analytical tables 2007-08
TRANSCRIPT
7/30/2019 Analytical Tables 2007-08
http://slidepdf.com/reader/full/analytical-tables-2007-08 1/180
Arun C. Mehta
ElementaryEducation in IndiaElementaryEducation in India
Progress towards UEE
A n a
l y t i c a l
T a b l e s 2 0 0 7
- 0 8

7/30/2019 Analytical Tables 2007-08
http://slidepdf.com/reader/full/analytical-tables-2007-08 2/180

7/30/2019 Analytical Tables 2007-08
http://slidepdf.com/reader/full/analytical-tables-2007-08 3/180

7/30/2019 Analytical Tables 2007-08
http://slidepdf.com/reader/full/analytical-tables-2007-08 4/180
ii
The data presented and indicators constructed in the document are entirely based upon the data as received
from the States & UTs as on 30th September, 2007.
Published in 2010 by
National University of Educational Planning and Administration(Declared by the Government of India under Section 3 of the UGC Act, 1956)
17-B, Sri Aurobindo Marg
New Delhi - 110016
India
and
Department of School Education and Literacy
Ministry of Human Resource Development
Government of India
© NUEPA 2010
Design, Layout and Printing by
International Print-o-Pac Limited
C-4 to C-11, Hosiery Complex
Phase II ExtensionNOIDA - 201 305 (Uttar Pradesh)
Cover Photograph
Arun C. Mehta

7/30/2019 Analytical Tables 2007-08
http://slidepdf.com/reader/full/analytical-tables-2007-08 5/180
iii
va 'kq oS '; lfpo
ANSHU VAISH
SECRETARY
Hkkjr ljdkj ekuo lalk/ku fodkl ea=ky;
Ldwy f’k{kk vkSj lk{kjrk foHkkx
ubZ fnYyh & 110 001Government of India
Ministry of Human Resource Development
Department of School Education & Literacy
124 ‘C’ Wing, Shastri Bhavan, New Delhi-110 001
Tel.: 23382587, 23381104, Fax: 23387859
E-mail: [email protected]
OREWORD
evelopment of a sound information system is critical for successful monitoring and implementation of
any programme, particularly in social sectors. Design of a school information system has, therefore,
been accorded priority from the very beginning of the District Primary Education Programme (DPEP) in
1994, as a result of which the District Information System for Education (DISE) was developed by the
National University of Educational Planning and Administration (NUEPA).
The importance of an Educational Management Information System (EMIS) was reiterated when Sarva
Shiksha Abhiyan (SSA) was launched in 2001. SSA guidelines envisage development of a transparent EMIS,
and preparatory activities of the programme included substantial strengthening of MIS infrastructure in the
States and UTs of the country. I am happy to note that all the States & UTs of the country have adopted DISE
and EMIS units have been established both at the state and district levels across the country.
District and State Elementary Education Report Cards as well as Elementary Education in Rural and Urban
India have been made available to users. I am happy to present Elementary Education in India: Analytical
Report/Tables for the year 2007-08 . Information presented in the volume is particularly valuable for
implementing educational programmes like SSA in the decentralized context. I am confident that this set of
data will be used in planning for good quality elementary education, and that data users and researchers
interested in the Indian education system will find the Analytical Report and Tables useful.
I take this opportunity to thank UNICEF, Delhi, for consistently supporting EMIS activities and NUEPA,
especially Dr. Arun C. Mehta, Professor and Head, Department of EMIS and entire DISE team, for bringing
out the present publication.
(Anshu Vaish)
D
F F F F F

7/30/2019 Analytical Tables 2007-08
http://slidepdf.com/reader/full/analytical-tables-2007-08 6/180
iv

7/30/2019 Analytical Tables 2007-08
http://slidepdf.com/reader/full/analytical-tables-2007-08 7/180
v
n the early 1990s when the District Primary Education Programme (DPEP) was launched, a need wasfelt to develop a computerized Educational Management Information System for facilitating
decentralized planning and management. Accordingly, the responsibility to develop the District InformationSystem for Education (DISE) was assigned to NUEPA. I am happy to note that the process that was initiatedin 42 districts across 7 DPEP Phase-I states in 1994-95 has now been expanded to all the 35 States and UTsof the country.
Under its flagship programme, namely DISE, the National University has been bringing out a series ofpublications based on DISE data. Each year NUEPA brings out State and District Report Cards as well asElementary Education in the Rural and Urban India that attempt to asses and present key performanceindicators of primary and upper primary education in the country. Besides School Report Cards(www.schoolreportcards.in), the University has also brought out another publication, namely DISE Flash
Statistics which aims at assessing the level of development of elementary education in States and UTs byconstructing Educational Development Index. Such publications not only facilitate monitoring of progresstowards UEE but also provide a wider scope for participation of the civil society in matters relating to planningand management of education.
In continuation of our series of publications based on the DISE data, it pleases me to present yet anotherpublication titled Elementary Education in India: Progress towards UEE, Analytical Report/Tables for the year2007-08. I hope that the researchers, policy makers, administrators, planners and other stakeholders willfind the publication both informative and useful.
I would like to place on record my appreciation for the hard work put in by the DISE team led by Prof. ArunC. Mehta, Department of Educational Management Information System (EMIS) in bringing out this publication.
We would welcome any comments that users may care to make for the improvement of the publication.
New Delhi (R. Govinda)
January, 2010
rom the Vice-Chancellor's Desk
I
F F F F F
R. GovindaVice-Chancellor
E-mail rgovinda@nuepa

7/30/2019 Analytical Tables 2007-08
http://slidepdf.com/reader/full/analytical-tables-2007-08 8/180
vi

7/30/2019 Analytical Tables 2007-08
http://slidepdf.com/reader/full/analytical-tables-2007-08 9/180
vii
or the last several years, NUEPA has been actively involved in strengthening Educational Management
Information System (EMIS) in the country. The Analytical Report 2007-08 is based on the data
received from all the 35 States and Union Territories of the country. The publication presents not only the
data up to elementary level but also brings in many new dimensions of elementary education into focus. It
incorporates data on children with disabilities, examination results, mediums of instruction, students’ flow
including transition and retention rates, teachers, utilization of school development and TLM grants, and
many other parameters on which not much information is available from other sources.
The Analytical Report/Tables is based on the data received from as many as 1.25 million schools spread over624 districts across 35 States & UTs. The study of this magnitude cannot be completed without the active
involvement and participation of the EMIS professionals at the national and sub-national levels. I am thankful
to all the State Project Directors, the state level EMIS coordinators and district level programmers and data
entry operators for timely supply of data.
I take this opportunity to thank UNICEF, Delhi, especially Ms Urmila Sarkar, Chief (Education) for consistently
supporting EMIS activities ever since the inception of DISE and Ms Anita Kaul, Joint Secretary, Department
of School Education & Literacy, Government of India, who played a crucial role in facilitating the implementation
of DISE in various states. The contribution of Ms Neelam Rao, Director (SE & L), is also gratefully acknowledged.
I am thankful to Prof R. Govinda, Vice-Chancellor, NUEPA, for guidance, encouragement and consistent
support to DISE activities.
The contribution of Shri Naveen Bhatia, Computer Programmer and Shri Shalender Sharma, Chief Consultant,
TSG (Ed. CIL), in database management, is gratefully acknowledged.
I am also thankful to Shri P. N. Tyagi for creating maps and Ms Alka Mishra, Ms Shakun Sethi and Ms Aseela M
for efficient assistance and colleagues in the Publication Unit, especially Shri Pramod Rawat, Deputy
Publication Officer and Ms Sheeja Biju, Project Publication Officer (DISE), for their keen interest in timely
bringing out the publication.
We are encouraged by the enormous number of comments received from data users and hope that the
present publication will also be received well by education planners, policy formulators and researchers. Any
suggestion for improvement is most welcome.
Arun C. Mehta
F
A A A A A cknowledgements

7/30/2019 Analytical Tables 2007-08
http://slidepdf.com/reader/full/analytical-tables-2007-08 10/180
viii

7/30/2019 Analytical Tables 2007-08
http://slidepdf.com/reader/full/analytical-tables-2007-08 11/180
ix
Raw data presented in the document or used for calculating indicatorsare essentially based on data provided by the States and UTs throughannual data collection (as on 30th September 2007) under SSA (DISE).NUEPA is committed to provide professional and software supportto all States and UTs as well as for dissemination and analysis ofdata as it is provided by the individual States and UTs.
In no way, NUEPA is involved in data collection as such and thereforethe accuracy and truthfulness of the data rest with the States/UTs.The State Project Directors have certified that data is free from errors
and inconsistencies and hence may be merged into the nationaldatabase maintained by NUEPA, New Delhi.
D D D D D isclaimer

7/30/2019 Analytical Tables 2007-08
http://slidepdf.com/reader/full/analytical-tables-2007-08 12/180
x

7/30/2019 Analytical Tables 2007-08
http://slidepdf.com/reader/full/analytical-tables-2007-08 13/180
xi
Foreword iiiFrom the Vice-Chancellor’s Desk vAcknowledgements viiAbbreviations xvExecutive Summary xvii
PART I SCHOOL-RELATED INDICATORS 1-54
Table 1.1 Number of Schools by Category, All Areas : All Managements 1
Table 1.2 Percentage of Schools by Category, All Areas : All Managements 2
Table 1.3 Percentage of Schools by Category, Rural Areas : All Managements 3
Table 1.4 Percentage of Schools by Category, Urban Areas : All Managements 4
Table 1.5 Percentage of Schools by Category, All Areas : All Government Managements 5
Table 1.6 Percentage of Schools by Category, All Areas : All Private Managements 6
Table 1.7 Number of Schools by Management, All Areas : All Managements 7
Table 1.8 Distance of Schools from CRC by Category, All Areas : All Managements 8
Table 1.9 Percentage of Schools Visited by CRC Co-ordinators, All Areas : All Managements 12
Table 1.10 Percentage of Schools Inspected, All Areas : All Managements 13
Table 1.11 Percentage of Schools in Rural Areas to All Schools 14
Table 1.12 Ratio of Primary to Upper Primary Schools/Sections by Management, All Areas 15Table 1.13 Ratio of Primary to Upper Primary Schools/Sections by Management, Rural Areas 16
Table 1.14 Ratio of Primary to Upper Primary Schools/Sections by Management, Urban Areas 17
Table 1.15 Percentage of Schools Established Since 2002-03, All Areas : All Managements 18
Table 1.16 Percentage of Schools Established Since 2002-03 and have Building : All Areas 19
Table 1.17 Percentage Distribution of Schools by Status of Building, All Areas : All Managements 20
Table 1.18 Percentage Distribution of Schools by Type of Building, All Areas : All Managements 25
Table 1.19 Average Number of Classrooms by School Category : All Government Managements 32
Table 1.20 Average Number of Classrooms by School Category : All Private Managements 33
Table 1.21 Percentage Distribution of Schools by Number of Classrooms : All Managements 34
Table 1.22 Percentage Distribution of Classrooms by Condition of Classrooms : All Managements 43
Table 1.23 Student-Classroom Ratio, All Areas : All Managements 47
Table 1.24 Percentage Distribution of Schools having Single-Classroom : All Managements 48
Table 1.25 Percentage Distribution of Schools having Single-Classroom : All Government Managements 49
Table 1.26 Percentage Distribution of Schools having Single-Classroom : All Private Managements 50
Table 1.27 Average Enrolment by School Category, All Areas : All Managements 51
Table 1.28 Percentage of Single-Teacher Schools, All Areas : All Managements 52
Table 1.29 Average Number of Instructional Days by Category : All Areas 53
C C C C C ontents

7/30/2019 Analytical Tables 2007-08
http://slidepdf.com/reader/full/analytical-tables-2007-08 14/180
xii
PART II FACILITIES IN SCHOOLS 55-78
Table 2.1 Percentage Distribution of Schools having Boundary Wall by Category : All Areas 57
Table 2.2 Percentage of Schools having Drinking Water Facility : All Government Managements 58
Table 2.3 Percentage of Schools having Drinking Water Facility : All Private Managements 59
Table 2.4 Percentage of Schools having Common Toilet Facility : All Areas 60Table 2.5 Percentage of Schools having Girls’ Toilet Facility : All Areas 61
Table 2.6 Percentage of Schools having Electricity Connection : All Areas 62
Table 2.7 Percentage of Schools having Computers : All Managements 63
Table 2.8 Percentage of Schools having Ramp : All Managements 64
Table 2.9 Percentage of Schools having Book-Bank : All Managements 65
Table 2.10 Percentage of Schools having Playground : All Managements 66
Table 2.11 Percentage of Schools having Kitchen-Shed : All Government & Aided Managements 67
Table 2.12 Percentage of Schools having Furniture for Students : All Areas 68
Table 2.13 Percentage of Schools having Furniture for Teachers : All Areas 69
Table 2.14 Percentage of Schools having conducted Medical Check-up : All Areas 70
Table 2.15 Percentage Distribution of Schools having Pre-Primary Sections : All Areas 71Table 2.16 Percentage Distribution of Schools having used School Building as Shift School 72
Table 2.17 Percentage of Residential Schools, All Areas : All Managements 73
Table 2.18 Percentage of Schools having Received School Development Grant : All Areas 74
Table 2.19 Percentage of Schools Utilised School Development Grant : All Areas 75
Table 2.20 Percentage of Schools Received Teaching Learning Material Grant : All Areas 76
Table 2.21 Percentage of Schools Utilised Teaching Learning Material Grant : All Areas 77
PART III ENROLMENT-BASED INDICATORS 79-100
Table 3.1 Enrolment in Primary & Upper Primary Classess, All Areas : All Managements 81
Table 3.2 Enrolment in Primary & Upper Primary Classes, Rural Areas : All Managements 82
Table 3.3 Percentage of Boys & Girls Enrolment in Primary & Upper Primary Classes : All Areas 83Table 3.4 Percentage of Boys & Girls Enrolment in Primary & Upper Primary Classes : Rural Areas 84
Table 3.5 Percentage of Boys & Girls Enrolment in Primary & Upper Primary Classes :
All Government Managements 85
Table 3.6 Percentage of Boys & Girls Enrolment in Primary & Upper Primary Classes :
All Private Managements 86
Table 3.7 Percentage of Enrolment in Government Schools to Total Enrolment : Rural Areas 87
Table 3.8 Percentage of SC & ST Enrolment to Total Enrolment : All Managements 88
Table 3.9 Enrolment of Children by Nature of Disability, All Areas : All Managements 89
Table 3.10 Enrolment of Children with Disability, All Areas : All Managements 90
Table 3.11 Percentage Share of Enrolment in Pre-Primary Classes to Total Enrolment : All Areas 91
Table 3.12 Percentage of Enrolment in Single-Teacher Schools, All Areas : All Managements 92Table 3.13 Percentage of Enrolment in Schools with Student-Classroom Ratio ≥ 60 : All Areas 93
Table 3.14 Percentage Distribution of Enrolment by Age & Grade : All Areas 94
Table 3.15 Percentage Distribution of Enrolment by Age & Grade : Rural Areas 95
Table 3.16 Percentage Distribution of Enrolment by Age & Grade : Urban Areas 96
Table 3.17 Percentage of Under-age & Over-age Childern, All Areas : All Managements 97
Table 3.18 Examination Results, All Areas : All Managements 98
Table 3.19 Examination Results, All Areas : All Government Managements 99
Table 3.20 Examination Results, All Areas : All Private Managements 100

7/30/2019 Analytical Tables 2007-08
http://slidepdf.com/reader/full/analytical-tables-2007-08 15/180
xiii
PART IV TEACHER-RELATED INDICATORS 101-147
Table 4.1 Percentage Distribution of Teachers by School Category : All Areas 103
Table 4.2 Percentage Distribution of Teachers by School Category : Rural Areas 104
Table 4.3 Average Number of Teachers per School by School Category : All Managements 105
Table 4.4 Average Number of Teachers per School by School Category : All Government Managements 106
Table 4.5 Average Number of Teachers per School by School Category : All Private Managements 107
Table 4.6 Percentage of Female Teachers by School Category : All Managements 108
Table 4.7 Pupil-Teacher Ratio by School Category : All Areas : All Managements 109
Table 4.8 Percentage of Schools having Pupil-Teacher Ratio > 100 : All Managements 110
Table 4.9 Teachers by Academic Qualifications & School Category : All Managements 111
Table 4.10 Percentage of Teachers Received In-Service Training : All Managements 120
Table 4.11 Para -Teachers by School Category, All Areas : All Managements 121
Table 4.12 Percentage of Para -Teachers by School Category : All Managements 122
Table 4.13 Percentage of Para -Teachers by Academic Qualifications : All Managements 123
Table 4.14 Percentage of Para -Teachers by Professional Qualifications : All Managements 132
Table 4.15 Percentage of Teachers by Caste, All Areas : All Managements 138
Table 4.16 Number of Working Days Spent on Non-Teaching Assignments 147

7/30/2019 Analytical Tables 2007-08
http://slidepdf.com/reader/full/analytical-tables-2007-08 16/180
xiv
7/30/2019 Analytical Tables 2007-08
http://slidepdf.com/reader/full/analytical-tables-2007-08 17/180
xv
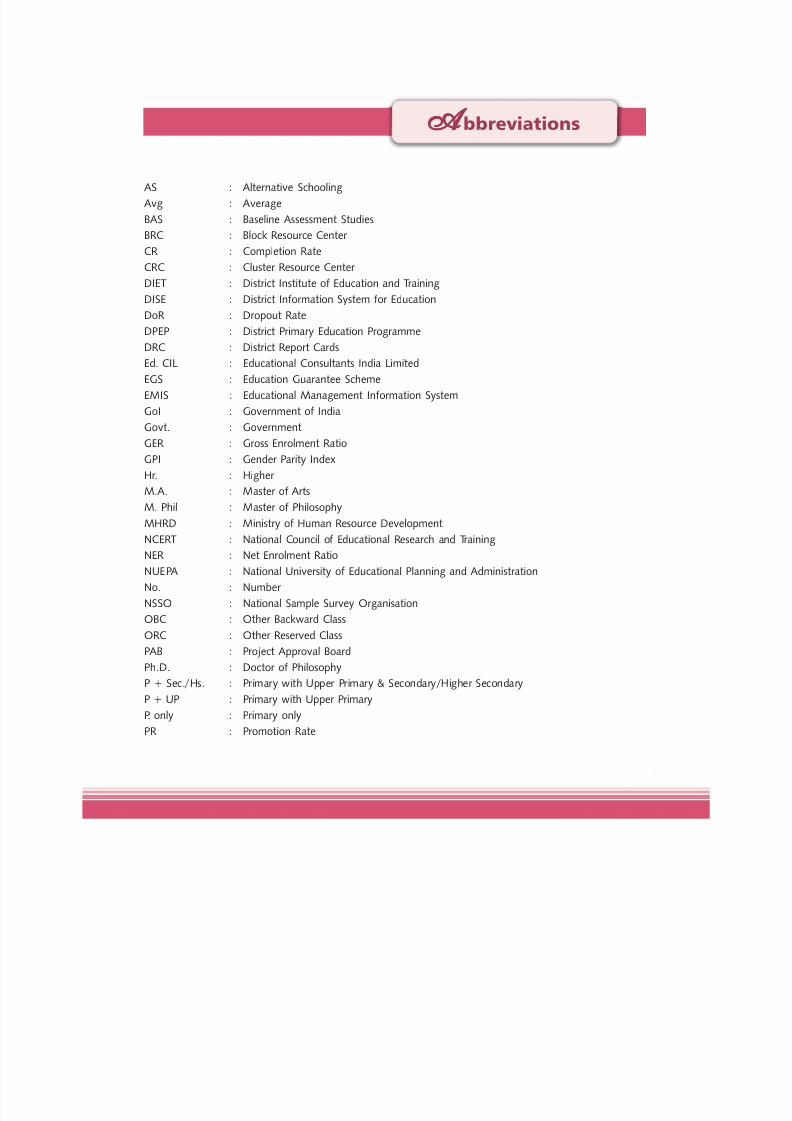
AS : Alternative Schooling
Avg : Average
BAS : Baseline Assessment Studies
BRC : Block Resource Center
CR : Completion Rate
CRC : Cluster Resource Center
DIET : District Institute of Education and Training
DISE : District Information System for Education
DoR : Dropout RateDPEP : District Primary Education Programme
DRC : District Report Cards
Ed. CIL : Educational Consultants India Limited
EGS : Education Guarantee Scheme
EMIS : Educational Management Information System
GoI : Government of India
Govt. : Government
GER : Gross Enrolment Ratio
GPI : Gender Parity Index
Hr. : Higher
M.A. : Master of Arts
M. Phil : Master of Philosophy
MHRD : Ministry of Human Resource Development
NCERT : National Council of Educational Research and Training
NER : Net Enrolment Ratio
NUEPA : National University of Educational Planning and Administration
No. : Number
NSSO : National Sample Survey Organisation
OBC : Other Backward Class
ORC : Other Reserved Class
PAB : Project Approval Board
Ph.D. : Doctor of Philosophy
P + Sec./Hs. : Primary with Upper Primary & Secondary/Higher Secondary
P + UP : Primary with Upper Primary
P. only : Primary only
PR : Promotion Rate
A A A A A bbreviations

7/30/2019 Analytical Tables 2007-08
http://slidepdf.com/reader/full/analytical-tables-2007-08 18/180
xvi
PTR : Pupil-Teacher Ratio
Pvt. : Private
RR : Repetition Rate
Recd : ReceivedSC : Scheduled Castes
SCR : Student-Classroom Ratio
SCERT : State Council of Educational Research and Training
SDG : School Development Grant
Sec. : Secondary
SRC : State Report Cards
SSA : Sarva Shiksha Abhiyan
ST : Scheduled Tribes
TLM : Teaching Learning Material
TR : Transition RateTSG : Technical Support Group
U. Prim./U.P : Upper Primary
U.P. Only : Upper Primary only
UEE : Universalisation of Elementary Education
UP + Sec/Hs. : Upper Primary with Secondary/Higher Secondary
UPE : Universalisation of Primary Education
KGBV : Kasturba Gandhi Balika Vidyalaya

7/30/2019 Analytical Tables 2007-08
http://slidepdf.com/reader/full/analytical-tables-2007-08 19/180
xvii
1. Introduction
1.1 The National University of Educational Planning and Administration has created a comprehensive database on
elementary education in India, known as the District Information System for Education (DISE), under one of its most
prestigious projects. The project covers both the primary and upper primary schools/sections of all the districts of
the country. The MIS Units are now operational both at the district and state levels and are equipped with necessary
hardware and software. The DISE software is also operational in all the districts of the country and is providing vital
information for policy formulation and preparation of district elementary education plans. What is more remarkable
about the DISE is that it has drastically reduced the time-lag in the availability of educational statistics. It is now
down from 7-8 years to less than a year at the national level and only a few months at the district and state levels.
Similarly, the NUEPA has also been assigned the responsibility to strengthen the Secondary Education Management
Information System for which it has developed a web-enabled software. Most of the states have collected data and
a detailed report is expected soon. It would reveal new facets of secondary education in the country.
1.2 The National University has successfully developed School Report Cards (http://schoolreportcards.in ) of more than
1.25 million primary and upper primary schools/sections, and is available for 2005-06, 2006-07 and 2007-08. In
addition to quantitative information, the Report Cards also provide qualitative information and descriptive reports
about individual schools. And, all this information can now be accessed on the click of a mouse. The Report Cards
provide the users with comprehensive information on all the vital parameters, be it on students, teachers or other
school related variables, in concise, accurate and standard format. It is easy to understand and it allows meaningful
comparisons to be made among schools. Users can also download raw data as per their requirement for further
empirical studies. All the DISE publications, such as ‘District and State report cards’, ‘Elementary education in rural
and urban India’, ‘DISE flash statistics including educational development index’, and ‘Elementary education in
India: progress towards the UEE, analytical report’, are available at http://dise.in . Publications based on the DISE
data brought out during the last five years have also been provided in a Compact Disk format.
1.3 Despite significant increase in the number of schools covered, a few schools, largely private un-aided ones, are yet
to be covered under the DISE. To further improve the quality of data, it has now been made mandatory for all the
states to check the data on five percent random sample basis through an independent agency each year. The states
are advised to initiate corrective measures in the light of the findings of sample checking of the data. In addition,
the NUEPA has also launched the Post-Enumeration Survey(PES) of the DISE data initially in three states, namely
Andhra Pradesh, Himachal Pradesh and Maharashtra. This is likely to be extended to the remaining states. All these
efforts would not only help in improving the quality of data but would also help in ensuring complete coverage.
1.4 The DISE software is now time-tested, user-friendly, menu-driven and error-free software and is being utilised
throughout the country. Efforts are being made to further improve it especially in view of user’s requirement for
which NUEPA has recently undertaken review of the existing Data Capture Format.
E E E E E xecutive Summary

7/30/2019 Analytical Tables 2007-08
http://slidepdf.com/reader/full/analytical-tables-2007-08 20/180
xviii
2. The Present Publication
2.1 A variety of schools and school-related indicators by school categories along with the average of all states are covered
under the DISE in 2007-08. The selected indicators for previous years are also presented in the present publication.
The tables presented in the document contain information on hundreds of variables, mostly by school category andwherever necessary by rural and urban areas, and by school management. Practically, all such indicators on which
information is required for formulating reliable elementary education plans are presented in ‘ready-to-use form’ . The
indicators analyzed and tables presented are divided into the following parts: School and Facility Indicators; Enrolment-
Based Indicators; and Teacher-Related Indicators. In addition, a separate section, devoted to Educational Development
Index is also presented. The major highlights of Elementary Education in India: Progress towards UEE, Analytical
Report 2007-08 are given in the following sections.
3. School-Based Indicators
3.1 With the improved coverage, the number of schools/sections imparting elementary education dealt with under the
DISE has increased many-fold. From 8,53,601 schools in 2002-03, their number has increased to 11,96,663 schools
in 2006-07 and further to 12,50,775 schools in 2007-08. Of the total schools, about 87.39 percent schools are
located in rural areas. During the same period, the number of primary schools increased from 6,01,866 to 8,05,667.
Category-wise distribution of schools reveals that majority of the schools (64.41 percent) are independent primary
schools. The increase in the number of schools is also reflected in the ratio of primary to upper primary schools/
sections which clearly shows the impact of Sarva Shiksha Abhiyan under which a large number of schools have been
opened in the recent past. This ratio for the year 2007-08 is one upper primary school/section for every set of 2.42
primary schools/sections compared to 2.45 in 2006-07 and 2.57 schools/sections in 2005-06. It is noticed that in
about 20 states, the ratio of primary to upper primary schools/sections is better than the national average of 2.42.
Many of the states have the ratio equivalent to almost two, all of which suggests that by and large schooling
facilities have been created and are available across the country. Despite significant improvement in the ratio, there
are a few states, such as Arunachal Pradesh and West Bengal, where the ratio still needs to be improved significantly.
3.2 Obtaining data from all the private schools is a challenging task. Concerted efforts made by the National University
have resulted in a significant increase in the number of such schools covered under the DISE over a period of time.
This is important in getting the true picture of universalisation of elementary education in the country. As many as
70,613 and 1,73,282 schools in 2007-08, respectively, were being managed by Private Aided and Private Unaided
managements. The DISE data also suggests that the majority of the private schools are un-aided schools (71.05
percent). The percentage of Government and Government Aided schools is as high as 85.83. This shows that ninety
out of every hundred schools imparting elementary education in the country are funded by the government.
3.3 A significant achievement of the education system in the country is that most of the new schools have a school
building. As many as 1,89,249 new schools have been opened since 2002-03 and the majority of which are located
in rural areas and 80 percent of these schools have been provided school buildings. During the period 2002-03 to
2007-08, as many as 1,27,984 primary schools have been opened which is 15.89 percent of the total primaryschools in the country. About 92 percent of such schools have been provided school buildings.
3.4 Not only the number of schools and schools with buildings has increased but the average number of instructional
rooms has also increased across the country. This is essential for smooth teaching-learning transaction. Irrespective
of the type of school, schools imparting elementary education across 624 districts in 2007-08 had an average of
4.31 classrooms, compared to 3.7 in 2004-05. However, a significant difference is noticed in the average number of
instructional rooms in primary schools located in rural areas (2.8 classrooms) and urban areas (4.6 classrooms) and

7/30/2019 Analytical Tables 2007-08
http://slidepdf.com/reader/full/analytical-tables-2007-08 21/180
xix
also in government (2.8 classrooms) and private (4.8 classrooms) managed schools. About 70 percent of classrooms
in primary schools are in good condition and remaining 30 percent need either minor or major repairs.
3.5 Schools imparting elementary education across the country vary in size. There are about 7.83 and 16.57 percent
schools which respectively have enrolment between 1-25 and 26-50. In view of there being a large number of smallschools, there is a need to have separate programmes for these schools. In view of the large number of such schools
(about 24 percent of 1.25 million schools), the National University has undertaken a research study, based on the
DISE data. It is hoped that the outcome of the study will help the NUEPA in developing planning methodology for
small schools.
3.6 Some of the salient highlights with regard to other school-based indicators are as follows:
3.6.1 The distribution of schools by type of building shows that 71.73 percent primary schools have pucca
(permanent) buildings as compared to 7.50 percent having partially pucca and another 3.51 percent having
kuchcha (temporary) building. Efforts should be made to provide pucca building to all schools.
3.6.2 The percentage of single-classroom schools during 2004-05 to 2007-08 declined from 10.39 percent to
8.49 percent. Despite the decline in percentage of single-classroom schools, their number in absolute terms
is significant, which needs intervention without delay.
3.6.3 Over a period of time, the student-classroom ratio has shown improvement. On an average about 37
students are sitting in one classroom in primary schools. However, in the case of primary schools, the
student-classroom ratio in states of Bihar and Jharkhand is still very high.
4. Facility Indicators
4.1 Like the number of schools, instructional rooms and ratio of primary to upper primary sections/schools, facilities in
schools have also improved significantly and this is true for physical, ancillary and teaching-learning facilities.
Availability of basic facilities in schools not only attracts more children to schools but also help in improving the
retention rate. About 87 percent of the schools had drinking water facility available in 2007-08 compared to 85
percent in 2006-07. A little less than 50 percent of the total schools had water hand pumps, and 24 percent of
schools had tap water facility in school. Like drinking water facility, more schools now have common toilets and
separate toilets for girls. About 63 percent schools had common toilets in schools in 2007-08, compared to 47
percent schools in 2004-05; and 51 percent schools in 2007-08 had separate toilets for girls compared to only 33
percent in 2004-05.
4.2 Some of the other major facilities available in schools are:
4.2.1 During the period 2004-05 to 2007-08, the number of schools with computers increased impressively. As
many as 1,78,253 schools reported to have a computer, which is 14.25 percent of the total schools. In
absolute terms, Maharashtra has the highest number of schools (31,845 schools, 36.49 percent) withcomputers. The percentage of primary schools with computers is 6.01 percent compared to 14.05 percent
of independent upper primary schools.
4.2.2 The percentage of schools with ramps increased significantly from 11.49 percent in 2004-05 to 34.43
percent in 2007-08; this may help in attracting more physically challenged children to schools. Together
with enrolment by nature of disability, the DISE is perhaps the only source that provides comprehensive
information about physically challenged children in schools.

7/30/2019 Analytical Tables 2007-08
http://slidepdf.com/reader/full/analytical-tables-2007-08 22/180
xx
4.2.3 Providing nutritious food to all children under the mid-day meal scheme is one of the ambitious programmes
of the government. For the first time, a variable on availability of kitchen-shed in school was added to the
DISE during 2006-07. In 2007-08, it reveals that 36 percent of schools managed by the government and
aided schools have kitchen-shed in school. The percentage of such schools is 37 and 26 respectively in the
rural and urban areas. The percentage of schools with kitchen-shed varies from 87 in Tamil Nadu to 2 inJammu & Kashmir.
4.2.4 The percentage of primary schools having attached pre-primary section increased from 14.27 in 2002-03
to 28.06 in 2007-08. The number of such schools is more in urban areas than in rural areas.
4.2.5 Over a period of time, the number of schools receiving school development and TLM grants increased
impressively (mostly government run schools). Compared to 7,24,682 schools that received school
development grant in 2003-04, the corresponding figure in 2006-07 was as high as 8,62,385 schools
(68.95 percent). The number of schools that received TLM grant has been as many as 8,32,934 (66.59
percent) of all types of schools. The majority of the states have utilised more than 90 percent of these
funds.
5. Enrolment-Based Indicators
5.1 With the increased coverage of schools under the DISE, enrolment both at the primary and upper primary levels of
education has also increased significantly. The enrolment increased from 101.16 million in 2002-03 to 131.85
million in 2006-07 and further to 134.13 million in 2007-08. The GER at primary level, based on the DISE data is
estimated to be 113.94 percent, corresponding to 95.92 percent NER. A few states are near the goal of universal
primary enrolment. Over a period of time, enrolment in upper primary classes has also shown consistent increase.
From a low of 37.72 million in 2004-05, it has increased to 50.91 million in 2007-08 (GER 69.88 percent).
5.2 Gender Parity Index (GPI) and percentage of girls’ enrolment in primary and upper primary classes reveal that there
is consistent improvement both in GPI and girls’ share in enrolment. The average of 624 districts in 2007-08
indicates a GPI of 0.93 in primary classes and 0.89 in case of upper primary classes. Meghalaya has the highest GPI
(above one).
5.3 The improvement in girls’ enrolment is also reflected in girls’ share to total enrolment. In primary classes, the share
of girls’ enrolment in 2007-08 was 48.22 percent compared to 48.09 percent in the previous year. Girls’ share in
total enrolment at upper primary level is 46.99 percent; it was 46.51 percent in 2006-07 and 45.32 percent in
2004-05. The percentage of girls’ enrolment in government managed schools was found to be higher than in
private managed schools for both primary and upper primary enrolment.
5.4 At the primary level, the share of the SC and ST enrolment with respect to total enrolment works out to 20.08 and
11.60 percent, respectively. Notably, at all levels, government schools are the main providers of educational needs
of both the SC and ST children. The SC and ST enrolment together had a share of 79.75 and 83.95 percent,
respectively, in government run primary and upper primary schools. The share of the OBC enrolment in the primaryand upper primary classes is 42.35 and 41.86 percent, respectively.
5.5 During 2006-07, the DISE made an attempt to collect information on enrolment of Muslim children, for the first
time. In 2007-08, the percentage of Muslim enrolment at primary level is reported to be 10.49 against 8.54 at
upper primary level. The percentage of girls’ enrolment is as high as 48.67 (GPI, 0.95) and 49.40 (GPI, 0.97) at
primary and upper primary levels. Preliminary analysis of data suggests that there are about 52 districts in the
country which have 25 percent or more Muslim students in primary classes. Most of these districts are from the
states of Assam, Bihar, Jammu & Kashmir, Karnataka, Uttar Pradesh and West Bengal.

7/30/2019 Analytical Tables 2007-08
http://slidepdf.com/reader/full/analytical-tables-2007-08 23/180
xxi
5.6 Much emphasis is being given to inclusive education. The DISE is perhaps the only source that collects information
on disabled children in elementary classes on a regular basis. In 2007-08, about 1.55 million disabled children were
enrolled in elementary classes across the country, of which 1.15 million were in primary and 0.40 million in upper
primary classes.
5.7 One of the essential requirements to achieve the UEE is to retain students in the education system. The apparent
survival rate (to Grade V) improved to 72 percent in 2007-08. This is also reflected in retention rate at primary level
which is estimated to be 74 percent. States like Haryana, Himachal Pradesh, Kerala, Madhya Pradesh, Maharashtra
and Tamil Nadu reported above 90 percent retention rate at primary level.
5.8 With improvement in the number of schools, facilities in schools and enrolment, the dropout rate for cohort 2006-
07 indicates an average rate of 9.40 percent in primary grades. Tamil Nadu with 1.70 percent and Himachal Pradesh
with 2.60 percent have almost achieved the goal of universal retention at primary level. The cohort survival rate (to
Grade V), estimated to be 72 percent, indicates that a good number of children dropping out in primary classes.
5.9 One of the other important indicators that are essential to achieve the UEE is high transition from primary level to
upper primary level of education. It has improved significantly from 64.48 percent in 2002-03 to 83.72 percent in
2005-06 but declined slightly to 81.13 percent in 2006-07
5.10 Learner’s achievement is considered as one of the important indicators of the quality of education. Examination
result at the terminal grades is a proxy indicator of learner’s achievement. About 48.67 percent boys and 48.80
percent girls passed Grade IV/V with a score of 60 percent and above, compared to 43.02 percent boys and 44.05
percent girls scoring 60 percent and above marks in Grade VII/VIII; thus showing impressive improvement over the
previous year.
6. Teacher-Related Indicators
6.1 Availability of teachers in schools is an important variable for quality education. The total number of teachers in
2007-08 suggests that about 5.63 million teachers are engaged in teaching in schools imparting elementary education
in the country. The data also shows appointment of a large number of teachers across the country consequent tothe SSA interventions. All the schools in the country now have an average of 2 and more teachers. The all-India
average reveals that, on an average, there were 4.5 teachers in a school in 2007-08 that imparts elementary
education compared to an average of 3.0 teachers per primary school.
6.2 All schools together had 42.72 percent female teachers. Urban areas had higher percentage of female teachers
than the rural areas; this is true for all types of school. Irrespective of types of school, a significant difference is also
noticed in the case of female teachers in schools under private and government managements.
6.3 Increase in the number of teachers is also reflected in the pupil-teacher ratio which has shown consistent improvement.
The PTR, both at primary and upper primary levels, is quite comfortable (primary, 34:1 and upper primary, 31:1)
and is below 40:1. However, there are 151 districts in the country which still have a PTR of above 40:1. Most of the
districts of Bihar and Jharkhand fall under this category. At primary level, there are only four states which reporteda PTR above 40. At upper primary level, Bihar reported a high PTR of 59:1, compared to 54:1 at primary level. In
Bihar, it is not only the PTR that is high but its student-classroom ratio is also high at 96. With the appointment of
a large number of teachers in the state, pupil-teacher ratio is expected to improve in the year that follows.
6.4 There are about 5,84,000 para -teachers, constituting 10.48 percent of the total number of teachers. About 68,186
schools have only para- teachers. The percentage of such schools is very high in Rajasthan, Jharkhand and Assam;
these states having 12.68, 39.12 and 18.64 percent, respectively, of the total number of schools. About 54 percent

7/30/2019 Analytical Tables 2007-08
http://slidepdf.com/reader/full/analytical-tables-2007-08 24/180
xxii
male and 51 percent female para- teachers are Graduates and above. About 16.38 percent male and 14.00 percent
female para- teachers in primary schools have B.Ed or equivalent degrees.
6.5 The average age of teachers across states suggests that the majority of teachers in primary schools are between 26
and 45 years, which is also true for other types of schools. The percentage of teachers in the age group of 18-25years across types of school has been low but has shown improvement over the previous year; it indicates newly
recruited teachers are joining the state education system.
6.6 The percentage of teachers involved in non-teaching assignments has been as low as 10.84 percent which shows
that the majority of teachers were not involved in non-teaching assignments during the previous academic year.
On an average, a teacher was involved in non-teaching assignments only for 16 days. In rural areas, teachers were
involved in such assignments for 14 days compared to 17 days in urban areas.
6.7 The DISE data reveals that government is the main employer of both the Scheduled Castes and Scheduled Tribes
teachers. The share of the SC and ST teachers together in government schools is as high as 80.23 percent. As many
as 0.69 million SC and 0.51 million ST teachers are engaged in imparting elementary education, respectively
representing 12.25 percent and 9.14 percent of the total teachers.
7. Educational Development Index
7.1 Based on the DISE data, an effort has been made to compute Educational Development Index separately for
primary and upper primary levels of education as also the composite index for the entire elementary education. The
EDI can play a significant role in assessing progress towards UEE as well as in deciding the future course of investment
on elementary education. About 23 indicators were used which were further re-grouped into four sub-groups,
namely access, infrastructure, teachers, and outcome indicators.
7.2 The EDI reveals that Mizoram out-performed the other six states in the north-eastern region which is true for
primary and composite primary and upper primary levels of education. May be these states are small in size but a
cursory look at the EDI values indicates that they are doing much better than a number of bigger states. It also
indicates a marked improvement in the case of Lakshadweep and Puducherry in composite primary and upperprimary levels of education. Puducherry not only ranked first within the set of smaller states but also ranked first
with an EDI value of 0.808 among all the States and UTs of the country in composite primary and upper primary
levels of education.
7.3 Among 21 major states, the top five ranking states are Kerala (EDI, 0.791), Delhi (EDI, 0.780), Tamil Nadu (EDI,
0.771), Haryana (EDI, 0.753) and Gujarat (EDI, 0.748). Kerala, Delhi and Tamil Nadu maintained their positions but
Himachal Pradesh (EDI, 0.695) conceded its fourth position to Haryana (EDI, 0.755). The EDI value of Karnataka in
2007-08 (EDI, 0.743) was higher than the same in the previous year (EDI, 0.680). However, Kerala at primary level
conceded its second position to Tamil Nadu and Himachal Pradesh its fourth position to Haryana. Kerala and Tamil
Nadu are generally seen as educationally advanced states. Irrespective of an educational level, the difference in EDI
values between the highest and lowest ranked states is significant, showing that states are at different levels of
educational development.
7.4 Bihar, Arunachal Pradesh and Jharkhand are ranked 35, 34 and 33 in case of composite primary and upper primary
levels of education with an EDI as low as 0.406, 0.485 and 0.488 respectively, It is much lower than that of the top
ranked states. In the overall ranking, West Bengal and Jharkhand are placed 33 rd and 32nd respectively in the
composite EDI at primary and upper primary levels of education compared to their respective 33 rd and 34th positions
in 2006-07.

7/30/2019 Analytical Tables 2007-08
http://slidepdf.com/reader/full/analytical-tables-2007-08 25/180
xxiii
7.5 The analysis of the EDI clearly reveals that different states are at different levels of educational development in
general, and primary and upper primary levels of education in particular. A few states with high EDI values are
termed better than the other states but still they may not be well placed with regard to all the four sets of indicators
used in computation of the EDI. Even if a state is ranked first, it may need further improvement for which individual
EDI values should be critically analyzed. In addition, there is also a need to analyse each indicator separately andidentify states that need improvement.
7.6 The states are advised to compute district-specific EDIs and analyse results separately of access, infrastructure,
teachers and outcome indicators. Even the top ranking states are not perfect with regard to all the four sets of
indicators that are reflected in individual EDI values. Variables found to have higher weightage than others should
be accorded the top most priority while adopting strategies in the year that follows.
8. DISE: Marching Ahead
8.1 Through the DISE efforts, information on all aspects of universalisation of education is now available at disaggregated
levels that can be used in different ways. The present document has highlighted a number of issues which can be
tracked by using the DISE data at different levels. Up-to-date information is now available at all desired levels inready-to-use form. Detailed information is available by school category, management, location, type of schools and
wherever necessary, is separately available by gender. The same is also separately available for primary and upper
primary levels of education. In view of the data now being available at school, cluster, block, district, state and
national levels, evidence-based planning can be initiated at any desired level. The DISE data now being available
over a period of time, trend analysis on areas of concern can be initiated. Studies on girls participation in educational
programmes, enrolment, impact of infrastructure on learner’s attainment, pupil-teacher ratio, para -teachers, impact
of in-service training on classroom transaction, schools with high PTR and students-classroom ratio, etc., can be
undertaken exclusively based on the DISE data. Individual schools lacking minimum facilities can be identified and
tracked by using the DISE data. A few states (Himachal Pradesh, Karnataka, Jharkhand, Uttar Pradesh etc.) have
computed district and block-specific EDI; the DISE data can be used extensively to track their progress. One of the
other important variables available under the DISE is grade-wise enrolment and repeaters that can be of immenseuse in initiating internal efficiency of education system related studies. In a number of districts, since the DISE data
is now available over more than five years, studies concerning retention and transition rates can be undertaken.
Perhaps the DISE is the only source which disseminates age and grade matrix that can play an important role while
planning for school places. Comprehensive profiles of more than 5.6 million teachers are also being maintained
under the DISE, that can be used for developing meaningful in-service-training programmes.
8.2 Despite overall improvement, there are a few areas of concern which need to be accorded the top most priority in
the following year.
8.2.1 A good number of schools are single-teacher schools despite an overall average of four teachers per school,
all of which need serious intervention. Rationalization of teachers is the only solution. Percentage of female
teachers has improved but in a few states their number is not satisfactory and hence need improvement.
Process of filling-up of vacant positions of teachers across the country may be initiated immediately. Quite
a good number of schools are left to para -teachers to manage them. Studies should be initiated on the
functioning of all such schools.
8.2.2 States with high ratio of primary to upper primary schools/sections may like to expand upper primary
schooling facilities. All schools imparting elementary education across the country should be provided with
minimum essential physical, ancillary and teaching-learning facilities. There are still locations where the PTR
is not satisfactory and a single-classroom has to accommodate a large number of pupils. Possibilities to
provide additional classrooms to schools having high student-classroom ratio may be explored.

7/30/2019 Analytical Tables 2007-08
http://slidepdf.com/reader/full/analytical-tables-2007-08 26/180
xxiv
8.2.3 The average dropout rate at primary level is very high and it needs to be checked. Without this neither the
goal of universal primary education nor elementary education can be achieved. This is also true for transition
from primary to upper primary level of education. Reason-specific child-centered strategies need to be
adopted to check this.
8.2.4 The quality of education, in terms of examination results and learners’ attainment across the country, is not
satisfactory. It may be improved through active participation of teachers. Useful in-service programmes can
be of great help in improving classroom transaction. Identification of training needs and review of existing
in-service programmes may be helpful in making these programmes more effective.
8.2.5 States may be advised to compute district-specific EDIs and analyse EDI values separately for indicators like
access, infrastructure, teachers and outcome. Rather, they may like to analyse all the 23 indicators used in
the EDI computation district-wise, and within a district, block-wise. This may be followed by adopting
appropriate strategies.

7/30/2019 Analytical Tables 2007-08
http://slidepdf.com/reader/full/analytical-tables-2007-08 27/180
Part I
School-Related
Indicators

7/30/2019 Analytical Tables 2007-08
http://slidepdf.com/reader/full/analytical-tables-2007-08 28/180
1
Table 1.1 Number of Schools by Category : 2007-08 All A
School Category
Primary with Primary with Upper Primary Upper Primary Primary Only Upper Primary Upper Primary Only with Sec./Hr. No R
& Sec./Hr. Sec. Secondary
A & N Islands 199 69 66 1 24
Andhra Pradesh 65352 18031 489 0 16577
Arunachal Pradesh 3677 656 159 11 44
Assam 50655 1280 556 10084 4152
Bihar 49868 16709 618 203 467
Chandigarh 28 22 111 1 14
Chhattisgarh 32780 2082 2156 11483 1067
D & N Haveli 177 106 6 1 1 Daman & Diu 51 10 11 14 7
Delhi 2454 582 1010 89 607
Goa 1013 97 169 24 198
Gujarat 12775 24806 872 369 217
Haryana 9503 1721 2027 1385 3103
Himachal Pradesh 11515 554 842 2405 1876
Jammu & Kashmir 11782 6596 2041 55 315
Jharkhand 28802 11296 594 213 1039
Karnataka 28871 25555 1197 437 381
Kerala 6704 2456 1014 787 1437
Lakshadweep 16 9 4 1 7
Madhya Pradesh 90092 10097 1878 26366 567
Maharashtra 40960 26526 3938 172 15659
Manipur 2564 708 552 55 132
Meghalaya 7867 509 275 1644 274
Mizoram 1512 313 58 868 28
Nagaland 1591 312 249 237 133
Orissa 34286 13506 615 4094 944 5
Puducherry 306 120 226 0 48
Punjab 13409 366 710 2335 3206
Rajasthan 57332 33514 6351 300 5806
Sikkim 804 185 151 3 5
Tamil Nadu 34835 9021 4530 4879 42
Tripura 2154 1025 646 1 75
Uttar Pradesh 128111 6790 790 42524 1753
Uttarakhand 14665 744 316 3371 1514
West Bengal 58957 1069 747 1549 7436
All States 805667 217442 35974 115961 69155 6
State/UT

7/30/2019 Analytical Tables 2007-08
http://slidepdf.com/reader/full/analytical-tables-2007-08 29/180
2
State/UT
Table 1.2 Percentage of Schools by Category : 2007-08 All Ar
School Category
Primary with Primary with Upper Primary Upper PriPrimary Only Upper Primary Upper Primary Only with Sec.
& Sec./Hr. Sec. Seconda
A & N Islands 55.43 19.22 18.38 0.28 6.69
Andhra Pradesh 65.06 17.95 0.49 0.00 16.50
Arunachal Pradesh 80.87 14.43 3.50 0.24 0.97 Assam 75.91 1.92 0.83 15.11 6.22
Bihar 73.47 24.62 0.91 0.30 0.69
Chandigarh 15.91 12.50 63.07 0.57 7.95
Chhattisgarh 65.95 4.19 4.34 23.10 2.15
D & N Haveli 58.22 34.87 1.97 0.33 0.33
Daman & Diu 52.04 10.20 11.22 14.29 7.14
Delhi 51.75 12.27 21.30 1.88 12.80
Goa 67.40 6.45 11.24 1.60 13.17
Gujarat 32.72 63.54 2.23 0.95 0.56
Haryana 53.56 9.70 11.42 7.81 17.49
Himachal Pradesh 66.96 3.22 4.90 13.98 10.91
Jammu & Kashmir 56.67 31.73 9.82 0.26 1.52
Jharkhand 68.67 26.93 1.42 0.51 2.48Karnataka 51.15 45.28 2.12 0.77 0.68
Kerala 53.95 19.77 8.16 6.33 11.56
Lakshadweep 43.24 24.32 10.81 2.70 18.92
Madhya Pradesh 69.84 7.83 1.46 20.44 0.44
Maharashtra 46.93 30.39 4.51 0.20 17.94
Manipur 63.92 17.65 13.76 1.37 3.29
Meghalaya 74.41 4.81 2.60 15.55 2.59
Mizoram 54.33 11.25 2.08 31.19 1.01
Nagaland 63.06 12.37 9.87 9.39 5.27
Orissa 57.69 22.72 1.03 6.89 1.59
Puducherry 43.53 17.07 32.15 0.00 6.83
Punjab 66.96 1.83 3.55 11.66 16.01
Rajasthan 55.50 32.44 6.15 0.29 5.62Sikkim 69.91 16.09 13.13 0.26 0.43
Tamil Nadu 65.35 16.92 8.50 9.15 0.08
Tripura 55.22 26.28 16.56 0.03 1.92
Uttar Pradesh 71.15 3.77 0.44 23.62 0.97
Uttarakhand 71.15 3.61 1.53 16.36 7.35
West Bengal 84.21 1.53 1.07 2.21 10.62
All States 64.41 17.38 2.88 9.27 5.53

7/30/2019 Analytical Tables 2007-08
http://slidepdf.com/reader/full/analytical-tables-2007-08 30/180
3
Table 1.3 Percentage of Schools by Category : 2007-08 Rural A
School Category
State/UT Primary with Primary with Upper Primary Upper PrPrimary Only Upper Primary Upper Primary Only with Sec
& Sec./Hr. Sec. Second
A & N Islands 59.74 18.53 15.97 0.32 5.43
Andhra Pradesh 68.66 17.33 0.32 0.00 13.69
Arunachal Pradesh 82.74 13.24 2.97 0.23 0.82
Assam 76.37 1.91 0.70 15.17 5.85
Bihar 74.15 24.07 0.87 0.29 0.63
Chandigarh 30.00 13.33 53.33 0.00 3.33
Chhattisgarh 67.65 3.47 3.52 23.54 1.82
D & N Haveli 63.67 34.46 1.50 0.37 0.00
Daman & Diu 56.45 11.29 8.06 16.13 4.84
Delhi 56.47 10.55 17.83 1.34 13.81
Goa 70.00 6.21 10.16 1.69 11.94
Gujarat 34.89 62.43 1.47 0.73 0.48
Haryana 55.80 8.86 9.60 8.39 17.34
Himachal Pradesh 68.17 2.96 3.73 14.36 10.78
Jammu & Kashmir 59.73 31.15 7.30 0.25 1.57
Jharkhand 70.08 26.39 1.00 0.46 2.07
Karnataka 55.54 42.56 0.82 0.60 0.47
Kerala 55.24 19.52 7.91 6.72 10.60
Lakshadweep 43.24 24.32 10.81 2.70 18.92
Madhya Pradesh 74.06 4.27 0.46 21.04 0.16
Maharashtra 51.16 29.54 3.11 0.16 16.03
Manipur 67.34 17.19 11.81 1.26 2.40
Meghalaya 76.10 4.55 1.88 15.50 1.97
Mizoram 58.84 7.30 0.57 32.63 0.67
Nagaland 68.06 11.03 5.93 9.88 5.10
Orissa 58.28 22.75 0.56 7.00 1.17
Puducherry 47.50 17.22 30.56 0.00 4.72
Punjab 68.81 1.31 1.85 12.36 15.67
Rajasthan 59.18 30.96 4.07 0.28 5.51
Sikkim 71.23 15.61 12.43 0.27 0.45
Tamil Nadu 68.19 17.36 7.71 6.65 0.09
Tripura 56.79 27.01 14.66 0.03 1.51
Uttar Pradesh 71.83 2.65 0.35 24.27 0.90
Uttarakhand 72.16 2.86 1.14 16.64 7.20
West Bengal 86.43 1.22 0.68 2.17 9.44
All States 67.03 16.07 2.01 9.60 4.77

7/30/2019 Analytical Tables 2007-08
http://slidepdf.com/reader/full/analytical-tables-2007-08 31/180
4
Table 1.4 Percentage of Schools by Category : 2007-08 Urban Ar
School Category
Primary with Primary with Upper Primary Upper PriPrimary Only Upper Primary Upper Primary Only with Sec
& Sec./Hr. Sec. Seconda
A & N Islands 26.09 23.91 34.78 0.00 15.22
Andhra Pradesh 47.61 20.96 1.29 0.00 30.14
Arunachal Pradesh 50.75 33.46 12.03 0.38 3.38 Assam 68.41 2.07 3.07 14.15 12.29
Bihar 61.01 34.90 1.70 0.55 1.84
Chandigarh 13.01 12.33 65.07 0.68 8.90
Chhattisgarh 47.29 13.34 14.61 18.52 6.24
D & N Haveli 29.17 58.33 8.33 0.00 4.17
Daman & Diu 42.86 7.14 21.43 14.29 14.29
Delhi 50.42 12.76 22.28 2.03 12.52
Goa 55.56 7.66 16.48 1.15 19.16
Gujarat 21.28 69.42 6.27 2.06 0.97
Haryana 38.37 15.43 23.87 3.82 18.51
Himachal Pradesh 40.78 8.96 30.61 5.75 13.77
Jammu & Kashmir 34.20 35.97 28.34 0.40 1.09
Jharkhand 42.73 36.91 9.01 1.48 9.88Karnataka 29.95 58.37 8.39 1.61 1.67
Kerala 47.39 21.46 9.70 4.20 17.20
Lakshadweep 0.00 0.00 0.00 0.00 0.00
Madhya Pradesh 41.59 31.58 8.13 16.41 2.28
Maharashtra 31.19 33.61 9.76 0.35 25.08
Manipur 47.36 19.94 23.17 1.91 7.62
Meghalaya 50.93 8.58 12.73 16.31 11.44
Mizoram 44.06 20.53 5.64 27.97 1.80
Nagaland 31.79 20.81 34.68 6.36 6.36
Orissa 49.64 22.37 7.54 5.43 7.32
Puducherry 39.53 17.11 33.92 0.00 9.14
Punjab 52.33 5.90 16.94 6.12 18.71
Rajasthan 31.09 42.26 19.92 0.38 6.35Sikkim 41.30 28.26 30.43 0.00 0.00
Tamil Nadu 52.10 14.89 12.17 20.82 0.02
Tripura 32.95 15.89 43.41 0.00 7.75
Uttar Pradesh 65.15 14.22 1.28 17.67 1.69
Uttarakhand 58.48 13.07 6.50 12.75 9.20
West Bengal 74.73 2.58 2.69 2.39 17.06 All States 46.26 26.63 8.94 7.02 10.90
State/UT

7/30/2019 Analytical Tables 2007-08
http://slidepdf.com/reader/full/analytical-tables-2007-08 32/180
5
Table 1.5 Percentage of Schools by Category : 2007-08 All Areas : All Go
School Category
State/UT Primary with Primary with Upper Primary Upper PrPrimary Only Upper Primary Upper Primary Only with Sec
& Sec./Hr. Sec. Second
A & N Islands 55.84 17.67 19.87 0.00 6.62
Andhra Pradesh 72.01 15.15 0.37 0.00 12.48
Arunachal Pradesh 82.78 13.07 2.96 0.23 0.97
Assam 84.13 1.75 0.13 9.40 4.59
Bihar 74.49 24.23 0.38 0.29 0.60
Chandigarh 18.18 8.18 67.27 0.91 5.45
Chhattisgarh 68.49 2.42 2.74 24.36 1.94
D & N Haveli 61.40 37.87 0.00 0.37 0.37
Daman & Diu 56.96 10.13 6.33 17.72 7.59
Delhi 65.36 2.55 13.45 2.28 16.36
Goa 84.25 7.23 1.92 0.82 5.77
Gujarat 34.83 64.17 0.58 0.33 0.09
Haryana 61.59 6.88 5.42 8.88 17.23
Himachal Pradesh 71.43 0.02 0.18 16.04 12.33
Jammu & Kashmir 63.82 28.15 5.82 0.33 1.88
Jharkhand 70.44 26.52 0.68 0.49 1.87
Karnataka 55.30 43.38 0.52 0.49 0.31
Kerala 55.91 20.48 10.36 2.95 10.30
Lakshadweep 43.24 24.32 10.81 2.70 18.92
Madhya Pradesh 76.69 0.03 0.03 23.22 0.03
Maharashtra 58.72 36.67 1.73 0.06 2.82
Manipur 78.05 12.52 5.57 0.73 3.13
Meghalaya 87.75 2.10 1.30 7.40 1.45
Mizoram 59.88 4.05 0.26 34.99 0.83
Nagaland 76.91 3.61 0.65 12.57 6.26
Orissa 62.21 24.15 0.48 5.25 1.53
Puducherry 54.88 15.42 19.05 0.00 10.66
Punjab 70.16 0.25 0.75 12.49 16.35
Rajasthan 65.59 26.21 1.10 0.36 6.74
Sikkim 66.44 17.47 15.29 0.23 0.57
Tamil Nadu 69.01 18.99 6.16 5.73 0.12
Tripura 56.16 26.61 15.59 0.03 1.60
Uttar Pradesh 75.36 0.67 0.11 23.66 0.19
Uttarakhand 74.20 0.94 0.89 16.69 7.29
West Bengal 86.82 0.06 0.40 1.91 10.74
All States 70.11 15.44 1.16 9.02 3.92

7/30/2019 Analytical Tables 2007-08
http://slidepdf.com/reader/full/analytical-tables-2007-08 33/180
6 Table 1.6 Percentage of Schools by Category : 2007-08 All Areas : A
School Category
Primary with Primary with Upper Primary Upper PriPrimary Only Upper Primary Upper Primary Only with Sec.
& Sec./Hr. Sec. Seconda
A & N Islands 52.38 30.95 7.14 2.38 7.14
Andhra Pradesh 38.96 28.48 0.94 0.00 31.62
Arunachal Pradesh 42.59 41.67 14.35 0.46 0.93 Assam 41.21 2.65 3.81 39.24 13.09
Bihar 19.06 45.40 29.48 0.89 5.17
Chandigarh 12.12 19.70 56.06 0.00 12.12
Chhattisgarh 39.53 24.71 22.91 8.17 4.68
D & N Haveli 52.63 15.79 31.58 0.00 0.00
Daman & Diu 30.00 20.00 50.00 0.00 0.00
Delhi 28.69 28.75 34.60 1.19 6.76
Goa 22.74 4.40 36.19 3.67 33.01
Gujarat 20.96 60.03 11.48 4.37 3.16
Haryana 14.26 23.54 40.86 2.56 18.78
Himachal Pradesh 37.01 24.78 36.65 0.18 1.39
Jammu & Kashmir 29.16 45.51 25.19 0.02 0.12
Jharkhand 36.53 34.27 14.78 0.85 13.56Karnataka 33.65 53.30 8.87 1.98 2.20
Kerala 52.80 19.34 6.66 8.71 12.49
Lakshadweep 0.00 0.00 0.00 0.00 0.00
Madhya Pradesh 37.58 44.56 8.17 7.33 2.36
Maharashtra 18.49 15.26 11.23 0.53 54.49
Manipur 37.31 27.32 29.19 2.59 3.59
Meghalaya 66.33 6.47 3.39 20.52 3.29
Mizoram 28.27 45.74 10.81 13.31 1.87
Nagaland 24.70 36.68 35.48 0.60 2.54
Orissa 15.57 9.45 6.19 22.16 2.15
Puducherry 24.62 20.00 54.62 0.00 0.38
Punjab 27.93 21.08 37.62 1.52 11.86
Rajasthan 20.35 53.38 24.16 0.10 2.02Sikkim 81.29 11.87 6.47 0.36 0.00
Tamil Nadu 58.15 12.86 13.09 15.89 0.00
Tripura 33.33 18.52 38.89 0.00 9.26
Uttar Pradesh 58.47 13.22 1.43 23.54 3.35
Uttarakhand 56.97 16.08 4.53 14.81 7.61
West Bengal 72.43 8.25 4.14 3.61 10.12
All States 41.14 25.16 9.97 10.45 12.16
State/UT

7/30/2019 Analytical Tables 2007-08
http://slidepdf.com/reader/full/analytical-tables-2007-08 34/180
7
State/UT
Table 1.7 Number of Schools by Management : 2007-08 All A
Department Tribal/ %age of Private All %of Social Local Other All Government Private Un- Private P
Education Welfare Body Departments Government Schools Aided Aided Schools SDepartment Schools
A & N Islands 303 0 9 5 317 88.30 2 40 42
Andhra Pradesh 2774 4293 69153 3104 79324 78.97 3528 17597 21125 2
Arunachal Pradesh 4238 22 28 43 4331 95.25 69 147 216
Assam 53229 17 634 70 53950 80.85 5564 7213 12777
Bihar 66568 33 22 4 66627 98.16 1067 171 1238
Chandigarh 103 0 0 7 110 62.50 7 59 66 3
Chhattisgarh 21773 23310 285 210 45578 91.69 543 3411 3954
D & N Haveli 270 1 0 1 272 89.47 13 6 19
Daman & Diu 71 1 6 1 79 80.61 2 8 10
Delhi 994 54 1875 59 2982 62.88 310 1450 1760 3
Goa 1064 3 20 5 1092 72.65 388 21 409 2
Gujarat 3784 687 28582 61 33114 84.82 827 5098 5925
Haryana 14083 63 390 193 14729 83.01 344 2664 3008
Himachal Pradesh 14913 5 4 46 14968 87.04 33 2191 2224
Jammu & Kashmir 16418 6 0 78 16502 79.38 4 4283 4287 2
Jharkhand 39009 143 177 182 39511 94.20 966 1158 2124
Karnataka 44849 390 154 229 45622 80.83 2408 8411 10819
Kerala 4589 39 403 56 5087 40.94 6831 480 7311 5
Lakshadweep 37 0 0 0 37 100.00 0 0 0
Madhya Pradesh 86942 19286 25 155 106408 82.49 1253 21339 22592
Maharashtra 177 2100 59102 329 61708 70.70 17907 7641 25548 2
Manipur 1704 866 38 12 2620 65.32 563 828 1391 3
Meghalaya 3542 20 296 141 3999 37.83 5921 649 6570
Mizoram 2117 3 89 89 2298 82.57 52 429 481
Nagaland 1843 0 0 11 1854 73.48 0 668 668 2
Orissa 51056 1588 383 640 53667 90.30 2623 3145 5768
Puducherry 435 0 3 3 441 62.73 43 217 260 3
Punjab 12741 7 5546 214 18508 92.42 439 1079 1518
Rajasthan 33708 162 43329 120 77319 74.85 962 21765 22727 2
Sikkim 782 59 22 7 870 75.65 51 227 278 2
Tamil Nadu 4205 1670 29348 113 35336 66.29 8396 9575 17971 3
Tripura 3734 5 0 0 3739 95.85 65 97 162
Uttar Pradesh 131509 1148 1665 1162 135484 75.24 7353 37132 44485 2
Uttarakhand 16490 75 237 169 16971 82.34 686 2953 3639
West Bengal 56989 40 397 35 57461 82.08 1393 11130 12523
All States 697043 56096 242222 7554 1002915 80.18 70613 173282 243895 1
State/UT
Note: Total may not add to hundred because of rounding of figures and no-responses.
7/30/2019 Analytical Tables 2007-08
http://slidepdf.com/reader/full/analytical-tables-2007-08 35/180
8
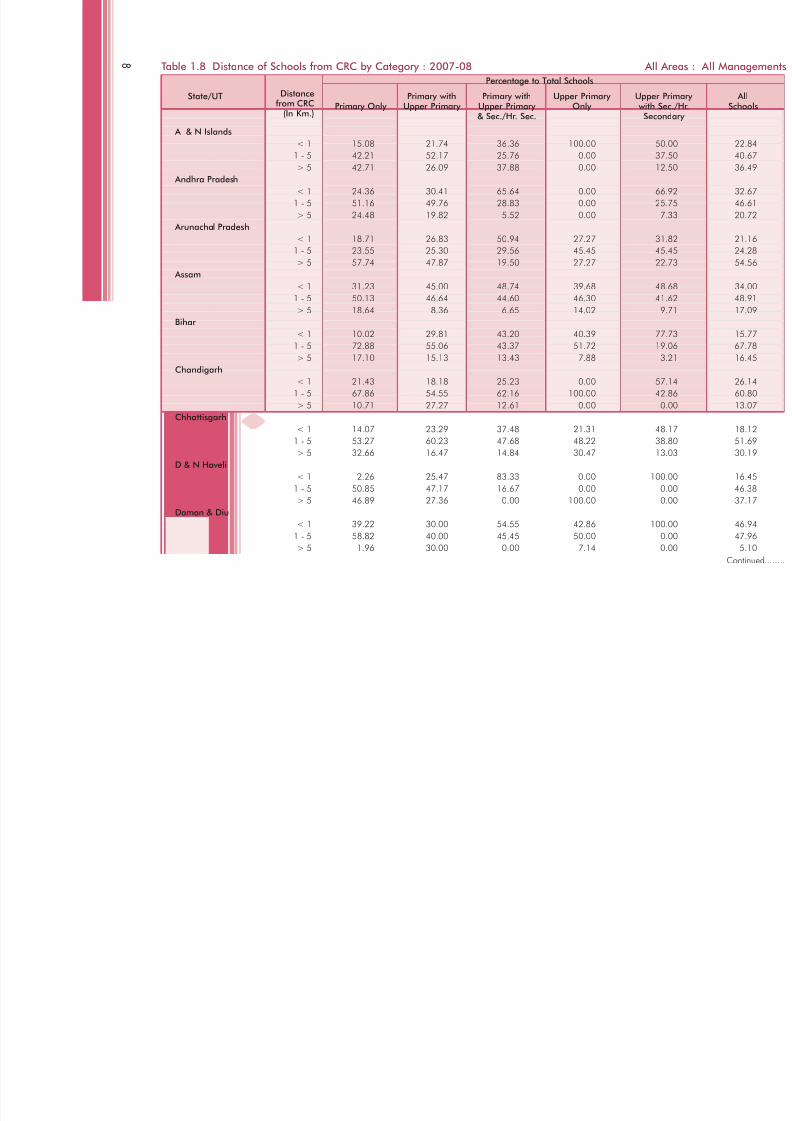
Table 1.8 Distance of Schools from CRC by Category : 2007-08 All Ar
Percentage to Total Schools
State/UT Distance Primary with Primary with Upper Primary Upper Prfrom CRC Primary Only Upper Primary Upper Primary Only with Sec
(In Km.) & Sec./Hr. Sec. Second
A & N Islands
< 1 15.08 21.74 36.36 100.00 50.0
1 - 5 42.21 52.17 25.76 0.00 37.5> 5 42.71 26.09 37.88 0.00 12.5
Andhra Pradesh
< 1 24.36 30.41 65.64 0.00 66.9
1 - 5 51.16 49.76 28.83 0.00 25.7
> 5 24.48 19.82 5.52 0.00 7.3
Arunachal Pradesh
< 1 18.71 26.83 50.94 27.27 31.8
1 - 5 23.55 25.30 29.56 45.45 45.4
> 5 57.74 47.87 19.50 27.27 22.7
Assam
< 1 31.23 45.00 48.74 39.68 48.6
1 - 5 50.13 46.64 44.60 46.30 41.6
> 5 18.64 8.36 6.65 14.02 9.7Bihar
< 1 10.02 29.81 43.20 40.39 77.7
1 - 5 72.88 55.06 43.37 51.72 19.0
> 5 17.10 15.13 13.43 7.88 3.2
Chandigarh
< 1 21.43 18.18 25.23 0.00 57.1
1 - 5 67.86 54.55 62.16 100.00 42.8
> 5 10.71 27.27 12.61 0.00 0.0
Chhattisgarh
< 1 14.07 23.29 37.48 21.31 48.1
1 - 5 53.27 60.23 47.68 48.22 38.8
> 5 32.66 16.47 14.84 30.47 13.0
D & N Haveli
< 1 2.26 25.47 83.33 0.00 100.0
1 - 5 50.85 47.17 16.67 0.00 0.0
> 5 46.89 27.36 0.00 100.00 0.0
Daman & Diu
< 1 39.22 30.00 54.55 42.86 100.0
1 - 5 58.82 40.00 45.45 50.00 0.0
> 5 1.96 30.00 0.00 7.14 0.0

7/30/2019 Analytical Tables 2007-08
http://slidepdf.com/reader/full/analytical-tables-2007-08 36/180
9
Table 1.8 Distance of Schools from CRC by Category : 2007-08 All A
Percentage to Total Schools
State/UT Distance Primary with Primary with Upper Primary Upper Pfrom CRC Primary Only Upper Primary Upper Primary Only with Se
(In Km.) & Sec./Hr. Sec. Secon
Delhi
< 1 76.73 72.85 74.75 65.17 67.
1 - 5 10.72 14.78 12.97 15.73 18.> 5 12.55 12.37 12.28 19.10 13.
Goa
<1 36.43 47.42 41.42 54.17 34.
1 - 5 48.17 41.24 48.52 45.83 52.
> 5 15.40 11.34 10.06 0.00 13.
Gujarat
< 1 15.54 25.59 39.33 46.61 44.
1 - 5 52.45 44.80 50.46 44.72 47.
> 5 32.02 29.61 10.21 8.67 8.
Haryana
< 1 21.02 32.13 36.26 20.58 32.
1 - 5 52.34 47.12 45.63 47.73 40.
> 5 26.63 20.74 18.11 31.70 26.Himachal Pradesh
< 1 22.72 39.53 41.69 10.06 55.
1 - 5 58.39 53.97 50.48 49.48 21.
> 5 18.89 6.50 7.84 40.46 23.
Jammu & Kashmir
< 1 9.58 27.53 28.27 43.64 26.
1 - 5 69.57 56.49 57.47 49.09 64.
> 5 20.85 15.98 14.26 7.27 9.
Jharkhand
< 1 20.98 32.32 50.51 56.34 53.
1 - 5 50.87 43.66 38.89 39.44 38.
> 5 28.15 24.02 10.61 4.23 8.
Karnataka< 1 98.61 99.58 100.00 96.34 95.
1 - 5 0.17 0.05 0.00 0.00 0.
> 5 1.22 0.37 0.00 3.66 3.
Kerala
<1 18.27 25.45 17.36 18.42 21.
1 - 5 53.04 49.14 55.72 55.27 56.
> 5 28.68 25.41 26.92 26.30 21.

7/30/2019 Analytical Tables 2007-08
http://slidepdf.com/reader/full/analytical-tables-2007-08 37/180
1 0 Table 1.8 Distance of Schools from CRC by Category : 2007-08 All Ar
Percentage to Total Schools
State/UT Distance Primary with Primary with Upper Primary Upper Prfrom CRC Primary Only Upper Primary Upper Primary Only with Sec
(In Km.) & Sec./Hr. Sec. Second
Lakshadweep
< 1 31.25 55.56 75.00 0.00 71.4
1 - 5 68.75 44.44 25.00 100.00 14.2> 5 0.00 0.00 0.00 0.00 14.2
Madhya Pradesh
< 1 16.38 36.31 31.90 31.87 32.9
1 - 5 51.20 55.68 62.73 39.35 61.5
> 5 32.42 8.01 5.38 28.78 5.4
Maharashtra
< 1 16.97 30.34 36.49 44.77 37.5
1 - 5 48.81 39.06 42.66 39.53 40.8
> 5 34.22 30.60 20.85 15.70 21.6
Manipur
< 1 7.80 18.08 13.95 20.00 19.7
1 - 5 47.93 49.29 64.67 50.91 71.9
> 5 44.27 32.63 21.38 29.09 8.3Meghalaya
< 1 14.73 20.04 30.91 24.70 40.5
1 - 5 49.93 54.81 53.82 44.28 45.9
> 5 35.34 25.15 15.27 31.02 13.5
Mizoram
< 1 40.41 49.84 55.17 44.24 82.1
1 - 5 17.59 32.27 39.66 16.71 7.1
> 5 42.00 17.89 5.17 39.06 10.7
Nagaland
< 1 75.55 77.88 86.35 78.48 83.4
1 - 5 5.15 6.09 9.64 2.11 6.0
> 5 19.30 16.03 4.02 19.41 10.5
Orissa
< 1 10.22 25.00 32.03 27.21 33.1
1 - 5 65.20 55.58 58.86 60.65 60.2
> 5 24.58 19.42 9.11 12.14 6.5
Puducherry
< 1 90.85 92.50 89.38 0.00 89.5
1 - 5 5.23 4.17 6.19 0.00 4.1
> 5 3.92 3.33 4.42 0.00 6.2

7/30/2019 Analytical Tables 2007-08
http://slidepdf.com/reader/full/analytical-tables-2007-08 38/180
1 1
Table 1.8 Distance of Schools from CRC by Category : 2007-08 All A
Percentage to Total Schools
State/UT Distance Primary with Primary with Upper Primary Upper Pfrom CRC Primary Only Upper Primary Upper Primary Only with Se
(In Km.) & Sec./Hr. Sec. Secon
Punjab
< 1 20.96 36.34 35.63 19.66 32.
1 - 5 59.33 52.73 56.20 56.45 46.
>5 19.72 10.93 8.17 23.90 20.
Rajasthan
< 1 7.85 14.63 18.82 20.67 26.
1 - 5 38.15 42.32 55.91 40.00 37.
>5 54.00 43.05 25.27 39.33 35.
Sikkim
< 1 19.03 31.35 78.81 0.00 20.
1 - 5 63.06 47.03 13.91 66.67 60.
>5 17.91 21.62 7.28 33.33 20.
Tamil Nadu
< 1 16.20 22.48 28.17 37.73 38.
1 - 5 53.57 48.50 46.03 46.18 28.
>5 30.23 29.02 25.81 16.09 33.
Tripura
< 1 30.92 31.02 57.12 0.00 70.
1- 5 42.99 45.27 33.75 100.00 21.
>5 26.09 23.71 9.13 0.00 8.
Uttar Pradesh
< 1 14.34 28.51 33.04 18.56 34.
1 - 5 64.50 58.44 55.19 61.05 56.
>5 21.16 13.05 11.77 20.38 9.
Uttarakhand
< 1 13.22 20.43 19.94 15.54 25.
1- 5 46.89 62.10 58.23 42.15 45.
>5 39.89 17.47 21.84 42.30 28.
West Bengal
< 1 19.42 97.29 75.37 27.76 15.
1 - 5 26.30 1.22 10.84 24.60 36.
>5 54.28 1.50 13.79 47.64 47.
All States
< 1 20.11 35.54 36.86 25.71 42.
1 - 5 50.67 41.63 46.03 50.19 37.
>5 29.22 22.83 17.11 24.10 20.

7/30/2019 Analytical Tables 2007-08
http://slidepdf.com/reader/full/analytical-tables-2007-08 39/180
1 2 Table 1.9 Percentage of Schools Visited by CRC Co-ordinators : 2006-07 All Ar
School Category
State/UT Primary with Primary with Upper Primary Upper PriPrimary Only Upper Primary Upper Primary Only with Sec.
& Sec./Hr. Sec. Seconda
A & N Islands 61.31 76.81 75.76 100.00 54.17
Andhra Pradesh 82.92 75.71 14.52 0.00 48.22
Arunachal Pradesh 59.31 63.41 58.49 36.36 38.64 Assam 75.77 64.84 30.76 63.23 34.61
Bihar 62.05 74.29 39.64 67.98 6.21
Chandigarh 53.57 40.91 54.95 100.00 28.57
Chhattisgarh 89.59 69.60 44.62 78.17 49.30
D & N Haveli 90.40 92.45 33.33 100.00 0.00
Daman & Diu 70.59 60.00 0.00 78.57 57.14
Delhi 10.80 3.09 11.39 16.85 22.57
Goa 63.28 64.95 53.25 50.00 58.08
Gujarat 79.01 79.27 43.92 54.47 48.85
Haryana 82.27 48.63 43.07 73.94 75.83
Himachal Pradesh 62.92 14.44 13.18 41.83 41.84
Jammu & Kashmir 85.92 82.57 72.37 78.18 73.02
Jharkhand 86.21 82.33 52.53 59.15 48.99Karnataka 85.94 87.31 65.25 76.43 53.28
Kerala 71.14 72.48 63.51 67.73 63.33
Lakshadweep 37.50 33.33 25.00 0.00 28.57
Madhya Pradesh 88.37 36.06 36.58 84.48 35.27
Maharashtra 89.44 86.82 61.35 59.30 63.27
Manipur 96.65 94.49 95.29 92.73 97.73
Meghalaya 66.99 65.23 49.09 68.07 37.59
Mizoram 91.87 84.66 84.48 93.55 67.86
Nagaland 40.10 22.12 10.44 36.29 26.32
Orissa 86.18 86.69 40.81 77.48 56.57
Puducherry 6.54 6.67 5.75 0.00 12.50
Punjab 40.43 4.92 5.49 32.38 26.42
Rajasthan 75.56 67.83 37.46 59.67 41.03Sikkim 45.40 45.95 40.40 0.00 20.00
Tamil Nadu 52.50 58.69 42.85 42.65 45.24
Tripura 50.74 55.22 60.22 0.00 62.67
Uttar Pradesh 71.03 33.51 29.49 64.65 25.39
Uttarakhand 80.82 57.39 38.61 72.38 40.75
West Bengal 56.30 1.31 11.65 29.12 35.92
All States 75.23 73.38 43.91 68.79 48.20

7/30/2019 Analytical Tables 2007-08
http://slidepdf.com/reader/full/analytical-tables-2007-08 40/180
1 3
Table 1.10 Percentage of Schools Inspected : 2006-07 All A
School Category
State/UT Primary with Primary with Upper Primary Upper PrPrimary Only Upper Primary Upper Primary Only with Sec
& Sec./Hr. Sec. Second
A & N Islands 68.34 79.71 78.79 100.00 70.83
Andhra Pradesh 48.41 53.45 20.65 0.00 46.07
Arunachal Pradesh 50.10 62.50 52.20 45.45 38.64
Assam 58.52 48.75 17.27 49.98 27.70
Bihar 49.42 64.23 34.14 61.08 8.14
Chandigarh 39.29 40.91 41.44 100.00 35.71
Chhattisgarh 53.86 50.82 34.00 52.21 37.21
D & N Haveli 88.14 96.23 83.33 100.00 0.00
Daman & Diu 94.12 60.00 45.45 71.43 85.71
Delhi 77.59 22.16 50.50 77.53 84.18
Goa 50.64 45.36 42.60 45.83 50.51
Gujarat 72.95 73.48 48.74 58.81 53.46
Haryana 62.79 40.50 39.86 56.61 63.68
Himachal Pradesh 45.96 40.43 41.81 41.37 41.79
Jammu & Kashmir 59.77 67.24 55.95 67.27 66.35
Jharkhand 80.26 82.56 55.72 78.40 64.20
Karnataka 33.39 39.00 39.68 36.84 36.75
Kerala 20.87 32.53 48.52 32.15 53.65
Lakshadweep 50.00 33.33 25.00 0.00 28.57
Madhya Pradesh 68.97 34.32 43.72 73.70 43.74
Maharashtra 91.84 91.20 73.69 79.65 77.81
Manipur 94.42 89.83 86.05 92.73 92.42
Meghalaya 43.73 47.74 42.55 46.59 28.83
Mizoram 54.56 25.24 29.31 55.30 42.86
Nagaland 79.82 49.36 35.34 78.90 66.17
Orissa 59.75 58.09 37.56 40.57 42.27
Puducherry 89.54 73.33 71.68 0.00 75.00
Punjab 38.80 11.75 10.56 44.24 42.64
Rajasthan 71.12 67.71 40.81 61.00 55.22
Sikkim 53.23 65.95 60.26 33.33 80.00
Tamil Nadu 85.67 87.37 65.81 67.29 66.67
Tripura 60.68 65.76 58.51 0.00 72.00
Uttar Pradesh 55.48 35.13 29.37 52.91 27.61
Uttarakhand 59.71 43.28 36.39 56.69 42.34
West Bengal 38.56 1.59 17.00 42.48 48.92
All States 59.40 63.16 48.21 57.05 53.70

7/30/2019 Analytical Tables 2007-08
http://slidepdf.com/reader/full/analytical-tables-2007-08 41/180
1 4 Table 1.11 Percentage of Schools in Rural Areas to All Schools : 2007-08
School Category
State/UT Primary with Primary with Upper Primary Upper PriPrimary Only Upper Primary Upper Primary Only with Sec.
& Sec./Hr. Sec. Seconda
A & N Islands 93.97 84.06 75.76 100.00 70.83
Andhra Pradesh 87.48 80.02 54.81 0.00 68.75
Arunachal Pradesh 96.33 86.43 79.87 90.91 79.55 Assam 94.85 93.83 78.96 94.64 88.70
Bihar 95.75 92.75 90.45 90.64 86.30
Chandigarh 32.14 18.18 14.41 0.00 7.14
Chhattisgarh 94.68 76.37 74.86 94.03 78.44
D & N Haveli 96.05 86.79 66.67 100.00 0.00
Daman & Diu 68.63 70.00 45.45 71.43 42.86
Delhi 24.00 18.90 18.42 15.73 23.72
Goa 85.69 79.38 74.56 87.50 74.75
Gujarat 89.67 82.64 55.39 65.31 72.35
Haryana 90.80 79.60 73.21 93.72 86.43
Himachal Pradesh 97.35 87.91 72.80 98.21 94.51
Jammu & Kashmir 92.78 86.43 65.46 81.82 91.43
Jharkhand 96.79 92.93 67.17 84.98 79.40Karnataka 89.95 77.88 32.08 64.30 57.48
Kerala 86.87 83.79 82.25 90.09 77.80
Lakshadweep 100.00 100.00 100.00 100.00 100.00
Madhya Pradesh 92.25 47.51 27.32 89.56 32.45
Maharashtra 85.95 76.63 54.27 62.79 70.46
Manipur 87.40 80.79 71.20 76.36 60.61
Meghalaya 95.47 88.21 67.64 93.07 70.80
Mizoram 75.73 45.37 18.97 73.16 46.43
Nagaland 93.09 76.92 51.81 90.72 83.46
Orissa 94.10 93.25 50.08 94.60 68.43
Puducherry 55.88 51.67 48.67 0.00 35.42
Punjab 91.20 63.66 46.20 94.09 86.84
Rajasthan 92.66 82.93 57.53 82.67 85.20Sikkim 97.64 92.97 90.73 100.00 100.00
Tamil Nadu 85.92 84.47 74.72 59.83 95.24
Tripura 96.05 96.00 82.66 100.00 73.33
Uttar Pradesh 91.14 63.55 71.90 92.76 83.23
Uttarakhand 93.92 73.25 68.67 94.25 90.75
West Bengal 84.09 65.39 51.94 80.37 72.82
All States 90.94 80.80 60.96 90.51 75.33

7/30/2019 Analytical Tables 2007-08
http://slidepdf.com/reader/full/analytical-tables-2007-08 42/180
1 5
Table 1.12 Ratio of Primary to Upper Primary Schools/Sections by Management : 2007-08
Management
State/UT Department Tribal/Social Local All Private Privateof Welfare Body Government Aided Un-Aided
Education Department Managements
A & N Islands 2.15 0.00 2.25 2.15 1.00 2.00
Andhra Pradesh 1.55 3.95 3.06 3.01 2.08 1.01
Arunachal Pradesh 5.95 2.10 2.33 5.84 1.43 1.90
Assam 5.48 2.50 3.54 5.45 0.00 3.12
Bihar 3.89 2.06 2.75 3.89 1.08 2.04
Chandigarh 1.17 0.00 0.00 1.17 0.86 1.02
Chhattisgarh 2.69 2.11 1.37 2.35 1.54 1.43
D & N Haveli 2.62 0.00 0.00 2.60 2.60 1.50
Daman & Diu 1.96 0.00 1.20 1.78 2.00 1.33
Delhi 0.51 5.89 25.24 2.41 0.90 1.39
Goa 6.44 3.00 1.00 5.97 0.77 4.00
Gujarat 1.69 1.16 1.52 1.53 0.98 1.20
Haryana 2.01 1.02 1.11 1.95 0.88 0.92
Himachal Pradesh 2.52 0.75 1.33 2.52 0.90 1.58
Jammu & Kashmir 2.72 6.00 0.00 2.72 1.00 1.41
Jharkhand 3.35 1.66 1.63 3.32 1.40 1.31
Karnataka 2.23 1.67 1.89 2.23 1.04 1.62
Kerala 2.02 0.73 1.63 1.97 1.72 1.21
Lakshadweep 1.38 0.00 0.00 1.38 0.00 0.00
Madhya Pradesh 3.50 2.61 1.33 3.30 2.01 1.42
Maharashtra 1.49 0.94 2.49 2.37 0.42 0.92
Manipur 3.05 - 1.32 4.45 2.92 1.15
Meghalaya 9.85 2.43 2.78 8.22 2.21 2.83
Mizoram 1.65 3.00 1.67 1.65 0.39 1.31
Nagaland 3.58 0.00 0.00 3.58 0.00 1.29
Orissa 2.74 3.32 1.51 2.74 0.31 1.23
Puducherry 2.01 0.00 1.00 2.00 1.13 1.37
Punjab 1.42 3.50 79.42 2.43 0.94 1.32
Rajasthan 1.07 9.38 - 2.71 1.57 1.22
Sikkim 2.78 - 3.14 2.98 3.13 6.31
Tamil Nadu 0.62 3.27 4.50 3.06 2.19 1.87
Tripura 2.25 1.33 0.00 2.24 1.12 1.56
Uttar Pradesh 3.11 5.28 2.06 3.11 0.87 2.05
Uttarakhand 2.98 2.52 2.27 2.96 0.59 2.37
West Bengal 6.67 4.71 9.53 6.68 0.06 5.48
All States 2.87 2.34 3.28 2.94 0.88 1.53

7/30/2019 Analytical Tables 2007-08
http://slidepdf.com/reader/full/analytical-tables-2007-08 43/180
1 6 Table 1.13 Ratio of Primary to Upper Primary Schools/Sections by Management : 2007-08
Management
State/UT Department Tribal/Social Local All Private Privateof Welfare Body Government Aided Un-Aided
Education Department Managements
A & N Islands 2.34 0.00 2.67 2.35 1.00 2.88
Andhra Pradesh 1.17 4.28 3.10 3.10 3.71 1.03
Arunachal Pradesh 6.34 2.00 2.57 6.25 1.46 1.89 Assam 5.71 4.00 4.07 5.69 0.00 3.30
Bihar 4.00 2.21 2.75 3.99 1.08 1.85
Chandigarh 1.44 0.00 0.00 1.44 1.00 1.00
Chhattisgarh 2.79 2.13 1.38 2.40 1.63 1.62
D & N Haveli 2.79 0.00 0.00 2.76 2.60 2.00
Daman & Diu 2.06 0.00 1.50 1.90 2.00 2.00
Delhi 0.46 0.00 - 2.48 1.00 1.39
Goa 6.82 3.00 0.75 6.44 0.75 3.67
Gujarat 1.71 1.15 1.55 1.55 0.88 1.25
Haryana 1.98 1.10 1.17 1.95 0.98 0.91
Himachal Pradesh 2.55 0.67 0.00 2.55 0.81 1.66
Jammu & Kashmir 2.78 0.00 0.00 2.78 1.00 1.53
Jharkhand 3.44 1.74 1.72 3.42 1.61 1.43Karnataka 2.33 1.60 2.27 2.33 1.08 1.93
Kerala 2.14 0.89 1.67 2.08 1.74 1.26
Lakshadweep 1.38 0.00 0.00 1.38 0.00 0.00
Madhya Pradesh 3.63 2.64 1.50 3.41 3.51 1.68
Maharashtra 1.91 0.91 2.66 2.53 0.22 0.60
Manipur 3.10 - 1.47 4.95 3.18 1.18
Meghalaya 10.80 2.43 2.80 8.79 2.34 3.48
Mizoram 1.71 1.00 1.80 1.71 0.22 1.77
Nagaland 3.77 0.00 0.00 3.77 0.00 1.39
Orissa 2.78 3.37 1.65 2.79 0.26 1.18
Puducherry 2.22 0.00 0.00 2.22 1.10 1.34
Punjab 1.40 4.00 - 2.46 0.68 1.35
Rajasthan 0.98 11.08 0.00 2.77 2.54 1.28Sikkim 2.87 - 3.00 3.07 4.56 6.90
Tamil Nadu 0.64 3.37 4.73 3.20 2.69 2.06
Tripura 2.32 0.50 0.00 2.31 1.24 1.50
Uttar Pradesh 3.08 6.20 2.12 3.08 0.85 2.03
Uttarakhand 3.00 2.50 2.40 2.99 0.51 2.49
West Bengal 7.42 4.33 1.00 7.38 0.04 6.24
All States 2.94 2.39 3.45 3.03 0.84 1.69

7/30/2019 Analytical Tables 2007-08
http://slidepdf.com/reader/full/analytical-tables-2007-08 44/180
1 7
Table 1.14 Ratio of Primary to Upper Primary Schools/Sections by Management : 2007-08
Management
State/UT Department Tribal/Social Local All Private Privateof Welfare Body Government Aided Un-Aided
Education Department Managements
A & N Islands 1.10 0.00 1.00 1.10 1.00 1.30
Andhra Pradesh 1.81 0.40 2.60 2.24 1.26 0.99
Arunachal Pradesh 2.24 2.50 2.00 2.23 1.38 1.90
Assam 3.21 1.00 0.88 3.13 0.02 1.49
Bihar 2.56 1.00 0.00 2.56 1.07 2.87
Chandigarh 1.09 0.00 0.00 1.09 0.83 1.02
Chhattisgarh 1.80 1.47 1.36 1.68 1.27 1.18
D & N Haveli 1.46 0.00 0.00 1.46 0.00 1.33
Daman & Diu 1.38 0.00 1.00 1.27 0.00 1.25
Delhi 0.52 5.00 19.36 2.39 0.89 1.39
Goa 4.63 0.00 1.33 4.03 0.81 4.50
Gujarat 1.42 1.23 1.30 1.30 1.16 1.17
Haryana 2.43 0.89 1.02 2.00 0.81 0.94
Himachal Pradesh 1.64 1.00 1.33 1.63 1.00 1.25
Jammu & Kashmir 2.12 2.00 0.00 2.12 1.00 1.19
Jharkhand 1.95 1.00 1.45 1.92 0.91 1.08
Karnataka 1.59 1.97 1.25 1.59 1.01 1.35
Kerala 1.51 0.45 1.40 1.47 1.60 1.09
Lakshadweep 0.00 0.00 0.00 0.00 0.00 0.00
Madhya Pradesh 2.13 2.13 1.30 2.12 1.24 1.21
Maharashtra 1.00 1.16 1.52 1.50 0.78 1.13
Manipur 2.87 1.00 1.00 2.69 1.97 1.08
Meghalaya 3.73 0.00 2.33 3.65 1.16 1.07
Mizoram 1.47 0.00 1.36 1.47 0.59 1.08
Nagaland 2.00 0.00 0.00 2.00 0.00 1.12
Orissa 2.15 2.26 1.20 2.11 0.87 1.31
Puducherry 1.77 0.00 1.00 1.76 1.14 1.39
Punjab 1.60 3.00 33.43 2.07 1.05 1.28
Rajasthan 1.97 2.00 0.00 2.02 1.22 1.11
Sikkim 1.00 0.00 0.00 1.15 1.29 3.33
Tamil Nadu 0.41 2.23 2.72 1.91 1.46 1.63
Tripura 1.40 3.00 0.00 1.41 1.06 1.73
Uttar Pradesh 4.14 2.36 1.80 3.85 1.01 2.08
Uttarakhand 2.41 2.67 1.91 2.35 0.81 2.07
West Bengal 3.97 7.00 82.00 4.17 0.09 4.17
All States 2.22 1.62 1.97 2.12 0.95 1.31

7/30/2019 Analytical Tables 2007-08
http://slidepdf.com/reader/full/analytical-tables-2007-08 45/180
1 8 Table 1.15 Percentage of Schools Established Since 2002-03 All Ar
School Category
State/UT Primary with Primary with Upper Primary Upper PriPrimary Only Upper Primary Upper Primary Only with Sec.
& Sec./Hr. Sec. Seconda
A & N Islands 11.06 4.35 1.52 0.00 12.50
Andhra Pradesh 10.45 21.09 22.90 0.00 23.64
Arunachal Pradesh 66.20 9.76 1.89 72.73 6.82 Assam 29.31 8.67 22.12 1.50 1.25
Bihar 30.06 1.87 7.77 4.43 0.21
Chandigarh 17.86 22.73 5.41 0.00 7.14
Chhattisgarh 12.10 22.62 32.42 51.90 10.31
D & N Haveli 44.07 9.43 0.00 0.00 0.00
Daman & Diu 1.96 0.00 18.18 7.14 0.00
Delhi 4.32 7.04 3.17 10.11 5.11
Goa 0.59 0.00 1.18 4.17 0.51
Gujarat 18.11 5.22 15.25 13.28 17.05
Haryana 4.54 17.43 13.76 10.54 6.03
Himachal Pradesh 7.15 43.50 22.92 44.12 8.80
Jammu & Kashmir 35.59 4.41 2.06 41.82 1.59
Jharkhand 51.91 1.54 7.07 69.48 2.69Karnataka 16.32 1.36 3.51 13.27 10.50
Kerala 0.92 0.53 1.78 0.89 1.46
Lakshadweep 0.00 11.11 0.00 100.00 0.00
Madhya Pradesh 7.11 23.46 6.98 19.31 8.99
Maharashtra 4.11 2.29 7.75 11.05 6.67
Manipur 2.03 6.21 3.80 0.00 0.00
Meghalaya 17.36 23.97 11.27 37.35 8.03
Mizoram 18.32 39.62 27.59 15.67 71.43
Nagaland 6.54 8.97 2.01 6.75 2.26
Orissa 13.14 2.61 2.76 0.83 1.69
Puducherry 11.76 9.17 5.31 0.00 0.00
Punjab 1.49 13.93 7.61 2.01 1.84
Rajasthan 24.86 14.17 11.78 58.67 4.36Sikkim 15.05 1.08 0.66 0.00 0.00
Tamil Nadu 9.07 4.46 15.61 2.89 100.00
Tripura 33.80 1.56 0.31 100.00 2.67
Uttar Pradesh 15.35 17.25 12.28 42.90 3.48
Uttarakhand 9.83 13.58 5.70 23.20 4.36
West Bengal 5.48 21.42 10.04 3.81 0.40
All States 15.89 8.21 11.17 28.45 9.07

7/30/2019 Analytical Tables 2007-08
http://slidepdf.com/reader/full/analytical-tables-2007-08 46/180
1 9
Table 1.16 Percentage of Schools Established Since 2002-03 and have Building All A
School Category
State/UT Primary with Primary with Upper Primary Upper PrPrimary Only Upper Primary Upper Primary Only with Sec
& Sec./Hr. Sec. Second
A & N Islands 100.00 100.00 100.00 - 100.00
Andhra Pradesh 79.41 99.24 97.32 - 95.25
Arunachal Pradesh 71.65 100.00 100.00 100.00 100.00
Assam 17.65 57.66 61.79 41.06 42.31
Bihar 28.78 55.13 50.00 33.33 -
Chandigarh 100.00 100.00 100.00 - 100.00
Chhattisgarh 70.11 83.65 52.22 68.66 73.64
D & N Haveli 100.00 100.00 - - -
Daman & Diu 100.00 0.00 100.00 100.00 -
Delhi 100.00 100.00 100.00 100.00 100.00
Goa 100.00 - 100.00 100.00 100.00
Gujarat 89.45 96.14 93.98 89.80 91.89
Haryana 98.14 96.33 97.85 99.32 97.86
Himachal Pradesh 99.15 98.34 100.00 99.91 100.00
Jammu & Kashmir 94.61 98.91 97.62 100.00 100.00
Jharkhand 78.28 95.98 92.86 90.54 89.29
Karnataka 98.58 99.42 100.00 94.83 100.00
Kerala 98.39 100.00 100.00 85.71 85.71
Lakshadweep - 100.00 - 100.00 -
Madhya Pradesh 97.39 98.65 98.47 82.51 88.24
Maharashtra 92.22 98.03 98.69 100.00 98.95
Manipur 96.15 100.00 100.00 - -
Meghalaya 81.19 86.89 87.10 87.30 86.36
Mizoram 94.95 99.19 93.75 99.26 65.00
Nagaland 100.00 100.00 100.00 100.00 100.00
Orissa 84.38 99.43 100.00 94.12 93.75
Puducherry 94.44 100.00 83.33 - -
Punjab 96.50 98.04 98.15 95.74 100.00
Rajasthan 87.67 98.44 99.47 86.93 100.00
Sikkim 97.52 100.00 100.00 - -
Tamil Nadu 99.91 99.50 100.00 100.00 100.00
Tripura 100.00 100.00 100.00 - 100.00
Uttar Pradesh 99.94 100.00 98.97 99.88 100.00
Uttarakhand 97.15 99.01 88.89 97.83 95.45
West Bengal 99.88 100.00 100.00 100.00 100.00
All States 74.15 97.11 88.87 90.84 95.38

7/30/2019 Analytical Tables 2007-08
http://slidepdf.com/reader/full/analytical-tables-2007-08 47/180
2 0 Table 1.17 Percentage Distribution of Schools by Status of Building : 2007-08 All Ar
School Category
State/UT Building Status Primary with Primary with Upper Primary UPrimary Only Upper Primary Upper Primary Only
& Sec./Hr. Sec.
A & N Islands
Private 7.54 18.84 6.06 100.00
Rented 2.51 0.00 0.00 0.00
Government 88.94 79.71 93.94 0.00
Government School in Rent Free Building 0.00 0.00 0.00 0.00
Andhra Pradesh
Private 7.81 15.57 37.01 0.00
Rented 5.88 18.36 13.29 0.00
Government 78.94 65.33 46.42 0.00
Government School in Rent Free Building 2.86 0.40 2.45 0.00
Arunachal Pradesh
Private 7.91 16.16 20.13 18.18
Rented 1.25 0.91 1.26 18.18
Government 59.37 81.71 77.99 63.64
Government School in Rent Free Building 11.94 0.91 0.63 0.00
AssamPrivate 5.21 13.05 50.18 13.20
Rented 1.87 1.41 5.94 0.56
Government 59.78 70.70 5.58 49.97
Government School in Rent Free Building 1.56 1.95 2.16 10.91
Bihar
Private 1.72 2.56 36.89 4.43
Rented 0.50 0.64 0.49 0.99
Government 71.10 93.75 55.83 87.19
Government School in Rent Free Building 1.89 1.09 1.46 4.43
Chandigarh
Private 28.57 59.09 34.23 0.00
Rented 0.00 0.00 0.90 0.00
Government 67.86 40.91 63.06 100.00
Government School in Rent Free Building 3.57 0.00 0.90 0.00
Chhattisgarh
Private 3.10 25.12 25.74 2.13
Rented 3.50 24.98 15.31 1.41
Government 83.71 40.49 35.16 76.03
Government School in Rent Free Building 1.47 4.13 5.75 1.47
*Total may not add to 100 because of no responses and schools without buildings.

7/30/2019 Analytical Tables 2007-08
http://slidepdf.com/reader/full/analytical-tables-2007-08 48/180
2 1
Table 1.17 Percentage Distribution of Schools by Status of Building : 2007-08 All A
School Category
State/UT Building Status Primary with Primary with Upper PrimaryPrimary Only Upper Primary Upper Primary Only
& Sec./Hr. Sec.
D & N Haveli
Private 4.52 1.89 50.00 0.00
Rented 23.73 4.72 50.00 0.00 Government 71.19 92.45 0.00 100.00
Government School in Rent Free Building 0.00 0.00 0.00 0.00
Daman & Diu
Private 5.88 20.00 36.36 0.00
Rented 7.84 20.00 0.00 7.14
Government 84.31 60.00 63.64 92.86
Government School in Rent Free Building 0.00 0.00 0.00 0.00
Delhi
Private 8.60 29.90 45.05 22.47
Rented 18.01 60.48 17.13 10.11
Government 68.74 8.42 35.25 65.17
Government School in Rent Free Building 4.52 1.20 2.57 2.25
Goa
Private 4.15 5.15 11.83 16.67
Rented 13.13 18.56 77.51 62.50
Government 80.95 75.26 7.69 20.83
Government School in Rent Free Building 0.99 0.00 0.00 0.00
Gujarat
Private 6.49 10.13 56.42 55.01
Rented 7.95 9.84 22.48 16.53
Government 80.10 75.24 15.83 23.58
Government School in Rent Free Building 3.19 4.07 1.95 1.63
Haryana
Private 5.50 46.14 63.79 7.00
Rented 0.92 5.29 4.34 0.36 Government 91.89 46.37 29.80 91.77
Government School in Rent Free Building 1.17 0.41 0.30 0.79
Himachal Pradesh
Private 2.48 29.96 42.04 0.50
Rented 4.85 66.97 54.51 0.75
Government 90.00 0.90 1.19 75.18
Government School in Rent Free Building 2.57 0.54 1.19 23.49

7/30/2019 Analytical Tables 2007-08
http://slidepdf.com/reader/full/analytical-tables-2007-08 49/180
2 2 Table 1.17 Percentage Distribution of Schools by Status of Building : 2007-08 All Ar
School Category
State/UT Building Status Primary with Primary with Upper Primary UPrimary Only Upper Primary Upper Primary Only
& Sec./Hr. Sec.
Jammu & Kashmir
Private 7.21 18.42 35.57 5.45
Rented 30.86 18.91 20.04 38.18 Government 54.11 59.48 41.84 49.09
Government School in Rent Free Building 3.92 1.39 1.22 7.27
Jharkhand
Private 3.54 6.74 49.49 8.45
Rented 0.97 1.08 9.60 2.35
Government 78.56 90.31 33.84 56.81
Government School in Rent Free Building 1.87 0.90 3.37 21.60
Karnataka
Private 8.95 16.98 62.24 43.02
Rented 6.81 7.88 21.14 14.65
Government 81.88 73.75 15.54 38.90
Government School in Rent Free Building 2.09 1.37 1.09 2.75
KeralaPrivate 60.83 59.04 49.70 85.64
Rented 3.06 1.75 0.89 0.51
Government 34.98 38.11 48.03 12.58
Government School in Rent Free Building 0.57 0.45 0.20 0.64
Lakshadweep
Private 0.00 0.00 0.00 0.00
Rented 18.75 0.00 0.00 0.00
Government 81.25 100.00 100.00 100.00
Government School in Rent Free Building 0.00 0.00 0.00 0.00
Madhya Pradesh
Private 3.56 34.23 48.94 3.11
Rented 5.91 63.33 45.58 3.35
Government 88.12 0.08 0.85 82.31
Government School in Rent Free Building 0.86 0.51 0.64 0.82
Maharashtra
Private 5.29 6.70 34.43 29.07
Rented 9.00 13.24 44.51 52.33
Government 84.44 79.27 14.12 16.28
Government School in Rent Free Building 0.70 0.61 6.55 2.33

7/30/2019 Analytical Tables 2007-08
http://slidepdf.com/reader/full/analytical-tables-2007-08 50/180
2 3
Table 1.17 Percentage Distribution of Schools by Status of Building : 2007-08 All A
School Category
State/UT Building Status Primary with Primary with Upper PrimaryPrimary Only Upper Primary Upper Primary Only
& Sec./Hr. Sec.
Manipur
Private 21.41 56.50 75.91 63.64
Rented 0.47 0.85 0.54 0.00 Government 76.13 42.37 23.37 34.55
Government School in Rent Free Building 0.94 0.14 0.00 0.00
Meghalaya
Private 49.17 78.19 82.55 62.77
Rented 1.30 4.72 4.00 3.10
Government 13.74 4.13 2.91 9.06
Government School in Rent Free Building 30.85 8.84 7.64 18.49
Mizoram
Private 10.85 68.69 60.34 6.80
Rented 2.05 17.25 29.31 1.15
Government 85.38 9.58 3.45 89.63
Government School in Rent Free Building 0.33 2.24 5.17 2.07
Nagaland
Private 10.81 77.24 95.18 2.11
Rented 0.88 1.92 1.20 0.00
Government 87.87 20.83 3.21 96.62
Government School in Rent Free Building 0.44 0.00 0.40 1.27
Orissa
Private 2.27 3.49 52.52 19.76
Rented 1.77 1.26 7.80 0.61
Government 92.28 94.23 35.93 72.37
Government School in Rent Free Building 0.94 0.64 2.76 4.20
Puducherry
Private 10.78 27.50 45.58 0.00
Rented 10.46 19.17 14.16 0.00 Government 74.84 52.50 34.96 0.00
Government School in Rent Free Building 1.96 0.00 2.21 0.00
Punjab
Private 2.93 81.69 86.34 0.94
Rented 0.71 11.20 5.21 0.21
Government 93.78 3.55 5.92 95.97
Government School in Rent Free Building 1.85 0.82 0.85 1.93

7/30/2019 Analytical Tables 2007-08
http://slidepdf.com/reader/full/analytical-tables-2007-08 51/180
2 4
Table 1.17 Percentage Distribution of Schools by Status of Building : 2007-08 All ArSchool Category
State/UT Building Status Primary with Primary with Upper Primary UPrimary Only Upper Primary Upper Primary Only
& Sec./Hr. Sec.
Rajasthan
Private 6.94 32.40 80.13 6.67
Rented 2.21 4.06 6.60 20.00
Government 79.96 59.31 11.73 56.33
Government School in Rent Free Building 6.27 3.72 1.28 8.33
Sikkim
Private 18.66 11.89 13.25 33.33
Rented 13.68 8.65 1.99 0.00
Government 66.29 77.84 84.11 66.67
Government School in Rent Free Building 0.50 0.00 0.00 0.00
Tamil Nadu
Private 25.47 23.61 47.99 56.43
Rented 5.11 2.23 4.19 2.50
Government 68.87 73.74 47.04 40.81
Government School in Rent Free Building 0.51 0.34 0.68 0.25
Tripura
Private 2.97 3.22 9.75 0.00
Rented 0.14 0.10 0.00 0.00 Government 96.47 96.49 89.78 0.00
Government School in Rent Free Building 0.42 0.10 0.46 0.00
Uttar Pradesh
Private 18.05 78.72 78.23 23.62
Rented 4.95 13.55 6.33 2.36
Government 75.49 6.05 11.90 72.19
Government School in Rent Free Building 0.68 0.60 1.90 0.85
Uttarakhand
Private 11.63 65.59 50.00 13.35
Rented 4.75 16.67 6.33 2.97
Government 80.74 12.37 36.39 78.34
Government School in Rent Free Building 1.11 1.88 2.85 1.39
West Bengal
Private 2.95 20.21 13.12 4.33 Rented 1.61 0.37 2.14 2.07
Government 79.87 2.43 21.82 60.43
Government School in Rent Free Building 3.26 0.94 11.91 20.14
All StatesPrivate 8.85 19.25 51.87 16.36 Rented 4.43 10.82 15.76 2.42
Government 77.75 67.07 26.39 70.85
Government School in Rent Free Building 2.23 1.68 2.30 2.97

7/30/2019 Analytical Tables 2007-08
http://slidepdf.com/reader/full/analytical-tables-2007-08 52/180
2 5 N
o t e : T o t a l m a y n o t a d d t o 1 0 0 b e c a u s e o f r o u n d i n g o f F i g u r e s
Table 1.18 Percentage Distribution of Schools by Type of Building : 2007-08 All A
School Category
State/UT Building Type Primary with Primary with Upper Primary UppPrimary Only Upper Primary Upper Primary Only wi
& Sec./Hr. Sec. S
A & N Islands
Pucca 50.25 49.25 56.06 100.00
Partially Pucca 22.11 5.97 4.55 0.00 Kuccha 14.07 1.49 1.52 0.00
Tent 3.02 4.48 0.00 0.00
Multiple Type 10.55 38.81 36.36 0.00
No Response 0.00 0.00 1.52 0.00
Andhra Pradesh
Pucca 49.31 44.52 51.32 0.00
Partially Pucca 2.34 3.58 2.63 0.00
Kuccha 2.67 0.44 0.00 0.00
Tent 0.43 0.00 0.00 0.00
Multiple Type 17.19 29.17 15.46 0.00
No Response 28.06 22.30 30.59 0.00
Arunachal Pradesh
Pucca 20.19 34.05 45.91 36.36
Partially Pucca 19.56 29.92 16.98 27.27
Kuccha 34.75 3.36 1.89 9.09
Tent 19.56 0.15 0.00 0.00
Multiple Type 5.90 32.52 35.22 27.27
No Response 0.03 0.00 0.00 0.00
Assam
Pucca 34.04 34.40 35.32 29.40
Partially Pucca 22.21 26.43 24.14 33.49
Kuccha 32.65 12.82 21.44 25.55
Tent 1.13 0.31 0.00 0.22
Multiple Type 8.24 25.33 17.66 10.61
No Response 1.73 0.70 1.44 0.73 Bihar
Pucca 57.59 60.16 57.65 60.40
Partially Pucca 2.70 3.22 6.19 4.95
Kuccha 0.63 0.73 2.28 1.49
Tent 0.31 0.05 0.00 0.00
Multiple Type 9.37 32.70 24.76 27.72
No Response 29.40 3.14 9.12 5.45
Note: Total may not add to hundred because of rounding of figures.

7/30/2019 Analytical Tables 2007-08
http://slidepdf.com/reader/full/analytical-tables-2007-08 53/180
2 6 Table 1.18 Percentage Distribution of Schools by Type of Building : 2007-08 All Ar
School Category
State/UT Building Type Primary with Primary with Upper Primary UppPrimary Only Upper Primary Upper Primary Only wit
& Sec./Hr. Sec. Se
Chandigarh
Pucca 96.43 100.00 96.40 100.00 10
Partially Pucca 0.00 0.00 0.00 0.00 Kuccha 0.00 0.00 0.00 0.00
Tent 0.00 0.00 0.00 0.00
Multiple Type 3.57 0.00 3.60 0.00
No Response 0.00 0.00 0.00 0.00
Chhattisgarh
Pucca 69.41 65.00 63.07 72.47 6
Partially Pucca 11.59 9.15 4.97 3.87
Kuccha 1.61 2.60 1.58 0.51
Tent 0.04 0.05 0.00 0.01
Multiple Type 10.26 12.95 6.92 4.58
No Response 7.09 10.26 23.46 18.56
D & N Haveli
Pucca 27.12 10.38 83.33 100.00 10Partially Pucca 47.46 33.02 0.00 0.00
Kuccha 0.00 0.94 0.00 0.00
Tent 0.00 0.00 0.00 0.00
Multiple Type 2.82 50.94 16.67 0.00
No Response 22.60 4.72 0.00 0.00
Daman & Diu
Pucca 98.04 100.00 100.00 100.00 10
Partially Pucca 0.00 0.00 0.00 0.00
Kuccha 0.00 0.00 0.00 0.00
Tent 0.00 0.00 0.00 0.00
Multiple Type 1.96 0.00 0.00 0.00
No Response 0.00 0.00 0.00 0.00
Delhi
Pucca 65.61 92.06 67.59 50.60 5
Partially Pucca 9.07 2.04 3.99 19.28
Kuccha 0.48 0.00 0.00 0.00
Tent 0.10 0.00 0.00 0.00
Multiple Type 22.62 4.99 27.81 22.89 3
No Response 2.12 0.91 0.60 7.23

7/30/2019 Analytical Tables 2007-08
http://slidepdf.com/reader/full/analytical-tables-2007-08 54/180
2 7
Table 1.18 Percentage Distribution of Schools by Type of Building : 2007-08 All A
School Category
State/UT Building Type Primary with Primary with Upper Primary UppPrimary Only Upper Primary Upper Primary Only wi
& Sec./Hr. Sec. S
Goa
Pucca 95.95 97.94 95.27 100.00
Partially Pucca 1.58 0.00 1.78 0.00 Kuccha 0.30 0.00 0.00 0.00
Tent 0.00 0.00 0.00 0.00
Multiple Type 0.89 1.03 2.37 0.00
No Response 1.28 1.03 0.59 0.00
Gujarat
Pucca 80.29 83.04 93.80 94.31
Partially Pucca 10.05 4.44 2.30 2.44
Kuccha 0.24 0.16 0.11 0.00
Tent 0.01 0.00 0.00 0.00
Multiple Type 7.43 12.04 3.21 2.44
No Response 1.97 0.32 0.57 0.81
Haryana
Pucca 98.07 97.91 98.72 99.13
Partially Pucca 0.14 0.00 0.20 0.07
Kuccha 0.01 0.00 0.00 0.00
Tent 0.00 0.00 0.00 0.00
Multiple Type 0.96 1.16 0.59 0.36
No Response 0.82 0.93 0.49 0.43
Himachal Pradesh
Pucca 65.19 87.91 89.79 83.62
Partially Pucca 9.16 4.33 1.43 6.99
Kuccha 3.02 1.99 0.83 2.16
Tent 0.00 0.00 0.00 0.00
Multiple Type 22.48 5.60 7.96 7.07
No Response 0.15 0.18 0.00 0.17 Jammu & Kashmir
Pucca 57.50 65.91 76.24 69.09
Partially Pucca 23.86 17.04 6.87 14.55
Kuccha 8.70 2.42 0.59 7.27
Tent 0.68 0.38 0.05 0.00
Multiple Type 4.34 13.08 15.27 5.45
No Response 4.92 1.17 0.98 3.64

7/30/2019 Analytical Tables 2007-08
http://slidepdf.com/reader/full/analytical-tables-2007-08 55/180
2 8 Table 1.18 Percentage Distribution of Schools by Type of Building : 2007-08 All Ar
School Category
State/UT Building Type Primary with Primary with Upper Primary UppPrimary Only Upper Primary Upper Primary Only wit
& Sec./Hr. Sec. Se
Jharkhand
Pucca 61.01 80.82 74.03 64.79 7
Partially Pucca 1.05 1.46 5.40 0.47 Kuccha 1.39 0.65 1.35 0.94
Tent 0.57 0.00 0.00 0.00
Multiple Type 2.22 15.36 14.33 6.10
No Response 33.75 1.71 4.89 27.70
Karnataka
Pucca 90.42 91.88 93.15 86.04 8
Partially Pucca 5.79 6.34 3.93 7.32
Kuccha 2.45 1.07 1.00 4.35
Tent 0.59 0.20 0.33 0.00
Multiple Type 0.03 0.01 0.00 0.23
No Response 0.72 0.49 1.59 2.06
Kerala
Pucca 76.89 62.85 67.33 68.46 7Partially Pucca 2.29 0.99 0.80 1.67
Kuccha 0.09 0.00 0.00 0.00
Tent 0.11 0.00 0.00 0.13
Multiple Type 20.01 35.79 31.27 28.97 2
No Response 0.62 0.37 0.60 0.77
Lakshadweep
Pucca 50.00 55.56 50.00 100.00
Partially Pucca 6.25 11.11 0.00 0.00 2
Kuccha 0.00 0.00 0.00 0.00
Tent 0.00 0.00 0.00 0.00
Multiple Type 43.75 33.33 50.00 0.00 5
No Response 0.00 0.00 0.00 0.00
Madhya Pradesh
Pucca 86.49 83.57 86.53 88.87 8
Partially Pucca 4.87 8.86 8.09 3.41
Kuccha 0.36 1.14 0.05 0.19
Tent 0.00 0.00 0.00 0.00
Multiple Type 6.51 4.46 3.78 3.91
No Response 1.77 1.97 1.54 3.62

7/30/2019 Analytical Tables 2007-08
http://slidepdf.com/reader/full/analytical-tables-2007-08 56/180
2 9
Table 1.18 Percentage Distribution of Schools by Type of Building : 2007-08 All A
School Category
State/UT Building Type Primary with Primary with Upper Primary UppPrimary Only Upper Primary Upper Primary Only wi
& Sec./Hr. Sec. S
Maharashtra
Pucca 84.71 82.05 85.08 84.30
Partially Pucca 5.22 3.11 6.15 6.40 Kuccha 0.60 0.41 0.97 2.33
Tent 0.03 0.02 0.05 0.00
Multiple Type 8.50 13.74 6.28 5.81
No Response 0.93 0.67 1.47 1.16
Manipur
Pucca 10.69 10.73 20.33 7.27
Partially Pucca 36.69 28.39 26.13 32.73
Kuccha 40.83 37.71 19.06 36.36
Tent 0.16 0.14 0.00 0.00
Multiple Type 8.98 20.62 32.67 20.00
No Response 2.65 2.40 1.81 3.64
Meghalaya
Pucca 29.05 32.42 53.09 32.42
Partially Pucca 46.11 45.58 26.55 43.31
Kuccha 13.87 7.27 2.91 11.56
Tent 0.65 0.20 0.00 0.67
Multiple Type 2.56 8.45 12.36 2.62
No Response 7.77 6.09 5.09 9.43
Mizoram
Pucca 4.10 21.73 39.66 7.26
Partially Pucca 74.60 57.19 27.59 75.46
Kuccha 11.38 12.14 10.34 9.56
Tent 0.20 0.00 0.00 0.00
Multiple Type 1.59 1.92 18.97 1.96
No Response 8.13 7.03 3.45 5.76 Nagaland
Pucca 16.66 29.81 49.80 30.80
Partially Pucca 57.89 42.63 21.69 53.59
Kuccha 20.55 15.06 4.02 9.70
Tent 0.00 0.00 0.00 0.00
Multiple Type 4.40 9.94 22.89 5.91
No Response 0.50 2.56 1.61 0.00

7/30/2019 Analytical Tables 2007-08
http://slidepdf.com/reader/full/analytical-tables-2007-08 57/180
3 0 Table 1.18 Percentage Distribution of Schools by Type of Building : 2007-08 All Ar
School Category
State/UT Building Type Primary with Primary with Upper Primary UppPrimary Only Upper Primary Upper Primary Only wit
& Sec./Hr. Sec. Se
Orissa
Pucca 36.16 24.72 57.40 36.89 3
Partially Pucca 16.79 6.48 8.29 24.96 Kuccha 1.33 0.27 0.98 5.62
Tent 0.05 0.00 0.00 0.05
Multiple Type 39.04 68.07 30.89 30.48 4
No Response 6.62 0.46 2.44 2.00
Puducherry
Pucca 72.22 69.17 72.77 0.00 8
Partially Pucca 5.56 10.83 1.34 0.00
Kuccha 0.00 0.00 0.00 0.00
Tent 0.33 0.00 0.00 0.00
Multiple Type 18.63 20.00 25.45 0.00
No Response 3.27 0.00 0.45 0.00
Punjab
Pucca 96.44 95.50 98.03 96.06 9Partially Pucca 0.46 1.37 0.28 0.51
Kuccha 0.08 0.27 0.00 0.00
Tent 0.01 0.00 0.00 0.04
Multiple Type 1.10 0.55 0.28 1.20
No Response 1.92 1.91 1.41 2.19
Rajasthan
Pucca 91.54 93.81 94.47 85.67 9
Partially Pucca 0.77 1.35 0.82 1.00
Kuccha 0.43 0.23 0.09 0.00
Tent 0.10 0.00 0.00 0.00
Multiple Type 1.08 3.29 3.64 1.00
No Response 6.07 1.32 0.98 12.33
Sikkim
Pucca 38.95 17.84 25.83 100.00 2
Partially Pucca 24.47 9.73 0.66 0.00 2
Kuccha 9.24 1.62 0.00 0.00 2
Tent 0.00 0.00 0.00 0.00
Multiple Type 21.47 67.03 72.85 0.00 4
No Response 5.87 3.78 0.66 0.00

7/30/2019 Analytical Tables 2007-08
http://slidepdf.com/reader/full/analytical-tables-2007-08 58/180
3 1
Table 1.18 Percentage Distribution of Schools by Type of Building : 2007-08 All A
School Category
State/UT Building Type Primary with Primary with Upper Primary UppPrimary Only Upper Primary Upper Primary Only wi
& Sec./Hr. Sec. S
Tamil NaduPucca 56.20 42.52 73.33 73.50
Partially Pucca 18.37 5.24 3.29 1.78 Kuccha 0.00 0.00 0.00 0.00 Tent 0.00 0.00 0.00 0.00
Multiple Type 25.34 52.20 23.33 24.68 No Response 0.09 0.03 0.04 0.04
TripuraPucca 51.66 46.97 42.48 0.00
Partially Pucca 13.99 10.37 12.87 0.00 Kuccha 8.90 1.66 0.47 0.00
Tent 0.05 0.10 0.00 0.00 Multiple Type 25.31 40.90 44.03 0.00 No Response 0.09 0.00 0.16 100.00
Uttar PradeshPucca 95.45 92.22 92.14 95.27
Partially Pucca 0.99 1.16 1.01 0.69 Kuccha 0.14 0.15 0.00 0.04
Tent 0.02 0.00 0.00 0.00 Multiple Type 1.69 4.96 4.44 2.29 No Response 1.71 1.50 2.41 1.70
UttarakhandPucca 93.35 93.80 90.51 94.50
Partially Pucca 2.32 1.62 1.27 1.31 Kuccha 0.27 0.13 0.00 0.09
Tent 0.06 0.13 0.00 0.12 Multiple Type 2.18 2.29 5.38 1.31 No Response 1.82 2.02 2.85 2.67
West BengalPucca 56.98 6.08 28.69 52.10
Partially Pucca 8.07 0.47 0.80 3.81 Kuccha 1.17 0.84 0.27 0.90
Tent 0.02 0.09 0.00 0.00
Multiple Type 18.17 1.22 8.71 25.66 No Response 15.59 91.30 61.53 17.52
All States
Pucca 71.73 74.17 78.23 79.93
Partially Pucca 7.50 4.88 4.66 6.92
Kuccha 3.51 0.83 1.11 2.89
Tent 0.29 0.05 0.02 0.04
Multiple Type 9.29 17.30 11.90 6.15
No Response 7.68 2.77 4.09 4.08

7/30/2019 Analytical Tables 2007-08
http://slidepdf.com/reader/full/analytical-tables-2007-08 59/180
3 2 Table 1.19 Average Number of Classrooms by School Category : 2007-08 All Areas : All G
School Category
State/UT Primary with Primary with Upper Primary Upper PriPrimary Only Upper Primary Upper Primary Only with Sec.
& Sec./Hr. Sec. Seconda
A & N Islands 4.0 9.3 17.0 0.0 10.5
Andhra Pradesh 1.9 4.4 13.7 0.0 6.4
Arunachal Pradesh 2.0 7.0 11.2 2.6 11.7 Assam 1.6 5.1 9.6 3.2 7.3
Bihar 1.9 4.9 5.0 4.4 5.7
Chandigarh 10.1 19.9 27.9 21.0 25.5
Chhattisgarh 2.6 2.8 3.2 2.6 5.8
D & N Haveli 1.7 6.9 0.0 3.0 15.0
Daman & Diu 4.5 9.3 19.0 4.8 7.8
Delhi 13.3 13.6 33.3 12.3 24.2
Goa 2.2 5.1 7.1 7.6 8.1
Gujarat 2.9 6.4 7.1 6.2 5.3
Haryana 4.2 4.7 6.8 3.6 6.2
Himachal Pradesh 2.9 8.7 17.7 2.5 5.5
Jammu & Kashmir 2.2 4.4 8.5 4.9 7.9
Jharkhand 1.4 4.8 10.4 3.6 7.3Karnataka 2.3 6.2 9.5 6.0 8.0
Kerala 5.8 12.9 20.7 16.5 23.8
Lakshadweep 9.3 12.3 16.5 12.0 18.1
Madhya Pradesh 2.9 11.0 21.1 3.3 14.7
Maharashtra 2.7 6.5 10.9 5.9 6.7
Manipur 3.4 7.4 11.5 4.6 7.9
Meghalaya 2.3 4.8 7.8 2.9 7.9
Mizoram 4.1 7.3 11.2 3.1 2.1
Nagaland 5.3 7.1 10.4 5.0 7.8
Orissa 2.6 5.2 9.9 2.4 8.2
Puducherry 5.1 10.0 14.4 0.0 18.5
Punjab 3.5 8.0 19.0 3.3 7.6
Rajasthan 2.6 5.9 7.2 3.2 5.7Sikkim 4.3 9.5 15.8 13.0 10.6
Tamil Nadu 3.4 7.1 5.8 11.7 3.4
Tripura 4.0 6.7 9.5 0.0 11.2
Uttar Pradesh 3.8 6.0 7.9 3.9 10.4
Uttarakhand 2.5 5.3 9.8 3.4 7.5
West Bengal 3.2 9.1 13.8 6.2 12.0
All States 2.8 5.8 9.7 3.7 7.9

7/30/2019 Analytical Tables 2007-08
http://slidepdf.com/reader/full/analytical-tables-2007-08 60/180
3 3
Table 1.20 Average Number of Classrooms by School Category : 2007-08 All Areas
School Category
State/UT Primary with Primary with Upper Primary Upper PrPrimary Only Upper Primary Upper Primary Only with Sec
& Sec./Hr. Sec. Second
A & N Islands 6.5 13.8 29.3 12.0 23.3
Andhra Pradesh 8.2 9.6 30.7 0.0 10.5
Arunachal Pradesh 5.9 10.2 12.7 11.0 8.5
Assam 1.5 6.0 8.4 2.8 3.9
Bihar 2.7 5.1 5.4 5.2 6.1
Chandigarh 20.3 17.9 39.1 0.0 45.9
Chhattisgarh 3.7 5.8 9.2 4.3 6.7
D & N Haveli 3.7 9.3 23.7 0.0 0.0
Daman & Diu 8.7 5.0 12.0 0.0 0.0
Delhi 10.8 14.9 32.8 11.5 20.8
Goa 6.0 11.3 12.2 7.6 9.3
Gujarat 5.6 8.8 10.9 4.7 6.9
Haryana 6.0 8.4 10.7 9.8 11.2
Himachal Pradesh 4.6 7.8 13.7 4.0 10.7
Jammu & Kashmir 5.7 9.8 16.5 2.0 12.0
Jharkhand 3.3 6.9 13.0 9.9 7.7
Karnataka 5.3 9.2 13.6 6.0 11.7
Kerala 6.6 15.7 24.0 10.0 24.0
Lakshadweep - - - -
Madhya Pradesh 4.4 6.8 11.4 5.9 12.3
Maharashtra 7.1 9.1 10.8 7.4 9.2
Manipur 3.5 9.2 13.7 4.4 7.2
Meghalaya 2.4 5.2 9.6 2.9 5.3
Mizoram 4.8 8.4 10.5 3.4 5.3
Nagaland 6.0 9.6 15.7 12.8 17.2
Orissa 3.8 7.1 14.5 2.0 5.7
Puducherry 7.1 12.6 22.2 0.0 10.0
Punjab 6.3 10.9 17.6 8.7 14.7
Rajasthan 4.3 7.3 10.7 6.3 8.9
Sikkim 5.0 8.7 22.6 5.0 0.0
Tamil Nadu 6.4 11.3 11.3 17.8 0.0
Tripura 6.1 9.3 16.7 0.0 14.8
Uttar Pradesh 4.9 7.7 11.0 5.7 11.7
Uttarakhand 4.9 7.7 13.5 4.4 10.9
West Bengal 0.2 0.4 1.6 2.6 10.4
All States 4.8 8.2 12.4 6.2 10.0

7/30/2019 Analytical Tables 2007-08
http://slidepdf.com/reader/full/analytical-tables-2007-08 61/180
3 4 Table 1.21 Percentage Distribution of Schools by Number of Classrooms : 2007-08 All Ar
School Category
State/UT Number of Primary with Primary with Upper Primary UppeClassrooms Primary Only Upper Primary Upper Primary Only with
& Sec./Hr. Sec. Se
A & N Islands
1 4.02 1.45 0.00 0.00
2 21.61 4.35 0.00 0.00
3 19.60 0.00 1.52 0.00
4 - 6 40.70 14.49 3.03 0.00
7 - 10 11.56 52.17 24.24 0.00 1
11 - 15 2.01 14.49 18.18 100.00 1
> 15 0.50 13.04 51.52 0.00 3
Andhra Pradesh
1 36.61 1.83 0.41 0.00
2 26.96 8.32 1.64 0.00
3 10.76 13.54 1.64 0.00
4 - 6 13.21 36.85 4.70 0.00 4
7 - 10 4.26 28.69 22.09 0.00 2
11 - 15 1.89 8.00 23.52 0.00 1
> 15 1.15 2.30 44.58 0.00
Arunachal Pradesh
1 36.61 0.46 0.00 0.00
2 19.72 1.98 0.00 36.36
3 9.95 5.49 1.26 27.27
4 - 6 16.89 26.52 6.29 18.18
7 - 10 2.26 57.16 40.25 0.00 2
11 - 15 0.19 6.40 39.62 9.09 3
> 15 0.08 1.98 12.58 0.00 2
Assam
1 70.35 9.61 10.07 16.87
2 16.05 11.17 6.83 5.97
3 5.54 12.73 8.45 56.75 2
4 - 6 7.57 26.09 14.75 18.84 3
7 - 10 0.38 36.41 24.28 1.37 1
11 - 15 0.07 3.44 27.16 0.15
> 15 0.01 0.55 8.45 0.02
Note: Balance of schools have not reported number of classrooms or they do not have any classroom.

7/30/2019 Analytical Tables 2007-08
http://slidepdf.com/reader/full/analytical-tables-2007-08 62/180
3 5
Table 1.21 Percentage Distribution of Schools by Number of Classrooms : 2007-08 All A
School Category
State/UT Number of Primary with Primary with Upper Primary UpClassrooms Primary Only Upper Primary Upper Primary Only w
& Sec./Hr. Sec. S
Bihar
1 7.09 2.39 2.43 0.99 2 34.06 13.89 11.33 16.26
3 12.21 11.29 11.33 19.21
4 - 6 14.78 45.09 37.54 41.38
7 - 10 1.31 21.37 18.93 13.79
11 - 15 0.07 2.67 5.83 2.96
> 15 0.00 0.32 2.10 0.49
Chandigarh
1 0.00 0.00 0.00 0.00
2 0.00 0.00 0.00 0.00
3 7.14 0.00 0.00 0.00
4 - 6 17.86 0.00 0.00 0.00
7 - 10 21.43 4.55 2.70 0.00 11 - 15 14.29 36.36 12.61 0.00
> 15 35.71 59.09 84.68 100.00
Chhattisgarh
1 6.06 5.00 2.27 1.32
2 34.99 12.15 8.91 5.63
3 28.30 14.79 9.46 59.32
4 - 6 18.40 27.23 21.38 11.90
7 - 10 1.87 19.79 15.35 1.94
11 - 15 0.23 2.50 10.62 0.24
> 15 0.07 0.77 7.28 0.15
D & N Haveli
1 6.78 0.94 0.00 0.00
2 53.67 4.72 0.00 0.00
3 7.34 9.43 0.00 100.00
4 - 6 9.04 37.74 0.00 0.00
7 - 10 0.00 27.36 16.67 0.00
11 - 15 0.00 11.32 50.00 0.00
> 15 0.56 4.72 33.33 0.00

7/30/2019 Analytical Tables 2007-08
http://slidepdf.com/reader/full/analytical-tables-2007-08 63/180
3 6 Table 1.21 Percentage Distribution of Schools by Number of Classrooms : 2007-08 All Ar
School Category
State/UT Number of Primary with Primary with Upper Primary UppClassrooms Primary Only Upper Primary Upper Primary Only wit
& Sec./Hr. Sec. S
Daman & Diu
1 1.96 0.00 0.00 0.00
2 9.80 0.00 0.00 0.00
3 11.76 10.00 0.00 50.00
4 - 6 54.90 40.00 36.36 28.57
7 - 10 17.65 30.00 18.18 21.43
11 - 15 3.92 10.00 9.09 0.00
> 15 0.00 10.00 36.36 0.00
Delhi
1 0.04 0.00 0.10 0.00
2 1.34 0.17 0.40 1.12
3 1.55 0.69 0.30 4.49
4 - 6 22.29 2.75 0.89 20.22
7 - 10 23.27 39.35 3.66 28.09
11 - 15 22.78 29.55 8.12 23.60
> 15 28.28 27.49 86.14 20.22
Goa
1 23.49 2.06 1.78 0.00
2 49.36 12.37 1.78 0.00
3 10.76 15.46 1.18 12.50
4 - 6 11.15 36.08 19.53 41.67
7 - 10 2.57 20.62 30.18 29.17
11 - 15 1.38 7.22 20.71 8.33
> 15 0.30 5.15 24.26 8.33
Gujarat
1 6.48 0.94 0.46 1.63
2 44.79 7.62 4.93 8.13
3 21.37 11.62 10.21 39.57
4 - 6 14.40 28.93 13.42 25.20
7 - 10 7.30 38.00 36.12 14.09
11 - 15 1.79 9.42 18.00 7.86
> 15 0.67 3.07 16.17 2.17

7/30/2019 Analytical Tables 2007-08
http://slidepdf.com/reader/full/analytical-tables-2007-08 64/180
3 7
Table 1.21 Percentage Distribution of Schools by Number of Classrooms : 2007-08 All A
School Category
State/UT Number of Primary with Primary with Upper Primary UpClassrooms Primary Only Upper Primary Upper Primary Only w
& Sec./Hr. Sec. S
Haryana
1 2.93 2.15 0.89 3.97
2 15.44 5.06 2.52 10.61
3 17.99 21.27 7.65 51.62
4 - 6 51.03 24.40 17.81 21.81
7 - 10 9.46 34.86 43.96 8.09
11 - 15 1.15 6.91 15.39 1.30
> 15 0.21 2.56 10.36 1.16
Himachal Pradesh
1 5.52 0.36 0.12 17.17
2 33.32 0.90 0.83 25.74
3 32.45 2.17 1.19 47.69
4 - 6 26.79 31.05 4.51 8.98
7 - 10 1.77 54.87 25.77 0.37
11 - 15 0.12 8.84 42.64 0.00
> 15 0.02 1.81 24.94 0.04
Jammu & Kashmir
1 14.69 2.32 0.10 0.00
2 39.41 12.66 0.73 9.09
3 25.32 14.75 1.86 30.91
4 - 6 12.43 31.91 14.21 36.36
7 - 10 3.31 26.26 27.83 16.36
11 - 15 0.29 9.84 31.70 1.82
> 15 0.04 1.55 23.08 1.82
Jharkhand
1 3.32 1.24 0.67 0.47
2 42.34 22.11 3.54 6.57 3 4.93 8.00 2.69 19.25
4 - 6 7.74 41.66 20.20 23.47
7 - 10 0.59 21.07 29.46 9.39
11 - 15 0.08 3.25 18.69 2.35
> 15 0.04 0.93 18.52 4.69
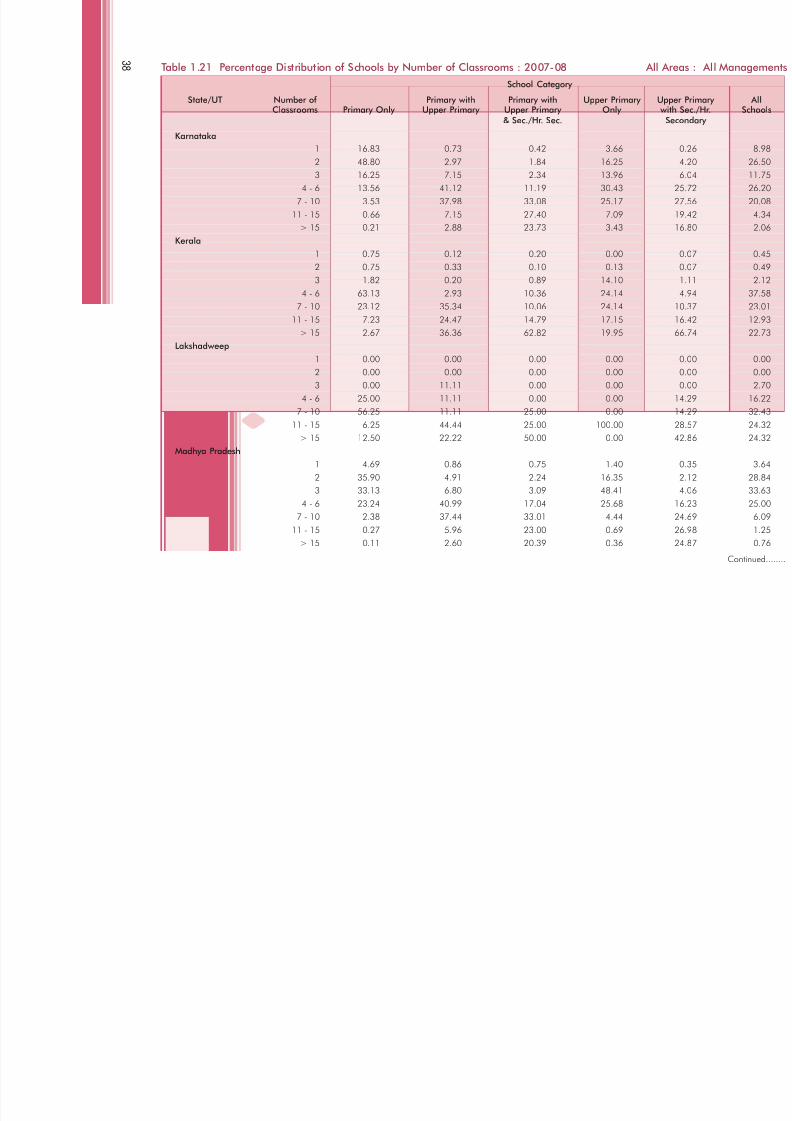
7/30/2019 Analytical Tables 2007-08
http://slidepdf.com/reader/full/analytical-tables-2007-08 65/180
3 8 Table 1.21 Percentage Distribution of Schools by Number of Classrooms : 2007-08 All Ar
School Category
State/UT Number of Primary with Primary with Upper Primary UppClassrooms Primary Only Upper Primary Upper Primary Only wit
& Sec./Hr. Sec. S
Karnataka
1 16.83 0.73 0.42 3.66
2 48.80 2.97 1.84 16.25
3 16.25 7.15 2.34 13.96
4 - 6 13.56 41.12 11.19 30.43
7 - 10 3.53 37.98 33.08 25.17
11 - 15 0.66 7.15 27.40 7.09
> 15 0.21 2.88 23.73 3.43
Kerala
1 0.75 0.12 0.20 0.00
2 0.75 0.33 0.10 0.13
3 1.82 0.20 0.89 14.10
4 - 6 63.13 2.93 10.36 24.14
7 - 10 23.12 35.34 10.06 24.14
11 - 15 7.23 24.47 14.79 17.15
> 15 2.67 36.36 62.82 19.95
Lakshadweep
1 0.00 0.00 0.00 0.00
2 0.00 0.00 0.00 0.00
3 0.00 11.11 0.00 0.00
4 - 6 25.00 11.11 0.00 0.00
7 - 10 56.25 11.11 25.00 0.00
11 - 15 6.25 44.44 25.00 100.00
> 15 12.50 22.22 50.00 0.00
Madhya Pradesh
1 4.69 0.86 0.75 1.40
2 35.90 4.91 2.24 16.35
3 33.13 6.80 3.09 48.41
4 - 6 23.24 40.99 17.04 25.68
7 - 10 2.38 37.44 33.01 4.44
11 - 15 0.27 5.96 23.00 0.69
> 15 0.11 2.60 20.39 0.36

7/30/2019 Analytical Tables 2007-08
http://slidepdf.com/reader/full/analytical-tables-2007-08 66/180
3 9
Table 1.21 Percentage Distribution of Schools by Number of Classrooms : 2007-08 All A
School Category
State/UT Number of Primary with Primary with Upper Primary UpClassrooms Primary Only Upper Primary Upper Primary Only w
& Sec./Hr. Sec. S
Maharashtra
1 10.97 0.50 0.56 1.74 2 49.44 2.72 1.09 2.91
3 10.75 7.36 12.21 23.84
4 - 6 18.90 33.96 17.50 33.14
7 - 10 6.29 45.15 32.58 21.51
11 - 15 1.73 7.82 17.50 6.98
> 15 0.98 2.11 17.47 8.72
Manipur
1 2.50 0.28 0.18 0.00
2 30.62 0.56 0.18 1.82
3 23.87 2.12 0.54 56.36
4 - 6 35.53 24.86 3.99 25.45
7 - 10 4.45 48.16 27.54 7.27 11 - 15 0.16 20.34 46.92 1.82
> 15 0.00 1.55 18.84 3.64
Meghalaya
1 26.90 4.52 3.27 5.96
2 27.47 10.22 2.18 8.94
3 18.42 16.90 17.09 58.21
4 - 6 18.30 31.63 13.09 15.75
7 - 10 1.30 26.33 22.91 2.13
11 - 15 0.25 3.73 25.82 0.18
> 15 0.05 0.59 11.64 0.00
Mizoram
1 1.59 0.00 0.00 1.15 2 1.52 0.96 1.72 1.27
3 6.75 1.60 0.00 83.41
4 - 6 87.70 15.65 3.45 13.25
7 - 10 1.32 72.20 44.83 0.69
11 - 15 0.20 6.39 39.66 0.00
> 15 0.07 1.60 8.62 0.00

7/30/2019 Analytical Tables 2007-08
http://slidepdf.com/reader/full/analytical-tables-2007-08 67/180
4 0 Table 1.21 Percentage Distribution of Schools by Number of Classrooms : 2007-08 All Ar
School Category
State/UT Number of Primary with Primary with Upper Primary UppClassrooms Primary Only Upper Primary Upper Primary Only wit
& Sec./Hr. Sec. S
Nagaland
1 0.06 0.32 0.40 1.27
2 0.50 0.00 0.00 0.00
3 3.02 0.64 0.00 1.69
4 - 6 88.75 14.74 3.21 83.97
7 - 10 6.66 58.01 8.43 9.70
11 - 15 0.44 22.12 57.43 3.38
> 15 0.06 1.60 28.92 0.00
Orissa
1 8.52 0.67 0.65 2.98
2 41.07 6.46 6.34 76.28
3 18.53 9.64 1.63 7.79
4 - 6 23.71 56.30 9.92 10.55
7 - 10 1.35 25.16 30.57 0.42
11 - 15 0.04 1.21 23.25 0.00
> 15 0.02 0.16 25.04 0.00
Puducherry
1 3.92 0.00 0.44 0.00
2 13.07 2.50 0.88 0.00
3 9.15 0.83 0.88 0.00
4 - 6 43.79 6.67 5.75 0.00
7 - 10 21.24 49.17 13.27 0.00
11 - 15 4.58 30.00 32.74 0.00
> 15 2.29 10.83 45.13 0.00
Punjab
1 3.69 0.82 0.14 3.04
2 28.47 2.46 0.42 12.85
3 21.65 3.28 0.70 53.19
4 - 6 39.58 10.38 5.21 26.55
7 - 10 4.30 43.17 19.58 2.14
11 - 15 0.63 25.68 24.37 0.39
> 15 0.18 12.84 47.89 0.17

7/30/2019 Analytical Tables 2007-08
http://slidepdf.com/reader/full/analytical-tables-2007-08 68/180
4 1
Table 1.21 Percentage Distribution of Schools by Number of Classrooms : 2007-08 All A
School Category
State/UT Number of Primary with Primary with Upper Primary UpClassrooms Primary Only Upper Primary Upper Primary Only w
& Sec./Hr. Sec. S
Rajasthan
1 6.30 0.50 0.19 1.67
2 47.95 4.18 0.54 13.00
3 18.69 6.01 3.05 45.67
4 - 6 19.75 41.32 9.86 16.33
7 - 10 1.51 44.12 54.46 9.33
11 - 15 0.13 2.66 22.96 1.33
> 15 0.04 0.47 8.52 0.67
Sikkim
1 2.74 0.00 0.00 0.00
2 10.70 0.00 0.66 0.00
3 13.43 0.00 0.66 0.00
4 - 6 50.25 6.49 1.99 33.33
7 - 10 15.55 60.54 11.92 33.33 11 - 15 1.24 25.95 43.05 0.00
> 15 0.12 3.24 41.06 33.33
Tamil Nadu
1 0.00 0.00 0.00 0.00
2 39.90 2.47 1.61 0.23
3 9.21 2.76 15.58 7.34
4 - 6 35.62 27.74 27.86 14.02
7 - 10 11.00 51.47 30.68 25.50
11 - 15 2.87 9.83 13.62 16.77
> 15 1.40 5.73 10.64 36.15
Tripura
1 1.21 0.00 0.00 0.00 2 16.11 3.41 0.00 0.00
3 19.59 4.78 0.00 0.00
4 - 6 59.61 33.56 28.95 0.00
7 - 10 3.11 54.93 37.31 0.00
11 - 15 0.37 2.83 19.35 0.00
> 15 0.00 0.49 14.40 0.00

7/30/2019 Analytical Tables 2007-08
http://slidepdf.com/reader/full/analytical-tables-2007-08 69/180
4 2 Table 1.21 Percentage Distribution of Schools by Number of Classrooms : 2007-08 All Ar
School Category
State/UT Number of Primary with Primary with Upper Primary UppClassrooms Primary Only Upper Primary Upper Primary Only wit
& Sec./Hr. Sec. S
Uttar Pradesh
1 0.66 0.34 0.38 0.32
2 16.19 2.18 2.03 2.59
3 25.92 8.29 8.48 37.38
4 - 6 48.05 30.09 24.30 47.38
7 - 10 6.70 41.03 24.05 7.77
11 - 15 0.67 11.96 15.57 1.85
> 15 0.15 3.28 18.99 0.91
Uttarakhand
1 3.08 0.54 0.63 1.01
2 51.07 4.70 2.22 4.48
3 24.32 14.25 11.39 56.51
4 - 6 16.17 27.96 14.56 31.83
7 - 10 2.97 34.27 20.25 2.43 11 - 15 0.50 12.90 21.20 0.62
> 15 0.21 3.23 26.27 0.27
West Bengal
1 7.49 0.28 0.00 0.06
2 20.77 0.09 0.00 1.16
3 20.23 0.00 0.00 0.97
4 - 6 34.84 2.99 4.28 55.33
7 - 10 1.38 3.18 12.18 21.63
11 - 15 0.21 1.12 10.71 3.23
> 15 0.06 0.75 11.78 1.36
All States
1 12.38 1.04 0.64 2.76
2 31.45 6.59 2.07 9.82
3 18.87 8.68 6.37 42.45
4 - 6 25.58 37.13 15.45 30.76
7 - 10 3.85 36.22 31.98 6.27
11 - 15 0.78 6.52 20.43 1.89
> 15 0.39 2.40 19.30 2.20

7/30/2019 Analytical Tables 2007-08
http://slidepdf.com/reader/full/analytical-tables-2007-08 70/180
4 3
Table 1.22 Percentage Distribution of Classrooms by Condition of Classrooms : 2007-08 All A
School Category
State/UT Condition Primary with Primary with Upper Primary Upof Primary Only Upper Primary Upper Primary Only w
Classrooms & Sec./Hr. Sec. S
A & N Islands
Good Condition 53.39 64.14 70.16 100.00
Need Minor Repair 30.61 26.86 20.50 0.00 Need Major Repair 16.00 9.00 9.34 0.00
Andhra Pradesh
Good Condition 75.80 80.92 95.89 0.00
Need Minor Repair 17.13 13.60 3.36 0.00
Need Major Repair 7.08 5.48 0.75 0.00
Arunachal Pradesh
Good Condition 48.73 52.63 54.17 80.36
Need Minor Repair 31.55 28.60 29.26 12.50
Need Major Repair 19.73 18.77 16.57 7.14
Assam
Good Condition 30.78 31.31 43.75 23.18
Need Minor Repair 32.16 34.16 29.94 32.05
Need Major Repair 37.06 34.54 26.31 44.77 Bihar
Good Condition 51.92 53.89 55.34 58.93
Need Minor Repair 31.57 27.36 26.71 23.55
Need Major Repair 16.51 18.75 17.95 17.52
Chandigarh
Good Condition 82.92 98.79 92.56 100.00
Need Minor Repair 14.60 1.21 6.93 0.00
Need Major Repair 2.48 0.00 0.51 0.00
Chhattisgarh
Good Condition 66.63 77.38 88.13 82.65
Need Minor Repair 21.01 17.39 9.11 11.86
Need Major Repair 12.36 5.23 2.76 5.49
D & N HaveliGood Condition 71.52 75.64 100.00 100.00
Need Minor Repair 21.67 23.14 0.00 0.00
Need Major Repair 6.81 1.22 0.00 0.00
Daman & Diu
Good Condition 76.21 95.24 100.00 77.61
Need Minor Repair 22.18 4.76 0.00 22.39
Need Major Repair 1.61 0.00 0.00 0.00

7/30/2019 Analytical Tables 2007-08
http://slidepdf.com/reader/full/analytical-tables-2007-08 71/180
4 4 Table 1.22 Percentage Distribution of Classrooms by Condition of Classrooms : 2007-08 All Ar
School Category
State/UT Condition Primary with Primary with Upper Primary Uppof Primary Only Upper Primary Upper Primary Only wit
Classrooms & Sec./Hr. Sec. S
Delhi
Good Condition 82.62 96.31 88.17 75.83
Need Minor Repair 12.17 3.18 8.07 20.09 Need Major Repair 5.21 0.51 3.76 4.07
Goa
Good Condition 69.87 75.25 85.51 75.82
Need Minor Repair 26.62 21.93 14.29 24.18
Need Major Repair 3.51 2.82 0.20 0.00
Gujarat
Good Condition 82.27 84.26 97.23 91.83
Need Minor Repair 14.24 11.68 2.35 6.56
Need Major Repair 3.50 4.07 0.42 1.60
Haryana
Good Condition 84.36 92.93 94.78 87.93
Need Minor Repair 10.93 5.67 4.10 8.86
Need Major Repair 4.72 1.41 1.11 3.22 Himachal Pradesh
Good Condition 60.26 90.10 93.06 67.01
Need Minor Repair 27.42 9.02 6.17 26.67
Need Major Repair 12.32 0.88 0.77 6.32
Jammu & Kashmir
Good Condition 53.39 62.06 80.91 45.83
Need Minor Repair 32.19 26.20 13.27 34.47
Need Major Repair 14.43 11.75 5.81 19.70
Jharkhand
Good Condition 66.70 63.30 76.61 83.14
Need Minor Repair 22.89 23.89 17.74 10.10
Need Major Repair 10.41 12.81 5.65 6.77
Karnataka
Good Condition 78.96 77.14 96.50 86.81
Need Minor Repair 16.65 16.89 2.57 10.23
Need Major Repair 4.38 5.97 0.93 2.95
Kerala
Good Condition 62.88 65.38 71.85 67.99
Need Minor Repair 32.17 29.45 22.97 28.13
Need Major Repair 4.96 5.17 5.18 3.88
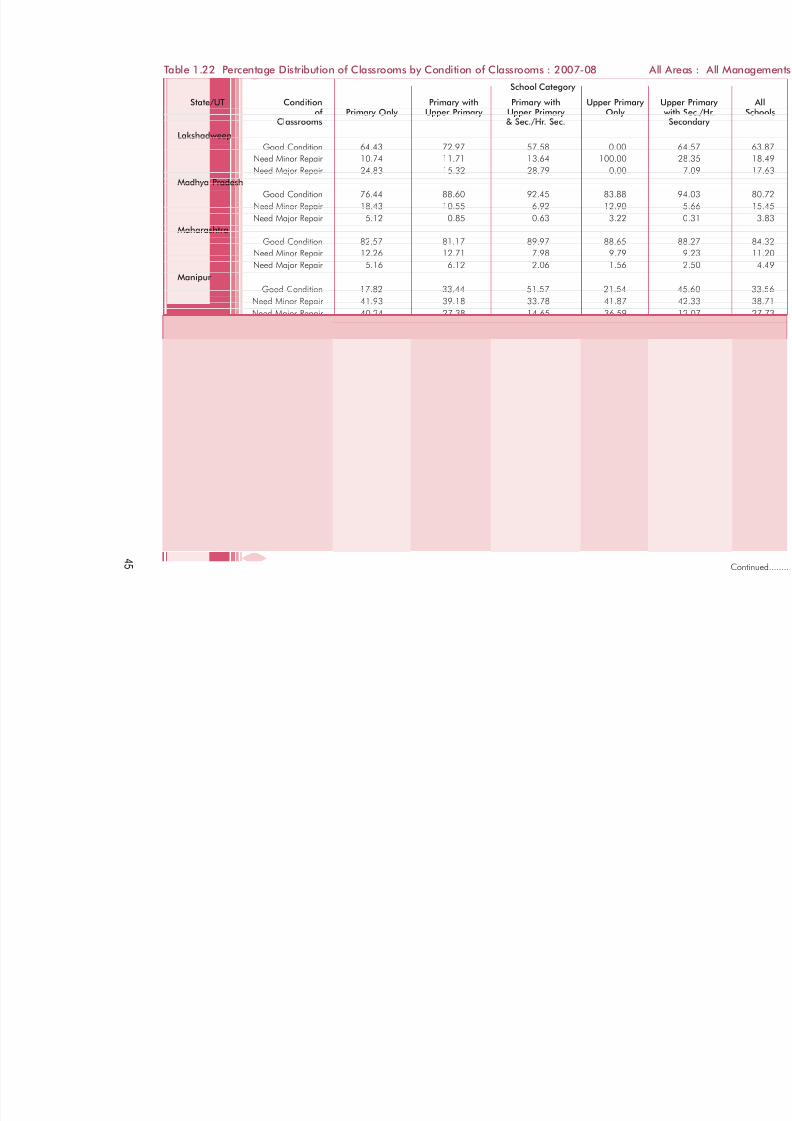
7/30/2019 Analytical Tables 2007-08
http://slidepdf.com/reader/full/analytical-tables-2007-08 72/180
4 5
Table 1.22 Percentage Distribution of Classrooms by Condition of Classrooms : 2007-08 All A
School Category
State/UT Condition Primary with Primary with Upper Primary Upof Primary Only Upper Primary Upper Primary Only w
Classrooms & Sec./Hr. Sec. S
Lakshadweep
Good Condition 64.43 72.97 57.58 0.00
Need Minor Repair 10.74 11.71 13.64 100.00 Need Major Repair 24.83 15.32 28.79 0.00
Madhya Pradesh
Good Condition 76.44 88.60 92.45 83.88
Need Minor Repair 18.43 10.55 6.92 12.90
Need Major Repair 5.12 0.85 0.63 3.22
Maharashtra
Good Condition 82.57 81.17 89.97 88.65
Need Minor Repair 12.26 12.71 7.98 9.79
Need Major Repair 5.16 6.12 2.06 1.56
Manipur
Good Condition 17.82 33.44 51.57 21.54
Need Minor Repair 41.93 39.18 33.78 41.87
Need Major Repair 40.24 27.38 14.65 36.59 Meghalaya
Good Condition 30.94 39.12 59.83 28.84
Need Minor Repair 43.07 39.54 29.52 42.21
Need Major Repair 25.99 21.33 10.66 28.95
Mizoram
Good Condition 38.96 52.58 66.67 40.31
Need Minor Repair 35.90 29.49 23.41 38.08
Need Major Repair 25.13 17.93 9.92 21.62
Nagaland
Good Condition 34.55 46.26 70.53 35.18
Need Minor Repair 42.69 38.31 23.62 44.62
Need Major Repair 22.76 15.43 5.85 20.20
OrissaGood Condition 45.27 47.89 79.19 36.41
Need Minor Repair 29.83 27.23 14.61 30.21
Need Major Repair 24.89 24.88 6.20 33.38
Puducherry
Good Condition 86.60 89.90 93.25 0.00
Need Minor Repair 9.17 8.10 6.50 0.00
Need Major Repair 4.23 2.10 0.25 0.00

7/30/2019 Analytical Tables 2007-08
http://slidepdf.com/reader/full/analytical-tables-2007-08 73/180
4 6 Table 1.22 Percentage Distribution of Classrooms by Condition of Classrooms : 2007-08 All Ar
School Category
State/UT Condition Primary with Primary with Upper Primary Uppof Primary Only Upper Primary Upper Primary Only wit
Classrooms & Sec./Hr. Sec. S
Punjab
Good Condition 73.27 95.41 97.68 76.37
Need Minor Repair 21.06 4.43 2.03 17.58 Need Major Repair 5.67 0.16 0.29 6.04
Rajasthan
Good Condition 69.75 80.74 93.78 82.95
Need Minor Repair 20.45 13.35 4.76 11.72
Need Major Repair 9.80 5.91 1.46 5.33
Sikkim
Good Condition 49.32 45.88 56.66 100.00
Need Minor Repair 36.83 31.22 31.22 0.00
Need Major Repair 13.85 21.88 12.12 0.00
Tamil Nadu
Good Condition 78.63 78.95 92.04 91.97
Need Minor Repair 16.12 15.18 6.09 5.63
Need Major Repair 5.25 5.87 1.87 2.40 Tripura
Good Condition 66.72 68.97 63.05 0.00
Need Minor Repair 20.58 20.91 22.63 0.00
Need Major Repair 12.71 10.12 14.31 0.00
Uttar Pradesh
Good Condition 80.62 87.80 91.24 83.38
Need Minor Repair 15.66 10.95 7.40 13.81
Need Major Repair 3.71 1.25 1.36 2.81
Uttarakhand
Good Condition 67.59 91.31 87.59 72.15
Need Minor Repair 21.04 7.02 10.13 18.67
Need Major Repair 11.36 1.66 2.28 9.18
West BengalGood Condition 54.54 58.20 60.27 55.03
Need Minor Repair 22.16 21.86 23.44 20.60
Need Major Repair 23.29 19.95 16.29 24.37
All States
Good Condition 70.16 75.91 86.82 77.80
Need Minor Repair 20.00 16.42 9.69 14.93
Need Major Repair 9.84 7.67 3.48 7.27

7/30/2019 Analytical Tables 2007-08
http://slidepdf.com/reader/full/analytical-tables-2007-08 74/180
4 7
Table 1.23 Student-Classroom Ratio : 2007-08 All A
School Category
State/UT Primary with Primary with Upper Primary Upper PrPrimary Only Upper Primary Upper Primary Only with Sec
& Sec./Hr. Sec. Second
A & N Islands 15 19 22 20 19
Andhra Pradesh 28 26 23 0 22
Arunachal Pradesh 16 26 28 27 15
Assam 42 32 22 44 28
Bihar 97 97 59 90 35
Chandigarh 39 22 28 34 22
Chhattisgarh 33 30 19 31 17
D & N Haveli 37 44 36 30 36
Daman & Diu 34 26 34 33 32
Delhi 32 25 24 37 25
Goa 18 21 27 20 21
Gujarat 31 36 35 34 32
Haryana 35 26 29 22 27
Himachal Pradesh 15 10 14 21 22
Jammu & Kashmir 14 19 17 17 12
Jharkhand 70 60 35 34 22
Karnataka 22 32 28 32 26
Kerala 25 29 23 27 20
Lakshadweep 29 28 26 31 12
Madhya Pradesh 34 36 29 31 23
Maharashtra 31 34 29 28 30
Manipur 18 20 25 18 13
Meghalaya 18 18 25 19 23
Mizoram 17 22 25 22 14
Nagaland 15 31 30 24 26
Orissa 29 36 28 40 27
Puducherry 22 23 22 0 15
Punjab 28 23 24 28 24
Rajasthan 26 28 24 25 20
Sikkim 10 19 20 8 17
Tamil Nadu 24 33 32 35 14
Tripura 18 30 45 0 17
Uttar Pradesh 46 41 32 30 22
Uttarakhand 23 20 20 19 14
West Bengal 47 221 73 59 55
All States 37 37 27 32 29

7/30/2019 Analytical Tables 2007-08
http://slidepdf.com/reader/full/analytical-tables-2007-08 75/180
4 8 Table 1.24 Percentage Distribution of Schools having Single-Classroom : 2007-08 All Ar
School Category
State/UT Primary with Primary with Upper Primary Upper PriPrimary Only Upper Primary Upper Primary Only with Sec.
& Sec./Hr. Sec. Seconda
A & N Islands 4.02 1.45 0.00 0.00 0.00
Andhra Pradesh 36.61 1.83 0.41 0.00 0.59
Arunachal Pradesh 36.61 0.46 0.00 0.00 0.00 Assam 70.35 9.61 10.07 16.87 7.18
Bihar 7.09 2.39 2.43 0.99 1.93
Chandigarh 0.00 0.00 0.00 0.00 0.00
Chhattisgarh 6.06 5.00 2.27 1.32 1.50
D & N Haveli 6.78 0.94 0.00 0.00 0.00
Daman & Diu 1.96 0.00 0.00 0.00 0.00
Delhi 0.04 0.00 0.10 0.00 0.00
Goa 23.49 2.06 1.78 0.00 0.00
Gujarat 6.48 0.94 0.46 1.63 4.15
Haryana 2.93 2.15 0.89 3.97 0.55
Himachal Pradesh 5.52 0.36 0.12 17.17 0.48
Jammu & Kashmir 14.69 2.32 0.10 0.00 0.00
Jharkhand 3.32 1.24 0.67 0.47 0.19Karnataka 16.83 0.73 0.42 3.66 0.26
Kerala 0.75 0.12 0.20 0.00 0.07
Lakshadweep 0.00 0.00 0.00 0.00 0.00
Madhya Pradesh 4.69 0.86 0.75 1.40 0.35
Maharashtra 10.97 0.50 0.56 1.74 1.05
Manipur 2.50 0.28 0.18 0.00 0.00
Meghalaya 26.90 4.52 3.27 5.96 0.36
Mizoram 1.59 0.00 0.00 1.15 0.00
Nagaland 0.06 0.32 0.40 1.27 0.00
Orissa 8.52 0.67 0.65 2.98 0.74
Puducherry 3.92 0.00 0.44 0.00 0.00
Punjab 3.69 0.82 0.14 3.04 0.41
Rajasthan 6.30 0.50 0.19 1.67 0.34Sikkim 2.74 0.00 0.00 0.00 0.00
Tamil Nadu 0.00 0.00 0.00 0.00 0.00
Tripura 1.21 0.00 0.00 0.00 0.00
Uttar Pradesh 0.66 0.34 0.38 0.32 0.29
Uttarakhand 3.08 0.54 0.63 1.01 0.46
West Bengal 7.49 0.28 0.00 0.06 0.11
All States 12.38 1.04 0.64 2.76 0.99

7/30/2019 Analytical Tables 2007-08
http://slidepdf.com/reader/full/analytical-tables-2007-08 76/180
4 9
Table 1.25 Percentage Distribution of Schools having Single-Classroom : 2007-08 All Areas : All G
School Category
State/UT Primary with Primary with Upper Primary Upper PrPrimary Only Upper Primary Upper Primary Only with Sec
& Sec./Hr. Sec. Second
A & N Islands 3.95 1.79 0.00 0.00 0.00
Andhra Pradesh 40.68 2.50 0.69 0.00 0.95
Arunachal Pradesh 37.46 0.53 0.00 0.00 0.00
Assam 69.34 8.17 5.80 12.62 4.40
Bihar 7.08 2.37 2.77 1.04 1.99
Chandigarh 0.00 0.00 0.00 0.00 0.00
Chhattisgarh 6.11 7.33 3.36 1.30 1.47
D & N Haveli 4.19 0.97 0.00 0.00 0.00
Daman & Diu 2.22 0.00 0.00 0.00 0.00
Delhi 0.05 0.00 0.00 0.00 0.00
Goa 25.33 2.53 14.29 0.00 0.00
Gujarat 6.84 1.07 0.52 0.00 6.67
Haryana 3.04 3.36 1.75 4.13 0.55
Himachal Pradesh 5.76 0.00 0.00 17.20 0.49
Jammu & Kashmir 16.31 3.21 0.21 0.00 0.00
Jharkhand 3.32 1.26 0.00 0.51 0.14
Karnataka 18.62 0.73 1.27 2.69 0.00
Kerala 1.27 0.10 0.19 0.00 0.00
Lakshadweep 0.00 0.00 0.00 0.00 0.00
Madhya Pradesh 4.89 0.00 3.13 1.41 0.00
Maharashtra 12.29 0.56 0.56 8.33 5.47
Manipur 2.49 0.30 0.00 0.00 0.00
Meghalaya 25.65 4.76 7.69 2.70 0.00
Mizoram 1.24 0.00 0.00 1.12 0.00
Nagaland 0.07 0.00 0.00 1.29 0.00
Orissa 8.56 0.67 0.39 2.20 0.73
Puducherry 4.96 0.00 0.00 0.00 0.00
Punjab 3.78 0.00 0.72 3.07 0.43
Rajasthan 5.10 0.49 0.47 1.80 0.36
Sikkim 3.11 0.00 0.00 0.00 0.00
Tamil Nadu 0.00 0.00 0.00 0.00 0.00
Tripura 1.24 0.00 0.00 0.00 0.00
Uttar Pradesh 0.66 0.66 0.65 0.32 0.00
Uttarakhand 3.38 0.63 1.32 1.09 0.49
West Bengal 8.78 0.00 0.00 0.00 0.11
All States 13.04 1.20 0.85 2.11 1.01

7/30/2019 Analytical Tables 2007-08
http://slidepdf.com/reader/full/analytical-tables-2007-08 77/180
5 0 Table 1.26 Percentage Distribution of Schools having Single-Classroom : 2007-08 All Areas : A
School Category
State/UT Primary with Primary with Upper Primary Upper PriPrimary Only Upper Primary Upper Primary Only with Sec.
& Sec./Hr. Sec. Seconda
A & N Islands 4.55 0.00 0.00 0.00 0.00
Andhra Pradesh 8.38 0.50 0.00 0.00 0.06
Arunachal Pradesh 3.26 0.00 0.00 0.00 0.00 Assam 79.11 13.61 10.68 21.16 11.30
Bihar 7.63 2.85 2.19 0.00 1.56
Chandigarh 0.00 0.00 0.00 0.00 0.00
Chhattisgarh 4.99 2.35 0.77 1.86 1.62
D & N Haveli 50.00 0.00 0.00 0.00 0.00
Daman & Diu 0.00 0.00 0.00 0.00 0.00
Delhi 0.00 0.00 0.16 0.00 0.00
Goa 5.38 0.00 0.00 0.00 0.00
Gujarat 3.14 0.14 0.44 2.32 3.74
Haryana 0.47 0.42 0.33 1.30 0.53
Himachal Pradesh 2.43 0.36 0.12 0.00 0.00
Jammu & Kashmir 1.04 0.21 0.00 0.00 0.00
Jharkhand 3.74 0.69 0.64 0.00 0.35Karnataka 4.45 0.75 0.21 4.67 0.42
Kerala 0.36 0.14 0.21 0.00 0.11
Lakshadweep 0.00 0.00 0.00 0.00 0.00
Madhya Pradesh 2.84 0.86 0.70 1.15 0.37
Maharashtra 0.87 0.15 0.56 0.00 0.50
Manipur 2.50 0.26 0.25 0.00 0.00
Meghalaya 27.90 4.47 2.24 6.68 0.46
Mizoram 5.15 0.00 0.00 1.56 0.00
Nagaland 0.00 0.41 0.42 0.00 0.00
Orissa 6.90 0.73 0.84 4.69 0.81
Puducherry 0.00 0.00 0.70 0.00 0.00
Punjab 0.94 0.94 0.00 0.00 0.00
Rajasthan 3.22 0.35 0.15 0.00 0.00Sikkim 1.77 0.00 0.00 0.00 0.00
Tamil Nadu 0.00 0.00 0.00 0.00 0.00
Tripura 0.00 0.00 0.00 0.00 0.00
Uttar Pradesh 0.66 0.29 0.31 0.32 0.34
Uttarakhand 1.21 0.51 0.00 0.56 0.36
West Bengal 0.39 0.29 0.00 0.22 0.08
All States 7.19 0.60 0.54 5.07 0.98
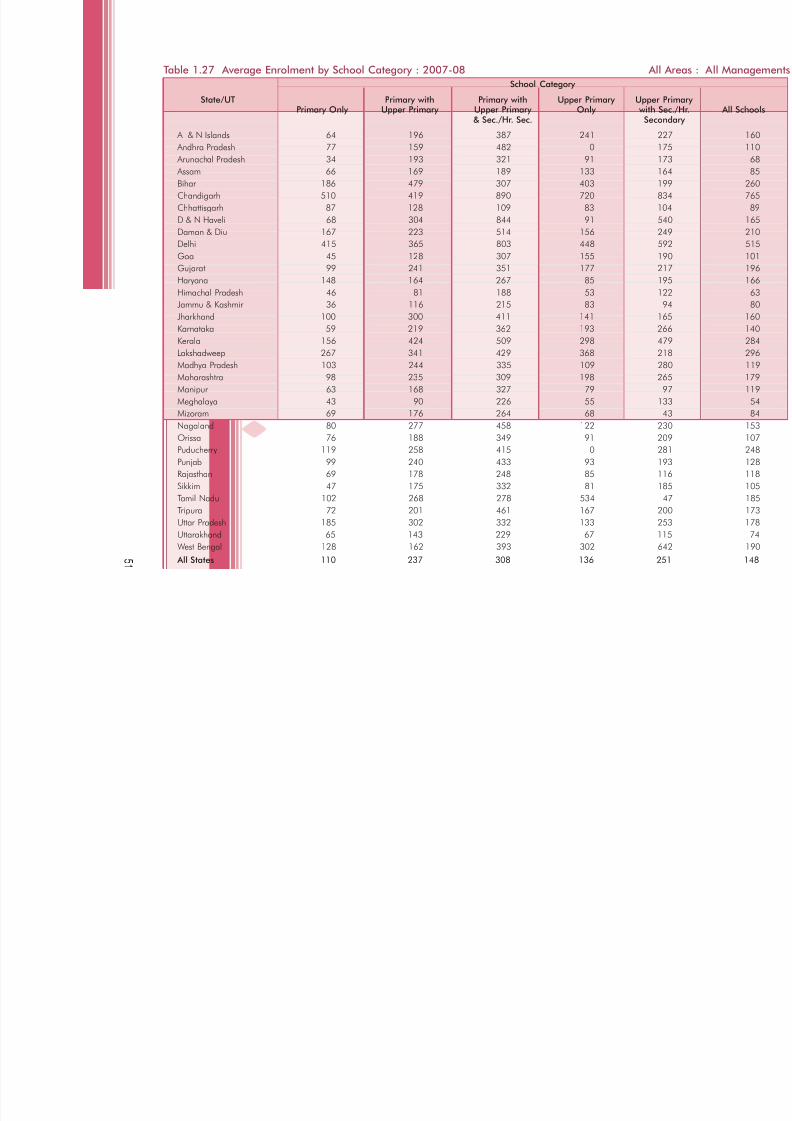
7/30/2019 Analytical Tables 2007-08
http://slidepdf.com/reader/full/analytical-tables-2007-08 78/180
5 1
Table 1.27 Average Enrolment by School Category : 2007-08 All A
School Category
State/UT Primary with Primary with Upper Primary Upper PrPrimary Only Upper Primary Upper Primary Only with Sec
& Sec./Hr. Sec. Second
A & N Islands 64 196 387 241 227
Andhra Pradesh 77 159 482 0 175
Arunachal Pradesh 34 193 321 91 173
Assam 66 169 189 133 164
Bihar 186 479 307 403 199
Chandigarh 510 419 890 720 834
Chhattisgarh 87 128 109 83 104
D & N Haveli 68 304 844 91 540
Daman & Diu 167 223 514 156 249
Delhi 415 365 803 448 592
Goa 45 128 307 155 190
Gujarat 99 241 351 177 217
Haryana 148 164 267 85 195
Himachal Pradesh 46 81 188 53 122
Jammu & Kashmir 36 116 215 83 94
Jharkhand 100 300 411 141 165
Karnataka 59 219 362 193 266
Kerala 156 424 509 298 479
Lakshadweep 267 341 429 368 218
Madhya Pradesh 103 244 335 109 280
Maharashtra 98 235 309 198 265
Manipur 63 168 327 79 97
Meghalaya 43 90 226 55 133
Mizoram 69 176 264 68 43
Nagaland 80 277 458 122 230
Orissa 76 188 349 91 209
Puducherry 119 258 415 0 281
Punjab 99 240 433 93 193
Rajasthan 69 178 248 85 116
Sikkim 47 175 332 81 185
Tamil Nadu 102 268 278 534 47
Tripura 72 201 461 167 200
Uttar Pradesh 185 302 332 133 253
Uttarakhand 65 143 229 67 115
West Bengal 128 162 393 302 642
All States 110 237 308 136 251

7/30/2019 Analytical Tables 2007-08
http://slidepdf.com/reader/full/analytical-tables-2007-08 79/180
5 2 Table 1.28 Percentage of Single-Teacher Schools : 2007-08 All Ar
School Category
State/UT Primary with Primary with Upper Primary Upper PriPrimary Only Upper Primary Upper Primary Only with Sec.
& Sec./Hr. Sec. Seconda
A & N Islands 0.50 1.45 0.00 0.00 0.00
Andhra Pradesh 11.22 0.16 0.20 0.00 0.08
Arunachal Pradesh 66.96 1.68 0.63 0.00 0.00 Assam 35.06 1.25 6.47 0.40 2.00
Bihar 7.86 1.53 13.11 3.45 12.85
Chandigarh 0.00 0.00 0.00 0.00 0.00
Chhattisgarh 18.19 7.68 5.80 9.26 1.41
D & N Haveli 37.29 2.83 0.00 0.00 0.00
Daman & Diu 0.00 0.00 0.00 0.00 0.00
Delhi 0.00 0.00 0.00 0.00 0.00
Goa 34.75 4.12 1.18 0.00 0.00
Gujarat 4.52 0.64 1.15 4.34 3.23
Haryana 4.24 4.53 1.13 7.08 0.26
Himachal Pradesh 9.95 0.54 0.24 4.16 0.05
Jammu & Kashmir 7.56 0.05 0.00 0.00 0.00
Jharkhand 11.24 1.68 1.35 0.94 1.83Karnataka 18.77 2.29 4.76 6.86 6.56
Kerala 0.49 0.00 0.00 0.00 0.00
Lakshadweep 0.00 0.00 0.00 0.00 0.00
Madhya Pradesh 18.94 2.69 0.43 9.66 0.18
Maharashtra 7.51 0.27 0.41 2.33 0.77
Manipur 17.67 0.56 0.00 1.82 0.00
Meghalaya 18.25 0.79 1.09 1.09 1.46
Mizoram 2.38 0.32 0.00 3.34 3.57
Nagaland 3.65 0.32 0.00 0.42 0.00
Orissa 17.46 1.92 5.37 4.64 2.22
Puducherry 4.25 0.00 0.00 0.00 0.00
Punjab 11.18 1.91 0.14 4.11 0.84
Rajasthan 37.07 3.16 0.82 9.00 1.07Sikkim 1.00 0.00 0.00 0.00 0.00
Tamil Nadu 4.13 0.24 0.88 0.18 0.00
Tripura 0.97 1.07 0.00 0.00 0.00
Uttar Pradesh 2.96 1.81 2.28 16.38 1.60
Uttarakhand 18.47 4.17 3.48 6.02 1.78
West Bengal 3.79 0.00 0.00 0.26 0.03
All States 13.73 1.55 1.47 9.88 0.76

7/30/2019 Analytical Tables 2007-08
http://slidepdf.com/reader/full/analytical-tables-2007-08 80/180
5 3
Table 1.29 Average Number of Instructional Days by Category : 2006-07 All A
School Category
State/UT Primary with Primary with Upper Primary Upper PrPrimary Only Upper Primary Upper Primary Only with Sec
& Sec./Hr. Sec. Second
A & N Islands 201 206 194 216 185
Andhra Pradesh 213 216 212 0 218
Arunachal Pradesh 173 213 219 222 201 Assam 217 217 189 215 196
Bihar 162 206 143 200 68
Chandigarh 234 225 231 243 227
Chhattisgarh 217 186 200 222 203
D & N Haveli 241 231 237 230 243
Daman & Diu 202 203 177 212 182
Delhi 164 172 168 177 175
Goa 189 192 183 153 191
Gujarat 206 212 207 209 211
Haryana 226 194 208 197 221
Himachal Pradesh 235 216 215 216 235
Jammu & Kashmir 212 213 216 204 207
Jharkhand 231 235 199 201 207
Karnataka 215 218 208 204 191
Kerala 183 183 184 179 184
Lakshadweep 106 206 375 0 61
Madhya Pradesh 227 219 221 227 220
Maharashtra 226 227 215 228 228
Manipur 202 204 203 195 198
Meghalaya 194 187 188 194 170
Mizoram 208 212 209 210 160
Nagaland 181 181 191 183 182
Orissa 209 216 193 216 210
Puducherry 190 187 193 0 195
Punjab 223 222 217 225 222
Rajasthan 217 218 213 157 218
Sikkim 173 184 165 146 169
Tamil Nadu 218 218 210 211 198
Tripura 225 237 241 260 236
Uttar Pradesh 198 177 185 189 181
Uttarakhand 214 212 210 209 211
West Bengal 205 37 89 188 219
All States 210 215 204 207 216

7/30/2019 Analytical Tables 2007-08
http://slidepdf.com/reader/full/analytical-tables-2007-08 81/180

7/30/2019 Analytical Tables 2007-08
http://slidepdf.com/reader/full/analytical-tables-2007-08 82/180
5 7
Table 2.1 Percentage Distribution of Schools having Boundary Wall by Category : 2007-08 All A
School Category
State/UT Primary with Primary with Upper Primary Upper PPrimary Only Upper Primary Upper Primary Only with Se
& Sec./Hr. Sec. Secon
A & N Islands 44.22 44.93 56.06 100.00 58.
Andhra Pradesh 41.74 67.00 88.75 - 78.
Arunachal Pradesh 19.96 52.59 68.55 63.64 81. Assam 26.50 45.63 64.03 26.10 45.
Bihar 23.74 39.42 45.79 41.87 54.
Chandigarh 100.00 100.00 100.00 100.00 100.
Chhattisgarh 41.44 60.95 56.35 33.72 61.
D & N Haveli 24.86 60.38 83.33 100.00 100.
Daman & Diu 86.27 90.00 81.82 92.86 100.
Delhi 98.33 98.80 99.50 96.63 98.
Goa 59.13 70.10 79.88 75.00 61.
Gujarat 66.76 86.80 92.66 89.97 92.
Haryana 90.62 93.84 97.19 91.99 96.
Himachal Pradesh 24.02 57.40 65.68 18.75 44.
Jammu & Kashmir 21.08 42.40 71.97 49.09 64.
Jharkhand 16.34 34.95 67.00 52.58 64.
Karnataka 45.26 65.94 77.28 60.64 74.
Kerala 66.30 73.66 79.39 66.45 80.
Lakshadweep 31.25 22.22 100.00 100.00 42.
Madhya Pradesh 42.00 83.28 90.79 42.37 91.
Maharashtra 52.78 64.44 75.32 68.60 65.
Manipur 20.67 41.10 69.75 47.27 70.
Meghalaya 15.02 33.20 53.82 16.42 41.
Mizoram 25.26 46.01 79.31 31.34 21.
Nagaland 75.86 70.83 81.12 78.48 59.
Orissa 54.94 69.34 85.53 56.08 82.
Puducherry 80.07 85.00 90.71 - 95.
Punjab 90.74 96.45 99.15 88.05 93.Rajasthan 47.82 80.01 93.15 70.00 91.
Sikkim 22.76 24.32 41.72 33.33 40.
Tamil Nadu 57.94 61.83 72.30 87.72 64.
Tripura 11.84 11.22 31.89 - 52.
Uttar Pradesh 43.87 82.03 84.81 46.61 90.
Uttarakhand 71.83 77.42 81.65 69.83 58.
West Bengal 36.40 96.07 87.55 45.45 66.
All States 42.81 67.32 79.39 46.11 73.

7/30/2019 Analytical Tables 2007-08
http://slidepdf.com/reader/full/analytical-tables-2007-08 83/180
5 8 Table 2.2 Percentage of Schools having Drinking Water Facility : 2007-08 All Areas : All Gov
School Category
State/UT Primary with Primary with Upper Primary Upper PrPrimary Only Upper Primary Upper Primary Only with Sec
& Sec./Hr. Sec. Second
A & N Islands 98.31 98.21 100.00 - 85.7
Andhra Pradesh 85.72 92.90 98.97 - 92.3
Arunachal Pradesh 59.53 84.81 92.19 90.00 92.8 Assam 63.05 87.90 84.06 74.93 84.3
Bihar 75.17 95.78 93.68 93.23 95.5
Chandigarh 100.00 100.00 100.00 100.00 100.0
Chhattisgarh 88.54 87.60 81.36 80.78 92.5
D & N Haveli 92.81 98.06 - 100.00 100.0
Daman & Diu 88.89 100.00 100.00 100.00 83.3
Delhi 99.28 98.68 100.00 100.00 99.5
Goa 94.89 98.73 95.24 100.00 100.0
Gujarat 77.97 88.78 88.02 93.64 96.6
Haryana 96.08 96.64 98.12 97.55 99.4
Himachal Pradesh 93.64 100.00 100.00 82.34 96.6
Jammu & Kashmir 66.51 76.06 86.26 83.33 86.1
Jharkhand 61.40 90.01 91.76 86.67 90.1Karnataka 67.23 88.38 85.23 84.75 90.9
Kerala 97.47 99.42 98.29 98.00 98.2
Lakshadweep 100.00 100.00 100.00 100.00 100.0
Madhya Pradesh 90.72 100.00 100.00 90.41 100.0
Maharashtra 79.66 86.87 97.38 91.67 92.9
Manipur 73.40 73.78 70.55 78.95 79.2
Meghalaya 52.21 50.00 71.15 55.41 72.4
Mizoram 78.78 81.72 100.00 82.84 21.0
Nagaland 69.14 85.07 66.67 75.97 56.9
Orissa 83.62 91.85 96.12 84.13 94.0
Puducherry 97.93 100.00 98.81 - 100.0
Punjab 97.17 93.48 98.56 97.66 98.9
Rajasthan 82.01 91.57 96.12 89.93 96.0
Sikkim 74.22 76.97 85.71 100.00 80.0
Tamil Nadu 100.00 100.00 100.00 100.00 100.0
Tripura 72.19 76.08 90.91 100.00 95.0
Uttar Pradesh 98.44 95.50 98.06 93.04 99.2
Uttarakhand 86.71 85.53 90.07 78.92 88.9
West Bengal 92.77 97.22 98.68 94.71 98.5
All States 84.50 90.32 93.65 88.86 94.4

7/30/2019 Analytical Tables 2007-08
http://slidepdf.com/reader/full/analytical-tables-2007-08 84/180
5 9
Table 2.3 Percentage of Schools having Drinking Water Facility : 2007-08 All Areas : A
School Category
State/UT Primary with Primary with Upper Primary Upper PPrimary Only Upper Primary Upper Primary Only with Se
& Sec./Hr. Sec. Secon
A & N Islands 100.00 100.00 100.00 100.00 100.
Andhra Pradesh 97.45 99.45 98.99 - 99.
Arunachal Pradesh 94.57 98.89 100.00 100.00 100. Assam 33.68 69.23 79.67 53.13 64.
Bihar 83.47 90.39 89.59 90.91 93.
Chandigarh 100.00 100.00 100.00 - 100.
Chhattisgarh 86.82 94.98 96.25 93.19 97.
D & N Haveli 100.00 100.00 100.00 -
Daman & Diu 100.00 50.00 80.00 -
Delhi 99.60 100.00 99.51 100.00 100.
Goa 100.00 100.00 98.65 100.00 100.
Gujarat 98.63 99.33 99.85 99.23 100.
Haryana 99.53 99.86 99.92 100.00 100.
Himachal Pradesh 98.42 99.27 99.75 100.00 100.
Jammu & Kashmir 93.84 95.34 98.89 100.00 100.
Jharkhand 81.83 88.46 92.04 88.89 92.
Karnataka 86.24 94.69 96.77 92.06 95.
Kerala 96.11 99.22 99.38 99.22 99.
Lakshadweep - - - -
Madhya Pradesh 96.62 98.79 99.40 98.73 99.
Maharashtra 98.31 98.56 98.61 95.59 98.
Manipur 70.91 83.68 88.42 86.11 88.
Meghalaya 45.34 60.00 82.51 50.82 63.
Mizoram 59.56 83.18 94.23 73.44 100.
Nagaland 64.24 78.37 86.50 100.00 100.
Orissa 77.51 86.61 93.56 68.47 82.
Puducherry 96.88 100.00 99.30 -
Punjab 99.53 99.69 99.12 100.00 98.
Rajasthan 94.25 98.09 99.13 95.45 98.
Sikkim 89.82 93.94 94.44 100.00
Tamil Nadu 100.00 100.00 100.00 100.00
Tripura 81.48 86.67 87.30 - 86.
Uttar Pradesh 99.60 99.56 99.21 99.61 99.
Uttarakhand 92.91 96.92 99.39 91.09 92.
West Bengal 1.55 1.65 10.21 37.39 89.
All States 82.50 95.71 95.95 84.75 95.

7/30/2019 Analytical Tables 2007-08
http://slidepdf.com/reader/full/analytical-tables-2007-08 85/180
6 0 Table 2.4 Percentage of Schools having Common Toilet Facility : 2007-08 All Ar
School Category
State/UT Primary with Primary with Upper Primary Upper PrPrimary Only Upper Primary Upper Primary Only with Sec
& Sec./Hr. Sec. Second
A & N Islands 91.96 76.81 69.70 100.00 83.3
Andhra Pradesh 56.58 73.94 70.96 - 65.7
Arunachal Pradesh 12.78 54.73 73.58 54.55 81.8 Assam 23.62 60.86 56.83 28.48 39.4
Bihar 39.69 73.78 56.15 74.88 67.8
Chandigarh 60.71 40.91 31.53 - 42.8
Chhattisgarh 32.69 52.40 50.14 45.29 57.8
D & N Haveli 22.03 50.94 66.67 - 100.0
Daman & Diu 82.35 70.00 90.91 100.00 57.1
Delhi 93.85 92.27 87.03 79.78 82.2
Goa 46.10 58.76 72.78 87.50 79.8
Gujarat 66.86 72.54 70.07 71.54 77.4
Haryana 93.18 95.53 97.24 92.06 95.0
Himachal Pradesh 43.45 77.08 73.75 42.83 62.6
Jammu & Kashmir 22.19 53.31 73.05 43.64 67.9
Jharkhand 23.61 59.26 66.50 52.11 53.7Karnataka 60.48 80.88 85.80 67.73 75.3
Kerala 85.95 87.54 80.97 80.30 75.6
Lakshadweep 87.50 66.67 75.00 100.00 57.1
Madhya Pradesh 69.29 80.29 84.77 75.01 85.7
Maharashtra 69.87 78.98 81.95 73.84 80.5
Manipur 38.26 66.95 84.06 60.00 79.5
Meghalaya 26.49 47.74 61.09 36.25 57.3
Mizoram 74.40 80.83 87.93 81.57 46.4
Nagaland 76.81 77.24 78.71 83.97 66.9
Orissa 45.86 63.63 69.92 46.34 61.0
Puducherry 75.16 63.33 66.37 - 72.9
Punjab 89.94 95.08 90.99 83.77 83.8
Rajasthan 24.09 48.90 62.10 35.00 52.2Sikkim 90.80 87.03 81.46 100.00 60.0
Tamil Nadu 68.63 65.99 53.73 54.40 52.3
Tripura 62.95 74.15 79.72 100.00 85.3
Uttar Pradesh 90.36 95.77 96.33 92.22 96.0
Uttarakhand 84.44 90.86 93.99 79.35 90.7
West Bengal 70.97 3.74 28.38 58.62 70.6
All States 58.62 69.66 70.76 71.43 70.6

7/30/2019 Analytical Tables 2007-08
http://slidepdf.com/reader/full/analytical-tables-2007-08 86/180
6 1
Table 2.5 Percentage of Schools having Girls Toilet Facility : 2007-08 All A
School Category
State/UT Primary with Primary with Upper Primary Upper PPrimary Only Upper Primary Upper Primary Only with Se
& Sec./Hr. Sec. Secon
A & N Islands 65.83 76.81 93.94 100.00 75.
Andhra Pradesh 34.79 62.60 84.66 - 75.
Arunachal Pradesh 5.11 34.30 54.72 63.64 77. Assam 6.80 25.16 49.10 15.18 35.
Bihar 15.30 39.26 28.48 39.90 49.
Chandigarh 78.57 90.91 99.10 100.00 100.
Chhattisgarh 14.46 43.13 48.47 23.77 47.
D & N Haveli 13.56 42.45 100.00 100.00 100.
Daman & Diu 56.86 50.00 90.91 64.29 85.
Delhi 76.73 90.38 76.04 53.93 47.
Goa 28.92 58.76 89.35 66.67 83.
Gujarat 46.97 73.33 90.02 82.93 91.
Haryana 82.75 92.21 95.46 86.71 93.
Himachal Pradesh 28.26 76.17 93.47 37.51 68.
Jammu & Kashmir 8.35 30.35 70.26 23.64 43.
Jharkhand 11.99 37.67 59.60 71.83 45.
Karnataka 34.79 58.74 84.54 58.58 77.
Kerala 69.75 89.21 92.90 85.90 92.
Lakshadweep 37.50 77.78 100.00 100.00 71.
Madhya Pradesh 40.92 75.12 93.98 52.65 89.
Maharashtra 42.33 65.68 91.82 84.88 88.
Manipur 3.98 28.39 63.95 16.36 43.
Meghalaya 6.48 21.61 51.27 12.29 41.
Mizoram 18.45 30.03 56.90 27.65 28.
Nagaland 24.64 61.22 80.32 37.13 47.
Orissa 21.37 36.48 72.85 25.67 51.
Puducherry 77.78 95.83 93.81 - 83.
Punjab 84.00 95.36 96.34 86.04 91.
Rajasthan 69.54 90.94 95.47 76.00 91.
Sikkim 31.47 57.30 80.79 33.33 80.
Tamil Nadu 52.24 74.18 87.31 89.06 92.
Tripura 11.47 23.12 52.79 - 74.
Uttar Pradesh 81.05 92.24 93.29 84.28 91.
Uttarakhand 47.75 76.61 82.91 56.21 67.
West Bengal 28.59 4.21 31.46 67.14 86.
All States 41.95 63.95 82.06 59.43 78.

7/30/2019 Analytical Tables 2007-08
http://slidepdf.com/reader/full/analytical-tables-2007-08 87/180
6 2 Table 2.6 Percentage of Schools having Electricity Connection : 2007-08 All Ar
School Category
State/UT Primary with Primary with Upper Primary Upper PrPrimary Only Upper Primary Upper Primary Only with Sec
& Sec./Hr. Sec. Second
A & N Islands 86.43 89.86 98.48 100.00 87.5
Andhra Pradesh 18.60 56.08 98.57 - 85.1
Arunachal Pradesh 7.78 41.16 76.73 54.55 90.9 Assam 3.92 22.34 55.40 9.43 34.2
Bihar 1.33 7.43 11.17 7.88 13.2
Chandigarh 100.00 100.00 100.00 100.00 100.0
Chhattisgarh 11.92 47.12 57.05 24.83 72.3
D & N Haveli 61.02 89.62 100.00 100.00 100.0
Daman & Diu 96.08 100.00 100.00 100.00 85.7
Delhi 98.21 98.97 99.60 100.00 98.1
Goa 92.79 98.97 98.82 100.00 99.4
Gujarat 61.78 89.18 96.10 94.31 97.2
Haryana 95.80 94.89 97.63 85.20 97.7
Himachal Pradesh 49.44 92.60 97.98 43.08 91.0
Jammu & Kashmir 10.13 23.18 63.11 18.18 31.4
Jharkhand 2.20 11.13 53.37 52.58 39.7Karnataka 55.83 83.10 92.15 75.51 88.1
Kerala 81.68 97.39 96.35 96.19 98.9
Lakshadweep 100.00 100.00 100.00 100.00 100.0
Madhya Pradesh 10.77 80.38 93.18 24.13 91.5
Maharashtra 56.97 81.10 92.31 81.98 83.9
Manipur 5.27 31.92 68.12 23.64 57.5
Meghalaya 7.18 33.01 68.00 19.22 58.7
Mizoram 16.47 63.58 91.38 35.48 35.7
Nagaland 10.06 55.13 83.94 56.54 58.6
Orissa 8.22 23.66 88.29 21.64 78.0
Puducherry 95.10 98.33 97.35 - 97.9
Punjab 80.48 97.54 98.87 92.59 98.3
Rajasthan 7.74 37.75 81.37 50.67 84.1
Sikkim 30.10 56.76 66.23 100.00 60.0
Tamil Nadu 67.13 85.27 95.14 99.36 95.2
Tripura 2.65 2.93 48.45 100.00 85.3
Uttar Pradesh 13.77 58.72 61.65 16.68 65.8
Uttarakhand 17.5 69.89 84.18 36.73 78.8
West Bengal 12.71 3.84 31.73 43.96 84.8
All States 21.44 56.81 81.90 27.65 81.0

7/30/2019 Analytical Tables 2007-08
http://slidepdf.com/reader/full/analytical-tables-2007-08 88/180
6 3
Table 2.7 Percentage of Schools having Computers : 2007-08 All A
School Category
State/UT Primary with Primary with Upper Primary Upper PPrimary Only Upper Primary Upper Primary Only with Se
& Sec./Hr. Sec. Secon
A & N Islands 34.17 42.03 54.55 100.00 58.
Andhra Pradesh 10.12 23.43 91.21 - 59.
Arunachal Pradesh 2.15 30.49 58.49 36.36 90. Assam 1.69 10.70 22.84 5.03 20.
Bihar 0.20 1.62 2.27 2.96 1.
Chandigarh 35.71 72.73 83.78 100.00 100.
Chhattisgarh 5.83 21.61 36.09 5.64 42.
D & N Haveli 3.39 3.77 100.00 100.00 100.
Daman & Diu 19.61 30.00 90.91 57.14 57.
Delhi 63.94 75.77 82.38 80.90 88.
Goa 7.70 27.84 82.25 91.67 97.
Gujarat 18.47 43.98 75.34 53.12 59.
Haryana 5.64 35.39 62.75 9.68 62.
Himachal Pradesh 3.11 56.86 79.57 2.25 27.
Jammu & Kashmir 4.18 15.75 52.33 10.91 30.
Jharkhand 3.41 7.58 41.75 14.55 19.
Karnataka 5.03 16.03 68.17 20.82 59.
Kerala 54.45 88.56 92.70 84.75 98.
Lakshadweep 68.75 88.89 100.00 100.00 85.
Madhya Pradesh 7.35 35.44 65.65 15.65 68.
Maharashtra 11.77 44.12 82.76 70.35 76.
Manipur 0.86 16.95 48.01 10.91 31.
Meghalaya 2.82 15.52 45.09 9.00 31.
Mizoram 3.97 38.34 77.59 17.86 28.
Nagaland 5.09 34.29 66.67 29.96 53.
Orissa 4.36 9.40 66.50 6.55 44.
Puducherry 27.45 90.00 89.82 - 97.
Punjab 5.89 67.49 80.42 70.15 89.
Rajasthan 4.85 17.31 65.42 18.33 44.
Sikkim 12.06 45.41 43.05 66.67 80.
Tamil Nadu 13.43 22.06 49.80 81.62 80.
Tripura 1.90 2.73 30.19 100.00 57.
Uttar Pradesh 2.00 11.10 15.32 5.41 11.
Uttarakhand 13.22 54.97 80.38 26.05 78.
West Bengal 1.67 1.12 12.18 6.13 31.
All States 6.01 24.01 60.21 14.05 56.

7/30/2019 Analytical Tables 2007-08
http://slidepdf.com/reader/full/analytical-tables-2007-08 89/180
6 4 Table 2.8 Percentage of Schools having Ramp : 2007-08 All Ar
School Category
State/UT Primary with Primary with Upper Primary Upper PrPrimary Only Upper Primary Upper Primary Only with Sec
& Sec./Hr. Sec. Second
A & N Islands 6.03 10.14 10.61 0.00 20.8
Andhra Pradesh 8.45 15.62 16.56 - 14.8
Arunachal Pradesh 2.23 6.40 5.66 0.00 6.8 Assam 16.03 23.67 6.47 11.12 5.7
Bihar 16.55 33.35 11.81 25.62 5.3
Chandigarh 17.86 31.82 35.14 100.00 71.4
Chhattisgarh 30.71 21.37 20.13 30.19 21.3
D & N Haveli 1.69 4.72 16.67 0.00 0.0
Daman & Diu 17.65 10.00 9.09 7.14 0.0
Delhi 58.96 60.65 70.40 80.90 82.5
Goa 21.13 26.80 9.47 4.17 8.5
Gujarat 69.82 74.99 29.93 26.02 23.5
Haryana 53.28 46.54 48.89 53.57 65.0
Himachal Pradesh 31.23 8.48 11.64 19.38 29.5
Jammu & Kashmir 7.08 18.24 11.32 3.64 5.0
Jharkhand 3.31 10.38 15.15 12.68 9.2Karnataka 13.84 32.52 17.13 21.05 13.3
Kerala 58.19 65.27 56.41 55.15 48.0
Lakshadweep 62.50 77.78 100.00 0.00 100.0
Madhya Pradesh 33.61 23.35 35.30 40.17 30.3
Maharashtra 78.30 74.57 16.20 20.35 14.4
Manipur 5.15 10.59 12.50 7.27 12.1
Meghalaya 5.17 8.25 8.73 4.68 3.2
Mizoram 29.70 9.90 5.17 32.49 10.7
Nagaland 6.54 5.77 8.03 6.75 3.0
Orissa 15.18 32.46 12.36 16.83 9.2
Puducherry 42.16 42.50 29.65 - 56.2
Punjab 41.74 17.49 20.99 41.71 43.9
Rajasthan 24.50 33.01 22.22 26.33 25.3Sikkim 4.85 8.65 9.27 0.00 0.0
Tamil Nadu 40.07 65.41 36.27 36.59 19.0
Tripura 45.59 45.46 50.46 0.00 65.3
Uttar Pradesh 57.71 16.85 20.89 44.70 16.8
Uttarakhand 33.65 12.50 18.67 23.61 10.9
West Bengal 54.62 1.78 14.59 45.77 58.5
All States 34.19 39.93 25.84 35.89 25.0

7/30/2019 Analytical Tables 2007-08
http://slidepdf.com/reader/full/analytical-tables-2007-08 90/180
6 5
Table 2.9 Percentage of Schools having Book-Bank : 2007-08 All A
School Category
State/UT Primary with Primary with Upper Primary Upper PPrimary Only Upper Primary Upper Primary Only with Se
& Sec./Hr. Sec. Secon
A & N Islands 61.81 65.22 63.64 100.00 58.
Andhra Pradesh 60.74 71.28 71.98 - 75.
Arunachal Pradesh 8.97 36.74 54.09 45.45 65. Assam 16.81 32.19 41.73 27.94 40.
Bihar 19.43 54.71 36.08 48.77 41.
Chandigarh 42.86 50.00 44.14 0.00 50.
Chhattisgarh 45.50 45.34 51.39 45.65 64.
D & N Haveli 64.41 92.45 83.33 100.00 100.
Daman & Diu 88.24 80.00 72.73 85.71 28.
Delhi 58.80 73.37 59.90 52.81 49.
Goa 18.26 30.93 18.93 45.83 32.
Gujarat 31.24 44.11 55.50 44.72 47.
Haryana 89.31 78.91 87.37 71.41 89.
Himachal Pradesh 39.29 55.96 67.58 34.59 43.
Jammu & Kashmir 38.74 54.99 59.87 54.55 68.
Jharkhand 33.36 61.18 60.94 56.81 58.
Karnataka 68.33 90.47 90.39 81.46 80.
Kerala 80.43 87.87 90.34 87.93 92.
Lakshadweep 43.75 44.44 75.00 100.00 85.
Madhya Pradesh 38.34 44.46 67.15 48.63 66.
Maharashtra 84.49 87.30 83.32 89.53 90.
Manipur 6.20 26.13 51.27 21.82 46.
Meghalaya 17.71 30.06 35.27 20.74 29.
Mizoram 3.17 10.54 17.24 7.14 10.
Nagaland 14.46 29.49 44.58 29.11 36.
Orissa 15.69 24.14 46.50 22.74 38.
Puducherry 10.46 11.67 25.66 - 6.
Punjab 31.75 57.10 58.73 42.18 51.
Rajasthan 43.72 59.52 71.12 48.00 76.
Sikkim 14.93 30.81 46.36 33.33 80.
Tamil Nadu 40.58 48.03 45.83 51.47 57.
Tripura 7.20 14.93 28.48 0.00 41.
Uttar Pradesh 51.67 68.56 72.41 46.75 76.
Uttarakhand 50.72 73.52 75.63 42.84 62.
West Bengal 55.31 3.46 33.20 60.43 83.
All States 44.40 61.61 63.55 44.59 74.

7/30/2019 Analytical Tables 2007-08
http://slidepdf.com/reader/full/analytical-tables-2007-08 91/180
6 6 Table 2.10 Percentage of Schools having Playground : 2007-08 All Ar
School Category
State/UT Primary with Primary with Upper Primary Upper PrPrimary Only Upper Primary Upper Primary Only with Sec
& Sec./Hr. Sec. Second
A & N Islands 45.23 75.36 60.61 100.00 50.0
Andhra Pradesh 49.02 64.42 91.82 - 84.0
Arunachal Pradesh 15.61 57.16 79.25 18.18 84.0 Assam 37.84 51.48 53.06 62.67 71.0
Bihar 23.04 45.06 40.78 56.16 62.9
Chandigarh 71.43 95.45 98.20 100.00 100.0
Chhattisgarh 33.49 57.68 60.06 38.87 67.4
D & N Haveli 12.43 46.23 100.00 100.00 0.0
Daman & Diu 41.18 70.00 90.91 57.14 57.1
Delhi 73.96 82.30 89.70 73.03 81.5
Goa 34.25 46.39 78.70 75.00 67.1
Gujarat 62.30 73.36 88.30 90.51 93.0
Haryana 79.29 85.01 91.81 78.12 88.7
Himachal Pradesh 57.17 95.67 96.32 47.69 80.9
Jammu & Kashmir 28.59 53.49 80.45 43.64 67.6
Jharkhand 19.43 34.97 56.73 46.48 66.7Karnataka 43.71 65.42 80.12 71.85 75.3
Kerala 60.93 71.29 81.56 86.66 91.7
Lakshadweep 0.00 11.11 25.00 0.00 100.0
Madhya Pradesh 52.69 84.40 92.65 54.17 93.8
Maharashtra 60.71 67.39 88.85 90.12 90.8
Manipur 47.35 56.78 71.01 56.36 81.0
Meghalaya 25.27 36.15 60.73 40.33 53.2
Mizoram 6.81 8.63 25.86 10.83 3.5
Nagaland 42.99 57.69 70.68 50.21 64.6
Orissa 16.96 28.10 66.34 48.49 65.6
Puducherry 43.14 60.00 79.20 - 58.3
Punjab 61.07 83.88 90.28 72.76 83.7
Rajasthan 32.96 56.05 84.98 39.33 76.0
Sikkim 55.10 76.22 87.42 66.67 80.0
Tamil Nadu 74.22 74.40 85.41 94.75 71.4
Tripura 51.39 65.17 82.04 0.00 92.0
Uttar Pradesh 63.81 82.74 88.99 67.96 89.5
Uttarakhand 54.48 80.51 78.48 50.58 58.3
West Bengal 30.71 3.18 26.77 52.61 67.3
All States 45.79 60.75 80.96 60.25 80.9

7/30/2019 Analytical Tables 2007-08
http://slidepdf.com/reader/full/analytical-tables-2007-08 92/180
6 7 NR : Data not reported.
Table 2.11 Percentage of Schools having Kitchen-Shed : 2007-08 All Areas : All Governme
School Category
State/UT Primary with Primary with Upper Primary Upper PPrimary Only Upper Primary Upper Primary Only with Se
& Sec./Hr. Sec. Secon
A & N Islands 20.34 23.21 33.85 0.00 33.
Andhra Pradesh 29.09 62.39 74.57 - 10.
Arunachal Pradesh 14.42 50.17 37.41 36.36 13. Assam 49.73 65.50 7.59 2.77 4.
Bihar 9.59 15.20 18.95 10.34 15.
Chandigarh 20.00 20.00 26.58 100.00 42.
Chhattisgarh 56.58 42.66 16.12 6.84 8.
D & N Haveli 29.71 50.48 33.33 100.00 0.
Daman & Diu 15.22 25.00 16.67 35.71 16.
Delhi 6.01 33.05 21.81 13.25 13.
Goa 2.21 6.19 10.30 12.50 10.
Gujarat 33.93 47.01 37.97 38.26 30.
Haryana 9.94 9.40 13.89 3.10 6.
Himachal Pradesh 5.26 33.33 23.91 1.00 3.
Jammu & Kashmir 1.14 2.37 5.71 7.41 3.
Jharkhand 26.15 41.12 33.85 56.80 17.Karnataka 26.49 28.40 17.90 31.71 18.
Kerala 48.94 49.34 52.14 47.38 44.
Lakshadweep 37.50 - 50.00 0.00 14.
Madhya Pradesh 54.08 26.91 33.63 12.54 35.
Maharashtra 11.23 21.07 39.27 25.00 25.
Manipur NR NR NR NR
Meghalaya 7.19 8.49 17.59 2.11 6.
Mizoram 71.50 24.53 33.33 4.90 10.
Nagaland 39.69 44.78 33.33 36.05 30.
Orissa 21.28 27.69 46.67 4.57 19.
Puducherry 29.15 41.10 23.08 - 6.
Punjab 5.93 22.35 16.46 3.49 4.
Rajasthan 33.58 38.97 15.43 21.79 6.Sikkim NR NR NR NR
Tamil Nadu 85.43 92.66 80.93 91.55 88.
Tripura 61.11 70.49 72.96 0.00 51.
Uttar Pradesh 62.73 11.45 15.11 8.26 8.
Uttarakhand 81.04 19.46 19.80 7.82 8.
West Bengal 72.03 13.89 19.85 18.93 20.
All States 41.37 36.03 37.08 11.33 14.

7/30/2019 Analytical Tables 2007-08
http://slidepdf.com/reader/full/analytical-tables-2007-08 93/180
6 8 Table 2.12 Percentage of Schools having Furniture for Students: 2007-08 All Ar
School Category
State/UT Primary with Primary with Upper Primary Upper PrPrimary Only Upper Primary Upper Primary Only with Sec
& Sec./Hr. Sec. Second
A & N Islands 98.99 100.00 96.67 100.00 87.5
Andhra Pradesh 47.90 64.13 81.39 - 80.5
Arunachal Pradesh 59.53 84.45 90.57 100.00 90.9 Assam 76.86 95.55 92.63 91.56 91.1
Bihar 31.24 80.20 55.18 80.79 44.3
Chandigarh 96.43 100.00 99.10 100.00 100.0
Chhattisgarh 87.64 83.53 80.19 78.69 87.8
D & N Haveli 50.85 89.62 100.00 100.00 100.0
Daman & Diu 33.33 40.00 36.36 42.86 57.1
Delhi 93.11 99.48 98.42 96.63 97.5
Goa 80.16 87.63 92.31 83.33 75.2
Gujarat 26.83 53.16 86.47 88.08 88.0
Haryana 71.42 60.66 68.08 48.52 66.3
Himachal Pradesh 36.40 81.59 83.73 25.99 37.9
Jammu & Kashmir 24.82 42.18 74.13 32.73 51.7
Jharkhand 21.49 56.41 78.96 66.20 85.3Karnataka 71.19 80.14 93.23 78.49 88.7
Kerala 54.09 54.28 62.13 50.57 56.1
Lakshadweep 100.00 100.00 100.00 100.00 100.0
Madhya Pradesh 30.53 67.58 92.01 38.91 90.1
Maharashtra 27.94 46.59 88.07 82.56 89.7
Manipur NR NR NR NR N
Meghalaya 86.42 88.61 93.45 86.31 85.4
Mizoram 89.88 93.93 94.83 91.94 78.5
Nagaland 87.99 90.38 90.76 95.36 85.7
Orissa 13.43 48.13 89.27 73.30 91.3
Puducherry 92.16 97.50 96.46 - 97.9
Punjab 67.48 95.63 98.45 88.69 91.5
Rajasthan 22.65 26.25 35.63 23.67 30.9
Sikkim NR NR NR NR N
Tamil Nadu 81.66 85.62 81.10 88.26 61.9
Tripura 95.68 98.05 98.30 100.00 100.0
Uttar Pradesh 54.61 73.83 72.28 58.26 71.3
Uttarakhand 25.25 72.58 74.05 31.24 64.2
West Bengal 48.46 3.18 30.39 67.59 80.7
All States 46.68 57.62 71.82 60.58 76.8
NR : Data not reported.

7/30/2019 Analytical Tables 2007-08
http://slidepdf.com/reader/full/analytical-tables-2007-08 94/180
6 9
Table 2.13 Percentage of Schools having Furniture for Teachers: 2007- 08 All A
School Category
State/UT Primary with Primary with Upper Primary Upper PPrimary Only Upper Primary Upper Primary Only with Se
& Sec./Hr. Sec. Secon
A & N Islands 97.49 100.00 96.97 100.00 87.
Andhra Pradesh 92.90 97.81 95.91 - 97.
Arunachal Pradesh 57.85 75.61 85.53 90.91 86. Assam 80.67 95.39 91.91 89.38 91.
Bihar 71.41 93.79 70.87 90.15 62.
Chandigarh 100.00 100.00 99.10 100.00 92.
Chhattisgarh 89.31 84.20 78.76 79.53 88.
D & N Haveli 90.96 98.11 100.00 100.00 100.
Daman & Diu 31.37 50.00 36.36 42.86 57.
Delhi 97.23 98.97 99.21 98.88 98.
Goa 80.55 84.54 93.49 83.33 78.
Gujarat 89.13 94.68 97.48 95.93 95.
Haryana 72.63 70.54 74.20 67.80 77.
Himachal Pradesh 89.35 86.46 87.53 79.71 88.
Jammu & Kashmir 93.82 94.86 96.33 92.73 94.
Jharkhand 79.86 92.55 88.22 79.81 89.
Karnataka 94.98 98.31 97.66 94.28 96.
Kerala 53.62 53.99 61.83 50.19 56.
Lakshadweep 100.00 88.89 100.00 100.00 100.
Madhya Pradesh 94.84 93.97 97.92 93.73 97.
Maharashtra 90.65 91.69 90.71 88.37 93.
Manipur NR NR NR NR
Meghalaya 81.98 86.25 93.09 82.60 86.
Mizoram 89.62 92.33 96.55 91.36 78.
Nagaland 84.35 90.71 92.77 93.67 87.
Orissa 88.42 96.54 96.10 94.48 96.
Puducherry 95.75 98.33 96.02 - 97.
Punjab 97.39 98.91 98.59 98.03 98.
Rajasthan 34.45 36.67 42.15 30.33 38.
Sikkim NR NR NR NR
Tamil Nadu 95.10 97.28 91.24 94.10 83.
Tripura 96.47 97.27 97.99 100.00 100.
Uttar Pradesh 87.49 84.86 81.39 83.86 80.
Uttarakhand 90.30 90.05 83.23 86.53 88.
West Bengal 76.81 4.40 33.60 70.05 90.
All States 82.77 84.10 77.94 86.61 86.
NR : Data not reported.
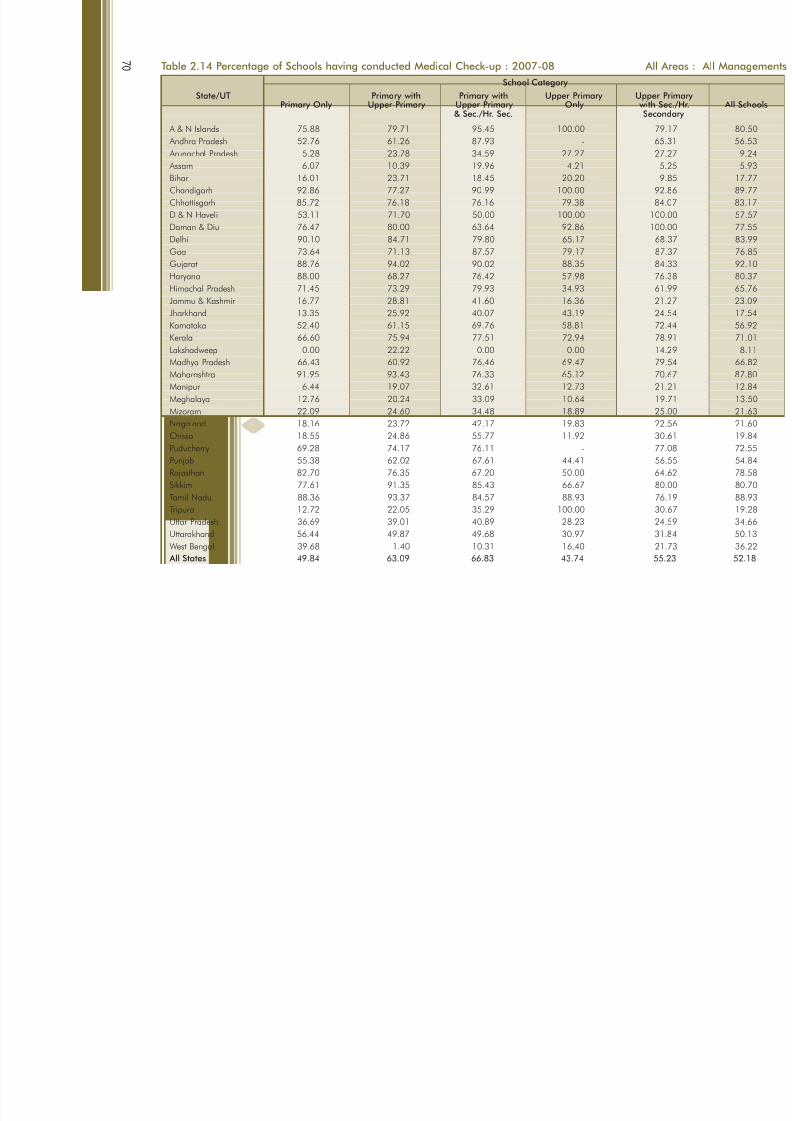
7/30/2019 Analytical Tables 2007-08
http://slidepdf.com/reader/full/analytical-tables-2007-08 95/180
7 0 Table 2.14 Percentage of Schools having conducted Medical Check-up : 2007-08 All Ar
School Category
State/UT Primary with Primary with Upper Primary Upper PrPrimary Only Upper Primary Upper Primary Only with Sec
& Sec./Hr. Sec. Second
A & N Islands 75.88 79.71 95.45 100.00 79.1
Andhra Pradesh 52.76 61.26 87.93 - 65.3
Arunachal Pradesh 5.28 23.78 34.59 27.27 27.2 Assam 6.07 10.39 19.96 4.21 5.2
Bihar 16.01 23.71 18.45 20.20 9.8
Chandigarh 92.86 77.27 90.99 100.00 92.8
Chhattisgarh 85.72 76.18 76.16 79.38 84.0
D & N Haveli 53.11 71.70 50.00 100.00 100.0
Daman & Diu 76.47 80.00 63.64 92.86 100.0
Delhi 90.10 84.71 79.80 65.17 68.3
Goa 73.64 71.13 87.57 79.17 87.3
Gujarat 88.76 94.02 90.02 88.35 84.3
Haryana 88.00 68.27 76.42 57.98 76.3
Himachal Pradesh 71.45 73.29 79.93 34.93 61.9
Jammu & Kashmir 16.77 28.81 41.60 16.36 21.2
Jharkhand 13.35 25.92 40.07 43.19 24.5Karnataka 52.40 61.15 69.76 58.81 72.4
Kerala 66.60 75.94 77.51 72.94 78.9
Lakshadweep 0.00 22.22 0.00 0.00 14.2
Madhya Pradesh 66.43 60.92 76.46 69.47 79.5
Maharashtra 91.95 93.43 76.33 65.12 70.6
Manipur 6.44 19.07 32.61 12.73 21.2
Meghalaya 12.76 20.24 33.09 10.64 19.7
Mizoram 22.09 24.60 34.48 18.89 25.0
Nagaland 18.16 23.72 42.17 19.83 22.5
Orissa 18.55 24.86 55.77 11.92 30.6
Puducherry 69.28 74.17 76.11 - 77.0
Punjab 55.38 62.02 67.61 44.41 56.5
Rajasthan 82.70 76.35 67.20 50.00 64.6
Sikkim 77.61 91.35 85.43 66.67 80.0
Tamil Nadu 88.36 93.37 84.57 88.93 76.1
Tripura 12.72 22.05 35.29 100.00 30.6
Uttar Pradesh 36.69 39.01 40.89 28.23 24.5
Uttarakhand 56.44 49.87 49.68 30.97 31.8
West Bengal 39.68 1.40 10.31 16.40 21.7
All States 49.84 63.09 66.83 43.74 55.2

7/30/2019 Analytical Tables 2007-08
http://slidepdf.com/reader/full/analytical-tables-2007-08 96/180
7 1
Table 2.15 Percentage Distribution of Schools having Pre-Primary Section : 2007-08 All A
School Category
State/UT Primary with Primary withPrimary Only Upper Primary Upper Primary
& Sec./Hr. Sec.
A & N Islands 29.65 47.83 31.82
Andhra Pradesh 9.83 19.88 30.88
Arunachal Pradesh 63.23 40.85 28.93 Assam 66.13 77.42 76.08
Bihar 11.56 17.36 16.83
Chandigarh 89.29 90.91 88.29
Chhattisgarh 19.87 46.21 31.73
D & N Haveli 3.39 1.89 50.00
Daman & Diu 25.49 70.00 27.27
Delhi 36.63 12.03 16.53
Goa 15.99 26.80 73.37
Gujarat 21.24 24.08 49.43
Haryana 73.18 44.16 44.94
Himachal Pradesh 8.23 82.67 80.17
Jammu & Kashmir 79.56 81.22 73.15
Jharkhand 6.11 7.72 28.79
Karnataka 32.46 41.21 71.01
Kerala 26.83 31.39 28.60
Lakshadweep 0.00 0.00 0.00
Madhya Pradesh 43.67 28.29 35.36
Maharashtra 38.18 32.54 25.04
Manipur 40.76 39.41 55.62
Meghalaya 87.84 73.87 69.45
Mizoram 40.48 87.22 86.21
Nagaland 98.99 89.74 94.78
Orissa 7.30 10.34 44.07
Puducherry 91.18 82.50 66.81
Punjab 21.46 55.19 52.82
Rajasthan 6.04 17.37 38.88
Sikkim 95.40 100.00 98.01
Tamil Nadu 16.39 9.09 32.91
Tripura 2.18 4.49 5.57
Uttar Pradesh 36.64 7.01 6.58
Uttarakhand 27.21 38.98 28.48
West Bengal 9.72 39.10 26.64
All States 28.06 25.77 39.92

7/30/2019 Analytical Tables 2007-08
http://slidepdf.com/reader/full/analytical-tables-2007-08 97/180
7 2 Table 2.16 Percentage Distribution of Schools having used School Building as Shift School : 2007-08 All
School Category
State/UT Primary with Primary with Upper Primary Upper PrPrimary Only Upper Primary Upper Primary Only with Sec
& Sec./Hr. Sec. Second
A & N Islands 2.01 4.35 9.09 0.00 8.3
Andhra Pradesh 0.28 0.29 1.02 - 0.8
Arunachal Pradesh 0.41 2.44 2.52 0.00 2.2 Assam 0.44 1.02 0.90 0.22 0.2
Bihar 3.29 2.71 5.50 3.45 0.4
Chandigarh 14.29 4.55 19.82 0.00 7.1
Chhattisgarh 3.70 16.91 18.92 5.23 17.1
D & N Haveli 0.56 7.55 0.00 0.00 0.0
Daman & Diu 60.78 70.00 63.64 57.14 85.7
Delhi 41.40 4.98 19.41 38.20 49.0
Goa 6.71 20.62 5.33 8.33 9.0
Gujarat 3.02 8.70 19.38 10.30 11.9
Haryana 0.76 0.41 0.89 0.36 0.5
Himachal Pradesh 0.26 1.44 0.95 0.29 0.3
Jammu & Kashmir 0.44 0.59 0.15 1.82 0.9
Jharkhand 0.73 0.93 3.87 4.69 2.5Karnataka 0.97 1.67 4.26 1.60 4.2
Kerala 2.51 1.63 2.17 0.25 0.7
Lakshadweep 0.00 0.00 0.00 0.00 0.0
Madhya Pradesh 7.19 26.02 39.40 15.97 43.3
Maharashtra 7.46 16.30 29.89 20.93 23.6
Manipur 0.55 1.13 3.44 0.00 1.5
Meghalaya 2.59 10.22 4.73 4.99 4.3
Mizoram 1.12 2.24 0.00 0.46 0.0
Nagaland 0.69 0.32 3.21 1.27 1.5
Orissa 0.59 0.96 7.48 0.68 2.0
Puducherry 1.96 2.50 0.88 - 2.0
Punjab 0.32 0.27 0.00 0.13 0.4
Rajasthan 0.95 2.35 7.92 4.67 4.7
Sikkim 2.74 3.24 5.96 0.00 0.0
Tamil Nadu 0.08 0.00 0.04 0.20 0.0
Tripura 3.81 24.20 54.02 0.00 14.6
Uttar Pradesh 0.34 1.18 0.63 0.20 0.1
Uttarakhand 0.26 0.54 0.32 0.27 0.4
West Bengal 1.67 0.37 2.01 2.91 4.4
All States 2.21 5.53 10.78 4.55 7.7

7/30/2019 Analytical Tables 2007-08
http://slidepdf.com/reader/full/analytical-tables-2007-08 98/180
7 3
Table 2.17 Percentage of Residential Schools : 2007-08 All A
School Category
State/UT Primary with Primary with Upper Primary Upper PPrimary Only Upper Primary Upper Primary Only with Se
& Sec./Hr. Sec. Secon
A & N Islands 0.00 1.45 1.52 0.00 8.
Andhra Pradesh 1.35 2.62 52.76 - 6.
Arunachal Pradesh 3.78 23.02 26.42 54.55 20. Assam 0.70 1.41 6.12 0.38 0.
Bihar 0.49 0.71 6.80 1.48 1.
Chandigarh 0.00 0.00 4.50 0.00 14.
Chhattisgarh 3.40 11.43 4.22 1.78 4.
D & N Haveli 1.13 0.00 33.33 0.00 0.
Daman & Diu 5.88 0.00 0.00 0.00 0.
Delhi 0.57 1.37 2.87 0.00 0.
Goa 2.37 1.03 8.28 0.00 1.
Gujarat 1.33 2.64 6.19 8.13 9.
Haryana 0.56 1.10 1.78 0.29 0.
Himachal Pradesh 0.38 3.43 3.80 0.17 0.
Jammu & Kashmir 0.04 0.17 0.15 23.64 2.
Jharkhand 0.31 0.66 5.22 67.61 1.
Karnataka 1.01 1.05 4.26 10.53 26.
Kerala 0.82 1.18 3.25 0.76 3.
Lakshadweep 0.00 0.00 0.00 0.00 0.
Madhya Pradesh 2.36 2.33 3.41 1.72 6.
Maharashtra 1.50 3.85 20.80 6.40 3.
Manipur 0.78 2.97 7.79 0.00 1.
Meghalaya 3.03 6.88 11.27 1.82 4.
Mizoram 0.53 4.15 15.52 0.23 10.
Nagaland 2.39 16.03 22.89 2.11 4.
Orissa 2.70 4.69 24.39 1.78 14.
Puducherry 1.63 0.83 4.42 - 2.
Punjab 0.34 0.82 1.55 0.17 0.
Rajasthan 0.68 0.91 2.58 28.67 1.
Sikkim 5.97 4.32 5.96 0.00 20.
Tamil Nadu 1.00 1.50 3.07 6.50 90.
Tripura 2.27 2.05 2.79 100.00 5.
Uttar Pradesh 0.32 0.47 0.63 0.51 0.
Uttarakhand 0.31 1.21 1.90 0.47 0.
West Bengal 0.36 2.25 2.54 1.36 2.
All States 1.12 2.13 6.43 1.49 3.

7/30/2019 Analytical Tables 2007-08
http://slidepdf.com/reader/full/analytical-tables-2007-08 99/180
7 4 Table 2.18 Percentage of Schools having Received School Development Grant : 2006-07 All Ar
School Category
State/UT Primary with Primary with Upper Primary Upper PrPrimary Only Upper Primary Upper Primary Only with Sec
& Sec./Hr. Sec. Second
A & N Islands 77.89 65.22 80.30 0.00 62.5
Andhra Pradesh 72.84 59.64 7.36 - 44.9
Arunachal Pradesh 28.04 64.48 52.20 27.27 40.9 Assam 60.92 66.72 1.98 67.62 14.4
Bihar 55.50 75.69 38.83 70.44 6.4
Chandigarh 57.14 18.18 54.95 100.00 28.5
Chhattisgarh 83.90 42.46 15.35 65.86 43.5
D & N Haveli 87.01 96.23 16.67 0.00 0.0
Daman & Diu 60.78 40.00 9.09 71.43 28.5
Delhi 51.47 8.42 24.85 37.08 49.0
Goa 83.42 76.29 79.29 66.67 82.8
Gujarat 81.60 81.26 16.17 28.18 13.8
Haryana 87.48 39.34 28.42 72.85 78.0
Himachal Pradesh 90.04 1.81 2.26 80.62 93.8
Jammu & Kashmir 51.55 45.95 25.09 40.00 35.2
Jharkhand 70.09 80.36 24.07 14.55 15.4Karnataka 78.95 76.90 15.87 51.26 14.1
Kerala 94.51 92.18 74.16 91.49 75.5
Lakshadweep 100.00 100.00 100.00 100.00 100.0
Madhya Pradesh 79.91 3.19 4.05 79.07 5.8
Maharashtra 91.36 88.91 44.59 61.05 65.3
Manipur 63.57 33.47 14.13 45.45 65.9
Meghalaya 49.99 47.94 37.09 50.67 20.8
Mizoram 61.04 10.22 6.90 65.32 32.1
Nagaland 81.40 16.99 2.41 90.30 72.1
Orissa 86.03 91.98 22.60 68.37 58.7
Puducherry 77.78 56.67 39.82 - 93.7
Punjab 79.93 3.55 3.38 86.81 84.1
Rajasthan 77.28 57.79 4.64 41.67 20.8
Sikkim 35.32 52.97 60.26 0.00 20.0
Tamil Nadu 82.22 89.99 56.67 58.66 4.7
Tripura 82.45 90.44 90.40 0.00 89.3
Uttar Pradesh 67.19 4.92 7.34 53.90 6.0
Uttarakhand 78.79 11.02 28.16 73.18 66.3
West Bengal 71.28 1.59 20.35 61.65 78.8
All States 73.72 67.44 26.82 65.01 53.1

7/30/2019 Analytical Tables 2007-08
http://slidepdf.com/reader/full/analytical-tables-2007-08 100/180
7 5
Table 2.19 Percentage of Schools Utilised School Development Grant : 2006-07* All A
School Category
State/UT Primary with Primary with Upper Primary Upper PPrimary Only Upper Primary Upper Primary Only with Se
& Sec./Hr. Sec. Secon
A & N Islands 96.68 97.76 95.18 0.00 24.
Andhra Pradesh 94.01 93.51 91.24 _ 87.
Arunachal Pradesh 96.55 95.21 95.50 69.57 87. Assam 93.58 95.60 98.70 94.76 93.
Bihar 69.00 72.26 58.62 76.70 95.
Chandigarh 100.00 100.00 99.94 100.00 100.
Chhattisgarh 93.65 86.26 116.42 92.02 118.
D & N Haveli 100.00 100.00 100.00 0.00 0.
Daman & Diu 78.06 100.00 0.00 85.37 100.
Delhi 91.33 99.96 98.41 93.62 96.
Goa 94.64 96.89 99.41 107.81 95.
Gujarat 95.05 88.91 110.32 99.20 87.
Haryana 99.32 99.07 96.68 99.57 95.
Himachal Pradesh 88.92 87.60 112.07 90.02 85.
Jammu & Kashmir 91.35 88.93 83.25 82.33 98.
Jharkhand 90.04 89.69 58.72 116.05 61.Karnataka 59.01 59.72 81.21 65.06 52.
Kerala 99.06 99.98 96.68 118.54 102.
Lakshadweep 100.00 100.00 100.00 100.00 100.
Madhya Pradesh 91.23 117.52 102.61 80.23 108.
Maharashtra 93.23 93.28 98.24 96.26 98.
Manipur 99.69 99.85 102.41 100.00 97.
Meghalaya 93.05 100.04 71.89 93.95 99.
Mizoram 98.87 100.00 100.00 100.65 100.
Nagaland 100.22 99.78 120.00 99.90 100.
Orissa 82.79 87.54 96.22 88.93 63.
Puducherry 85.03 67.98 92.88 - 87.
Punjab 87.56 68.24 55.14 89.94 94.
Rajasthan 82.55 96.85 89.26 97.93 127.Sikkim 134.68 92.75 93.92 0.00 100.
Tamil Nadu 100.40 99.53 97.86 99.78 100.
Tripura 98.63 98.19 99.98 0.00 99.
Uttar Pradesh 97.53 100.21 87.02 95.39 94.
Uttarakhand 94.55 94.64 97.87 86.00 93.
West Bengal 78.04 73.81 86.24 84.67 86.
All States 86.64 84.63 91.94 89.56 88.
* More than 100 may be because of spill-over activities.

7/30/2019 Analytical Tables 2007-08
http://slidepdf.com/reader/full/analytical-tables-2007-08 101/180
7 6 Table 2.20 Percentage of Schools Received Teaching Learning Material (TLM) Grant : 2006-07 All
School Category
State/UT Primary with Primary with Upper Primary Upper PrPrimary Only Upper Primary Upper Primary Only with Sec
& Sec./Hr. Sec. Second
A & N Islands 62.81 63.77 69.70 0.00 50.0
Andhra Pradesh 70.74 58.82 4.29 - 41.0
Arunachal Pradesh 22.90 49.94 43.40 0.00 18.1 Assam 61.56 64.77 0.72 65.71 11.7
Bihar 49.61 68.29 38.03 58.13 5.5
Chandigarh 57.14 36.36 60.36 100.00 21.4
Chhattisgarh 82.30 38.62 13.54 62.66 40.6
D & N Haveli 92.09 96.23 50.00 0.00 0.0
Daman & Diu 25.49 30.00 0.00 42.86 28.5
Delhi 41.08 7.04 7.52 13.48 11.2
Goa 83.32 76.29 80.47 75.00 80.8
Gujarat 79.01 79.81 15.71 28.46 13.8
Haryana 87.84 36.55 26.30 70.11 76.4
Himachal Pradesh 88.53 0.36 1.43 81.16 94.9
Jammu & Kashmir 75.11 61.26 34.25 56.36 54.9
Jharkhand 71.11 78.18 22.90 14.08 12.1Karnataka 74.32 72.98 15.20 46.00 13.6
Kerala 91.99 88.93 73.96 86.28 76.1
Lakshadweep 100.00 88.89 100.00 100.00 100.0
Madhya Pradesh 74.19 1.27 1.54 74.07 3.1
Maharashtra 90.69 88.77 43.80 61.63 63.3
Manipur 32.29 16.67 9.42 32.73 40.9
Meghalaya 50.20 44.60 37.45 51.28 21.9
Mizoram 73.54 7.67 8.62 78.46 10.7
Nagaland 85.42 20.51 2.81 92.41 75.1
Orissa 84.10 89.46 22.28 66.81 55.4
Puducherry 75.49 52.50 38.94 - 85.4
Punjab 84.12 2.73 2.96 89.94 85.9
Rajasthan 71.62 56.28 5.68 36.67 24.1
Sikkim 6.97 12.97 13.91 0.00 20.0
Tamil Nadu 79.22 87.22 54.28 56.75 9.5
Tripura 81.57 86.83 85.45 0.00 84.0
Uttar Pradesh 64.73 3.61 6.33 48.65 3.0
Uttarakhand 77.09 10.75 32.59 75.02 74.4
West Bengal 67.99 1.87 23.83 63.72 78.8
All States 71.26 65.60 25.83 61.45 51.4

7/30/2019 Analytical Tables 2007-08
http://slidepdf.com/reader/full/analytical-tables-2007-08 102/180
7 7
Table 2.21 Percentage of Schools Utilised Teaching Learning Material (TLM) Grant : 2006-07* All A
School Category
State/UT Primary with Primary with Upper Primary Upper PPrimary Only Upper Primary Upper Primary Only with Se
& Sec./Hr. Sec. Secon
A & N Islands 95.62 102.22 102.86 0.00 99.
Andhra Pradesh 96.25 96.39 65.00 - 91.
Arunachal Pradesh 98.60 96.05 88.64 0.00 94. Assam 98.19 96.11 99.87 100.01 99.
Bihar 83.69 85.65 90.67 87.36 89.
Chandigarh 97.74 68.30 97.79 100.00 100.
Chhattisgarh 93.39 91.94 113.29 91.35 94.
D & N Haveli 100.00 100.25 100.00 0.00 0.
Daman & Diu 92.31 100.00 0.00 85.29 100.
Delhi 127.46 168.68 105.21 93.66 82.
Goa 95.20 98.19 195.33 100.00 95.
Gujarat 101.61 96.17 102.21 110.42 117.
Haryana 100.84 98.98 99.24 99.91 99.
Himachal Pradesh 91.22 100.00 73.91 91.23 94.
Jammu & Kashmir 90.40 92.94 99.96 91.35 94.
Jharkhand 94.31 90.07 104.43 25.73 73.Karnataka 74.53 80.65 87.86 47.22 98.
Kerala 100.16 100.78 101.06 100.94 101.
Lakshadweep 100.00 100.00 100.00 100.00 72.
Madhya Pradesh 90.55 105.52 166.16 86.49 95.
Maharashtra 95.56 97.11 87.60 96.64 98.
Manipur 98.61 113.92 98.24 100.00 100.
Meghalaya 96.70 99.69 99.04 95.76 98.
Mizoram 99.64 100.00 100.00 91.04 100.
Nagaland 100.20 98.83 99.56 98.83 99.
Orissa 80.56 82.68 76.15 86.53 81.
Puducherry 92.11 94.19 104.13 - 98.
Punjab 82.48 87.50 44.98 90.00 91.
Rajasthan 96.03 94.29 87.16 105.36 88.Sikkim 89.18 93.56 79.21 0.00 100.
Tamil Nadu 101.89 100.52 99.35 99.35 102.
Tripura 100.45 95.98 99.61 0.00 96.
Uttar Pradesh 98.73 108.44 109.49 97.39 95.
Uttarakhand 98.84 100.38 91.51 98.30 99.
West Bengal 87.22 167.92 95.38 94.10 93.
All States 93.57 92.41 95.22 93.13 96.
* More than 100 may be because of spill-over activities.

7/30/2019 Analytical Tables 2007-08
http://slidepdf.com/reader/full/analytical-tables-2007-08 103/180
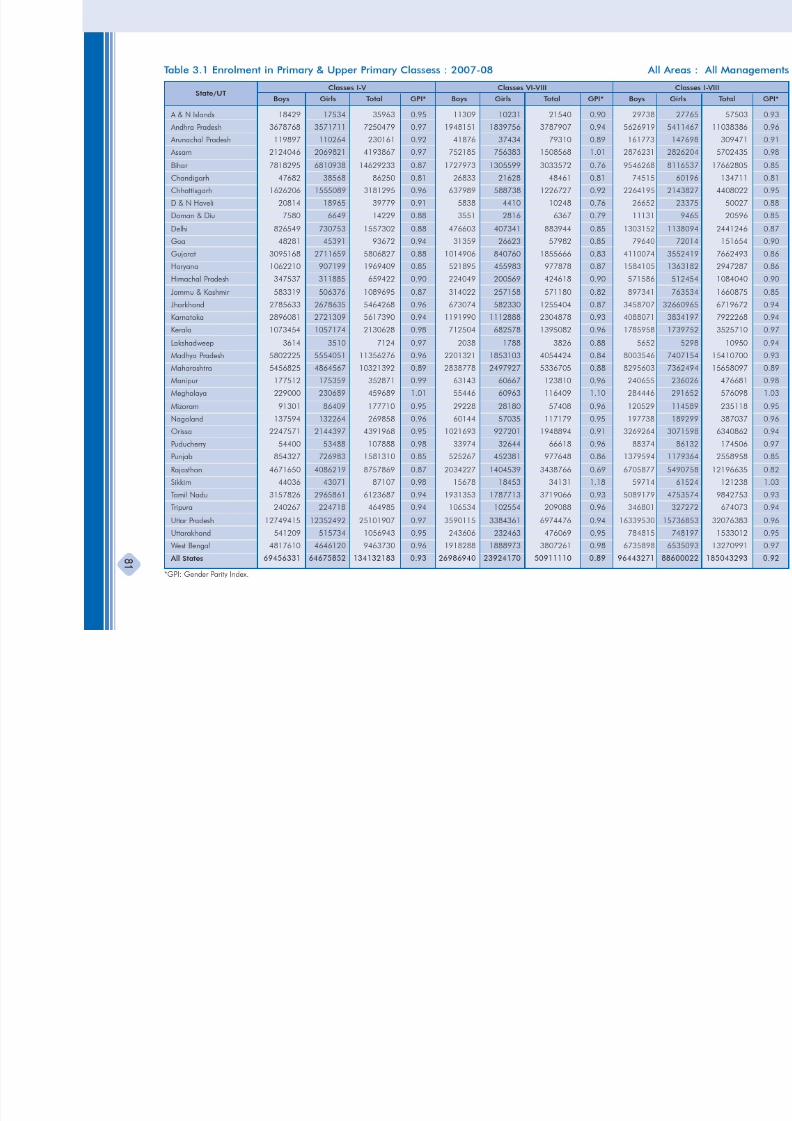
7/30/2019 Analytical Tables 2007-08
http://slidepdf.com/reader/full/analytical-tables-2007-08 104/180

7/30/2019 Analytical Tables 2007-08
http://slidepdf.com/reader/full/analytical-tables-2007-08 105/180

7/30/2019 Analytical Tables 2007-08
http://slidepdf.com/reader/full/analytical-tables-2007-08 106/180
8 3
Table 3.3 Percentage of Boys & Girls Enrolment in Primary & Upper Primary Classes : 2007-08 All A
Classes I-V Classes VI-VIII
Boys Girls Total Boys Girls Total Boys
A & N Islands 51.24 48.76 35963 52.50 47.50 21540 51.72
Andhra Pradesh 50.74 49.26 7250479 51.43 48.57 3787907 50.98
Arunachal Pradesh 52.09 47.91 230161 52.80 47.20 79310 52.27
Assam 50.65 49.35 4193867 49.86 50.14 1508568 50.44
Bihar 53.44 46.56 14629233 56.96 43.04 3033572 54.05
Chandigarh 55.28 44.72 86250 55.37 44.63 48461 55.31
Chhattisgarh 51.12 48.88 3181295 52.01 47.99 1226727 51.37
D & N Haveli 52.32 47.68 39779 56.97 43.03 10248 53.28
Daman & Diu 53.27 46.73 14229 55.77 44.23 6367 54.04
Delhi 53.08 46.92 1557302 53.92 26.08 883944 53.38
Goa 51.54 48.46 93672 54.08 45.92 57982 52.51
Gujarat 53.30 46.70 5806827 54.69 45.31 1855666 53.64
Haryana 53.94 46.06 1969409 53.37 46.63 977878 53.75
Himachal Pradesh 52.70 47.30 659422 52.76 47.24 424618 52.73
Jammu & Kashmir 53.53 46.47 1089695 54.98 45.02 571180 54.03
Jharkhand 50.98 49.02 5464268 53.61 46.39 1255404 51.47
Karnataka 51.56 48.44 5617390 51.72 48.28 2304878 51.60 Kerala 50.38 49.62 2130628 51.07 48.93 1395082 50.66
Lakshadweep 50.73 49.27 7124 53.27 46.73 3826 51.62
Madhya Pradesh 51.09 48.91 11356276 54.29 45.71 4054424 51.93
Maharashtra 52.87 47.13 10321392 53.19 46.81 5336705 52.98
Manipur 50.31 49.69 352871 51.00 49.00 123810 50.49
Meghalaya 49.82 50.18 459689 47.63 52.37 116409 49.37
Mizoram 51.38 48.62 177710 50.91 49.09 57408 51.26
Nagaland 50.99 49.01 269858 51.33 48.67 117179 51.09
Orissa 51.17 48.83 4391968 52.42 47.58 1948894 51.56
Puducherry 50.42 49.58 107888 51.00 49.00 66618 50.64
Punjab 54.03 45.97 1581310 53.73 46.27 977648 53.91
Rajasthan 53.34 46.66 8757869 59.16 40.84 3438766 54.98 Sikkim 50.55 49.45 87107 45.93 54.07 34131 49.25
Tamil Nadu 51.57 48.43 6123687 51.93 48.07 3719066 51.70
Tripura 51.67 48.33 464985 50.95 49.05 209088 51.45
Uttar Pradesh 50.79 49.21 25101907 51.48 48.52 6974476 50.94
Uttarakhand 51.21 48.79 1056943 51.17 48.83 476069 51.19
West Bengal 50.91 49.09 9463730 50.38 49.62 3807261 50.76
All States 51.78 46.22 134132183 53.01 46.99 50911110 52.12
State/UT
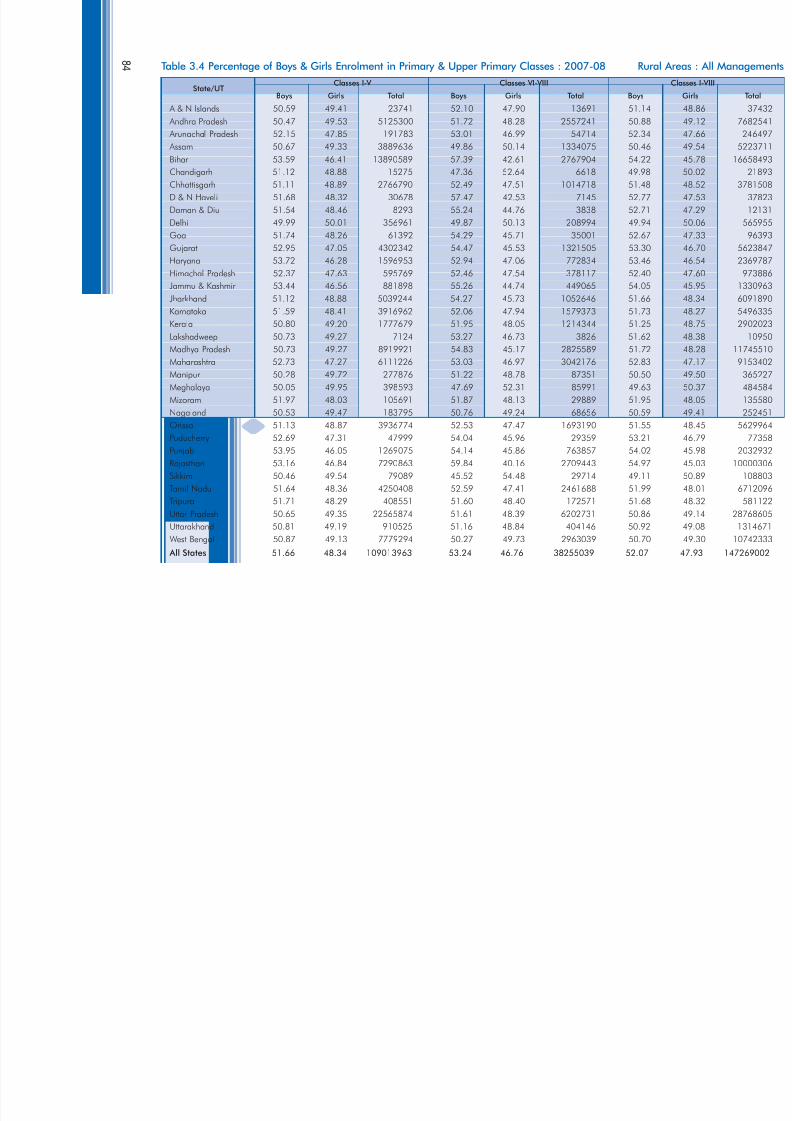
7/30/2019 Analytical Tables 2007-08
http://slidepdf.com/reader/full/analytical-tables-2007-08 107/180
8 4 Table 3.4 Percentage of Boys & Girls Enrolment in Primary & Upper Primary Classes : 2007-08 Rural A
Classes I-V Classes VI-VIII
Boys Girls Total Boys Girls Total Boys
A & N Islands 50.59 49.41 23741 52.10 47.90 13691 51.14
Andhra Pradesh 50.47 49.53 5125300 51.72 48.28 2557241 50.88
Arunachal Pradesh 52.15 47.85 191783 53.01 46.99 54714 52.34
Assam 50.67 49.33 3889636 49.86 50.14 1334075 50.46
Bihar 53.59 46.41 13890589 57.39 42.61 2767904 54.22
Chandigarh 51.12 48.88 15275 47.36 52.64 6618 49.98
Chhattisgarh 51.11 48.89 2766790 52.49 47.51 1014718 51.48
D & N Haveli 51.68 48.32 30678 57.47 42.53 7145 52.77
Daman & Diu 51.54 48.46 8293 55.24 44.76 3838 52.71
Delhi 49.99 50.01 356961 49.87 50.13 208994 49.94
Goa 51.74 48.26 61392 54.29 45.71 35001 52.67
Gujarat 52.95 47.05 4302342 54.47 45.53 1321505 53.30
Haryana 53.72 46.28 1596953 52.94 47.06 772834 53.46
Himachal Pradesh 52.37 47.63 595769 52.46 47.54 378117 52.40
Jammu & Kashmir 53.44 46.56 881898 55.26 44.74 449065 54.05
Jharkhand 51.12 48.88 5039244 54.27 45.73 1052646 51.66
Karnataka 51.59 48.41 3916962 52.06 47.94 1579373 51.73 Kerala 50.80 49.20 1777679 51.95 48.05 1214344 51.25
Lakshadweep 50.73 49.27 7124 53.27 46.73 3826 51.62
Madhya Pradesh 50.73 49.27 8919921 54.83 45.17 2825589 51.72
Maharashtra 52.73 47.27 6111226 53.03 46.97 3042176 52.83
Manipur 50.28 49.72 277876 51.22 48.78 87351 50.50
Meghalaya 50.05 49.95 398593 47.69 52.31 85991 49.63
Mizoram 51.97 48.03 105691 51.87 48.13 29889 51.95
Nagaland 50.53 49.47 183795 50.76 49.24 68656 50.59
Orissa 51.13 48.87 3936774 52.53 47.47 1693190 51.55
Puducherry 52.69 47.31 47999 54.04 45.96 29359 53.21
Punjab 53.95 46.05 1269075 54.14 45.86 763857 54.02
Rajasthan 53.16 46.84 7290863 59.84 40.16 2709443 54.97
Sikkim 50.46 49.54 79089 45.52 54.48 29714 49.11
Tamil Nadu 51.64 48.36 4250408 52.59 47.41 2461688 51.99
Tripura 51.71 48.29 408551 51.60 48.40 172571 51.68
Uttar Pradesh 50.65 49.35 22565874 51.61 48.39 6202731 50.86
Uttarakhand 50.81 49.19 910525 51.16 48.84 404146 50.92
West Bengal 50.87 49.13 7779294 50.27 49.73 2963039 50.70
All States 51.66 48.34 109013963 53.24 46.76 38255039 52.07
State/UT

7/30/2019 Analytical Tables 2007-08
http://slidepdf.com/reader/full/analytical-tables-2007-08 108/180
8 5
State/UT
Table 3.5 Percentage of Boys & Girls Enrolment in Primary & Upper Primary Classes : 2007-08 All Areas : All G
Classes I-V Classes VI-VIII Classe
Boys Girls Total Boys Girls Total Boys
A & N Islands 50.81 49.19 29892 52.54 47.46 19100 51.49
Andhra Pradesh 48.12 51.88 4451204 48.89 51.11 2370238 48.38
Arunachal Pradesh 51.45 48.55 204441 52.10 47.90 70493 51.61
Assam 50.52 49.48 3597656 50.46 49.54 1018907 50.50
Bihar 53.45 46.55 14404648 57.07 42.93 2945039 54.06
Chandigarh 54.98 45.02 60845 54.57 45.43 32951 54.83
Chhattisgarh 50.59 49.41 2791751 51.57 48.43 1044394 50.86
D & N Haveli 51.14 48.86 34291 56.61 43.39 8822 52.26
Daman & Diu 50.72 49.28 10719 52.82 47.18 5182 51.41
Delhi 50.72 49.28 1039616 50.55 49.45 578804 50.66
Goa 51.78 48.22 42414 54.17 45.83 10552 52.26
Gujarat 51.80 48.20 4641271 52.71 47.29 1390535 52.01
Haryana 52.00 48.00 1485990 50.05 49.95 686505 51.39
Himachal Pradesh 50.69 49.31 498907 51.28 48.72 353589 50.94
Jammu & Kashmir 51.00 49.00 676901 53.30 46.70 366884 51.81
Jharkhand 50.81 49.19 5048602 53.52 46.48 1070996 51.29
Karnataka 50.32 49.68 3837130 50.51 49.49 1608354 50.37
Kerala 50.39 49.61 754693 51.21 48.79 486343 50.71
Lakshadweep 50.73 49.27 7214 53.27 46.73 3826 51.62
Madhya Pradesh 49.14 50.86 8186460 52.34 47.66 2561616 49.91
Maharashtra 51.77 48.23 6253487 51.44 48.56 1492708 51.71
Manipur 48.59 51.41 173637 48.54 51.46 35565 48.58
Meghalaya 49.87 50.13 181998 49.69 50.31 26572 49.84
Mizoram 51.67 48.33 125093 51.13 48.87 38309 51.54
Nagaland 49.47 50.53 128654 49.47 50.53 41304 49.47
Orissa 50.85 49.15 4169999 52.38 47.62 1629476 51.28
Puducherry 48.48 51.52 48569 51.24 48.76 39654 49.72
Punjab 53.22 46.78 1314778 52.69 47.31 805130 53.02
Rajasthan 49.87 50.13 5883699 55.46 44.54 2065599 51.32 Sikkim 50.05 49.95 72921 45.20 54.80 30151 48.63
Tamil Nadu 50.38 49.62 2903299 50.61 49.39 1996596 50.47
Tripura 51.41 48.50 430472 50.42 49.58 101244 51.11
Uttar Pradesh 49.24 50.76 18590177 49.07 50.93 3918641 49.21
Uttarakhand 48.73 51.27 75217 48.47 51.53 326750 48.65
West Bengal 50.38 49.62 8314874 50.24 49.76 3228001 50.34
All States 50.64 40.36 101153420 51.69 48.31 32108650 50.90

7/30/2019 Analytical Tables 2007-08
http://slidepdf.com/reader/full/analytical-tables-2007-08 109/180
8 6 Table 3.6 Percentage of Boys & Girls Enrolment in Primary & Upper Primary Classes : 2007-08 All Areas
Classes I-V Classes VI-VIII
Boys Girls Total Boys Girls Total Boys
A & N Islands 53.37 48.63 6071 52.21 47.79 2440 53.04
Andhra Pradesh 54.91 45.09 2799275 55.69 44.31 1417669 55.17
Arunachal Pradesh 57.24 42.76 25720 58.36 41.64 8817 57.52
Assam 51.43 48.57 596211 48.62 51.38 489661 50.17
Bihar 53.18 46.82 224585 53.19 46.81 88533 53.18
Chandigarh 56.01 43.99 25405 57.08 42.92 15510 56.42
Chhattisgarh 54.90 45.10 389544 55.82 44.18 178010 55.19
D & N Haveli 59.75 40.25 5488 59.19 40.81 1426 59.63
Daman & Diu 62.38 37.62 2666 64.66 35.34 880 62.94
Delhi 57.80 42.20 517686 60.31 39.69 305140 58.73
Goa 51.34 48.66 51258 54.06 45.94 47430 52.65
Gujarat 59.28 40.72 1165556 60.62 39.38 465131 59.66
Haryana 59.88 40.12 483419 61.19 38.81 291373 60.37
Himachal Pradesh 58.96 41.04 160515 60.13 39.87 71029 59.32
Jammu & Kashmir 57.68 42.32 412794 57.99 42.01 204296 57.79
Jharkhand 53.44 46.56 363664 54.28 45.72 172386 53.71
Karnataka 54.23 45.77 1780260 54.50 45.50 696524 54.30 Kerala 50.38 49.62 1375046 51.00 49.00 908487 50.62
Lakshadweep - - - - - - -
Madhya Pradesh 58.12 43.88 3169816 57.66 42.34 1492808 56.61
Maharashtra 54.56 45.44 4067905 53.87 46.13 3843997 54.23
Manipur 51.97 48.03 179234 51.99 48.01 88245 51.98
Meghalaya 49.78 50.22 277691 47.02 52.98 89837 49.11
Mizoram 50.68 49.32 52617 50.48 49.52 19099 50.63
Nagaland 52.37 47.63 141204 52.33 47.67 76145 52.35
Orissa 57.33 42.67 221969 52.66 47.34 319418 54.58
Puducherry 52.02 47.98 59319 50.64 49.36 26964 51.59
Punjab 58.00 42.00 266532 58.55 41.45 172518 58.22
Rajasthan 61.29 38.71 2685583 65.04 34.96 1331552 62.53
Sikkim 53.16 46.84 14186 51.48 48.52 3980 52.79
Tamil Nadu 52.64 47.36 3220388 53.46 46.54 1722470 52.92
Tripura 54.94 45.06 34513 56.65 43.35 17844 55.52
Uttar Pradesh 55.22 44.78 6511730 54.56 45.44 3055835 55.01
Uttarakhand 57.45 42.55 299726 57.09 42.91 149319 57.33
West Bengal 54.72 45.28 1418856 51.20 48.80 579170 53.54
All States 55.33 44.67 32736432 55.35 44.65 18353943 55.34
State/UT

7/30/2019 Analytical Tables 2007-08
http://slidepdf.com/reader/full/analytical-tables-2007-08 110/180
8 7
Table 3.7 Percentage of Enrolment in Government Schools to Total Enrolment : 2007-08 Rura
School Category
State/UT Primary with Primary with Upper Upper Primary Upper PPrimary Only Upper Primary Primary & Sec./ Only with Se
Hr. Secondary Secon
A & N Islands 90.40 88.20 95.94 0.00 92.
Andhra Pradesh 75.37 66.84 34.61 0.00 76.
Arunachal Pradesh 95.57 89.26 81.88 45.55 73. Assam 90.48 81.83 8.47 60.91 77.
Bihar 66.68 98.05 47.33 97.00 86.
Chandigarh 100.00 96.55 97.36 0.00 100.
Chhattisgarh 95.27 44.37 27.31 96.21 89.
D & N Haveli 94.49 97.58 0.00 100.00 0.
Daman & Diu 91.85 100.00 16.79 100.00 100.
Delhi 89.81 4.09 44.97 76.80 94.
Goa 76.43 55.26 4.72 32.71 27.
Gujarat 90.18 90.77 19.33 24.32 15.
Haryana 96.89 44.28 30.13 86.96 73.
Himachal Pradesh 93.31 0.00 0.15 99.85 97.
Jammu & Kashmir 82.86 66.53 44.56 93.32 95.
Jharkhand 96.19 94.77 49.32 76.21 68.
Karnataka 80.02 82.77 26.88 58.43 27.
Kerala 36.21 34.49 47.25 23.24 34.
Lakshadweep 100.00 100.00 100.00 100.00 100.
Madhya Pradesh 90.23 - - 93.94 0.
Maharashtra 89.22 91.90 45.30 13.38 8.
Manipur 79.27 40.18 15.97 25.32 39.
Meghalaya 46.66 16.20 13.30 21.36 29.
Mizoram 93.36 28.37 0.00 93.67 19.
Nagaland 86.35 14.34 2.45 99.31 82.
Orissa 96.65 97.49 50.15 75.56 91.
Puducherry 86.75 70.63 29.23 - 100.
Punjab 97.11 2.17 2.19 98.89 92.
Rajasthan 89.89 64.45 11.16 85.80 95.
Sikkim 80.88 92.13 88.58 17.46 86.
Tamil Nadu 65.56 73.60 47.26 46.41 0.
Tripura 96.90 97.73 91.82 100.00 82.
Uttar Pradesh 79.10 7.82 8.95 66.73 8.
Uttarakhand 77.18 11.85 33.79 75.08 76.
West Bengal 92.10 8.46 64.16 85.82 89.
All States 86.50 78.05 34.60 72.11 64.

7/30/2019 Analytical Tables 2007-08
http://slidepdf.com/reader/full/analytical-tables-2007-08 111/180

7/30/2019 Analytical Tables 2007-08
http://slidepdf.com/reader/full/analytical-tables-2007-08 112/180

7/30/2019 Analytical Tables 2007-08
http://slidepdf.com/reader/full/analytical-tables-2007-08 113/180
9 0 Table 3.10 Enrolment of Children with Disability : 2007-08 All A
Classes I-V Classes VI-VIII
Boys Girls Total GPI* Boys Girls Total GPI* Boys
A & N Islands 139 84 223 0.60 87 77 164 0.89 226
Andhra Pradesh 30254 22080 52334 0.73 12804 9162 21966 0.72 43058 3
Arunachal Pradesh 1338 951 2289 0.71 244 185 429 0.76 1582
Assam 25537 19148 44685 0.75 4139 3295 7434 0.80 29676 2
Bihar 69347 46109 115456 0.66 14439 9232 23671 0.64 83780 5
Chandigarh 390 257 647 0.66 394 350 744 0.89 784
Chhattisgarh 55248 52614 107862 0.95 9657 7402 17059 0.77 64905 6
D & N Haveli 96 59 155 0.61 36 22 58 0.61 132
Daman & Diu 37 20 57 0.54 8 7 15 0.88 45
Delhi 2572 2539 5111 0.99 2997 4560 7557 1.52 5569
Goa 239 126 365 0.53 128 63 191 0.49 367
Gujarat 32155 21740 53895 0.68 10145 6615 16760 0.65 42300 2
Haryana 7992 5009 13001 0.63 3164 2178 5342 0.69 11156
Himachal Pradesh 4340 2955 7295 0.68 2469 1681 4150 0.68 6809
Jammu & Kashmir 7529 4509 12038 0.60 3143 1834 4977 0.58 10672
Jharkhand 16357 11607 27964 0.71 3971 2764 6735 0.70 20328
Karnataka 26279 17416 43695 0.66 11458 7612 19070 0.66 37737 2Kerala 27189 19780 46969 0.73 19479 15586 35065 0.80 46668 3
Lakshadweep 151 107 258 0.71 72 76 148 1.06 223
Madhya Pradesh 38614 28585 67199 0.74 16934 11528 28462 0.68 55548 4
Maharashtra 50787 36794 87581 0.72 18467 14480 32947 0.78 69254 5
Manipur 1055 817 1872 0.77 165 164 329 0.99 1220
Meghalaya 1436 1155 2591 0.80 257 325 582 1.26 1693
Mizoram 2225 1650 3875 0.74 512 497 1009 0.97 2737
Nagaland 634 501 1135 0.79 87 72 159 0.83 721
Orissa 41237 31143 72380 0.76 14410 11047 25457 0.77 55647 4
Puducherry 443 352 795 0.79 386 219 605 0.57 829
Punjab 4285 2706 6991 0.63 2599 2199 4798 0.85 6884
Rajasthan 76262 52456 128718 0.69 22269 13415 35684 0.60 98531 6
Sikkim 283 212 495 0.75 75 66 141 0.88 358
Tamil Nadu 24120 16860 40980 0.70 16918 12007 28925 0.71 41038 2
Tripura 1504 1023 2527 0.68 615 406 1021 0.66 2119
Uttar Pradesh 65426 47175 112601 0.72 20587 15990 36577 0.78 86013
Uttarakhand 3588 2536 6124 0.71 1111 779 1890 0.70 460
West Bengal 50043 35670 85713 0.71 15905 12449 28354 0.70 65948 4
All States 669131 486745 1155876 0.73 230131 168344 398475 0.73 899262 65
State/UT
*GPI: Gender Parity Index

7/30/2019 Analytical Tables 2007-08
http://slidepdf.com/reader/full/analytical-tables-2007-08 114/180
9 1
Table 3.11 Percentage Share of Enrolment in Pre-Primary Classes to Total Enrolment: 2007- 08 All A
School Category
Primary with Primary withPrimary Only Upper Primary Upper Primary
& Sec./Hr. Secondary
A & N Islands 14.65 8.19 3.20
Andhra Pradesh 7.60 7.92 8.97
Arunachal Pradesh 41.76 8.48 4.35 Assam 8.03 3.63 8.58
Bihar 4.98 4.19 6.51
Chandigarh 20.65 18.70 10.41
Chhattisgarh 8.79 17.32 24.42
D & N Haveli 2.28 0.32 7.07
Daman & Diu 8.76 62.20 12.53
Delhi 3.11 1.61 1.29
Goa 19.06 19.39 24.07
Gujarat 6.52 4.96 12.00
Haryana 11.25 8.98 8.08
Himachal Pradesh 4.50 33.51 21.70
Jammu & Kashmir 26.77 15.41 16.75
Jharkhand 1.52 1.23 3.96 Karnataka 10.10 5.23 13.65
Kerala 6.40 4.76 5.87
Lakshadweep 0.00 0.00 0.00
Madhya Pradesh 19.58 5.99 8.82
Maharashtra 17.25 8.15 10.51
Manipur 18.58 13.89 15.01
Meghalaya 80.18 46.26 24.70
Mizoram 19.41 23.40 17.01
Nagaland 55.74 21.09 19.54
Orissa 3.58 3.11 16.50
Puducherry 31.61 18.87 18.97
Punjab 6.78 19.38 13.98
Rajasthan 2.39 3.94 8.68 Sikkim 27.27 11.04 6.34
Tamil Nadu 9.56 2.52 11.90
Tripura 0.28 0.15 0.28
Uttar Pradesh 12.96 1.36 2.02
Uttarakhand 10.23 10.06 8.97
West Bengal 0.88 3.67 0.78
All States 10.01 5.14 9.70
State/UT

7/30/2019 Analytical Tables 2007-08
http://slidepdf.com/reader/full/analytical-tables-2007-08 115/180
9 2 Table 3.12 Percentage of Enrolment in Single-Teacher Schools : 2007-08 All A
School Category
Primary with Primary with Upper Upper Primary Upper PPrimary Only Upper Primary Primary & Sec./ Only with Se
Hr. Secondary Secon
A & N Islands 0.06 0.01 0.00 0.00 0.0
Andhra Pradesh 3.46 0.09 0.10 0.00 0.0
Arunachal Pradesh 35.22 0.73 0.00 0.00 0.0 Assam 24.07 1.09 5.52 0.26 1.3
Bihar 5.34 0.76 10.58 1.93 10.9
Chandigarh 0.00 0.00 0.00 0.00 0.0
Chhattisgarh 11.76 3.45 2.21 4.57 0.5
D & N Haveli 17.51 0.27 0.00 0.00 0.0
Daman & Diu 0.00 0.00 0.00 0.00 0.0
Delhi 0.00 0.00 0.00 0.00 0.0
Goa 10.14 0.65 0.03 0.00 0.0
Gujarat 1.98 0.15 0.52 2.15 1.2
Haryana 1.73 2.17 0.63 2.87 0.2
Himachal Pradesh 5.80 0.07 0.07 1.75 0.0
Jammu & Kashmir 5.61 0.02 0.00 0.00 0.0
Jharkhand 9.35 0.77 1.15 0.49 0.9Karnataka 11.11 1.70 4.03 3.86 5.9
Kerala 0.10 0.00 0.00 0.00 0.0
Lakshadweep 0.00 0.00 0.00 0.00 0.0
Madhya Pradesh 12.86 3.09 0.56 5.32 0.0
Maharashtra 1.77 0.06 0.06 0.24 0.1
Manipur 12.53 0.26 0.00 0.00 0.0
Meghalaya 12.40 0.21 0.17 1.10 0.3
Mizoram 1.73 0.08 0.00 1.82 5.0
Nagaland 1.65 0.36 0.00 0.68 0.0
Orissa 10.62 1.19 6.03 3.35 2.0
Puducherry 1.17 0.00 0.00 0.00 0.0
Punjab 7.63 1.66 0.16 2.98 0.7
Rajasthan 28.48 1.84 0.90 4.97 0.9Sikkim 0.35 0.00 0.00 0.00 0.0
Tamil Nadu 1.79 0.11 0.49 0.08 0.0
Tripura 1.10 0.53 0.00 0.00 0.0
Uttar Pradesh 2.10 0.93 1.50 9.59 0.8
Uttarakhand 10.84 1.93 2.30 4.18 1.6
West Bengal 2.03 0.00 0.00 0.05 0.0
All States 6.84 0.89 0.90 5.01 0.3
State/UT

7/30/2019 Analytical Tables 2007-08
http://slidepdf.com/reader/full/analytical-tables-2007-08 116/180
9 3
Table 3.13 Percentage of Enrolment in Schools with Student-Classroom Ratio ≥≥≥≥≥ 60 : 2007-08 All A
School Category
Primary with Primary with Upper Upper Primary Upper PPrimary Only Upper Primary Primary & Sec./ Only with Se
Hr. Secondary Secon
A & N Islands 4.33 2.79 9.54 0.00 0.
Andhra Pradesh 11.20 9.56 3.70 0.00 3.
Arunachal Pradesh 7.16 19.38 20.94 0.00 0. Assam 50.44 35.03 14.71 45.47 22.
Bihar 63.44 87.53 60.56 86.31 47.
Chandigarh 45.13 16.40 18.64 0.00 15.
Chhattisgarh 20.69 15.91 6.99 11.38 12.
D & N Haveli 10.02 22.77 17.92 0.00 0.
Daman & Diu 15.43 0.00 15.66 12.22 0.
Delhi 13.86 3.90 3.33 38.89 8.
Goa 2.88 9.00 5.45 5.10 0.
Gujarat 14.09 12.79 16.03 13.80 19.
Haryana 21.52 10.13 10.14 2.19 0.
Himachal Pradesh 1.12 0.72 2.37 6.27 7.
Jammu & Kashmir 2.58 7.47 2.57 0.00 2.
Jharkhand 28.89 61.60 30.53 22.62 14.Karnataka 11.06 12.28 13.70 16.56 18.
Kerala 2.79 2.62 3.99 0.99 2.
Lakshadweep 0.00 12.16 0.00 0.00 0.
Madhya Pradesh 21.60 37.77 21.35 19.81 16.
Maharashtra 18.68 19.23 12.31 15.43 11.
Manipur 3.89 3.46 10.41 0.00 0.
Meghalaya 7.94 4.84 13.73 6.12 10.
Mizoram 2.72 11.35 4.56 5.55 0.
Nagaland 3.91 28.09 17.95 16.30 6.
Orissa 9.25 14.97 10.08 26.74 9.
Puducherry 7.15 3.51 5.38 0.00 0.
Punjab 6.21 6.24 5.54 5.14 5.
Rajasthan 8.16 8.71 5.93 1.09 5.
Sikkim 0.00 6.69 3.11 0.00 0.
Tamil Nadu 4.76 8.12 17.06 24.60 0.
Tripura 3.83 19.56 38.13 0.00 2.
Uttar Pradesh 40.63 36.76 28.29 23.20 20.
Uttarakhand 17.46 11.82 10.00 9.18 4.
West Bengal 32.91 4.27 27.31 49.29 54.
All States 29.63 29.48 13.10 23.82 21.
State/UT

7/30/2019 Analytical Tables 2007-08
http://slidepdf.com/reader/full/analytical-tables-2007-08 117/180
9 4
*Total may not add to hundred because of rounding of figures.
Table 3.14 Percentage Distribution of Enrolment by Age & Grade : 2007-08 All A
Age in Class I Class II Class III Class IV Class V Class VI Class VII C
Completed
Years Boys Girls Boys Girls Boys Girls Boys Girls Boys Girls Boys Girls Boys Girls Boy
< 5 3.20 2.90
5 26.43 26.20 3.15 2.87
6 57.51 57.78 24.36 23.61
7 10.03 10.17 56.63 57.20 24.19 23.36
8 1.71 1.78 12.20 12.45 56.17 56.36 23.57 22.57
9 0.54 0.58 2.43 2.54 13.92 14.20 55.00 55.39 26.23 25.72
10 0.24 0.26 0.66 0.73 3.92 4.16 14.27 14.57 51.12 51.31 30.58 30.89
11 0.12 0.13 0.26 0.29 1.09 1.15 4.87 5.07 14.70 14.82 42.80 42.77 31.07 31.52
12 0.21 0.20 0.24 0.25 0.50 0.53 1.60 1.66 5.48 5.58 17.65 17.65 42.50 42.52 31.7
13 0.05 0.06 0.14 0.15 0.46 0.50 1.66 1.73 6.06 5.88 17.17 17.07 39.8
14 0.05 0.06 0.15 0.16 0.58 0.61 1.90 1.84 6.25 6.09 18.1
15 0.02 0.02 0.05 0.05 0.17 0.18 0.72 0.69 2.22 2.05 6.98
16 0.01 0.01 0.02 0.02 0.05 0.05 0.22 0.21 0.60 0.58 2.51
> 16 0.01 0.01 0.01 0.01 0.07 0.07 0.19 0.18 0.78
Total* 100 100 100 100 100 100 100 100 100 100 100 100 100 100 100

7/30/2019 Analytical Tables 2007-08
http://slidepdf.com/reader/full/analytical-tables-2007-08 118/180
9 5
* Total may not add to hundred because of rounding of figures.
Table 3.15 Percentage Distribution of Enrolment by Age & Grade : 2007-08 Rural A
Age in Class I Class II Class III Class IV Class V Class VI Class VII
Completed
Years Boys Girls Boys Girls Boys Girls Boys Girls Boys Girls Boys Girls Boys Girls Bo
< 5 2.92 2.61
5 24.70 24.54 2.82 2.54
6 59.26 59.44 22.48 21.77
7 10.32 10.48 58.24 58.73 22.01 21.27
8 1.72 1.80 12.76 13.01 57.52 57.62 21.50 20.59
9 0.54 0.57 2.53 2.64 14.47 14.74 56.22 56.52 24.50 24.07
10 0.23 0.25 0.66 0.73 4.17 4.42 14.82 15.11 52.00 52.09 29.01 29.43
11 0.11 0.12 0.25 0.29 1.12 1.18 5.30 5.30 15.18 15.30 42.98 42.95 29.50 30.13
12 0.19 0.19 0.23 0.23 0.49 0.52 1.72 1.72 5.69 5.82 18.54 18.58 42.60 42.56 30.1
13 0.05 0.06 0.14 0.16 0.53 0.53 1.78 1.85 6.32 6.09 18.09 17.98 39.9
14 0.05 0.06 0.17 0.17 0.61 0.63 2.05 1.95 6.64 6.45 19.0
15 0.02 0.02 0.05 0.05 0.17 0.18 0.78 0.71 2.31 2.10 7.3
16 0.01 0.01 0.02 0.02 0.05 0.05 0.24 0.22 0.64 0.60 2.6
> 16 0.01 0.01 0.08 0.07 0.20 0.18 0.8
Total* 100 100 100 100 100 100 100 100 100 100 100 100 100 100 10

7/30/2019 Analytical Tables 2007-08
http://slidepdf.com/reader/full/analytical-tables-2007-08 119/180
9 6
Table 3.16 Percentage Distribution of Enrolment by Age & Grade : 2007-08 Urban A
Age in Class I Class II Class III Class IV Class V Class VI Class VII C
Completed
Years Boys Girls Boys Girls Boys Girls Boys Girls Boys Girls Boys Girls Boys Girls Boy
< 5 4.84 4.62
5 36.25 36.02 4.96 4.73
6 47.32 47.79 34.55 33.81
7 8.48 8.42 47.70 48.35 35.18 34.28
8 1.72 1.69 9.36 9.50 48.88 49.29 33.49 32.38
9 0.59 0.62 2.01 2.10 11.38 11.57 48.66 49.26 33.76 32.97
10 0.30 0.35 0.70 0.76 2.79 2.97 11.83 12.13 46.79 47.32 36.04 35.87
11 0.17 0.18 0.33 0.35 0.96 1.05 4.08 4.13 12.85 12.90 41.90 41.96 36.21 35.84
12 0.32 0.30 0.33 0.34 0.57 0.60 1.30 1.44 4.71 4.72 14.54 14.50 41.92 42.22 36.8
13 0.06 0.06 0.15 0.15 0.41 0.44 1.22 1.32 5.26 5.26 14.18 14.21 38.9
14 0.05 0.06 0.14 0.15 0.47 0.55 1.46 1.53 5.05 5.04 15.3
15 0.02 0.02 0.06 0.06 0.16 0.17 0.57 0.64 1.99 1.96 5.8
16 0.01 0.01 0.02 0.02 0.04 0.05 0.16 0.17 0.48 0.55 2.2
>16 0.01 0.01 0.01 0.01 0.06 0.06 0.15 0.18 0.6
Total* 100 100 100 100 100 100 100 100 100 100 100 100 100 100 10
* Total may not add to hundred because of rounding of figures

7/30/2019 Analytical Tables 2007-08
http://slidepdf.com/reader/full/analytical-tables-2007-08 120/180
9 7
Table 3.17 Percentage of Under-Age & Over-Age Children : 2007-08 All A
Primary Level Upper Prima
Under-Age Over-Age Under-Age
Boys Girls Total Boys Girls Total Boys Girls Total
A & N Islands 6.92 6.62 6.77 13.44 13.70 13.57 6.65 6.41 6.53
Andhra Pradesh 17.09 16.97 17.03 2.52 2.47 2.50 22.71 21.66 22.18
Arunachal Pradesh 16.74 16.74 16.74 10.64 10.98 10.80 5.62 4.63 5.12 Assam 5.60 5.44 5.52 6.50 6.64 6.57 6.13 6.21 6.17
Bihar 2.55 2.59 2.57 4.15 4.17 4.16 5.03 3.59 4.31
Chandigarh 7.03 7.90 7.42 9.62 9.41 9.52 8.76 7.58 8.17
Chhattisgarh 2.60 2.57 2.59 13.14 13.06 13.10 3.15 2.86 3.01
D & N Haveli 12.25 11.95 12.11 12.39 11.86 12.13 14.05 11.48 12.76
Daman & Diu 6.70 7.01 6.95 14.47 11.39 13.03 8.36 6.28 7.32
Delhi 15.67 14.77 15.25 8.44 9.53 8.95 13.52 10.01 11.76
Goa 1.92 1.87 1.90 10.07 8.38 9.25 2.85 2.82 2.83
Gujarat 13.20 12.97 13.09 6.50 6.31 6.41 20.58 17.50 19.04
Haryana 10.43 10.20 10.32 8.52 9.05 8.76 10.54 8.88 9.71
Himachal Pradesh 13.63 13.63 13.63 5.23 5.03 5.13 10.51 9.24 9.88
Jammu & Kashmir 15.42 15.39 15.40 3.97 4.08 4.02 19.57 16.17 17.87
Jharkhand 12.28 12.51 12.40 5.81 5.76 5.78 14.10 12.45 13.28 Karnataka 3.62 3.67 3.65 1.83 1.77 1.80 7.77 7.43 7.60
Kerala 12.12 12.61 12.36 2.85 2.18 2.52 16.38 17.03 16.70
Lakshadweep 9.13 8.92 9.03 9.44 6.98 8.23 5.40 4.32 4.86
Madhya Pradesh 11.38 11.00 11.19 11.31 11.87 11.58 5.98 4.83 5.41
Maharashtra 7.17 7.30 7.23 8.52 8.24 8.39 7.26 6.66 6.96
Manipur 5.76 5.99 5.87 4.90 4.87 4.89 6.14 5.98 6.06
Meghalaya 7.10 6.74 6.92 15.04 16.92 15.98 7.69 8.12 7.90
Mizoram 3.91 3.95 3.93 16.95 16.92 16.93 4.08 3.93 4.01
Nagaland 4.08 3.67 3.88 11.92 12.78 12.34 4.94 4.60 4.77
Orissa 17.03 17.23 17.12 2.81 2.86 2.83 26.50 24.65 25.58
Puducherry 18.85 19.80 19.32 1.68 1.48 1.58 22.37 23.17 22.77
Punjab 9.15 9.38 9.26 12.93 12.02 12.52 5.71 5.18 5.45
Rajasthan 13.87 13.01 13.47 12.00 12.67 12.31 8.04 5.86 6.95
Sikkim 4.83 4.45 4.64 31.38 32.05 31.71 5.08 4.96 5.02
Tamil Nadu 15.65 15.84 15.74 1.31 1.19 1.25 18.37 17.43 17.90
Tripura 0.17 0.17 0.17 7.25 7.14 7.19 0.86 0.71 0.78
Uttar Pradesh 3.87 3.43 3.65 3.62 3.74 3.68 12.19 11.59 11.89
Uttarakhand 12.37 11.85 12.12 3.35 3.99 3.66 15.30 14.42 14.86
West Bengal 13.00 12.85 12.92 6.12 6.79 6.45 14.53 13.68 14.11
All States 9.03 8.87 8.95 6.08 6.17 6.13 12.05 10.96 11.51
State/UT

7/30/2019 Analytical Tables 2007-08
http://slidepdf.com/reader/full/analytical-tables-2007-08 121/180

7/30/2019 Analytical Tables 2007-08
http://slidepdf.com/reader/full/analytical-tables-2007-08 122/180

7/30/2019 Analytical Tables 2007-08
http://slidepdf.com/reader/full/analytical-tables-2007-08 123/180

7/30/2019 Analytical Tables 2007-08
http://slidepdf.com/reader/full/analytical-tables-2007-08 124/180

7/30/2019 Analytical Tables 2007-08
http://slidepdf.com/reader/full/analytical-tables-2007-08 125/180
1 0 3
*Total may not add to hundred because of rounding of figures & no responses.
Table 4.1 Percentage Distribution of Teachers by School Category : 2007-08 All A
School Category
State/UT Primary with Primary with Upper Primary Upper PrimaryPrimary Only Upper Primary Upper Primary Only with Sec./Hr.
& Sec./Hr. Sec. Secondary
A & N Islands 24.61 25.13 42.04 0.30 7.92
Andhra Pradesh 37.87 26.23 2.38 0.00 33.52
Arunachal Pradesh 44.53 37.84 13.97 0.42 3.23
Assam 49.10 4.89 2.32 28.29 15.40
Bihar 56.63 41.11 1.05 0.47 0.74
Chandigarh 7.47 7.83 74.34 0.51 9.86
Chhattisgarh 54.45 7.53 9.45 23.30 5.27
D & N Haveli 27.63 61.84 8.92 0.88 0.73
Daman & Diu 42.90 10.06 22.49 14.79 9.02
Delhi 29.37 7.97 41.50 1.48 19.68
Goa 32.50 9.45 27.15 3.08 27.82
Gujarat 18.49 76.41 3.71 0.83 0.57
Haryana 36.58 10.17 18.19 5.97 29.09
Himachal Pradesh 48.32 5.67 10.27 16.85 18.89
Jammu & Kashmir 29.77 46.51 21.14 0.37 2.21 Jharkhand 43.18 45.93 4.91 0.68 5.30
Karnataka 27.49 65.24 4.96 0.93 1.38
Kerala 28.00 26.71 14.98 6.72 23.53
Lakshadweep 36.91 26.36 15.45 2.91 18.36
Madhya Pradesh 54.07 17.78 5.00 21.71 1.45
Maharashtra 25.38 39.31 7.65 0.25 27.41
Manipur 33.08 28.67 30.55 1.41 6.30
Meghalaya 56.16 9.54 7.64 21.38 5.28
Mizoram 41.71 19.06 4.84 33.53 0.85
Nagaland 45.80 16.71 18.27 11.36 7.86
Orissa 38.73 30.71 2.97 4.71 3.83
Puducherry 19.78 16.77 49.39 0.00 14.06
Punjab 46.15 3.17 8.07 14.78 27.83 Rajasthan 29.82 48.67 13.14 0.28 8.09
Sikkim 48.00 24.25 26.47 0.33 0.74
Tamil Nadu 41.62 21.64 12.97 23.69 0.08
Tripura 27.50 26.93 42.73 0.04 2.80
Uttar Pradesh 70.90 5.85 0.73 20.96 1.57
Uttarakhand 58.30 6.21 3.16 20.89 11.43
West Bengal 62.97 0.19 1.32 3.59 31.90
All States* 43.40 27.50 7.28 9.12 11.93

7/30/2019 Analytical Tables 2007-08
http://slidepdf.com/reader/full/analytical-tables-2007-08 126/180
1 0 4 Table 4.2 Percentage Distribution of Teachers by School Category : 2007-08 Rural A
School Category
State/UT Primary with Primary with Upper Primary Upper PPrimary Only Upper Primary Upper Primary Only with Se
& Sec./Hr. Sec. Secon
A & N Islands 29.14 25.71 37.49 0.39 7.27
Andhra Pradesh 40.12 28.03 1.27 0.00 30.58 Arunachal Pradesh 48.53 34.86 13.06 0.45 3.11
Assam 49.16 4.97 1.88 29.26 14.73
Bihar 57.84 40.06 0.98 0.44 0.68
Chandigarh 18.98 9.57 66.98 0.00 4.48
Chhattisgarh 58.14 5.83 6.46 25.09 4.49
D & N Haveli 31.76 62.02 5.09 1.13 0.00
Daman & Diu 47.37 10.53 17.04 17.79 6.02
Delhi 35.08 6.78 34.45 1.25 22.44
Goa 34.78 9.94 26.10 3.92 25.25
Gujarat 19.72 77.12 2.20 0.55 0.41
Haryana 39.42 9.25 14.92 6.67 29.74
Himachal Pradesh 50.19 5.25 7.59 17.91 19.07
Jammu & Kashmir 33.85 48.02 15.30 0.36 2.47
Jharkhand 46.43 45.88 2.87 0.60 4.23
Karnataka 31.79 64.89 1.72 0.71 0.89
Kerala 29.17 27.43 14.62 7.13 21.65
Lakshadweep 36.91 26.36 15.45 2.91 18.36
Madhya Pradesh 62.55 11.21 1.60 24.12 0.52
Maharashtra 27.21 41.23 5.72 0.20 25.64
Manipur 36.80 28.86 28.14 1.35 4.85
Meghalaya 59.12 9.13 5.10 22.48 4.17
Mizoram 47.91 12.11 1.83 37.71 0.43
Nagaland 52.51 15.54 11.28 12.64 8.03
Orissa 39.61 30.94 1.58 4.97 2.63
Puducherry 21.20 17.68 49.79 0.00 11.33
Punjab 49.09 2.30 4.04 16.43 28.14
Rajasthan 33.78 48.48 8.93 0.27 8.54Sikkim 49.39 24.29 25.19 0.35 0.78
Tamil Nadu 45.37 24.22 12.64 17.67 0.11
Tripura 29.81 29.28 38.58 0.04 2.30
Uttar Pradesh 72.47 4.12 0.55 21.41 1.45
Uttarakhand 59.40 4.98 2.31 22.00 11.31
West Bengal 66.11 0.16 0.90 3.80 29.03
All States 47.44 26.64 4.81 9.65 10.55

7/30/2019 Analytical Tables 2007-08
http://slidepdf.com/reader/full/analytical-tables-2007-08 127/180
1 0 5
Table 4.3 Average Number of Teachers per School by School Category : 2007-08 All A
School Category
State/UT Primary with Primary with Upper Primary Upper PPrimary Only Upper Primary Upper Primary Only with Se
& Sec./Hr. Sec. Secon
A & N Islands 4.63 13.51 23.62 11.00 12.1
Andhra Pradesh 3.01 7.55 25.22 0.00 10.4
Arunachal Pradesh 1.89 8.99 13.70 6.00 11.4 Assam 2.35 9.25 10.09 6.80 8.9
Bihar 3.73 8.08 5.60 7.57 5.2
Chandigarh 14.71 19.64 36.96 28.00 38.8
Chhattisgarh 2.57 5.60 6.79 3.14 7.6
D & N Haveli 2.15 7.98 21.83 12.00 10.0
Daman & Diu 5.76 8.20 13.91 7.14 8.8
Delhi 12.20 13.96 41.86 16.96 33.0
Goa 2.50 7.48 12.36 9.83 11.1
Gujarat 3.39 7.22 9.97 5.29 6.1
Haryana 4.07 6.25 9.51 4.56 9.9
Himachal Pradesh 2.67 6.50 7.75 4.45 6.4
Jammu & Kashmir 2.71 7.56 11.10 7.24 7.5
Jharkhand 2.22 6.03 12.25 4.77 7.5
Karnataka 2.47 6.64 10.77 5.51 9.4
Kerala 6.70 17.55 24.19 13.76 27.0
Lakshadweep 12.69 16.33 21.25 16.00 14.4
Madhya Pradesh 2.58 7.58 11.45 3.55 10.9
Maharashtra 3.30 7.84 12.08 8.59 11.6
Manipur 3.20 10.04 13.74 6.35 11.8
Meghalaya 2.47 6.50 9.62 4.51 6.6
Mizoram 4.51 9.94 14.00 6.31 4.9
Nagaland 5.86 10.89 14.93 9.77 12.1
Orissa 2.51 5.06 10.72 2.56 9.0
Puducherry 6.06 12.93 21.21 0.00 27.0
Punjab 2.74 6.91 9.06 5.05 6.9
Rajasthan 2.20 6.13 8.74 4.00 5.8
Sikkim 5.01 11.11 14.70 9.33 12.4
Tamil Nadu 3.78 7.60 9.07 15.38 6.0
Tripura 3.97 8.17 20.56 11.00 11.6
Uttar Pradesh 3.57 5.55 5.94 3.18 5.7
Uttarakhand 2.40 5.05 6.05 3.74 4.5
West Bengal 2.93 1.10 5.36 6.33 11.5
All States 3.01 7.07 11.53 4.38 10.2

7/30/2019 Analytical Tables 2007-08
http://slidepdf.com/reader/full/analytical-tables-2007-08 128/180
1 0 6 Table 4.4 Average Number of Teachers per School by School Category : 2007-08 All Areas : All Go
School Category
State/UT Primary with Primary with Upper Primary Upper PriPrimary Only Upper Primary Upper Primary Only with Sec.
& Sec./Hr. Sec. Seconda
A & N Islands 4.41 13.43 23.43 0.00 11.8
Andhra Pradesh 2.46 6.84 17.33 0.00 10.6
Arunachal Pradesh 1.76 8.54 13.70 5.80 11.5 Assam 2.35 9.72 10.32 7.30 9.5
Bihar 3.73 8.16 6.28 7.70 5.1
Chandigarh 13.30 24.11 35.91 28.00 28.1
Chhattisgarh 2.48 3.66 4.37 3.09 7.5
D & N Haveli 1.99 7.94 0.00 12.00 10.0
Daman & Diu 5.56 8.63 9.80 7.14 9.0
Delhi 12.81 16.05 46.34 17.43 34.1
Goa 2.17 6.66 8.00 8.44 9.2
Gujarat 3.15 6.91 7.33 6.96 4.6
Haryana 4.02 5.17 8.21 4.38 9.9
Himachal Pradesh 2.53 7.67 8.78 4.45 6.4
Jammu & Kashmir 2.37 6.88 9.35 7.28 7.4
Jharkhand 2.18 5.91 10.49 4.32 7.0Karnataka 2.19 6.35 8.86 5.64 8.1
Kerala 5.95 14.96 21.31 16.90 24.6
Lakshadweep 12.69 16.33 21.25 16.00 14.4
Madhya Pradesh 2.38 10.10 17.38 3.37 12.8
Maharashtra 2.75 7.45 11.86 7.67 8.2
Manipur 3.20 9.83 13.78 7.68 13.9
Meghalaya 2.46 6.26 8.31 4.92 8.0
Mizoram 4.49 8.37 14.33 6.31 2.6
Nagaland 5.80 12.42 15.17 9.70 12.1
Orissa 2.45 4.92 9.57 2.79 9.3
Puducherry 5.93 13.59 21.56 0.00 27.4
Punjab 2.69 6.54 10.74 5.05 6.8
Rajasthan 2.04 5.61 6.95 3.84 5.7Sikkim 4.99 11.59 14.91 9.50 12.4
Tamil Nadu 2.77 6.48 6.11 12.05 6.0
Tripura 3.86 8.05 20.42 11.00 10.7
Uttar Pradesh 3.44 4.37 4.79 2.80 5.7
Uttarakhand 2.13 4.22 6.13 3.67 4.5
West Bengal 3.38 9.53 12.83 7.70 12.0
All States 2.81 6.68 11.19 3.79 9.5

7/30/2019 Analytical Tables 2007-08
http://slidepdf.com/reader/full/analytical-tables-2007-08 129/180
1 0 7
Table 4.5 Average Number of Teachers per School by School Category : 2007-08 All Areas : A
School Category
State/UT Primary with Primary with Upper Primary Upper PPrimary Only Upper Primary Upper Primary Only with Se
& Sec./Hr. Sec. Secon
A & N Islands 6.36 13.85 27.67 11.00 14.3
Andhra Pradesh 6.80 8.96 36.82 0.00 10.2
Arunachal Pradesh 6.89 11.87 13.71 8.00 9.5 Assam 2.34 7.93 10.06 6.28 8.1
Bihar 3.28 5.72 5.13 5.36 6.0
Chandigarh 18.25 16.54 39.08 0.00 46.8
Chhattisgarh 4.53 7.80 10.13 4.81 8.0
D & N Haveli 4.70 9.33 21.83 0.00 0.0
Daman & Diu 8.33 6.50 18.20 0.00 0.0
Delhi 9.83 13.64 38.92 15.43 28.3
Goa 5.78 11.11 12.98 10.67 11.9
Gujarat 5.61 9.10 10.72 4.58 6.3
Haryana 5.00 7.80 10.36 7.62 9.9
Himachal Pradesh 4.46 6.50 7.71 4.00 5.7
Jammu & Kashmir 5.56 9.17 12.65 5.00 8.0
Jharkhand 3.57 7.71 13.96 9.61 8.9Karnataka 4.44 7.61 11.24 5.38 10.2
Kerala 7.25 19.45 27.30 13.02 28.4
Lakshadweep - - - -
Madhya Pradesh 4.54 7.57 11.35 6.11 10.8
Maharashtra 7.54 10.13 12.16 8.83 12.1
Manipur 3.17 10.22 13.72 5.64 8.2
Meghalaya 2.48 6.54 9.93 4.42 6.3
Mizoram 4.73 10.61 13.96 6.30 9.7
Nagaland 6.42 10.47 14.92 14.00 12.1
Orissa 4.65 8.20 11.55 2.04 6.6
Puducherry 6.55 12.06 21.00 0.00 11.0
Punjab 4.54 6.97 8.65 5.04 7.6
Rajasthan 4.35 7.31 9.02 6.05 7.2
Sikkim 5.08 8.91 13.17 9.00 0.0
Tamil Nadu 6.14 10.84 11.80 17.73 0.0
Tripura 8.33 12.00 21.94 0.00 15.0
Uttar Pradesh 4.06 5.73 6.22 4.33 5.7
Uttarakhand 4.06 5.27 5.98 4.11 4.5
West Bengal 0.48 0.80 2.08 3.02 9.2
All States 4.47 8.13 11.70 6.49 11.1

7/30/2019 Analytical Tables 2007-08
http://slidepdf.com/reader/full/analytical-tables-2007-08 130/180
1 0 8 Table 4.6 Percentage of Female Teachers by School Category : 2007-08 All A
School Category
State/UT Primary with Primary with Upper Primary Upper PPrimary Only Upper Primary Upper Primary Only with Se
& Sec./Hr. Sec. Secon
A & N Islands 57.66 59.40 56.10 72.73 55.8
Andhra Pradesh 48.11 45.08 64.33 0.00 39.7
Arunachal Pradesh 37.32 37.44 30.67 34.85 22.0 Assam 35.49 34.18 48.77 20.42 26.9
Bihar 38.78 34.43 17.97 26.28 10.4
Chandigarh 78.88 84.26 80.67 92.86 84.3
Chhattisgarh 31.05 48.41 44.38 28.29 30.2
D & N Haveli 44.44 57.09 81.15 41.67 60.0
Daman & Diu 73.10 57.35 67.11 45.00 44.2
Delhi 68.60 81.47 74.71 52.35 46.2
Goa 83.72 78.56 82.10 60.17 63.7
Gujarat 49.10 53.47 71.17 56.18 65.0
Haryana 47.29 50.06 50.98 36.11 42.9
Himachal Pradesh 45.70 63.06 60.55 24.76 32.1
Jammu & Kashmir 41.00 41.89 52.61 55.53 25.1
Jharkhand 26.99 28.33 36.36 69.29 26.2
Karnataka 47.91 54.01 72.94 52.70 49.9
Kerala 74.37 69.66 73.46 70.59 69.7
Lakshadweep 40.89 43.45 41.18 12.50 37.6
Madhya Pradesh 32.12 52.43 61.97 30.42 61.0
Maharashtra 47.23 45.90 50.37 40.17 32.0
Manipur 41.26 41.85 43.21 35.53 48.3
Meghalaya 51.66 61.46 68.70 38.88 49.7
Mizoram 49.00 52.88 54.94 27.04 35.2
Nagaland 42.48 44.49 54.89 26.56 34.2
Orissa 37.08 37.38 50.21 20.97 36.7
Puducherry 64.85 62.73 63.47 0.00 45.9
Punjab 65.10 74.55 76.46 49.65 53.7
Rajasthan 29.29 29.82 31.61 50.71 21.2
Sikkim 45.21 41.49 48.02 50.00 48.3Tamil Nadu 78.48 68.65 72.56 71.16 99.2
Tripura 20.64 20.42 30.26 63.64 23.3
Uttar Pradesh 39.83 38.01 33.85 25.72 13.5
Uttarakhand 54.36 58.40 54.11 31.12 23.3
West Bengal 29.36 32.53 44.15 34.84 37.6
All States 42.30 45.12 55.79 35.36 37.9

7/30/2019 Analytical Tables 2007-08
http://slidepdf.com/reader/full/analytical-tables-2007-08 131/180
1 0 9
Table 4.7 Pupil-Teacher Ratio by School Category : 2007-08 All A
School Category
State/UT Primary with Primary with Upper Primary Upper PPrimary Only Upper Primary Upper Primary Only with Se
& Sec./Hr. Sec. Secon
A & N Islands 14 15 16 22 19
Andhra Pradesh 26 21 19 0 17
Arunachal Pradesh 18 21 23 15 15 Assam 28 18 19 20 18
Bihar 50 59 55 53 38
Chandigarh 35 21 24 26 21
Chhattisgarh 34 23 16 26 14
D & N Haveli 32 38 39 8 54
Daman & Diu 29 27 37 22 28
Delhi 34 26 19 26 18
Goa 18 17 25 16 17
Gujarat 29 33 35 34 35
Haryana 36 26 28 19 20
Himachal Pradesh 17 12 24 12 19
Jammu & Kashmir 13 15 19 11 13
Jharkhand 45 50 34 30 22
Karnataka 24 33 34 35 28
Kerala 23 24 21 22 18
Lakshadweep 21 21 20 23 15
Madhya Pradesh 40 32 29 31 25
Maharashtra 30 30 26 23 23
Manipur 20 17 24 12 8
Meghalaya 18 14 24 12 20
Mizoram 15 18 19 11 9
Nagaland 14 25 31 13 19
Orissa 30 37 33 36 23
Puducherry 20 20 20 0 10
Punjab 36 35 48 18 28
Rajasthan 31 29 28 21 20
Sikkim 9 16 23 9 15
Tamil Nadu 27 35 31 35 8
Tripura 18 25 22 15 17
Uttar Pradesh 52 55 56 42 44
Uttarakhand 27 28 38 18 25
West Bengal 44 147 73 48 55
All States 37 34 27 31 25

7/30/2019 Analytical Tables 2007-08
http://slidepdf.com/reader/full/analytical-tables-2007-08 132/180
1 1 0 Table 4.8 Percentage of Schools having Pupil-Teacher Ratio > 100 : 2007-08* All A
School Category
State/UT Primary with Primary with Upper Primary Upper PPrimary Only Upper Primary Upper Primary Only with Se
& Sec./Hr. Sec. Secon
A & N Islands 0.00 0.00 0.00 0.00 0.0
Andhra Pradesh 0.26 0.17 1.23 0.00 0.0
Arunachal Pradesh 0.60 0.91 0.00 0.00 0.0 Assam 4.80 2.03 6.47 0.45 1.6
Bihar 10.21 14.68 15.86 9.36 14.9
Chandigarh 3.57 0.00 0.00 0.00 0.0
Chhattisgarh 2.57 1.63 1.11 0.98 0.4
D & N Haveli 0.00 0.00 0.00 0.00 0.0
Daman & Diu 0.00 0.00 18.18 0.00 0.0
Delhi 0.77 0.00 0.50 0.00 0.1
Goa 0.00 0.00 0.00 0.00 0.0
Gujarat 0.41 0.20 1.03 2.17 1.3
Haryana 1.23 2.15 2.32 0.43 0.8
Himachal Pradesh 0.03 0.00 2.26 0.04 0.2
Jammu & Kashmir 0.02 0.03 0.15 0.00 0.0
Jharkhand 4.43 5.36 6.90 2.35 2.5
Karnataka 1.26 2.27 7.69 4.58 8.6
Kerala 0.07 0.04 0.00 0.00 0.1
Lakshadweep 0.00 0.00 0.00 0.00 0.0
Madhya Pradesh 4.46 8.72 6.28 2.32 3.5
Maharashtra 0.33 0.24 0.81 0.58 0.3
Manipur 0.82 0.42 1.45 0.00 0.0
Meghalaya 0.28 0.00 0.73 0.18 0.0
Mizoram 0.33 0.00 0.00 0.46 0.0
Nagaland 0.50 2.24 4.02 0.42 0.7
Orissa 1.10 2.08 13.33 1.03 5.3
Puducherry 0.33 0.00 0.00 0.00 0.0
Punjab 3.15 5.46 9.44 0.69 1.7
Rajasthan 2.65 2.06 2.50 0.33 0.8
Sikkim 0.00 0.54 0.66 0.00 0.0Tamil Nadu 0.36 0.50 3.20 3.83 0.0
Tripura 0.70 1.46 0.00 0.00 0.0
Uttar Pradesh 11.40 19.69 19.49 9.93 11.1
Uttarakhand 1.60 3.63 11.71 1.22 2.2
West Bengal 2.00 0.19 3.08 3.10 8.3
All States 4.11 3.31 3.39 4.65 1.9
* In schools having one or more teachers.

7/30/2019 Analytical Tables 2007-08
http://slidepdf.com/reader/full/analytical-tables-2007-08 133/180
1 1 1
Table 4.9 Teachers by Academic Qualification & School Category : 2007-08(Excluding Para-Teachers) All
School Category
State/UT Academic Primary with Primary with Upper Primary UpperQualification Primary Only Upper Primary Upper Primary Only with
& Sec./Hr. Sec. Seco
A & N Islands
Below Secondary 3.23 0.34 1.11 0.00 3
Secondary 7.68 26.71 6.01 0.00 2
Higher Secondary 60.47 26.71 31.35 22.22 13
Graduate 20.04 31.31 43.89 55.56 52
Post Graduate 8.13 14.16 16.46 22.22 27
M.Phil. or Ph.D. 0.22 0.34 0.46 0.00 0
Others 0.22 0.43 0.46 0.00 0
Andhra Pradesh
Below Secondary 0.54 0.35 0.51 0.00 0
Secondary 3.83 12.51 4.91 0.00 2
Higher Secondary 18.25 12.51 4.03 0.00 5
Graduate 56.68 54.46 42.80 0.00 56
Post Graduate 20.15 19.38 45.26 0.00 32
M.Phil. or Ph.D. 0.29 0.35 1.86 0.00 0
Others 0.27 0.45 0.64 0.00 0
Arunachal Pradesh
Below Secondary 2.40 1.11 0.72 0.00 0
Secondary 5.61 22.34 2.48 0.00 1
Higher Secondary 44.22 22.34 17.06 11.67 6
Graduate 41.84 43.58 54.23 61.67 48
Post Graduate 5.72 10.26 24.56 26.67 42
M.Phil. or Ph.D. 0.18 0.18 0.57 0.00 0
Others 0.04 0.18 0.38 0.00 1
AssamBelow Secondary 10.32 2.11 2.03 1.80 0
Secondary 56.58 28.03 7.01 11.27 4
Higher Secondary 24.21 28.03 18.57 44.90 11
Graduate 8.25 38.64 61.99 40.04 76
Post Graduate 0.38 2.61 8.59 1.15 5
M.Phil. or Ph.D. 0.08 0.18 0.34 0.10 0
Others 0.16 0.38 1.40 0.74 1

7/30/2019 Analytical Tables 2007-08
http://slidepdf.com/reader/full/analytical-tables-2007-08 134/180
1 1 2 Table 4.9 Teachers by Academic Qualification & School Category : 2007-08
(Excluding Para-Teachers) All A
School Category
State/UT Academic Primary with Primary with Upper Primary Upper PQualification Primary Only Upper Primary Upper Primary Only with Se
& Sec./Hr. Sec. Secon
Bihar Below Secondary 1.56 0.81 2.85 0.54 1.2
Secondary 15.60 26.22 12.57 10.83 5.0
Higher Secondary 46.04 26.22 25.16 23.09 9.0
Graduate 28.28 32.12 31.28 43.19 43.3
Post Graduate 7.58 13.84 25.07 21.46 39.1
M.Phil. or Ph.D. 0.60 0.50 1.21 0.61 1.3
Others 0.34 0.29 1.86 0.27 0.7
Chandigarh
Below Secondary 0.98 2.67 0.39 0.00 0.1
Secondary 10.24 4.13 4.95 28.57 2.7
Higher Secondary 8.29 4.13 3.94 3.57 1.5
Graduate 40.49 40.29 36.28 21.43 49.0Post Graduate 38.29 45.15 51.55 46.43 43.2
M.Phil. or Ph.D. 1.46 3.40 2.36 0.00 2.3
Others 0.24 0.24 0.52 0.00 0.9
Chhattisgarh
Below Secondary 2.80 2.97 1.59 1.07 1.1
Secondary 4.58 25.36 2.65 1.99 2.3
Higher Secondary 46.59 25.36 15.70 13.37 11.4
Graduate 24.13 24.10 33.78 35.39 27.7
Post Graduate 21.51 21.58 44.89 47.62 56.4
M.Phil. or Ph.D. 0.18 0.20 0.59 0.36 0.6
Others 0.14 0.24 0.46 0.12 0.1
D & N HaveliBelow Secondary 3.98 1.56 27.87 0.00 0.0
Secondary 20.69 30.20 4.92 0.00 20.0
Higher Secondary 36.87 30.20 12.30 0.00 10.0
Graduate 28.65 25.27 42.62 33.33 40.0
Post Graduate 9.81 12.52 10.66 58.33 20.0
M.Phil. or Ph.D. 0.00 0.12 0.00 8.33 10.0
Others 0.00 0.00 1.64 0.00 0.0

7/30/2019 Analytical Tables 2007-08
http://slidepdf.com/reader/full/analytical-tables-2007-08 135/180
1 1 3
Table 4.9 Teachers by Academic Qualification & School Category : 2007-08(Excluding Para-Teachers) All A
School Category
State/UT Academic Primary with Primary with Upper Primary UpperQualification Primary Only Upper Primary Upper Primary Only with S
& Sec./Hr. Sec. Seco
Daman & Diu
Below Secondary 7.07 1.33 3.60 4.04 0.
Secondary 44.17 21.33 8.63 21.21 29.
Higher Secondary 18.02 21.33 15.83 8.08 11.
Graduate 20.14 26.67 46.04 34.34 37.
Post Graduate 7.07 24.00 25.90 24.24 21.
M.Phil. or Ph.D. 0.00 0.00 0.00 0.00 0.
Others 2.12 0.00 0.00 3.03 0.
Delhi
Below Secondary 3.39 3.05 2.64 3.83 3.
Secondary 2.23 5.83 2.11 1.54 3.
Higher Secondary 15.70 5.83 4.29 2.69 3.
Graduate 43.40 47.03 34.69 29.35 23.Post Graduate 33.44 35.99 52.30 59.23 60.
M.Phil. or Ph.D. 0.82 0.63 2.30 2.08 2.
Others 1.01 1.64 1.67 1.28 2.
Goa
Below Secondary 6.12 8.06 2.76 0.00 2.
Secondary 54.73 17.38 22.60 18.18 13.
Higher Secondary 13.62 17.38 14.06 4.76 7.
Graduate 19.86 40.32 46.41 52.81 53.
Post Graduate 5.42 16.85 13.87 23.81 23.
M.Phil. or Ph.D. 0.08 0.00 0.10 0.43 0.
Others 0.16 0.00 0.19 0.00 0.
GujaratBelow Secondary 6.98 6.26 3.56 6.41 6.
Secondary 45.14 32.21 17.80 35.28 19.
Higher Secondary 26.69 32.21 17.70 21.10 16.
Graduate 13.62 20.04 42.08 24.86 41.
Post Graduate 6.62 8.28 17.36 11.83 15.
M.Phil. or Ph.D. 0.15 0.16 0.27 0.05 0.
Others 0.79 0.83 1.22 0.47 0.

7/30/2019 Analytical Tables 2007-08
http://slidepdf.com/reader/full/analytical-tables-2007-08 136/180
1 1 4 Table 4.9 Teachers by Academic Qualification & School Category : 2007-08
(Excluding Para-Teachers) All Ar
School Category
State/UT Academic Primary with Primary with Upper Primary Upper PQualification Primary Only Upper Primary Upper Primary Only with Se
& Sec./Hr. Sec. Secon
HaryanaBelow Secondary 6.97 2.54 1.98 2.80 2.3
Secondary 26.66 12.68 6.46 14.87 13.0
Higher Secondary 19.50 12.68 10.16 8.35 7.4
Graduate 30.62 42.91 44.09 36.30 36.5
Post Graduate 15.70 27.75 35.72 35.25 38.4
M.Phil. or Ph.D. 0.37 0.82 1.07 1.46 1.4
Others 0.18 0.62 0.52 0.97 0.7
Himachal Pradesh
Below Secondary 1.03 0.63 0.51 0.52 0.4
Secondary 40.62 13.95 5.88 31.55 26.1
Higher Secondary 19.93 13.95 8.75 10.00 8.5
Graduate 25.05 41.85 45.29 31.86 35.7
Post Graduate 12.65 27.87 37.72 24.56 27.2
M.Phil. or Ph.D. 0.40 0.90 1.11 1.27 1.4
Others 0.31 0.84 0.74 0.24 0.3
Jammu & Kashmir
Below Secondary 2.32 1.45 0.75 2.08 0.4
Secondary 17.99 20.83 7.20 10.38 5.8
Higher Secondary 31.21 20.83 11.80 12.11 6.7
Graduate 35.40 40.45 54.28 43.60 50.3
Post Graduate 12.48 15.79 25.12 29.76 35.5
M.Phil. or Ph.D. 0.43 0.40 0.56 2.08 0.7
Others 0.18 0.24 0.29 0.00 0.1
Jharkhand
Below Secondary 4.77 2.14 1.88 0.85 2.3
Secondary 26.48 18.42 5.92 5.75 2.6
Higher Secondary 24.26 18.42 12.29 5.01 4.4
Graduate 34.80 44.36 50.15 45.79 53.6
Post Graduate 9.32 16.08 28.04 41.64 35.4
M.Phil. or Ph.D. 0.31 0.37 1.27 0.53 1.1
Others 0.06 0.20 0.44 0.43 0.5

7/30/2019 Analytical Tables 2007-08
http://slidepdf.com/reader/full/analytical-tables-2007-08 137/180
1 1 5
Table 4.9 Teachers by Academic Qualification & School Category : 2007-08(Excluding Para-Teachers) All A
School Category
State/UT Academic Primary with Primary with Upper Primary UpperQualification Primary Only Upper Primary Upper Primary Only with S
& Sec./Hr. Sec. Seco
Karnataka
Below Secondary 0.08 0.06 0.15 0.08 0.
Secondary 28.19 38.50 13.88 30.69 14.
Higher Secondary 50.08 38.50 22.37 36.46 14.
Graduate 16.21 17.30 44.08 25.83 50.
Post Graduate 2.80 3.49 13.38 4.07 17.
M.Phil. or Ph.D. 0.03 0.01 0.04 0.00 0.
Others 2.62 2.14 6.11 2.87 3.
Kerala
Below Secondary 2.28 2.16 1.35 1.44 1.
Secondary 25.63 25.54 18.13 22.32 14.
Higher Scondary 38.38 25.54 15.14 15.23 9.
Graduate 28.31 38.47 46.72 46.68 55.Post Graduate 4.86 7.51 16.57 12.82 17.
M. Phil. or Ph. D. 0.08 0.11 0.50 0.26 0.
Others 0.35 0.49 1.21 1.15 1.
Lakshadweep
Below Secondary 0.99 0.00 0.00 0.00 0.
Secondary 81.77 16.67 64.71 50.00 39.
Higher Scondary 5.91 16.67 5.88 6.25 2.
Graduate 7.39 52.78 20.00 37.50 42.
Post Graduate 2.46 13.89 9.41 6.25 13.
M. Phil. or Ph. D. 0.00 0.00 0.00 0.00 0.
Others 1.48 0.00 0.00 0.00 3.
Madhya pradeshBelow Secondary 2.03 2.16 2.29 0.98 1.
Secondary 4.62 25.26 4.54 3.68 5.
Higher Scondary 42.96 25.26 16.54 14.82 13.
Graduate 28.65 30.39 39.61 36.27 37.
Post Graduate 21.19 16.28 36.11 43.47 40.
M. Phil. or Ph. D. 0.33 0.40 0.59 0.59 0.
Others 0.23 0.26 0.32 0.19 0.

7/30/2019 Analytical Tables 2007-08
http://slidepdf.com/reader/full/analytical-tables-2007-08 138/180
1 1 6 Table 4.9 Teachers by Academic Qualification & School Category : 2007-08
(Excluding Para-Teachers) All A
School Category
State/UT Academic Primary with Primary with Upper Primary Upper PQualification Primary Only Upper Primary Upper Primary Only with Se
& Sec./Hr. Sec. Secon
MaharashtraBelow Secondary 2.47 2.15 3.60 1.66 1.8
Secondary 38.14 29.69 16.89 19.02 17.4
Higher Scondary 30.59 29.69 14.63 14.18 12.5
Graduate 23.43 30.37 49.51 51.51 53.8
Post Graduate 5.19 7.81 14.64 13.39 13.8
M. Phil. or Ph. D. 0.05 0.10 0.30 0.08 0.1
Others 0.13 0.16 0.35 0.16 0.2
Manipur
Below Secondary 5.37 1.95 1.18 0.88 0.2
Secondary 22.51 18.38 6.17 3.54 1.9
Higher Scondary 33.79 18.38 14.93 13.27 4.4
Graduate 36.42 53.56 61.89 77.58 81.4
Post Graduate 1.68 7.15 14.85 4.42 11.3
M. Phil. or Ph. D. 0.10 0.44 0.79 0.29 0.3
Others 0.14 0.14 0.17 0.00 0.2
Meghalaya
Below Secondary 14.46 3.37 2.26 1.29 0.8
Secondary 40.63 33.65 11.22 18.36 10.7
Higher Scondary 32.14 33.65 27.33 51.74 20.9
Graduate 11.77 26.65 47.84 26.25 52.9
Post Graduate 0.73 2.49 10.38 1.92 13.1
M. Phil. or Ph. D. 0.06 0.16 0.36 0.10 0.6
Others 0.20 0.03 0.61 0.34 0.6
Mizoram
Below Secondary 24.31 3.82 0.27 9.27 8.9
Secondary 47.66 24.80 5.45 14.72 6.4
Higher Scondary 14.69 24.80 21.53 19.25 33.3
Graduate 12.43 39.42 57.22 53.81 33.3
Post Graduate 0.84 6.65 14.99 2.36 17.9
M. Phil. or Ph. D. 0.00 0.12 0.54 0.04 0.0
Others 0.07 0.40 0.00 0.40 0.0

7/30/2019 Analytical Tables 2007-08
http://slidepdf.com/reader/full/analytical-tables-2007-08 139/180
1 1 7
Table 4.9 Teachers by Academic Qualification & School Category : 2007-08(Excluding Para-Teachers) All A
School Category
State/UT Academic Primary with Primary with Upper Primary UpperQualification Primary Only Upper Primary Upper Primary Only with S
& Sec./Hr. Sec. Seco
NagalandBelow Secondary 14.30 5.23 2.49 14.14 8.
Secondary 27.21 25.43 8.96 20.59 12.
Higher Scondary 35.68 25.43 24.67 16.15 14.
Graduate 20.76 39.60 53.64 43.20 55.
Post Graduate 1.52 3.69 9.21 5.27 8.
M. Phil. or Ph. D. 0.04 0.11 0.16 0.13 0.
Others 0.49 0.51 0.84 0.53 0.
Orissa
Below Secondary 2.65 1.73 1.25 0.53 1.
Secondary 44.98 22.05 7.11 19.47 9.
Higher Scondary 21.10 22.05 13.98 18.22 10.
Graduate 27.44 45.87 54.68 53.03 53.Post Graduate 3.75 8.20 21.80 8.62 24.
M. Phil. or Ph. D. 0.08 0.10 1.18 0.11 0.
Others 0.00 0.01 0.00 0.01 0.
Puducherry
Below Secondary 2.29 0.61 0.46 0.00 0.
Secondary 15.71 16.41 5.95 0.00 3.
Higher Scondary 28.17 16.41 9.15 0.00 3.
Graduate 32.29 34.28 38.87 0.00 28.
Post Graduate 19.54 27.44 37.86 0.00 59.
M. Phil. or Ph. D. 1.37 2.97 3.54 0.00 4.
Others 0.63 1.70 1.71 0.00 0.
PunjabBelow Secondary 12.24 1.99 2.64 6.04 3.
Secondary 16.71 9.24 5.57 13.33 8.
Higher Scondary 15.26 9.24 6.67 8.27 6.
Graduate 31.35 49.61 46.92 32.71 39.
Post Graduate 23.79 27.81 36.67 38.10 40.
M. Phil. or Ph. D. 0.39 0.39 0.71 1.07 0.
Others 0.26 1.72 0.82 0.47 0.

7/30/2019 Analytical Tables 2007-08
http://slidepdf.com/reader/full/analytical-tables-2007-08 140/180
1 1 8 Table 4.9 Teachers by Academic Qualification & School Category : 2007-08
(Excluding Para-Teachers) All A
School Category
State/UT Academic Primary with Primary with Upper Primary Upper PQualification Primary Only Upper Primary Upper Primary Only with Se
& Sec./Hr. Sec. Secon
RajasthanBelow Secondary 4.25 2.10 2.89 4.43 2.1
Secondary 6.11 14.94 3.29 3.58 3.6
Higher Scondary 24.32 14.94 10.35 14.97 10.6
Graduate 40.57 42.70 56.86 43.97 42.8
Post Graduate 24.02 24.70 25.81 32.11 40.0
M. Phil. or Ph. D. 0.20 0.23 0.38 0.66 0.3
Others 0.20 0.23 0.26 0.19 0.2
Sikkim
Below Secondary 7.33 5.84 4.25 3.57 4.8
Secondary 30.28 24.84 22.75 7.14 19.3
Higher Scondary 42.69 24.84 25.37 10.71 12.9
Graduate 18.28 40.67 42.51 75.00 48.3
Post Graduate 0.85 3.33 4.30 3.57 14.5
M. Phil. or Ph. D. 0.03 0.10 0.09 0.00 0.0
Others 0.23 0.34 0.18 0.00 0.0
Tamil Nadu
Below Secondary 1.40 0.67 1.04 1.18 0.0
Secondary 20.15 25.46 8.30 10.34 3.7
Higher Scondary 35.40 25.46 11.78 10.77 8.2
Graduate 27.17 25.82 43.52 37.83 65.0
Post Graduate 14.33 20.90 30.34 34.90 14.4
M. Phil. or Ph. D. 0.79 1.22 2.99 3.21 3.2
Others 0.74 0.46 2.01 1.67 5.3
Tripura
Below Secondary 30.99 17.65 7.44 0.00 1.1
Secondary 40.87 21.65 20.87 0.00 1.3
Higher Scondary 20.44 21.65 16.01 0.00 2.5
Graduate 6.36 37.05 53.91 25.00 91.1
Post Graduate 1.05 1.80 1.56 75.00 3.6
M. Phil. or Ph. D. 0.16 0.09 0.04 0.00 0.0
Others 0.12 0.11 0.17 0.00 0.1
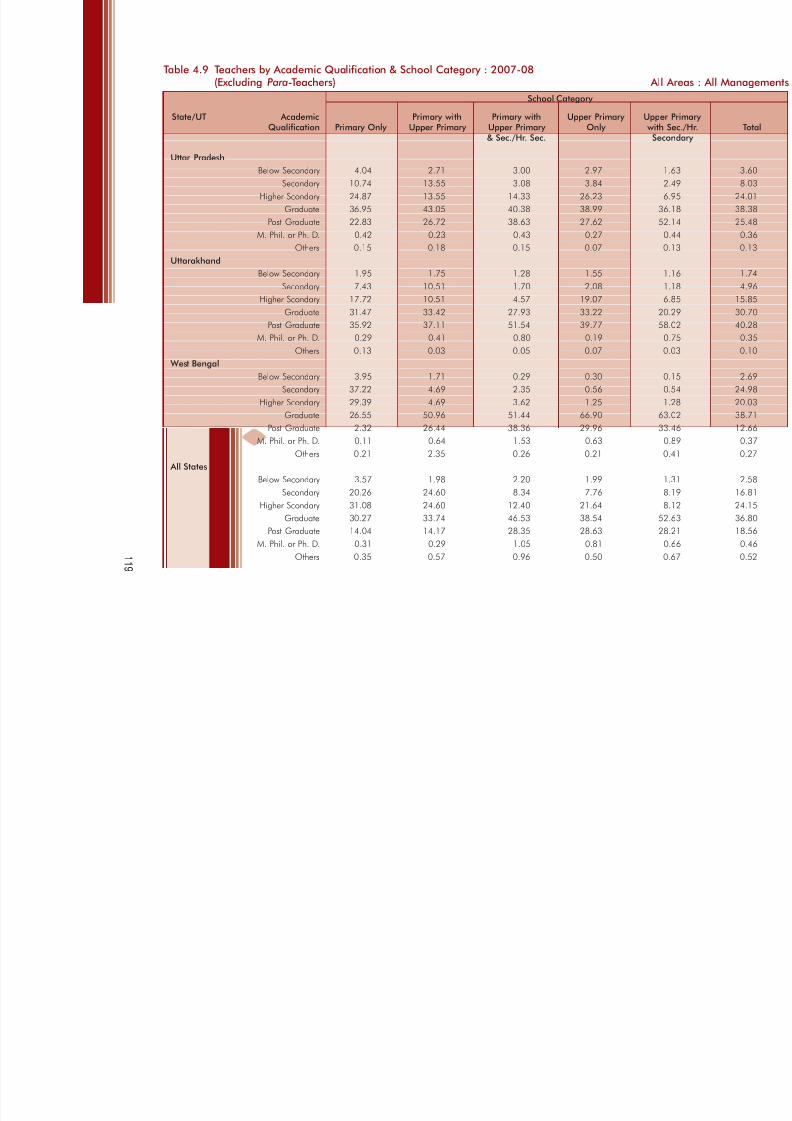
7/30/2019 Analytical Tables 2007-08
http://slidepdf.com/reader/full/analytical-tables-2007-08 141/180
1 1 9
Table 4.9 Teachers by Academic Qualification & School Category : 2007-08(Excluding Para-Teachers) All A
School Category
State/UT Academic Primary with Primary with Upper Primary UpperQualification Primary Only Upper Primary Upper Primary Only with S
& Sec./Hr. Sec. Seco
Uttar PradeshBelow Secondary 4.04 2.71 3.00 2.97 1.
Secondary 10.74 13.55 3.08 3.84 2.
Higher Scondary 24.87 13.55 14.33 26.23 6.
Graduate 36.95 43.05 40.38 38.99 36.
Post Graduate 22.83 26.72 38.63 27.62 52.
M. Phil. or Ph. D. 0.42 0.23 0.43 0.27 0.
Others 0.15 0.18 0.15 0.07 0.
Uttarakhand
Below Secondary 1.95 1.75 1.28 1.55 1.
Secondary 7.43 10.51 1.70 2.08 1.
Higher Scondary 17.72 10.51 4.57 19.07 6.
Graduate 31.47 33.42 27.93 33.22 20.Post Graduate 35.92 37.11 51.54 39.77 58.
M. Phil. or Ph. D. 0.29 0.41 0.80 0.19 0.
Others 0.13 0.03 0.05 0.07 0.
West Bengal
Below Secondary 3.95 1.71 0.29 0.30 0.
Secondary 37.22 4.69 2.35 0.56 0.
Higher Scondary 29.39 4.69 3.62 1.25 1.
Graduate 26.55 50.96 51.44 66.90 63.
Post Graduate 2.32 26.44 38.36 29.96 33.
M. Phil. or Ph. D. 0.11 0.64 1.53 0.63 0.
Others 0.21 2.35 0.26 0.21 0.
All StatesBelow Secondary 3.57 1.98 2.20 1.99 1.
Secondary 20.26 24.60 8.34 7.76 8.
Higher Scondary 31.08 24.60 12.40 21.64 8.
Graduate 30.27 33.74 46.53 38.54 52.
Post Graduate 14.04 14.17 28.35 28.63 28.
M. Phil. or Ph. D. 0.31 0.29 1.05 0.81 0.
Others 0.35 0.57 0.96 0.50 0.

7/30/2019 Analytical Tables 2007-08
http://slidepdf.com/reader/full/analytical-tables-2007-08 142/180

7/30/2019 Analytical Tables 2007-08
http://slidepdf.com/reader/full/analytical-tables-2007-08 143/180
1 2 1
Table 4.11 Para-Teachers by School Category : 2007-08 All A
School Category
Primary with Primary with Upper Primary Upper PrimaryPrimary Only Upper Primary Upper Primary Only with Sec./Hr.
& Sec./Hr. Sec. Secondary
Male Female Male Female Male Female Male Female Male Female
A & N Islands 3 6 0 8 7 11 1 1 2 2
Andhra Pradesh 14,012 14837 11919 13003 250 314 0 0 13808 10686 Arunachal Pradesh 1,344 1050 93 110 42 43 2 4 6 5
Assam 10,504 6728 207 123 31 19 1165 390 20 81
Bihar 7,741 6463 4895 4030 184 54 46 23 47 4
Chandigarh 2 0 1 8 7 36 0 0 3 25
Chhattisgarh 5,316 3036 1035 714 750 509 1572 835 209 134
D & N Haveli 0 1 0 0 0 0 0 0 0 0
Daman & Diu 1 6 0 0 6 7 1 0 0 0
Delhi 271 549 40 188 211 838 12 8 117 176
Goa 7 28 4 4 5 11 2 3 12 22
Gujarat 153 215 639 1095 67 184 12 20 16 38
Haryana 4,067 2736 602 475 621 450 716 452 1701 1376
Himachal Pradesh 4,035 2205 35 73 67 133 1634 616 992 502
Jammu & Kashmir 8,328 4284 6996 3509 440 257 16 93 90 32 Jharkhand 29,409 10463 18593 6213 568 175 25 52 217 85
Karnataka 0 0 0 0 0 0 0 0 0 0
Kerala 231 755 409 1059 119 524 119 305 207 451
Lakshadweep 0 0 1 0 0 0 0 0 2 0
Madhya Pradesh 1,789 1049 1108 1089 107 163 497 220 30 40
Maharashtra 507 481 1087 972 294 308 16 9 1261 718
Manipur 78 36 58 47 38 19 5 5 73 18
Meghalaya 531 803 121 227 45 123 136 140 40 35
Mizoram 712 752 689 875 172 251 333 180 35 26
Nagaland 42 45 19 16 5 13 21 9 15 6
Orissa 15,657 10016 13620 9048 226 207 1506 873 595 600
Puducherry 15 33 11 9 52 54 0 0 9 3
Punjab 229 458 10 31 17 64 53 52 158 197 Rajasthan 19,970 4632 3343 3698 522 331 24 115 487 165
Sikkim 12 15 7 12 4 5 0 0 0 0
Tamil Nadu 75 580 92 178 142 306 238 480 0 10
Tripura 356 86 350 73 37 15 2 5 7 2
Uttar Pradesh 76,651 89083 333 221 36 16 315 154 71 8
Uttarakhand 2,085 1779 46 87 20 11 69 64 50 22
West Bengal 8,520 7872 17 18 211 270 840 851 9326 11086
All States 212,683 171082 66380 47513 5303 5721 9378 5959 29795 26555
State/UT

7/30/2019 Analytical Tables 2007-08
http://slidepdf.com/reader/full/analytical-tables-2007-08 144/180

7/30/2019 Analytical Tables 2007-08
http://slidepdf.com/reader/full/analytical-tables-2007-08 145/180
1 2 3
Table 4.13 Percentage of Para-Teachers by Academic Qualification : 2007-08 All A
School Category
State/UT Academic Primary with Primary with Upper Primary Upper PQualification Primary Only Upper Primary Upper Primary Only with Se
& Sec./Hr. Sec. Secon
Male Female Male Female Male Female Male Female Male
A & N Islands
Below Secondary 0.00 16.67 0.00 0.00 0.00 0.00 0.00 0.00 0.00 Secondary 0.00 0.00 0.00 0.00 0.00 0.00 0.00 0.00 0.00
Higher Secondary 33.33 33.33 0.00 12.50 28.57 63.64 0.00 0.00 0.00
Graduate 33.33 33.33 0.00 37.50 14.29 27.27 100.00 100.00 0.00
Post Graduate 33.33 16.67 0.00 50.00 42.86 9.09 0.00 0.00 100.00
M.Phil. or Ph.D. 0.00 0.00 0.00 0.00 14.29 0.00 0.00 0.00 0.00
Others 0.00 0.00 0.00 0.00 0.00 0.00 0.00 0.00 0.00
Andhra Pradesh
Below Secondary 3.80 3.38 1.03 1.42 0.00 0.65 0.00 0.00 0.25
Secondary 38.55 36.44 15.49 23.16 2.80 4.85 0.00 0.00 2.99
Higher Secondary 27.70 34.00 28.13 35.37 8.80 9.06 0.00 0.00 13.27
Graduate 26.04 23.48 48.55 36.25 44.00 49.51 0.00 0.00 71.50
Post Graduate 3.50 2.24 6.13 3.01 43.20 35.28 0.00 0.00 11.12
M.Phil.or Ph.D. 0.26 0.27 0.26 0.33 0.40 0.65 0.00 0.00 0.30
Others 0.16 0.20 0.40 0.45 0.80 1.62 0.00 0.00 0.56
Arunachal Pradesh
Below Secondary 42.11 41.52 3.23 9.09 4.76 9.30 0.00 0.00 16.67
Secondary 30.51 34.19 3.23 6.36 2.38 4.65 0.00 0.00 0.00
Higher Secondary 20.16 16.57 33.33 27.27 7.14 16.28 0.00 25.00 16.67
Graduate 6.70 6.19 51.61 39.09 61.90 46.51 100.00 75.00 66.67
Post Graduate 0.45 0.95 7.53 17.27 21.43 23.26 0.00 0.00 0.00
M.Phil.or Ph.D. 0.00 0.38 0.00 0.91 2.38 0.00 0.00 0.00 0.00
Others 0.07 0.19 1.08 0.00 0.00 0.00 0.00 0.00 0.00
Assam
Below Secondary 3.58 3.89 3.38 1.63 29.03 0.00 0.77 0.51 4.31
Secondary 21.33 21.11 6.28 7.32 9.68 0.00 6.78 7.44 6.22
Higher Secondary 58.58 55.40 39.13 35.77 12.90 0.00 45.58 45.38 11.00
Graduate 15.83 18.49 48.31 48.78 38.71 89.47 43.78 43.08 65.55
Post Graduate 0.42 0.73 2.90 6.50 0.00 5.26 1.80 3.08 5.74
M.Phil. or Ph.D. 0.13 0.21 0.00 0.00 3.23 5.26 0.52 0.51 1.44
Others 0.12 0.15 0.00 0.00 6.45 0.00 0.77 0.00 5.74

7/30/2019 Analytical Tables 2007-08
http://slidepdf.com/reader/full/analytical-tables-2007-08 146/180
1 2 4 Table 4.13 Percentage of Para-Teachers by Academic Qualification : 2007-08 All A
School Category
State/UT Academic Primary with Primary with Upper Primary Upper PQualification Primary Only Upper Primary Upper Primary Only with Se
& Sec./Hr. Sec. Second
Male Female Male Female Male Female Male Female Male
Bihar
Below Secondary 1.68 2.15 1.41 1.36 10.33 12.96 0.00 0.00 8.51
Secondary 9.71 11.42 6.62 7.12 11.96 11.11 6.52 0.00 21.28
Higher Secondary 50.23 59.07 38.65 54.91 21.74 38.89 41.30 56.52 6.38
Graduate 29.36 21.71 39.35 28.59 23.37 9.26 30.43 43.48 25.53
Post Graduate 7.92 4.29 12.54 6.85 16.85 24.07 21.74 0.00 27.66
M.Phil. or Ph.D. 0.79 0.97 0.94 0.92 8.70 3.70 0.00 0.00 8.51
Others 0.31 0.39 0.49 0.25 0.00 0.00 0.00 0.00 2.13
Chandigarh
Below Secondary 0.00 0.00 0.00 25.00 0.00 2.78 0.00 0.00 0.00
Secondary 0.00 0.00 0.00 0.00 0.00 0.00 0.00 0.00 0.00
Higher Secondary 0.00 0.00 0.00 0.00 14.29 11.11 0.00 0.00 0.00
Graduate 50.00 0.00 0.00 25.00 0.00 19.44 0.00 0.00 100.00
Post Graduate 50.00 0.00 100.00 50.00 85.71 63.89 0.00 0.00 0.00 M.Phil. or Ph.D. 0.00 0.00 0.00 0.00 0.00 2.78 0.00 0.00 0.00
Others 0.00 0.00 0.00 0.00 0.00 0.00 0.00 0.00 0.00
Chhattisgarh
Below Secondary 2.16 3.59 3.77 2.38 2.53 3.14 1.21 1.56 2.87
Secondary 3.39 5.34 2.90 3.36 3.20 3.14 2.61 1.68 3.35
Higher Secondary 49.98 46.08 41.84 46.64 27.07 25.74 25.64 23.59 17.70
Graduate 24.98 23.81 29.47 26.61 38.67 40.86 36.13 34.73 31.10
Post Graduate 18.74 20.55 20.97 20.31 27.60 26.92 33.08 37.49 44.50
M.Phil. or Ph.D. 0.45 0.26 0.48 0.42 0.53 0.20 0.57 0.60 0.48
Others 0.15 0.26 0.58 0.14 0.00 0.00 0.57 0.00 0.00
D & N Haveli
Below Secondary 0.00 0.00 0.00 0.00 0.00 0.00 0.00 0.00 0.00 Secondary 0.00 0.00 0.00 0.00 0.00 0.00 0.00 0.00 0.00
Higher Secondary 0.00 100.00 0.00 0.00 0.00 0.00 0.00 0.00 0.00
Graduate 0.00 0.00 0.00 0.00 0.00 0.00 0.00 0.00 0.00
Post Graduate 0.00 0.00 0.00 0.00 0.00 0.00 0.00 0.00 0.00
M.Phil. or Ph.D. 0.00 0.00 0.00 0.00 0.00 0.00 0.00 0.00 0.00
Others 0.00 0.00 0.00 0.00 0.00 0.00 0.00 0.00 0.00

7/30/2019 Analytical Tables 2007-08
http://slidepdf.com/reader/full/analytical-tables-2007-08 147/180
1 2 5
Table 4.13 Percentage of Para-Teachers by Academic Qualification : 2007-08 All A
School Category
State/UT Academic Primary with Primary with Upper Primary Upper PQualification Primary Only Upper Primary Upper Primary Only with Se
& Sec./Hr. Sec. Secon
Male Female Male Female Male Female Male Female Male
Daman & Diu
Below Secondary 0.00 0.00 0.00 0.00 16.67 28.57 0.00 0.00 0.00 Secondary 100.00 50.00 0.00 0.00 16.67 0.00 0.00 0.00 0.00
Higher Secondary 0.00 33.33 0.00 0.00 16.67 0.00 0.00 0.00 0.00
Graduate 0.00 0.00 0.00 0.00 33.33 28.57 100.00 0.00 0.00
Post Graduate 0.00 0.00 0.00 0.00 0.00 42.86 0.00 0.00 0.00
M.Phil. or Ph.D. 0.00 0.00 0.00 0.00 0.00 0.00 0.00 0.00 0.00
Others 0.00 0.00 0.00 0.00 16.67 0.00 0.00 0.00 0.00
Delhi
Below Secondary 1.48 2.55 0.00 0.00 0.95 0.96 0.00 0.00 2.56
Secondary 2.95 2.00 2.50 2.66 5.21 1.32 8.33 0.00 11.97
Higher Secondary 34.32 26.05 15.00 4.79 13.27 2.52 8.33 0.00 5.98
Graduate 43.17 52.82 50.00 57.98 25.12 34.45 8.33 12.50 21.37
Post Graduate 16.97 15.66 32.50 31.91 50.71 57.98 75.00 75.00 56.41
M.Phil. or Ph.D. 0.00 0.18 0.00 1.06 2.37 2.76 0.00 12.50 0.85
Others 1.11 0.73 0.00 1.60 2.37 0.60 0.00 0.00 0.85
Goa
Below Secondary 0.00 0.00 0.00 0.00 0.00 0.00 0.00 0.00 0.00
Secondary 14.29 21.43 0.00 0.00 0.00 36.36 0.00 0.00 8.33
Higher Secondary 42.86 10.71 0.00 0.00 0.00 0.00 0.00 0.00 0.00
Graduate 14.29 53.57 50.00 75.00 60.00 45.45 100.00 100.00 66.67
Post Graduate 14.29 10.71 50.00 25.00 40.00 18.18 0.00 0.00 25.00
M.Phil. or Ph.D. 0.00 0.00 0.00 0.00 0.00 0.00 0.00 0.00 0.00
Others 14.29 3.57 0.00 0.00 0.00 0.00 0.00 0.00 0.00
GujaratBelow Secondary 10.46 10.70 5.16 5.21 2.99 3.93 8.33 5.00 6.25
Secondary 26.80 21.40 18.47 14.61 14.93 7.30 0.00 25.00 18.75
Higher Secondary 32.68 26.98 35.52 30.05 4.48 12.36 0.00 15.00 12.50
Graduate 16.99 29.30 23.79 35.34 40.30 53.37 58.33 25.00 56.25
Post Graduate 11.76 10.70 15.49 13.70 31.34 23.03 33.33 30.00 6.25
M.Phil. or Ph.D. 0.00 0.47 0.31 0.46 2.99 0.00 0.00 0.00 0.00
Others 1.31 0.47 1.25 0.64 2.99 3.37 0.00 0.00 0.00

7/30/2019 Analytical Tables 2007-08
http://slidepdf.com/reader/full/analytical-tables-2007-08 148/180
1 2 6 Table 4.13 Percentage of Para-Teachers by Academic Qualification : 2007-08 All A
School Category
State/UT Academic Primary with Primary with Upper Primary Upper PQualification Primary Only Upper Primary Upper Primary Only with Se
& Sec./Hr. Sec. Second
Male Female Male Female Male Female Male Female Male
Haryana
Below Secondary 1.16 1.43 0.50 1.26 0.97 0.22 1.54 0.67 0.94 Secondary 1.13 1.83 1.66 1.05 3.06 3.14 2.37 1.78 2.65
Higher Secondary 19.23 12.72 6.64 10.32 9.18 8.74 3.91 2.67 7.17
Graduate 49.91 44.26 49.83 45.89 49.60 48.21 53.91 45.43 50.62
Post Graduate 27.17 38.78 39.04 40.21 36.23 38.34 36.03 47.88 36.51
M.Phil. or Ph.D. 1.28 0.91 1.99 1.05 0.64 1.35 1.96 1.56 1.29
Others 0.12 0.07 0.33 0.21 0.32 0.90 0.28 0.67 0.82
Himachal Pradesh
Below Secondary 0.32 0.54 0.00 1.37 2.99 2.29 0.24 0.00 0.30
Secondary 4.91 7.35 11.43 10.96 10.45 13.74 16.65 14.52 15.03
Higher Secondary 26.84 23.90 17.14 21.92 14.93 18.32 27.05 21.21 18.45
Graduate 40.69 39.14 57.14 41.10 44.78 42.75 34.70 36.05 36.59
Post Graduate 25.70 27.94 14.29 21.92 26.87 21.37 20.44 26.59 28.13 M.Phil. or Ph.D. 1.36 0.95 0.00 2.74 0.00 1.53 0.67 1.63 1.01
Others 0.17 0.18 0.00 0.00 0.00 1.53 0.24 0.49 0.50
Jammu & Kashmir
Below Secondary 0.40 0.49 0.33 0.20 0.45 0.39 0.00 0.00 1.11
Secondary 2.05 2.17 1.89 2.22 3.86 3.11 6.25 0.00 1.11
Higher Secondary 26.42 22.04 33.38 29.52 24.32 21.79 18.75 36.56 13.33
Graduate 48.07 48.81 44.71 45.45 45.91 45.91 50.00 35.48 50.00
Post Graduate 22.54 25.98 19.10 22.00 25.23 28.40 25.00 26.88 33.33
M.Phil. or Ph.D. 0.47 0.49 0.43 0.43 0.23 0.39 0.00 1.08 1.11
Others 0.06 0.02 0.17 0.17 0.00 0.00 0.00 0.00 0.00
Jharkhand
Below Secondary 6.13 6.89 2.54 2.20 2.46 3.43 0.00 7.69 7.83
Secondary 10.36 14.10 6.26 10.32 5.99 11.43 12.00 3.85 9.22
Higher Secondary 53.66 55.01 21.28 33.03 22.71 32.57 24.00 5.77 8.29
Graduate 26.52 21.45 61.78 47.84 57.57 40.00 48.00 42.31 47.47
Post Graduate 2.87 1.97 7.69 6.11 10.74 12.00 16.00 40.38 21.66
M.Phil. or Ph.D. 0.31 0.36 0.33 0.41 0.35 0.57 0.00 0.00 0.92
Others 0.16 0.22 0.13 0.09 0.18 0.00 0.00 0.00 4.61

7/30/2019 Analytical Tables 2007-08
http://slidepdf.com/reader/full/analytical-tables-2007-08 149/180
1 2 7
Table 4.13 Percentage of Para-Teachers by Academic Qualification : 2007-08 All A
School Category
State/UT Academic Primary with Primary with Upper Primary Upper PQualification Primary Only Upper Primary Upper Primary Only with Se
& Sec./Hr. Sec. Secon
Male Female Male Female Male Female Male Female Male
Karnataka
Below Secondary 0.00 0.00 0.00 0.00 0.00 0.00 0.00 0.00 0.00 Secondary 0.00 0.00 0.00 0.00 0.00 0.00 0.00 0.00 0.00
Higher Secondary 0.00 0.00 0.00 0.00 0.00 0.00 0.00 0.00 0.00
Graduate 0.00 0.00 0.00 0.00 0.00 0.00 0.00 0.00 0.00
Post Graduate 0.00 0.00 0.00 0.00 0.00 0.00 0.00 0.00 0.00
M.Phil. or Ph.D. 0.00 0.00 0.00 0.00 0.00 0.00 0.00 0.00 0.00
Others 0.00 0.00 0.00 0.00 0.00 0.00 0.00 0.00 0.00
Kerala
Below Secondary 3.90 2.38 1.96 1.61 1.68 1.35 5.04 3.62 1.45
Secondary 31.17 21.59 37.65 27.01 10.92 10.21 32.77 23.68 13.53
Higher Secondary 37.66 43.58 23.23 21.06 14.29 15.41 24.37 17.43 11.59
Graduate 22.94 28.34 25.18 31.26 48.74 45.47 26.05 37.50 48.79
Post Graduate 3.03 3.18 10.27 16.43 23.53 26.59 10.08 16.12 21.74
M.Phil. or Ph.D. 0.43 0.13 0.24 1.32 0.84 0.58 1.68 1.64 1.45
Others 0.87 0.66 1.22 0.85 0.00 0.96 0.00 0.33 0.48
Lakshadweep
Below Secondary 0.00 0.00 0.00 0.00 0.00 0.00 0.00 0.00 0.00
Secondary 0.00 0.00 100.00 0.00 0.00 0.00 0.00 0.00 0.00
Higher Secondary 0.00 0.00 0.00 0.00 0.00 0.00 0.00 0.00 0.00
Graduate 0.00 0.00 0.00 0.00 0.00 0.00 0.00 0.00 0.00
Post Graduate 0.00 0.00 0.00 0.00 0.00 0.00 0.00 0.00 0.00
M.Phil. or Ph.D. 0.00 0.00 0.00 0.00 0.00 0.00 0.00 0.00 0.00
Others 0.00 0.00 0.00 0.00 0.00 0.00 0.00 0.00 0.00
Madhya Pradesh
Below Secondary 3.75 2.48 1.62 1.84 0.93 3.07 2.62 4.09 0.00
Secondary 6.54 8.48 5.87 4.41 1.87 0.00 4.02 3.18 0.00
Higher Secondary 40.64 39.56 31.59 32.97 14.95 20.25 17.71 15.45 10.00
Graduate 29.68 26.69 38.45 37.65 43.93 42.94 41.05 35.45 40.00
Post Graduate 18.28 21.45 21.66 22.31 37.38 31.90 33.20 41.36 46.67
M.Phil. or Ph.D. 0.73 1.05 0.72 0.46 0.93 1.84 1.21 0.45 3.33
Others 0.39 0.29 0.09 0.37 0.00 0.00 0.20 0.00 0.00

7/30/2019 Analytical Tables 2007-08
http://slidepdf.com/reader/full/analytical-tables-2007-08 150/180
1 2 8 Table 4.13 Percentage of Para-Teachers by Academic Qualification : 2007-08 All A
School Category
State/UT Academic Primary with Primary with Upper Primary Upper PQualification Primary Only Upper Primary Upper Primary Only with Se
& Sec./Hr. Sec. Second
Male Female Male Female Male Female Male Female Male
Maharashtra
Below Secondary 3.75 3.95 1.93 3.19 3.40 3.58 0.00 0.00 1.27 Secondary 19.92 27.65 13.62 13.89 12.93 12.38 25.00 33.33 9.60
Higher Secondary 50.69 38.25 51.70 45.88 15.99 15.64 12.50 33.33 20.14
Graduate 21.70 24.74 25.94 28.91 51.36 45.60 56.25 22.22 52.02
Post Graduate 3.94 3.95 5.98 6.69 14.63 22.80 6.25 11.11 15.86
M.Phil. or Ph.D. 0.00 0.42 0.37 0.93 1.02 0.00 0.00 0.00 0.40
Others 0.00 1.04 0.46 0.51 0.68 0.33 0.00 0.00 0.71
Manipur
Below Secondary 3.85 2.78 1.72 0.00 0.00 0.00 0.00 0.00 1.37
Secondary 14.10 5.56 0.00 4.26 0.00 0.00 20.00 0.00 0.00
Higher Secondary 42.31 52.78 13.79 23.40 13.16 21.05 20.00 20.00 8.22
Graduate 33.33 38.89 77.59 61.70 52.63 52.63 60.00 60.00 83.56
Post Graduate 3.85 0.00 6.90 10.64 26.32 26.32 0.00 0.00 5.48 M.Phil. or Ph.D. 0.00 0.00 0.00 0.00 5.26 0.00 0.00 20.00 0.00
Others 2.56 0.00 0.00 0.00 2.63 0.00 0.00 0.00 1.37
Meghalaya
Below Secondary 13.56 15.82 2.48 9.25 4.44 4.20 2.94 4.29 0.00
Secondary 26.37 27.65 9.09 14.10 13.33 12.61 9.56 17.14 12.50
Higher Secondary 42.00 37.24 56.20 43.61 22.22 25.21 50.74 35.00 22.50
Graduate 17.14 17.43 28.93 30.40 46.67 55.46 34.56 38.57 60.00
Post Graduate 0.75 1.62 3.31 2.64 8.89 2.52 1.47 5.00 5.00
M.Phil. or Ph.D. 0.00 0.00 0.00 0.00 2.22 0.00 0.00 0.00 0.00
Others 0.19 0.25 0.00 0.00 2.22 3.36 0.74 0.00 0.00
Mizoram
Below Secondary 8.15 8.51 1.60 2.29 2.33 1.20 4.80 2.78 0.00 Secondary 42.98 41.36 11.18 14.40 6.40 13.15 9.01 11.67 0.00
Higher Secondary 23.88 23.27 29.32 28.57 20.35 25.90 8.71 5.56 8.57
Graduate 23.17 23.94 48.04 47.09 60.47 51.00 74.17 71.11 60.00
Post Graduate 1.83 2.39 9.72 7.66 10.47 8.76 3.30 8.89 31.43
M.Phil. or Ph.D. 0.00 0.13 0.15 0.00 0.00 0.00 0.00 0.00 0.00
Others 0.00 0.40 0.00 0.00 0.00 0.00 0.00 0.00 0.00

7/30/2019 Analytical Tables 2007-08
http://slidepdf.com/reader/full/analytical-tables-2007-08 151/180
1 2 9
Table 4.13 Percentage of Para-Teachers by Academic Qualification : 2007-08 All A
School Category
State/UT Academic Primary with Primary with Upper Primary Upper PQualification Primary Only Upper Primary Upper Primary Only with Se
& Sec./Hr. Sec. Secon
Male Female Male Female Male Female Male Female Male
Nagaland
Below Secondary 16.67 2.22 10.53 6.25 0.00 0.00 9.52 22.22 26.67 Secondary 9.52 24.44 26.32 37.50 0.00 15.38 23.81 11.11 6.67
Higher Secondary 26.19 37.78 31.58 18.75 20.00 53.85 14.29 11.11 0.00
Graduate 45.24 26.67 26.32 37.50 80.00 23.08 33.33 44.44 46.67
Post Graduate 0.00 4.44 5.26 0.00 0.00 7.69 19.05 11.11 13.33
M.Phil. or Ph.D. 2.38 2.22 0.00 0.00 0.00 0.00 0.00 0.00 6.67
Others 0.00 2.22 0.00 0.00 0.00 0.00 0.00 0.00 0.00
Orissa
Below Secondary 1.03 1.14 0.65 0.76 1.77 1.45 0.27 0.69 1.01
Secondary 24.92 22.22 16.84 17.89 4.87 4.35 8.90 10.19 5.88
Higher Secondary 32.87 32.56 30.31 30.73 11.95 10.14 23.64 26.92 13.11
Graduate 35.45 37.14 43.19 41.08 57.52 55.56 55.71 48.91 55.80
Post Graduate 5.28 6.50 8.46 9.00 23.45 26.09 11.02 12.83 22.52
M.Phil. or Ph.D. 0.43 0.44 0.53 0.53 0.44 2.42 0.46 0.46 1.18
Others 0.01 0.00 0.01 0.01 0.00 0.00 0.00 0.00 0.50
Puducherry
Below Secondary 0.00 0.00 0.00 0.00 0.00 0.00 0.00 0.00 0.00
Secondary 0.00 0.00 18.18 11.11 3.85 3.77 0.00 0.00 0.00
Higher Secondary 13.33 15.15 18.18 11.11 5.77 3.77 0.00 0.00 0.00
Graduate 66.67 66.67 27.27 55.56 38.46 47.17 0.00 0.00 11.11
Post Graduate 20.00 18.18 27.27 22.22 42.31 45.28 0.00 0.00 88.89
M.Phil. or Ph.D. 0.00 0.00 0.00 0.00 7.69 0.00 0.00 0.00 0.00
Others 0.00 0.00 9.09 0.00 1.92 1.89 0.00 0.00 0.00
Punjab
Below Secondary 5.24 6.11 0.00 6.45 5.88 0.00 11.32 9.80 4.43
Secondary 3.06 4.59 0.00 6.45 5.88 4.76 13.21 13.73 5.70
Higher Secondary 9.61 5.90 10.00 9.68 11.76 7.94 5.66 17.65 5.06
Graduate 55.02 43.67 40.00 61.29 35.29 28.57 30.19 21.57 41.14
Post Graduate 26.64 39.52 40.00 16.13 41.18 58.73 37.74 35.29 43.04
M.Phil. or Ph.D. 0.00 0.22 10.00 0.00 0.00 0.00 1.89 1.96 0.63
Others 0.44 0.00 0.00 0.00 0.00 1.59 0.00 1.96 0.00

7/30/2019 Analytical Tables 2007-08
http://slidepdf.com/reader/full/analytical-tables-2007-08 152/180
1 3 0 Table 4.13 Percentage of Para-Teachers by Academic Qualification : 2007-08 All A
School Category
State/UT Academic Primary with Primary with Upper Primary Upper PQualification Primary Only Upper Primary Upper Primary Only with Se
& Sec./Hr. Sec. Secon
Male Female Male Female Male Female Male Female Male
Rajasthan
Below Secondary 6.02 11.61 3.89 6.17 3.07 3.04 4.17 6.09 3.90 Secondary 7.72 11.79 5.77 6.63 3.26 3.95 4.17 0.00 3.70
Higher Secondary 26.86 24.65 23.93 23.74 11.49 17.93 29.17 25.22 16.63
Graduate 41.85 30.44 45.80 36.15 55.17 41.95 50.00 53.91 47.43
Post Graduate 17.09 21.05 18.94 26.74 24.71 31.61 12.50 14.78 27.72
M.Phil. or Ph.D. 0.13 0.19 0.90 0.32 1.34 1.52 0.00 0.00 0.21
Others 0.25 0.24 0.60 0.24 0.96 0.61 0.00 0.00 0.00
Sikkim
Below Secondary 0.00 0.00 0.00 8.33 0.00 0.00 0.00 0.00 0.00
Secondary 8.33 6.67 0.00 0.00 0.00 0.00 0.00 0.00 0.00
Higher Secondary 41.67 66.67 14.29 25.00 0.00 40.00 0.00 0.00 0.00
Graduate 50.00 26.67 85.71 58.33 50.00 40.00 0.00 0.00 0.00
Post Graduate 0.00 0.00 0.00 8.33 25.00 20.00 0.00 0.00 0.00 M.Phil. or Ph.D. 0.00 0.00 0.00 0.00 0.00 0.00 0.00 0.00 0.00
Others 0.00 0.00 0.00 0.00 25.00 0.00 0.00 0.00 0.00
Tamil Nadu
Below Secondary 2.67 3.28 14.13 2.81 2.11 3.96 0.42 1.27 0.00
Secondary 4.00 8.28 7.61 9.55 6.34 7.59 5.46 6.54 0.00
Higher Secondary 29.33 26.90 17.39 18.54 9.15 14.19 10.08 8.86 0.00
Graduate 32.00 49.31 28.26 42.70 35.92 51.49 34.03 48.52 0.00
Post Graduate 18.67 8.97 19.57 22.47 36.62 20.13 42.86 31.22 0.00
M.Phil. or Ph.D. 0.00 1.38 5.43 2.25 4.93 2.64 3.78 3.59 0.00
Others 13.33 1.90 7.61 1.69 4.93 0.99 3.36 1.27 0.00
Tripura
Below Secondary 23.60 23.26 5.43 13.70 29.73 13.33 0.00 0.00 0.00
Secondary 51.60 56.98 3.71 4.11 18.92 0.00 0.00 0.00 0.00
Higher Secondary 14.61 9.30 2.00 1.37 5.41 20.00 0.00 0.00 0.00
Graduate 7.87 5.81 76.86 65.75 32.43 33.33 100.00 80.00 100.00
Post Graduate 1.12 3.49 11.43 13.70 13.51 33.33 0.00 20.00 0.00
M.Phil. or Ph.D. 0.00 0.00 0.29 1.37 0.00 0.00 0.00 0.00 0.00
Others 1.12 1.16 0.29 0.00 0.00 0.00 0.00 0.00 0.00

7/30/2019 Analytical Tables 2007-08
http://slidepdf.com/reader/full/analytical-tables-2007-08 153/180
1 3 1
Table 4.13 Percentage of Para-Teachers by Academic Qualification : 2007-08 All A
School Category
State/UT Academic Primary with Primary with Upper Primary Upper PQualification Primary Only Upper Primary Upper Primary Only with Se
& Sec./Hr. Sec. Secon
Male Female Male Female Male Female Male Female Male
Uttar Pradesh
Below Secondary 3.22 2.29 2.10 2.26 2.78 0.00 6.67 2.60 4.23 Secondary 3.33 3.46 4.50 4.07 13.89 6.25 6.03 9.09 2.82
Higher Secondary 34.02 41.97 30.93 33.03 11.11 18.75 15.56 14.94 2.82
Graduate 42.21 37.27 44.44 37.56 36.11 25.00 41.59 40.26 38.03
Post Graduate 16.91 14.70 18.02 22.62 33.33 43.75 28.89 33.12 52.11
M.Phil. or Ph.D. 0.26 0.27 0.00 0.45 2.78 6.25 0.63 0.00 0.00
Others 0.05 0.05 0.00 0.00 0.00 0.00 0.63 0.00 0.00
Uttarakhand
Below Secondary 1.68 1.52 0.00 0.00 5.00 9.09 1.45 1.56 8.00
Secondary 1.97 1.41 4.35 10.34 0.00 0.00 1.45 0.00 4.00
Higher Secondary 16.59 21.81 15.22 14.94 10.00 9.09 14.49 9.38 8.00
Graduate 44.75 43.11 43.48 34.48 35.00 9.09 39.13 46.88 24.00
Post Graduate 33.67 30.86 36.96 35.63 50.00 63.64 43.48 37.50 46.00
M.Phil. or Ph.D. 0.48 0.28 0.00 0.00 0.00 0.00 0.00 1.56 0.00
Others 0.10 0.11 0.00 0.00 0.00 0.00 0.00 0.00 0.00
West Bengal
Below Secondary 3.52 4.55 0.00 0.00 0.00 0.37 0.12 0.12 0.50
Secondary 50.28 59.98 0.00 5.56 1.90 1.48 0.71 1.07 0.57
Higher Secondary 21.14 17.12 0.00 0.00 0.95 0.74 1.07 0.71 1.07
Graduate 20.04 15.55 82.35 83.33 67.30 73.70 84.88 81.87 78.14
Post Graduate 1.54 1.30 17.65 11.11 12.80 11.85 10.71 13.98 15.46
M.Phil. or Ph.D. 0.35 0.25 0.00 0.00 0.47 0.74 0.12 0.47 0.30
Others 0.22 0.20 0.00 0.00 0.95 0.00 0.48 0.83 0.28
All States
Below Secondary 3.83 3.32 1.65 1.93 2.53 2.08 1.28 1.45 0.69
Secondary 12.11 12.61 9.99 14.33 5.32 5.68 7.57 7.16 3.20
Higher Secondary 36.30 39.23 28.20 33.65 16.14 14.52 22.52 18.04 9.44
Graduate 35.14 32.44 48.82 38.93 47.33 45.35 47.43 48.18 68.31
Post Graduate 12.02 11.87 10.62 10.40 25.83 30.61 19.84 23.83 16.20
M.Phil. or Ph.D. 0.34 0.34 0.47 0.49 1.26 1.18 0.73 1.01 0.45
Others 0.13 0.12 0.25 0.26 0.66 0.69 0.43 0.35 0.54

7/30/2019 Analytical Tables 2007-08
http://slidepdf.com/reader/full/analytical-tables-2007-08 154/180
1 3 2 Table 4.14 Percentage of Para-Teachers by Professional Qualification : 2007-08 All A
School Category
State/UT Professional Primary with Primary with Upper Primary UppQualification Primary Only Upper Primary Upper Primary Only wit
& Sec./Hr. Sec. Se
A & N Islands
J.V., J.B.T. or Equivalent 22.22 12.50 16.67 0.00 S.V., C.V., S.B.T. or Equivalent 11.11 0.00 0.00 0.00
L.T., B.T., B.Ed. or Equivalent 33.33 75.00 61.11 100.00 1
M.Ed. or Equivalent 0.00 0.00 0.00 0.00
Others 0.00 12.50 16.67 0.00
Andhra Pradesh
J.V., J.B.T. or Equivalent 0.00 0.00 0.00 0.00
S.V., C.V., S.B.T. or Equivalent 10.97 10.41 5.14 0.00
L.T., B.T., B.Ed. or Equivalent 11.49 20.32 63.30 0.00
M.Ed. or Equivalent 0.69 1.07 4.79 0.00
Others 5.89 6.71 6.56 0.00
Arunachal Pradesh
J.V., J.B.T. or Equivalent 1.46 3.45 0.00 0.00
S.V., C.V., S.B.T. or Equivalent 1.67 0.00 2.35 0.00
L.T., B.T., B.Ed. or Equivalent 0.21 7.39 23.53 0.00
M.Ed. or Equivalent 0.13 0.00 1.18 0.00
Others 2.84 1.97 4.71 0.00
Assam
J.V., J.B.T. or Equivalent 6.31 8.18 4.00 3.73
S.V., C.V., S.B.T. or Equivalent 1.04 6.36 0.00 3.41
L.T., B.T., B.Ed. or Equivalent 0.92 9.39 4.00 5.27
M.Ed. or Equivalent 0.40 2.42 0.00 1.16
Others 6.22 3.94 4.00 3.28
Bihar
J.V., J.B.T. or Equivalent 17.63 13.46 20.17 20.29
S.V., C.V., S.B.T. or Equivalent 5.01 6.08 10.08 7.25
L.T., B.T., B.Ed. or Equivalent 6.89 10.39 16.39 4.35
M.Ed. or Equivalent 1.32 2.14 10.08 5.80 Others 3.45 6.11 7.56 5.80
Chandigarh
J.V., J.B.T. or Equivalent 0.00 33.33 9.30 0.00
S.V., C.V., S.B.T. or Equivalent 0.00 0.00 2.33 0.00
L.T., B.T., B.Ed. or Equivalent 100.00 66.67 72.09 0.00
M.Ed. or Equivalent 0.00 0.00 9.30 0.00
Others 0.00 0.00 6.98 0.00
Note: Total may not add to hundred because of no response.

7/30/2019 Analytical Tables 2007-08
http://slidepdf.com/reader/full/analytical-tables-2007-08 155/180
1 3 3
Table 4.14 Percentage of Para-Teachers by Professional Qualification : 2007-08 All A
School Category
State/UT Professional Primary with Primary with Upper Primary UppQualification Primary Only Upper Primary Upper Primary Only wit
& Sec./Hr. Sec. Se
Chhattisgarh
J.V., J.B.T. or Equivalent 34.79 21.84 18.90 31.20 S.V., C.V., S.B.T. or Equivalent 1.50 2.46 5.72 2.66
L.T., B.T., B.Ed. or Equivalent 6.14 6.69 5.88 11.59
M.Ed. or Equivalent 1.60 2.80 1.51 2.20
Others 6.45 5.32 1.99 5.65
Dadra & Nagar HaveIi
J.V., J.B.T. or Equivalent 0.00 0.00 0.00 0.00
S.V., C.V., S.B.T. or Equivalent 100.00 0.00 0.00 0.00
L.T., B.T., B.Ed. or Equivalent 0.00 0.00 0.00 0.00
M.Ed. or Equivalent 0.00 0.00 0.00 0.00
Others 0.00 0.00 0.00 0.00
Daman & Diu
J.V., J.B.T. or Equivalent 57.14 0.00 0.00 0.00
S.V., C.V., S.B.T. or Equivalent 28.57 0.00 23.08 0.00 L.T., B.T., B.Ed. or Equivalent 14.29 0.00 38.46 100.00
M.Ed. or Equivalent 0.00 0.00 0.00 0.00
Others 0.00 0.00 30.77 0.00
Delhi
J.V., J.B.T. or Equivalent 60.68 9.65 2.80 0.00
S.V., C.V., S.B.T. or Equivalent 1.34 0.88 2.51 5.00
L.T., B.T., B.Ed. or Equivalent 26.25 78.51 74.06 75.00
M.Ed. or Equivalent 3.05 1.75 4.82 5.00
Others 5.98 8.33 12.44 10.00
Goa
J.V., J.B.T. or Equivalent 34.29 0.00 37.50 20.00
S.V., C.V., S.B.T. or Equivalent 8.57 0.00 0.00 20.00
L.T., B.T., B.Ed. or Equivalent 11.43 75.00 50.00 40.00
M.Ed. or Equivalent 2.86 0.00 6.25 0.00
Others 8.57 0.00 0.00 0.00
Gujarat
J.V., J.B.T. or Equivalent 59.24 50.52 20.72 34.38
S.V., C.V., S.B.T. or Equivalent 3.53 5.07 7.17 0.00
L.T., B.T., B.Ed. or Equivalent 17.66 23.18 41.83 53.13
M.Ed. or Equivalent 0.82 2.13 2.39 0.00
Others 11.14 14.59 14.34 9.38

7/30/2019 Analytical Tables 2007-08
http://slidepdf.com/reader/full/analytical-tables-2007-08 156/180
1 3 4 Table 4.14 Percentage of Para-Teachers by Professional Qualification : 2007-08 All A
School Category
State/UT Professional Primary with Primary with Upper Primary UppQualification Primary Only Upper Primary Upper Primary Only with
& Sec./Hr. Sec. Se
Haryana
J.V., J.B.T. or Equivalent 44.01 10.68 13.35 2.65 S.V., C.V., S.B.T. or Equivalent 0.69 2.32 3.45 2.14
L.T., B.T., B.Ed. or Equivalent 51.89 77.44 71.62 90.15
M.Ed. or Equivalent 1.51 1.86 2.80 3.17
Others 0.46 0.93 1.12 0.86
Himachal Pradesh
J.V., J.B.T. or Equivalent 22.84 8.33 10.50 0.22
S.V., C.V., S.B.T. or Equivalent 5.66 9.26 13.50 38.71
L.T., B.T., B.Ed. or Equivalent 27.18 34.26 47.50 52.84
M.Ed. or Equivalent 1.57 0.00 3.00 1.64
Others 8.14 8.33 9.00 5.16
Jammu & Kashmir
J.V., J.B.T. or Equivalent 3.87 2.55 3.01 6.42
S.V., C.V., S.B.T. or Equivalent 1.14 1.49 1.58 0.00 L.T., B.T., B.Ed. or Equivalent 24.74 22.60 31.13 33.94
M.Ed. or Equivalent 5.18 3.62 5.74 3.67
Others 4.86 6.30 5.45 3.67
Jharkhand
J.V., J.B.T. or Equivalent 17.94 11.99 6.19 5.19
S.V., C.V., S.B.T. or Equivalent 4.63 7.40 1.88 2.60
L.T., B.T., B.Ed. or Equivalent 2.30 4.99 11.31 25.97
M.Ed. or Equivalent 0.75 1.04 1.88 0.00
Others 12.30 13.72 14.80 5.19
Karnataka
J.V., J.B.T. or Equivalent 0.00 0.00 0.00 0.00
S.V., C.V., S.B.T. or Equivalent 0.00 0.00 0.00 0.00
L.T., B.T., B.Ed. or Equivalent 0.00 0.00 0.00 0.00
M.Ed. or Equivalent 0.00 0.00 0.00 0.00 Others 0.00 0.00 0.00 0.00
Kerala
J.V., J.B.T. or Equivalent 7.81 7.36 1.71 6.13
S.V., C.V., S.B.T. or Equivalent 76.37 51.91 27.22 43.16
L.T., B.T., B.Ed. or Equivalent 11.97 36.31 64.70 46.23
M.Ed. or Equivalent 1.72 1.02 2.33 1.89
Others 0.71 0.82 0.62 0.94
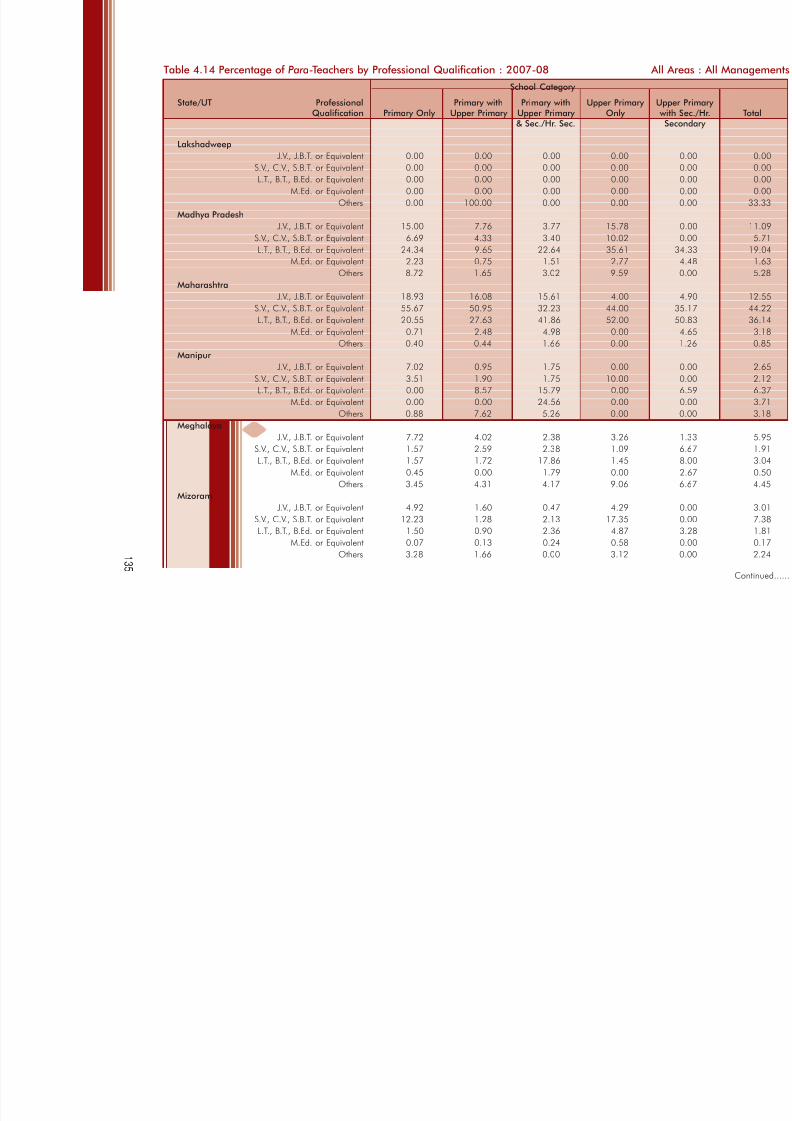
7/30/2019 Analytical Tables 2007-08
http://slidepdf.com/reader/full/analytical-tables-2007-08 157/180
1 3 5
Table 4.14 Percentage of Para-Teachers by Professional Qualification : 2007-08 All A
School Category
State/UT Professional Primary with Primary with Upper Primary UppQualification Primary Only Upper Primary Upper Primary Only wit
& Sec./Hr. Sec. Se
Lakshadweep
J.V., J.B.T. or Equivalent 0.00 0.00 0.00 0.00 S.V., C.V., S.B.T. or Equivalent 0.00 0.00 0.00 0.00
L.T., B.T., B.Ed. or Equivalent 0.00 0.00 0.00 0.00
M.Ed. or Equivalent 0.00 0.00 0.00 0.00
Others 0.00 100.00 0.00 0.00
Madhya Pradesh
J.V., J.B.T. or Equivalent 15.00 7.76 3.77 15.78
S.V., C.V., S.B.T. or Equivalent 6.69 4.33 3.40 10.02
L.T., B.T., B.Ed. or Equivalent 24.34 9.65 22.64 35.61
M.Ed. or Equivalent 2.23 0.75 1.51 2.77
Others 8.72 1.65 3.02 9.59
Maharashtra
J.V., J.B.T. or Equivalent 18.93 16.08 15.61 4.00
S.V., C.V., S.B.T. or Equivalent 55.67 50.95 32.23 44.00
L.T., B.T., B.Ed. or Equivalent 20.55 27.63 41.86 52.00
M.Ed. or Equivalent 0.71 2.48 4.98 0.00
Others 0.40 0.44 1.66 0.00
Manipur
J.V., J.B.T. or Equivalent 7.02 0.95 1.75 0.00
S.V., C.V., S.B.T. or Equivalent 3.51 1.90 1.75 10.00
L.T., B.T., B.Ed. or Equivalent 0.00 8.57 15.79 0.00
M.Ed. or Equivalent 0.00 0.00 24.56 0.00
Others 0.88 7.62 5.26 0.00
Meghalaya
J.V., J.B.T. or Equivalent 7.72 4.02 2.38 3.26
S.V., C.V., S.B.T. or Equivalent 1.57 2.59 2.38 1.09
L.T., B.T., B.Ed. or Equivalent 1.57 1.72 17.86 1.45
M.Ed. or Equivalent 0.45 0.00 1.79 0.00 Others 3.45 4.31 4.17 9.06
Mizoram
J.V., J.B.T. or Equivalent 4.92 1.60 0.47 4.29
S.V., C.V., S.B.T. or Equivalent 12.23 1.28 2.13 17.35
L.T., B.T., B.Ed. or Equivalent 1.50 0.90 2.36 4.87
M.Ed. or Equivalent 0.07 0.13 0.24 0.58
Others 3.28 1.66 0.00 3.12

7/30/2019 Analytical Tables 2007-08
http://slidepdf.com/reader/full/analytical-tables-2007-08 158/180
1 3 6 Table 4.14 Percentage of Para-Teachers by Professional Qualification : 2007-08 All A
School Category
State/UT Professional Primary with Primary with Upper Primary UppQualification Primary Only Upper Primary Upper Primary Only with
& Sec./Hr. Sec. Se
Nagaland
J.V., J.B.T. or Equivalent 4.60 0.00 5.56 0.00 S.V., C.V., S.B.T. or Equivalent 0.00 0.00 0.00 3.33
L.T., B.T., B.Ed. or Equivalent 8.05 5.71 11.11 3.33
M.Ed. or Equivalent 0.00 5.71 0.00 3.33
Others 4.60 2.86 0.00 20.00
Orissa
J.V., J.B.T. or Equivalent 4.27 2.57 3.23 1.01
S.V., C.V., S.B.T. or Equivalent 49.72 44.36 18.48 43.46
L.T., B.T., B.Ed. or Equivalent 16.67 25.30 45.73 39.22
M.Ed. or Equivalent 1.46 2.17 5.77 2.35
Others 2.26 1.89 9.24 1.26
Puducherry
J.V., J.B.T. or Equivalent 6.25 15.00 0.00 0.00
S.V., C.V., S.B.T. or Equivalent 16.67 0.00 5.66 0.00
L.T., B.T., B.Ed. or Equivalent 58.33 40.00 60.38 0.00 M.Ed. or Equivalent 6.25 5.00 4.72 0.00
Others 6.25 10.00 11.32 0.00
Punjab
J.V., J.B.T. or Equivalent 26.93 4.88 12.35 8.57
S.V., C.V., S.B.T. or Equivalent 2.04 9.76 2.47 21.90
L.T., B.T., B.Ed. or Equivalent 37.55 41.46 45.68 39.05
M.Ed. or Equivalent 1.75 0.00 6.17 4.76
Others 5.68 4.88 12.35 15.24
Rajasthan
J.V., J.B.T. or Equivalent 15.84 10.28 6.57 10.79
S.V., C.V., S.B.T. or Equivalent 31.41 24.16 14.42 23.02
L.T., B.T., B.Ed. or Equivalent 33.90 39.23 37.98 38.13
M.Ed. or Equivalent 1.42 3.01 3.40 4.32 Others 2.92 2.98 3.63 2.88
Sikkim
J.V., J.B.T. or Equivalent 3.70 10.53 11.11 0.00
S.V., C.V., S.B.T. or Equivalent 3.70 0.00 0.00 0.00
L.T., B.T., B.Ed. or Equivalent 0.00 10.53 0.00 0.00
M.Ed. or Equivalent 0.00 0.00 0.00 0.00
Others 22.22 0.00 0.00 0.00
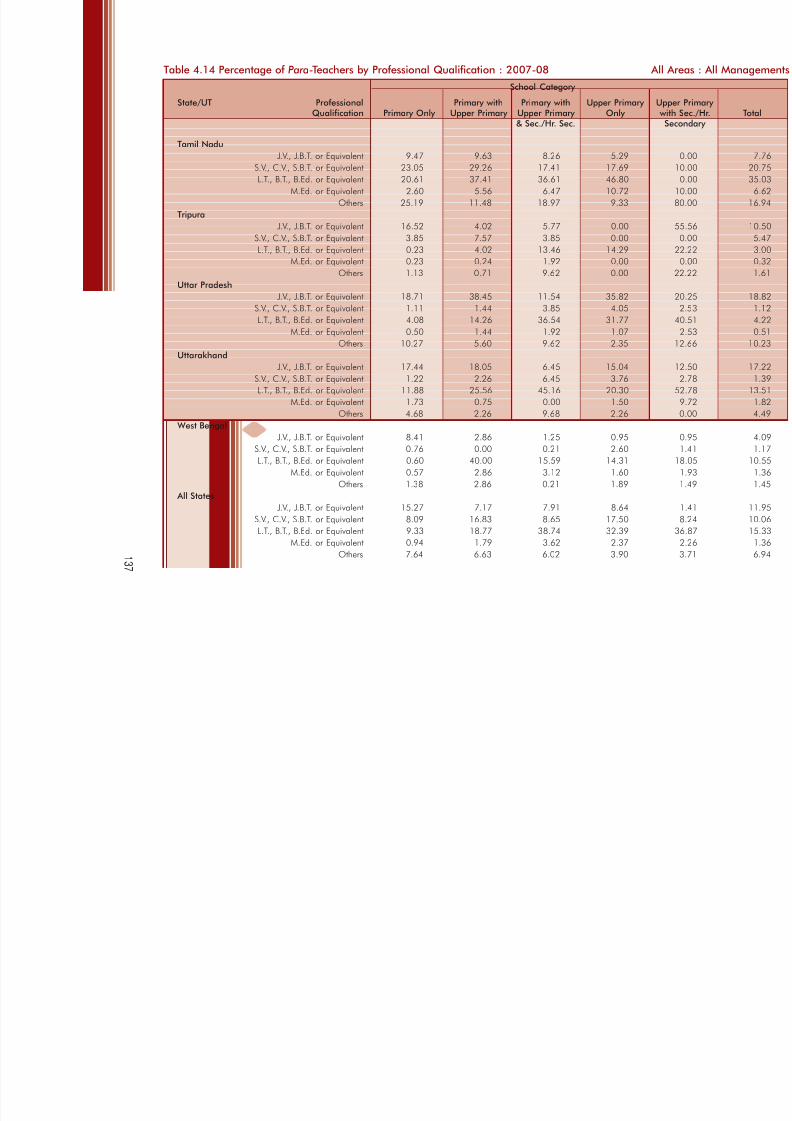
7/30/2019 Analytical Tables 2007-08
http://slidepdf.com/reader/full/analytical-tables-2007-08 159/180
1 3 7
Table 4.14 Percentage of Para-Teachers by Professional Qualification : 2007-08 All A
School Category
State/UT Professional Primary with Primary with Upper Primary UppQualification Primary Only Upper Primary Upper Primary Only wit
& Sec./Hr. Sec. Se
Tamil Nadu
J.V., J.B.T. or Equivalent 9.47 9.63 8.26 5.29 S.V., C.V., S.B.T. or Equivalent 23.05 29.26 17.41 17.69
L.T., B.T., B.Ed. or Equivalent 20.61 37.41 36.61 46.80
M.Ed. or Equivalent 2.60 5.56 6.47 10.72
Others 25.19 11.48 18.97 9.33
Tripura
J.V., J.B.T. or Equivalent 16.52 4.02 5.77 0.00
S.V., C.V., S.B.T. or Equivalent 3.85 7.57 3.85 0.00
L.T., B.T., B.Ed. or Equivalent 0.23 4.02 13.46 14.29
M.Ed. or Equivalent 0.23 0.24 1.92 0.00
Others 1.13 0.71 9.62 0.00
Uttar Pradesh
J.V., J.B.T. or Equivalent 18.71 38.45 11.54 35.82
S.V., C.V., S.B.T. or Equivalent 1.11 1.44 3.85 4.05
L.T., B.T., B.Ed. or Equivalent 4.08 14.26 36.54 31.77
M.Ed. or Equivalent 0.50 1.44 1.92 1.07
Others 10.27 5.60 9.62 2.35
Uttarakhand
J.V., J.B.T. or Equivalent 17.44 18.05 6.45 15.04
S.V., C.V., S.B.T. or Equivalent 1.22 2.26 6.45 3.76
L.T., B.T., B.Ed. or Equivalent 11.88 25.56 45.16 20.30
M.Ed. or Equivalent 1.73 0.75 0.00 1.50
Others 4.68 2.26 9.68 2.26
West Bengal
J.V., J.B.T. or Equivalent 8.41 2.86 1.25 0.95
S.V., C.V., S.B.T. or Equivalent 0.76 0.00 0.21 2.60
L.T., B.T., B.Ed. or Equivalent 0.60 40.00 15.59 14.31
M.Ed. or Equivalent 0.57 2.86 3.12 1.60 Others 1.38 2.86 0.21 1.89
All States
J.V., J.B.T. or Equivalent 15.27 7.17 7.91 8.64
S.V., C.V., S.B.T. or Equivalent 8.09 16.83 8.65 17.50
L.T., B.T., B.Ed. or Equivalent 9.33 18.77 38.74 32.39
M.Ed. or Equivalent 0.94 1.79 3.62 2.37
Others 7.64 6.63 6.02 3.90

7/30/2019 Analytical Tables 2007-08
http://slidepdf.com/reader/full/analytical-tables-2007-08 160/180
1 3 8 Table 4.15 Percentage of Teachers by Caste : 2007-08 All A
School Category
State/UT Caste Primary with Primary with Upper Primary Upper Primary
Primary Only Upper Primary Upper Primary Only with Sec./Hr.
& Sec./Hr. Sec. Secondary
Male Female Male Female Male Female Male Female Male Female
A & N Islands
General 85.42 84.70 87.77 89.09 89.56 90.91 100.00 100.00 81.40 89.57
SC 0.00 0.38 0.00 0.18 0.59 0.23 0.00 0.00 3.88 1.23
ST 7.55 8.60 10.11 5.09 7.79 7.48 0.00 0.00 2.33 3.07
OBC 7.03 5.93 2.13 5.64 1.62 1.15 0.00 0.00 9.30 2.45
ORC 0.00 0.00 0.00 0.00 0.15 0.00 0.00 0.00 0.00 0.00
Others 0.00 0.38 0.00 0.00 0.00 0.12 0.00 0.00 3.10 3.68
No Response 0.00 0.00 0.00 0.00 0.29 0.12 0.00 0.00 0.00 0.00
Andhra Pradesh
General 32.02 44.67 34.80 43.21 63.84 76.57 0.00 0.00 43.32 54.25
SC 14.71 14.15 13.49 14.13 9.14 7.10 0.00 0.00 10.95 10.61
ST 14.31 5.98 6.66 3.51 3.00 1.13 0.00 0.00 3.80 2.45
OBC 38.96 35.20 45.05 39.15 24.02 15.20 0.00 0.00 41.92 32.69
ORC 0.00 0.00 0.00 0.00 0.00 0.00 0.00 0.00 0.00 0.00 Others 0.00 0.00 0.00 0.00 0.00 0.00 0.00 0.00 0.00 0.00
No Response 0.00 0.00 0.00 0.00 0.00 0.00 0.00 0.00 0.00 0.00
Arunachal Pradesh
General 15.01 17.52 33.81 31.05 55.30 40.72 48.84 47.83 58.02 61.26
SC 2.14 2.24 1.35 1.09 1.92 1.05 0.00 0.00 3.31 1.80
ST 79.96 77.92 59.25 65.14 35.76 54.49 34.88 47.83 30.53 35.14
OBC 2.53 2.12 5.07 2.26 5.03 2.69 16.28 4.35 8.14 1.80
ORC 0.09 0.12 0.05 0.09 0.07 0.45 0.00 0.00 0.00 0.00
Others 0.28 0.08 0.46 0.36 1.92 0.60 0.00 0.00 0.00 0.00
No Response 0.00 0.00 0.00 0.00 0.00 0.00 0.00 0.00 0.00 0.00
Assam
General 26.10 29.67 39.78 42.45 34.19 41.91 31.65 32.80 35.52 40.76
SC 6.70 5.73 5.19 4.85 5.18 5.55 5.56 5.03 5.12 4.49
ST 19.65 19.86 9.36 8.08 16.45 16.22 16.02 14.95 13.99 11.49
OBC 27.56 32.66 35.48 38.96 23.48 24.48 27.53 34.98 28.22 35.30
ORC 0.13 0.16 0.15 0.12 0.42 0.73 0.10 0.12 0.16 0.12
Others 19.86 11.91 10.05 5.54 20.28 11.11 19.13 12.11 16.96 7.80
No Response 0.00 0.00 0.00 0.00 0.00 0.00 0.00 0.00 0.03 0.05
Note: Total may not add to hundred because of rounding of figures.

7/30/2019 Analytical Tables 2007-08
http://slidepdf.com/reader/full/analytical-tables-2007-08 161/180
1 3 9
Table 4.15 Percentage of Teachers by Caste : 2007-08 All A
School Category
State/UT Caste Primary with Primary with Upper Primary Upper Primary
Primary Only Upper Primary Upper Primary Only with Sec./Hr.
& Sec./Hr. Sec. Secondary
Male Female Male Female Male Female Male Female Male Female
Bihar
General 29.56 34.81 35.82 41.80 54.42 47.91 40.51 36.39 59.04 62.60 SC 17.97 13.47 13.89 10.95 7.89 8.04 10.15 10.89 7.76 8.27
ST 5.08 5.31 3.71 3.68 5.00 7.23 2.65 3.22 3.86 3.54
OBC 46.49 45.28 45.51 42.49 30.89 33.12 45.01 46.78 25.99 25.20
ORC 0.45 0.52 0.54 0.50 1.44 1.77 1.06 1.49 0.69 0.39
Others 0.44 0.60 0.53 0.58 0.35 1.93 0.62 1.24 2.66 0.00
No Response 0.00 0.00 0.00 0.00 0.00 0.00 0.00 0.00 0.00 0.00
Chandigarh
General 55.17 87.08 64.71 90.93 73.64 91.15 100.00 92.31 80.00 94.12
SC 24.14 8.00 19.12 5.77 14.00 6.37 0.00 7.69 10.59 5.01
ST 0.00 0.00 0.00 0.55 0.25 0.21 0.00 0.00 0.00 0.22
OBC 20.69 4.92 16.18 2.75 11.73 2.24 0.00 0.00 9.41 0.44
ORC 0.00 0.00 0.00 0.00 0.13 0.03 0.00 0.00 0.00 0.00
Others 0.00 0.00 0.00 0.00 0.25 0.00 0.00 0.00 0.00 0.22
No Response 0.00 0.00 0.00 0.00 0.00 0.00 0.00 0.00 0.00 0.00
Chhattisgarh
General 12.18 22.52 20.01 35.39 23.01 47.45 14.16 25.36 21.20 38.67
SC 14.24 13.35 10.52 7.88 12.09 8.33 14.78 12.67 13.18 10.94
ST 33.72 29.90 25.76 15.98 16.90 11.76 29.21 30.55 22.99 20.43
OBC 39.09 32.41 42.76 38.74 46.38 29.97 41.08 29.66 41.17 27.20
ORC 0.24 0.42 0.27 0.41 0.27 0.43 0.17 0.31 0.32 0.61
Others 0.52 1.35 0.63 1.54 1.11 1.68 0.58 1.35 1.16 2.07
No Response 0.02 0.04 0.05 0.07 0.25 0.38 0.03 0.09 0.00 0.08
D & N Haveli
General 9.05 34.52 15.98 43.89 65.22 87.88 42.86 40.00 0.00 50.00
SC 4.76 7.14 7.16 6.00 0.00 1.01 28.57 40.00 50.00 16.67
ST 80.48 51.79 71.63 38.92 34.78 3.03 14.29 20.00 50.00 0.00
OBC 3.81 3.57 3.86 5.38 0.00 1.01 14.29 0.00 0.00 33.33
ORC 0.00 0.00 0.00 0.00 0.00 0.00 0.00 0.00 0.00 0.00
Others 1.90 2.38 1.38 5.80 0.00 7.07 0.00 0.00 0.00 0.00
No Response 0.00 0.60 0.00 0.00 0.00 0.00 0.00 0.00 0.00 0.00

7/30/2019 Analytical Tables 2007-08
http://slidepdf.com/reader/full/analytical-tables-2007-08 162/180
1 4 0 Table 4.15 Percentage of Teachers by Caste : 2007-08 All A
School Category
State/UT Caste Primary with Primary with Upper Primary Upper Primary
Primary Only Upper Primary Upper Primary Only with Sec./Hr.
& Sec./Hr. Sec. Secondary
Male Female Male Female Male Female Male Female Male Female
Daman & Diu
General 30.77 35.38 34.48 28.21 66.00 56.86 38.18 48.89 41.18 44.44
SC 3.85 10.38 6.90 2.56 10.00 6.86 5.45 13.33 11.76 3.70
ST 10.26 9.91 6.90 2.56 2.00 0.98 3.64 2.22 0.00 0.00
OBC 48.72 33.02 48.28 28.21 12.00 18.63 30.91 20.00 38.24 18.52
ORC 1.28 2.36 3.45 0.00 0.00 0.00 3.64 6.67 0.00 0.00
Others 3.85 6.60 0.00 38.46 10.00 2.94 0.00 4.44 8.82 33.33
No Response 1.28 2.36 0.00 0.00 0.00 13.73 18.18 4.44 0.00 0.00
Delhi
General 55.54 76.15 74.35 89.82 71.07 88.32 67.45 82.15 63.55 81.26
SC 18.81 11.42 10.37 3.63 16.61 6.47 20.72 10.76 22.30 12.81
ST 5.40 2.09 1.86 0.74 2.45 0.91 2.09 2.28 3.72 1.45
OBC 19.00 9.83 11.50 5.26 9.22 3.69 8.90 3.67 9.82 4.23
ORC 0.37 0.13 0.20 0.17 0.05 0.05 0.00 0.00 0.11 0.02 Others 0.88 0.38 1.73 0.39 0.61 0.55 0.83 1.14 0.51 0.23
No Response 0.00 0.00 0.00 0.00 0.00 0.00 0.00 0.00 0.00 0.00
Goa
General 71.36 85.98 78.71 86.44 91.67 97.36 78.72 94.37 87.18 93.81
SC 5.68 1.54 1.94 0.70 0.81 0.23 1.06 0.00 0.91 0.96
ST 8.40 0.82 3.23 0.88 1.34 0.29 2.13 1.41 3.24 0.52
OBC 12.84 10.42 12.26 6.16 6.18 1.99 18.09 4.23 7.64 3.83
ORC 0.25 0.14 0.00 0.00 0.00 0.06 0.00 0.00 0.13 0.00
Others 1.48 1.10 3.87 5.81 0.00 0.06 0.00 0.00 0.91 0.88
No Response 0.00 0.00 0.00 0.00 0.00 0.00 0.00 0.00 0.00 0.00
Gujarat
General 27.01 38.50 35.32 46.06 55.13 69.36 50.41 54.74 47.41 63.27
SC 11.24 10.21 11.36 9.65 8.06 6.01 9.12 12.14 10.34 5.10
ST 26.13 18.79 15.39 12.26 10.21 5.82 12.40 7.85 9.27 5.33
OBC 29.21 22.41 32.64 24.00 23.29 14.98 25.50 18.80 26.72 18.66
ORC 0.33 0.66 0.31 0.53 0.20 0.55 0.23 0.18 0.86 0.46
Others 6.08 9.42 4.98 7.51 3.11 3.28 2.34 6.30 5.39 7.18
No Response 0.00 0.00 0.00 0.00 0.00 0.00 0.00 0.00 0.00 0.00

7/30/2019 Analytical Tables 2007-08
http://slidepdf.com/reader/full/analytical-tables-2007-08 163/180
1 4 1
Table 4.15 Percentage of Teachers by Caste : 2007-08 All A
School Category
State/UT Caste Primary with Primary with Upper Primary Upper Primary
Primary Only Upper Primary Upper Primary Only with Sec./Hr.
& Sec./Hr. Sec. Secondary
Male Female Male Female Male Female Male Female Male Female
Haryana
General 47.14 77.35 61.31 78.51 63.61 81.29 63.49 76.42 63.26 78.90 SC 20.98 6.53 13.46 5.75 12.13 4.64 11.96 5.67 9.60 4.80
ST 0.48 0.33 0.91 0.45 0.72 0.47 0.37 0.40 0.56 0.44
OBC 30.20 14.76 22.66 14.09 21.96 12.62 22.93 16.16 25.19 14.63
ORC 0.96 0.65 1.23 0.58 1.07 0.47 0.84 1.01 1.16 0.92
Others 0.24 0.37 0.43 0.63 0.50 0.52 0.40 0.35 0.23 0.32
No Response 0.00 0.01 0.00 0.00 0.00 0.00 0.00 0.00 0.00 0.00
Himachal Pradesh
General 59.64 73.43 69.57 79.40 73.11 84.48 66.54 72.43 68.37 76.36
SC 20.50 11.38 13.45 8.49 13.25 7.09 14.66 11.13 14.85 11.47
ST 8.63 5.60 3.31 3.13 2.37 1.75 5.91 5.85 5.28 3.48
OBC 11.10 9.29 13.45 8.67 10.96 6.28 12.70 10.30 11.26 8.46
ORC 0.11 0.24 0.23 0.18 0.27 0.30 0.14 0.26 0.17 0.21
Others 0.02 0.06 0.00 0.13 0.04 0.10 0.05 0.04 0.07 0.03
No Response 0.00 0.00 0.00 0.00 0.00 0.00 0.00 0.00 0.00 0.00
Jammu & Kashmir
General 69.23 78.94 74.72 83.71 80.70 89.64 78.53 78.73 74.73 88.22
SC 5.37 5.69 4.57 4.93 5.60 3.94 1.13 1.81 1.24 1.68
ST 12.78 8.39 9.56 6.03 6.83 3.15 2.43 13.12 8.93 4.55
OBC 8.45 5.04 7.33 3.93 4.94 2.70 5.65 4.98 9.78 4.04
ORC 0.20 0.24 0.26 0.14 0.16 0.15 0.00 0.00 0.11 0.00
Others 3.97 1.71 3.56 1.26 1.77 0.42 2.26 1.36 5.20 1.52
No Response 0.00 0.00 0.00 0.00 0.00 0.00 0.00 0.00 0.00 0.00
Jharkhand
General 15.95 16.17 24.41 26.32 46.56 65.27 43.27 32.67 42.15 36.77
SC 10.56 6.56 9.67 5.51 5.85 3.70 5.45 7.95 3.81 2.90
ST 29.41 44.18 17.61 37.44 8.38 13.95 17.95 32.81 15.71 41.85
OBC 43.24 32.20 47.37 29.65 38.13 15.84 32.05 25.85 36.38 17.22
ORC 0.44 0.50 0.31 0.28 0.35 0.30 0.64 0.00 0.83 0.44
Others 0.40 0.38 0.63 0.79 0.73 0.94 0.64 0.71 1.12 0.82
No Response 0.00 0.00 0.00 0.00 0.00 0.00 0.00 0.00 0.00 0.00

7/30/2019 Analytical Tables 2007-08
http://slidepdf.com/reader/full/analytical-tables-2007-08 164/180
1 4 2 Table 4.15 Percentage of Teachers by Caste : 2007-08 All A
School Category
State/UT Caste Primary with Primary with Upper Primary Upper Primary
Primary Only Upper Primary Upper Primary Only with Sec./Hr.
& Sec./Hr. Sec. Secondary
Male Female Male Female Male Female Male Female Male Female
Karnataka
General 49.93 60.95 55.85 67.35 73.89 84.53 60.23 65.41 73.36 79.13
SC 15.65 9.86 14.57 8.89 7.19 3.73 12.99 8.20 9.16 4.62
ST 3.86 2.47 3.99 2.16 2.24 0.64 3.51 1.65 3.44 1.28
OBC 29.45 26.43 24.96 21.27 16.02 10.61 22.39 23.64 13.93 14.86
ORC 0.09 0.12 0.10 0.14 0.32 0.28 0.18 0.47 0.00 0.06
Others 1.03 0.18 0.53 0.18 0.34 0.21 0.70 0.63 0.11 0.06
No Response 0.00 0.00 0.00 0.00 0.00 0.00 0.00 0.00 0.00 0.00
Kerala
General 29.61 44.02 32.96 43.94 41.79 51.59 46.39 58.42 46.66 56.34
SC 3.84 3.87 3.82 4.07 6.74 4.52 2.48 2.28 3.96 3.52
ST 4.50 3.72 2.62 2.52 2.04 2.08 1.65 1.83 1.92 1.67
OBC 55.42 39.75 53.18 40.32 43.88 36.01 43.78 30.93 41.94 32.92
ORC 1.86 2.04 1.47 1.71 2.14 2.08 1.59 1.29 1.53 1.59 Others 4.72 6.53 5.88 7.32 3.31 3.54 3.88 5.10 3.85 3.73
No Response 0.05 0.07 0.06 0.11 0.11 0.18 0.22 0.15 0.14 0.23
Lakshadweep
General 0.00 0.00 1.22 0.00 0.00 0.00 0.00 0.00 3.17 2.63
SC 0.00 0.00 0.00 0.00 0.00 0.00 0.00 0.00 0.00 2.63
ST 100.00 100.00 98.78 100.00 100.00 97.14 100.00 100.00 95.24 84.21
OBC 0.00 0.00 0.00 0.00 0.00 0.00 0.00 0.00 0.00 2.63
ORC 0.00 0.00 0.00 0.00 0.00 0.00 0.00 0.00 0.00 0.00
Others 0.00 0.00 0.00 0.00 0.00 2.86 0.00 0.00 1.59 7.89
No Response 0.00 0.00 0.00 0.00 0.00 0.00 0.00 0.00 0.00 0.00
Madhya Pradesh
General 31.24 44.01 46.94 57.12 56.17 70.08 36.36 49.06 56.04 72.41
SC 16.45 13.12 8.55 6.49 6.99 4.12 17.12 13.06 7.67 4.65
ST 21.18 15.48 3.52 2.54 2.54 2.30 16.29 12.49 4.62 2.05
OBC 31.10 27.33 40.97 33.64 34.30 23.51 30.19 25.34 31.67 20.89
ORC 0.01 0.03 0.01 0.00 0.00 0.00 0.02 0.02 0.00 0.00
Others 0.01 0.03 0.01 0.00 0.00 0.00 0.02 0.03 0.00 0.00
No Response 0.00 0.00 0.00 0.00 0.00 0.00 0.00 0.00 0.00 0.00

7/30/2019 Analytical Tables 2007-08
http://slidepdf.com/reader/full/analytical-tables-2007-08 165/180
1 4 3
Table 4.15 Percentage of Teachers by Caste : 2007-08 All A
School Category
State/UT Caste Primary with Primary with Upper Primary Upper Primary
Primary Only Upper Primary Upper Primary Only with Sec./Hr.
& Sec./Hr. Sec. Secondary
Male Female Male Female Male Female Male Female Male Female
Maharashtra
General 29.84 45.30 33.47 42.13 37.54 60.91 38.18 56.48 36.67 47.57 SC 13.23 10.98 12.95 11.96 12.78 8.27 11.82 8.12 13.78 11.80
ST 12.06 5.09 8.91 4.86 9.41 4.04 5.84 2.13 5.69 5.00
OBC 37.85 32.53 37.60 34.69 33.17 22.41 35.06 26.69 35.63 29.36
ORC 4.85 2.85 4.78 2.86 4.25 1.33 5.19 1.35 5.77 3.21
Others 2.17 3.24 2.28 3.47 2.81 2.94 3.90 5.22 2.46 3.06
No Response 0.00 0.00 0.00 0.02 0.04 0.10 0.00 0.00 0.01 0.01
Manipur
General 43.60 50.72 50.59 60.12 51.91 55.75 70.67 64.52 74.23 88.33
SC 3.01 3.75 4.55 4.10 4.00 3.70 8.44 14.52 12.64 3.45
ST 48.00 43.78 38.20 31.14 33.02 34.38 15.11 18.55 6.44 4.24
OBC 5.09 1.66 6.39 4.24 10.67 5.72 5.78 2.42 6.44 3.98
ORC 0.02 0.03 0.17 0.13 0.05 0.09 0.00 0.00 0.00 0.00
Others 0.29 0.06 0.10 0.27 0.33 0.37 0.00 0.00 0.25 0.00
No Response 0.00 0.00 0.00 0.00 0.02 0.00 0.00 0.00 0.00 0.00
Meghalaya
General 4.96 3.49 6.21 3.55 20.89 12.44 10.37 4.80 21.76 12.43
SC 1.21 0.78 2.75 1.53 4.95 2.53 2.98 1.22 3.92 2.20
ST 92.94 95.12 88.06 93.00 70.05 82.88 83.33 92.77 68.12 82.29
OBC 0.67 0.53 2.44 0.99 2.29 1.27 2.63 0.83 5.44 1.76
ORC 0.01 0.00 0.00 0.00 0.12 0.00 0.04 0.03 0.00 0.00
Others 0.20 0.09 0.55 0.94 1.69 0.88 0.62 0.35 0.76 1.32
No Response 0.00 0.00 0.00 0.00 0.00 0.00 0.02 0.00 0.00 0.00
Mizoram
General 1.04 0.75 2.66 2.43 5.62 3.46 1.08 2.03 0.00 0.00
SC 0.84 1.08 2.05 1.46 3.65 2.07 0.65 1.15 1.11 2.04
ST 97.52 97.51 92.97 95.02 86.52 93.32 97.45 96.28 97.78 97.96
OBC 0.58 0.63 2.05 0.91 3.93 1.15 0.50 0.27 1.11 0.00
ORC 0.03 0.00 0.00 0.00 0.00 0.00 0.03 0.00 0.00 0.00
Others 0.00 0.03 0.27 0.18 0.28 0.00 0.18 0.14 0.00 0.00
No Response 0.00 0.00 0.00 0.00 0.00 0.00 0.13 0.14 0.00 0.00

7/30/2019 Analytical Tables 2007-08
http://slidepdf.com/reader/full/analytical-tables-2007-08 166/180
1 4 4 Table 4.15 Percentage of Teachers by Caste : 2007-08 All A
School Category
State/UT Caste Primary with Primary with Upper Primary Upper Primary
Primary Only Upper Primary Upper Primary Only with Sec./Hr.
& Sec./Hr. Sec. Secondary
Male Female Male Female Male Female Male Female Male Female
Nagaland
General 1.94 1.44 20.17 11.99 32.86 15.12 9.09 2.77 10.67 4.03
SC 2.04 1.24 6.69 4.70 12.25 7.02 5.43 1.63 4.48 1.65
ST 94.73 97.22 66.51 79.34 49.94 76.19 81.47 94.13 79.14 92.12
OBC 0.95 0.03 4.46 2.85 4.36 1.23 2.65 1.31 4.57 2.01
ORC 0.02 0.00 0.42 0.07 0.12 0.05 0.12 0.00 0.00 0.00
Others 0.32 0.08 1.75 1.06 0.48 0.39 1.24 0.16 1.14 0.18
No Response 0.00 0.00 0.00 0.00 0.00 0.00 0.00 0.00 0.00 0.00
Orissa
General 28.71 46.10 30.63 48.18 57.81 67.11 35.65 47.58 54.75 69.10
SC 17.66 13.50 14.48 12.53 6.27 9.73 5.18 9.57 6.48 6.53
ST 18.97 12.28 14.01 10.65 6.46 6.98 5.20 9.80 4.62 5.50
OBC 34.02 27.24 40.23 27.77 27.96 14.20 53.07 31.95 33.28 17.63
ORC 0.15 0.20 0.19 0.16 0.30 0.15 0.29 0.36 0.20 0.26 Others 0.48 0.68 0.46 0.71 1.19 1.84 0.62 0.73 0.67 0.99
No Response 0.00 0.00 0.00 0.00 0.00 0.00 0.00 0.00 0.00 0.00
Puducherry
General 15.35 17.88 11.45 16.38 21.18 24.42 0.00 0.00 21.12 29.05
SC 23.76 16.53 24.94 14.80 17.16 8.56 0.00 0.00 17.96 19.88
ST 2.23 3.23 0.51 1.58 1.62 1.22 0.00 0.00 0.49 0.31
OBC 23.76 26.48 33.59 46.12 34.50 44.98 0.00 0.00 15.05 12.23
ORC 0.99 0.27 1.53 1.58 1.71 1.22 0.00 0.00 3.88 3.06
Others 1.24 3.90 1.53 2.73 2.82 4.81 0.00 0.00 3.40 2.14
No Response 32.67 31.72 26.46 16.81 21.01 14.79 0.00 0.00 38.11 33.33
Punjab
General 54.40 65.06 71.27 78.90 79.80 88.09 63.56 73.18 63.40 74.48
SC 31.04 21.64 12.42 8.01 8.51 4.98 20.94 15.79 20.88 15.09
ST 0.95 0.84 1.24 1.22 1.19 0.65 0.86 0.55 0.62 0.54
OBC 13.20 11.87 13.20 10.34 10.03 5.65 14.03 9.98 14.00 9.12
ORC 0.17 0.18 0.31 0.00 0.13 0.10 0.20 0.12 0.33 0.17
Others 0.24 0.41 1.55 1.54 0.33 0.53 0.40 0.39 0.77 0.60
No Response 0.00 0.00 0.00 0.00 0.00 0.00 0.00 0.00 0.00 0.00

7/30/2019 Analytical Tables 2007-08
http://slidepdf.com/reader/full/analytical-tables-2007-08 167/180
1 4 5
Table 4.15 Percentage of Teachers by Caste : 2007-08 All A
School Category
State/UT Caste Primary with Primary with Upper Primary Upper Primary
Primary Only Upper Primary Upper Primary Only with Sec./Hr.
& Sec./Hr. Sec. Secondary
Male Female Male Female Male Female Male Female Male Female
Rajasthan
General 28.13 53.03 30.87 56.50 36.48 65.25 28.72 44.33 38.47 66.93 SC 19.13 10.17 18.53 9.16 13.09 5.91 19.59 12.64 15.45 6.13
ST 11.96 6.69 9.11 4.48 4.95 2.22 14.70 9.03 7.34 2.69
OBC 39.50 29.06 40.34 28.76 44.25 25.42 35.81 33.83 37.27 22.77
ORC 0.66 0.46 0.86 0.54 0.75 0.50 0.51 0.16 0.98 0.62
Others 0.27 0.54 0.30 0.51 0.31 0.62 0.51 0.00 0.32 0.70
No Response 0.35 0.04 0.19 0.04 0.18 0.10 0.17 0.00 0.17 0.15
Sikkim
General 19.36 13.24 21.92 19.15 22.62 18.39 57.14 50.00 56.25 20.00
SC 3.76 5.22 3.50 3.06 3.29 4.13 0.00 7.14 6.25 3.33
ST 39.12 40.44 32.92 42.07 38.56 42.12 14.29 35.71 0.00 30.00
OBC 36.72 38.79 36.67 32.31 29.81 33.40 28.57 0.00 37.50 43.33
ORC 0.32 0.44 0.50 0.47 0.17 0.28 0.00 0.00 0.00 0.00
Others 0.73 1.59 4.50 2.94 4.51 1.69 0.00 7.14 0.00 3.33
No Response 0.00 0.27 0.00 0.00 1.04 0.00 0.00 0.00 0.00 0.00
Tamil Nadu
General 6.75 7.76 6.11 7.88 6.89 11.12 8.94 16.09 0.00 1.20
SC 16.47 13.56 18.34 12.96 18.03 10.99 13.96 8.58 0.00 17.13
ST 1.08 0.71 0.81 0.59 0.74 0.69 0.59 0.58 0.00 4.38
OBC 75.57 77.89 74.68 78.49 74.22 77.10 76.40 74.56 100.00 77.29
ORC 0.06 0.06 0.05 0.05 0.04 0.05 0.09 0.16 0.00 0.00
Others 0.07 0.03 0.02 0.02 0.08 0.05 0.02 0.03 0.00 0.00
No Response 0.00 0.00 0.00 0.01 0.00 0.00 0.00 0.00 0.00 0.00
TripuraGeneral 14.56 25.33 22.15 33.33 37.64 50.17 50.00 57.14 46.86 54.68
SC 11.20 9.46 14.86 11.35 16.89 10.75 25.00 0.00 15.12 11.33
ST 58.10 46.29 36.73 36.26 17.97 19.48 0.00 14.29 12.28 13.79
OBC 11.64 12.07 19.45 13.86 20.41 13.43 25.00 28.57 20.21 15.27
ORC 1.05 1.36 2.12 1.11 1.64 0.77 0.00 0.00 0.90 0.49
Others 3.45 5.50 4.70 4.09 5.44 5.40 0.00 0.00 4.64 4.43
No Response 0.00 0.00 0.00 0.00 0.00 0.00 0.00 0.00 0.00 0.00

7/30/2019 Analytical Tables 2007-08
http://slidepdf.com/reader/full/analytical-tables-2007-08 168/180
1 4 6 Table 4.15 Percentage of Teachers by Caste : 2007-08 All A
School Category
State/UT Caste Primary with Primary with Upper Primary Upper Primary
Primary Only Upper Primary Upper Primary Only with Sec./Hr.
& Sec./Hr. Sec. Secondary
Male Female Male Female Male Female Male Female Male Female
Uttar Pradesh
General 40.59 49.68 48.86 65.13 50.24 66.75 42.98 56.94 53.79 63.27
SC 15.51 11.62 11.54 7.55 11.12 7.75 16.76 13.44 9.79 10.42
ST 0.75 0.72 0.92 0.71 0.90 0.44 0.82 0.85 0.94 1.09
OBC 40.53 34.77 34.98 22.30 33.19 19.96 36.08 23.84 33.24 22.08
ORC 0.64 0.73 0.78 1.14 0.26 1.45 0.83 0.90 0.35 1.09
Others 1.97 2.46 2.92 3.18 4.29 3.65 2.54 4.03 1.89 2.04
No Response 0.00 0.00 0.00 0.00 0.00 0.00 0.00 0.00 0.00 0.00
Uttarakhand
General 65.76 72.37 70.17 73.01 66.48 71.76 67.87 74.21 69.48 64.29
SC 12.69 9.05 10.37 6.11 9.81 3.77 14.63 12.32 12.19 14.16
ST 3.28 2.98 2.75 2.10 2.74 2.13 2.58 2.85 1.91 2.98
OBC 17.13 12.40 15.62 13.77 13.80 7.06 14.22 7.46 14.80 6.46
ORC 0.49 0.59 0.38 1.05 1.48 0.77 0.46 0.71 0.83 0.43 Others 0.11 0.16 0.00 0.27 0.00 0.39 0.02 0.08 0.06 0.19
No Response 0.55 2.45 0.70 3.69 5.70 14.12 0.22 2.37 0.74 11.49
West Bengal
General 62.86 74.49 77.08 87.65 69.21 72.80 67.43 72.67 68.45 74.65
SC 22.84 15.09 13.39 9.88 20.49 17.24 19.86 18.66 19.61 16.58
ST 4.98 4.18 3.27 0.62 4.19 4.79 5.26 3.86 4.75 3.09
OBC 8.38 4.91 3.27 1.23 5.30 4.21 6.69 4.19 6.46 5.04
ORC 0.18 0.16 0.00 0.62 0.05 0.13 0.16 0.09 0.18 0.11
Others 0.74 1.10 1.49 0.00 0.35 0.77 0.59 0.53 0.55 0.53
No Response 0.01 0.07 1.49 0.00 0.40 0.06 0.02 0.00 0.00 0.01
All States
General 35.09 43.93 36.96 48.30 46.29 62.24 36.45 40.06 47.48 59.90
SC 15.57 11.55 13.14 9.64 11.43 6.60 13.64 10.27 12.75 10.09
ST 12.98 8.79 9.49 6.95 8.07 5.18 11.86 8.55 5.83 4.13
OBC 33.76 33.33 37.91 32.18 31.43 24.01 33.54 38.55 30.19 23.36
ORC 0.56 0.53 0.99 0.70 0.96 0.47 0.37 0.36 1.60 0.87
Others 2.02 1.80 1.46 2.18 1.59 1.25 4.12 2.15 2.08 1.50
No Response 0.04 0.08 0.05 0.04 0.24 0.24 0.02 0.07 0.07 0.15

7/30/2019 Analytical Tables 2007-08
http://slidepdf.com/reader/full/analytical-tables-2007-08 169/180
1 4 7
Table 4.16 Number of Working Days Spent on Non-Teaching Assignments : 2006-07 All A
School Category
Primary Primary Primary Upper Primary Upper PrimaryOnly with Upper with Upper only with All Sc
Primary Primary & Sec./H.Sec.Sec./H.Sec.
A & N Islands 9 10 13 0 15 1
Andhra Pradesh 11 12 10 0 12 12 Arunachal Pradesh 21 20 38 0 13 2
Assam 21 15 22 24 28 22
Bihar 23 25 18 24 15 24
Chandigarh 9 4 9 6 4
Chhattisgarh 17 14 34 17 39 1
D & N Haveli NR NR NR NR NR N
Daman & Diu 29 9 32 0 4 23
Delhi 20 21 24 49 26 24
Goa 16 8 22 13 18 1
Gujarat 16 12 30 20 30 1
Haryana 14 20 19 18 21 1
Himachal Pradesh 19 15 29 14 16 1
Jammu & Kashmir 11 10 13 9 14 1Jharkhand 28 28 22 29 55 2
Karnataka 7 7 8 18 12
Kerala 6 6 5 7 6
Lakshadweep 16 9 20 20 12 14
Madhya Pradesh 21 17 32 23 25 2
Maharashtra 11 12 21 5 19 14
Manipur 27 27 32 10 19 2
Meghalaya 17 11 16 19 15 1
Mizoram 7 4 7 5 1
Nagaland 13 9 14 15 8 1
Orissa 11 12 13 12 16 12
Puducherry 19 21 15 0 12 1
Punjab 19 16 62 21 21 2
Rajasthan 12 12 17 12 14 12
Sikkim 8 21 5 0 0 1
Tamil Nadu 8 8 14 13 1
Tripura 51 39 54 0 93 4
Uttar Pradesh 11 7 7 11 8 1
Uttarakhand 18 19 23 20 17 1
West Bengal 12 41 12 15 14 13
All States 14 14 17 15 15 14
States/UT
NR : Data not reported.

7/30/2019 Analytical Tables 2007-08
http://slidepdf.com/reader/full/analytical-tables-2007-08 170/180
7/30/2019 Analytical Tables 2007-08
http://slidepdf.com/reader/full/analytical-tables-2007-08 171/180
DISE Publications: A Few Comments
I wish to compliment NUEPA for the valuable documents, very well structured to serve as valuable reference
material . Dr. M. Anandakrishnan, Chairman, Indian Institute of Technology, Kanpur. I must compliment NUEPA for producing such an informative well led out document which will give opportunity to
researchers and policy makers to access vital information pertaining to various facets of elementary education . Maj.Gen. S.N. Mukharjee, Lakshmibai National University of Physical Education, Gwalior.
It is a valuable document which will be useful to people from all walks of life. In fact I was searching for some data which is found in the publication. Prof. Geetha Bali, Vice-Chancellor, Karnataka State Women’s University, Mysore.
I just browsed through the publications and found that they are quite useful and informative. Prof. R.S. Deshpande,Director, Institute for Social and Economic Change, Bangalore.
Both these publications will be of immense help for the department . Dr. R.G. Kothari, Professor of Education, TheMaharaja Sayajirao University of Baroda, Vadodara.
These documents are useful for the users of our library. Professor In-charge (Library), Maharshi Dayanand UniversityLibrary, Rohtak.
The publications are very informative and would be used widely by researchers and policy makers engaged in the field of elementary education in India. Prof. R. Sambasiva Rao, Special Director General, Ministry of Health andFamily Welfare, New Delhi
The data complied and presented in the publication are of immense value for research work on education and gender, and commendable. I congratulate NUEPA for bringing out such a useful publication. Swamy Swarupanand,Secretary, Ramakrishna Ashrama, Ramakrishnapuri, Gwalior.
These publications are very useful and we will definitely share it with the interested organizations and individuals.Mr. Patwari, Akshara Foundation, E-mail: [email protected].
Time has come that it should be accepted as sole authorized data of Government of India and also be extended to secondary level. NUEPA deserves compliments for the sustained effort and contribution. Prof. B.P. Khandelwal,NOIDA.
I agree that the reports would of great value from the point of view of planning experiments in universalization of the education. Dr. Ragini Prem, Secretary, Banwasi Seva Ashram, Sonbhadra.
It looks a very useful collection of data. Mr. Sabtasachi Bhattacharya, Chairman, Indian Council of Historical Research,New Delhi.
The documents are of great use to the students and faculty members of our Department. Please convey our complements to DISE team for bringing out such an important statistics. Dr. A.K. Kundu, Deputy Librarian, North-
Eastern Hill University, Meghalaya.
On behalf of our students and faculty, I would like to congratulate NUEPA for producing such valuable publications.Indeed, our faculty, researchers and students will benefit from the scholarly work that provides deeper insight into elementary education in India. Dr. Muhammad, The Aga Khan University, Karachi (Pakistan).
We shall process and display it in our library for scholars and researchers. Mrs. Savitri Devi, Deputy Director, IndianCouncil of Social Science Research, New Delhi.
I am sure the reports will be of immense use in our own research work. Mr. A.J. Philip, Director, Pratichi, Delhi.

7/30/2019 Analytical Tables 2007-08
http://slidepdf.com/reader/full/analytical-tables-2007-08 172/180
Analytical Report is extremely useful for our research scholars. Dr. P.P. Singh, Head, Library & Documentation DivisionA.N. Sinha Institute of Social Studies, Patna.
This will be useful to our library users . Librarian, National Institute of Technology Hamirpur, Himachal Pradesh.
The material is useful and informative for us . Dr. P.D. Kaushik, Associate Director, Rajiv Gandhi Foundation, NewDelhi.
We are sure that the publication will be of immense interest to our members. Ms. Bhavna Sharma, Library Resource Centre, India Habitat Centre, New Delhi.
I am sure it will be very useful reference material for me. Prof. Neerja Shukla, Professor & Head, Department oEducation of Special Needs, NCERT, New Delhi.
This will surely help us in understanding the latest status of education in India in general and particularly in GujaraI would share this with my colleagues and all concerned. Dr. Pushopa Wadhwani, State Head, Azim Premji FoundationGujarat.
I would like to mention that I am pursuing M. Phil in elementary education in Himachal Pradesh. The data provide
in this publication would be of immense use in my thesis. Ms. Masooma Singha, Shimla. It is indeed an informative and useful document to monitor universalisation of elementary education. Th
compilation is very exhaustive and comprehensive effort. The work being put in is truly remarkable ancommendable. Col. H Dharmarajan, Rashtriya Indian Military College, Dehradun.
It is a massive work magnificently executed. Mr. Marmar Mukhopadhyay, Director, Educational Technology anManagement Academy, New Delhi.
I am sending these publications to our Library for the benefit of researchers and students of JNU . Prof. B.BBhattacharya, Vice-Chancellor, JNU, New Delhi.
These publications have been forwarded to the University Library for wide publicity and use by the students anfaculty members. University Librarian, Chaudhary Devi Lal University, Sirsa, Haryana.
The hard work done by NUEPA in bringing out these volumes without much time-lag is commendable. The qualityof publication is excellent. I am sure that the material given in these volumes will be widely used . Prof. A.B.LSrivastava, Chief Consultant, Technical Support Group, Ed. CIL.
This report will great reference material for our work and will be referred by researchers and students who come tvisit our centre . Prof. Virgil D’Sami, Executive Director, Arunodhaya Centre for Street and Working Children, Chenna
These publications containing useful data are being placed in the library for the information of readers. Prof. Jai RuSingh, Vice-Chancellor, Guru Nanak Dev University, Amritsar.
The document indeed provided a wealth of information pertaining to various facets of elementary education. MMervyn D’Sousa, Chairman, Goa Board of Secondary & Higher Secondary Education, Goa.
We are sure that these documents will be of immense help to our work. Mr. Naren Sankranthi, MV FoundationSecunderabad.
It is a very useful document for our faculty. Our library will be richer by this addition . Dr. S.R. Hashim, DirectoInstitute for Studies in Industrial Development, New Delhi.
The publications will be of great reference to our teachers as well as students and hence a very useful addition tour library . Ms. Nandi Nailwal, Librarian, Lal Bhahdur Shastri Institute of Management, Delhi.
These documents will be of great value for our University specially for the faculty and students of the School oEducation. Prof. Mana Prasad Wagley, Dean, School of Education, Kathmandu University, Nepal.

7/30/2019 Analytical Tables 2007-08
http://slidepdf.com/reader/full/analytical-tables-2007-08 173/180
We have found the data very useful and interesting. Mr. Gururaj K. S., Azim Premji foundation, Bangalore.
I find the data and information presented very useful. Mr. V.G. Das, E-mail: [email protected].
The copies have been kept in our library for wider readership. Prof. Pankaj Chandra, Director, Indian Institute of
Management, Bangalore. This publication will be very useful to our library users . Mr. B. Ganapathi, Librarian, Entrepreneurship Development
Institute of India, Gandhi Nagar, Gujarat.
We will keep this publication in our library collection for its wider use by researchers. I am sure the publication will help them in their research and study. Mr. Mustahsan Usmani Raja, Librarian, Indian Institute of Management,Lucknow.
We find this report useful to our library . Mrs. P.S. Sharma, Central Library, Indian Institute of Technology Bombay,Mumbai.
This is very useful and valuable document and I hope that all the faculty members of my department will benefit from this publication. Prof. Santosh Sharma, Head, Curriculum Group, NCERT, New Delhi.
I browsed through the report and found it very useful and informative and gives plenty of information on elementary education. I am sending the report to our library for wider circulation. Prof. R.S. Deshpande, Director, Institute forSocial and Economic Change, Bangalore.
The publication will prove excellent source of information for students and researchers in the field of education. Mr.Cima M. Yeole, Shivaji University, Kolhapur, Maharashtra.
This will herald a new era for the academicians and researchers in the field of education to embark on fresh research and analysis . Prof. Rajendra Menaria, Jaipur.
We feel pleasure to say that the documents contain useful information about the elementary education in India. Mr.Swami Swarupanand, Secretary, Ramakrishna Ashram, Gwalior.
It is a laudable effort. Congratulations for bring out the publication, which provides latest information pertaining to various facets of elementary education. It would be wonderful to get school-specific raw data for various research processes. Dr. Savita Sinha, Professor & Head, DESSH, NCERT, New Delhi.
I am sure that the publications shall be valuable addition to our library and hope that our readers will be greatly benefited by these publications. Prof. Shabahat Hussain, Librarian-in-charge, Maulana Azad Library, Aligarh MuslimUniversity, Aligarh.
These would indeed be a valuable addition to our library collection. Ms. Anju Vyas, Librarian, Central for Women’sDevelopment Studies , Library, New Delhi.
It is very useful in our research work. Mr. Fidelis Tirkey, Coordinator, Development of Library & DocumentationCentre, Indian Social Institute, New Delhi.
This publication is very interactive and will be very useful to our research students and academic staff. Dr. D.D.Pednekar, Officer-in-charge, Homi Bhabha Centre for Science Education, Tata Institute of Fundamental Research,Mumbai.
It is very useful for our faculty members. Mr. Bharat Kumar, Librarian, Management Development Institute, Gurgaon.
I am happy to state that your publications are becoming more value added and superior over the years. I congratulate NUEPA for theses outstanding publications which will not only benefit researchers but also the people at large. Prof.Ajit Kumar Jain, Visiting Professor, IHMR, Jaipur.
The publications are very informative. Dr. Shayama Chona, Principal, Delhi Public School, New Delhi.

7/30/2019 Analytical Tables 2007-08
http://slidepdf.com/reader/full/analytical-tables-2007-08 174/180
The document is really the need of the hour and I am sure that your tremendous work will certainly be appreciateby all researchers and policy makers. Dr. B. Yashovarma, Principal, Shri D.M. College, Ujire, Karnataka.
These kind of publications are very useful both for teaching and research work. Prof. N. Rajagopala Rao, HeadDOE, SSSU, Prasanthi Nailayam, Andhra Pradesh.
This report is immense helpful for the research students as well as for their guides to access vital information abouelementary education in India. Dr. Surendra Nath Banerjee, Retired Professor, Indian Statistical Institute, Kolkata
It is certainly useful for our advocacy purposes. Mr. R. Sachin Kumar Jain, Development Journalist, Vikad SamvadBhopal.
These publications would be of immense use to my students, research scholars and colleagues in our research workDr. Nityanda Pradhan, Head, P.G. Department of Education, D.A.V. College, Koraput, Orissa.
I am sure the publication will be of immense use to many in the field of school education. Mr. S. Sathyam, ChairmanHRD Ministry’s Review Committee on Educational Statistics, New Delhi.
I assure, these publications will be brought to the notice of our collegeus in the SCERT. Mr. S. Suresh Babu
E-mail: [email protected].
These reports will be very much valuable for me and for my research scholars. Dr. Siba Charan Subudhi, Departmenof Education, North-Eastern Hill University, Tura Campus, Meghalaya.
We assure you that, the publication will be prominently displayed in our library for its best use. Dr. Muttaya
Koganuramath, University Librarian, Tata Institute of Social Sciences, Mumbai.
I would like to congratulate NUEPA on producing a valuable report, which provides an analytical landscape oelementary education in India. We will keep the report in our library for sharing it with our faculty and students whwill benefit from the material for their research work. Dr. Hamid-ud-din Al Kirmani, Professor and Director, The Ag
Khan University, Karachi, Pakistan.
The report and the data compiled are very useful to our projects in designing, comparing the progress and fixing thfuture target activities. Mr. K. Balakrishna Moorthy, General Secretary, People’s Action for Social Service, AndhrPradesh.
As the publication is quite informative and useful, I hope the teacher participants will be really benefited. Dr. H.SBhatia, Director, UGC Academic Staff College, Guru Nanak Dev University, Amritsar.
This is very useful addition to our library. I am sure the educationists and the research scholars will make good usof it. Ms. N. Seetharambhai, Secretary, Andhra Mahila Sabha, Literacy House, Hyderabad.
The publications are bound to help in my working on legal aspects of right to elementary education. Mr. Asho
Aggarwal, Social Jurist, New Delhi.
I shall be able to make better use of the reports in planning for our state. Mr. M. Alphonse, Tamil Nadu.
These publications will help us immensely in planning different activities for improving the state of education iOrissa. Mr. Anil Pradhan, Member Secretary, Sikshasadhan, Orissa.
It provides a great input to our faculty and researchers in teaching and research. Mr. Bibhuti Kumar Singh, SRDTuljapur, E-mail: [email protected].
This publication will definitely helpful for us in drawing out our strategy of implementation educational programmein our programme areas. Mr. Ravi Nayse, Regional Programme Coordinator, Chandrapur.

7/30/2019 Analytical Tables 2007-08
http://slidepdf.com/reader/full/analytical-tables-2007-08 175/180
We are adding document to our collection and are sure that these will be of immense interest to our members. Ms.Bhavna, Manager, Habitat Library & Resource Centre, India Habitat Centre, Delhi.
The publication will be of great help to government and policy makers institutions. Mr. Yaqoon Memon, Director-al-Hira Public School, Indore, Madhya Pradesh.
We have added the material to the collection of our library. Ms. Kanchan Vasudev, Documentation Officer, NationalSocial Science documentation Centre, ICSSR, New Delhi.
Analysis of data has been done very nicely and presented very well using coloured and graphical figures. I am sure the publications will be widely used by planners and researchers. Dr. J.C. Goyal, Former, Reader, NCERT, New Delhi.
Both reports are very useful for us because we are now in the process of improving our data collection . Mr. SamSereyrath, Director of Planning, MoEYS, Cambodia.
The reports show the mirror of the district scenario and it will be quite useful to achieve the goals in the field of education. Dr. T. S. Joshi, Principal, District Institute of Education & Training, Gandhinagar, Gujarat.
The report has not only been well documented but it will be really useful for us those who are working on child
education in collaboration with the various state governments. The detailed information provided in the report,supported by data, will certainly help us to design and plan our education intervention accordingly. Ms. MumtazMasood, Ambuja Cement Foundation, Okhla, New Delhi.
The publication has been added to the holdings of the library for consultation. Mr. Naveen Mahajan, DeputyLibrary and Information Officer, Nehru Memorial Museum & Library, New Delhi.
I whole heartedly congratulate and appreciate NUEPA for its outstanding efforts in bringing out Analytical Report.The DISE data will definitely help multi national companies to make their efforts to improve information about elementary school education in rural areas. Prof. Nagesh Shinde, Professor & Head, School of Studies in ContinuingEducation, Vikram University, Ujjain.
The publication is of immense help to our institute and is being displayed in the library. Mr. Challang R Marak,
Lecturer, DIET, Tura. The documents are highly useful research activities and in regular classroom interactions. Prof. M. Nirmala Jyothi,
Professor & Head, Sri Padmavati Mahila Visvavidyalayam, Andhra Pradesh.
This document will be of great help and benefit to us. Ms. Ranjana Sharma, Assistant Co-ordinator, ResearchMonitoring & Evaluation, E-mail: [email protected].
It will be displayed in our library and made available to the policy makers, researchers, faculty and our students. Mr.M.P. Deshpande, Principal DIET, Dharwad.
These are quite helpful for our research. Ms. Supriya Mallik, Principal DIET, Dolipur.
I convey my congratulations to NUEPA for having prepared so useful data which renders the work of the administrators
and researchers easy and authentic . Dr. S. Kumar, General Secretary, Forum of Senior Citizens in Education, Panchkula. Really these volumes present a comprehensive analysis about the status of elementary education in India, which
will be quite useful to research scholars and related faculty of the Institute. Dr. Dinesh Kumar, E-mail:[email protected].
This document has been forwarded to the university library for wide publicity and use by the students and faculty members. Librarian, Chaudhary Devi Lal University, Sirsa.
The publication contains a wealth of meaningful information. Certainly it will be immensely useful for researchers,teachers and district administration. Prof. Beena Shah, Vice-Chancellor, M.J.P. Rohilkhand University, Bareilly.

7/30/2019 Analytical Tables 2007-08
http://slidepdf.com/reader/full/analytical-tables-2007-08 176/180
This will no doubt be a valuable addition to our library to benefit our faculty members, research scholars anstudents. Mr. N. Choudhary, Librarian, LBN Library, Dibrugarh University, Dibrugarh.
It will be of great help to the students and researchers at large. I must say that your research team must bcongratulated for the wonderful work that they have done. Dr. Vandana Upadhyay, Department of Economics
Rajiv Gandhi University, Arunachal Pradesh, Itanagar.
I am in the process of reading intently the publication and find it exceedingly informative. The school-specific ramaterial will undoubtedly help us in the administrative and academic purpose. Dr. Indu Khetarpal, Principal, SalwaPublic School, Gurgaon, Haryana.
The publications have been added to our college library and made known to the staff members. Dr. MahabaleshwarRao, Professor cum Principal, Dr. T.M.A. Pai College of Education, Udupi.
We researchers are able to know both a bird’s-eye view at national level and the detailed report regarding eachdistrict in India. I highly appreciate your hard efforts and analysis. Hisako Akai, Fukuoka, Japan.
The District Report Cards provide ample information for making critical analysis of various states in India especiallon elementary education . Dr. R.S. Sharma, Ex-Fellow, NUEPA, New Delhi.
Thanks for sending me this invaluable volume, Prof. Anil Sadgopal, Sahkar Nagar, Bhopal.
Indeed the publications are valuable addition to our library. Dr. Renuka Narang, Education Consultant, MumbaTransformation Support Unit, All India Institute of Local Self Government, Mumbai.
I find the publication useful for strengthening Education Management Information System in India . Prof. BharaBhaveja, Head and Dean, Department of Education, University of Delhi.
We will place documents in the teacher education section of the library where it will be used by visitors as weteacher trainees. Ms. Radhika Herzberger, E-mail: [email protected].
I had a quick glance of the contents and the work reported is very high quality. I wish you all success in disseminatio
this report. Dr. S. Sadagopan, Director, International Institute of Information Technology, Bangalore. It will be very useful for our faculty and students. Some of our students are working on education for their M.A
M.Phil dissertation. Dr. M. Indira, Associate Professor, Department of Studies in Economics and Co-operation
University of Mysore, Mysore.
Congratulations on all your good work with DISE data. It is really a fantastic achievement to get increasingly reliabdata on 1.25 million elementary schools in India. I think a lot can be done in terms of district level analysis of thdata. Dr. Geeta Kingdon, Department of Economics, University of Oxford, Oxford.
We are delighted to see that the new District Report Cards using DISE data are already online as they have wealtof interesting information, Dr. Vandana Sipahimalani Rao, Human Development Economist, Manila, Philippines.
Thanks for sending me two volumes of your valuable publications, Elementary Education in India: District Repo
Cards, Prof. Ashish Bose, Leading Demographer and Former Professor, Institute of Economic Growth, Delhi.
I am sure it would be of great help. Dr. Sharada Jain, Director, Sandhan (Society for Education & DevelopmentNew Delhi.
This is what we have been waiting for. Ms. Varsha Hooja, Director, Technical Operations, National Resource Centrfor Inclusion Spastics Society of India.
Rest assured that our education team in India will make full use of this publication, and will encourage others to dso well. Mr. Sam Carlson, Lead Education Specialist for India.

7/30/2019 Analytical Tables 2007-08
http://slidepdf.com/reader/full/analytical-tables-2007-08 177/180
The report is a rich source of data and useful for our research students. Prof. Geetha B. Nambissan, Chariman, ZakirHussain Centre for Educational Studies, Jawaharlal Nehru University, New Delhi.
Your publications are surely useful and informative, always gives me a great encouragement to my further studies,Ms. Hisako Akai, Fukuoka, Japan.
I am sure the document will be of great help to all those who are committed to universal elementary education. Mr.Prakash Karat, General Secretary, Communist Party of India (Marxist), New Delhi.
Congratulations for launching over one million school report cards - this is wonderful achievement. Dr. MichaelWard, Senior Education Adviser, DFID India, British High Commission, New Delhi.
This is really amazing to see the remote village schools information on your website. The site will be very useful in
understanding the status of the Indian schools. Mr. R. Venkat Reddy, [email protected].
Thanks for felicitations for your monumental publication, Elementary Education in India: Progress towards UEE,
Analytical Report. Mr. Saiyid Hamid, former Vice-Chancellor, Aligarh Muslim University, Chancellor, Jamia Hamdardand Secretary, Hamdard Education Society, New Delhi.
The data provided by DISE would be of immense help to the people who are working in the field of primary education. It would have been of great help to government to properly plan for the school level education for Muslims. Mr. Kamal Faruqui, Chariman, Delhi Minorities Commission, Vikas Bhawan, New Delhi.
It was great to learn about the progress made regarding DISE. Dr. Deepa Sankar, Education Economist, The WorldBank, New Delhi.
DISE publications annually produce a vast wealth of educational statistics and I am so happy that NUEPA has kept up the standards in generating periodic information so useful for all of us. Dr. Preet Rustagi, Senior Fellow, Institutefor Human Development, New Delhi.
I must confess that after the monumental work of J.P.Naik on the history of Indian education your work related to elementary education in India is the most comprehensive data-base published so far. It will be an invaluable for all
researchers and policy makers on education in the coming decades. Prof. Gautam Sen, Director General, IndianInstitute of Education, Pune.
We hope to benefit from the publication. Dr. Montek Singh Ahluwalia, Deputy Chairman, Planning Commission,New Delhi.
Congratulations on the excellent production of the two volumes of the District Report Cards.Prof. Amitabh Kundu, Centre for Studies in Regional Development, Jawaharlal Nehru University, New Delhi.
The publication is very useful containing considerable amount of data and analysis, which will be useful for researchers in the field of education. Prof. Anandakrishnan, Chairman, Madras Institute of Development, Chennai.
Thank you for sending me very useful publications. Shri J. Veeraraghavan, Director, Bhartiya Vidya Bhavan, NewDelhi.
I have placed the publication in our library for wider consultation by our scholars. Prof. C.H. Hanumantha Rao,Chairman, Centre for Economic and Social Studies, Hyderabad.
NUEPA’s success in operationalising the nationally acclaimed DISE has been one such landmark, revolutionizing the role of education planners, who can now address local developmental needs from an informed perspective, armed with statistical and situational data. Mr. Samphe Lhalungpa, Ex-Chief, Education Section, UNICEF India CountryOffice, New Delhi.
A great piece of work, congratulation for putting everything in black and white. Dr. Maheswar Lal, Asha for Education,Philadelphia.

7/30/2019 Analytical Tables 2007-08
http://slidepdf.com/reader/full/analytical-tables-2007-08 178/180
The publications (Elementary Education in Rural and Urban India) would be very useful addition to our library. MMohammad Hamid Ansari, Chairperson, National Commission for Minorities, Government of India, New Delhi.
The publications containing valuable recent data on the state of elementary education in India will no doubt bfound most useful by myself and my students at JNU. Prof. D.N. Rao, Centre for Economic Studies & Plannin
School of Sciences, Jawaharlal Nehru University, New Delhi.
The data provided in the Analytical Tables are of immense utility. Prof. P.M. Kulkarni, Centre for the Study oRegional Development, Jawaharlal Nehru University, New Delhi.
The DISE Flash Statistics is becoming smarter with more and more information. I congratulate DISE team for thetotal dedication in compiling the data. Mr. S.S. Rajagopalan, Chennai.
This is a welcome step and I appreciate the efforts undertaken by NUEPA. Dr. Lokesh K. Shekhawat, Vice-ChancelloJai Narain Vyas University, Jodhpur.
We are extremely thankful to you for sending such a valuable publication. Librarian, Tilak Maharashtra UniversitLibrary, Pune.
We have kept the publication in the Central Library of the institute, which will be useful for our readers. DYogendra Singh, Ex-Scientist, Indian Institute of Technology, Roorkee Central Library, Roorkee.
I find the publication well prepared, quite useful and informative. Dr. B.N. Yugandhar, Member, Planning Commissioof India, Yojana Bhawan, New Delhi.
I write to appreciate the efforts NUEPA has been making for the last several years in strengthening EMIS in thcountry. The amount of data being disseminated regularly through DISE publications, enormous and rich in contentsattests to the significant achievement of NUEPA. Dr. Raman P. Singh, Deputy Advisor (Education), PlanninCommission, Yojana Bhawan, New Delhi.
Just received the two volumes of elementary education in India. Should I say I am privileged? I have just leafethrough the pages and have had a sensation. What a tremendous job done! Really grateful for the prompt dispatchMr. Soumen Hom, Kolkotta.
District Report Cards will be of immense help in the activities in school education at CII. Ms. Alka ChaudharyDirector, Confederation of Indian Industry, New Delhi.
The information would help us in many ways. Mr. Sunil Gautam, Indian Institute of Dalit Studies, New Delhi.
I have gone through documents on the web, they are immensely useful for my research. I want to congratulate yoand also convey my thanks for providing such vast information. Prof. Amulya Chagapuram, ICFAI UniversityHyderabad.
The http://schoolreportcards.in is nice move. It helps if you are an academician, it helps if you are a policy makeand it helps even if you are a common citizen. The data will help the process of empowerment and strengthen thdemocracy . Dr. Ram Manohar Vikas, Indian Institute of Technology, Kanpur.

7/30/2019 Analytical Tables 2007-08
http://slidepdf.com/reader/full/analytical-tables-2007-08 179/180
National University of Educational Planning and Administration17-B, Sri Aurobindo Marg, New Delhi 110016
Phone: 91-11-26962120, 26962126, 26962335, 26967780Fax: 91-11-26853041, 26865180
Email: [email protected]: http://www.nuepa.org
For detailed information on DISE, please visit
Website: http://www.schoolreportcards.inhttp://www.dise.in

7/30/2019 Analytical Tables 2007-08
http://slidepdf.com/reader/full/analytical-tables-2007-08 180/180
One Million+ School Report Cards(www.schoolreportcards.in)
T he National University of Educational Planning and Administration has created a comprehensive
database on elementary education in India under one of its most prestigious projects, known as, District
Information System for Education (DISE). The project covers both primary and upper primary schools/sectionsof all the districts of the country. What is more remarkableabout DISE is that it has drastically reduced the time-lag inavailability of educational statistics which is now downfrom 7-8 years to less than a year at the national and only a few months at the district and state levels. DISE issupported by the Ministry of Human ResourceDevelopmentand UNICEF.
The National University has successfully developed
School Report Cards of more than 1.25 million Primary and Upper Primary Schools/Sections. In addition toquantitative information, the Report Cards also providequalitative information and a descriptive report about
he