analytical model for shear strength estimation of
TRANSCRIPT

Contents lists available at ScienceDirect
Engineering Structures
journal homepage: www.elsevier.com/locate/engstruct
Analytical model for shear strength estimation of reinforced concrete beam-column joints
Leonardo M. Massone⁎, Gonzalo N. OrregoDepartment of Civil Engineering, University of Chile, Blanco Encalada 2002, Santiago, Chile
A R T I C L E I N F O
Keywords:StrengthBeam-columnJointShearModelReinforced concrete
A B S T R A C T
A model capable of predicting the shear response of beam-column joints subjected to seismic actions is pre-sented. The analytical model, originally developed for walls and based on a simple physical formulation, isadapted. It considers mean stress and strain fields based on a reinforced concrete panel representing the joint,under the assumption that the principal concrete stress and principal strain directions coincide. Simple con-stitutive material laws are considered for concrete and steel. To estimate the shear capacity, the model satisfiesthe equilibrium in the longitudinal (vertical) direction. In order to analyze the accuracy of the model, a databaseintegrated by 92 tests of exterior and interior beam-column joints is collected from the literature. Noting that theoriginal model does not consider the effect of confinement product of adjacent elements to the connection, thiseffect is introduced through factors that reduce the values of the longitudinal and transverse strain used tocalibrate the angle of the strut. In addition, the contribution of the transverse reinforcement in the capacity ofthe element is included. These modifications together with the influence of the boundary reinforcement, yields agood strength estimate for exterior and interior joints that fail in shear. When comparing with other models fromthe literature, it is observed that the proposed model provides one of the best correlations.
1. Introduction
Beam-column joints are used in frame structures and fulfill thefunction of delivering continuity to the structure, in addition to trans-ferring shear and moment forces from one structural element to an-other. For these reasons it is required a correct design of these con-nections in order to maintain stable structures. Structure collapse canoccur when a beam-column joint (reference as joints in the text) fails inshear, which is a brittle failure response (Fig. 1a). Other type of po-tential failure occurs when one of the elements adjacent to the joint failsbefore the joint (Fig. 1b).
In frame analysis, most models assume a rigid behavior for beam-column joints, giving only flexibility to column and beam elements.Some previous works have modified the properties of the elementsframing into the joint in order to account for the additional joint flex-ibility (e.g., Hoffmann et al. [1]). Many models have evolved from thereincorporating, among others, bond slip observed in the longitudinalreinforcement of beams, confining effect of surrounding elements, andshear response of the joint (e.g., Youssef and Ghobarah [2]); however,for the shear response in some cases only simple models have beenincluded. In order to correctly predict the shear response of the joint,more complete and complex formulations have been included, based on
panel response (e.g., modified compression field theory in models suchas in Lowes and Altoontash [3] and Pan et al. [4]). Such formulationsallow representing the observed failure modes and are intended fornonlinear analysis of elements or entire structures in finite elementformulation, rather than shear strength predictions for design.
The current work focuses in the shear strength estimation of beam-column joints for different failure modes. In the literature there aredifferent models to estimate shear response in beam-column joints.Some of them are based on a strut-and-tie model that incorporatesforces equilibrium, strain compatibility and the material constitutivelaws (e.g., [5,6]). There are also closed-form expressions, some assimple as the one in ACI318-14 [7], semi-empirical expressions such asthe model by Kassem [8], and Kim and LaFave [9] that require cali-bration of parameters and others more elaborated such as the modeldeveloped by Wang et al. [10].
Hwang and Lee [5,6] present a strut-and-tie model to predict theshear strength of interior and exterior reinforced concrete joints, whichsatisfies conditions of equilibrium forces, strain compatibility andconstitutive law of cracked concrete. In those works, they propose tomodel the distribution of stresses of the joint as a statically in-determinate lattice, through three mechanisms: one diagonal, onehorizontal and one vertical (Fig. 2). The diagonal mechanism (Fig. 2a)
https://doi.org/10.1016/j.engstruct.2018.07.005Received 10 March 2017; Received in revised form 9 May 2018; Accepted 2 July 2018
⁎ Corresponding author.E-mail address: [email protected] (L.M. Massone).
Engineering Structures 173 (2018) 681–692
Available online 14 July 20180141-0296/ © 2018 Elsevier Ltd. All rights reserved.
T

consists of a diagonal compression strut with an angle of inclination= ″ ″−θ h htan ( / )b c
1 , where ″hb and ″hc (Fig. 2) are the distances betweenthe end longitudinal reinforcements of the beam and the column, re-spectively. In addition, it is assumed that the direction of the diagonalstrut coincides with the main direction of compression of the concrete.The horizontal mechanism (Fig. 2b) consists of a horizontal tie and twoflat struts, in which the stirrups of the column constitute the tie. It isalso assumed that the stirrups in the core of the joint are considered100% effective when calculating the area of horizontal reinforcement,while those located at the ends of the joint are considered providingonly 50% of their force as effective. The vertical mechanism (Fig. 2c)includes a vertical tie and two steep struts. The vertical tie is consideredas the vertical intermediate reinforcement of the column. The combi-nation of the 3 lattices determines the complete system, so that byequilibrium the resulting shear force is defined as,
= − + +V D θ F F θcos cotjh h v (1)
where D is the compression force at the diagonal strut; and Fh and Fv arethe forces in the horizontal and vertical struts, respectively. As thesystem is hyperstatic, a load distribution pattern is assumed betweenthe 3 mechanisms.
Failure of the compression strut is defined when the concrete at theend of the diagonal in compression, that is, in the nodal zone (Fig. 2a)reaches its maximum compressive capacity. To determine the capacity,it is necessary to define the constitutive laws of the materials. Forconcrete, as same as in this work, the ascending branch for the com-pression curve in the cracked concrete of the model by Zhang and Hsu[11] is considered to characterize the biaxial action present in this
material. As for reinforcing steel, its behavior is considered elasto-plastic. When incorporating compatibility, forcing average deforma-tions for the entire element, the nonlinear system requires an iterativeprocess to validate compatibility, which allows determining the shearcapacity.
In the ACI 318-14 [7], on the other hand, the shear strength isobtained as a function of the compressive strength of concrete, definedas,
= ′V γ f Ajh c j (2)
where γ is a function of the confinement delivered by the surroundingsbeams. For the purpose of this work, where joints with confluent beamson only 1 or 2 sides are considered, for interior joints (beams in 2 faces)γ = 1.2 if the width of these beams is at least 75% of the width of thejoint. In other cases, γ = 1.0. Aj represents the effective area of thejoint, which for beams centered on the joint includes the entire cross-sectional area of the joint.
Another closed-form expression is the model proposed by Wanget al. [10], where it is assumed that the shear capacity of the joint isobtained when the stresses in the concrete, located at point C (Fig. 3)have reached their material failure envelope. The point C is consideredonly subjected to an axial stress σy and a shear stress τxy. Also, it isassumed that the principal stresses at the joint at the moment of failure,coincide with the two normal stresses acting along and perpendicular tothe diagonal strut AB.
On the other hand, the angle α is defined as = −α h htan ( / )c b1 , where
hc is the width of the column; hb corresponds to the height of the beam;
Fig. 1. Type of failure in a joint – (a) Shear failure at the joint [38] and (b) failure of the beam adjacent to the joint in flexure [24].
Fig. 2. Shear resistant mechanisms – (a) diagonal mechanism, (b) horizontal mechanism, and (c) vertical mechanism (after [5]).
L.M. Massone, G.N. Orrego Engineering Structures 173 (2018) 681–692
682

=σ N /b hy c c c where Nc is the axial load on the column, bc is the width ofthe column; τxy =Vjh/bjhc, where Vjh is the shear force of the joint inthe horizontal direction, bj is the depth of the joint, considered as thelowest between bc and bb+0.5hc if bc≥ bb or the lowest between bband bc+ 0.5hc if bc < bb; where bb is the width of the beam.
In order to incorporate the biaxial behavior of concrete, that is, theeffect of tensile stresses on the compressive strength, the Kupfer andGerstle [12] model is used, which is defined by the failure criterion
− =′0.8 1σf
σf
α
t n
α
c
1
,
2 , where σα2 is the main compressive stress and ft n, is the
nominal tensile stress of concrete in the direction of σα1 (main tensilestress), which considers the contribution of horizontal and verticaldistributed reinforcement. Through equilibrium, it defines
= + +f f ρ f α ρ f αcos sint n t c sh yh sv yv, ,2 2 , where ρsh is the amount of hor-
izontal reinforcement (Ash/bjhb) that includes the column stirrups be-tween the upper and lower longitudinal reinforcement of the adjacentbeam; ρsv is the amount of vertical reinforcement (Asv/bjhc) that con-siders the intermediate longitudinal bars of the column; fyh and fyv arethe yield stress of the horizontal and vertical reinforcement, respec-tively; = ′f f0.56t c c, , corresponds to the contribution of the concrete tothe nominal tensile strength. The model assumes that the tensilestrength of concrete is reached and that the horizontal and verticalreinforcements have reached their respective yield stresses.
This gives a closed-form expression for the maximum shear strengthof the joint (Vjh), as
=− − ′
+ ′V β
α f α f σf f α
b h1.0 (sin / 0.8cos / )
(1/ 0.8/ )sin2jh jt n c y
t n cj c
2,
2
, (3)
In order to take into account the better behavior of the interiorjoints than the exterior joints (due to the greater confinement effectprovided by the adjacent beams in interior joints), a reduction factor(βj) is introduced in which βj = 1.0 for interior joints and 0.8 for ex-terior joints.
The work by Kassem [8] uses the same principles developed in thestrut-and-tie model by Hwang and Lee [5,6], but reduces the expres-sions to a closed-form solution by imposing the distribution of forcesbetween D, Fh, and Fh as a calibration with test data. Thus, the ex-pression reduces for exterior beam-column joints to,
= + + + ′V (0.21ψκcosα 0.09(ω 3.47ω bb
tanα) 0.22ω bb
cotα)f Ajh h bb
jv
b
jc j
(4)
And for interior beam-column joints to,
⎜ ⎟= ⎛
⎝⎜ + ⎛
⎝+ ⎞
⎠+ ⎞
⎠⎟ ′V 0.26ψκcosα 0.44 ω 1.39ω b
btanα 0.07ω b
bcotα f Ajh h b
b
jv
b
jc j
(5)
where = − ′ψ 0.6(1 f [MPa]/250)c for interior joints and= − ′ψ 0.48(1 f [MPa]/250)c for exterior joints; = − ′κ 0.25 0.85n /fc c, with
nc the axial stress in the column; bbbjis the beam to joint effective width
ratio; = ′ω ρ f /fh jh yh c, with ρ fjh yh the joint transversal reinforcementstrength (steel ratio times the yield stress); = ′ω ρ f /fb b yb c, with ρ fb yb thebeam longitudinal reinforcement strength (steel ratio times the yieldstress); = ′ω ρ f /fv jv yv c, with ρ fjv yv the column longitudinal interior re-inforcement strength (steel ratio times the yield stress).
The work by Kim and LaFave [9] developed a simple closed-formexpression that includes key parameters identified and calibrated with astatistical analysis. The expression, for joints with no eccentricity, re-duces to,
= ′ ′ ′V 1.31α β (ρ f /f ) (ρ f /f ) (f [MPa]) Ajh t t j yh c0.15
b yb c0.3
c0.75
j (6)
where =α 1.0t for interior joints and 0.7 for exterior joints; =β 1.0t forcases with none or one transverse beam (out-of-plane) and 1.18 forcases with two transverse beams; ρ fj yh is the joint volumetric transversereinforcement strength in the direction of loading (steel ratio times theyield stress).
In this paper, a panel model is validated in the estimation of shearcapacity of beam-column joints, which considers the joint as a singleelement that represents its state with average strain and stress. Themodel used as a base has its origins in the work carried out by Kassemand Elsheikh [13], originally formulated for short walls and with themain directions (crack or strut direction) calibrated for a database oftests, and which has been generalized to angles of the strut directionbased on analysis and measurements of wall deformations in the workof Massone and Ulloa [14], and later modified to incorporate the effectof the main reinforcement (boundary) for corbels [15]. For its appli-cation in beam-column joints it is necessary to incorporate the con-finement effect provided by the elements adjacent to the joint, in ad-dition to the contribution of the transverse reinforcement that in thesecases presents a relevant influence. Thus, the results of the modifiedmodel are compared with tests of beam-column joints of a databasecompiled from the literature, besides of a comparison of the predicted
Fig. 3. (a) Forces and mechanism of a beam-column joint; and (b) stress field of point C (after [10]).
L.M. Massone, G.N. Orrego Engineering Structures 173 (2018) 681–692
683

capacity with other available models.
2. Base model and previous modifications
In the model proposed by Kassem and Elsheikh [13], an averagestrain and stress field is considered for the entire element (wall in thiscase), applying equations of equilibrium (Fig. 4), strain compatibilityand constitutive laws for concrete and reinforcing steel. Using this, theangle of the compression strut, which is assumed equal to the angle ofprincipal stresses and strains, was determined to be the one that bestpredicts the shear strength for a selected database.
Assuming that the reinforcing steel is only subjected to tensilestresses and that the main stress direction is oriented at an angle α withrespect to the vertical direction, the equilibrium equations of the systemalong the coordinate axis Lt are expressed by (Fig. 4b and c):
= + +σ σ α σ α ρ fcos sinL d r L L2 2 (7)
= + +σ σ α σ α ρ fsin cost d r t t2 2 (8)
= − +τ σ σ α α( )cos sinLt d r (9)
where σL, σt are the normal stresses in the directions L and t [MPa]; τLtcorresponds to the average shear stress in the L-t plane [MPa]; σd, σr arethe principal concrete stresses in the directions d and r [MPa]; fL, ftcorrespond to the average stresses of the reinforcing steel in the di-rections L and t [MPa]; and ρ ρ,L t are the steel ratio in the L and tdirections.
Considering that the stress distribution in the joint is uniform, theshear force is obtained as:
=V τ t dLt w w (10)
where V corresponds to the shear force in the section [N]; tw is thethickness of the element [mm]; dw is the horizontal length of the wallbetween the centroids of the boundary elements [mm], or dw can becalculated as 0.8 Lw, where Lw is the length of the wall.
For the strain field, where perfect bond between concrete and steelis assumed, the expressions are defined as:
= +ε ε α ε αcos sinL d r2 2 (11)
= +ε ε α ε αsin cost d r2 2 (12)
= − +γ ε ε α α2( )cos sinLt d r (13)
where εL, εt are the strain in the L and t directions; γLt corresponds to theshear strain in the L-t plane; εd, εr are the principal strain in the d and rdirections (positive for tensile strain).
Finally, assuming that the top displacement of the wall (Δ [mm]) iscontrolled by shear, its value is determined as:
= γ HΔ Lt w (14)
where Hw corresponds to the height of the wall [mm].In order to determine the concrete stress in compression, the con-
stitutive law by Zhang and Hsu [11] is considered, which considers thestrength degradation of concrete due to tensile strain in the orthogonaldirection (εr). Thus, the equations representing this behavior are asfollows:
⎜ ⎟ ⎜ ⎟= − ′ ⎡
⎣⎢
⎛⎝
− ⎞⎠
−⎛⎝
− ⎞⎠
⎤
⎦⎥ ⩽σ ζf ε
ζεε
ζεε ζε2 Ifd c
d
o
d
oo o
2
(15)
Fig. 4. Wall and beam-column joint analogy – (a) short reinforced concrete wall, (b) average stress on wall, (c) compression strut in wall (after [13]), (d) beam-column joint, and (e) joint reinforcement.
L.M. Massone, G.N. Orrego Engineering Structures 173 (2018) 681–692
684
= − ′⎡
⎣
⎢⎢
−⎛
⎝⎜⎜
−
−
⎞
⎠⎟⎟
⎤
⎦
⎥⎥
< ⩽−
σ ζf ζε ε ζε11
1If 2d c
εζε
ζ
o o o2
2do
(16)
where = ⩽′ + +
ζf ε ε
5, 8 11 400
0, 91 400c r r
is the reduction coefficient; ′fc corre-
sponds to the maximum compression stress of a standard concrete cy-linder [MPa]; εo = 0.002 corresponds to the strain associated with ′fc .
As for the constitutive law for concrete in tension, the proposal byGupta and Rangan [16] is adopted:
= ⩽ ⩽σ E ε ε εIf 0r c r r ct (17)
⎜ ⎟= ′ ⎛⎝
⎞⎠
⩽ ⩽−
−σ f ε ε
ε εε ε εIfr ct
ut r
ut ctct r ut
(18)
where ′ = ′f f0.4 [MPa]ct c is the maximum tensile stress in concrete
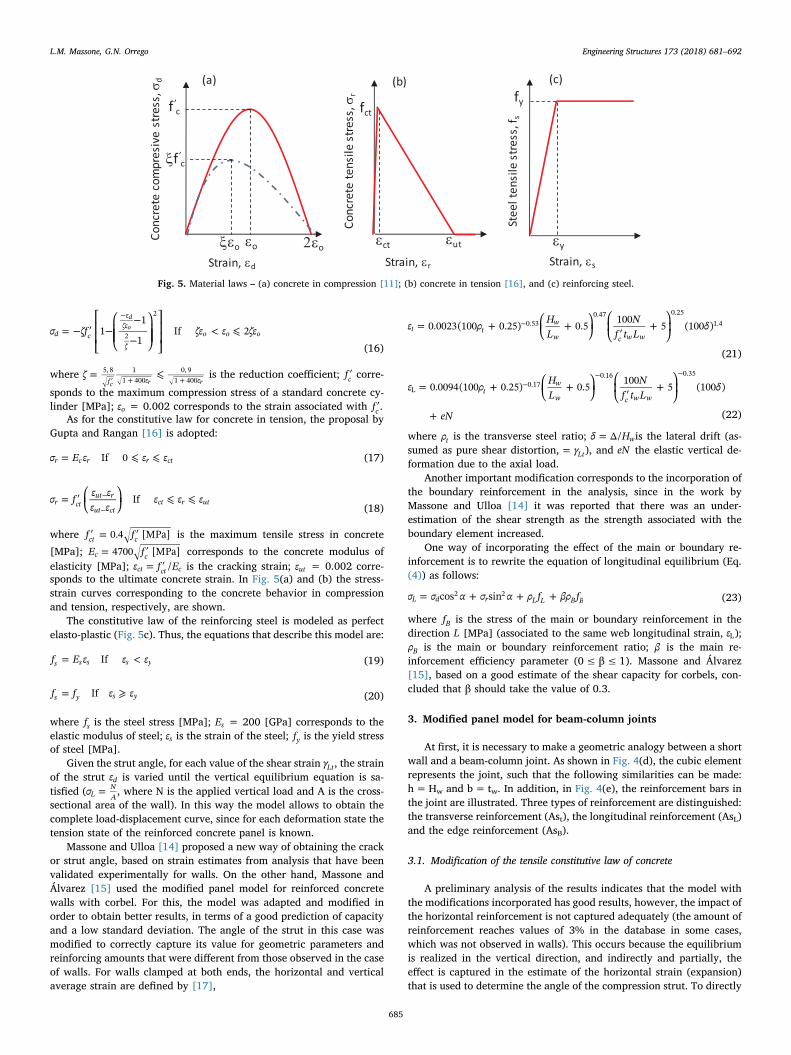
[MPa]; = ′E f4700 [MPa]c c corresponds to the concrete modulus ofelasticity [MPa]; = ′ε f E/ct ct c is the cracking strain; εut = 0.002 corre-sponds to the ultimate concrete strain. In Fig. 5(a) and (b) the stress-strain curves corresponding to the concrete behavior in compressionand tension, respectively, are shown.
The constitutive law of the reinforcing steel is modeled as perfectelasto-plastic (Fig. 5c). Thus, the equations that describe this model are:
= <f E ε ε εIfs s s s y (19)
= ⩾f f ε εIfs y s y (20)
where fs is the steel stress [MPa]; Es = 200 [GPa] corresponds to theelastic modulus of steel; εs is the strain of the steel; fy is the yield stressof steel [MPa].
Given the strut angle, for each value of the shear strain γLt, the strainof the strut εd is varied until the vertical equilibrium equation is sa-tisfied ( =σL
NA , where N is the applied vertical load and A is the cross-
sectional area of the wall). In this way the model allows to obtain thecomplete load-displacement curve, since for each deformation state thetension state of the reinforced concrete panel is known.
Massone and Ulloa [14] proposed a new way of obtaining the crackor strut angle, based on strain estimates from analysis that have beenvalidated experimentally for walls. On the other hand, Massone andÁlvarez [15] used the modified panel model for reinforced concretewalls with corbel. For this, the model was adapted and modified inorder to obtain better results, in terms of a good prediction of capacityand a low standard deviation. The angle of the strut in this case wasmodified to correctly capture its value for geometric parameters andreinforcing amounts that were different from those observed in the caseof walls. For walls clamped at both ends, the horizontal and verticalaverage strain are defined by [17],
⎜ ⎟⎜ ⎟= + ⎛⎝
+ ⎞⎠
⎛
⎝ ′+ ⎞
⎠−ε ρ H
LN
f t Lδ0.0023(100 0.25) 0.5 100 5 (100 )t t
w
w c w w
0.530.47 0.25
1.4
(21)
⎜ ⎟⎜ ⎟= + ⎛⎝
+ ⎞⎠
⎛
⎝ ′+ ⎞
⎠+
−− −
ε ρ HL
Nf t L
δ
eN
0.0094(100 0.25) 0.5 100 5 (100 )tw
w c w wL
0.170.16 0.35
(22)
where ρt is the transverse steel ratio; =δ HΔ/ wis the lateral drift (as-sumed as pure shear distortion, = γLt), and eN the elastic vertical de-formation due to the axial load.
Another important modification corresponds to the incorporation ofthe boundary reinforcement in the analysis, since in the work byMassone and Ulloa [14] it was reported that there was an under-estimation of the shear strength as the strength associated with theboundary element increased.
One way of incorporating the effect of the main or boundary re-inforcement is to rewrite the equation of longitudinal equilibrium (Eq.(4)) as follows:
= + + +σ σ α σ α ρ f βρ fcos sinL d r L L B B2 2 (23)
where fB is the stress of the main or boundary reinforcement in thedirection L [MPa] (associated to the same web longitudinal strain, εL);ρB is the main or boundary reinforcement ratio; β is the main re-inforcement efficiency parameter (0≤ β≤ 1). Massone and Álvarez[15], based on a good estimate of the shear capacity for corbels, con-cluded that β should take the value of 0.3.
3. Modified panel model for beam-column joints
At first, it is necessary to make a geometric analogy between a shortwall and a beam-column joint. As shown in Fig. 4(d), the cubic elementrepresents the joint, such that the following similarities can be made:h=Hw and b= tw. In addition, in Fig. 4(e), the reinforcement bars inthe joint are illustrated. Three types of reinforcement are distinguished:the transverse reinforcement (Ast), the longitudinal reinforcement (AsL)and the edge reinforcement (AsB).
3.1. Modification of the tensile constitutive law of concrete
A preliminary analysis of the results indicates that the model withthe modifications incorporated has good results, however, the impact ofthe horizontal reinforcement is not captured adequately (the amount ofreinforcement reaches values of 3% in the database in some cases,which was not observed in walls). This occurs because the equilibriumis realized in the vertical direction, and indirectly and partially, theeffect is captured in the estimate of the horizontal strain (expansion)that is used to determine the angle of the compression strut. To directly
Fig. 5. Material laws – (a) concrete in compression [11]; (b) concrete in tension [16], and (c) reinforcing steel.
L.M. Massone, G.N. Orrego Engineering Structures 173 (2018) 681–692
685

incorporate this effect into the analysis, the expression by Wang et al.[10] to define the tensile capacity of concrete is used. This expression,through equilibrium, incorporates both the contribution of vertical andhorizontal distributed reinforcement. For the purposes of this analysis,and considering that vertical reinforcement is already incorporated inthe equilibrium equation, only the horizontal reinforcement componentis incorporated in this term. In this way, the tensile strength of concreteis defined as:
= ′ +f f ρ f α0.4 [MPa] cost n c sh yh,2
(24)
3.2. Effect of confinement of beams and columns adjacent to the joint
As reported in the literature (e.g. [10,18]) the interior joints presenthigher shear capacity than the external joints under similar conditions,because of their higher confining effect (constraining expansion) ofadjacent beams. This can be seen with the 1B (exterior – [19]) and X1(interior – [20]) tests, where the interior and exterior joints are de-signed similarly. Table 1, which shows the most relevant parameters ofthe tests, indicates that the interior joint reaches a shear strength 52%higher than the exterior joint. The proposed model, after incorporatingthe confinement effect, provides similar joint shear strength estimates(807 kN for the interior joint vs. 499 kN for the exterior joint), mainlyattributed to confinement.
Additionally, in the present work, it is considered that the columns,as same as the beams, can provide some vertical (longitudinal) con-finement to the joint. In this case, both exterior and interior joints havethe same elements above and/or below the joint, so this effect mustinfluence in a similar way both types of connections. Thus, in order toincorporate the confinement influence provided by the beams andcolumns, Eqs. (21) and (22) were modified, such that = −ε ε λ(1 )t avg
modt avg t, ,
and = −ε ε λ(1 )L avgmod
L avg L, , , reducing their values, which is understood as alimitation in the transverse and longitudinal expansion of the joint bymeans of factors λt (for the transverse direction) and λL (for the long-itudinal), which vary from the value 0 to 1.
These equations are used to obtain and calibrate the angle of thestrut (crack angle), α. It is assumed that the compression strut angle isdefined when =σ fr ct is reached, as same as with previous models.Therefore, in this model, the confinement from beams and columns isreflected in the expressions that calculate this angle. In order to set theparameter values of λt and λL, a database of interior and exterior beam-column joint tests was compiled (this is described in the followingsection). While applying the modified model the pair of values that bestestimates the shear strength of joint with low scatter was selected.Considering that both exterior and interior joints have the same con-finement due to the presence of columns (not beams), the value of theconstant reducing the longitudinal expansion, =λ 0.5L is selected forboth types of joint. On the other hand, as for the exterior joints
=λ( 0.2)t there are fewer beam elements in the transverse directionthan those in interior joint, there is a higher level of confinement forinterior joint =λ( 0.7)t , resulting in a higher value of λt .
These parameters allow determining the new values of vertical andhorizontal average strain for beam-column joints. As it was done by aprevious author [14], given a guess value for the shear distortion γ( )Lt ,the longitudinal and transverse strain can be determined with themodified expressions of Eqs. (21) and (22), for a specific elementconfiguration (different values of geometries, axial load, materialproperties and reinforcement amounts). By using compatibility and the
material constitutive law for concrete in tension, it can be determinewhether the cracking stress has been reached =σ f( )r ct , increasing thevalue of γLt until the crack has formed, which defines the crack angle(α). After running this procedure, the new expressions for the crackingangles (strut) are calibrated as a function of the most relevant para-meters (aspect ratio and axial load level), as:
= + +′− −( )( )α
Exterior joint:
17.6 0.5 0.1hL
Nf bL
0.02 0.46
w c w (25)
= + +′− −( )( )α
Interior joint:
19.8 0.5 0.1hL
0.04 Nf bL
0.43
w c w (26)
3.3. Description of the database
A large series of research projects available from the literature areused to compile a database for interior and exterior beam-column joints[18–39]. The compiled database consists of 92 tests, with 54 exteriorjoints and 38 interior joints (Table 2). The two types of joints andtesting scheme are shown in Fig. 6. For the database, the compressivestrength of concrete varies from 22.1 to 92.4 [MPa]; the longitudinalreinforcing steel ratio varies from 0 to 4%; the boundary steel re-inforcement ratio varies from 0.51 to 3.5%; the transverse reinforce-ment steel ratio varies from 0 to 3%; the yield stress of the longitudinaland boundary reinforcement steel varies from 280 to 644 [MPa];whereas for the transverse reinforcing steel it varies from 235 to 1320[MPa]; the axial load level varies from 0 to 0.75Lwb ′f c. The database iscompiled from several research programs, with a variety of steelquantities (low to high steel ratio), material strength (normal to highstrength materials), as well as axial load, which makes the database richin data that can identify the relevance of each parameter in the model.
3.4. Flexure model for beams and flexo-compression model for columns
In order to verify whether the beams or columns adjacent to thejoint fail before the joint, a simple bending model is implemented in thecase of the beams and one of flexo-compression for the columns. In bothcases, it is considered that failure occurs at the joint-beam or joint-column interface, respectively. The procedure described in the ACI 318-14 [7] is used in the analysis. Once the ultimate strength is obtained,either from the beam or column, the forces acting on the joint are re-presented by Fig. 7, such that the joint shear strength is determined as
= −V T Vjoint s b c, 2 1, for exterior joints and = + −V T T Vjoint s b s b c, 1 , 2 1 for in-terior joint, where Vc1 represents the shear force in the column, andTs,b1 and Ts.b2 correspond to the tensile forces of the upper and lowerbeam reinforcement, respectively.
4. Modified model results
4.1. Strength
Using the proposed model and incorporating the contribution of theboundary reinforcement proposed by Massone and Alvarez [15], that is,taking β = 0.3, as well as, incorporating the horizontal reinforcementin the tensile strength of concrete and implementing the new expres-sions to obtain the crack angle (strut) (Eqs. (25) and (26)), the shear
Table 1Exterior and interior joint test comparison.
Type h (mm) Lw (mm) b (mm) bb (mm) ′fc (MPa) ρL (%) fyL (MPa) ρt (%) fyt (MPa) ρB (%) fyB (MPa) N/Ag ′fc Vtest (kN)
Exterior 480 300 300 259 33.6 0.78 490 0.87 437 1.17 490 0.06 554Interior 419 362 362 279 34.3 0.87 414 0.76 352 1.29 414 0.05 840
L.M. Massone, G.N. Orrego Engineering Structures 173 (2018) 681–692
686

Table2
Beam
-colum
njointda
taba
se.
Autho
rSp
ecim
enID
h[m
m]
L w[m
m]
b[m
m]
d w[m
m]
b viga[m
m]
′ f c[M
Pa]
ρ L[%
]f yL
[MPa
]ρ t
[%]
f yt[M
Pa]
ρ B[%
]f yB
[MPa
]N/(Ag
′ f c)Vtest[kN]
Type
a
Mag
get[22]
UnitA
146
038
033
029
025
522
.10.81
365
1.61
317
1.22
365
0.07
576
1
Leeet
al.[
19]
22
254
279
203
229
203
29.0
0.00
01.11
389
1.23
538
0.11
194
15
325
427
920
322
920
324
.80.00
01.11
389
1.23
538
0.00
206
16
425
427
920
322
920
324
.80.00
00.49
273
1.23
531
0.00
208
1
Paulay
etal.[
29]
Unit1
561
045
745
741
235
622
.60.67
296
0.90
326
0.67
296
0.05
754
1Unit2
661
045
745
741
235
622
.50.67
296
0.90
326
0.67
296
0.15
990
1Unit3
761
045
745
741
235
626
.90.67
296
0.46
316
0.67
296
0.05
753
1
Park
etal.[
28]
Unit3
845
740
630
536
822
938
.20.56
485
0.22
321
0.36
315
0.10
606
1
Kan
adaet
al.[
16]
U40
L9
380
300
300
259
260
24.3
1.00
385
0.00
01.00
385
0.00
256
1U41
L10
380
300
300
259
260
26.7
1.00
385
0.26
294
1.00
385
0.00
339
1U42
L11
380
300
300
261
260
30.1
0.99
385
0.13
294
0.99
385
0.00
337
1U20
L12
380
300
300
261
260
26.7
0.00
00.00
00.73
387
0.00
188
1U21
L13
380
300
300
261
260
30.1
0.00
00.26
294
0.73
387
0.00
198
1
Ehsani
etal.[
9]1B
1448
030
030
024
425
933
.60.78
490
0.87
437
1.17
490
0.06
554
13B
1548
030
030
024
425
940
.90.78
490
1.31
437
1.17
490
0.06
591
14B
1643
930
030
024
425
944
.60.78
490
1.48
437
1.56
490
0.06
635
15B
1748
034
034
029
030
024
.31.03
414
0.77
437
2.06
414
0.13
571
16B
1848
034
034
029
030
039
.80.58
490
0.77
437
0.87
490
0.07
469
1
Zerbe[35]
J119
381
305
305
241
254
39.4
1.38
483
1.09
531
2.07
483
0.05
438
1J3
2038
130
530
524
125
439
.91.38
483
1.09
531
2.07
483
0.05
449
1
Ehsani
etal.[
10]
121
480
340
340
290
300
64.7
0.58
455
1.15
455
1.08
455
0.02
486
12
2248
034
034
029
030
067
.30.58
455
1.15
455
1.08
455
0.04
609
13
2343
930
030
024
925
964
.70.76
455
1.48
455
1.42
455
0.07
542
14
2443
930
030
024
925
967
.31.04
455
1.48
455
1.88
455
0.05
627
1
Alamed
dine
[3]
LL8
2550
835
635
629
231
756
.50.75
479
1.20
446
1.35
468
0.04
860
1LH
826
508
356
356
292
317
56.5
0.75
479
1.80
446
1.35
468
0.04
838
1HL8
2750
835
635
629
231
756
.50.98
457
1.22
446
1.46
457
0.07
987
1HH8
2850
835
635
629
231
756
.50.98
457
1.84
446
1.46
457
0.07
986
1LL
1129
508
356
356
292
317
74.5
0.75
479
1.14
446
1.35
468
0.03
769
1LH
1130
508
356
356
289
317
74.5
0.76
479
1.77
446
1.36
468
0.03
934
1HL1
131
508
356
356
289
317
74.5
0.99
457
1.16
446
1.48
457
0.06
967
1HH11
3250
835
635
628
931
774
.50.99
457
1.77
446
1.48
457
0.06
1021
1
Alamed
dine
[3]
LL14
3350
835
635
628
631
792
.40.76
479
1.22
446
1.38
468
0.02
878
1LH
1434
508
356
356
292
317
92.4
0.75
479
1.80
446
1.35
468
0.02
890
1HH14
3550
835
635
629
231
792
.40.98
457
1.87
446
1.46
457
0.04
1032
1
Fujii
etal.[
12]
B136
250
220
220
190
160
30.0
1.22
387
0.41
291
1.22
387
0.07
246
1B2
3725
022
022
019
016
030
.01.22
387
0.41
291
1.22
387
0.07
214
1B3
3825
022
022
019
016
030
.01.22
387
0.41
291
1.22
387
0.24
273
1B4
3925
022
022
019
016
030
.01.22
387
1.10
291
1.22
387
0.24
287
1
Kak
uet
al.[
15]
140
220
220
220
201
160
31.1
0.00
00.49
250
0.90
360
0.17
249
12
4122
022
022
020
116
041
.70.00
00.49
250
0.90
360
0.10
244
13
4222
022
022
020
116
041
.70.00
00.49
250
0.90
360
0.00
212
14
4322
022
022
020
116
044
.70.00
00.12
281
0.90
360
0.17
236
15
4422
022
022
020
116
036
.70.00
00.12
281
0.90
360
0.09
220
16
4522
022
022
020
116
040
.40.00
00.12
281
0.90
360
0.00
208
17
4622
022
022
020
416
032
.20.70
395
0.49
250
0.70
395
0.12
249
18
4722
022
022
020
416
041
.20.70
395
0.49
250
0.70
395
0.08
243
19
4822
022
022
020
416
040
.60.70
395
0.49
250
0.70
395
0.00
234
1
(con
tinuedon
next
page)
L.M. Massone, G.N. Orrego Engineering Structures 173 (2018) 681–692
687

Table2(con
tinued)
Autho
rSp
ecim
enID
h[m
m]
L w[m
m]
b[m
m]
d w[m
m]
b viga[m
m]
′ f c[M
Pa]
ρ L[%
]f yL
[MPa
]ρ t
[%]
f yt[M
Pa]
ρ B[%
]f yB
[MPa
]N/(Ag
′ f c)Vtest[kN]
Type
a
1049
220
220
220
204
160
44.4
0.70
395
0.12
281
0.70
395
0.17
241
111
5022
022
022
020
416
041
.90.70
395
0.12
281
0.70
395
0.08
229
112
5122
022
022
020
416
035
.10.70
395
0.12
281
0.70
395
0.00
207
114
5222
022
022
020
416
041
.00.28
381
0.12
281
0.28
282
0.08
224
115
5322
022
022
020
416
039
.70.32
381
0.12
281
0.32
395
0.08
229
116
5422
022
022
020
416
037
.41.13
381
0.49
250
1.13
381
0.00
250
1
Blak
eley
etal.[
6]interior
5588
968
645
760
645
748
.52.36
289
1.52
297
1.77
289
0.03
1722
2
Meinh
eitet
al.[
23]
I56
457
457
330
384
279
26.2
1.22
457
0.50
409
0.61
457
0.40
1090
2II
5745
745
733
037
427
941
.82.65
449
0.50
409
1.33
449
0.25
1597
2III
5845
745
733
037
127
926
.64.94
402
0.50
409
1.65
402
0.39
1228
2IV
5945
733
045
725
140
636
.11.12
438
0.73
409
2.25
438
0.30
1454
2V
6045
745
733
037
427
935
.92.65
449
0.50
409
1.33
449
0.04
1530
2VI
6145
745
733
037
427
936
.82.65
449
0.50
409
1.33
449
0.48
1646
2VII
6245
733
045
725
140
637
.21.12
438
0.73
409
2.25
438
0.47
1468
2XII
6345
745
733
037
427
935
.22.65
449
2.36
423
1.33
449
0.30
1948
2XIII
6445
745
733
037
427
941
.32.65
449
1.51
409
1.33
449
0.25
1557
2
Meinh
eitet
al.[
23]
XIV
6545
733
045
725
140
633
.21.12
438
2.18
409
2.25
438
0.32
1539
2
Fenw
ick[11]
Unit1
6630
030
025
026
020
042
.90.62
318
2.55
275
1.93
280
0.00
521
2Unit3
6730
030
025
026
420
039
.31.37
318
3.00
275
0.69
318
0.00
437
2
Birss[7]
B168
610
457
457
–35
627
.90.96
427
1.21
346
0.96
427
0.05
1217
2B2
6961
045
745
7–
356
31.5
0.96
427
0.50
398
0.96
427
0.44
1213
2
Beckingsale[5]
B11
7061
045
745
741
435
635
.90.82
423
2.85
336
0.82
423
0.04
965
2B1
271
610
457
457
414
356
34.6
0.82
422
2.85
336
0.82
422
0.04
982
2B1
372
610
457
457
414
356
31.4
0.82
398
1.91
336
0.82
398
0.26
1015
2
Park
etal.[
27]
interior
7345
740
630
536
622
934
.00.56
412
2.13
305
0.56
412
0.24
966
2
Park
etal.[
28]
Unit1
7445
740
630
536
422
941
.30.82
473
3.52
320
0.82
473
0.10
1001
2
Durrani
etal.[
8]X1
7541
936
236
2–
279
34.3
0.87
414
0.76
352
1.29
414
0.05
840
2X2
7641
936
236
2–
279
33.6
0.87
414
1.15
352
1.29
414
0.06
853
2X3
7741
936
236
2–
279
31.0
0.48
345
0.76
352
0.90
345
0.05
629
2
Otani
etal.[
25]
C1
7830
030
030
026
420
025
.61.28
422
0.27
324
0.64
422
0.08
436
2C2
7930
030
030
026
420
025
.61.28
422
0.90
324
0.64
422
0.08
432
2C3
8030
030
030
026
420
025
.61.28
422
2.01
324
0.64
422
0.08
410
2
Abram
s[1]
LIJ3
8134
345
734
340
234
331
.10.00
470
0.55
400
0.57
470
0.00
724
2LIJ4
8234
345
734
340
234
334
.30.00
470
0.55
400
0.57
470
0.00
789
2
Leon
[20]
BCJ2
8330
525
425
4–
203
30.3
1.31
448
0.49
414
0.87
448
0.00
358
2BC
J384
305
305
254
–20
327
.41.09
448
0.49
414
0.73
448
0.00
394
2BC
J485
305
356
254
–20
327
.20.62
448
0.49
414
0.62
448
0.00
462
2
Kitam
ayaet
al.[
18]
B186
300
300
300
–20
024
.51.47
351
0.35
235
1.24
351
0.08
570
2B2
8730
030
030
0–
200
24.5
1.47
351
0.35
235
1.24
351
0.08
570
2B3
8830
030
030
0–
200
24.5
0.94
371
0.88
235
0.78
371
0.08
515
2
Fujii
etal.[
12]
A1
8925
022
022
019
016
040
.21.82
644
0.41
291
1.52
644
0.08
412
2A2
9025
022
022
019
016
040
.21.82
387
0.41
291
1.52
387
0.08
380
2A3
9125
022
022
019
016
040
.21.82
644
0.41
291
1.52
644
0.23
412
2A4
9225
022
022
019
016
040
.21.82
644
1.10
291
1.52
644
0.23
421
2
aTy
pe1=
Exterior
joint/Ty
pe2=
Interior
joint.
L.M. Massone, G.N. Orrego Engineering Structures 173 (2018) 681–692
688

strength is calculated for the collected database, as well as the strengthfor the flexural and flexo-compression models. The numerical proce-dure is described in Fig. 8, where the general steps are described. Inorder to iterate to solve the vertical equilibrium equation, any numer-ical (e.g., Newton-Rapson, bisection) can be implemented. Once theoverall shear stress versus shear strain is determined, the shear strengthis selected as the peak capacity. The response of 3 selected specimenswith different failure modes are depicted in Fig. 9. In the figure, one of
the specimens reaches the tensile capacity of concrete followed by astrength reduction due to the absence of longitudinal distributed re-inforcement (ID-13); another specimen also presents strength reductiononce tensile of concrete is reached, but recovers its capacity reaching alarger strength due to yielding of the longitudinal reinforcement (ID-5);and similarly, the third specimens overcomes the cracking capacity, butthe longitudinal reinforcement due to its larger quantity, does not yieldresulting in a joint that reaches the compressive strength of concrete(ID-79).
Table 3 shows the summary of the statistical results (mean andstandard deviation of the Vmodel/Vtest ratio) when applying the model.When comparing the three types of failure modes (joint shear, beamflexure or column flexo-compression), it is observed that for the data-base there are no predicted tests that have a column failure (not shownin table).
Considering all cases (joint shear and beam flexural failure) yield onaverage that the capacity predictions for the database are under-estimated by 3%. Now, if only joint shear failure is considered, a moreconservative prediction is observed, since it underestimates the jointshear strength by 7%. As for beam flexural failure, the model agreeswell with the test results (error of 2%), although with greater dispersionthan in the case of shear (0.19 versus 0.14), with almost half of thedatabase failing in joint shear. On the other hand, similar accuracy isshown between interior and exterior joints, with more conservativeresults for interior joints failing in shear.
4.2. Confinement effect from beams
General trends of the two models implemented is provided, that is,the original model where the angle of the strut is not affected by theconfinement generated by the adjacent beams (original model) and themodel presented in this work that corrects the angle with respect to thelevel of confinement provided by the beams (both considering thecontribution of the boundary and transverse reinforcement), given bythe ratio =conf ·b
bN4
vc
, where bv corresponds to the width of the beam, bc
Fig. 6. Types of beam-column joints – (a) exterior joint, and (b) interior joint(after [23]).
Fig. 7. Forces acting at the joint – (a) interior joint, and (b) exterior joint.
Fig. 8. Flow chart with the numerical scheme of the model formulation.
Fig. 9. Analytical shear stress versus shear strain response of selected speci-mens.
Table 3Vmodel/Vtest ratio results for exterior and interior joints.
All Joint shear Beam flexure
Type Avg Std. Dev. Avg Std. Dev. N°cases(%)
Avg Std. Dev. N°cases(%)
Exterior 0.99 0.18 0.98 0.13 23(43%)
1.00 0.22 31(57%)
Interior 0.95 0.15 0.89 0.13 24(63%)
1.05 0.13 14(37%)
All 0.97 0.17 0.93 0.14 47(51%)
1.02 0.19 45(49%)
L.M. Massone, G.N. Orrego Engineering Structures 173 (2018) 681–692
689

to the width of the column and N to the number of beams surroundingthe joint.
For a better analysis of this parameter, interior and exterior jointsare presented independently. Fig. 10 shows the strength predictions fordifferent confinement levels provided by the beams in exterior joints.This type of exterior joints is not considered confined by the beams inACI 318-14 [7]. This is mainly reflected in the model, where a trendline (red line) is almost horizontal for both the original and the mod-ified model, with a slight correction in the modified model. This in-dicates a low dependency on this parameter. On the other hand, Fig. 11shows the strength predictions for interior joints. ACI 318-14 in thiscase improves the joint strength due to confinement. This time, theoriginal model is highly dependent on this parameter, observing that asthere is more confinement, the model becomes more conservative. Thisindicates that the original model fails to correctly capture the con-finement effect provided by beams. This is corrected when using themodified model, resulting in a trend line (red line) more horizontal thanin the case of the original model.
4.3. Comparison with models from the literature
The experimental joint shear strength of the database is comparedwith five models from the literature, for both exterior and interiorjoints. These models are: ACI318-14 [7], the work done by Hwang andLee [5,6], the one by Kassem [8], the model developed by Kim andLaFave [9] and the model presented by Wang et al. [10], which werepresented in the introduction. The model results are plotted in Fig. 12.In addition, in all cases, predictions for flexural failure in beams andflexo-compression in columns are also performed. The figure shows thatthe proposed model and the models by Wang et al. [10], Kassem [8]and Kim and LaFave [9] present average strength ratio close to 1 forjoint shear failure (red dots).
Table 4 classifies the strength estimated by failure type for all fourmodels. It is observed that flexo-compression failure in columns is
practically inexistent, except for the model by Hwang and Lee [5,6],Kassem [8] and Wang et al. [10], presenting 1 case in each of them.Most cases are controlled by joint shear failure, except for the model byKim and LaFave [9]. In addition, statistical results (mean and standarddeviation) of the model to test strength ratio (Vmodel/Vtest) for the sixmodels are presented. This ratio was selected, since it is strength in-dependent (instead of comparing Vmodel vs Vtest). It is observed that themodel developed in ACI318-14 presents lowest strength ratio, under-estimating the capacity by 17% for all specimens, with the highestdispersion in the group. On the other hand, the proposed model and themodel by Wang et al. [10], as well as the semi-empirical models(Kassem [8] and Kim and LaFave [9]) show the best strength ratio(error on average less than 10%) for shear failure with also low stan-dard deviation (between 0.13 and 0.15), with slightly better response inthe model by Kim and LaFave, in part due to the low number of spe-cimens with shear failure (only 32 cases, also 2 specimens with notransverse reinforcement were not included since the shear strengthbecomes zero). The good performance of the semi-empirical models isunderstandable due to the large database that was used for their cali-bration. However, these 2 semi-empirical models also show the largestdifferences between the number of specimens that are predicted withshear failure, indicating that such formulations might be highly de-pendent in the parameter selection, especially when more than onefailure mode is expected.
The results indicate that the proposed model accurately predicts theshear strength of beam-column joints. Even, though the model presentsgood correlation, it is necessary to study the dependency to the mainmodel parameters. Fig. 13 shows the same results presented in Fig. 12a,but in the horizontal axis different model parameters are deployed. Theconcrete compression strength (f′c) is presented in Fig. 13a; the long-itudinal reinforcement strength ( +ρ f ρ f0.3L yL B yB), similar to the con-tribution in Eq. (23) but for reinforcement yielding, in Fig. 13b; thetransverse reinforcement strength (ρ ft yt) in Fig. 13c; and axial level( ′N f A/ c g) in Fig. 13d. As it can be seen in all plots of Fig. 13, there is
Fig. 10. Vmodel/Vtest ratio respect to confinement level for exterior joints – (a) original model, and (b) modified model.
Fig. 11. Vmodel/Vtest ratio respect to confinement level for interior joints – (a) original model, and (b) modified model.
L.M. Massone, G.N. Orrego Engineering Structures 173 (2018) 681–692
690

modest dependency of the accuracy of the proposed model (Vmodel/Vtest) to the parameters considered, indicating that their contribution iswell captured by the model.
5. Conclusions
In the present work, a model is implemented with the objective ofpredicting the non-linear behavior of reinforced concrete beam-columnjoints subjected to axial and shear stresses, which is based on a simpleformulation that considers an average strain and stress field of a re-inforced concrete panel representing the joint. The model satisfies theequilibrium in the longitudinal direction.
A modification to the original model is developed, incorporating theconfinement effect due to the presence of beams adjacent to the joint.For this, the transverse and longitudinal expansions are reduced (sincethe columns have a similar effect constraining the longitudinal strain),yielding new expressions for the crack angle, differentiating betweenexterior and interior joints, since the confinement effect of the beams
for the interior joints is larger. Another modification incorporated is theconstitutive law for concrete in tension, where the contribution of thetransverse reinforcement is included.
After applying these modifications, the proposed model yields anaverage strength (Vmodel/Vtest) of 0.97 and a standard deviation of 0.17,maintaining good estimates for both exterior and interior joints. Thisdispersion decreases to 0.14 when comparing only the specimens pre-dicted to fail by joint shear. The incorporation of confinement for theestimation of the angle of the principal direction captures the depen-dence to the constraining of adjacent beams the joint, in particular withthe interior joints, where the effect is more relevant.
The proposed model together with the work by Wang et al. [4] andthe semi-empirical models (Kassem [8] and Kim and LaFave [9]) pro-vide the best results, compared to others available in the literature,regarding their dispersion values and in terms of the average shearstrength estimation. The semi-empirical models, however, present greatdifferences in the number of specimens with shear failure. The proposedmodel can be used also to determine the entire shear load versus shear
Fig. 12. Joint shear model to test strength ratio, Vmodel/Vtest, – (a) proposed model, (b) ACI 318 [7]; (c) Kassem [8], (d) Hwang and Lee [5,6], (e) Wang et al. [10] and(f) Kim and LaFave [9].
Table 4Strength estimate ratio for the proposed model and models from the literature.
Cases Prop. model ACI318 Hwang and Lee Wang et al. Kassem Kim and LaFave
All Average 0.97 0.83 0.87 0.96 0.95 1.03St. dev. 0.17 0.18 0.15 0.15 0.15 0.15C.O.V. 0.18 0.22 0.17 0.16 0.16 0.15
Joint shear Average 0.93 0.79 0.86 0.94 0.94 1.04St. dev. 0.14 0.19 0.16 0.15 0.15 0.13C.O.V. 0.15 0.24 0.18 0.15 0.16 0.13N° cases (%) 47 (51%) 64 (70%) 64 (70%) 60 (65%) 80 (87%) 32 (36%)
Beam flexure Average 1.02 0.93 0.91 1.00 1.02 1.03St. dev. 0.19 0.13 0.12 0.16 0.15 0.16C.O.V. 0.19 0.15 0.13 0.16 0.15 0.16N° cases (%) 45 (49%) 28 (30%) 27 (29%) 31 (35%) 11 (12%) 58 (64%)
Column flexo-comp.* Average – – 0.94 0.94 0.94 0N° cases (%) 0 (0%) 0 (0%) 1 (1%) 1 (1%) 1 (1%) 0
a Only average is shown since there is 1 or 0 cases.
L.M. Massone, G.N. Orrego Engineering Structures 173 (2018) 681–692
691

deformation of the joint.
References
[1] Hoffmann GW, Kunnath SK, Reinhorn AM, Mander JB. Gravity-load-designed reinforcedconcrete buildings: seismic evaluation of existing construction and detailing strategies forimproved seismic resistance. Technical Report NCEER-92-0016. SUNY/Buffalo, NY:National Center for Earthquake Engineering Research; 1992.
[2] Youssef M, Ghobarah A. Modeling of RC beam-column joints and structural walls. JEarthq Eng 2001;5(1):93–111.
[3] Lowes LN, Altoontash A. Modeling reinforced concrete beam-column joints subjected tocyclic loading. J Strut Eng 2003;129(12):1686–97.
[4] Pan Z, Guner S, Vecchio FJ. Modeling of interior beam-column joints for nonlinear ana-lysis of reinforced concrete frames. Eng Struct 2017;142:182–91.
[5] Hwang SJ, Lee HJ. Analytical model for predicting shear strengths of exterior reinforcedconcrete beam-column joints for seismic resistance. ACI Struct J 1999;96(5):846–57.
[6] Hwang SJ, Lee HJ. Analytical model for predicting shear strengths of interior reinforcedconcrete beam-column joints for seismic resistance. ACI Struct J 2000;97(1):35–44.
[7] ACI Committee 318. Building code requirements for structural concrete (ACI 318-14) andcommentary (318R-14). Farmington Hills, Mich: American Concrete Institute; 2014.
[8] Kassem W. Strut-and-tie modelling for the analysis and design of RC beam-column joints.Mater Struct 2016;49:3459–76.
[9] Kim J, LaFave JM. A simplified approach to joint shear behavior prediction of RC beam-column connections. Earthq Spectra 2012;28(3):1071–96.
[10] Wang GL, Dai JG, Teng JG. Shear strength model for RC beam–column joints underseismic loading. Eng Struct 2012;40:350–60.
[11] Zhang L-XB, Hsu TTC. Behavior and analysis of 100 MPa concrete membrane elements. JStruct Eng 1998;124(1):24–34.
[12] Kupfer H, Gerstle KH. Behavior of concrete under biaxial stress. J Eng Mech Div, ASCE1973;99(4):853–66.
[13] Kassem W, Elsheikh A. Estimation of shear strength of structural shear walls. J Struct Eng,ASCE 2010;136(10):1215–24.
[14] Massone LM, Ulloa MA. Shear response estimate for squat reinforced concrete walls via asingle panel model. Earthq Struct 2014;7(5):647–65.
[15] Massone LM, Alvarez JE. Shear strength model for reinforced concrete corbels based onpanel response. Earthq Struct 2016;11(4):723–40.
[16] Gupta A, Rangan BV. High-strength concrete HSC structural walls. ACI Struct J1998;95(2):194–205.
[17] Massone LM. Strength prediction of squat structural walls via calibration of a shear-flexure interaction model. Eng Struct 2010;32(4):922–32.
[18] Fujii S, Morita S. Comparison between interior and exterior RC beam-column joint be-havior. In: Jirsa JO, editor. Design of beam-column joints for seismic resistance, SP-123.Farmington Hills, Mich.: American Concrete Institute; 1991. p. 145–65.
[19] Ehsani MR, Wight JK. Exterior reinforced concrete beam-to-column connections sub-jected to earthquake-type loading. ACI J 1985;82(4):492–9.
[20] Durrani AJ, Wight JK. Behavior of interior beam-to-column connections under earth-quake-type loading. ACI J 1985;82(3):343–9.
[21] Abrams DP. Scale relations for reinforced concrete beam-column joints. ACI Struct J1987;84(6):502–12.
[22] Alameddine FF. Seismic design recommendation for high-strength concrete beam-to-column connections. PhD thesis, University of Arizona; 1990. 257p.
[23] Beckingsale CW. Post-elastic behaviour of reinforced concrete beam-column joints.Research Report No. 80-20. Department of Civil Engineering, University of Canterbury,Christchurch, New Zealand; 1980. 379p.
[24] Blakeley RWG, Megget LM, Priestley MJN. Seismic performance of two full-size re-inforced concrete beam-column joint units. Bull New Zealand Nat Soc Earthq Eng1975;8(1):38–69.
[25] Birss GR. The elastic behaviour of earthquake resistant reinforced concrete beam-columnjoints. Research Report No. 78-13. Department of Civil Engineering, University ofCanterbury, Christchurch, New Zealand; 1978. 105p.
[26] Ehsani MR, Moussa AE, Vallenilla CR. Comparison of inelastic behavior of reinforcedordinary and high-strength concrete frames. ACI Struct J 1987;84(2):161–9.
[27] Fenwick RC, Irvine HM. Reinforced concrete beam-column joints for seismic loading.School of Engineering Report No. 142. Department of Civil Engineering, University ofAuckland, Auckland, New Zealand; 1977. 50p.
[28] Kaku T, Asakusa H. Ductility estimation of exterior beam-column subassemblages in re-inforced concrete frames. In: Jirsa JO, editor. Design of beam-column joints for seismicresistance, SP-123. Farmington Hills, Mich.: American Concrete Institute; 1991. p.167–85.
[29] Kanada K, Kondon G, Fujii S, Morita S. Relation between beam bar anchorage and shearresistance at exterior beam-column joints. Trans Jpn Concr Inst 1984;6:433–40.
[30] Kitayama K, Otani S, Aoyama H. Development of design criteria for RC interior beam-column joints. Design of beam-column joints for seismic resistance, SP-123. FarmingtonHills, Mich.: American Concrete Institute; 1991. p. 97–123.
[31] Lee DLN, Wight JK, Hanson RD. RC beam-column joints under large load reversals. JStruct Div, ASCE 1977;103(ST12):2337–50.
[32] Leon RT. Shear strength and hysteretic behavior of interior beam-column joints. ACIStruct J 1990;87(1):3–11.
[33] Megget LM. Cyclic behaviour of exterior reinforced concrete beam-column joints. BullNew Zealand Nat Soc Earthq Eng 1974;7(1):22–47.
[34] Meinheit DF, Jirsa JO. The shear strength of reinforced concrete beam-column joints.CESRL Report No. 77-1. Department of Civil Engineering, University of Texas at Austin;1977. 271p.
[35] Otani S, Kitayama K, Aoyama H. Beam bar bond stress and behavior of reinforced con-crete interior beam-column connections. Second U.S.-N.Z.-Japan Seminar, Tokyo; 1985.
[36] Park R, Gaerty L, Stevenson EC. Tests on an interior reinforced concrete beam-columnjoint. Bull New Zealand Nat Soc Earthq Eng 1981;14(2):81–92.
[37] Park R, Milburn JR. Comparison of recent New Zealand and United States seismic designprovisions for reinforced concrete beam-column joints and tests results from four unitsdesigned according to the New Zealand code. Bull New Zealand Nat Soc Earthq Eng1983;16(1):3–24.
[38] Paulay T, Scarpas A. Behavior of exterior beam-column joints. Bull New Zealand Nat SocEarthq Eng 1981;14(3):131–44.
[39] Zerbe HE, Durrani AJ. Effect of slab on behavior of exterior beam-to-column connections.Report No. 30. Rice University, Houston, Tex.; 1985. 159p.
Fig. 13. Joint shear proposed model to test strength ratio, Vmodel/Vtest, versus – (a) f′c, (b) +ρ f ρ f0.3L yL B yB; (c) ρ ft yt, and (d) ′N f A/ c g .
L.M. Massone, G.N. Orrego Engineering Structures 173 (2018) 681–692
692