analytical methods for petroleum … specific analytical testing methods based on soil and/or...
TRANSCRIPT

ANALYTICAL METHODS FOR
PETROLEUM HYDROCARBONS
Publication No. ECY 97-602 June 1997
Printed on Recycled Paper
ANALYTICAL METHODS FOR
PETROLEUM HYDROCARBONS
Prepared by:
Washington State Department of Ecology Toxics Cleanup Program
And The Ecology Environmental Laboratory
Publication No. ECY 97-602 June 1997
Printed on Recycled Paper

For additional copies of this document, contact:
Department of Ecology Publications Distribution Center
PO Box 47600 Olympia, WA 98504-7600 Telephone: (360) 407-7472
The Department of Ecology is an equal opportunity agency and does not discriminate on the basis of race, creed, color, disability, age, religion, national origin, sex, marital status, disabled veteran's status, Vietnam Era veteran's status or sexual orientation.
For more information or if you have special accommodation needs, please contact Toxics
Cleanup Program at (360) 407-7170.

PREFACE LETTER
ANALYTICAL METHODS FOR PETROLEUM HYDROCARBONS
This document contains analytical methods for analyzing "Total Petroleum Hydrocarbons" (TPH) for compliance with the Model Toxics Control Act (MTCA)
Cleanup Regulation (chapter 173-340 WAC). The Washington Department of Ecology (Ecology) adopted changes to the MTCA Cleanup Regulation on February 12, 2001.
These changes became effective on August 15, 2001. Some of the analytical methods provided in this document may also be used for analyzing TPH in Oregon (check with the
Oregon Department of Environmental Quality for specific requirements).
The MTCA Cleanup Regulation sets forth the procedures and requirements for conducting remedial investigations, establishing cleanup standards, and selecting cleanup actions for the cleanup of hazardous waste sites. Part VII of the regulation describes how to establish cleanup levels for hazardous substances. MTCA provides three approaches
for establishing TPH cleanup levels: Method A (ARARs and Tables), Method B (Universal method), and Method C (Conditional method). Each of these approaches
require specific analytical testing methods based on soil and/or groundwater contamination and the hazardous substance found on the site.
Under Method A, the “total” approach may be used to collect and analyze the presence,
location, and concentration of TPH. This “total” approach includes two analytical methods: NWTPH-Gx for gasoline range organics (GRO) and NWTPH-Dx for diesel
range organics (DRO) and heavy oils. See Table 830-1 in WAC 173-340-900.
Under Method B and Method C, the “fractionated” approach must be used to collect and analyze the presence, location, and concentration of TPH, except as provided in WAC
173-340-700(8)(b)(ii)(D). This “fractionated” approach includes two analytical methods: one for “volatile” aliphatic and aromatic petroleum hydrocarbons (VPH) for gasoline range organics (GRO), and another for “extractable” aliphatic and aromatic petroleum
hydrocarbons (EPH) for diesel range organics (DRO) and heavy fuel oils. See Table 830-1 in WAC 173-340-900. Ecology is in the process of accrediting laboratories for the VPH and EPH analytical methods. Pending the evaluation of information from the
laboratory accreditation process, Ecology will be updating this document.
In conjunction with the Evironmental Protection Agency (EPA), Ecology is establishing a laboratory accreditation process. The accreditation of Washington laboratories will
provide some assurance of the technical proficiency and competence of a laboratory to assess conformance to a set of prescribed standards. The laboratory accreditation will be a formal recognition that a testing laboratory is competent to carry out tests specifically
related to TPH analytical testing methods.

Ecology is currently revising and expanding the TPH guidance document, “Guidance for Remediation of Petroleum Contaminated Soils,” Pub. No. 91-30. The revised document
will provide updated and expanded guidance regarding the conduction of remedial investigations, the establishment of cleanup levels, and the selection of cleanup actions
for petroleum contaminated sites.
Questions about analytical methods for petroleum hydrocarbons or the laboratory accreditation process should be directed to Charles San Juan at the Department of
Ecology (360-407-7191); e-mail: [email protected]. Access to a variety of technical guidance documents is also available at the Toxics Cleanup Program’s Internet address:
http://www.ecy.wa.gov/programs/tcp/cleanup.html.

TABLE OF CONTENTS
TOTAL PETROLEUM HYDROCARBONS (TPH)
ANALYTICAL DECISION TREE FOR NWTPH
NWTPH-HCID - Hydrocarbon Identification Method for Soil and Water .................................... 1
NWTPH-Gx - Volatile Petroleum Products Method for Soil and Water Analyses ..................... 11
NWTPH-Dx - Semivolatile Petroleum Products Method for Soil and Water Analyses.............. 19
Method for the Determination of Volatile Petroleum Hydrocarbons (VPH) Fractions ............... 27
Method for the Determination of Extractable Pet. Hydrocarbons (EPH) Fractions.................... 65
Appendices:
Appendix 1: Single Laboratory Accuracy, Precision, and Method Detection Limits (MDL) Data for VPH ...................................................................................................... 105
Appendix 2: Suggested VPH Data Reporting Format.................................................... 111
Appendix 3: Single Laboratory, Accuracy, Precision, and Method Detection Limit
(MDL) Data for EPH....................................................................................................... 115
Appendix 4: Suggested EPH Data Reporting Format .................................................... 121
Appendix 5: Report of Analysis Summary Sheet ........................................................... 125
Appendix 6: Chromatograms of Petroleum Products*................................................... 127
* The chromatograms are not available in the “electronic” version. They are included in the printed publication.


TOTAL PETROLEUM HYDROCARBONS (TPH)
The following compilation of analytical methods may be used in Oregon and Washington for Underground Storage Tank cleanups and other cleanups of TPH (check with applicable state rules). Each of these Total Petroleum Hydrocarbon (TPH) Methods has its own niche in the
overall analytical scheme. The methods are:
NWTPH-HCID....................................................................................Hydrocarbon Identification
NWTPH-Gx ....................................................................Volatile Petroleum Products (Extended)
NWTPH-Dx ...........................................................Semi-volatile Petroleum Products (Extended)
NWTPH-HCID is a qualitative and semi-quantitative screen to determine the presence and type of petroleum products that may exist in water or soil. This method should be used if the type of petroleum contamination is unknown. It should be performed on contaminated soil or
water that is representative of the contamination at the site. The results of this method will determine what fully quantitative method/methods, if any, are to be used in determining
compliance with the matrix criteria. Should the value of the analysis for gasoline, diesel or heavy oils (or any other identified petroleum product) exceed the reporting limits, then the
specific analytical method for that product must be employed.
NWTPH-Gx is the qualitative and quantitative method (extended) for volatile (“gasoline”) petroleum products in soil and water. Petroleum products applicable for this method include
aviation and automotive gasolines, mineral spirits, stoddard solvent and naphtha.
NWTPH-Dx is the qualitative and quantitative method (extended) for semi-volatile (“diesel”) petroleum products in soil and water. Petroleum products applicable for this include jet fuels,
kerosene, diesel oils, hydaulic fluids, mineral oils, lubricating oils and fuel oils.
NOTE: These “NWTPH” methods result in single TPH values that can be used when compliance with a single cleanup level is desired. When TPH “fractions” are needed, then
the VPH and EPH methods must be used.

ANALYTICAL DECISION TREE FOR NWTPH
The following flow chart depicts the laboratory analytical scheme to be used when analyzing samples for single TPH levels. The first step is the qualitative determination of the existence and nature of petroleum contamination and this should be used when the site contamination is
unknown. It is required that this first step will be performed on a representative sample from the area that is suspected to be the most contaminated at the site. For those samples containing analytes which, due to their retention times, ratios to each other or their non-hydrocarbon
pattern (e.g., creosote), do not suggest petroleum hydrocarbons, then GC/MS methods should be employed to ascertain the components. At those sites where the petroleum contaminants are known or have been identified using the NWTPH-HCID method, the specific product method is
to be used.
DETERMINATION/VERIFICATION
OF PETROLEUM CONTAMINATION
NWTPH-HCID
Volatile Petroleum Semi-volatile Petroleum NOT CONCLUSIVE
NWTPH-Gx
NWTPH-Dx
USE GC/MS (8260,8270) OR OTHER APPLICABLE METHODS
TO IDENTIFY AND QUANTITATE NON-PETROLEUM COMPONENTS


NWTPH-HCID
Hydrocarbon Identification Method for Soil and Water
Summary
This method is a qualitative and semi-quantitative procedure. It is used for groundwater or surface water, and soil/sediment from sites where the petroleum products are unknown and/or when
multiple types of petroleum products are suspected to be present. This method is used to identify petroleum products containing components from C7 to C30 range, as well as heavy oils, with specific product confirmation by pattern matching ("fingerprinting") employing capillary gas
chromatography with flame ionization detection (GC/FID). EPA method 3510 has been adapted as the extraction procedure for the water portion of this method.
While this method is intended to be primarily qualitative, it can be used to eliminate the need for
further analyses for those samples which demonstrate TPH levels significantly below the regulatory limits. If the sample contains toluene to dodecane (gasoline range), dodecane through tetradecane (diesel range) and/or an unresolved chromatographic envelope greater than tetradecane (e.g. motor
oils) above the reporting limits of this method, then the final quantitation must be performed by methods specific for these mixtures. Since the water extraction procedure in this method is
identical to that found in the water portion of NWTPH-Dx (semi-volatile petroleum products, i.e. from kerosene through heavy fuel oils), these products may be quantitated using this extract. Because of the possible loss of volatile compounds in the extraction and concentrations steps,
gasoline, mineral spirits and other volatile petroleum products that exceed the reporting limits of this method must be quantitated using the NWTPH-Gx method.
The reporting limits for water are 0.25 mg/L for gasoline, 0.63 mg/L for #2 diesel and motor oils. The reporting limits for soil/sediment are 20 mg/Kg for gasoline, 50 mg/Kg for #2 diesel, and 100 mg/Kg for motor oil, all reported on a dry weight basis. These values for soil/sediment assumes
100% solids and will be higher depending on the actual moisture content.
The method relies heavily upon the experience of the analyst for the identification of the specific petroleum product(s) that may be present. Therefore, this method must be run by, or under the
direct supervision of, analysts experienced in the use of GC and in the interpretation of gas chromatograms of both fresh and weathered petroleum products.
Analytical Methods for Petroleum Hydrocarbons 1

Equipment and Reagents
Gas Chromatograph, w/wo autosampler Capillary split/splitless injector
Flame ionization detector Suggested Capillary Column:
J&W DB-1 or DB-5, 30 M x 0.25 mm or 0.32 mm with 0.25 um film thickness capillary column or equivalent
Chromatography Data System VOA Vial: 40 mL glass vial with Teflon coated cap septum, Eagle Picher or equivalent
Syringe: Hamilton #701, 10 uL or equivalent Ultrasonic Bath
Glass Wool: Pyrex or equivalent Centrifuge tubes: 5 or 15 mL, calibrated in 0.1 mL increments
Analytical Balance: accurate to at least 0.0001 g Volumetric Flasks: 10 mL, ground glass with ground glass stopper
Separatory funnels: 500 mL, Teflon stopcocks Kuderna-Danish (KD) Flasks: 250 mL or equivalent
Snyder Columns: 3-ball, 24/40 ground glass joint Concentrator Tubes: 10 mL
Methylene Chloride: Burdick and Jackson Brand or equivalent N-Evap Concentrator or equivalent
Standards
Retention Time Standards. Prepare a composite standard, using methylene chloride as the solvent, consisting of toluene, dodecane and tetracosane at 25 ug/mL each. Additional compounds may be
added at the discretion of the analyst. The use of this standard is to establish the retention time windows for the quantitation of gasoline #2 diesel and motor oils.
Reference Standards. Prepare individual petroleum product reference standards (i.e. gasoline,
mineral spirits, kerosene and #2 diesel oil), using methylene chloride as the solvent, at approximately 50 ug/mL. Prepare a non-synthetic motor oil (pennzoil SAE 30 or equivalent)
reference standard at 200 ug/mL. The preparation of reference standards for other types of petroleum products is recommended. The use of these reference standards is to insure the accurate
identification of petroleum product contamination by chromatographic pattern matching ("fingerprinting") and establish retention time windows for those petroleum products not
determined with the individual compound retention time standard.
Gasoline Stock Standard. A stock standard is prepared by placing approximately 9 mL of methylene chloride in a 10 mL volumetric flask. Tare the flask/methylene chloride and add about five drops of non-oxygenated regular unleaded gasoline, assuring that the liquid falls directly into the methylene chloride without contacting the neck of the flask. Reweigh the flask and dilute to
volume with methylene chloride, stopper and mix by inverting the flask several times. It is important that the analyst minimize the amount of time that the flask is left unstoppered, to reduce
Analytical Methods for Petroleum Hydrocarbons 2
the loss of gasoline through volatilization. The use of a commercially prepared gasoline standards is acceptable if it is certified as non-oxygenated gasoline or if the gasoline concentration has been
adjusted to reflect the contribution of the oxygenate. Calculate the gasoline concentration as follows:
Stock, ug / mL = (final wt, mg) - (tare wt, mg) x 1000 ugmg10 mL
Note: The use of oxygenated regular unleaded gasoline for the gasoline stock standard is allowed
if the weight (mass) of the gasoline used is adjusted for the weight (mass) contribution of the oxygenate to the gasoline. This will necessitate the analysis of the gasoline for the specific
oxygenate(s) present to determine the concentration. The analysis for the oxygenates will be conducted by either of the methods published in the Federal Register - Appendix B and C - Testing
Procedures - Vol. 57, No. 24, Wednesday, February 5, 1992, Notices.Alternate methods for the analysis of gasoline oxygenates must be approved by the Oregon’s Department of Environmental
Quality and/or Washington’s Department of Ecology prior to use.
Diesel Stock Standard. A stock standard is prepared by adding about five drops of #2 diesel oil stock to tared 10 mL volumetric flask. Reweigh the flask and bring it to volume with methylene chloride, stopper and mix by inverting the flask several times. Calculate the concentration of this
standard in the same manner as the gasoline stock standard. The use of a commercially prepared #2 diesel standard is an acceptable alternative to the above procedure.
Motor Oil Stock Standard. A stock standard is prepared by adding about ten drops of a non-synthetic SAE 30 weight motor oil (Pennzoil or equivalent) to a tared 10 mL volumetric flask.
Reweigh the flask, bring it to volume with methylene chloride, stopper and mix by inverting the flask several times. Calculate the concentration of this standard in the same manner as the gasoline stock standard. The use of commercially prepared motor oil standards is an acceptable alternative
to the above procedure.
Note: The Diesel and Motor Oil Stock Standards required in this method are identical to those required for NWTPH-Dx (extended diesel method including all semi-volatile petroleum products eluting after gasoline, e.g. kerosene, diesels, mineral oils, lubricating oils, heavy fuel oils, etc.).
Surrogate Stock Standard. Suggested surrogates for use in this method are bromofluorobenzene and pentacosane. The use of different or additional surrogates is optional. Prepare the surrogate
stock standard by weighing 50 mg of each surrogate compound into a 10 mL volumetric flask, then bring to volume with methylene chloride for a final concentration of 5000 ug/mL for each surrogate compound. The use of a commercially prepared surrogate solution(s) is an acceptable alternative to
the above procedure.
Composite Calibration Working Standard. Using serial dilutions of the stock standards, prepare a mixture for water analyses that contains 10 ug/mL of gasoline, 25 ug/mL of #2 diesel oil and the
Analytical Methods for Petroleum Hydrocarbons 3

surrogate standard. For soil/sediment analyses this standard should be prepared to contain 20 ug/mL of gasoline, 50 ug/mL of #2 diesel and the surrogate standard. Add the appropriate volumes,
using the equations listed below, and adjusting for the concentration change created by any serial dilutions, of gasoline stock standard, #2 diesel stock standard and the surrogate stock standard to a
10 mL volumetric flask, then dilute to volume with methylene chloride. Stopper and mix by inverting the flask several times. The surrogate standard should be added to a level sufficient to
produce a surrogate concentration of between 5 and 50 ug/mL.
Volume Gasoline Stock, uL = 20 (soil) / 10 (water) ug / mL x 10 mLGasoline Stock Conc, ug / mL
x 1000 uLmL
Volume Diesel Stock, uL = 50 (soil) / 25 (water) ug / mL x 10 mLDies Conc, ug / mL
x 1000 uLmLel Stock
This mixture corresponds to 0.25 mg/L gasoline and 0.63 mg/L #2 diesel oil for water and 20 mg/Kg gasoline and 50 mg/Kg diesel in soil following the extraction and analytical procedures of
this method.
The motor oil calibration working standard should be made at a concentration of 250 ug/mL for water and 100 ug/mL for soil following the procedure outlined above. This will correspond to a
reporting value of 0.63 mg/L for water and 100 mg/kg for soil. If, in the opinion of the analyst, the GC sensitivity to 100 ug/mL of motor oil is insufficient, the analyst is allowed to increase the
concentration of this standard and to concentrate a portion of the extract to achieve the reporting limit for soil.
Surrogate Working Standard. Prepare a surrogate working (spiking) standard, using the procedure outlined above, that will yield between 5 ug and 50 ug/mL of the surrogate compounds in the 10
mL sample extract produced in this method.
Note: All samples must be collected in glass jars with Teflon lined lids (Eagle Picher or equivalent) and held at 4 degrees C until extracted. A volume of 400 mL is the minimum sample size to achieve the reporting limits as stated, however, larger volumes are allowed as long as the
solvent/sample ratio is maintained. Samples must be extracted within 7 days (for water) or 14 days (for soil/sediment) of the date of collection. The preservation of water samples in the field, to a pH
of less than 2 with 1+1 HCL, is recommended.
Extraction Procedures
Water Samples
Mark the water meniscus on the sample jar for later volume determination. Pour the sample into a 500 mL separatory funnel, add the surrogate solution (to achieve the desired concentration in a 10 mL extract). Add 30 mL of methylene chloride to the sample jar, cap and shake the jar vigorously
Analytical Methods for Petroleum Hydrocarbons 4
for a few seconds to wash off any hydrocarbons adhering to the side of the jar. Add this solvent to the separatory funnel, stopper and shake vigorously, venting frequently, for one minute. Allow the
two phases to separate, then drain the solvent into a 250 mL K-D flask fitted with a 10 mL concentrator tube. Repeat the extraction twice more using 30 mL of methylene chloride, each time,
adding the solvent to the K-D.
Attach a 3-ball Snyder column to the K-D and concentrate the sample extract to 5 - 10 mL on a stream bath. Remove the K-D apparatus and allow it to cool prior to disassembly. During
disassembly, rinse the Snyder/K-D joint and K-D/concentrator joint with approximately 1 mL of methylene chloride and add these rinsings to the extract. Adjust the volume of the extract to 10 mL. For those samples which exceed 10 mL, place the concentrator tube into an N-Evap and,
under a gentle stream of nitrogen, reduce the volume to 10 mL. Transfer 1 mL of the extract (to be used for the gasoline or gasoline/diesel determination) to an autosampler vial fitted with a screw top
and a Teflon coated septum. Concentrate the remainder of the extract (to be used for heavy oils determination) to 0.9 mL, transfer it to an 2 mL autosampler vial equipped with a screw top and a
Teflon coated septum. Store both vials in a refrigerator until analysis.
Each extraction set must include one method blank (organic-free water of similar volume to the samples) per 20 samples. The method blank is to receive the surrogate solution and to be extracted
and analyzed in the same manner as the samples.
EPA method 3520, Continuous Liquid-Liquid Extraction, may be substituted as an alternate extraction procedure to that outlined above.
Soil Samples
Weigh approximately 10 grams of soil into a 40 mL VOA vial and record the weight to the nearest 0.001 grams. Add 5 grams of anhydrous sodium sulfate, surrogate working solution and 10 mL of methylene chloride to the VOA vial. Cap the vial and place it (no more than 5 at a time) in a sonic bath for 5 minutes. Shake the vials well and return them to the sonic bath for 5 more minutes. A minimum of one method blank per extraction set or 20 samples, whichever is more frequent, must be prepared along with the samples. One sample duplicate must also be extracted for samples set
from one to ten samples and two duplicates for sets from eleven to twenty samples.
Determine the moisture content of the samples, for use in the final calculations, by the following procedure. Immediately after weighing the sample for extraction, weigh 5-10 grams of the sample
into a tared crucible. Dry the sample/crucible overnight at 105 degrees C. Reweigh the sample/crucible after allowing it to cool to room temperature. Calculate the % solids as follows:
[(grams of dry sample/grams of wet sample) x 100].
If the extract contains significant moisture, elute the solvent phase through an anhydrous sodium sulfate micro-column. Place a portion of the extract in a 2 mL autosampler vial (screw cap, Teflon coated septum), taking care to minimize the volume of headspace, and store the vial in a refrigerator
until analyzed. Concentration of the extract, when necessary, will be conducted using an N-Evap
Analytical Methods for Petroleum Hydrocarbons 5
with a gentle stream of nitrogen. This concentrate should be stored in the same manner as noted above.
Note: Anhydrous sodium sulfate micro-columns are prepared by plugging a 5 3/4" length
disposable Pasteur pipette (pre-rinsed with methylene chloride) with glass wool (precleaned with methylene chloride) and adding approximately 3 cm of anhydrous sodium sulfate (previously muffled at 430 degrees C overnight in a shallow pan and stored in a glass jar with a Teflon lid
liner).
For samples containing petroleum products other than gasoline, diesel, or motor oil, the analyst must either prepare calibration standards of them by the methods listed above or analyze the sample by the fully quantitative method, e.g. NWTPH-Gx. Other calibration standards produced for use in
this method must be at an equivalent concentration to the previously established standards, e.g. mineral spirits at the gasoline concentration, kerosene at the diesel concentration.
As more information becomes available on new extraction techniques, the Washington State Dept.
of Ecology's Manchester Laboratory and Oregon’s Department of Environmental Quality will publish descriptions of acceptable alternate extraction methods.
Suggested GC Parameters
Sample injection Volume = 2 uL
Injector Temperature = 290�C Detector Temperature = 300�C
Hydrogen Flow = 25-35 mL/min Air Flow = 300-400 mL/min
Make-up Gas Flow = 30 mL/min GC Temperature Program = Initial temperature of 50�C and hold for 2 minutes; ramp the
temperature 10�C/min to 320�C and hold for 5 minutes.
Product Identification
Petroleum products are to be identified by pattern matching with reference product chromatograms generated the same day as the sample analysis. The term "gasoline range" or "diesel range"
hydrocarbons, or derivations of them, should only be used when the analyst is unable to identify the petroleum product present. When these terms are used, it is to indicate the presence of compounds eluting from toluene to dodecane, for the former term, and from dodecane through tetracosane, for
the latter term. Motor oils, hydraulic fluids and similar petroleum products which present an unresolved chromatographic envelope of compounds, originating or extending beyond tetracosane, may be reported using the collective term, lube oil, unless specific identification is possible. Heavy fuel oils, e.g. fuel oil #6 or Bunker C, which contain a diesel range component as well as a lube oil
(and higher) range may be reported using the collective term, heavy fuel oil, unless specific identification is possible. These products should not, however, be confused with mixtures of #2
diesel and motor oils.
Analytical Methods for Petroleum Hydrocarbons 6

Note: The actual identification of the grade or type of lube oil and heavy fuel oil may require equipment and techniques beyond the scope of this method.
Analysis Procedure
The analysis is accomplished by injecting 2 uL of the 10 mL extract, either manually or by
autosampler, into the GC using the splitless injection mode. The results from this injection are, for quantitation purposes, compared directly against the single point calibration standard for the
product(s) identified. The injection of 2 uL of the concentrated extract (1 mL equivalent) is used primarily for heavy oil determination, because of the reduced sensitivity of the FID to late eluting
motor oil-like products. It may be used for the determination of #2 diesel oil and other diesel range petroleum products but it may not be used for the determination of gasoline or gasoline range
petroleum products because of the potential for loss of the more volatile components during the concentration step.
Calculations
Gasoline. The area of the components, toluene to dodecane of the calibration standard, is integrated to the baseline as a group. The samples and method blanks are integrated in the same manner and the group areas are compared. If the sample area exceeds the calibration standard area, proceed with method NWTPH-Gx for accurate quantitation using a fresh aliquot of the sample. If the
sample area does not exceed the calibration standard area, then report the gasoline concentration as less than 0.25 mg/L for water or 20 mg/kg for soil. This soil value for gasoline, and the subsequent
petroleum products, assumes 100% solids and will be higher depending on the actual moisture content.
Other volatile petroleum products, identified as being present (e.g. mineral spirits), must be compared to the appropriate standard produced at the same concentration as gasoline. The
requirement for further analyses is determined following the criteria for gasoline as noted above.
Note: For samples containing only #2 diesel oil, kerosene, etc., the portion of these products, that elute within the retention time range of gasoline, should not be identified and/or quantitated as
gasoline or gasoline range petroleum.
Diesel. The area of the components, dodecane through tetracosane of the calibration standard, is integrated to the baseline as a group. This integration must include the unresolved envelope of
compounds as well as the discrete component peaks. The sample is integrated in the same manner and the group areas are compared. If the sample area exceeds the calibration standard area, then
proceed to method NWTPH-Dx. If the sample does not exceed the calibration standards area, then report the #2 diesel concentration as less than 0.63 mg/L for water or 50 mg/Kg for soil.
Other semi-volatile petroleum products, identified as being present (e.g. kerosene), must be compared to the appropriate standard produced at the same concentration as #2 diesel. The
requirement for further analyses is determined following the criteria for #2 diesel as noted above.
Analytical Methods for Petroleum Hydrocarbons 7

Lube Oil. For those samples which consist primarily of only an unresolved chromatographic envelope of components eluting after tetracosane, compare their area to the area of the motor oil standard by integrating the unresolved envelope to baseline. If the sample exceeds the standard
area, then proceed to method NWTPH-Dx. If the sample area is less than the standard, then report the lube oil concentration as less than 0.63 mg/L for water or 100 mg/Kg for soil. Samples
identified as containing heavy fuel oil must be quantitated to the same value as lube oil by utilizing a heavy fuel oil standard and following the procedure outlined for lube oil.
Note: The analyst is expected to adjust the retention time windows used for quantitation of petroleum products, other than gasoline, #2 diesel, or motor oil/lube oils, to incorporate the majority of the chromatographable components associated with those identified products.
If, in the judgement of the analyst, the area of an identified petroleum product other than gasoline, diesel, and motor oil would exceed the reporting limit, the analyst is allowed to report a "greater than" value for that product without performing the quantitative analysis. The analyst must then
proceed to the appropriate fully quantitative analytical procedure, e.g. NWTPH-Dx, for the identified petroleum product.
Quality Assurance
The addition of an appropriate extraction surrogate to samples and method blank(s) is required. The
surrogate recovery for all samples and blanks should be between 50% and 150% and must be reported with the petroleum results unless the quantity of the petroleum product(s) preclude its
determination. The laboratory should analyze one sample from each site in duplicate for sample sets of 10 or less and two samples in duplicate for sets of 11 to 20 samples (i.e. 10% QA). If either
of the duplicate results are positive, the sample is to be considered positive. Since this method precludes the preparation of analytical duplicates, the laboratory should recommend that the project
manager collect and submit field duplicates for analysis. The laboratory must analyze method blanks prepared identically to the samples. Organic free water must be used in the preparation of
water method blank. No "sample" is necessary for use with soil/sediment method blanks.
Author - Bob Carrell, Manchester Environmental Laboratory, Dept. of Ecology, State of Washington. Reviewed and edited by Steve Robb, Toxics Cleanup Program, Department of
Ecology, State of Washington. This method is based on Oregon’s Department of Environmental Quality TPH methods and Washington’s Department of Ecology WTPH methods.
Analytical Methods for Petroleum Hydrocarbons 8

NWTPH-Gx Chromatograms
Gasoline Weathered Gasoline
Naptha Mineral Spirits #1 Mineral Spirits #2 Mineral Spirits #3
NWTPH-Dx Chromatograms
#2 Diesel #2 Diesel/Motor Oil
#2 Fuel Oil Kerosene (Deodorized)
Jet A Fuel Bunker C #1 Bunker C #2
Motor Oil 30 Wt. Mineral Oil (USP)
Hydraulic Fluid Transformer Oil
Gas Oil
See Appendix 6
Analytical Methods for Petroleum Hydrocarbons 9

(blank page)
Analytical Methods for Petroleum Hydrocarbons 10

NWTPH-Gx
Volatile Petroleum Products Method for Soil and Water
Summary
The NWTPH-Gx method is intended to replace the Oregon’s TPH-G and Washington’s WTPH-G methods and to present a more comprehensive approach to volatile petroleum product analyses.
NWTPH-Gx adapts Oregon’s TPH, Washington’s WTPH and EPA SW846 Methods 5030 and/or 8020 and covers the quantitative and qualitative analyses of volatile petroleum products, e.g.
gasolines, naphtha, mineral spirits, stoddard solvent, and other volatile petroleum products in soil and water. Soil samples are extracted with methanol and analyzed by gas chromatograph with a
flame ionization detector (GC/FID). The methanol extracts may be injected directly into the GC or they may be diluted with organic free reagent water and introduced by a purge/trap concentrator. Water samples are introduced directly to the purge/trap concentrator. This method specifies the criteria for the identification and quantitation of volatile petroleum products. When the type of petroleum product is unknown, regular unleaded gasoline will initially be used as the default
petroleum standard. The use of GC/PID, GC/MS or GC/AED (Atomic Emission Detector) for the analysis of gasoline may be substituted for GC/FID as long as all other method parameters are met.
The reporting limits for soil are 5 mg/kg by the purge/trap procedure and 20 mg/kg for direct
injection. All soil results are reported on a dry weight basis. Since this value assumes 100% solids, the analyst may wish to adjust the amount of soil extracted and/or purge a larger quantity of extract
to achieve the reporting limits. For water, the reporting limits are 0.25 mg/L.
The method is applicable for the identification, by pattern matching ("fingerprinting") and quantitation of volatile petroleum products, i.e. those petroleum products for which the majority of
the components elute within the gasoline range.
Note: Benzene, Toluene, Ethylbenzene and Xylenes (BTEX) may be determined simultaneously with gasoline if the requirements of EPA Method 8021 or EPA Method 8260 are met (i.e. the use of a PID (Photoionization Detector) for method 8020 or a MS (Mass Spectrometry) for method 8260
and the QA/QC associated with these methods).
This method must be performed by, or under the direct supervision of, analysts experienced in the use of GC and in the interpretation of gas chromatographs of both fresh and weathered volatile
petroleum products.
Analytical Methods for Petroleum Hydrocarbons 11

Equipment and Reagents
Gas Chromatograph Purge/Trap Liquid Concentrator - Tekmar or Equivalent - Autosampler (Optional) Flame Ionization (FID) or Photo Ionization/Flame Ionization Detectors (PID/FID)
Suggested Capillary Column: Restex RTX-502.2, 60M x 0.53 mm x 3.0 um film thickness or equivalent
Chromatography Data System Gas tight syringes, various volumes, Hamilton brand or equivalent
Volumetric flasks: 10 mL, ground glass joint with stopper Methanol: Burdick and Jackson Purge/Trap grade or equivalent
Petroleum Product Standards: Available from commercial sources Refer to methods 5030 and/or 8020 for the remaining equipment and reagent requirement
Sample Containers/Holding Times
All soil samples for NWTPH-Gx analyses must be collected in soil VOA bottles with Teflon coated septum lined tops. They should be filled to the top to minimize headspace above the soil and stored at 4 degrees C until analyzed. The maximum holding time (the time from the date of collection to
the date of analysis) for gasoline and any other volatile petroleum product is 14 days.
All water samples for NWTPH-Gx analyses must be collected in glass VOA vials with Teflon coated septum lined screw tops. They must be filled so that there is no air space (headspace) above
the water. Samples should be preserved with 1+1 HCl to a pH <2 and refrigerated at 4 degrees C until analyzed. The maximum holding time (the time from the date of collection to the date of
analysis) is 7 days for unpreserved samples and 14 days for preserved samples. The results of any samples which exceed these limits must be qualified as an estimated value.
Standards
Stock Standards. A stock standard is prepared by placing approximately 9 mL of methanol in a 10
mL volumetric flask. Allow the flask to stand, unstoppered, until the methanol wetted surfaces have dried (about ten minutes), then tare the methanol/flask. Add about 5 drops of the petroleum
product to the flask while assuring that the liquid falls directly into the methanol without contacting the neck of the flask. Weigh the flask again and dilute to volume with methanol, stopper and mix by inverting the flask several times. The use of commercially prepared standards is acceptable to
the above procedure. Commercially prepared gasoline standards must be certified as non-oxygenated gasoline or the gasoline concentration has been adjusted to reflect the contribution of
the oxygenate. Calculate the concentration as follows:
Gasoline Stock Standard, ug / mL = (final wt, mg) - (tare wt, mg)10 mL
x 1000 ugmg
Analytical Methods for Petroleum Hydrocarbons 12
The standard for gasoline will be regular unleaded gasoline and this standard is to be used as the default petroleum product for reporting purposes.
Note: The use of oxygenated regular unleaded gasoline for this standard is allowed if the weight
(mass) of the gasoline used is adjusted for the weight contribution of the oxygenate to the gasoline. This will necessitate the analysis of the gasoline for the specific oxygenate(s) present to determine
their concentration. This analysis must be conducted by either of the methods published in the Federal Register - Appendix B and C - Testing procedures - Vol. 57, No. 24, Wednesday, February 5, 1992, Notices. Alternate methods for the analysis of gasoline oxygenates must be approved by the Oregon’s Department of Environmental Quality and/or Washington’s Department of Ecology
prior to use.
Stock Surrogate Standard
Note: The suggested surrogates are 1,4-difluorobenzene and bromofluorobenzene. The use of additional surrogates is optional. Selected surrogate compounds should be non-polar, purgeable
from water and must not coelute with any significant component of gasoline.
Make up a stock standard by accurately weighing the surrogate compound(s) into a 10 mL volumetric flask. Utilize the same procedure as the stock gasoline standard preparation if neat material is used or by adding the appropriate volumes of dilute surrogate if solutions are used. Bring it to volume with methanol. The use of commercially prepared surrogate solutions is an
acceptable alternative to the above procedure.
Working Surrogate Spike. Add the appropriate volume of stock surrogate standard to methanol in a partially filled 10 mL volumetric flask and dilute to volume with methanol. The final concentration
of the working surrogate solution is left to the discretion of the analyst, however, this solution should produce between 5 ng and 50 ng of surrogate introduced to the GC.
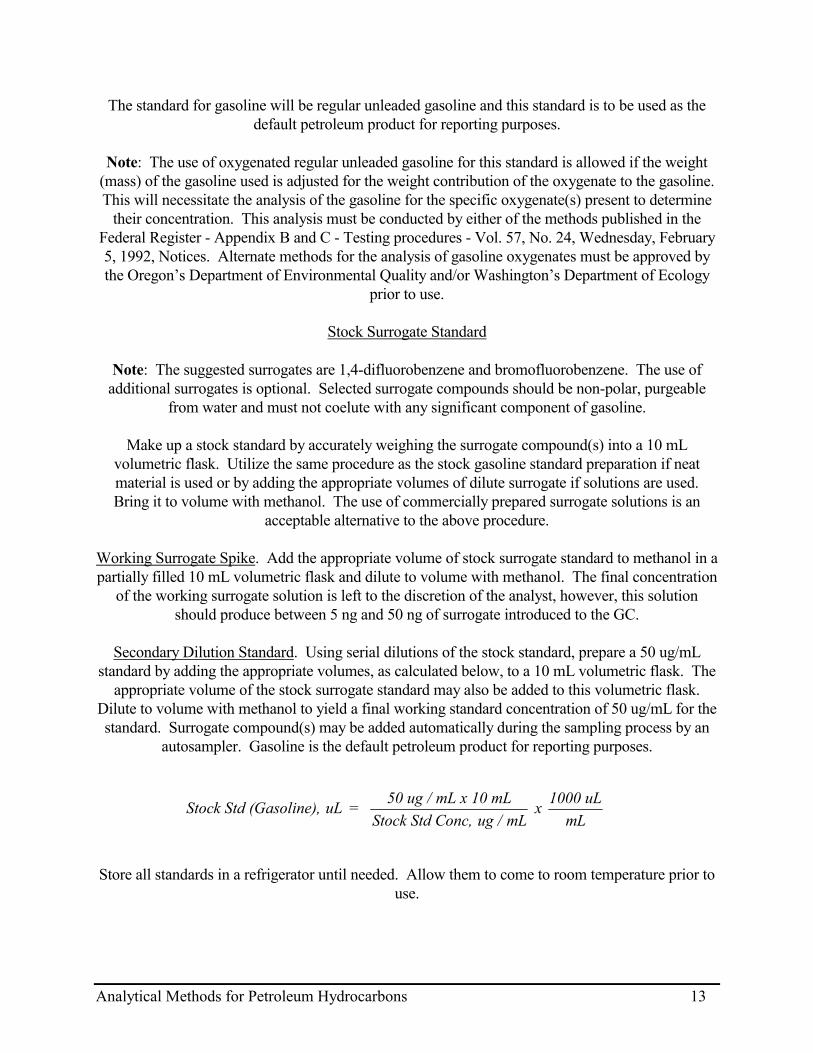
Secondary Dilution Standard. Using serial dilutions of the stock standard, prepare a 50 ug/mL
standard by adding the appropriate volumes, as calculated below, to a 10 mL volumetric flask. The appropriate volume of the stock surrogate standard may also be added to this volumetric flask.
Dilute to volume with methanol to yield a final working standard concentration of 50 ug/mL for the standard. Surrogate compound(s) may be added automatically during the sampling process by an
autosampler. Gasoline is the default petroleum product for reporting purposes.
Stock Std (Gasoline), uL = 50 ug / mL x 10 mLStock Std Conc, ug / mL
x 1000 uLmL
Store all standards in a refrigerator until needed. Allow them to come to room temperature prior to
use.
Analytical Methods for Petroleum Hydrocarbons 13

Calibration Standard
The aqueous purge standards are each prepared by adding 5 uL, 10 uL, 20 uL and 50 uL and 100 uL of the secondary dilution standard per 5 mL of organic free water. The five point calibration
standard quantities in the purged water are then 250 ng, 500 ng, 1000 ng, 2500 ng and 5000 ng for the volatile petroleum products. At the discretion of the analyst, the concentration of the surrogate
can increase with increasing standard concentration or remain at a fixed value for all calibration standards and samples. Extending the calibration range, either up or down, is allowed as long as
the standards remain within the linear range of the instrument and a minimum of a five point calibration is produced. In order to be acceptable, the calibration curve must have a linear
correlation coefficient of at least 0.990 and none of the standards may vary from their true (known) value by more than plus/minus 15%.
The use of an autosampler may be substituted for this manual method of standards and sample
introduction.
Direction Injection. Prepare calibration standards from the stock gasoline standard and surrogate standards at concentrations of 10 ug/mL, 25 ug/mL, 50 ug/mL, 100 ug/mL and 250 ug/mL for gasoline by adding the appropriate volumes to volumetric flasks and diluting to volume with
methanol. Increasing the calibration range with higher standards is acceptable as long as the linear range of the instrument is not exceeded.
Purge/Trap and GC Parameters
Follow the procedure outlined in Method 8021 for the set up of the purge and trap operating
parameters and for the GC. Adjust the hydrogen/air flow rates to optimize the FID sensitivity.
Soil Extraction Procedure
Weigh approximately 5 grams of soil into a 40 mL VOA vial and record the weight to 0.001 grams. Add 50 uL of the surrogate working standard and 10 mL of methanol. Quickly cap the vial and shake for 1 minute or use an ultrasonic bath for 2 minutes shaking well after 1 minute. Allow the soil methanol mixture to separate, centrifuging if necessary to clarify the methanol extract. For
storage, transfer a portion of the extract into a 2 mL glass autosampler vial, with a Teflon-lined cap, minimizing the headspace and store in a freezer for no longer than one week prior to analysis. Along with the samples, prepare at least one method blank and one sample duplicate per ten
samples.
Determine the moisture content of the sample, for use in the final calculations, by the following method. Immediately after weighing the sample for extraction, weigh 5-10 grams of the sample
into a tared crucible. Dry the sample/crucible overnight at 105 degrees C. Reweigh the sample/crucible after allowing it to cool to room temperature. Calculate the % solids as follows:
[(grams of dry sample/grams of wet sample) x 100].
Analytical Methods for Petroleum Hydrocarbons 14
Analysis Procedure
Prior to the analysis of any samples or method blanks, prepare and analyze a mid-range calibration check standard to insure that the instrument is functioning correctly and that the calibration is valid. This standard should be produced daily using the secondary gasoline standard. The value obtained for this analysis must not vary from the true (known) value by more than plus/minus 20%. If the
value falls outside this range then a second mid-range calibration standard should be produced and the analysis repeated. If the reanalysis of the fresh standard fails to meet the acceptance criteria,
then the instrument must be recalibrated prior to the analysis of any samples. Once the instrument is shown to be in calibration, the analyses of samples may proceed.
After the last sample has been analyzed, a mid-range calibration check sample must be run to demonstrate that the instrument is still operating within the required parameters. Should this
standard fail to meet those parameters, then all samples analyzed after the last successful calibration check must either be reanalyzed or the results obtained must be qualified as an estimated value. An
increase in the frequency of mid-range calibration check standard analyses beyond the minimum required is recommended.
Significant interferences may be encountered due to the presence of other petroleum products (or non-petroleum products) eluting within the retention time range of the volatile petroleum product being analyzed. If this occurs, the analyst is allowed to adjust the retention time range used for
quantitation to exclude the interferences or to subtract the area of the interfering components from the total area prior to the quantity determination. With the former method, the calibration curve must be adjusted in the same manner to reflect the change in retention time range and integration
area.
For volatile petroleum products other than gasoline that have a more narrow boiling point range, e.g. mineral spirits, the retention time range used for quantitation should be adjusted to encompass
the expected range of the product. Petroleum products which cannot be identified should be quantitated with the gasoline calibration curve. The term "gasoline range" hydrocarbons, or
derivations of it, should not be used when reporting the petroleum values unless the analyst is unable to identify the petroleum product present.
Purge/Trap - Soil. A 100 uL aliquot of the methanol extract is transferred via a 100 uL gas tight
syringe to 5 mL of organic free water in a 5 mL gas tight syringe and immediately injected into the purging vessel of the purge and trap device. For samples expected to contain concentrations of gasoline range volatiles outside the calibration linear range, or if dilution is required, a smaller aliquot of the methanol extract, or sample, should be used. The analysis then proceeds as in
Method 8020. Autosampler techniques may be substituted for this manual method of sample introduction.
Purge/Trap - Water. Sample water (5 mL) is transferred to a 10 mL gas tight syringe and the
working surrogate standard spike is added, via a gas tight syringe, into the 5 mL water sample. Immediately inject this water into the purge vessel of the purge/trap device. If necessary, a smaller sample aliquot may be used in order to remain within the linear calibration range of the instrument.
Analytical Methods for Petroleum Hydrocarbons 15

Larger sample volumes may be analyzed, at the discretion of the analyst, if lower quantitation limits are required. Autosampler techniques may be substituted for this manual method of sample
introduction.
Direct Injection - For Soil. Allow the extract to come to room temperature, then inject, either manually or by autosampler, 2 uL of the extract into the GC using the splitless injection mode.
Quantitation
The retention time range (window) for gasoline integration must, at a minimum, include toluene
through naphthalene. For other volatile petroleum products, the retention time range for integration must be adjusted to incorporate the majority of the components of the petroleum product(s)
identified as present in the samples. If specific product identification can not be made, the analyst must quantitate the samples with the calibration curve of the petroleum product that most closely
resembles that of the sample.
For those surrogates which elute within the retention time range used for integration, the analyst must subtract the area of the surrogate(s) from the total area to yield the appropriate area of the
petroleum product.
The analyst shall use regular unleaded gasoline as the default petroleum product for reporting purposes when no petroleum products were identified in any initial screening or when the type(s) of
petroleum products are unknown prior to analysis.
Sample chromatograms of various volatile petroleum products are included at the end of this method to assist the analyst in determining the appropriate integration ranges.
Result Calculation
The area of the components is integrated, as a group, to the baseline and compared to
concentrations of the standards which are integrated in the same manner.
For Soil
Soil Sample Conc, mg / kg = (A x R) x DE x W x S
where
A = group area of sample R = Response factor from std curve (ng injected/area count)
D = Extract Volume, mL W = Weight of sample, grams
E = Volume of extract purged or injected, uL S = Decimal percent solids of sample
Analytical Methods for Petroleum Hydrocarbons 16
For Water
Water Sample Conc, ug / L = (A x R)V
where
A = group area of sample R = Response factor from std curve (ng purged/area count)
V = Volume of sample purged, mL
The recovery of the surrogate should be between 50% and 150% and must be reported with the results. Report any surrogate recoveries that can not be calculated due to a high level of gasoline
contamination.
Author: Bob Carrell, Manchester Environmental Laboratory, Dept. of Ecology, State of Washington. Reviewed and edited by Steve Robb, Toxics Cleanup Program, Department of
Ecology, State of Washington. This method is based on Oregon’s Department of Environmental Quality TPH-G and Washington’s Department of Ecology WTPH-G methods.
Analytical Methods for Petroleum Hydrocarbons 17

(blank page)
Analytical Methods for Petroleum Hydrocarbons 18
NWTPH-Dx
Semi-Volatile Petroleum Products Method for Soil and Water
Summary
The NWTPH-Dx method is intended to replace the Oregon’s Department of Environmental Quality TPH-D and Washington’s Department of Ecology WTPH-D methods and to present a more comprehensive approach to semi-volatile petroleum product analyses. NWTPH-Dx adapts
Oregon’s TPH, Washington’s WTPH and EPA SW-846 Methods 3510, 3540/3550 and 8000 and covers the quantitative and qualitative analysis of semi-volatile petroleum products, i.e. jet fuels
through heavy fuel oils, in soil and water. The method involves extracting the samples with methylene chloride and injecting a portion of the extract into a gas chromatograph (GC) equipped
with a flame ionization detector (FID). This method specifies criteria for the identification and quantitation of semi-volatile petroleum products. A clean-up procedure, which may be used to aid in the removal of non-petroleum based organic interferences, i.e. biogenic interferences, has been included. When the type of petroleum product is unknown, #2 diesel will initially be used as the
default petroleum standard.
The reporting limits are 25 mg/kg (soil) and 0.25 mg/L (water) for the petroleum products in the elution range of jet fuels through #2 diesel. For petroleum products eluting after #2 diesel oil, e.g. motor oils, hydraulic fluids, and heavy fuel oils, the reporting limits are 100 mg/kg (soil) and 0.50 mg/L (water). All soil results are reported on a dry weight basis. Since this value assumes 100%
solids and therefore will be higher depending on the actual moisture content, the analyst is permitted to concentrate the extract to obtain these reporting limits. When doubt exists as to which
reporting limit is applicable for the petroleum product present, the analyst should use the lower value.
The method is applicable for the identification, by pattern matching ("fingerprinting"), and
quantitation of semi-volatile petroleum products. These include kerosenes, jet fuels, diesel oils, fuel oils, lubricating oils, hydraulic fluids, mineral oils and insulating oils, e.g. transformer oils. In
general, those petroleum products which do not contain a substantial volatile fraction, i.e. the majority of the components eluting outside of the gasoline range, should be analyzed by this
method.
Note: The use of GC/MS (Mass Spectrometry) or GC/AED (Atomic Emission Detector) may be substituted for GC/FID as long as all other method parameters are met.
This method is to be used by, or under the direct supervision of, analysts experienced in the use of
GC and in the interpretation of gas chromatograms of both fresh and weathered petroleum products.
Analytical Methods for Petroleum Hydrocarbons 19

Equipment and Reagents
Gas Chromatograph, w/wo Autosampler Flame Ionization Detector
Capillary Split/Splitless Injector Suggested Column:
J & W Scientific: DB-1 or DB-5, 30 M x 0.25 mm or 0.32 mm I.D. with 0.25 um film thickness capillary column or equivalent
Chromatographic Data System: Capable of group integrations Analytical Balance, accurate to a least 0.0001 grams Volumetric Flasks, 10 mL, ground glass stoppered
N-Evap Concentrator or equivalent Centrifuge tubes, 10 or 15 mL, glass, calibrated in 0.1 mL increments
Centrifuge tubes, 10 or 15 mL, glass, disposable Kaderna-Danish (K-D) Flasks, 250 mL
Concentrator Tubes, 10 mL Snyder Columns, 3-ball, 300 mm length
Sodium Sulfate, anhydrous Methylene Chloride, Burdick and Jackson brand, gas chromatography/pesticide residue grade or
equivalent Sulfuric acid, concentrated
Silica gel, 100/200 mesh, Baker Analyzed Reagent grade or equivalent - Before use, activate for at least 16 hours at 130 degrees C in a shallow tray
Petroleum Product Standards: Available from commercial sources
Note: All samples shall be collected in Eagle Picher, or equivalent, glass jars and held at 4 degrees C until extracted. The holding time, from the date of collection to extraction, is 14 days for soil and
preserved water. For unpreserved water, the holding the holding time is 7 days. Preservation is accomplished by adjusting the pH of the water sample to approximately 2 with the addition of 1+1
HCl.
Suggested GC Parameters
Sample Extract Injection Volume = 2 uL Injector Temperature = 290 degrees C Detector Temperature = 300 degrees C
Hydrogen Flow = 25-35 cc/min Air Flow = 300-400 cc/min
Helium Make-up Gas Flow = 30 cc/min Helium Carrier Gas Head Pressure = 15 psi
GC Temperature Program: Initial temperature = 50 degrees C, hold 2 minutes
Temperature Ramp Rate = 20 degrees C per minute Final Temperature = 320 degrees C, hold for 10 minutes
Analytical Methods for Petroleum Hydrocarbons 20
Standards
Reference/Stock Standards. Prepare individual petroleum product reference/stock standards, e.g. kerosene, #2 diesel oil, transformer oil (mineral oil based) and Bunker-C fuel oil.
Add 5 to 10 drops of the pure petroleum product to a zero tared 10 mL flask. Record the weight
and bring the flask to volume with methylene chloride, stopper and mix by inverting the flask several times. Calculate the concentration of these standards using the equation shown below. The
use of commercially prepared standards is an acceptable alternative to the above procedure. Analysts may not use artificial standards, e.g. diesel range organics mixtures, etc., for quantitation
purposes in place of authentic petroleum products.
These standards are to be used to produce calibration working standards which should be used to insure the proper identification of petroleum products by chromatographic pattern matching
("fingerprinting") as well as accurate quantitation.
Stock Conc, ug / mL = (final wt, mg) - (tare wt, mg)10 mL
x 1000 ugmg
Calibration Working Standards. Using the stock standards, prepare calibration working standards for the identified petroleum product(s) to be quantitated. Add the appropriate volume(s), using the equation shown below and adjusting for the concentration change created by any serial dilutions, to
a 10 mL volumetric flask(s). Dilute to volume with methylene chloride. Calibration standards must, at a minimum, (1) provide a five point calibration curve, (2) include a sufficiently low
standard to provide the necessary reporting limits, and (3) define the linear working range of the instrument.
In order to be acceptable, the calibration curve must have a linear correlation coefficient of at least 0.990 and none of the standards may vary from their true (known) value by more than plus/minus
15%. #2 diesel oil is the default petroleum product for reporting purposes.
Stock Surrogate Standard. Prepare the stock surrogate standard by weighing 50 mg of the surrogate compound(s) into a 10 mL volumetric flask. Bring the flask to volume with methylene chloride for
a final concentration of 5000 ug/mL for the surrogate compound. The use of commercially prepared surrogate solutions is an acceptable alternative to the above procedure.
Note: The suggested surrogates are 2-fluorobiphenyl, o, or p-terphenyl or pentacosane. The use of other surrogates is optional. Selected surrogate compounds must be non-polar, unaffected by the
cleanup procedure, i.e. the concentrated sulfuric acid/silica gel treatment, and lacking in significant interferences in most standard petroleum products.
Working Surrogate Spike. Using serial dilutions of the stock standard, prepare a surrogate working
standard. Add the appropriate volume of the stock surrogate standard, using the equation listed
Analytical Methods for Petroleum Hydrocarbons 21
below, and adjusting for any serial dilutions, to a 10 mL volumetric flask and dilute to volume with methylene chloride. Stopper and mix by inverting the flask several times. The surrogate working standard should be added to a level sufficient to produce a surrogate concentration between 5 and
50 ug/mL.
Volume Stock, uL = (Cal Std Conc, ug / mL) x 10 mLStock Conc, ug / mL
x 1000 uLmL
Store all standards in a refrigerator until needed. Allow them to come to room temperature prior to
use.
Sample Extraction
Soil Matrix
Weigh approximately 20 grams of soil, recording the weight to the nearest 0.01 grams, and approximately 20 grams of anhydrous sodium sulfate into a 150 mL beaker. Mix completely with a spatula. The mixture should have a grainy texture. If it forms a large clump, add more anhydrous
sodium sulfate and grind to grainy texture. Add the appropriate volume of working surrogate standard, 50 mL of methylene chloride and sonicate for 3 minutes utilizing the horn sonicator and power settings in SW-846 Method 3550. Allow the mixture to settle then collect the extract in a
250 mL Kuderna-Danish (KD) flask to which is connected a 10 mL concentrator tube.
Repeat the extraction twice more and add these extracts to the KD. Attach a 3 ball Snyder column and concentrate the extract on a steam bath to a volume of 5-10 mL. Allow the K-D to cool to
room temperature. Disassemble the K-D, rinsing the Snyder/K-D and K-D/concentrator tube joints with 1-2 mL of methylene chloride. Add these rinsings to the extract. If necessary, place the
concentrator tube in an N-Evap and reduce the volume to 10 mL under a gentle stream of nitrogen. At this point, proceed to the sample cleanup procedure if applicable or transfer a portion of the extract to a 2 mL autosampler vial fitted with a screw top and a Teflon lined septum. Store the extract in a refrigerator until analyzed. If the extract is highly colored or forms a precipitate, a
dilution may be necessary to stay within the calibration range. The use of the EPA method 3540 (soxhlet) in place of Method 3550 is optional.
Determine the moisture content of the samples by the following method. Immediately after
weighing the sample for extraction, weigh approximately 10 grams of the sample into a tared crucible and record the weight. Dry the sample/crucible overnight at 105 degrees C. Reweigh the sample/crucible after allowing it to cool to room temperature and record the weight. Calculate the
% solids as follows: [(grams of dry sample/grams of wet sample) x 100].
Along with each sample set, run at least one duplicate sample per set of 10 or fewer samples (10%) and, for each extraction day, at least one method blank (5%). Spiking of surrogates, extraction and
Analytical Methods for Petroleum Hydrocarbons 22

analyses of the QC samples will be conducted identically to the regular samples with the exception that no soil is added to the method blank.
Water Matrix
Allow the sample to come to room temperature and mark the meniscus for later use in volume
determination. Pour the sample into a separartory funnel and adjust the pH to approximately 2 with 1+1 HCl and add the appropriate volume of surrogate working solution. Add 30 mL of methylene chloride to the sample jar and rotate the jar at a sufficient angle to wash the walls. Pour the solvent
into the separatory funnel, stopper, and shake it vigorously for one minute, venting frequently. After the two phases have separated, drain the solvent into a 250 mL K-D flask to which is attached
a 10 mL concentrator tube.
Note: Due to possible loss of analytes from the water to the sample jar walls, the entire sample must be consumed in the extraction and no aliquots may be used. Since the reporting limits are
calculated on a 400 mL sample volume, sample jar size should be appropriate for this volume. For larger sample volume extractions, the analyst must increase the quantity of solvent used to maintain
the original solvent/sample ratio.
Repeat the extraction twice more and add these extracts to the K-D. Attach a 3-ball Snyder column to the K-D and concentrate the extract on a steam bath to 5-10 mL. Allow the K-D to cool to room temperature and disassemble it, rinsing the Snyder/K-D and K-D/ concentrator joints with 1-2 mL of methylene chloride. Add these rinsings to the extract. Place the concentrator tube into an N-
Evap and reduce the volume to 2 mL under a gentle stream of nitrogen. Transfer the extract to a 2 mL autosampler vial fitted with a screw top and a Teflon lined septum. Store the extract in a
refrigerator until analyzed.
Along with each sample set, run at least one duplicate sample per set of 10 or fewer samples (10%) and, for each extraction day, at least one method blank (5%). Spiking of surrogates, extraction and analyses of the QC samples will be conducted identically to the regular samples with the exception
that organic free water will be used for the method blank.
As more information becomes available on new extraction techniques, Washington State Dept. of Ecology's Manchester Laboratory and/or Oregon’s Department of Environmental Quality will
publish descriptions of acceptable alternative extraction methods.
Sample Cleanup. In those cases where samples contain a significant amount of naturally occurring non-petroleum organics, e.g. leaf litter, bark, etc., which may contribute biogenic interferences, the
following cleanup technique may be employed to assist in their reduction or elimination.
Transfer the 10 mL sample extract to a 10 to 15 mL centrifuge tube, add 1 mL of concentrated sulfuric acid to the extract and stopper the tube. Mix thoroughly for 1 minute by either shaking the
tube or with the use of a vortex-genie adjusted to the highest setting.
Analytical Methods for Petroleum Hydrocarbons 23

Caution: Since sulfuric acid produces a highly exothermic reaction with water and other polar materials, extreme care should be exercised with its use.
Allow the two phases to separate. Centrifugation can be used to facilitate this process. Using a disposable glass pipet, transfer the methylene chloride (top) phase to another centrifuge tube and
add approximately 0.4 grams (roughly equivalent to 1 mL of volume) of silica gel to the tube, stopper and mix as before. Allow the silica gel to settle or centrifuge. Repeat the sulfuric
acid/silica gel treatment once more. Transfer a portion of the extract to a 2 mL autosampler vial equipped with a Teflon-lined cap and store the extract in a refrigerator until analyzed. A smaller
aliquot of the extract may be used for this cleanup procedure as long as the ratio of extract to acid/silica gel is maintained.
It has been noted that some petroleum products, i.e. heavy fuel oils such as #6 fuel oil or Bunker-C, may experience a concentration loss of between 10 and 20 percent when subjected to this cleanup technique. This loss appears to be primarily associated with the removal of petroleum compounds which contain sulfur. To account for this loss when analyzing samples that have been subjected to the cleanup procedure in preparation for heavy fuel oil determination, the analyst must use utilize
standards which have undergone the cleanup technique to calibrate the GC.
Note: The use of EPA method 3611 (Alumina column cleanup) may be substituted for the above cleanup technique if it is demonstrated to provide equivalent results.
Analysis Procedure. Prior to the analysis of any samples or method blanks, the analyst must prepare and analyze a mid-range calibration check standard to insure that the instrument is
functioning correctly and that the calibration is still valid. The value obtained for this analysis must not vary from the true (known) value by more than plus/minus 15%. If the value falls outside this
range then a second mid-range calibration check standard should be analyzed. If the analysis of the second check standard fails to meet the acceptance criteria, then the instrument must be recalibrated prior to the analysis of any samples. Once the instrument has been shown to be in calibration, the
analyses of samples may proceed.
The analyst shall use #2 diesel as the default petroleum product for reporting purposes when no petroleum products were identified in any initial screening or when the type(s) of petroleum
products are unknown prior to analysis.
After the last sample has been analyzed, a mid-range calibration check sample must be run to demonstrate that the instrument is still operating within the required parameters. Should this
standard fail to meet those parameters, then all samples analyzed after the last successful calibration check standard must be reanalyzed. An increase in the frequency of mid-range calibration check
standard analyses beyond the minimum required is recommended.
Qualitative Analysis - Identification
If NWTPH-HCID has not been previously performed on the samples and/or the type of petroleum present is unknown, the analyst should pre-screen the samples to determine the petroleum product.
Analytical Methods for Petroleum Hydrocarbons 24

The observed petroleum product shall be determined by pattern matching with the standard(s) analyzed the same day. Chromatograms used for this "fingerprinting" should be normalized to approximately 90% of full scale for the largest component of the particular petroleum product
observed.
When reporting the results, the terms such as "diesel range" or "motor oil range", or derivations of them, should only be used when the analyst is unable to identify the petroleum product(s) present.
Motor oils, hydraulic fluids and similar petroleum products which consist primarily of an unresolved chromatographic envelope of compounds originating at, or extending beyond
tetracosane, may be reported using the collective term "lube oil" unless specific identification is possible. Heavy fuel oils, e.g. #6 fuel oil or Bunker-C, which contain a diesel range component as well as a lube oil range, may be reported using the collective term "heavy fuel oil" unless specific identification is possible. Heavy fuel oils should not, however, be confused with mixtures of #2
diesel and lube oils.
Note: The actual identification of the grade or type of lube oil and/or heavy fuel oil may require equipment and techniques beyond the scope of this method.
Quantitative Analysis - Integration
The retention time range (window) for integration must be adjusted to incorporate the majority of the components of petroleum product(s) identified as present in the samples. If specific product identification can not be made, the analyst must quantitate the samples with the calibration curve for the petroleum product that most closely resembles that of the sample. In all cases, the selected retention time range (windows) used for quantitation must, at a minimum, include any unresolved envelope of compounds as well as all discrete component peaks with an area greater than or equal
to 10% of the largest peak. These components must be integrated to the baseline as a group.
For those surrogates which elute within the retention time range used for integration of a petroleum product, the analyst must subtract the area of the surrogate from the total area to yield the
appropriate area of the petroleum product. In this case, the analyst may wish to generate separate calibrations for the petroleum standards and the surrogate(s) to facilitate integration and
quantitation.
At the discretion of the analyst, the range of components included in the integration may be adjusted in order to minimize the potential contribution of any co-eluting fractions arising from the presence of multiple petroleum products. Any change in the integration range must be reflected in a
concomitant change to the calibration standards integration.
Sample chromatograms of various petroleum products are included at the end of this method to assist the analyst in determining the appropriate integration ranges.
Analytical Methods for Petroleum Hydrocarbons 25

Result Calculation
For Soil
Soil Sample Conc, mg / kg = (A x R) x V x Dilution FactorE x W x S
where
A = Area Count from Sample R = Response Factor (ng injected/area count)
V = Extract Volume (mL) W = Weight of Sample (g) E = Volume injected, (uL)
S = Decimal percent solids of sample
For Water
Water Sample Conc, mg / L = (A x R) x VE x S
where
A = Area Count from Sample R = Response Factor (ng injected/area count)
V = Extract Volume (mL) S = Volume of Sample (mL)
E = Volume Injected (uL)
The recovery of the surrogate should be between 50% and 150% and must be reported with the results. If the recovery of the surrogate is not able to be obtained due to a high levels of petroleum
contamination, then this fact needs to be reported.
Author: Bob Carrell, Manchester Environmental Laboratory, Dept. of Ecology, State of Washington. Reviewed and edited by Steve Robb, Toxics Cleanup Program, Department of
Ecology, State of Washington. This method is based on Orgeon’s Department of Environmental Quality TPH-D and Washington’s Department of Ecology WTPH-D methods.
Analytical Methods for Petroleum Hydrocarbons 26

METHOD FOR THE DETERMINATION
OF
VOLATILE PETROLEUM HYDROCARBONS (VPH) FRACTIONS
Washington State Department of Ecology
June 1997
Analytical Methods for Petroleum Hydrocarbons 27

METHOD FOR THE DETERMINATION OF VOLATILE PETROLEUM HYDROCARBONS (VPH)
TABLE OF CONTENTS
Section Topic Page
1.0 Scope and Application 29
2.0 Summary of Method 30
3.0 Definitions 31
4.0 Interferences 34
5.0 Health and Safety Issues 35
6.0 Apparatus and Materials 35
7.0 Reagents and Standards 37
8.0 Sample Collection, Preservation, and Handling 40
9.0
Procedure 41
9.1 Sample Preparation and Purging 41
9.2 GC Conditions 45
9.3 Retention Time Windows 46
9.4 Calibration 47
9.5 GC Analysis 49
9.6 Calculations (external standard) 50
10.0 Quality Control 55
11.0 Data Production and Reporting 59
12.0 Method Performance 61
13.0 References 62
APPENDIX 1 - Single Laboratory Accuracy, Precision, and Method Detection Limits
APPENDIX 2 - Suggested VPH Data Reporting Format
Analytical Methods for Petroleum Hydrocarbons 28
DISCLAIMER Mention of trade names or commercial products does not constitute
endorsement by the Washington State Department of Ecology Equipment and materials cited in this method may be replaced by similar products, as long
as adequate data exists or has been produced documenting equivalent or superior performance.
METHOD FOR THE DETERMINATION OF
VOLATILE PETROLEUM HYDROCARBONS
1.0 SCOPE AND APPLICATION
1.1 This method is designed to measure the collective concentrations of volatile aliphatic and aromatic petroleum hydrocarbons in water and soil. The carbon ranges used
through out this document are given in equivalent carbon (EC) numbers which are related to the boiling point of a chemical normalized to the boiling point of
the n-alkanes, and its retention time in a boiling point gas chromatographic (GC) column. Volatile aliphatic hydrocarbons are collectively quantitated within four ranges: C5 through C6, >C6 through C8, >C8 through C10 and > C10 through
C12. Volatile aromatic hydrocarbons are collectively quantitated within the C8 through C10, >C10 through C12 and >C12 through C13 ranges. These aliphatic
and aromatic hydrocarbon ranges correspond to a boiling point range between approximately 36°C and 220°C.
1.2 This method is also designed to measure the individual concentrations of benzene, toluene,
ethylbenzene, xylenes, and methyl tert butylether (MTBE) in water and soil.
1.3 Petroleum products suitable for evaluation by this method include gasoline, mineral spirits, and certain petroleum naphthas. This method, in and of itself, is not suitable for the evaluation of samples contaminated with kerosene, jet fuel, heating oils, lubricating
oils, or other petroleum products which contain a significant percentage of hydrocarbons larger than C10. When samples are known or suspected to contain
petroleum products containing significant concentration of hydrocarbons >C10, the Extractable Petroleum Hydrocarbon (EPH) method should also be employed to fully
evaluate the hydrocarbons present.
1.4 For reporting purposes, the practical quantitation limits (PQL), given the sample volume purged, mass and/or methanol extract volume purged are: 50.0 ug/L for water and 5.0 mg/kg for soil/sediments for the aliphatic and aromatic carbon ranges and 5.0 ug/L and 0.5 mg/kg respectively for the individually targeted compounds. The
procedure for Method Detection Limits (MDL) determination in this method and the
Analytical Methods for Petroleum Hydrocarbons 29
Single Laboratory Precision, Accuracy and MDL data (generated by the State of Massachusetts) is added for informational purposes only.
1.5 This method is based on a purge-and-trap, gas chromatography (GC) procedure. This
method should be used by, or under the supervision of, analysts experienced in the use of purge-and-trap systems and gas chromatographs. The analysts should be skilled in the interpretation of gas chromatograms and their use as a quantitative
tool.
1.6 Like all GC procedures, this method is subject to a "false positive" bias in the reporting of targeted analytes, in that non-petroleum compounds eluting or co-eluting within a specified retention time window may be falsely identified and/or quantitated with the respective carbon ranges. Confirmatory analysis by a GC/MS, EPA Method 8260, or other suitable procedures are recommended in cases where significant concentrations of non-hydrocarbon compounds are known or suspected. If the
results of these analyses lead to identification and quantitation of non-petroleum compounds, the analyst may subtract those values from the affected carbon ranges as long as the identities and quantities of subtracted compounds are provided in the
analytical report.
2.0 SUMMARY OF METHOD
2.1 Samples are analyzed using purge-and-trap sample concentration. The gas chromatograph is temperature programmed to facilitate separation of organic compounds.
Detection is achieved by a photo-ionization detector (PID) and flame ionization detector (FID) in series. Quantitation is based on comparing the PID and FID
detector response of a sample to a standard comprised of aromatic and aliphatic hydrocarbons. The PID chromatogram is used to determine the individual
concentrations of targeted analytes (BTEX/MTBE) and collective concentration of aromatic hydrocarbons within the C8 through C10, C10 through C12 and C12
through C13 ranges. The FID chromatogram is used to determine the collective concentration of aliphatic hydrocarbons within the C5 through C6, C6 through C8,
C8 through C10 and C10 through C12 ranges. To avoid double counting of the aromatic contribution to the aliphatic ranges, the PID concentrations are subtracted
from the FID concentrations to yield the aliphatic ranges values.
2.2 This method is suitable for the analysis of waters, soils, and sediments. Water samples may be analyzed directly for volatile petroleum hydrocarbons by purge-and-trap concentration and gas chromatography. Soil samples are either dispersed in
methanol to dissolve the volatile organic constituents and a portion of the methanol is analyzed by purge-and-trap GC or combined with water for purging directly from
a soil purge vessel (EPA method 5035).
2.3 This method is based on, and constitutes a significant modification of, the “Method for the Determination of Volatile Petroleum Hydrocarbons (VPH)”, Public Comment Draft 1.0, developed by the Massachusetts Department of Environmental Protection and on EPA method 5035. They in turn based their method on (1) USEPA Methods
Analytical Methods for Petroleum Hydrocarbons 30

5030, 8000, 8020, and 8015, SW-846, "Test Methods for Evaluating Solid Wastes", 3rd Edition, 1986; (2) Draft "Method for Determination of Gasoline Range Organics", EPA UST Workgroup, November, 1990; and (3) "Method for
Determining Gasoline Range Organics", Wisconsin Department of Natural Resources, PUBL-SW-140, 1992.
3.0 DEFINITIONS
3.1 Volatile Petroleum Hydrocarbons (VPH) are defined as all hydrocarbon compounds eluting just prior to n-pentane through 1-methylnaphthalene. VPH is comprised of
C5 through C6, >C6 through C8, >C8 through C10 and >C10 through C12 Aliphatic Hydrocarbons, as well as >C8 through C10, >C10 through C12 and >C12
through C13 Aromatic Hydrocarbons as well as benzene and toluene. VPH concentration data are reported as the aggregate concentrations of the aliphatic and
aromatic hydrocarbon ranges and as selected targeted analytes.
3.2 Equivalent Total Petroleum Hydrocarbons (E-TPH) For samples contaminated ONLY with gasoline or other low molecular weight petroleum products, the E-TPH value is
equivalent to the VPH value. For samples contaminated with BOTH light and heavy molecular weight petroleum products (e.g., gasoline and diesel fuel), the E-
TPH value is a summation of the VPH value and the Extractable Petroleum Hydrocarbon (EPH) values. In order to avoid double counting of analytes due to the
overlap in the carbon ranges existing between the two methods, the analyst will report the highest of the two values determined for the overlapping ranges. In those cases where both the VPH and EPH methods are employed on samples, the analyst may select to quantitate the >C10 through C12 Aliphatic and the >C10 through C12
Aromatic Hydrocarbon ranges only using the EPH method.
3.3 C5 through C6 Aliphatic Hydrocarbons are defined as all aliphatic hydrocarbon compounds which elute on the FID chromatogram from (and including) n-pentane
through n-hexane.
3.4 C6 through C8 Aliphatic Hydrocarbons are defined as all aliphatic hydrocarbons which elute on the FID chromatogram after n-hexane through n-octane.
3.5 C8 through C10 Aliphatic Hydrocarbons are defined as all aliphatic hydrocarbon
compounds which elute on the FID chromatogram after n-octane through n-decane.
3.6 C10 through C12 Aliphatic Hydrocarbons are defined as all aliphatic hydrocarbons which elute on the FID chromatogram after n-decane through n-dodecane.
3.7 C8 through C10 Aromatic Hydrocarbons are defined as all hydrocarbon compounds
which elute on the PID chromatogram after toluene through 1,2,3-trimethylbenzene.
Analytical Methods for Petroleum Hydrocarbons 31
3.8 C10 through C12 Aromatic Hydrocarbons are defined as all hydrocarbons which elute on the PID chromatogram after 1,2,3- trimethylbenzene through naphthalene.

3.9 C12 through C13 Aromatic Hydrocarbons are defined as all hydrocarbons which elute
on the PID chromatogram after naphthalene through 1-methylnaphthalene. This is a hybrid range which is designed to acquire the methylnaphthalenes associated with
petroleum products like gasoline and is only used when VPH is run without an accompanying EPH method request.
3.10 Targeted VPH Analytes are defined as benzene, toluene, ethylbenzene, p,m,o-xylenes, and
MTBE.
3.11 Volatile Petroleum Hydrocarbon (VPH) Component Standard is defined as a 15 component mixture of the aliphatic and aromatic compounds, plus surrogate, listed in Table 1. The compounds comprising the VPH Component Standard are used to (a) define the individual retention times and chromatographic response factors for each of the Targeted VPH Analytes, (b) define and establish the windows for the
collective aliphatic and aromatic hydrocarbon ranges of interest, and (c) determine average chromatographic response factors that can in turn be used to calculate the
collective concentration of hydrocarbons within these ranges.
3.12 Analytical Batch is defined as a group of samples with similar matrices which are processed as a unit. For Quality Control purposes, if the number of samples in such
a group is greater than 20, then each group of 20 samples or less are defined as separate analytical batches.
3.13 Laboratory Duplicates are defined as split samples taken from the same sampling
container and analyzed separately with identical procedures. The analysis of laboratory duplicates give a measure of the precision associated with laboratory procedures, but not with sample collection, preservation, or storage procedures.
3.14 Field Duplicates are defined as two separate samples collected at the same time and place
under identical circumstances and managed the same throughout field and laboratory procedures. Analyses of field duplicates give a measure of the precision associated with sample collection, preservation, and storage, as well as laboratory
procedures.
3.15 E-TPH Duplicates are defined as two separate samples collected at the same time and location, for analysis by both EPH and VPH methods. E-TPH duplicates are taken at locations where significant concentrations of petroleum hydrocarbons lighter and heavier than C9 are likely to be present (e.g., locations contaminated by releases of
both gasoline and diesel fuel). The resultant EPH and VPH concentrations, adjusted to prevent double counting of overlapping hydrocarbon ranges between the
methods, are then summed to determine the Equivalent TPH (E-TPH) concentration.
Analytical Methods for Petroleum Hydrocarbons 32
3.16 Calibration Standards are defined as a series of standard solutions prepared from dilutions of a stock standard solution, containing known concentrations of each analyte and
surrogate compound of interest.
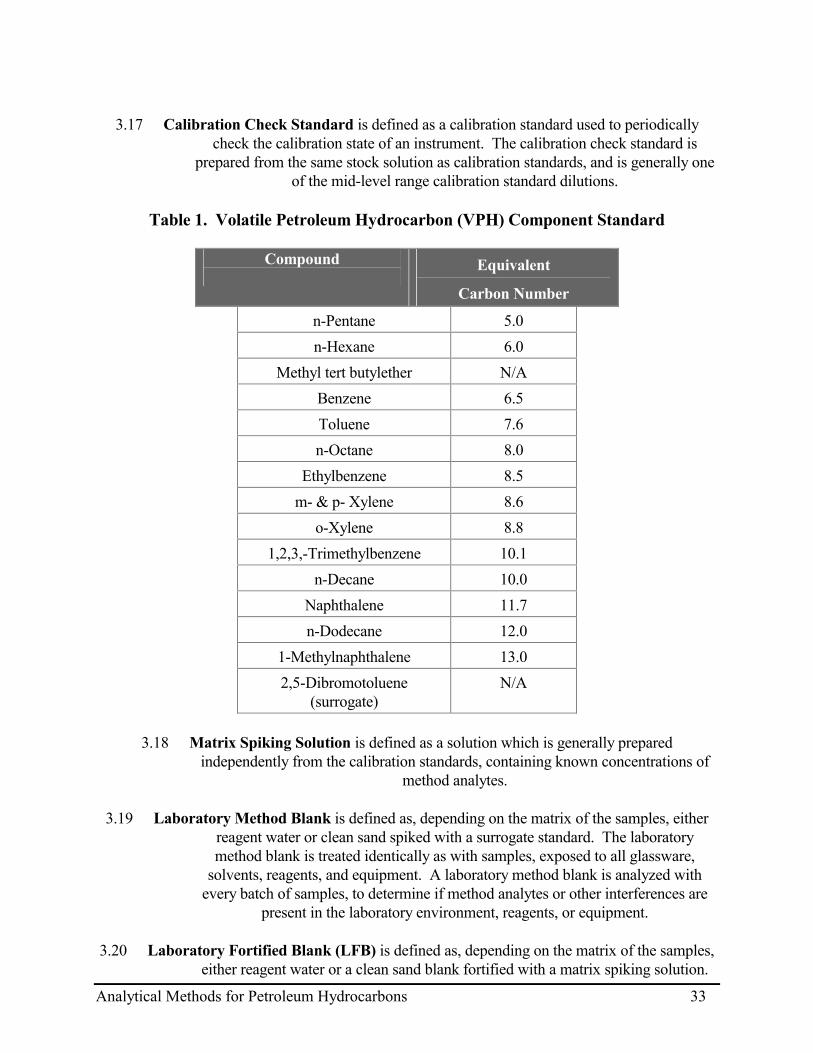
3.17 Calibration Check Standard is defined as a calibration standard used to periodically
check the calibration state of an instrument. The calibration check standard is prepared from the same stock solution as calibration standards, and is generally one
of the mid-level range calibration standard dilutions.
Table 1. Volatile Petroleum Hydrocarbon (VPH) Component Standard
Compound
Equivalent
Carbon Number
n-Pentane 5.0 n-Hexane 6.0
Methyl tert butylether N/A Benzene 6.5 Toluene 7.6 n-Octane 8.0
Ethylbenzene 8.5 m- & p- Xylene 8.6
o-Xylene 8.8 1,2,3,-Trimethylbenzene 10.1
n-Decane 10.0 Naphthalene 11.7 n-Dodecane 12.0
1-Methylnaphthalene 13.0 2,5-Dibromotoluene
(surrogate) N/A
3.18 Matrix Spiking Solution is defined as a solution which is generally prepared
independently from the calibration standards, containing known concentrations of method analytes.
3.19 Laboratory Method Blank is defined as, depending on the matrix of the samples, either reagent water or clean sand spiked with a surrogate standard. The laboratory method blank is treated identically as with samples, exposed to all glassware,
solvents, reagents, and equipment. A laboratory method blank is analyzed with every batch of samples, to determine if method analytes or other interferences are
present in the laboratory environment, reagents, or equipment.
3.20 Laboratory Fortified Blank (LFB) is defined as, depending on the matrix of the samples, either reagent water or a clean sand blank fortified with a matrix spiking solution.
Analytical Methods for Petroleum Hydrocarbons 33

The LFB is treated and analyzed identically as with samples and blanks, and its purpose is to determine whether the methodology is in control and whether the
laboratory is capable of making accurate and precise measurements at the required practical quantitation limits..
3.21 Laboratory Fortified Matrix (LFM) Sample is defined as an environmental sample
which has been spiked with a matrix spiking solution containing known concentrations of method analytes. The LFM sample is treated and analyzed exactly as a sample, and its purpose is to determine whether the sample matrix contributes bias to the analytical results. The background concentrations of the analytes in the sample matrix must be determined through the separate analyses of a laboratory or
field duplicate, and the measured values in the LFM sample corrected for background concentrations.
3.22 All other terms are as defined in SW-846, "Test Method for Evaluating Solid Waste",
USEPA, September, 1986, and as amended.
4.0 INTERFERENCES
4.1 Samples can become contaminated by diffusion of volatile organics through the sample container septum during shipment and storage. Trip blanks prepared from reagent water should be carried through sampling and subsequent storage and handling to
serve as a check on such contamination.
4.2 Contamination by carryover can occur whenever high-level and low-level samples are sequentially analyzed. To reduce carryover, the sample syringe and/or purging
device must be rinsed between samples with reagent water or solvent. The trap and other parts of the system are also subject to contamination, therefore, frequent bake-
out and purging of the entire system may be required. A screening step is recommended to protect analytical instrumentation. Whenever an unusually
concentrated sample is encountered, it must be followed by the analysis of a solvent blank to check for cross-contamination.
4.3 Certain organic compounds not associated with releases of petroleum products, including
chlorinated solvents, ketones, and ethers, will be quantitated as Volatile Petroleum Hydrocarbons. Some samples may require additional analytical procedures to be
employed , e.g. GC/MS, to document the presence and quantity of such compounds.
4.4 The response selectivity of a photo-ionization detector (PID) is used in this method to differentiate aromatic hydrocarbons from aliphatic hydrocarbons. All compounds
eluting on the PID chromatogram after toluene are identified by the method as aromatic hydrocarbons. This will lead to an overestimation of aromatic
hydrocarbons within samples, as certain aliphatic compounds will elicit a response on the PID, particularly unsaturated compounds such as alkenes. The significance
and implications of this overestimation will vary from sample to sample and, where less conservative data are desired, additional actions should be considered to
Analytical Methods for Petroleum Hydrocarbons 34

minimize the detection of non-aromatic compounds, such as the use of a lower energy PID lamp or GC/MS.
5.0 HEALTH AND SAFETY ISSUES
The toxicity and carcinogenicity of each reagent used in this method has not been precisely defined. However, each chemical compound should be treated as a potential health hazard. From
this viewpoint, exposure to these chemicals must be reduced to the lowest possible level by whatever means available. The laboratory is responsible for maintaining a current file of
OSHA regulations regarding the safe handling of the chemicals specified in this method. A reference file of material safety data sheets should also be made available to all personnel
involved in the chemical analysis.
6.0 APPARATUS AND MATERIALS
6.1 The following glassware is used in this method:
6.1.1 VOC Vials: Wide mouth 60-mL VOC vials or 40-mL VOC vials with teflon/ silicone septa for soils; 40-mL VOC vials with teflon/silicone septa for waters.
6.1.2 Volumetric flasks: 10-mL, 50-mL, 100-mL, and 1,000-mL with a ground-glass stopper.
6.1.3 Disposal pipets: Pasteur.
6.2 Analytical balance: An analytical balance capable of accurately weighing 0.0001 g must be
used for weighing standards. A top-loading balance capable of weighing to the nearest 0.1 g must be used for weighing soil samples.
6.3 Gas Chromatography
6.3.1 Gas Chromatograph: An analytical system complete with temperature programmable gas
chromatograph and purge-and-trap concentrator. The data station must be capable of storing and reintegrating chromatographic data and must be capable of determining peak areas using a forced baseline projection.
6.3.2 Columns
6.3.2.1 Recommended column: 105M x 0.53 mm I.D. Restek RTX 502.2, 3.0 micron film
thickness, or equivalent.
6.3.2.2 Other columns, such as a 60 M x 0.53 mm J&W DB-5, may be used. Capillary columns are required to achieve necessary resolution. The column must be capable of resolving typical gasoline components. It must also
resolve ethylbenzene from m/p-xylene. Some columns may require subambient cooling to achieve these criteria.
Analytical Methods for Petroleum Hydrocarbons 35

6.3.3 Detectors: The method utilizes a Photo-ionization Detector (PID) in series with a Flame
Ionization Detector (FID); the PID first in the series. The method is based upon the use of a 10.0 eV PID lamp, although lower energy lamps are permissible in order to minimize PID response to aliphatic compounds.
6.3.4 Purge-and-trap device: The purge-and-trap device consists of a sample purger, a trap, and a
desorber. Several complete devices are commercially available.
6.3.4.1 The purging chamber must be designed to accept 5 mL samples with a water column at least 3 cm deep. Purging devices larger than 5 mL have a reduced purging efficiency and should not be used. The gaseous headspace
between the water column and the top of the vessel should be at least 3 cm deep. The gaseous headspace between the water column and
the trap must have a total volume of less than 15 mL. The purge gas must pass through the water column as finely divided bubbles with a
diameter of less than 3 mm at the origin. Fritted glass or needle sparge cells may be used. If needle sparge cells are used, the purge
gas must be introduced no more than 5 mm from the base of the water column. Alternate sample purge devices may be used,
provided equivalent performance is demonstrated.
6.3.4.2 The trap should be at least 25 cm long and have an inside diameter of at least 0.105 inches. The trap should be packed with 400 mg of Carbopack B (Supelco
Cat. No. 209273). Alternative trap packing materials include: Tenax GC (or equivalent); 7.6 cm Carbopack B and 1.3 cm
Carbosieve S-III (Supelco Cat No. 2-0321); 7 cm Carbopack C and 1.2 cm Carbopack B (Supelco Cat No. 2-1064); or equal volumes of Tenax, silica gel, and charcoal as described in EPA SW-846 Method
5030. In general, Carbopack trap packing materials are recommended because they have less of a tendency to retain
methanol, which could interfere with the elution of pentane and quench the FID flame. The trap length and packing materials may be
varied as long as equivalent performance has been verified.
6.3.4.3 Prior to initial use, the Carbopack B trap should be conditioned overnight at 270°C by backflushing with an inert gas flow of at least 20 mL/min. Vent the trap effluent to a hood, not to the analytical column. Prior to daily
use, the trap should be conditioned for 10 min. at 260°C with backflushing. The trap may be vented to the analytical column
during daily conditioning, however, the column must be run through the temperature program prior to analysis of samples. Devices other than the traps recommended in Section 6.3.4.2 should be conditioned
and desorbed according to the manufacturer's guidelines.
6.3.4.4 The desorber should be capable of rapidly heating the trap to 240°C for desorption.
Analytical Methods for Petroleum Hydrocarbons 36
6.4 Ultrasonic bath.
6.5 Syringes: 5-mL Luerlock glass hypodermic and 5-mL gas-tight syringe with shutoff valve.
6.6 Syringe valve: Two-way, with luer ends.
6.7 Microsyringes: 1-µL, 5-µL, 10-µL, 25-µL, 100-µL, 250-µL, 500-µL, and 1,000-µL.
6.8 Spatula: Stainless steel.
7.0 REAGENTS AND STANDARDS
7.1 Reagents
7.1.1 Reagent Water: organic free water (ASTM Type I reagent grade water).
7.1.2 Solvent: methanol; purge and trap grade or equivalent. Store away from other solvents.
7.1.3 Ottawa and/or masonry sand: free of volatile petroleum hydrocarbons.
7.2 Stock Standard Solution
Prepare a stock standard solution in methanol at approximately 20 µg/µL, or purchase certified solutions. Preparation of stock standards and component standards should be done
using volumetric glassware.
7.2.1 The stock standard solution consists of the 15 VPH component standards listed in Table 1 and a surrogate standard. Prepare the stock standard solution by accurately
weighing approximately 0.2000 g of each standard component. Dissolve the component in methanol and dilute to volume in a 10-mL volumetric flask. At the discretion of the analyst, the surrogate standard may be made up as a
separate solution from the VPH standards.
7.2.1.1 Place about 8 mL of methanol in a 10-mL tared ground-glass stoppered volumetric flask. Allow the flask to stand, unstoppered, for about 10 min. or until all alcohol-wetted surfaces have dried. Weigh the flask to the nearest
0.1 mg.
7.2.1.2 Using a 500-µL syringe, immediately add 100 to 200 µL of each VPH Component Standard to the flask; then reweigh. The liquid must fall directly into the
alcohol without contacting the neck of the flask.
7.2.1.3 Dilute to volume, stopper, and then mix by inverting the flask three times. Calculate the concentration in micrograms per microliter (µg/µL) from the net gain in weight. When compound purity is assayed to be 98% or
greater, the weight may be used without correction to calculate the Analytical Methods for Petroleum Hydrocarbons 37
concentration of the stock standard, provided such purities are certified by the manufacturer or by an independent source.
7.2.1.4 Transfer the stock standard solution into a Teflon-lined screw-cap/crimp cap bottle. Store,
with minimal headspace, at -10°C to -20°C and protect from light.
7.2.2 Stock standard solutions must be replaced after 6 months, or sooner if comparison with check standards indicates a problem. The use of commercially prepared certified standard solutions is an acceptable alternative to the use of neat
compounds in the preparation of standards.
7.3 Primary Dilution Standard
Using the stock standard solution, prepare primary dilution standards in methanol, as needed. The primary dilution standard should be prepared at the concentrations shown in Table 2. These standards should be stored with minimal headspace, at -10°C to -20°, and should be checked frequently for signs of degradation or evaporation. The analyst is
allowed to prepare separate surrogate and VPH analyte standards.
The primary dilution standards should be replaced at least monthly.
7.4 VPH Calibration Standards
Prepare VPH Calibration standards in reagent water from the primary dilution standard at a minimum of five concentration levels. One of the concentration levels must be
near, but above, the method detection limit and must be at a sufficiently low level to allow the PQL reporting of at least 5.0 ug/L for water and 0.5 mg/kg for
soil/sediments for the targeted analytes (BTEX and MTBE) and 50.0 ug/L and 5.0 mg/kg respectively for the aliphatic and aromatic carbon ranges. The other standard
concentrations must correspond to the expected range of concentrations found in real samples and/or should define the working range of the detector.
7.4.1 Rapidly inject the methanolic standard into the water in the expanded area of a filled 100-
mL volumetric flask. Remove the needle quickly after injection.
7.4.2 Mix aqueous standards by inverting the flask three times.
7.4.3 Discard the solution contained in the neck of the flask, and fill the sample syringe from the standard solution contained in the expanded area of the flask.
7.4.4 Do not use pipets to dilute or transfer samples or aqueous standards.
7.4.5 Do not inject more than 20 µL of methanolic standards into 100 mL of reagent water.
Aqueous standards are not stable and should be discarded after one hour.
7.5 Surrogate Control Standard (SCS)
Analytical Methods for Petroleum Hydrocarbons 38

The analyst must monitor both the performance of the analytical system and the effectiveness of the method in dealing with sample matrices by spiking each sample, blank, and matrix spike with a surrogate standard. The surrogate standard is also added to the VPH
calibration standard solutions. The recommended surrogate standard is 2,5-dibromotoluene, which elutes after all aliphatic and aromatic compounds of interest. The use of additional surrogates or surrogates other than those listed above may be used, at the discretion of the analyst, as long as their performance in the method is
demonstrated as acceptable and does not compromise the quantitation of the various target analytes or carbon ranges.
7.5.1 Surrogate Spiking Solution: From a stock standard solution prepared as in Section 7.2.1,
prepare a surrogate spiking solution at 50 µg/mL in methanol. Add 4.0 µL of this surrogate spiking solution directly into the 5-mL syringe with every aqueous sample, blank, and matrix spike. 1.0 mL of the surrogate spiking solution is added to soil samples during the extraction step (See 9.1.2.2).
7.6 Matrix Spiking Solution
The recommended matrix spiking solution, consisting of the Targeted VPH Analytes, is prepared in
methanol at concentrations of 50 µg/mL.
Analytical Methods for Petroleum Hydrocarbons 39
7.7 Petroleum Reference Standard
The use of a Petroleum Reference Standard is recommended for quality control purposes. The Petroleum Reference Standard consists of an API or commercial gasoline standard. Prepare a Petroleum Reference Standard Spiking Solution by accurately weighing
approximately 0.0100 g of neat product. Dissolve the neat product in methanol and dilute to volume in a 10-mL volumetric flask.
8.0 SAMPLE COLLECTION, PRESERVATION, AND HANDLING
8.1 Aqueous Samples
8.1.1 Aqueous samples should be collected in duplicate (or the number of vials directed by the
laboratory) without agitation and without headspace in contaminant-free amber glass VOC vials with Teflon-lined septa screw caps. Samples must
be acidified to a pH of 2.0 or less at the time of collection and this can generally be accomplished by adding 3 or 4 drops (0.1 to 0.2 mL) of 1:1 HCl
(1 part reagent water and 1 part concentrated HCl) to a 40-mL VOC vial. Samples must be cooled to 4°C immediately after collection.
8.1.2 A chain of custody form should accompany all sampling vials and should document the
date and time of sample collection and acid preservation. The pH of all water samples must be determined by the laboratory unless sample vials
containing acid for field preservation were supplied by the laboratory (this must be noted on the chain of custody). The pH measurement may be
performed on left over sample. Any sample found to contain a pH above 2.0 should be so noted on the laboratory/data report sheet.
8.1.3 Any sample received by the laboratory that is not packed in ice or cooled to 4°C must be so
noted on the laboratory/data report sheet.
8.1.4 Acid preserved aqueous samples must be analyzed within 14 days of collection. Aqueous samples which, for whatever reason, have not received acid preservation
must be analyzed within 7 days of collection or the data must be reported as an “estimate quantity”.
8.2 Soil Samples
8.2.1 Soil samples must be collected in a manner that minimizes sample handling and agitation. All sediment must be removed from the glass threads of the vial to ensure an adequate seal. Samples must be cooled to 4°C immediately after collection.
8.2.3 Samples for VPH analysis should be collected in duplicate 2 or 4 ounce VOC jars with
Teflon coated septum lined lids.
Analytical Methods for Petroleum Hydrocarbons 40
8.2.4 Sampling must be accomplished in a manner that ensures a minimum of headspace in the sample vial.
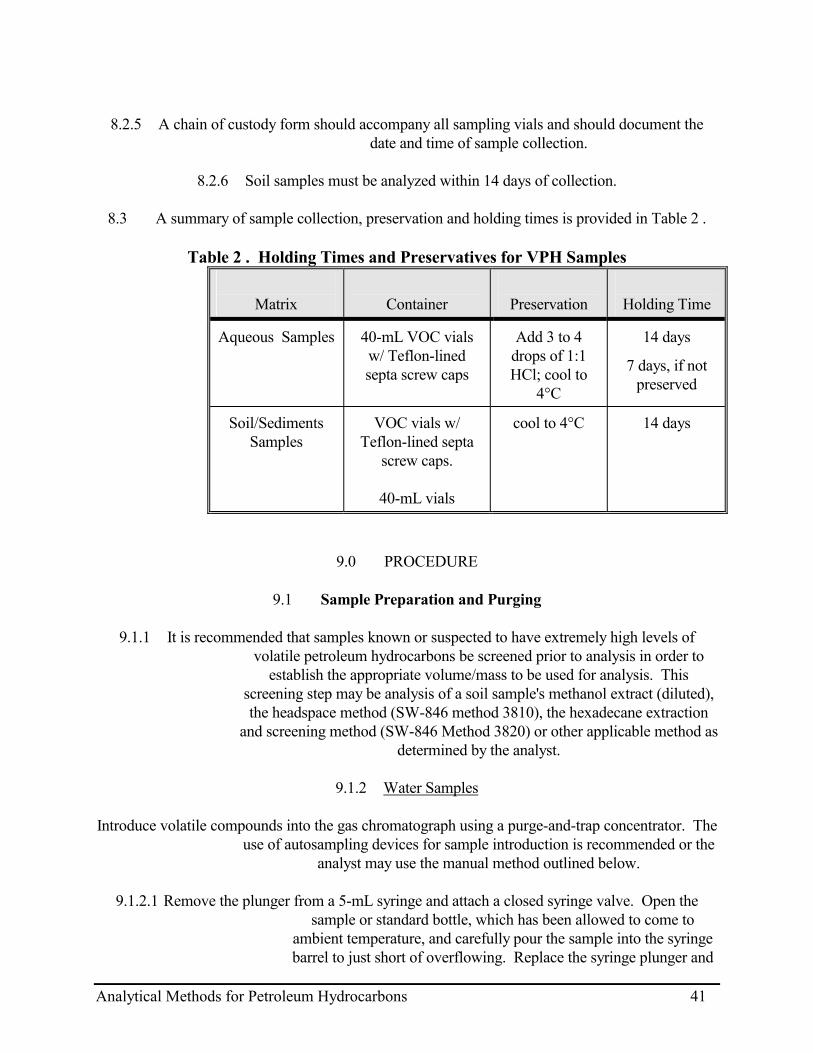
8.2.5 A chain of custody form should accompany all sampling vials and should document the
date and time of sample collection.
8.2.6 Soil samples must be analyzed within 14 days of collection.
8.3 A summary of sample collection, preservation and holding times is provided in Table 2 .
Table 2 . Holding Times and Preservatives for VPH Samples
Matrix
Container
Preservation
Holding Time
Aqueous Samples 40-mL VOC vials w/ Teflon-lined septa screw caps
Add 3 to 4 drops of 1:1 HCl; cool to
4°C
14 days
7 days, if not preserved
Soil/Sediments Samples
VOC vials w/ Teflon-lined septa
screw caps.
40-mL vials
cool to 4°C 14 days
9.0 PROCEDURE
9.1 Sample Preparation and Purging
9.1.1 It is recommended that samples known or suspected to have extremely high levels of volatile petroleum hydrocarbons be screened prior to analysis in order to
establish the appropriate volume/mass to be used for analysis. This screening step may be analysis of a soil sample's methanol extract (diluted), the headspace method (SW-846 method 3810), the hexadecane extraction
and screening method (SW-846 Method 3820) or other applicable method as determined by the analyst.
9.1.2 Water Samples
Introduce volatile compounds into the gas chromatograph using a purge-and-trap concentrator. The
use of autosampling devices for sample introduction is recommended or the analyst may use the manual method outlined below.
9.1.2.1 Remove the plunger from a 5-mL syringe and attach a closed syringe valve. Open the
sample or standard bottle, which has been allowed to come to ambient temperature, and carefully pour the sample into the syringe barrel to just short of overflowing. Replace the syringe plunger and
Analytical Methods for Petroleum Hydrocarbons 41

compress the sample. Open the syringe valve and vent any residual air while adjusting the sample volume to 5.0 mL. This process of
taking an aliquot destroys the validity of the liquid sample for future analysis; therefore, if there is only one 40-mL vial, the analyst should
fill a second syringe at this time to protect against possible loss of sample integrity. This second sample is maintained only until such time when the analyst has determined that the first sample has been
analyzed properly. Filling one 20-mL syringe would allow the use of only one syringe. If a second analysis is needed from a syringe, it
must be analyzed within 24 hours. Care must be taken to prevent air from leaking into the syringe.
9.1.2.2 If necessary, samples should be diluted prior to injection into the purge chamber. In such cases, all steps must be performed without delay until the diluted
sample is in a gas-tight syringe.
9.1.2.2.1 Dilutions may be made in volumetric flasks (10 mL to 100 mL). Select the volumetric flask that will allow for the necessary dilution.
Intermediate dilutions may be necessary for highly concentrated samples.
9.1.2.2.2 Calculate the approximate volume of reagent water to be added to the volumetric
flask selected and add slightly less than this volume of reagent water to the flask.
9.1.2.2.3 Inject the proper aliquot of sample from the syringe prepared in Paragraph 9.1.2.1
into the flask. Aliquots of less than 1 mL are not recommended. Dilute the sample to the mark with reagent water. Cap the flask, invert, and shake three times. Repeat the above procedure for additional dilutions. Alternatively
the dilutions can be made directly in the glass syringe to avoid further loss of volatiles.
9.1.2.2.4 Fill a 5-mL syringe with diluted sample as in Paragraph 9.1.2.1.
9.1.2.3 Add 4.0 µL of the surrogate spiking solution through the valve bore of the syringe. Close
the valves.
9.1.2.4 Attach the syringe-syringe valve assembly to the syringe valve on the purging device. Open the syringe valves and inject the sample into the purging chamber.
9.1.2.5 Close both valves and purge the sample for 11 min. Recommended purge and trap
operating parameters are provided in Table 3.
Analytical Methods for Petroleum Hydrocarbons 42
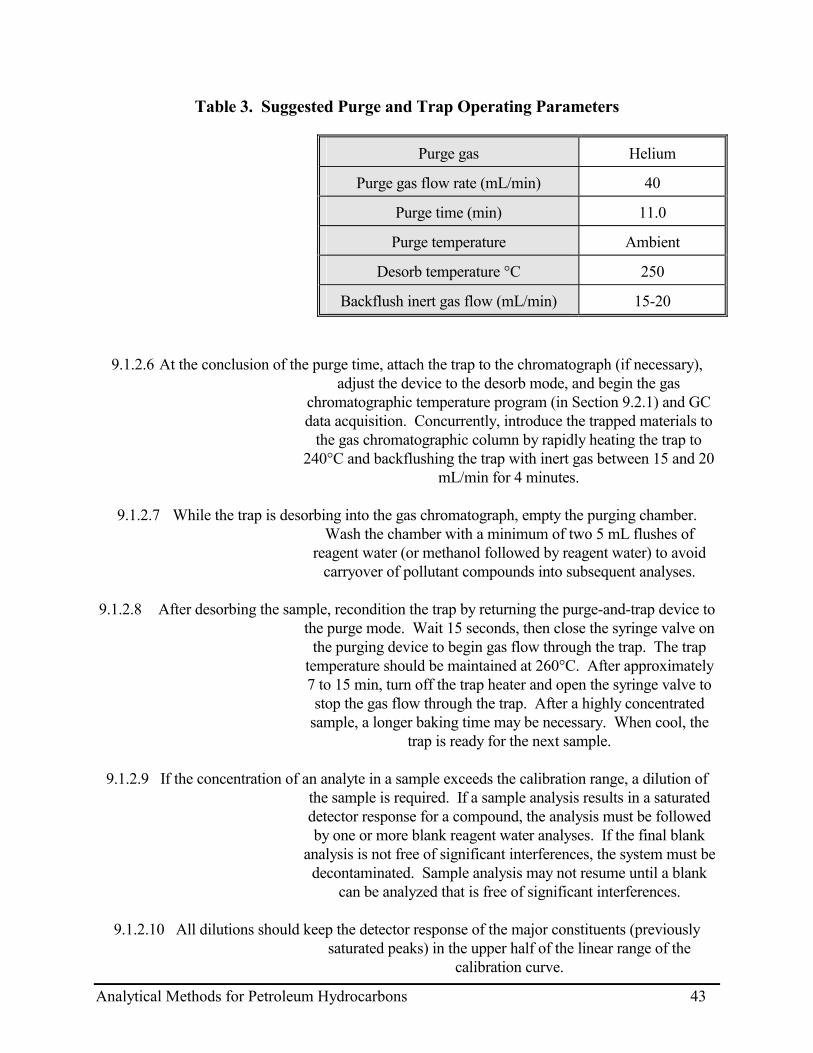
Table 3. Suggested Purge and Trap Operating Parameters
Purge gas Helium
Purge gas flow rate (mL/min) 40
Purge time (min) 11.0
Purge temperature Ambient
Desorb temperature °C 250
Backflush inert gas flow (mL/min) 15-20
9.1.2.6 At the conclusion of the purge time, attach the trap to the chromatograph (if necessary), adjust the device to the desorb mode, and begin the gas
chromatographic temperature program (in Section 9.2.1) and GC data acquisition. Concurrently, introduce the trapped materials to
the gas chromatographic column by rapidly heating the trap to 240°C and backflushing the trap with inert gas between 15 and 20
mL/min for 4 minutes.
9.1.2.7 While the trap is desorbing into the gas chromatograph, empty the purging chamber. Wash the chamber with a minimum of two 5 mL flushes of
reagent water (or methanol followed by reagent water) to avoid carryover of pollutant compounds into subsequent analyses.
9.1.2.8 After desorbing the sample, recondition the trap by returning the purge-and-trap device to
the purge mode. Wait 15 seconds, then close the syringe valve on the purging device to begin gas flow through the trap. The trap
temperature should be maintained at 260°C. After approximately 7 to 15 min, turn off the trap heater and open the syringe valve to stop the gas flow through the trap. After a highly concentrated
sample, a longer baking time may be necessary. When cool, the trap is ready for the next sample.
9.1.2.9 If the concentration of an analyte in a sample exceeds the calibration range, a dilution of the sample is required. If a sample analysis results in a saturated detector response for a compound, the analysis must be followed by one or more blank reagent water analyses. If the final blank
analysis is not free of significant interferences, the system must be decontaminated. Sample analysis may not resume until a blank
can be analyzed that is free of significant interferences.
9.1.2.10 All dilutions should keep the detector response of the major constituents (previously saturated peaks) in the upper half of the linear range of the
calibration curve.
Analytical Methods for Petroleum Hydrocarbons 43

9.1.3 Soil/Sediments
Soil and sediment samples are extracted with methanol. An aliquot of the extract is added to
reagent water and introduced into the gas chromatograph using a purge and trap concentrator. Should lower values for the targeted
analytes be desired, the analyst may employ direct purging of the soil sample using the method outlined in EPA methods 5030 and 5035.
The use of autosampling devices for sample introduction is recommended or the analyst may use the manual method outlined
below.
9.1.3.1 Weigh the sample vial to 0.1 g in a top loading balance and add 4 to 5 grams of the sample to the vial, reseal and determine the weight of the soil/sediment
sample.
9.1.3.2 Quickly add 9.0 mL of methanol and 1.0 mL of the surrogate spiking solution. Cap and shake the sample vial for 2 minutes.
9.1.3.3 Allow soil/sediment to settle, or centrifuge the vial, until a layer of methanol is apparent.
9.1.3.4 Using a microliter syringe, withdraw an appropriate aliquot of the methanol extract for
sparging. Sample screening data can be used to determine the volume of methanol extract to add to the 5 mL of reagent water for
analysis. All dilutions must keep the response of the major constituents in the upper half of the linear range of the calibration
curve.
9.1.3.5 Remove the plunger from one 5.0-mL Luerlock type syringe equipped with a syringe valve and fill until overflowing with reagent water. Replace the plunger and compress the water to vent trapped air. Adjust the volume to
allow for addition of the extract (e.g., for 100 µL of extract adjust to 4.9 mL). Pull the plunger to 5.0 mL for addition of the sample extract. Add the volume of methanol extract determined from
screening (100 µL maximum).
9.1.3.6 Attach the syringe valve assembly to the syringe valve on the purging device. Open the syringe valves and inject the sample into the purging chamber. Complete operations as specified in Paragraphs 9.1.2.5 through
9.1.2.8.
9.1.4 Proceed with the analysis as described in Sections 9.2 through 9.5. Analyze all laboratory method blanks and QC samples under the same conditions as that used for
samples.
9.1.5 If the responses exceed the calibration or linear range of the system, use a smaller aliquot of methanol or aqueous sample.
Analytical Methods for Petroleum Hydrocarbons 44

9.1.6 Determination of Percent Moisture
9.1.6.1 Soil and sediment results must be reported on a dry-weight basis.
9.1.6.2 Transfer 5 to 10 g of sample into a tared crucible. The amount of material used to
determine the percent moisture will depend on the amount of moisture present, thus relatively dry samples require more sample addition in order to achieve a significant weight change than wet
samples. Dry the sample overnight in an oven at 105°C. Remove the sample from the oven and allow it to cool in a desiccator before
reweighing. Reweigh and calculate the percent moisture of the sample using the equations provided in Section 9.6.2.2.
9.2 GC Conditions
9.2.1 Oven Program: Oven temperature 45°C, hold for 1 min, then to 100°C at 3°C/min, to
160°C at 8°C/min, to 230°C at 20°C/min; hold for 7.5 min. Conditions may be altered to improve resolution of volatile petroleum hydrocarbons.
9.2.2 Gas Flows: The recommended carrier gas is helium.
9.2.2.1 Carrier gas flow: 12.5 mL/min.
9.2.2.2 Air: 350 mL/min
9.2.2.3 Hydrogen: 30 mL/min
9.2.2.4 Make up gas flow: 17.5 mL/min
Analytical Methods for Petroleum Hydrocarbons 45
9.2.3 Miscellaneous:
9.2.3.1 FID temperature: 230°C
9.2.3.2 PID temperature: 230°C
9.2.3.3 Injection port temperature: 250°C
9.2.3.4 Column head pressure: 15 psi
9.3 Retention Time Windows
9.3.1 Before establishing retention time windows, make sure the GC system is within optimum operating conditions. Make three injections of the VPH Component
Standard throughout the course of a 72-hr period. Serial injections over less than a 72-hr period may result in retention time windows that are too tight.
9.3.2 Calculate the standard deviation of the three absolute retention times for each individual
compound in the VPH Component Standard. The retention time window is defined as plus or minus three times the standard deviation of the absolute retention times for each standard. However, the experience of the analyst
should weigh heavily in the interpretation of chromatograms.
9.3.3 In those cases where the standard deviation for a particular standard is zero, the laboratory should substitute the standard deviation of a closely eluting structurally
similar compound to develop a valid retention time window.
9.3.4 The laboratory must calculate retention time windows for each standard on each GC column and whenever a new GC column is installed. This data must be retained by
the laboratory.
9.3.5 VPH retention time (Rt) windows are defined as beginning 0.1 minutes after the Rt of the beginning marker compound and ending 0.1 minutes after the Rt of the ending marker compound. The exception to this is the C5 through C6
aliphatic hydrocarbon range, where its Rt window is defined a beginning 0.1 minutes prior to the beginning marker compound and ending 0.1 minutes
after the ending marker compound. VPH marker compounds and windows are summarized in Table 4 .
Analytical Methods for Petroleum Hydrocarbons 46

Table 4 . VPH Marker Compounds
Hydrocarbon Range
Beginning Marker Compound
Ending Marker Compound
C5-C6 Aliphatic Hydrocarbons (FID)
just before n-Pentane
just after n-Hexane
C6-C8 Aliphatic Hydrocarbons (FID)
just after n-Hexane just after n-Octane
C8-C10 Aliphatic Hydrocarbons (FID)
just after n-Octane just after n-Decane
C10-C12 Aliphatic Hydrocarbons (FID)
just after n-Decane just after n-Dodecane
C8-C10 Aromatic Hydrocarbons (PID)
just after Toluene just after 1,2,3-Trimethylbenzene
C10-C12 Aromatic Hydrocarbons (PID)
just after 1,2,3-Trimethylbenzene
just after Naphthalene
C12-C13 Aromatic Hydrocarbons (PID)
just after Naphthalene
just after 1-Methylnaphthalene
9.4 Calibration
9.4.1 External Standard Calibration Procedure
9.4.1.1 Prepare VPH Calibration Standards at a minimum of five concentration levels in
accordance with the procedures and specifications contained in Section 7.0.
9.4.1.2 Analyze each VPH Calibration Standard following the procedures outlined in Section 9.5.
Tabulate peak height or area responses against the mass injected. The results can be used to prepare a calibration curve for each targeted analyte. Alternatively, the ratio of the response to the amount injected, defined as the calibration factor (CF), may be calculated for method analytes using Equation 1. If the percent
relative standard deviation (%RSD) of the calibration factor is equal to or less than 20 % over the working range for all analytes of
interest, as determined using Equation 2, linearity through the origin can be assumed, and the average calibration factor can be used in
place of a calibration curve.
Analytical Methods for Petroleum Hydrocarbons 47

Equation 1: Calibration Factor
Calibration Factor (CF) = area of peakmass purged (ng)
Equation 2: Relative Standard Deviation
%RSD =Stand Dev of 5 CFsMean of 5 CFs
x 100
9.4.1.3 A collective calibration curve or factor must also be established for each hydrocarbon range of interest. Calculate the collective Calibration Factors (CF)
for C5-C6, >C6-C8, >C8-C10 and >C10-C12 Aliphatic Hydrocarbons ranges using the FID chromatogram. Calculate the collective CF for the >C8-C10, >C10-C12 and C12-C13 Aromatic Hydrocarbons ranges using the PID chromatogram. Tabulate the summation of the peak areas of all components, the compounds which define the various ranges, in those fractions (e.g. C6-C8
Aliphatic Hydrocarbons, n-pentane and n-hexane or >C6 - C8, n-octane) against the total mass injected using Equation 3.
Note: Do not include the area of any surrogate standard or internal standard in calculating a
Range CF.
Equation 3: Range Calibration Factor
Range CF = Total area of peaksTotal mass purged (ng)
9.4.1.4 At a minimum, the working calibration curve or calibration factor must be verified on each
working day, and after every 20 samples, whichever is more frequent, by the injection of a mid-level calibration standard to verify instrument performance and linearity. If the percent difference (%D) for any targeted analyte response varies from the predicted response
by more than ± 15 %, as determined using Equation 4, a new calibration curve must be prepared for that analyte. Similarly, if the
percent difference of the carbon range compound response varies from the predicted response by more than ± 20 %, a new calibration
curve must be prepared. Analytical Methods for Petroleum Hydrocarbons 48

Equation 4: Percent Difference (%D)
% D = CF CFvCF
x 100�
9.4.1.5 Targeted VPH Analytes and Aromatic Hydrocarbons ranges are quantitated on the PID chromatogram.
9.4.1.6 The Aliphatic Hydrocarbons ranges are quantitated on the FID chromatogram after
subtraction of the collective concentrations of MTBE, and the BTEX compounds identified on the PID chromatogram from the collective
concentration values of the C5 through C6 and C6 through C8 Aliphatic Hydrocarbon concentration values determined using the FID chromatogram. Similarly, the PID concentrations determined
for the remaining aromatic ranges are subtracted from the FID concentrations for those ranges to yield the actual FID Aliphatic
Hydrocarbon ranges values.
9.4.1.7 The concentration of specific analytes or hydrocarbon ranges in aqueous and non-aqueous samples may also be calculated from a calibration curve by use of
linear regression analysis.
9.5 GC Analysis
9.5.1 Samples are analyzed in a set referred to as an analysis sequence. The sequence begins with instrument calibration followed by samples interspersed with blanks and QC
samples. The analytical sequence ends must end with an acceptable calibration verification. If the final calibration verification is not acceptable,
then all samples analyzed after the last acceptable calibration verification must either be reanalyzed or if this is not possible, then the data associated
with those samples must be qualified as an “estimate quantity”.
9.5.2 Establish daily retention time windows for each analyte. Use the absolute retention time for each analyte as the midpoint of the window for that day. The daily retention
time window equals the midpoint ± three times the standard deviation determined in Section 9.3.
9.5.2.1 Tentative identification of an analyte occurs when a peak from a sample falls within the
daily retention time window. In cases where interferences are suspected, confirmation on a second dissimilar GC column or by
GC/MS analysis may be necessary.
Analytical Methods for Petroleum Hydrocarbons 49

9.5.2.3 Validation of GC system qualitative performance must be accomplished by the analysis of standards, generally mid-level, within the analysis sequence. If any of the standards fall outside their daily retention time window, the system is out of control. In such cases, the cause of the problem
must be determined and corrected.
9.5.3 If the response for Targeted VPH Analytes exceeds the linear range of the system, dilute the sample and reanalyze. It is recommended that samples be diluted so that all peaks are on scale. Overlapping peaks are not always evident when peaks are off scale. Computer reproduction of chromatograms, manipulated to ensure that all peaks are on scale over a 100-fold range, are acceptable if linearity is demonstrated prior to the analysis of samples. Peak height
measurements are recommended over peak area integration when overlapping peaks cause errors in area integration.
9.5.4 If detection of targeted analyte peaks are prevented by the presence of interferences,
additional analytical techniques, e.g. GC/MS, are recommended.
9.5.5 Peak area and carbon range area quantification/integration must be from baseline (i.e. forced baseline projection which must include the unresolved complex mixture
"hump" areas). The exception to this is the C5 through C6 Aliphatic Hydrocarbon range which, due to the use of capillary columns shorter than
100 meters and/or the purging of methanol volumes greater than 20 uL, may experience a lack of complete resolution between C5 (n-pentane) and methanol. In this event, the analyst is allowed to use tangential skim
integration, or other suitable integration techniques, to integrate n-pentane, and subsequent hydrocarbons within the C5-C6 aliphatic range if it/they
appear(s) on the trailing edge of the methanol solvent peak.
9.6 External Standard Calculations
The concentration of targeted analytes and hydrocarbon ranges in a sample may be determined by calculating the amount of analyte or hydrocarbon range purged, from the peak
response, using the calibration curve or the calibration factor determined in Section 9.4.
9.6.1 Aqueous samples:
The general equation to determine the concentration of a specific analyte or hydrocarbon range in
aqueous samples in provided in Equation 5.
Equation 5
Concentration ( g / L) = ( A )(A)(D)( A )(V )
x
s s�
where:
Analytical Methods for Petroleum Hydrocarbons 50
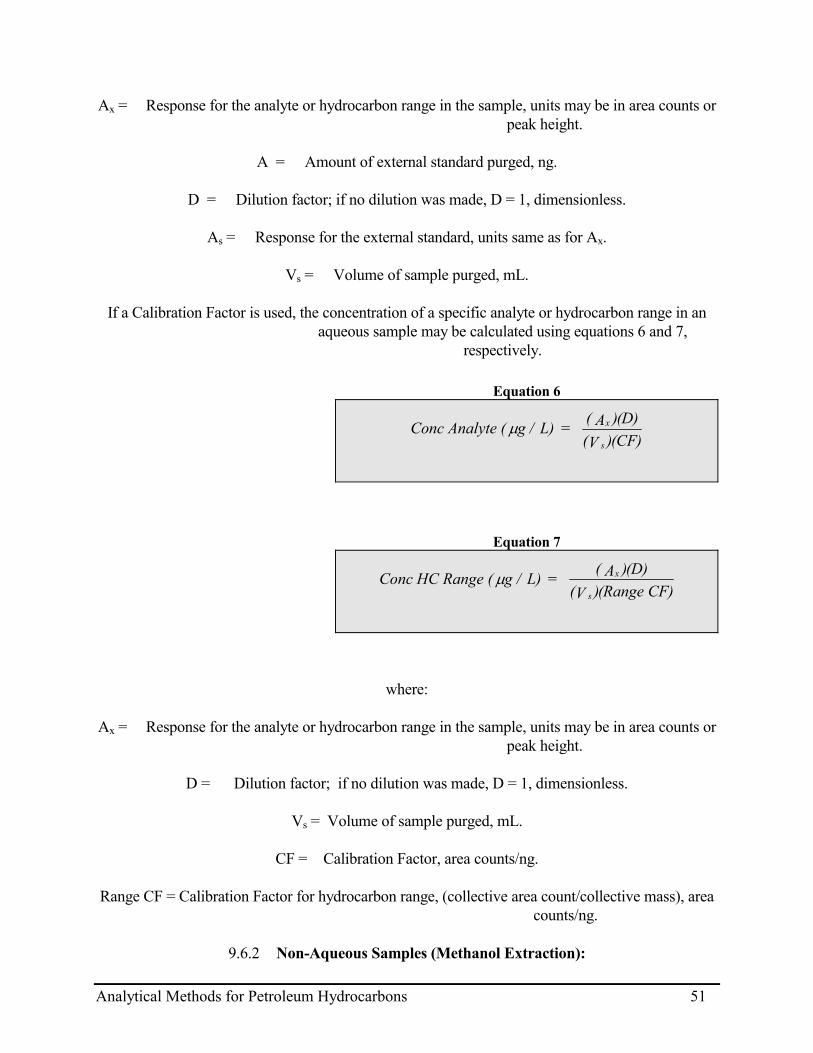
Ax = Response for the analyte or hydrocarbon range in the sample, units may be in area counts or peak height.
A = Amount of external standard purged, ng.
D = Dilution factor; if no dilution was made, D = 1, dimensionless.
As = Response for the external standard, units same as for Ax.
Vs = Volume of sample purged, mL.
If a Calibration Factor is used, the concentration of a specific analyte or hydrocarbon range in an
aqueous sample may be calculated using equations 6 and 7, respectively.
Equation 6
Conc Analyte ( g / L) = ( A )(D)(V )(CF)
x
s�
Equation 7
Conc HC Range ( g / L) = ( A )(D)(V )(Range CF)
x
s�
where:
Ax = Response for the analyte or hydrocarbon range in the sample, units may be in area counts or peak height.
D = Dilution factor; if no dilution was made, D = 1, dimensionless.
Vs = Volume of sample purged, mL.
CF = Calibration Factor, area counts/ng.
Range CF = Calibration Factor for hydrocarbon range, (collective area count/collective mass), area
counts/ng.
9.6.2 Non-Aqueous Samples (Methanol Extraction):
Analytical Methods for Petroleum Hydrocarbons 51

9.6.2.1 The general equation to determine the concentration of a specific analyte or hydrocarbon range in a soil or sediment sample is provided in Equation 8.
Equation 8
Concentration ( g / kg) = ( A )(A)(V )(D)( A )(V )(W )
x t
s i d�
where:
Ax = Response for the analyte or hydrocarbon range in the sample, units may be in area counts or peak height.
A = Amount of external standard purged, ng.
Vt = Volume of total extract, µL (Note: this value must include the 1.0 mL surrogate spiking
solution added to soil samples)
D = Dilution factor; if no dilution was made, D = 1, dimensionless.
As = Response for the external standard, units same as for Ax.
Vi = Volume of methanol extract added to reagent water for purge and trap analysis, µL.
Wd = Dry weight of sample purged, g (see equations 11 through 13)
If a Calibration Factor is used, the concentration of a specific analyte or hydrocarbon range in a soil or sediment sample may be calculated using Equations 9
and 10, respectively.
Equation 9
Conc Analyte ( g / kg) = ( A )(V )(D)(V )(W )(CF)
x t
i d�
Analytical Methods for Petroleum Hydrocarbons 52

Equation 10
Conc HC Range ( g / kg) = ( A )(V )(D)(V )(W )(Range CF)
x t
i d�
where:
Vt = Volume of total extract, µL.
Vi = Volume of extract added for purging, µL
Wd = Dry Weight of sample purged, g (see Equations 11 through 13)
Ax, CF, Range CF and D have the same definition as for aqueous samples.
9.6.2.2 Calculation of Dry Weight of Sample
In order to calculate the dry weight of sample purged (Wd), it is necessary to determine the moisture content of the soil/sediment sample, using the procedure outlined in
Section 9.1.6. Using the data obtained from Section 9.1.6, Wd is calculated using Equations 11 through 13.
Equation 11
% Moisture = g sample - g dry sampleg sample
X 100
Equation 12
% Dry Solids = (1) - (% Moisture)
Equation 13
dW (g) = (% Dry Solids)(g of extracted sample)
Analytical Methods for Petroleum Hydrocarbons 53

9.6.3 The concentration of specific analytes or hydrocarbon ranges in aqueous and non-aqueous samples may also be calculated from the calibration curve by linear
regression, provided that the correlation coefficient (r) is at least 0.99 and the % D for any targeted analyte must not vary from the predicted response by more than +/- 15%, nor any hydrocarbon range standard from its predicted
response by more than +/- 20%.
9.6.4 Peak areas measured from blanks may not be subtracted from sample peak areas.
9.6.5 All integration of collective hydrocarbon ranges must be to baseline.
9.6.6 Required Adjustment of Range Concentration Data: In order to minimize the "double counting" of the same hydrocarbon compounds on both the FID and PID
chromatograms, the collective concentrations of MTBE, benzene, toluene, ethylbenzene, and m, p, o-xylene identified on the PID chromatogram must
be subtracted from the collective Aliphatic Hydrocarbon concentration values, for the ranges in which they elute, determined using the FID
chromatogram. Similarly, the collective concentrations of the remaining aromatic ranges values determined on the PID chromatogram must be
subtracted from the corresponding aliphatic ranges values determined on the FID chromatogram.
10.0 QUALITY CONTROL
10.1 General Requirements and Recommendations
10.1.1 Each laboratory that uses this method should operate a formal quality control program. The minimum requirements of this program consist of an initial demonstration of laboratory capability and an ongoing analysis of spiked samples to evaluate and document the quality of data. The laboratory must maintain records to
document the quality of the data generated. Ongoing data quality checks are compared with established performance criteria to determine if the results of analyses meet the performance standards for the method. When results of
sample spikes indicate atypical method performance, a quality control check standard must be analyzed to confirm that the measurements were
performed in an in-control mode of operation.
10.1.2 A acidified reagent water blank should continually accompany each soil sample or water sample batch, respectively, over the course of sampling, storage, and
analysis.
10.1.3 A Laboratory Method Blank should be run after samples suspected of being highly contaminated to determine if sample carryover has occurred.
10.1.4 At a minimum, for each analytical batch (up to 20 samples), a Laboratory Method Blank,
Laboratory Fortified Blank, Laboratory Fortified Matrix Spike, and sample Analytical Methods for Petroleum Hydrocarbons 54

duplicate must be analyzed. For analytical batches with more than 10 samples, the analysis of an additional mid-range calibration check standard is recommended. The blank and spiked samples must be carried through all
stages of the sample preparation and measurement process.
10.1.5 The recommended sequence of analysis is as follows:
(1) Calibration Standards (initial) or mid-range Calibration Check Standard (daily check on initial calibration)
(2) Laboratory Method Blank (3) Samples
(4) QC Samples (5) Mid-range Calibration Check Standard (also recommended after each 10 samples)
10.1.6 It is recommended that a system of control charts be developed to plot surrogate standard
recoveries as a function of time. When surrogate recovery from a sample, blank, or QC sample is less than 60% or more than 140%, check
calculations to locate possible errors, the fortifying solution for degradation, and changes in instrument performance. If the cause cannot be determined,
the analyst may reanalyze the sample or report the surrogate values as outside acceptance limits.
10.2 Minimum Instrument QC
10.2.1 While it is recommended that the n-pentane (C5) peak be adequately resolved from the
methanol solvent on the FID chromatogram, the analyst is allowed to follow the guidance as outlined in 9.5.5. Coelution of the m- and p- xylene isomers
is permissible. Any surrogates and/or internal standards used must be adequately resolved from individual compounds in the VPH Component
Standard.
10.2.2 Retention time windows must be established for each analyte of interest each time a new GC column is installed, and must be verified and/or adjusted on a daily
basis. (See Section 9.3)
10.2.3 Calibration curves must be developed based upon the analysis of calibration standards prepared at a minimum of 5 concentration levels. The linearity of
calibration or response factors may be assumed if the percent relative standard deviation (%RSD) over the working range of the curve is less than
or equal to 20%. Alternatively, if linear regression analysis is used for quantitation, the correlation coefficient (r) must be at least 0.99 and no
targeted analyte or carbon range standard may vary from the true value by more than +/- 15% and +/- 20% respectively. (See Section 9.4.)
10.3 Initial and Periodic Method QC Demonstrations
Analytical Methods for Petroleum Hydrocarbons 55

The following must be conducted as an initial demonstration of laboratory capability, prior to the analysis of any samples. Subsequent to this initial demonstration, additional
evaluations of this nature should be conducted on a periodic basis, in response to changes in instrumentation or operations, and/or in response to confirmed or
suspected systems, method, or operational problems.
10.3.1 Accuracy and Precision
To demonstrate initial laboratory capability, analyze a minimum of four replicate reagent water and/or clean sand blanks spiked with each analyte of interest at
approximately 20 to 60 µg/L and/or 20 to 60 mg/kg, respectively.
10.3.1.1 Add an appropriate aliquot of the stock or primary dilution standard solution(s) to each of the four replicate reagent water or clean sand blanks. Purge and analyze each replicate according to the procedures described in
Section 9.0.
10.3.1.2 Calculate the measured concentrations of each analyte in all replicates, the mean accuracy (as a percentage of true value) for each analyte, and the precision
(as %RSD) of the measurements for each analyte.
10.3.1.3 For each analyte, the mean accuracy, expressed as a percentage of the true value, must be between 80% and 120%. For each analyte, the %RSD must be
less than or equal to 20%.
10.3.1. If desired, the Accuracy and Precision evaluation may be combined with the MDL evaluation specified in Paragraph 10.3.2.
10.3.2 Method Detection Limits (Optional)
Analyze a minimum of seven replicate reagent water and/or clean sand blanks which have been
fortified with all analytes of interest at approximately 0.5 to 5 µg/L and/or 1 to 5 mg/kg, respectively. Calculate the Method Detection Limit (MDL) of
each analyte using the procedure described in Section 12.0.
10.3.2.1 Water MDLs are determined by analyzing 7 to 10 replicates of reagent water samples in 100-mL flasks spiked with the VPH Component standard and with
40 µg/L of the surrogate compound 2,5-dibromotoluene.
10.3.2.2 Soil/sediment MDLs are determined by analyzing 7-10 replicates of 5 -g of VPH-free sand blanks spiked with the VPH Component standard and with 2
mg/kg of the surrogate 2,5-dibromotoluene.
Analytical Methods for Petroleum Hydrocarbons 56

10.3.3 Petroleum Reference Standard
As an optional demonstration of the validity and relevance of VPH calibration, analyze a reagent water and/or clean sand blank spiked with a known concentration of a neat
gasoline product.
10.3.3.1 Fortify a reagent water and/or clean sand blank with 5 µL and/or 0.5 mL of the Petroleum Standard Spiking Solution, respectively. Purge and analyze in
accordance with the procedures outlined in Section 9.0.
10.3.3.2 Calculate the total concentration of all petroleum hydrocarbons within the Aliphatic Hydrocarbon ranges using the FID chromatogram. Add these values together. Do not subtract the concentration of Targeted
VPH analytes.
10.3.3.3 The concentration calculated in Paragraph 10.3.3.2 is expected to be within 30% +/- of the known concentration of Petroleum Standard in the reagent
water or sand blank.
Analytical Methods for Petroleum Hydrocarbons 57

10.4 Ongoing Method QC Demonstrations
10.4.1 Each sample, blank, and matrix spike must be spiked with the surrogate spiking solution. Required surrogate recovery is 60% to 140%.
10.4.2 At a minimum, with every batch of 20 samples or less the laboratory must analyze the
following:
10.4.2.1 Calibration Check Standard - A mid-range calibration standard, prepared from the same stock standard solution used to develop the calibration curve, must be analyzed prior to sample analysis to verify the calibration state of the instrument. For large analytical batches that contain more
than 10 samples, the analysis of an additional mid-range calibration check standard is recommended after the analysis of the tenth sample. If the percent difference (% D) of any analyte within the calibration check standard varies from the predicted response by more than 20 %, a new calibration curve must be prepared for
that analyte.
10.4.2.2 Laboratory Method Blank - A water or soil laboratory method blank is prepared by fortifying a 5 mL reagent water blank with 4 µL of the surrogate spiking solution, or by fortifying a 5 g sample of clean sand with
1.0 mL of the surrogate spiking solution. Peaks within the retention time windows of any hydrocarbon ranges of interest may
not be present at or above the lowest calculated PQL for any sample within its batch. When determining the PQL for soil
method blanks, incorporate the lowest percent solids value found for any sample within its batch in the calculation.
10.4.2.3 Laboratory Fortified Blank (LFB) - A water or soil component spike is prepared by
fortifying a 5 mL reagent water blank with 4 µL of the matrix spiking solution, or by fortifying a 5 g sample of clean sand with
1.0 mL of the matrix spiking solution. The spike recovery must be between 70% and 130% and if these values can not be obtained
the analyst must identify and correct the problem before analyses can continue.
10.4.2.4 Sample duplicates - Sample duplicates may be laboratory or field duplicates. The RPD
of duplicate samples should not exceed +/- 25%. The lack of sample homogeneity may contribute to RPD’s for duplicates which exceed this value. Should the values exceed 25%, the
analyst must report that occurrence.
Analytical Methods for Petroleum Hydrocarbons 58
10.4.2.5 Laboratory Fortified Matrix (LFM) Spike - The water or soil LFM spike is prepared by fortifying an actual 5 mL water sample with 4 µL of the matrix
spiking solution, or by fortifying an actual 5 g soil/sediment sample with 1.0 mL of the matrix spiking solution. The purpose

of the LFM is to determine whether the sample matrix contributes bias to the analytical results. The background concentrations of
the analytes in the sample matrix must be determined in a separate aliquot and the measured values in the LFM corrected for
background concentrations. The corrected concentrations of each analyte within the matrix spiking solution must be within 70 -
130% of the true value. Should the values determined exceed this range, the analyst must report that occurrence.
10.4.3 If any of the performance standards specified in Section 10.4 are not met, the problem must
be corrected before further samples are analyzed. Exceptions to this are duplicate samples RPD’s and high recoveries for LFM spikes which, due to sample non-homogeneity may exceed the allowable limits. Any samples run
between the last calibration check standard that meets the criteria and one that does not must be rerun. If this is not possible, that data must be reported
as an “estimated concentration”.
11.0 DATA PRODUCTION AND REPORTING
11.1 Sample Analysis
11.11 PID Chromatogram
11.1.1.1 Determine the peak area count for the Targeted VPH Analytes.
11.1.1.2 Determine the peak area count for the surrogate 2,5-dibromotoluene.
11.1.1.3 Separately determine the total area count for all peaks eluting 0.1 minutes after the Rt’s for toluene through 0.1 minutes after the Rt for 1,2,3-
trimethylbenzene, for all peaks eluting 0.1 minutes after the retention time (Rt) for 1,2,3-trimethylbenzene and 0.1 minutes after the retention time for naphthalene and for all peaks eluting
0.1 minutes after the Rt for naphthalene through 0.1 minutes after the Rt of 1-methylnaphthalene.
11.1.1.4 Using the equations contained in Section 9.6 or linear regression analysis, calculate
the concentrations of the Targeted VPH Analytes, the surrogate standard 2,5-dibromotoluene, and >C8 through C10, >C10
through C12 and >C12 through C13 Aromatic Hydrocarbons.
Analytical Methods for Petroleum Hydrocarbons 59

11.2.1 FID Chromatogram
11.2.1.1 Separately determine the total area count for all peaks eluting 0.1 minutes before the
retention time (Rt) for n-pentane to 0.1 minutes after the Rt for n-hexane and for all peaks eluting 0.1 minutes after the Rt for n-
hexane to 0.1 minutes after the Rt for n-octane. It is not necessary to identify or quantitate individual aliphatic compounds within
these ranges.
11.2.1.2 Determine the total area count for all peaks eluting 0.1 minutes after the Rt for n-octane to 0.1 minutes after the Rt for n-decane and 0.1 minutes after n-decane to 0.1 minutes after n-dodecane. It is not necessary to
identify or quantitate individual aliphatic compounds within this range.
11.2.1.3 Determine the peak area count for the surrogate standard 2,5-dibromotoluene.
11.2.1.4 Using the equations contained in Section 9.6 or linear regression analysis, calculate
the concentrations of C5 through C6 Aliphatic Hydrocarbons, >C6 through C8 Aliphatic Hydrocarbons, >C8 through C10 Aliphatic
Hydrocarbons, >C10 through C12 Aliphatic Hydrocarbons and the surrogate standard 2,5-dibromotoluene.
11.2.1.5 To avoid "double counting" of the same analytes, adjust the concentrations of Aliphatic
Hydrocarbons calculated in Paragraph 11.2.1.4 by subtracting the collective concentrations of methyl tert butylether, benzene, toluene, >C8 through C10 and >C10 through C12 Aromatic Hydrocarbons, as determined from the PID chromatogram in Section 11.11, from the Aliphatic Hydrocarbon range values
effected.
11.3 Data Reporting Format
11.3.1 The following information and data must be reported:
11.3.1.1 The sample matrix (aqueous, soil or sediment);
11.3.1.2 The date(s) the sample was collected, received by the laboratory, and analyzed;
11.3.1.3 A description of the sample(s) received by the laboratory, relative to the physical condition of the containers, the temperature of the samples, and
use of appropriate preservatives;
11.3.1.4 Moisture content (for soil/sediment samples);
Analytical Methods for Petroleum Hydrocarbons 60
11.3.1.5 The calculated concentrations of C5 through C6, C6 through C8, C8 through C10 and C10 through C12 Aliphatic Hydrocarbons ranges and C8 through
C10, C10 through C12 and C12 through C13 Aromatic Hydrocarbons ranges
11.3.1.6 Surrogate recovery (expressed as percent recovery);
11.3.1.7 The calculated concentrations of Targeted VPH Analytes determined
11.3.1.8 The concentration units for aqueous samples are expressed as ug/L or mg/L and for soil
or sediment samples the units are expressed as ug/Kg or mg/Kg on a dry-weight basis.
12.0 METHOD PERFORMANCE
12.1 Method Detection Limits (Optional)
12.1.1 The method detection limit (MDL) is defined as the minimum concentration of a substance that can be measured and reported with 99% confidence that the value is
above zero. The MDL actually achieved in a given analysis will vary depending on instrument sensitivity and matrix effects.
12.1.2 The MDL is determined according to the following equation:
Equation 14
MDL = (t) x (SD)
where:
t = student t value at the 99% confidence level
SD = standard deviation of the replicate analysis
Analytical Methods for Petroleum Hydrocarbons 61

Student t values are as follows: Number of replicates t value
7 3.14
8 3.00
9 2.90
10 2.82
12.1.3 For the purposes of this method, the designated MDL value for a hydrocarbon range of interest shall be the highest value calculated for the individual analytes
within that hydrocarbon range.
12.2 Single Laboratory Accuracy, Precision, and MDL Data
Single laboratory accuracy, precision and MDL data for method analytes are provided in Tables 1-1 through 1-4 in Appendix 1. Additional investigation will be conducted to further
evaluate the low recoveries for naphthalene.
13.0 REFERENCES
1. USEPA "SW-846 Test Methods for Evaluating Solid Waste," 3rd Edition; Methods 5030, 8000, 8015, and the current edition of 8020.
2. American Petroleum Institute "Sampling and Analysis of Gasoline Range Organics and
Soils," in preparation.
3. USEPA, "Measurements of Petroleum Hydrocarbons: Report on Activities to Develop a Manual," prepared by Midwest Research Institute, Falls Church, VA under EPA
Contract No. 68-WO-0015, WA No. 4; Submitted to USEPA Office of Underground Storage Tanks; Washington, DC; November 20, 1990.
4. ASTM "Standard Practice for Sampling Waste and Soils for Volatile Organics," Draft #1
2/16/87.
5. Parr, J. L., G. Walters, and M. Hoffman, Sampling and Analysis of Soils for Gasoline Range Organics," presented at First Annual West Coast Conference Hydrocarbon
contaminated Soils and Groundwater, 2/21/90.
6. American Petroleum Institute "Laboratory Study on Solubilities of Petroleum Hydrocarbons in Groundwater," August 1985, API Publ. 4395.
Analytical Methods for Petroleum Hydrocarbons 62

7. "Leaking Underground Fuel Tank (LUFT) Field Manual," State Water Resources Control Board, State of California, Sacramenta, CA, May 1988.
8. Fitzgerald, John "Onsite Analytical Screening of Gasoline Contaminated Media Using a Jar
Headspace Procedure," in Petroleum Contaminated Soils,Vol. 2, 1989.
9. Senn, R. B., and M. S. Johnson, "Interpretation of Gas Chromatographic Data in Subsurface Hydrocarbon Investigations," Ground Water Monitoring Review, 1987.
10. Hughes, B. M., D. E. McKenzie, C. K. Trang, L. S. R. Minor, "Examples of the Use of an
Advances Mass Spectrometric Data Processing Environment for the Determination of Sources of Wastes," in Fifth Annual Waste Testing and Quality Assurance
Symposium; USEPA, July 24-28, 1989.
11. Urban, M. J., J. S. Smith, E. K/ Schultz, R. K. Dickson, "Volatile Organic Analysis for a Soil Sediment or Waste Sample" in Fifth Annual Waste Testing and Quality
Assurance Symposium; USEPA, July 24-28, 1989.
12. Siegrist, R. L. and P.D. Jenssen, "Evaluation of Sampling Method Effects on Volatile Organic Compound Measurements in Contaminated Soils," Environmental Science
and Technology, Vol. 24, November 9, 1990.
13. Wisconsin DNR "Modified GRO Method for Determining Gasoline Range Organics," PUBL-SW-140, 1992.
Analytical Methods for Petroleum Hydrocarbons 63
(blank page)
Analytical Methods for Petroleum Hydrocarbons 64
METHOD FOR THE DETERMINATION
OF
EXTRACTABLE PETROLEUM HYDROCARBONS (EPH) FRACTIONS
Washington State Department of Ecology
June 1997
Analytical Methods for Petroleum Hydrocarbons 65

METHOD FOR THE DETERMINATION OF EXTRACTABLE PETROLEUM HYDROCARBONS (EPH)
TABLE OF CONTENTS
Section Topic Page
1.0 Scope and Application 67
2.0 Summary of Method 68
3.0 Definitions 70
4.0 Interferences 72
5.0 Health and Safety Issues 73
6.0 Apparatus and Materials 73
7.0 Reagents and Standards 75
8.0 Sample Collection, Preservation, and Handling 77
9.0
Procedure 78
9.1 Sample Preparation 78
9.2 GC Conditions 85
9.3 Retention Time Windows 86
9.4 Calibration 87
9.5 GC Analysis 91
9.6 Calculations 91
10.0 Quality Control 95
11.0 Data Production and Reporting 100
12.0 Method Performance 102
13.0 References 103
APPENDIX 3 - Single Laboratory Accuracy, Precision, and Method detection Limits
APPENDIX 4 - Suggested EPH Data Reporting Format
Analytical Methods for Petroleum Hydrocarbons 66
DISCLAIMER Mention of trade names or commercial products does not constitute
endorsement by the Washington State Department of Ecology. Equipment and materials cited in this method may be replaced by similar products, as long
as adequate data exists or has been produced documenting equivalent or superior performance.
METHOD FOR THE DETERMINATION OF EXTRACTABLE PETROLEUM HYDROCARBONS
1.0 SCOPE AND APPLICATION
1.1 This method is designed to measure the collective concentrations of extractable aliphatic and aromatic petroleum hydrocarbons in water and soil. The carbon ranges used
through out this document are given in equivalent carbon numbers (EC) which are related to the boiling point of a chemical normalized to the boiling point of
the n-alkanes and its retention time in a boiling point gas chromatographic column. Extractable aliphatic hydrocarbons are collectively quantitated within five
ranges: C8 through C10, >C10 through C12, >C12 through C16, >C16 through C21 and >C21 through C34. Extractable aromatic hydrocarbons are collectively
quantitated within five ranges: C8 through C10, >C10 through C12, >C12 through C16, >C16 through C21 and >C21 through C34. These aliphatic and aromatic
hydrocarbon ranges correspond to a boiling point range between approximately 150 °C and 500 °C.
1.2 Petroleum products suitable for evaluation by this method include, but are not limited to, kerosene and jet fuels, diesel and fuel oils and hydraulic, insulating and lubricating
oils. This method, in and of itself, is not suitable for the evaluation of gasoline, mineral spirits, petroleum naphthas, and other petroleum products which contain a
significant percentage of hydrocarbons lighter than C10. When samples are known or suspected to contain petroleum hydrocarbons of these or similar types, the
Volatile Petroleum Hydrocarbon (VPH) method must also be employed to fully evaluate the hydrocarbons present.
1.3 For reporting purposes, the practical quantitation limits (PQL), given the sample
volume/mass, final extract volume and assuming 100 percent solids for soil/sediments are: 50.0 ug/L for aliphatic and aromatic carbon ranges in water and 5.0 mg/Kg for these components in soil. If lower quantitation limits are desired, the analyst is allowed to extract larger volumes/masses and/or concentrate the extracts to smaller volumes prior to analysis. The procedure for Method Detection Limits
Analytical Methods for Petroleum Hydrocarbons 67

(MDL) determination in this method and the Single Laboratory Precision, Accuracy and MDL data (generated by State of Massachusetts) is added for informational
purposes only.
1.4 This method is based on a solvent extraction, silica gel fractionation process and gas chromatography (GC) analysis using a flame ionization detector (FID). This
procedure should be used by, or under the supervision of, analysts experienced in extractable organics analysis. Analysts using this method should be skilled in the
interpretation of gas chromatograms and their use as a quantitative tool.
1.5 Like all GC procedures, this method is subject to a "false positive" bias, in that non-hydrocarbon compounds eluting or co-eluting within a specified retention time window may be falsely identified and/or quantitated with the respective carbon
ranges. While the cleanup procedure specified in this method to segregate aliphatic and aromatic fractions will serve to mitigate this concern, confirmatory analyses by gas chromatography/mass spectrometry (GC/MS) analysis, EPA Method 8270, or
other suitable techniques are recommended in cases where significant concentrations of non-hydrocarbon compounds are known or suspected. Non-
petroleum compounds identified and quantitated by GC/MS may be subtracted from the carbon ranges affected as long as the quantity and identities of the compounds
are reported along with the carbon range data.
2.0 SUMMARY OF METHOD
2.1 A sample submitted for EPH analysis is extracted with methylene chloride, dried over sodium sulfate, solvent exchanged into hexane, and concentrated. Sample cleanup
and separation into aliphatic and aromatic fractions is conducted using a modification of EPA method 3630 (silica gel cleanup). The use of commercially available silica gel cartridges (Sep-Pak cartridges, Waters, Milford, MA) may be
substituted for the silica gel column outlined in method 3630 if they can be shown to achieve comparable results. The two extracts produced are then concentrated to final volumes of 10 mL each (i.e., an aliphatic extract and an aromatic extract) and
are then separately analyzed by a gas chromatograph equipped with a capillary column and a flame ionization detector. The resultant chromatogram of aliphatic compounds is collectively integrated within the C8 through C10, >C10 through C12, >C12 through C16, >C16 through C21 and >C21 through C34 aliphatic hydrocarbon ranges. The resultant chromatogram of aromatic compounds is collectively integrated within the C8 through C10, >C10 through C12, >C12
through C16, >C16 through C21 and >C21 through C34 ranges.
2.2 Average calibration factors or response factors determined using an aliphatic hydrocarbon standard mixture are used to calculate the collective concentrations of the different
aliphatic hydrocarbons ranges. An average calibration factor or response factor determined using the aromatic hydrocarbon standard mixture is used to calculate a
collective concentrations of the aromatic hydrocarbon ranges.
Analytical Methods for Petroleum Hydrocarbons 68
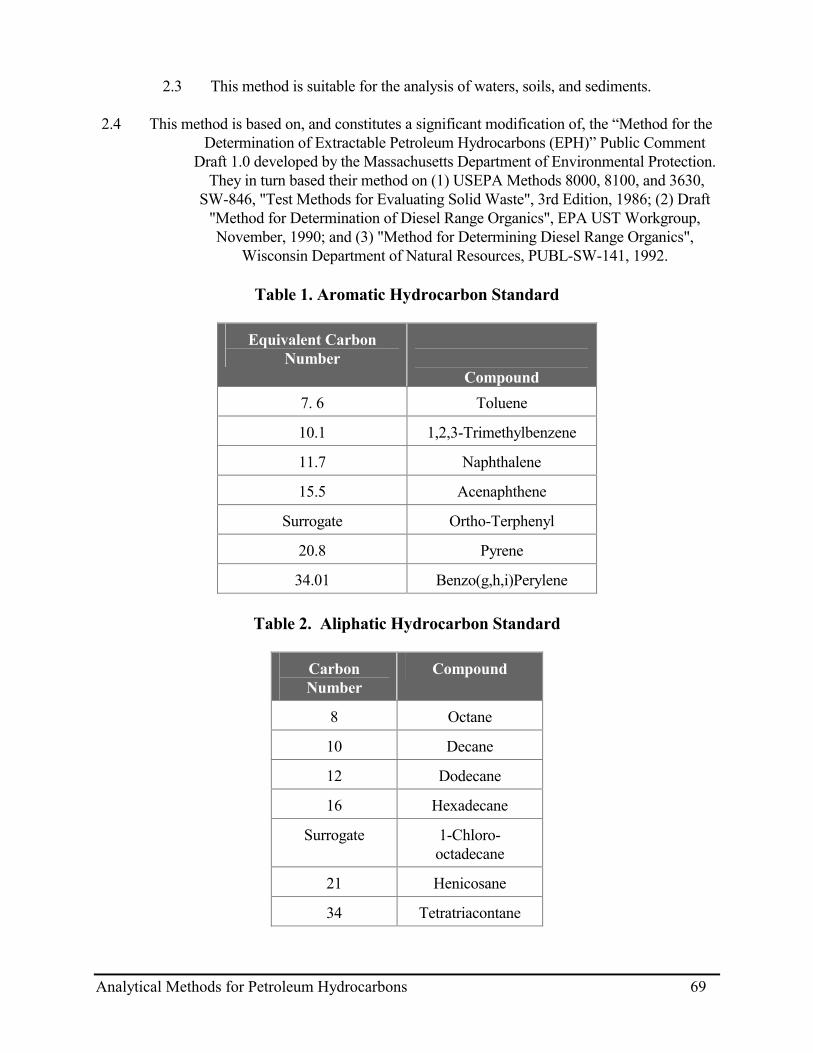
2.3 This method is suitable for the analysis of waters, soils, and sediments.
2.4 This method is based on, and constitutes a significant modification of, the “Method for the Determination of Extractable Petroleum Hydrocarbons (EPH)” Public Comment
Draft 1.0 developed by the Massachusetts Department of Environmental Protection. They in turn based their method on (1) USEPA Methods 8000, 8100, and 3630,
SW-846, "Test Methods for Evaluating Solid Waste", 3rd Edition, 1986; (2) Draft "Method for Determination of Diesel Range Organics", EPA UST Workgroup, November, 1990; and (3) "Method for Determining Diesel Range Organics",
Wisconsin Department of Natural Resources, PUBL-SW-141, 1992.
Table 1. Aromatic Hydrocarbon Standard
Equivalent Carbon Number
Compound 7. 6 Toluene
10.1 1,2,3-Trimethylbenzene
11.7 Naphthalene
15.5 Acenaphthene
Surrogate Ortho-Terphenyl
20.8 Pyrene
34.01 Benzo(g,h,i)Perylene
Table 2. Aliphatic Hydrocarbon Standard
Carbon Number
Compound
8 Octane
10 Decane
12 Dodecane
16 Hexadecane
Surrogate 1-Chloro-octadecane
21 Henicosane
34 Tetratriacontane
Analytical Methods for Petroleum Hydrocarbons 69

3.0 DEFINITIONS
3.1 Extractable Petroleum Hydrocarbons (EPH) are defined as all hydrocarbon compounds eluting from toluene through benzo(g,h,i)perylene. EPH is comprised of C8 through C10, >C10 through C12, >C12 through C16, >C16 through C21 and >C21 through
C34 Aliphatic Hydrocarbons and C8 through C10, >C10 through C12, >C12 through C16, >C16 through C21 and >C21 through C34 Aromatic Hydrocarbons. EPH concentration data are reported as the aggregate concentration of the aliphatic
and aromatic hydrocarbon ranges.
3.2 Equivalent Total Petroleum Hydrocarbons (E-TPH) For samples contaminated with petroleum products in the C10 to C34 range, the E-TPH value is equivalent to the
EPH value. For samples contaminated with a petroleum product(s) containing significant concentrations of hydrocarbons lighter and heavier than C10, (e.g.,
contaminated with both gasoline and diesel fuel), the E-TPH value is a summation of the EPH value and the Volatile Petroleum Hydrocarbon (VPH) value. In order to avoid double counting of analytes due to the overlap in the carbon ranges existing
between the two methods, the analyst will report the highest of the two values determined for the overlapping ranges. In those cases where both the VPH and EPH
methods are employed on samples, the analyst may select to quantitate the >C10 through C12 Aliphatic and the >C10 through C12 Aromatic Hydrocarbon ranges by
the EPH method only. Similarly, the analyst may select to quantitate the C8 through C10 Aromatic and C8 through C10 Aliphatic Hydrocarbon ranges by the
VPH method only.
3.3 C8 through C10 Aromatic Hydrocarbons are defined as all of the aromatic hydrocarbon compounds eluting from (and including) toluene through 1,2,3-trimethylbenzene.
3.4 >C10 through C12 Aromatic Hydrocarbons are defined as all aromatic hydrocarbon
compounds eluting after 1,2,3-trimethylbenzene through naphthalene.
3.5 >C12 through C16 Aromatic Hydrocarbons are defined as all aromatic hydrocarbon compounds eluting after naphthalene through acenaphthene.
3.6 >C16 through C21 Aromatic Hydrocarbons are defined as all aromatic hydrocarbons
compounds eluting after acenaphthene through pyrene.
3.7 >C21 through C34 Aromatic Hydrocarbons are defined as all aromatic hydrocarbons compounds eluting after pyrene through benzo(g,h,i,)perylene.
3.8 C8 through C10 Aliphatic Hydrocarbons are defined as all aliphatic hydrocarbon
compounds eluting from (and including) n-octane (n-C8) through n-decane (n-C10).
3.9 >C10 through C12 Aliphatic Hydrocarbons are defined as all aliphatic hydrocarbon compounds eluting after n-decane through n-dodecane (n-C12).
Analytical Methods for Petroleum Hydrocarbons 70

3.10 >C12 through C16 Aliphatic Hydrocarbons are defined as all aliphatic hydrocarbon compounds eluting after n-dodecane through n-hexadecane (nC16)
3.11 >C16 through C21 Aliphatic Hydrocarbons are defined as all aliphatic hydrocarbons
eluting after n-hexadecane through n-henicosane (nC21).
3.12 >C21 through C34 Aliphatic Hydrocarbons are defined as all aliphatic hydrocarbons eluting after n-henicosane through tetratriacontane (nC34).
3.13 Aromatic Hydrocarbon Standard is defined as a 6 component mixture (plus surrogate) of
the aromatic hydrocarbons listed in Table 1. The compounds comprising the Aromatic Hydrocarbon Standard are used to (a) define and establish the windows
for the Aromatic Hydrocarbon ranges, and (b) determine chromatographic response factors that can in turn be used to calculate the collective concentration of aromatic
hydrocarbons in environmental samples within those hydrocarbon ranges.
3.14 Aliphatic Hydrocarbon Standard is defined as a 6 component mixture (plus surrogate) of the normal alkanes listed in Table 2. The compounds comprising the Aliphatic
Hydrocarbon Standard are used to (a) define and establish windows for the aliphatic hydrocarbons ranges, and (b) determine chromatographic response factors that can in turn be used to calculate the collective concentration of aliphatic hydrocarbons in
environmental samples within those hydrocarbon ranges.
3.15 Analytical Batch is defined as a group of samples with similar matrices which are processed as a unit. For Quality Control purposes, if the number of samples in such
a group is greater than 20, then each group of 20 samples or less are defined as separate analytical batches.
3.16 Laboratory Duplicates are defined as split samples taken from the same sampling
container and analyzed separately with identical procedures. The analysis of laboratory duplicates give a measure of the precision associated with laboratory procedures, but not with sample collection, preservation, or storage procedures.
3.17 Field Duplicates are defined as two separate samples collected at the same time and
location under identical circumstances and managed the same throughout field and laboratory procedures. Analyses of field duplicates give a measure of the precision associated with sample collection, preservation and storage, as well as laboratory
procedures.
3.18 E-TPH Duplicates are defined as two separate samples collected at the same time and location, for analysis by both EPH and VPH methods. E-TPH duplicates are taken at locations where significant concentrations of petroleum hydrocarbons lighter and heavier than C10 are likely to be present (e.g., locations contaminated by releases of both gasoline and diesel fuel). The resultant EPH and VPH concentrations are then
summed to determine the Equivalent TPH (E-TPH) concentration.
Analytical Methods for Petroleum Hydrocarbons 71

3.19 Calibration Standards are defined as a series of standard solutions prepared from dilutions of a stock standard solution, containing known concentrations of each analyte and
surrogate compounds of interest.
3.20 Calibration Check Standard is defined as a calibration standard used to periodically check the calibration state of an instrument. The calibration check standard is prepared from the same stock standard solution as calibration standards, and is
generally one of the mid-level range calibration standard dilutions.
3.21 Matrix Spiking Solution is defined as a solution which is generally prepared independently from the calibration standards and which contain known
concentrations of method analytes.
3.22 Laboratory Method Blank is defined as, depending on the matrix of the samples, either reagent water or clean sand spiked with a surrogate standard. The laboratory method blank is treated identically as with samples, exposed to all glassware,
solvents, reagents, and equipment. A laboratory method blank is analyzed with every batch of samples, to determine if method analytes or other interferences are
present in the laboratory environment, reagents, or equipment.
3.23 Laboratory Fortified Blank (LFB) is defined as, depending on the matrix of the samples, either reagent water or clean sand blank fortified with a matrix spiking solution. The LFB is treated and analyzed identically as with samples and blanks and its purpose is to determine whether the methodology is in control and whether the
laboratory is capable of making accurate and precise measurements at the required practical quantitation limits.
3.24 Laboratory Fortified Matrix (LFM) Sample is defined as an environmental sample
which has been spiked with a matrix spiking solution containing known concentrations of method analytes. The LFM sample is treated and analyzed exactly
as with samples and its purpose is to determine whether the sample matrix contributes bias to the analytical results. The background concentration of analytes
in the sample matrix must be determined through the separate analyses of a laboratory or field duplicate, and the measured values in the LFM sample corrected
for background concentrations.
3.25 All other terms are as defined in SW-846, "Test Methods for Evaluating Solid Waste", USEPA, September, 1986, and as amended.
4.0 INTERFERENCES
4.1 Method interferences are reduced by washing all glassware with hot soapy water and then rinsing with warm tap water, acetone, and methylene chloride.
4.2 High purity reagents must be used to minimize interference problems.
Analytical Methods for Petroleum Hydrocarbons 72
4.3 Contamination by carryover can occur whenever high-level and low-level samples are
sequentially analyzed. Whenever an unusually concentrated sample is analyzed, it should be followed by the analysis of a solvent blank to check for cross-
contamination.
4.4 Matrix interferences may be caused by contaminants that are coextracted along with the analytes of interest from the sample. The type and extent of matrix interference will
vary considerably from one source to another depending upon the nature and diversity of the site being sampled and may include certain solvents, halogenated
hydrocarbons and phthalate esters. A silica gel cleanup procedure is used to overcome many of these interferences however, some samples may require additional cleanup procedures/approaches or analytical techniques, e.g. gel
permeation chromatography and/or GC/MS, which are beyond the scope of this method.
5.0 HEALTH AND SAFETY ISSUES
The toxicity and carcinogenicity of each reagent used in this method has not been precisely defined. However, each chemical compound should be treated as a potential health hazard. From
this viewpoint, exposure to these chemicals must be reduced to the lowest possible level by whatever means available. The laboratory is responsible for maintaining a current
awareness file of Occupational Safety and Health Administration (OSHA) regulations regarding the safe handling of the chemicals specified in this method. A reference file of
material safety data sheets (MSDS) should also be made available to all personnel involved in the chemical analysis.
6.0 APPARATUS AND MATERIALS
6.1 The following glassware is used for this method:
6.1.1 1-L amber glass bottles
6.1.2 4 oz. (120 mL) amber glass wide-mouth jars
6.1.3 Vials:
6.1.3.1 autosampler: 2-mL glass vials with Teflon-lined rubber crimp caps
6.1.3.2 10-mL vials with Teflon-lined caps
6.1.4 Glass funnels
6.1.5 2-L Separatory funnels with Teflon stopcock
Analytical Methods for Petroleum Hydrocarbons 73

6.1.6 Kuderna-Danish apparatus including 10-mL concentrator tube, 500-mL Evaporative flask,
& 3-ball Snyder column
6.1.7 Chromatographic column: 250 mm long x 10 mm I.D. with teflon stopcock
6.1.8 Disposable pipets: Pasteur
6.1.9 25-mL graduated cylinder
6.1.10 1-Liter graduated cylinder
6.1.11 100-mL beakers
6.1.12 25-mL volumetric flasks
6.2 Analytical balance: An analytical balance capable of accurately weighing 0.0001 g must be used for weighing standards. A top-loading balance capable of weighing to the
nearest 0.1 g must be used for weighing soil samples.
6.3 A nitrogen blowdown apparatus for use in concentrating extracts.
6.4 Gas Chromatography
6.4.1 Gas Chromatograph: An analytical system complete with temperature programmable gas chromatograph for use with capillary columns is required. The data station must be capable of storing and reintegrating chromatographic data and must
be capable of determining peak areas using a forced baseline projection.
6.4.2 Recommended Column: 30-m long x 0.32-mm I.D., 0.25-µm film DB-5 column (J&W Scientific) or equivalent. This column will allow for the adequate resolution
of alkanes from n-C8 to n-C34.
6.4.3 Detector: A Flame Ionization Detector (FID).
6.4.4 Autosampler: An autosampler capable of making 1 to 2 µL injections is recommended.
6.5 Water bath: heated with a concentric ring covers, capable of temperature control (± 2°C). The bath should be used in a hood.
6.6 Microsyringes: 10-µL, 100-µL, 250-µL, 500-µL, 1000-µL
6.7 Boiling Chips: glass or teflon, precleaned prior to use
6.8 Soxhlet or Sonication extraction apparatus
6.9 Drying oven
Analytical Methods for Petroleum Hydrocarbons 74

7.0 REAGENTS AND STANDARDS
7.1 Reagents
7.1.1 Reagent Water: organic free water
7.1.2 Solvents: hexane, methylene chloride, and acetone; pesticide grade or better. Store away from other solvents.
7.1.3 Sodium sulfate: (ACS) granular, anhydrous. Purify by heating at 400°C for 4 hours in a
shallow tray.
7.1.4 Ottawa and/or masonry sand: free of extractable petroleum hydrocarbons.
7.1.5 Silica gel: 100/200 mesh (Davison Chemical grade 923 or equivalent). Heat to 150-160 o C for several hours before use. Silica Gel Sep-Pak Cartridges: 5 g/20-mL
(Waters, Milford, MA) , if it is demonstated to give equivalent separations.
7.2 Stock Standard Solutions
Prepare stock standard solutions at approximately 1000 ng/µL, or purchase as certified solutions.
7.2.1 Aromatic Hydrocarbon Standard: The Aromatic Hydrocarbon Standard consists of the 6 aromatic compounds listed in Table 1 and a surrogate compound. Prepare stock standard solutions by accurately weighing approximately 0.0100 g of
pure material. Dissolve the material in methylene chloride and dilute to volume in a 10-mL volumetric flask. The use of commercially prepared stock standards solutions is an acceptable alternative to the use of neat
material. The analyst is allowed to prepare a separate surrogate solution.
7.2.2 Aliphatic Hydrocarbon Standard: The Aliphatic Hydrocarbon Standard consists of the 6 normal alkanes listed in Table 2 and a surrogate compound. Prepare stock standard solutions by accurately weighing approximately 0.0100 g of pure material. Dissolve the material in hexane and dilute to volume in a 10-mL
volumetric flask. The use of commercially prepared stock standard solutions is an acceptable alternative to the use of neat material. The analyst
is allowed to prepare a separate surrogate solution.
7.2.3 Petroleum Reference Standard: The use of a Petroleum Reference Standard is recommended for quality control purposes. The Petroleum Reference
Standard consists of an API or commercial diesel, fuel oil, kerosene, and/or lubricating oil. Prepare stock standard solutions by accurately weighing
approximately 0.0100 g of neat product. Dissolve neat product in hexane and dilute to volume in a 10-mL volumetric flask.
Analytical Methods for Petroleum Hydrocarbons 75
7.3 Surrogate Standards
7.3.1 The recommended surrogate standards are chloro-octadecane (COD, available from Restek Corporation, Bellefonte, PA) and ortho-terphenyl (OTP, available from EM Sciences, Gibbstown, NJ). Additional surrogates or surrogates other than those listed above may be used at the discretion of the analyst as long as
their performance in the method is demonstrated as acceptable. Preparation and use of those surrogates will be in the same manner as the listed
surrogate.
7.3.2 The surrogate standard COD is prepared by accurately weighing approximately 0.0100 g of pure material in a 10-mL volumetric flask. Dissolve the material in hexane.
This solution is added to the Aliphatic Hydrocarbon standard.
7.3.3 The surrogate standard OTP is prepared by accurately weighing approximately 0.0100 g of pure material in a 10-mL volumetric flask. Dissolve the material in
methylene chloride. This solution is added to the Aromatic Hydrocarbon standard.
7.3.4 Surrogate Spiking Solution: The recommended surrogate spiking solution is comprised of a
mixture of the COD and OTP surrogate standards. Prepare a surrogate spiking solution which contains the surrogate standards at a concentration of 20 ng/µL in acetone. Each sample, blank, and matrix spike is fortified with
1.0 mL of the surrogate spiking solution.
7.4 Internal Standard
If an internal standard method of calibration is to be used, the recommended internal standard is 5-alpha-androstane (EM Sciences, Gibbstown, NJ).
7.5 Matrix Spike Standard
7.5.1 Four or more analytes from each analyte group (i.e., aromatic and aliphatic hydrocarbons)
are selected for use in a matrix spiking solution, which is prepared independently from the calibration standards.
7.5.2 The recommended spiking solution, consisting of C10, C12, C16 and C21 normal alkanes
and naphthalene, acenaphthene, anthracene, pyrene, benzo(a)pyrene and benzo(g,h,i)perylene, is prepared in acetone at concentrations of 25 ng/µL.
7.5.3 The samples selected as the matrix spike are fortified with 1.0 mL of the matrix spiking
solution.
7.6 Fractionation Check Solution
Analytical Methods for Petroleum Hydrocarbons 76

7.6.1 The Fractionation Check Solution is used to monitor the fractionation efficiency of different batches (lot numbers) of silica gel used to prepare the silica gel hydrocarbon fractionation columns (and Sep-Pak cartridges if used) as well as check for
sample preparation errors (e.g., insufficient/excessive pentane use).
7.6.2 Prepare a Fractionation Check Solution in hexane containing 25 ng/µL each of the n-C8, n-C10, n-C12, n-C16, n-C21, and n-C34 alkanes) and 25 ng/µL each of naphthalene, acenaphthylene, acenaphthene, fluorene, phenanthrene,
anthracene, fluoranthene, pyrene, benzo(a)anthracene, chrysene, benzo(b)fluoranthene, benzo(k)fluoranthene, benzo(a)pyrene, indeno(1,2,3-cd)pyrene and benzo(g,h,i)perylene. The final solution will contain 6 alkanes and 16 PAHs at concentrations of 25 ng/µL each. The use of commercially
available check solutions containing these compounds is acceptable.
8.0 SAMPLE COLLECTION, PRESERVATION, AND HANDLING
8.1 Aqueous samples are collected in 1 liter amber glass bottles with teflon-lined screw caps.
8.2 Soil and sediment samples are collected in 4 oz. (120 mL) amber wide-mouth glass jars with teflon-lined screw caps.
8.3 Aqueous samples must be preserved at the time of sampling by the addition of an acid to
reduce the pH of the sample to less than 2.0. This is accomplished by the addition of approximately 5 mL of 1:1 HCl to a 1 liter sample. Following collection and the
addition of acid, the sample must be cooled to 4°C. 8.4 Soil and sediment samples must be cooled to 4°C immediately after collection.
8.5 A chain of custody form must accompany all aqueous, soil and sediment samples,
documenting the time and date of sampling and any preservative additions.
8.6 Aqueous, soil and/or sediment samples must be extracted within 14 days of collection. If for whatever reason aqueous samples were not preserved at the time of collection
they must be extracted within 7 days of collection. Both aqueous and soil/sediment extracts must be analyzed within 40 days of extraction.
8.7 A summary of sample collection, preservation, and holding times is provided in Table 3.
Analytical Methods for Petroleum Hydrocarbons 77
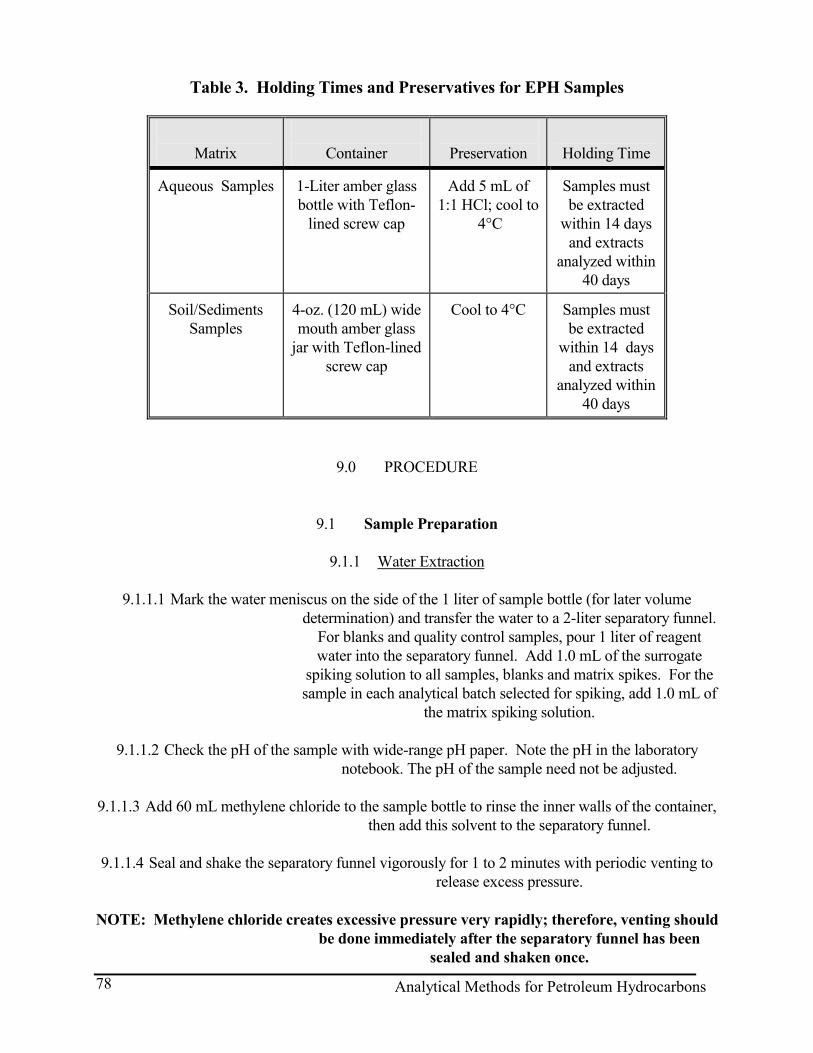
Table 3. Holding Times and Preservatives for EPH Samples
Matrix
Container
Preservation
Holding Time
Aqueous Samples 1-Liter amber glass bottle with Teflon-
lined screw cap
Add 5 mL of 1:1 HCl; cool to
4°C
Samples must be extracted
within 14 days and extracts
analyzed within 40 days
Soil/Sediments Samples
4-oz. (120 mL) wide mouth amber glass
jar with Teflon-lined screw cap
Cool to 4°C Samples must be extracted
within 14 days and extracts
analyzed within 40 days
9.0 PROCEDURE
9.1 Sample Preparation
9.1.1 Water Extraction
9.1.1.1 Mark the water meniscus on the side of the 1 liter of sample bottle (for later volume determination) and transfer the water to a 2-liter separatory funnel.
For blanks and quality control samples, pour 1 liter of reagent water into the separatory funnel. Add 1.0 mL of the surrogate
spiking solution to all samples, blanks and matrix spikes. For the sample in each analytical batch selected for spiking, add 1.0 mL of
the matrix spiking solution.
9.1.1.2 Check the pH of the sample with wide-range pH paper. Note the pH in the laboratory notebook. The pH of the sample need not be adjusted.
9.1.1.3 Add 60 mL methylene chloride to the sample bottle to rinse the inner walls of the container,
then add this solvent to the separatory funnel.
9.1.1.4 Seal and shake the separatory funnel vigorously for 1 to 2 minutes with periodic venting to release excess pressure.
NOTE: Methylene chloride creates excessive pressure very rapidly; therefore, venting should
be done immediately after the separatory funnel has been sealed and shaken once.
Analytical Methods for Petroleum Hydrocarbons 78

9.1.1.5 Allow the organic layer to separate from the water phase for a minimum of 5 minutes. If
the emulsion interface between layers is more than one-third the size of the solvent layer, the analyst must employ mechanical techniques to complete the phase separation. The optimum
technique depends upon the sample and may include stirring, filtration of the emulsion through glass wool, centrifugation, or
other physical methods. Collect the solvent extract in an 500ml Kuderna-Danish (K-D) evaporation flask to which is
attached a 10 mL concentrator tube..
9.1.1.6 Repeat the extraction two more times using fresh portions of solvent and adding the solvent extracts to the KD flask. (Steps 9.1.1.3 to 9.1.1.5) The use of continuous liquid-liquid extraction (EPA method 3520) is an
acceptable alternative to the separatory funnel extraction method described above.
9.1.1.7 For sample volume determination add water to the sample bottle to the level of the
meniscus previously marked then transfer this water to a graduated cylinder and record the volume.
9.1.1.8 Add one clean boiling chip to the K-D flask and attach a three ball Snyder column. Pre-wet the Snyder column by adding about 1 mL of methylene chloride to
the top of the column. Place the K-D apparatus on a hot water bath (80-90°C) so that the concentrator tube is partially immersed in the hot water and the entire lower rounded surface of the flask is
bathed with hot vapor. Adjust the vertical position of the apparatus and the water temperature as required to complete the
concentration in 10 to 20 minutes. At the proper rate of distillation, the balls of the column will actively chatter, but the chambers will not flood. When the apparent volume of liquid
reaches 4-6 mL, remove the K-D apparatus from the water bath and allow it to drain and cool for at least 10 minutes.
9.1.1.9 Solvent exchange the methylene chloride with hexane by adding at least 50 mL of hexane
to the top of the Snyder column. and concentrate the extract to less than 10 mL, as described in Paragraph 9.1.1.8, raising the
temperature of the water bath, if necessary, to maintain proper distillation.
Note: An alternative solvent exchange method is to use the nitrogen blowdown apparatus to
exchange the methylene chloride with hexane. This is accomplished by placing a disposable pipet in the concentrator
tube and adding the small amounts of hexane via the pipet to the bottom of the concentrator tube during the concentration process
in the apparatus.
Analytical Methods for Petroleum Hydrocarbons 79
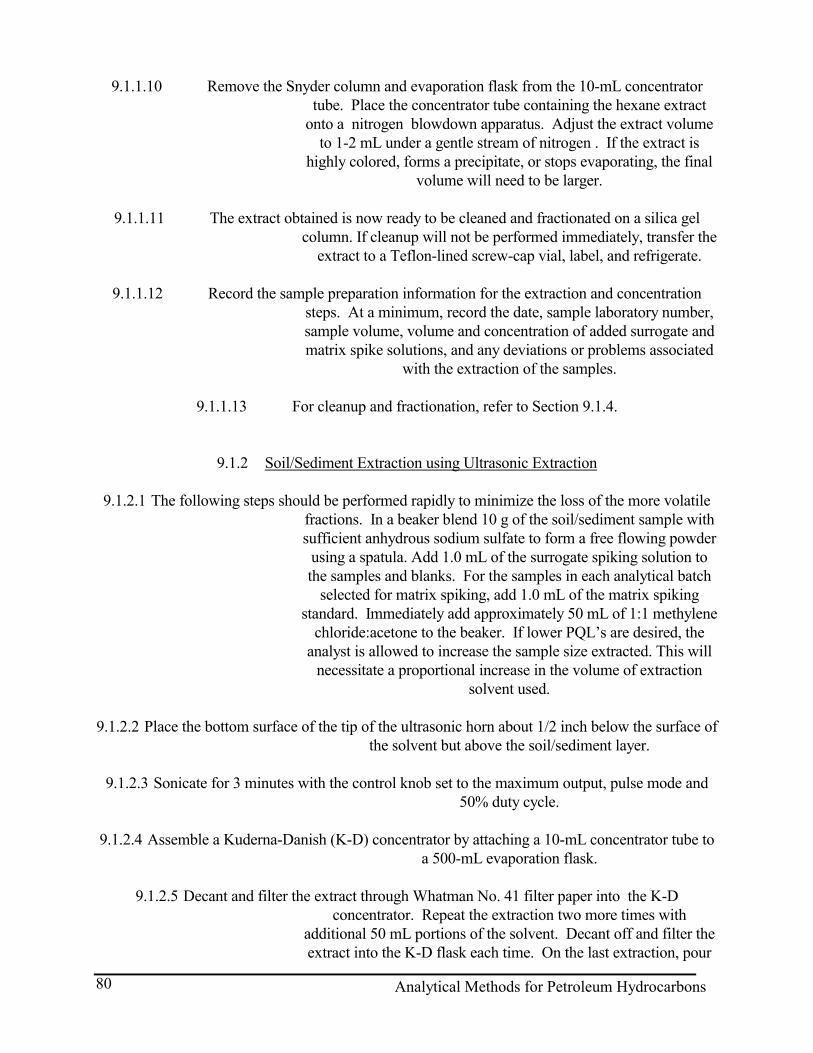
9.1.1.10 Remove the Snyder column and evaporation flask from the 10-mL concentrator tube. Place the concentrator tube containing the hexane extract
onto a nitrogen blowdown apparatus. Adjust the extract volume to 1-2 mL under a gentle stream of nitrogen . If the extract is
highly colored, forms a precipitate, or stops evaporating, the final volume will need to be larger.
9.1.1.11 The extract obtained is now ready to be cleaned and fractionated on a silica gel
column. If cleanup will not be performed immediately, transfer the extract to a Teflon-lined screw-cap vial, label, and refrigerate.
9.1.1.12 Record the sample preparation information for the extraction and concentration
steps. At a minimum, record the date, sample laboratory number, sample volume, volume and concentration of added surrogate and matrix spike solutions, and any deviations or problems associated
with the extraction of the samples.
9.1.1.13 For cleanup and fractionation, refer to Section 9.1.4.
9.1.2 Soil/Sediment Extraction using Ultrasonic Extraction
9.1.2.1 The following steps should be performed rapidly to minimize the loss of the more volatile fractions. In a beaker blend 10 g of the soil/sediment sample with sufficient anhydrous sodium sulfate to form a free flowing powder
using a spatula. Add 1.0 mL of the surrogate spiking solution to the samples and blanks. For the samples in each analytical batch
selected for matrix spiking, add 1.0 mL of the matrix spiking standard. Immediately add approximately 50 mL of 1:1 methylene
chloride:acetone to the beaker. If lower PQL’s are desired, the analyst is allowed to increase the sample size extracted. This will
necessitate a proportional increase in the volume of extraction solvent used.
9.1.2.2 Place the bottom surface of the tip of the ultrasonic horn about 1/2 inch below the surface of
the solvent but above the soil/sediment layer.
9.1.2.3 Sonicate for 3 minutes with the control knob set to the maximum output, pulse mode and 50% duty cycle.
9.1.2.4 Assemble a Kuderna-Danish (K-D) concentrator by attaching a 10-mL concentrator tube to
a 500-mL evaporation flask.
9.1.2.5 Decant and filter the extract through Whatman No. 41 filter paper into the K-D concentrator. Repeat the extraction two more times with
additional 50 mL portions of the solvent. Decant off and filter the extract into the K-D flask each time. On the last extraction, pour
Analytical Methods for Petroleum Hydrocarbons 80
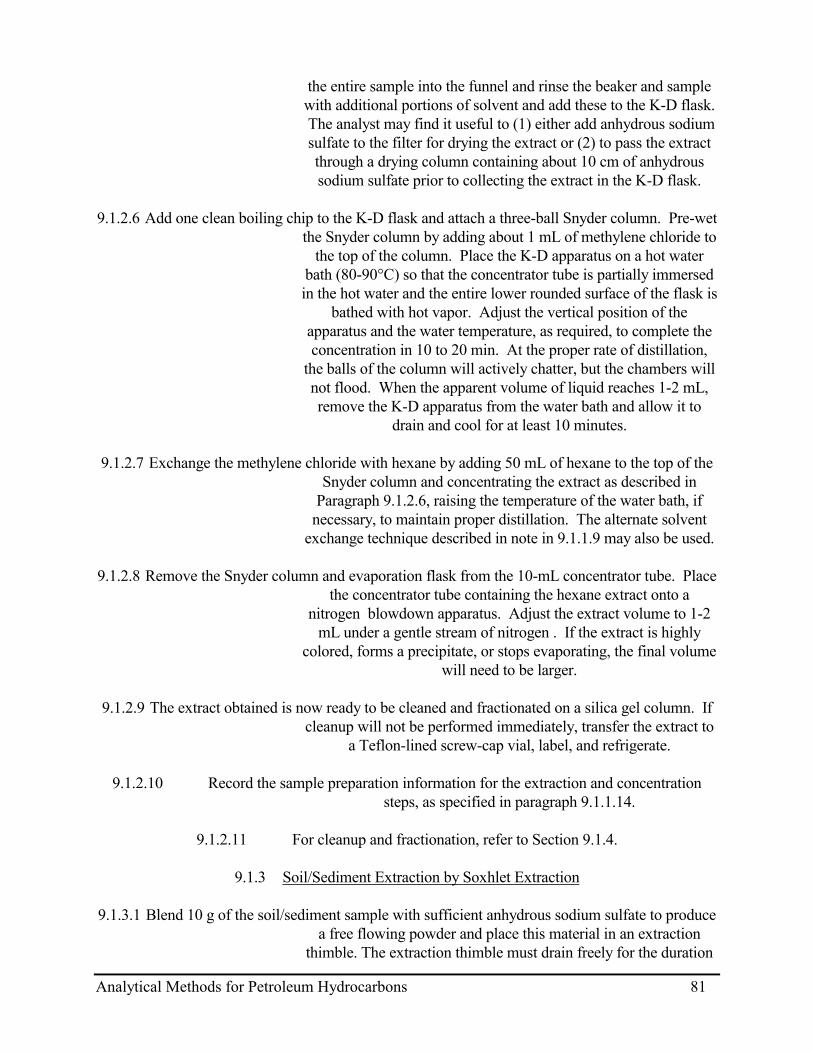
the entire sample into the funnel and rinse the beaker and sample with additional portions of solvent and add these to the K-D flask. The analyst may find it useful to (1) either add anhydrous sodium sulfate to the filter for drying the extract or (2) to pass the extract through a drying column containing about 10 cm of anhydrous sodium sulfate prior to collecting the extract in the K-D flask.
9.1.2.6 Add one clean boiling chip to the K-D flask and attach a three-ball Snyder column. Pre-wet
the Snyder column by adding about 1 mL of methylene chloride to the top of the column. Place the K-D apparatus on a hot water
bath (80-90°C) so that the concentrator tube is partially immersed in the hot water and the entire lower rounded surface of the flask is
bathed with hot vapor. Adjust the vertical position of the apparatus and the water temperature, as required, to complete the concentration in 10 to 20 min. At the proper rate of distillation,
the balls of the column will actively chatter, but the chambers will not flood. When the apparent volume of liquid reaches 1-2 mL, remove the K-D apparatus from the water bath and allow it to
drain and cool for at least 10 minutes.
9.1.2.7 Exchange the methylene chloride with hexane by adding 50 mL of hexane to the top of the Snyder column and concentrating the extract as described in
Paragraph 9.1.2.6, raising the temperature of the water bath, if necessary, to maintain proper distillation. The alternate solvent
exchange technique described in note in 9.1.1.9 may also be used.
9.1.2.8 Remove the Snyder column and evaporation flask from the 10-mL concentrator tube. Place the concentrator tube containing the hexane extract onto a
nitrogen blowdown apparatus. Adjust the extract volume to 1-2 mL under a gentle stream of nitrogen . If the extract is highly
colored, forms a precipitate, or stops evaporating, the final volume will need to be larger.
9.1.2.9 The extract obtained is now ready to be cleaned and fractionated on a silica gel column. If
cleanup will not be performed immediately, transfer the extract to a Teflon-lined screw-cap vial, label, and refrigerate.
9.1.2.10 Record the sample preparation information for the extraction and concentration
steps, as specified in paragraph 9.1.1.14.
9.1.2.11 For cleanup and fractionation, refer to Section 9.1.4.
9.1.3 Soil/Sediment Extraction by Soxhlet Extraction
9.1.3.1 Blend 10 g of the soil/sediment sample with sufficient anhydrous sodium sulfate to produce a free flowing powder and place this material in an extraction
thimble. The extraction thimble must drain freely for the duration
Analytical Methods for Petroleum Hydrocarbons 81

of the extraction period. Add 1.0 mL of the surrogate spiking solution onto the sample. For the samples in each analytical batch
selected for matrix spiking, add 1.0 mL of the matrix spiking solution. If lower PQL’s are desired, the analyst may increase the
quantity of sample extracted.
9.1.3.2 Place approximately 200 mL of methylene chloride into a 250-mL Erlenmeyer or round bottomed flask (depending on the heating source) containing
several clean boiling chips. Attach the flask to the extractor and extract the sample for 8-16 hr.
9.1.3.3 Allow the extract to cool after the extraction is completed.
9.1.3.4 Assemble a Kuderna-Danish (K-D) concentrator by attaching a 10-mL concentrator tube to
a 500-mL evaporation flask.
9.1.3.5 Dry the extract by passing it through a glass powder funnel containing anhydrous sodium sulfate. Collect the dried extract in the K-D concentrator. Wash
the extractor flask and sodium sulfate column with 50 to 75 mL of methylene chloride to complete the quantitative transfer.
9.1.3.6 Add one or two clean boiling chips to the flask and attach a three-ball Snyder column. Pre-
wet the Snyder column by adding about 1 mL of methylene chloride to the top of the column. Place the K-D apparatus on a hot water bath (80-90°C) so that the concentrator tube is partially immersed in the hot water and the entire lower rounded surface of the flask is bathed with hot vapor. Adjust the vertical position of the apparatus and the water temperature, as required, to complete
the concentration in 10 to 20 min. At the proper rate of distillation, the balls of the column will actively chatter, but the chambers will not flood. When the apparent volume of liquid
reaches 1-2 mL, remove the K-D apparatus from the water bath and allow it to drain and cool for at least 10 minutes.
9.1.3.7 Exchange the methylene chloride with hexane by adding 50 mL of hexane to the top of the
Snyder column and concentrating the extract as described in Paragraph 9.1.3.6, raising the temperature of the water bath, if
necessary, to maintain proper distillation. The alternate solvent exchange technique outlined in the note in 9.1.1.9 may also be
used.
9.1.3.8 Remove the Snyder column and evaporation flask from the 10 mL concentrator tube. Place the concentrator tube containing the hexane extract onto a
nitrogen blowdown apparatus. Adjust the extract volume to 1-2 mL under a gentle stream of nitrogen . If the extract is highly
colored, forms a precipitate, or stops evaporating, the final volume will need to be larger.
Analytical Methods for Petroleum Hydrocarbons 82

9.1.3.9 The extract obtained is now ready to be cleaned and fractionated on a silica gel column. If
cleanup will not be performed immediately, transfer the extract to a Teflon-lined screw-cap vial, label, and refrigerate.
9.1.3.10 Record the preparation information for the extraction and concentration steps, as
specified in 9.1.1.14.
9.1.3.11 For cleanup and fractionation, refer to Section 9.1.4.
9.1.3.12 The use of the Accelerated Solvent Extraction (ASE), EPA Method 3545, is an acceptable alternative to either ultrasonic or soxhlet extraction techniques as long as it is demonstrated to achieve comparable
results.
9.1.4 Silica Gel Cleanup and Separation
9.1.4.1 Silica gel is a regenerative adsorbent of amorphous silica with weakly acidic properties. It is produced from sodium silicate and sulfuric acid. Silica gel can be used for column chromatography and is used for separating analytes from interfering compounds of a different chemical
polarity. Silica gel is also used to separate petroleum distillates into aliphatic and aromatic fractions. Before the silica gel
technique can be utilized, the extract solvent must be exchanged to hexane. This procedure may be performed immediately before the extract concentration step is complete by adding hexane to the K-
D (when the volume of remaining methylene chloride is approximately 10 to 15 mL) and reducing the extract volume to 1 to 2 mL. After cooling, disassemble the K-D apparatus, rinsing the joints into the concentrator tube with a minimum of hexane.
With a nitrogen blowdown concentrator, further reduce the extract to a final volume of 2 mL.
9.1.4.2 Prepare a slurry of 10g of activated silica gel in methylene chloride and place this into a 10
mm I.D.x 250 mm long chromatographic column. Tap the column to settle the silica gel and elute the methylene chloride. Add 1 to 2 cm of anhydrous sodium sulfate to the top of the silica gel. Note: The activity of each new batch (lot number) of silica gel must be evaluated prior to its use in this procedure. This requires the use
of the fractionation check solution to insure that there is an efficient separation of the aromatic fraction from the aliphatic
fraction. If necessary, the analyst is allowed to adjust the volumes of the eluants used to facilitate this process.
9.1.4.3 Pre-elute the column with 40 mL of pentane. Let the solvent flow through the column, at a
rate of about 2 mL/minute, until the head of the liquid in the
Analytical Methods for Petroleum Hydrocarbons 83

column is just above the sodium sulfate layer. Close the stopcock to stop solvent flow. Discard this pentane.
9.1.4.4 Open the stopcock and immediately transfer the hexane sample extract onto the silica gel
column. Rinse the concentrator tube with an additional 1-2 mL of hexane and add this to the column as well.
9.1.4.5 Just prior to exposure of the sodium sulfate layer to the air, add 25 mL of pentane to the
column. Collect the eluant in a 250 mL K-D flask to which is attached a 10 mL concentrator tube and label this fraction
"aliphatics". Concentrate and solvent exchange this extract into hexane.
9.1.4.6 Following recovery of the aliphatic fraction and just prior to exposure of the sodium sulfate
layer, elute the column with 50 mL of methylene chloride/pentane (40:60) (v/v) and collect the eluant in a 250 mL K-D flask
equipped with a 10 mL concentrator tube.. Label this fraction "aromatics". Concentrate and solvent exchange this extract into
methylene chloride.
9.1.4.7 Concentrate each fraction to a final volume of 10 mL under a gentle stream of nitrogen from a nitrogen blowdown apparatus.
9.1.4.8 Transfer 1 mL of the fractions to a labeled two-mL glass autosampler vials with teflon-rubber crimp caps for analysis and save the remaining extract in a
teflon-rubber septum screw topped vial. If lower PQL’s are required, the analyst may concentrate the extract to as low as 1 mL
prior to analysis
9.1.5 Proceed with the analysis in accordance with Sections 9.2 through 9.5. Analyze all laboratory method blanks and QC samples under the same conditions as that
used for samples.
9.1.6 If chromatographic responses exceed the linear range of the system, dilute the extract(s) and re-analyze
9.1.7 Determination of Percent Moisture
9.1.7.1 Soil and sediment sample results must be reported on a dry-weight basis. A portion of
sample for moisture determination should be weighed out at the same time as the portion used for hydrocarbon determination.
9.1.7.2 Immediately after weighing a sample for extraction, transfer 5 to 10 g of the sample into a
tared crucible. Dry the sample overnight at 105°C in an oven. After drying remove it from the oven allow it to cool in a
desiccator before reweighing. Calculate the percent moisture of the sample using the equations provided in Section 9.6.3.
Analytical Methods for Petroleum Hydrocarbons 84

9.2 GC Conditions
9.2.1 Suggested Gas Chromatographic Conditions
9.2.1.1 Oven Program: Set oven temperature to 50 °C for 2 minute, then 8°C/min to 320 °C and
hold for 10 minutes.
9.2.1.2 Sample/autosampler injection volume is 1 to 2 µL.
9.2.1.3 Gas Flows: The recommended carrier gas is helium.
9.2.1.3.1 Helium carrier gas flow: 1 to 2 mL/min.
9.2.1.3.2 Air: 400 mL/min.
9.2.1.3.3 Hydrogen: 35 mL/min.
9.2.1.3.4 Make up gas flow: 30 mL/min.
9.2.1.4 Miscellaneous:
9.2.1.4.1 FID temperature, 310 to 320 °C
9.2.1.4.2 Injection port temperature, 290 to 300 °C
9.2.1.4.3 GC operated in splitless mode
9.2.1.4.4 Column head pressure 15.0 psi at 50°C
9.2.1.4.5 Linear velocity approximately 50 cm/sec
9.3 Retention Time Windows
9.3.1 Before establishing windows, make sure the GC system is within optimum operating conditions. Make three injections of the Aromatic and Aliphatic
Hydrocarbon standard mixtures throughout the course of a 72-hr period. Serial injections over less than a 72-hr period may result in retention time
windows that are too tight.
9.3.2 Calculate the standard deviation of the three absolute retention times for each standard.
9.3.3 Plus or minus three times the standard deviation of the absolute retention times for each standard should be used to define the retention time window. However, the
Analytical Methods for Petroleum Hydrocarbons 85

experience of the analyst should weigh heavily in the interpretation of chromatograms.
9.3.4 In those cases where the standard deviation for a particular standard is zero, the laboratory
should substitute the standard deviation of a closely eluting structurally similar compound to develop a valid retention time window.9.3.5 The
laboratory must calculate retention time windows for each standard on each GC column and whenever a new GC column is installed or a portion
removed as part of GC maintenance. This data must be retained by the laboratory.
9.3.6 EPH retention time (Rt) windows for all fractions (carbon ranges and hydrocarbon types)
except the C8 through C10 are defined as beginning 0.1 minutes after the Rt of the beginning marker compound and ending 0.1 minutes after the Rt of
the ending marker compound. Since the first fraction for both the aliphatics and aromatics includes the beginning marker compounds, the Rt windows
for them are defined as beginning 0.1 minutes before the Rt of the beginning marker compound and ends 0.1 minutes after the ending marker
compound.
EPH marker compounds and windows are summarized in Table 4.
Analytical Methods for Petroleum Hydrocarbons 86
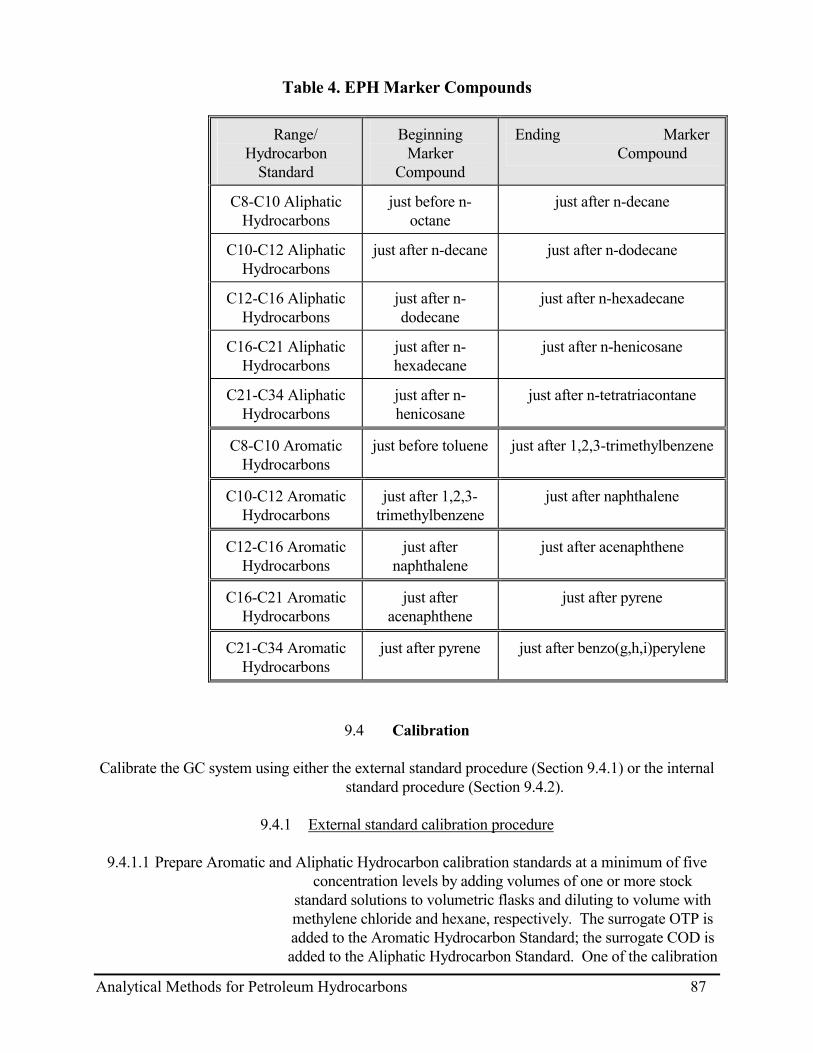
Table 4. EPH Marker Compounds
Range/ Hydrocarbon
Standard
Beginning Marker
Compound
Ending Marker Compound
C8-C10 Aliphatic Hydrocarbons
just before n-octane
just after n-decane
C10-C12 Aliphatic Hydrocarbons
just after n-decane just after n-dodecane
just after n-dodecane
just after n-hexadecane
C16-C21 Aliphatic Hydrocarbons
just after n-hexadecane
just after n-henicosane
C21-C34 Aliphatic Hydrocarbons
just after n-henicosane
just after n-tetratriacontane
C8-C10 Aromatic Hydrocarbons
just before toluene just after 1,2,3-trimethylbenzene
C10-C12 Aromatic Hydrocarbons
just after 1,2,3-trimethylbenzene
just after naphthalene
C12-C16 Aromatic Hydrocarbons
just after naphthalene
just after acenaphthene
C16-C21 Aromatic Hydrocarbons
just after acenaphthene
just after pyrene
C21-C34 Aromatic Hydrocarbons
just after pyrene just after benzo(g,h,i)perylene
C12-C16 Aliphatic Hydrocarbons
9.4 Calibration
Calibrate the GC system using either the external standard procedure (Section 9.4.1) or the internal standard procedure (Section 9.4.2).
9.4.1 External standard calibration procedure
9.4.1.1 Prepare Aromatic and Aliphatic Hydrocarbon calibration standards at a minimum of five
concentration levels by adding volumes of one or more stock standard solutions to volumetric flasks and diluting to volume with methylene chloride and hexane, respectively. The surrogate OTP is added to the Aromatic Hydrocarbon Standard; the surrogate COD is added to the Aliphatic Hydrocarbon Standard. One of the calibration
Analytical Methods for Petroleum Hydrocarbons 87

standards must be at a concentration near, but above, the method detection limit and is used to determine the reporting PQL. In order to report the PQL’s listed in 1.4, given the volume/mass water or soil
extracted of 1 liter or 10 grams and assuming 100% solids on the soil, this standard must be at a 5 ng/uL level. The other concentrations must correspond to the expected range of
concentrations found in real samples or should define the working range of the detector.
9.4.1.2 A collective calibration curve or factor must be established for each hydrocarbon range of
interest. Inject each calibration standard using the technique that will be used to introduce the actual samples into the gas chromatograph (e.g., 1 to 2 µL injections). To calculate the collective CF for C8-C10, >C12-C12, >C12-C16, >C16-C21 and C21-C34 Aromatic Hydrocarbons, tabulate the summation of all peak areas of the
calibration compounds in that range (e.g. C8-C10, toluene and 1,2,4-trimethylbenzene or >C10-C12, naphthalene) against the total mass
injected. Although a forced baseline projection is required for samples and blanks, the analyst is allowed to integrate only the area of the calibration compound(s) to generate the calibration factors.
The ratio of the response to the amount injected, defined as the calibration factor (CF), or range CF, may be calculated for
hydrocarbon ranges at each standard concentration using Equation 1. If the percent relative standard deviation (%RSD) of the calibration factor is equal to or less than 20 % over the working range for the
ranges of interest, as determined using Equation 2, linearity through the origin can be assumed, and the average calibration factor can be
used in place of a calibration curve. The Aliphatic Hydrocarbon collective CF is calculated in the same manner using the aliphatic
standards.
Equation 1: Range Calibration Factor
Range CF = total area of peaksmass injected (ng)
Equation 2: Percent Relative Standard Deviation
%RSD = Stand Dev of 5 CFsMean of 5 CFs
x 100
Analytical Methods for Petroleum Hydrocarbons 88

Note: The area for the surrogates COD and OTP must be subtracted from the area of the range in which they elute (e.g., COD is subtracted from the C16-
C21 Aliphatic Hydrocarbon range.
9.4.1.4 At a minimum, the working calibration curve or calibration factor must be verified at the beginning of each working day and after the final analysis of that day, or after every 20 samples, whichever is more frequent, by the injection of a mid-level calibration standard to verify instrument performance and linearity. If the percent difference (%D) for any range varies from the predicted response by more than ± 20 %, as
calculated using Equation 4, a new calibration curve must be prepared.
Equation 4: Percent Difference (%D)
%D = CF - CFvCF
x 100
where:
CF = Average Calibration Factor from calibration curve.
CFv = Calibration Factor from verification calibration check.
9.4.1.5 The concentrations of hydrocarbon ranges may also be calculated from a calibration curve by use of linear regression analysis.
9.4.2 Internal standard calibration procedure
9.4.2.1 The suggested internal standard for this method is 5-alpha-androstane (EM Science,
Gibbstown, NJ).
9.4.2.2 Prepare Aromatic and Aliphatic Hydrocarbon calibration standards at a minimum of five concentration levels by adding volumes of stock standard solutions to volumetric flasks. The surrogate OTP is added to the Aromatic
Hydrocarbon Standard; the surrogate COD is added to the Aliphatic Hydrocarbon Standard. To each calibration standard, add a known
constant amount of an internal standard. One of the calibration standards must be at a concentration near, but above, the method detection limit and is used to determine the reporting PQL. The other concentrations must correspond to the expected range of concentration found in real world samples or should define the
working range of the detector.
Analytical Methods for Petroleum Hydrocarbons 89
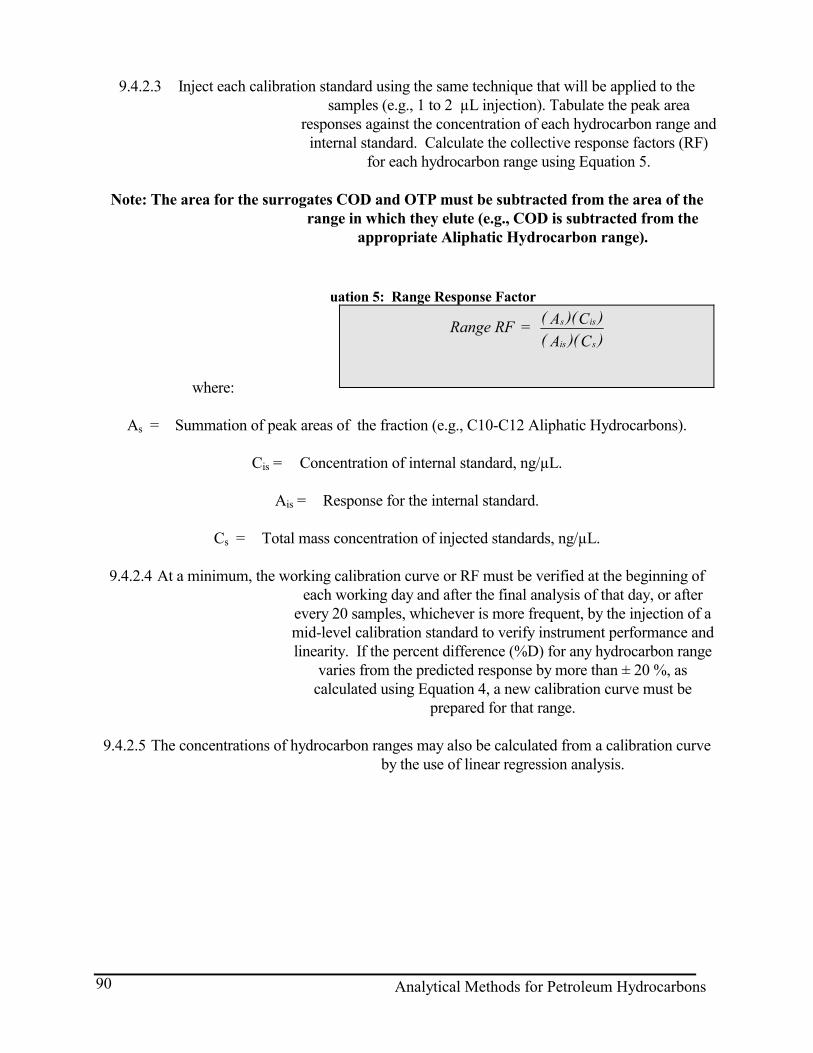
9.4.2.3 Inject each calibration standard using the same technique that will be applied to the samples (e.g., 1 to 2 µL injection). Tabulate the peak area
responses against the concentration of each hydrocarbon range and internal standard. Calculate the collective response factors (RF)
for each hydrocarbon range using Equation 5.
Note: The area for the surrogates COD and OTP must be subtracted from the area of the range in which they elute (e.g., COD is subtracted from the
appropriate Aliphatic Hydrocarbon range).
uation 5: Range Response Factor
Range RF = ( A )(C )( A )( C )
s is
is s
where:
As = Summation of peak areas of the fraction (e.g., C10-C12 Aliphatic Hydrocarbons).
Cis = Concentration of internal standard, ng/µL.
Ais = Response for the internal standard.
Cs = Total mass concentration of injected standards, ng/µL.
9.4.2.4 At a minimum, the working calibration curve or RF must be verified at the beginning of each working day and after the final analysis of that day, or after
every 20 samples, whichever is more frequent, by the injection of a mid-level calibration standard to verify instrument performance and linearity. If the percent difference (%D) for any hydrocarbon range
varies from the predicted response by more than ± 20 %, as calculated using Equation 4, a new calibration curve must be
prepared for that range.
9.4.2.5 The concentrations of hydrocarbon ranges may also be calculated from a calibration curve by the use of linear regression analysis.
Analytical Methods for Petroleum Hydrocarbons 90
9.5 GC Analysis
9.5.1 Samples are analyzed in a set referred to as an analysis sequence. The sequence begins with instrument calibration, or verification of calibration, followed by sample
extracts interspersed with blanks and QC samples. The analytical sequence must end with an acceptable verification calibration standard. If the ending
calibration standard is not acceptable, all samples analyzed after the last acceptable calibration verification must be reanalyzed. If, for whatever
reason, reanalysis is not possible, then the data for those samples must be qualified as an “estimate”.
9.5.2 Aliphatic and aromatic extracts are introduced into the gas chromatograph by slitless
injection.
9.5.3 Inject 1 to 2 µL of the sample extract. Record the volume injected and the resulting peak size in area units.
9.5.4 Confirm the established retention time windows for each hydrocarbon range on a daily
basis. Use the absolute retention time for each analyte as the midpoint of the window for that day. The daily retention time window equals the midpoint
± three times the standard deviation determined in Section 9.3.
9.5.4.1 Validation of GC system qualitative performance must be accomplished by the analysis of standards within the analysis sequence. If any of the standards fall
outside their daily retention time window, the system is out of control. In such cases, the cause of the problem must be determined
and corrected.
9.5.5 When quantifying on a peak area basis by internal or external calibration, peak area integration for the aliphatic and aromatic carbon ranges must be from
baseline (i.e. must include the unresolved complex mixture "hump" areas).
9.6 Calculations
9.6.1 External Standard Calibration
The concentration of each hydrocarbon range in a sample may be determined by calculating the amount of hydrocarbon range compounds injected, from the peak response, using the calibration curve or the calibration factor determined in Section
9.4.
Analytical Methods for Petroleum Hydrocarbons 91

9.6.1.1 Aqueous samples:
The general equation to determine the concentration of a hydrocarbon range in aqueous samples in provided in Equation 6.
w
here:
Equation 6
Concentration (ug / L) = ( A )(A)(V )(D)( A )(V )(V )
x t
s i s
Ax = Response for a hydrocarbon range in the sample, units may be in area counts or peak height.
A = Amount of standard injected, ng.
As = Response for the external standard, units same as for Ax.
Vi = volume of extract injected, µL.
D = Dilution factor: if no dilution was made, D = 1,
dimensionless.
Vt = Volume of total extract, µL.
Vs = Volume of sample extracted, mL.
If a Calibration Factor is used, the concentration of a hydrocarbon range may be calculated using Equation 7.
where:
Range CF = Calibration Factor for hydrocarbon ranges (collective area
count/collective mass).
Equation 7
Conc HC Range (ug / L) = ( A )(V )(D)(V )(V )(Range CF)
X t
i s
Analytical Methods for Petroleum Hydrocarbons 92

9.6.1.2 Nonaqueous samples:
The general equation to determine the concentration of a hydrocarbon range in soil or sediment samples is provided in Equation 8.
Equation 8
Concentration (ug / kg) = ( A )(A)(V )(D)( A )(V )(W )
x t
s i d
where:
Wd = Dry weight of sample extracted, g. (See Equations 12 through 14)
Ax, As, A, Vt, D, and Vi have the same definition as for aqueous samples.
If a Calibration Factor is used, the concentration of specific
hydrocarbon ranges in a soil or sediment sample may be calculated using Equation 9.
Equation 9
Conc HC Range (ug / kg) = ( A )(V )(D)(V )(W )(Range CF)
x t
i d
where:
Range CF = Calibration Factor for a hydrocarbon range (collective area count/collective mass).
9.6.2 Internal Standard Calibration
The concentration of each hydrocarbon range in a sample may be determined by calculating the amount of hydrocarbon range compound(s) injected, from the peak
response, based upon the compound/internal-standard response ratio.
9.6.2.1 Aqueous samples:
The general equation to determine the concentration of a specific hydrocarbon range in aqueous samples is provided in Equation 10.
Analytical Methods for Petroleum Hydrocarbons 93

where:
Ax = Response of the hydrocarbon range being measured, units may be in area counts or in
peak height.
Equation 10
Concentration (ug / L) = ( A )(C )(D)( A )(RF)(V )
x is
is s
Cis = Amount of internal standard added to extract, ng.
D = Dilution factor, if a dilution was made on the sample prior to analysis. If no dilution was
made, D = 1, dimensionless.
Ais = Response of the internal standard, units same as Ax.
RF = Response factor for the hydrocarbon range, dimensionless.
Vs = Volume of aqueous sample extracted, mL.
9.6.2.2 Nonaqueous samples:
The general equation to determine the concentration of a specific or hydrocarbon range in soil or sediment samples is provided in Equation 11.
where:
Wd = Dry weight of sample
extracted, g. (See Equations 12 through 14).
Equation 11
Concentration (ug / kg) = ( A )(C )(D)( A )(RF)(W )
x is
is d
Ax, Cis, D, Ais, and RF have the same definition as for aqueous samples.
9.6.3 Calculation of Dry Weight of Sample
In order to calculate the dry weight of sample extracted (Wd), it is necessary to determine the
moisture content of the soil/sediment sample, using the procedure outlined in Section 9.1.7. Using the data obtained from Section 9.1.7, Wd is
calculated using Equations 12 through 14.
Analytical Methods for Petroleum Hydrocarbons 94

Equation 12
% Moisture = g sample - g dry sampleg sample
X 100
Equation 13
% Dry Solids = (1) - (% Moisture)
Equation 14
dW (g) = (% Dry Solids)(g of extracted sample)
10.0 QUALITY CONTROL
10.1 General Requirements and Recommendations
10.1.1 Each laboratory that uses this method should operate a formal quality control program. The minimum requirements of this program consist of an initial demonstration of laboratory capability and an ongoing analysis of spiked samples to evaluate
and document data quality. The laboratory must maintain records to document the quality of the data generated. Ongoing data quality checks are compared with established performance criteria to determine if the results of analyses meet the performance standards for the method. When results of
sample spikes indicate atypical method performance, a quality control check standard must be analyzed to confirm that the measurements were
performed in an in-control mode of operation.
10.1.2 Hexane or methylene chloride solvent blanks should be run after samples suspected of being highly contaminated to determine if sample carryover has occurred.
10.1.3 At a minimum, for each analytical batch (up to 20 samples), a Laboratory Method Blank,
Laboratory Fortified Blank Spike (Water or Soil), Laboratory Fortified
Analytical Methods for Petroleum Hydrocarbons 95

Matrix Spike, and sample duplicate must be analyzed. For analytical batches with more than 10 samples, the analysis of an additional mid-range
calibration check standard is recommended. The blank and spiked samples must be carried through all stages of the sample preparation and
measurement process.
10.1.4 The recommended sequence of analysis is as follows:
(1) Calibration Standards (initial) or mid-range Calibration Check (Verification) Standard (i.e. daily check of initial calibration)
(2) Laboratory Method Blank (3) Samples
(4) QC Samples (5) Mid-range Calibration Check (Verification) Standard (also recommended after each 10
samples)
10.1.5 It is recommended that a system of control charts be developed to plot surrogate standard recoveries as a function of time. When surrogate recovery from a sample,
blank, or QC sample is less than 50% or more than 150%, check calculations to locate possible errors, the fortifying solution for degradation, and changes in instrument performance. If the cause cannot be determined, the analyst may reanalyze the sample extract, report the surrogate values as outside acceptance limits or, if additional sample is available, re-extract and
reanalyze the sample.
10.2 Minimum Instrument QC
10.2.1 The instrument must be able to achieve adequate separation and resolution of peaks of interest.
10.2.1.1 The n-octane (n-C8) and toluene peaks must be adequately resolved from the solvent
front of the chromatographic run.
10.2.1.2 The surrogates COD and OTP and any internal standards used must be adequately resolved from any individual components in the Aliphatic
Hydrocarbon and Aromatic Hydrocarbon standards.
10.2.2 Retention time windows must be established for each hydrocarbon range of interest each time a new GC column is installed, and must be verified and/or adjusted on
a daily basis. (See Section 9.3)
10.2.3 Calibration curves must be developed based upon the analysis of calibration standards prepared at a minimum of 5 concentration levels. The linearity of
calibration or response factors may be assumed if the percent relative standard deviation (%RSD) over the working range of the curve is less than
or equal to 20 %. Alternatively, if linear regression analysis is used for
Analytical Methods for Petroleum Hydrocarbons 96

quantitation, the correlation coefficient (r) must be at least 0.99. and the percent difference (% D) of the response for any hydrocarbon range from the
predicted response may not vary by more than +/- 20%. (See Section 9.4.)
10.3 Initial and Periodic Method QC Demonstrations
The following must be conducted as an initial demonstration of laboratory capability, prior to the analysis of any samples. Subsequent to this initial demonstration, additional
evaluations of this nature should be conducted on a periodic basis, in response to changes in instrumentation or operations, and/or in response to confirmed or
suspected systems, method, or operational problems.
10.3.1 Accuracy and Precision
To demonstrate initial laboratory capability, analyze a minimum of four replicate reagent water and/or clean sand blanks spiked with the calibration compounds for each range of interest at approximately 50 µg/L and/or 5 mg/kg, respectively.
10.3.1.1 Extract and analyze each replicate according to the procedures described in Section
9.0.
10.3.1.2 Calculate the measured concentrations of each range in all replicates, the mean accuracy (as a percentage of true value) for each compound, and the
precision (as %RSD) of the measurements for each compound.
10.3.1.3 For each compound, the mean accuracy, expressed as a percentage of the true value, should be between 70 % and 130 %. For each compound, the
%RSD must be less than or equal to 20%.
10.3.2 Method Detection Limits (Optional)
Analyze a minimum of seven replicate reagent water and/or clean sand blanks which have been fortified with all analytes of interest at approximately 0.5 to 2 µg/L and/or
1.0 to 5.0 mg/kg, respectively. Extract and analyze each replicate according to the procedures described in Section 9.0. Calculate the Method Detection Limit (MDL) of each analyte using the procedure described in Section 12.0.
10.3.2.1 Water MDLs are determined by extracting 7 to 10 replicates of 1-L reagent water blanks
spiked with OTP, COD and each analyte of interest.
10.3.2.2 Soil/sediment MDLs are determined by extracting 7-10 replicates of 10-g of EPH-free sand blanks spiked with OTP, COD, and each analyte of interest.
Analytical Methods for Petroleum Hydrocarbons 97

10.3.3 Fractionation
To demonstrate the capability of properly fractionating aliphatic and aromatic hydrocarbons in a sample, the analyst must first prepare and analyze the Fractionation Check
Solution specified in Section 7.6.
10.3.3.1 Prepare a silica gel column as outlined in 9.1.4
10.3.3.2 Load 1.0 mL of the Fractionation Check Solution onto column and proceed with the elution and collection of the aliphatic and aromatic fractions as
outline in 9.1.4.
NOTE: The amount of pentane used during the elution/fractionation is critical. Excessive pentane will cause elution of aromatics into the aliphatic
fraction. Insufficient pentane will cause low recoveries of the aliphatic fraction. The volume of pentane and/or methylene chloride/pentane recommended may need to be adjusted to
meet QC limits.
10.3.3.3 Solvent exchange the aliphatic fraction to hexane and the aromatic fraction to methylene chloride. Concentrate each solution to a final volume of 1.0 mL under a gentle stream of nitrogen from an nitrogen blowdown
apparatus.
10.3.3.4 Transfer the final 1.0 mL extracts to two labeled glass auto sampler vials with teflon-lined rubber crimp caps. Analyze by GC/FID (see Section 9.0).
10.3.3.5 For each analyte within the Fractionation Check Solution, the mean accuracy, expressed
as a percentage of the true value, must be between 70 % and 130 %.
10.3.4 Petroleum Reference Standard
As an optional demonstration of the validity and relevance of EPH calibration, analyze a reagent
water and/or clean sand blank spiked with a known concentration of a neat petroleum product.
10.3.4.1 Dilute a Petroleum Reference Standard stock standard solution with acetone to a
concentration of approximately 250 ng/µL. Spike a 1 Liter reagent water blank or 10 g clean sand blank with 1.0 mL of this
spiking solution. Extract and analyze in accordance with the procedures outlined in Section 9.0.
10.3.4.2 Calculate the total concentration of all petroleum hydrocarbons within each range. Add these values together.
Analytical Methods for Petroleum Hydrocarbons 98

10.3.4.3 The concentration calculated in Paragraph 10.3.4.2 is expected to be within +/- 30 % of the known concentration of Petroleum Standard in the reagent
water or sand blank.
10.4 Ongoing Method QC Demonstrations
10.4.1 Each sample, blank, and matrix spike sample must be spiked with the surrogate spiking solution. Required surrogate recovery is 60% to 140%.
10.4.2 At a minimum, with every batch of 20 samples or less the lab must analyze the following:
10.4.2.1 Calibration Check Standard - A mid-range calibration standard, prepared from
the same stock standard solution used to develop the calibration curve, must be analyzed prior to sample analysis to verify the
calibration state of the instrument. For large analytical batches that contain more than 10 samples, the analysis of an additional mid-range calibration check standard is recommended after the
analysis of the tenth sample. If the percent difference (% D) of any compound within a calibration check standard varies from the predicted response by more than 20 %, a new calibration curve
must be prepared. (See Section 9.4)
10.4.2.2 Laboratory Method Blank - A water or soil laboratory method blank is prepared by fortifying a reagent water or clean sand blank with 1.0 mL of the
surrogate spiking solution. Peaks within the retention time windows of any hydrocarbon ranges of interest may not be present
at or above the lowest calculated PQL for any sample within its batch. When determining the PQL of soil method blanks,
incorporate the lowest percent solids value found for any sample within its batch in the calculation.
10.4.2.3 Laboratory Fortified Blank Spike - A water or soil component spike is prepared by fortifying a reagent water or clean sand blank with 1.0 mL of the matrix spiking solution. The spike recovery must be between 70 % and 130 % and, if these values can not be obtained, the analyst
must identify and correct the problem before analyses can continue.
10.4.2.4 Sample duplicates - Sample duplicates may be laboratory duplicates or field duplicates
and the RPD of the duplicate samples should not exceed +/- 25%. The lack of sample homogeneity may contribute to the RPD’s
values for duplicates which exceed this value. Should the values exceed 25% the analyst must report that occurrence.
10.4.2.5 Laboratory Fortified Matrix (LFM) Spike - The water or soil LFM spike is prepared
by fortifying an actual water or soil sample with 1.0 mL of the matrix spiking solution. The purpose of the LFM spike is to
Analytical Methods for Petroleum Hydrocarbons 99

determine whether the sample matrix contributes bias to the analytical results. The background concentrations of the analytes in the sample matrix must be determined in a separate aliquot and
the measured values in the LFM corrected for background concentrations. The corrected concentrations of each analyte
within the LFM spike sample must be within 70 to 130 % of the true value. Should the values determined exceed this range, the
analyst must report that occurrence.
10.4.3 If any of the performance standards specified in Section 10.4 are not met, the problem should be corrected before further samples are analyzed. Exceptions to this are duplicate samples RPD’s and high recoveries for LFM spikes which, due to sample non-homogeneity, may exceed the allowable limits. Any samples run between the last calibration check standard that meet the criteria and one that does not must be reanalyzed. If this is not possible, then the data must
be reported as an "estimated concentration."
11.0 DATA PRODUCTION AND REPORTING
11.1 Sample Analysis
11.1.1 Aliphatic Fraction
11.1.1.1 Determine the total area count for all peaks eluting 0.1 minutes before the retention time (Rt) for C8 to 0.1 minutes after the Rt for C10.
11.1.1.2 Determine the total area count for all peaks eluting 0.1 minutes after the Rt for C10 to 0.1
minutes after the Rt for C12. Determine the total area count of all peaks eluting 0.1 minutes after the Rt for C12 to 0.1 minutes after
the Rt for C16, for all peaks eluting 0.1 minutes after the Rt for C16 to 0.1 minutes after the Rt for C21and for all peaks eluting 0.1 minutes after the Rt for C21 to 0.1 minutes after the Rt for C34. It
is not necessary to identify or quantitate individual aliphatic compounds within these ranges.
11.1.1.3 Determine the peak area count for the surrogate COD and any internal standard used. Subtract these values from the collective area count value within
the appropriate hydrocarbon range(s).
11.1.1.4 Using the equations contained in Section 9.6 or linear regression analysis, calculate the concentrations of C8 through C10, >C10 through C12, >C12
through C16, >C16 through C21 and >C21 through C34 Alipiphatic Hydrocarbon ranges and the surrogate standard COD.
11.1.1.5 The term “all peak areas” must include any unresolved envelope of peaks which elute
within the Rt windows listed above and below for the aliphatic and aromatic fractions.
Analytical Methods for Petroleum Hydrocarbons 100

11.2.1 Aromatic Fraction
11.2.1.1 Determine the total area count for all peaks eluting 0.1 minutes before the retention time
(Rt) for toluene to 0.1 minutes after the Rt for 1,2,3 trimethylbenzene. In the same manner, determine the total area
count for all peaks eluting 0.1 minutes after the Rt for 1,2,3-trimethylbenzene to 0.1 minutes after the Rt for naphthalene, from 0.1 minutes after the Rt for naphthalene to 0.1 minutes after the Rt for acenaphthene, from 0.1 minutes after the Rt for acenaphthene to 0.1 minutes after the Rt for pyrene and 0.1 minutes after the Rt
for pyrene to 0.1 minutes after the Rt for benzo(g.h.i)perylene.
11.2.1.2 Determine the peak area count for the surrogate OTP and any internal standard used.
11.2.1.3 Subtract the peak area value from 11.2.1.2 from the collective area count value for the range effected determined in 11.2.1.1 to calculate the area
count for Aromatic Hydrocarbons ranges.
11.2.1.4 Using the equations contained in Section 9.6 or linear regression analysis, calculate the concentrations of C8 through C10, >C10 through C12, >C12
through C16 , >C16 through C21 and >C21 through C34 Aromatic Hydrocarbons and the surrogate standard COD.
11.3 Data Reporting Format
11.3.1 The following information and data must be reported:
11.3.1.1 The sample matrix (aqueous, soil or sediment);
11.3.1.2 The date(s) the sample was collected, received by the laboratory, extracted, and analyzed;
11.3.1.3 A description of the sample(s) received by the laboratory, relative to the physical
condition of the containers, the temperature of the samples, and use of appropriate preservatives;
11.3.1.4 Moisture content (for soil/sediment samples);
11.3.1.5 The calculated concentrations of C8 through C10, >C10 through C12, >C12 through C16, >C16 through C21 and >C21 through C34 Aliphatic
Hydrocarbons, and C8 through C10, >C10 through C12, >C12 through C16, >C16 through C21 and >C21 through C34 Aromatic
Hydrocarbons.
11.3.1.6 Surrogate recovery (expressed as percent recovery);
Analytical Methods for Petroleum Hydrocarbons 101
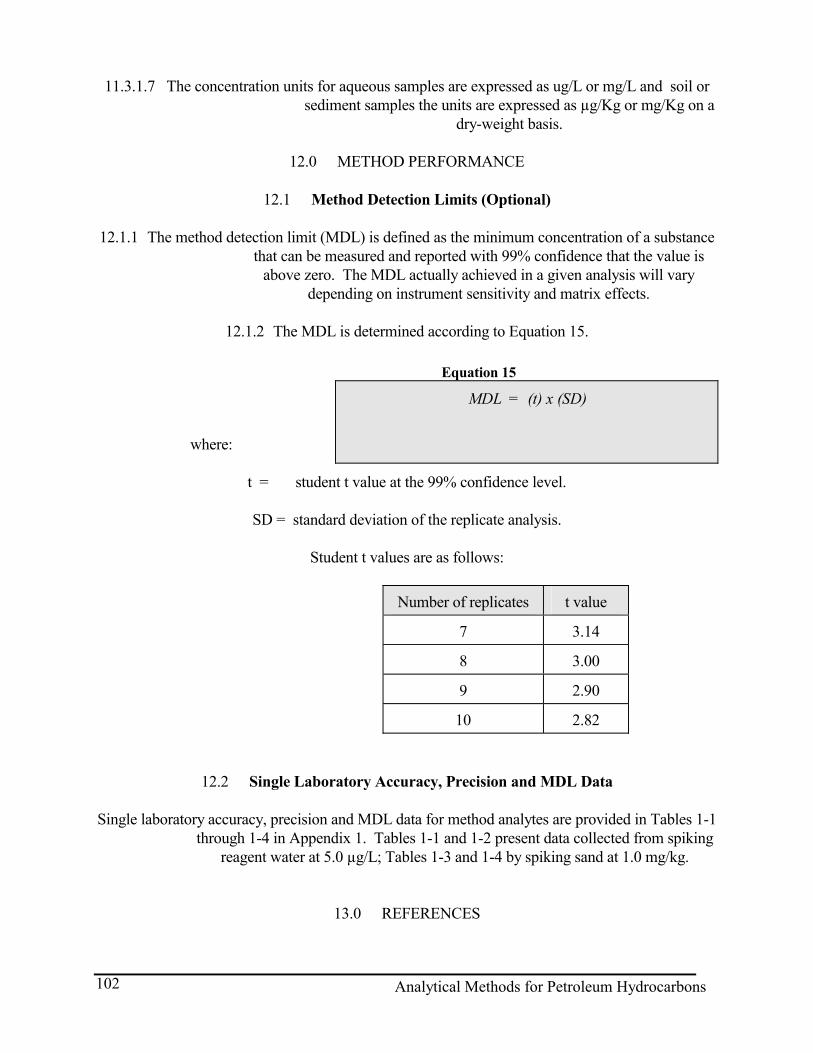
11.3.1.7 The concentration units for aqueous samples are expressed as ug/L or mg/L and soil or sediment samples the units are expressed as µg/Kg or mg/Kg on a
dry-weight basis.
12.0 METHOD PERFORMANCE
12.1 Method Detection Limits (Optional)
12.1.1 The method detection limit (MDL) is defined as the minimum concentration of a substance that can be measured and reported with 99% confidence that the value is
above zero. The MDL actually achieved in a given analysis will vary depending on instrument sensitivity and matrix effects.
12.1.2 The MDL is determined according to Equation 15.
Equation 15
MDL = (t) x (SD)
where:
t = student t value at the 99% confidence level.
SD = standard deviation of the replicate analysis.
Student t values are as follows:
Number of replicates t value
7 3.14
8 3.00
9 2.90
10 2.82
12.2 Single Laboratory Accuracy, Precision and MDL Data
Single laboratory accuracy, precision and MDL data for method analytes are provided in Tables 1-1 through 1-4 in Appendix 1. Tables 1-1 and 1-2 present data collected from spiking
reagent water at 5.0 µg/L; Tables 1-3 and 1-4 by spiking sand at 1.0 mg/kg.
13.0 REFERENCES
Analytical Methods for Petroleum Hydrocarbons 102

1. Massachusetts Department of Environmental Protection and ABB Environmental Services, Inc., Wakefield, MA "Interim Petroleum Policy: Development of Health-based
Alternative to the Total Petroleum Hydrocarbon (TPH) Parameter," August 1994.
2. USEPA, "Measurement of Petroleum Hydrocarbons: Report on Activities to Develop a Manual." Prepared by Midwest Research Institute, Falls Church, VA, under EPA Contract #68-WO-0015, WA No. 4; submitted to USEPA Office of Underground
Storage Tanks, Washington, DC; November 20, 1990.
3. USEPA Federal Register 40 CFR Part 136, Appendix B, "Guidelines Establishing Test procedures for the Analysis of Pollutants," July 1992.
4. USEPA Test Methods for Evaluating Solid Waste (SW-846); Method 3510: Separatory
Funnel Liquid-Liquid Extraction; September 1986.
5. USEPA Test Methods for Evaluating Solid Waste (SW-846); Method 3540: Soxhlet Extraction; September 1986.
6. USEPA Test Methods for Evaluating Solid Waste (SW-846); Method 3630: Silica Gel
Cleanup; September 1986.
7. USEPA Test Methods for Evaluating Solid Waste (SW-846): Method 8000: Gas Chromatography; September 1986.
8. USEPA Test Methods for Evaluating Solid Waste (SW-846); Method 8100: Polynuclear
Aromatic Hydrocarbons; September 1986.
9. Wisconsin Department of Natural Resources, "Modified DRO - Method for Determining Diesel Range Organics," PUBL-SW-141, 1992.
Analytical Methods for Petroleum Hydrocarbons 103
APPENDIX 1
SINGLE LABORATORY ACCURACY, PRECISION, AND
METHOD DETECTION LIMITS (MDL) DATA FOR VPH
Analytical Methods for Petroleum Hydrocarbons 104

(blank page)

Table 1-1. Single Laboratory Accuracy, Precision, and Method Detection Limits (MDLs) for Compounds in Component Standard Spiked Into Reagent Water and Analyzed by the VPH Method
Compound
Spiked Conc.
(µg/L)
Method Accuracya (Mean % Recoveryb)
Method Precisiona (RSDc - %)
MDLa (µg/L)
PIDd FIDe PID FID PID FID
n-Pentane 6.0 98 7.8 1.4
Methyl tert butylether 1.8 77 79 4.8 15 0.21 0.69
Benzene 0.6 82 97 4.9 10 0.08 0.19
Toluene 0.6 79 104 7.3 6.5 0.11 0.13
n-Nonane 2.0 83 8.0 0.42
Ethylbenzene 0.6 77 94 4.2 9.1 0.06 0.16
m- & p-Xylene 1.2 68 85 4.3 6.4 0.11 0.20
o-Xylene 0.6 79 88 16 6.4 0.23 0.11
1,2,3-Trimethylbenzene 0.6 69 89 8.2 6.4 0.11 0.11
Naphthalene 3.6 58 56 16 18 1.0 1.2
2,5-Dibromotoluene (surrogate)
40 88 92 4.9 13
a Based on analysis of seven samples spiked with component standard. b Recovery (%) of spiked concentration.
c RSD = relative standard deviation (%) of mean concentration measured. d PID = photoionization detector. e FID = flame ionization detector.
Analytical Methods for Petroleum Hydrocarbons 106

Table 1-2. Single Laboratory Accuracy, Precision, and Method Detection Limits (MDLs) for Compounds in Component Standard Spiked Into VPH- Free Sand and Analyzed by the VPH Method
Compound
Spiked Conc.
(µg/Kg)
Method Accuracya (Mean % Recoveryb)
Method Precisiona (RSDc - %)
MDLa (µg/Kg)
PIDd FIDe PID FID PID FID
n-Pentane 120 124 6.0 28
Methyl tert butylether 120 70 96 3.1 27 8.1 99
Benzene 60 122 128 3.3 5.4 7.6 13
Toluene 60 139 137 4.8 8.6 13 22
n-Nonane 120 119 4.6 21
Ethylbenzene 60 107 103 4.3 5.0 8.6 9.7
m- & p-Xylene 120 109 104 4.1 5.2 17 20
o-Xylene 60 103 111 3.8 6.6 7.4 14
1,2,3-Trimethylbenzene 60 93 102 5.5 5.3 9.6 10
Naphthalene NDf ND ND ND ND ND ND
2,5-Dibromotoluene (surrogate)
2,000 119 117 8.6 9.7
a Based on analysis of seven samples spiked with component standard. b Recovery (%) of spiked concentration.
c RSD = relative standard deviation (%) of mean concentration measured. d PID = photoionization detector. e FID = flame ionization detector.
f ND = not determined.

Table 1-3. Single Laboratory Accuracy and Precision for Compounds in Component Standard Spiked Into Reagent Water at Concentrations in the Low to Middle End of the Analytical Range and Then
Analyzed by the VPH Method
Compound
Spiked Conc.
(µg/L)
Method Accuracya (Mean % Recoveryb)
Method Precisiona (RSDc - %)
PIDd FIDe PID FID
n-Pentane 40 96 7.7
Methyl tert butylether 60 87 88 4.0 3.9
Benzene 20 99 99 4.4 3.7
Toluene 60 99 99 4.1 4.0
n-Nonane 40 104 10
Ethylbenzene 20 99 99 4.2 4.2
m- & p-Xylene 80 99 99 4.3 4.2
o-Xylene 40 99 99 3.7 3.6
1,23-Trimethylbenzene 40 99 99 4.1 4.0
Naphthalene 40 70 81 4.3 3.2
2,5-Dibromotoluene (surrogate)
40 92 94 5.2 4.6
a Based on analysis of five samples spiked with component standard. b Recovery (%) of spiked concentration.
c RSD = relative standard deviation (%) of mean concentration measured. d PID = photoionization detector. e FID = flame ionization detector.
Analytical Methods for Petroleum Hydrocarbons 108

Table 1-4. Single Laboratory Accuracy and Precision for Compounds in Component Standard Spiked Into VPH-Free Sand at Concentrations in the Low to Middle End of the Analytical Range and Then Analyzed by the VPH Method
Compound
Spiked Conc.
(mg/Kg)
Method Accuracya (Mean % Recoveryb)
Method Precisiona (RSDc - %)
PIDd FIDe PID FID
n-Pentane 2.0 118 1.9
Methyl tert butylether 3.0 100 94 2.4 2.8
Benzene 2.0 119 109 3.0 0.7
Toluene 2.0 118 109 1.7 1.3
n-Nonane ND ND ND ND ND
Ethylbenzene 1.0 121 110 1.4 1.2
m- & p-Xylene 3.0 122 110 1.4 1.1
o-Xylene 2.0 118 107 1.3 1.1
1,2,3-Trimethylbenzene 2.0 115 109 1.4 1.3
Naphthalene 2.0 61 57 11 1.8
2,5-Dibromotoluene (surrogate)
2.0 75 64 9.7 3.3
a Based on analysis of five samples spiked with component standard. b Recovery (%) of spiked concentration.
c RSD = relative standard deviation (%) of mean concentration measured. d PID = photoionization detector. e FID = flame ionization detector.
f ND = not determined.
Analytical Methods for Petroleum Hydrocarbons 109

APPENDIX 2
SUGGESTED VPH DATA REPORTING FORMAT
Analytical Methods for Petroleum Hydrocarbons 110

(blank page)
Analytical Methods for Petroleum Hydrocarbons 111

VOLATILE PETROLEUM HYDROCARBON (VPH) ANALYSIS
Client: Client Sample ID: Date Received: Laboratory Sample ID: Date Analyzed:
Matrix: Date Reported: Percent Moisture:
VPH RESULTS
Parameter Results PQL Units C5-C6 Aliphatics (FID) * C6-C8 Aliphatics (FID) * C8-C10 Aliphatics (FID) * C10-C12 Aliphatics (FID) * C8-C10 Aromatics (PID) C10-C12 Aromatics (PID) C12-C13 Aromatics (PID)
* Excludes any MTBE or BTEX compounds
SURROGATE RECOVERY
Surrogate %Recovery Acceptance Range 2,5-dibromotoluene 80% - 120%
TARGETED VPH ANALYTES
Analyte Results PQL Units Methyl tert butylether
Benzene Toluene
Ethylbenzene p-Xylene * m-Xylene *
o-Xylene Naphthalene
* p and m-xylenes may not be able to be resolved and may be reported as the total of
p and m-xylenes.
Analytical Methods for Petroleum Hydrocarbons 112

Analytical Methods for Petroleum Hydrocarbons 113
APPENDIX 3
SINGLE LABORATORY ACCURACY, PRECISION, AND
METHOD DETECTION LIMIT (MDL) DATA FOR EPH
Analytical Methods for Petroleum Hydrocarbons 114

(blank page)
115
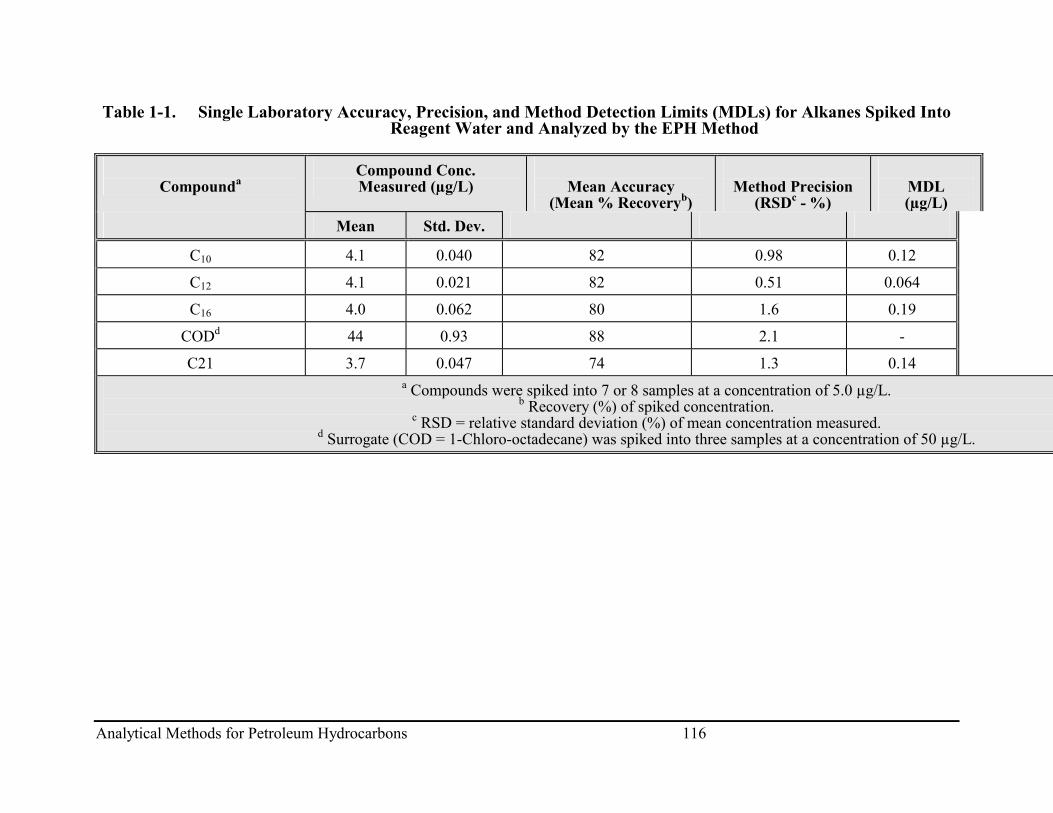
Table 1-1. Single Laboratory Accuracy, Precision, and Method Detection Limits (MDLs) for Alkanes Spiked Into Reagent Water and Analyzed by the EPH Method
Compounda Compound Conc. Measured (µg/L)
Mean Accuracy
(Mean % Recoveryb)
Method Precision
(RSDc - %)
MDL (µg/L)
Mean Std. Dev.
C10 4.1 0.040 82 0.98 0.12
C12 4.1 0.021 82 0.51 0.064
C16 4.0 0.062 80 1.6 0.19
CODd 44 0.93 88 2.1 -
C21 3.7 0.047 74 1.3 0.14a Compounds were spiked into 7 or 8 samples at a concentration of 5.0 µg/L.
b Recovery (%) of spiked concentration. c RSD = relative standard deviation (%) of mean concentration measured.
d Surrogate (COD = 1-Chloro-octadecane) was spiked into three samples at a concentration of 50 µg/L.
Analytical Methods for Petroleum Hydrocarbons 116

Table 1-2. Single Laboratory Accuracy, Precision, and Method Detection Limits (MDLs) for Polynuclear Aromatic Hydrocarbons (PAHs) Spiked Into Reagent Water and Analyzed by the EPH Method
Compounda Compound Conc. Measured (µg/L)
Mean Accuracy
(Mean % Recoveryb)
Method Precision
(RSDc - %)
MDL (µg/L)
Mean Std. Dev.
Naphthalene 5.6 0.088 112 1.6 0.262-Methylnaphthalene 6.4 0.096 128 1.5 0.29
Acenaphthylene 5.6 0.085 112 1.5 0.26Acenaphthene 5.7 0.092 114 1.6 0.28
Fluorene 5.6 0.094 112 1.7 0.28Phenanthrene 5.5 0.097 110 1.8 0.29Anthracene 7.0 0.10 140 1.4 0.31
OTPd 44 1.6 88 3.6 -Fluoranthene 5.7 0.090 114 1.6 0.27
Pyrene 6.1 0.098 122 1.6 0.29Benzo(a)Anthracene 5.9 0.089 118 1.5 0.27
Chrysene 5.8 0.098 116 1.7 0.29Benzo(b)Fluoranthene 6.3 0.082 126 1.3 0.25Benzo(k)Fluoranthene 5.6 0.065 112 1.2 0.20
Benzo(a)Pyrene 6.0 0.075 120 1.2 0.22Indeno(123 cd)Pyrene 5.1 0.17 102 3.3 0.50
Dibenzo(ah)Anthracene 2.8 0.21 56 7.5 0.62Benzo(ghi)Perylene 3.8 0.18 76 4.7 0.54
a Compounds were spiked into 7 or 8 samples at a concentration of 5.0 µg/L. b Recovery (%) of spiked concentration.
c RSD = relative standard deviation (%) of mean concentration measured. d Surrogate (OTP = ortho-Terphenyl) was spiked into three samples at a concentration of 50 µg/L.
Analytical Methods for Petroleum Hydrocarbons 117
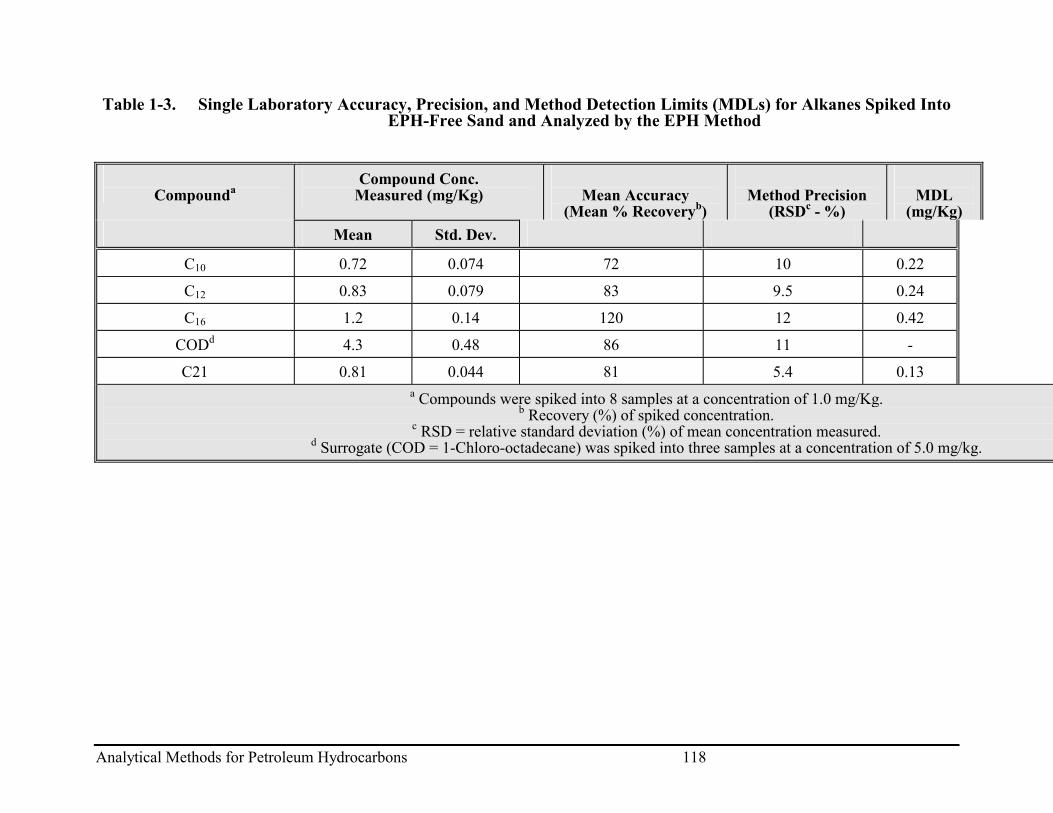
Table 1-3. Single Laboratory Accuracy, Precision, and Method Detection Limits (MDLs) for Alkanes Spiked Into EPH-Free Sand and Analyzed by the EPH Method
Compounda
Compound Conc. Measured (mg/Kg)
Mean Accuracy
(Mean % Recoveryb)
Method Precision
(RSDc - %)
MDL
(mg/Kg) Mean Std. Dev.
C10 0.72 0.074 72 10 0.22
C12 0.83 0.079 83 9.5 0.24
C16 1.2 0.14 120 12 0.42
CODd 4.3 0.48 86 11 -
C21 0.81 0.044 81 5.4 0.13a Compounds were spiked into 8 samples at a concentration of 1.0 mg/Kg.
b Recovery (%) of spiked concentration. c RSD = relative standard deviation (%) of mean concentration measured.
d Surrogate (COD = 1-Chloro-octadecane) was spiked into three samples at a concentration of 5.0 mg/kg.
Analytical Methods for Petroleum Hydrocarbons 118
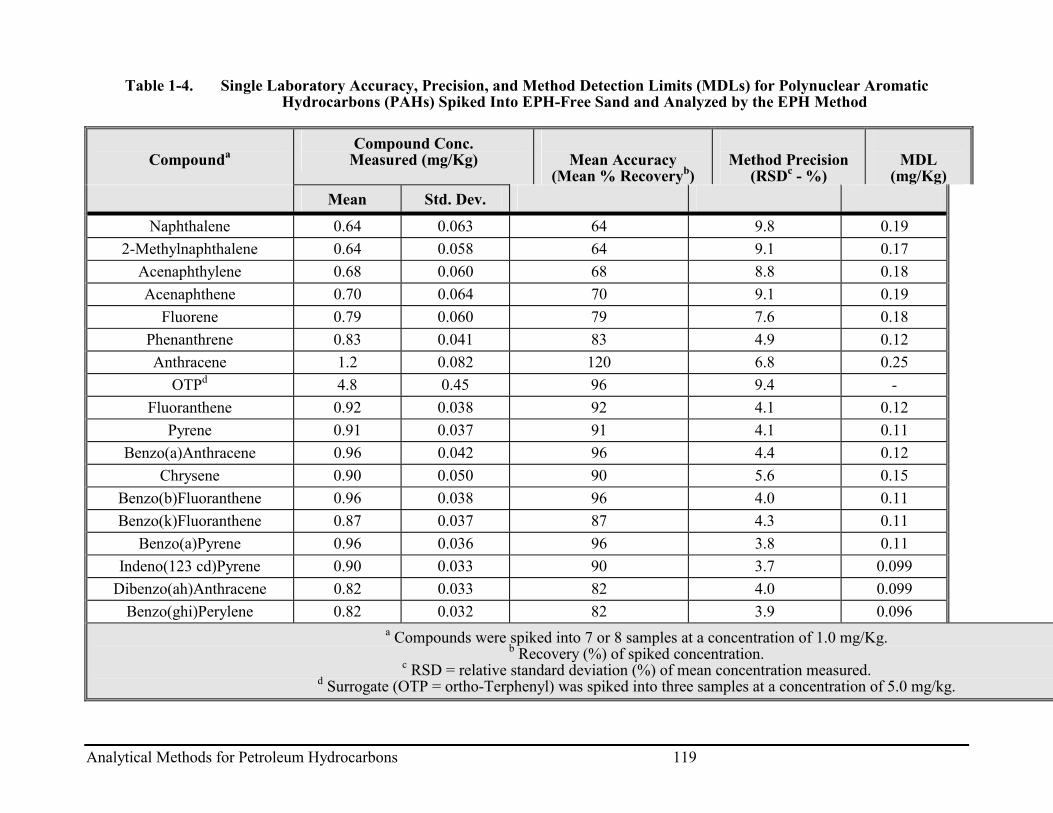
Table 1-4. Single Laboratory Accuracy, Precision, and Method Detection Limits (MDLs) for Polynuclear Aromatic Hydrocarbons (PAHs) Spiked Into EPH-Free Sand and Analyzed by the EPH Method
Compounda Compound Conc.
Measured (mg/Kg)
Mean Accuracy (Mean % Recoveryb)
Method Precision
(RSDc - %)
MDL
(mg/Kg) Mean Std. Dev.
Naphthalene 0.64 0.063 64 9.8 0.192-Methylnaphthalene 0.64 0.058 64 9.1 0.17
Acenaphthylene 0.68 0.060 68 8.8 0.18Acenaphthene 0.70 0.064 70 9.1 0.19
Fluorene 0.79 0.060 79 7.6 0.18Phenanthrene 0.83 0.041 83 4.9 0.12Anthracene 1.2 0.082 120 6.8 0.25
OTPd 4.8 0.45 96 9.4 -Fluoranthene 0.92 0.038 92 4.1 0.12
Pyrene 0.91 0.037 91 4.1 0.11Benzo(a)Anthracene 0.96 0.042 96 4.4 0.12
Chrysene 0.90 0.050 90 5.6 0.15Benzo(b)Fluoranthene 0.96 0.038 96 4.0 0.11Benzo(k)Fluoranthene 0.87 0.037 87 4.3 0.11
Benzo(a)Pyrene 0.96 0.036 96 3.8 0.11Indeno(123 cd)Pyrene 0.90 0.033 90 3.7 0.099
Dibenzo(ah)Anthracene 0.82 0.033 82 4.0 0.099Benzo(ghi)Perylene 0.82 0.032 82 3.9 0.096
a Compounds were spiked into 7 or 8 samples at a concentration of 1.0 mg/Kg. b Recovery (%) of spiked concentration.
c RSD = relative standard deviation (%) of mean concentration measured. d Surrogate (OTP = ortho-Terphenyl) was spiked into three samples at a concentration of 5.0 mg/kg.
Analytical Methods for Petroleum Hydrocarbons 119

APPENDIX 4
SUGGESTED EPH DATA REPORTING FORMAT
Analytical Methods for Petroleum Hydrocarbons 120

Analytical Methods for Petroleum Hydrocarbons 121
(blank page)

EXTRACTABLE PETROLEUM HYDROCARBON (EPH) ANALYSIS
Client: Client Sample ID: Date Received: Laboratory Sample ID: Date Extracted: Matrix: Date Analyzed: Percent Moisture: Date Reported:
EXTRACTABLE PETROLEUM HYDROCARBON (EPH)
Parameter Results PQL Units C8-C10 Aliphatics C10-C12 Aliphatics C12-C16 Aliphatics C16-C21 Aliphatics C21-C34 Aliphatics C8-C10 Aromatics
C10-C12 Aromatics
C12-C16 Aromatics
C16-C21 Aromatics
C21-C34 Aromatics
SURROGATE RECOVERIES
Surrogate %Recovery Acceptance Range Chloro-octadecane (COD) 50% - 150%
Ortho-terphenyl (OTP) 50% - 150%
Analytical Methods for Petroleum Hydrocarbons 122

Analytical Methods for Petroleum Hydrocarbons 123
(blank page)
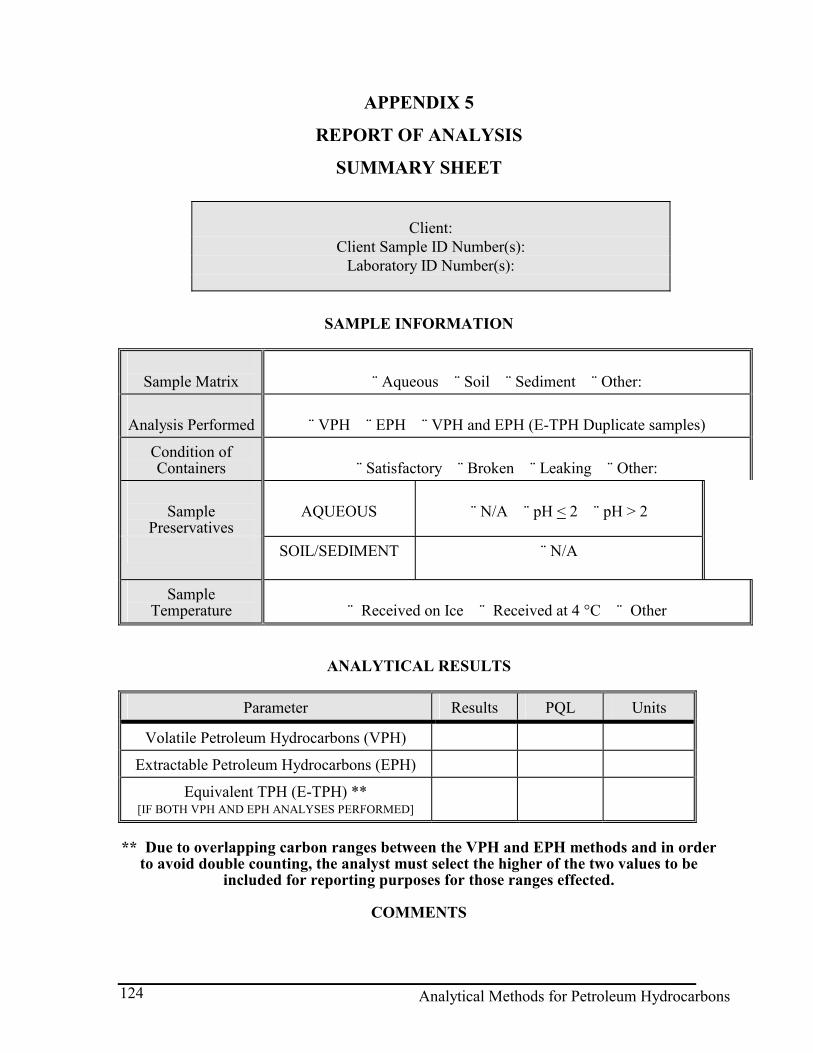
APPENDIX 5
REPORT OF ANALYSIS
SUMMARY SHEET
Client: Client Sample ID Number(s):
Laboratory ID Number(s):
SAMPLE INFORMATION
Sample Matrix
¨ Aqueous ¨ Soil ¨ Sediment ¨ Other:
Analysis Performed
¨ VPH ¨ EPH ¨ VPH and EPH (E-TPH Duplicate samples)
Condition of Containers
¨ Satisfactory ¨ Broken ¨ Leaking ¨ Other:
Sample
Preservatives
AQUEOUS
¨ N/A ¨ pH < 2 ¨ pH > 2
SOIL/SEDIMENT
¨ N/A
Sample Temperature
¨ Received on Ice ¨ Received at 4 °C ¨ Other
ANALYTICAL RESULTS
Parameter Results PQL Units
Volatile Petroleum Hydrocarbons (VPH)
Extractable Petroleum Hydrocarbons (EPH)
Equivalent TPH (E-TPH) ** [IF BOTH VPH AND EPH ANALYSES PERFORMED]
** Due to overlapping carbon ranges between the VPH and EPH methods and in order
to avoid double counting, the analyst must select the higher of the two values to be included for reporting purposes for those ranges effected.
COMMENTS
Analytical Methods for Petroleum Hydrocarbons 124

Analytical Methods for Petroleum Hydrocarbons 125
(blank page)

APPENDIX 6*
Petroleum Product Chromatograms Carburator Cleaner
Automotive Gasoline Mineral Spirits #1 Mineral Spirits #2 JP-4 Jet Fuel (old) JP-4 Jet Fuel (new)
JP-5 Jet Fuel Kerosene
Kerosene (ICP grade) Gasoline and #2 Diesel Oil
Natural Gas Condensate #2 Fuel Oil
#2 Fuel Oil (38% aromatic) (See chromatogram in NWTPH-Dx) #2 Diesel Oil (See chromatogram in NWTPH-Dx)
#2 Diesel Oil and Motor Oil (30w) (See chromatogram in NWTPH-Dx) 2-Cycle Engine Oil #1 2-Cycle Engine Oil #2 2-Cycle Engine Oil #3
Motor Oil (30w) (See chromatogram in NWTPH-Dx) Automatic Transmission Fluid
Power Steering Fluid Transformer Oil (used) Transformer Oil (new)
Hydraulic Fluid #1 Hydraulic Fluid #2 Hydraulic Fluid #3
Mineral Oil #1 Mineral Oil #2 Cutting Oil #1 Cutting Oil #2 Bunker-C #1 Bunker-C #2
CSS-1 (emulsion asphalt) AR-4000 (asphalt cement)
Non-petroleum Product Chromatograms
Turpentine Creosote
Synthetic Motor Oil
* The chromatograms are not available in the “electronic” version. They are included in the printed publication.
Analytical Methods for Petroleum Hydrocarbons 126

Analytical Methods for Petroleum Hydrocarbons 127
Chromatograms: NWTPH-Gx
Gasoline Weathered Gasoline
Naphtha Mineral Spirits #1 Mineral Spirits #2 Mineral Spirits #3
Chromatograms: NWTPH-Dx
#2 Diesel Oil #2 Diesel Oil/Motor Oil
#2 Fuel Oil (38% Aromatic) Kerosene (Deodorized)
Jet Fuel A Bunker C #1 Bunker C #2
Motor Oil 30 Wgt. Mineral Oil (USP)
Hydraulic Fluid Transformer Oil
Gas Oil