analytical method validation
TRANSCRIPT

Analytical
Method Validation
Paul R. Johnson
Campbell University
Pharmaceutical Sciences-PERC
QC/R&D Analytical Lab Manager
1

Guidance for Industry
Q2B Validation of Analytical
Procedures: MethodologyCenter for Drug Evaluation and Research (CDER),
5600 Fishers Lane, Rockville, MD 20857 (Tel) 301-827-4573
http://www.fda.gov/cder/guidance/index.htm
or
Center for Biologics Evaluation and Research (CBER)
1401 Rockville Pike, Rockville, MD 20852-1448,
http://www.fda.gov/cber/guidelines.htm
U.S. Department of Health and Human Services
Food and Drug Administration
November 1996
ICH
http://www.ich.org/products/guidelines/quality/quality-single/article/validation-of-analytical-procedures-text-and-methodology.html
USP 37- NF 32<1225> VALIDATION OF COMPENDIAL PROCEDURES
2

Components of Data Quality
Quality of
analysis
before
sample
analysis
Quality of
analysis
results
immediately
before and
during
sample
analysis
From: AAPS “A Scientific Approach to Analytical Instrument Validation”
3

4
Qualified vs. Validated
Instruments are “Qualified”.
Analytical Instrument Qualification (AIQ)
Processes are “Validated”.
Validation reserved for processes that include
analytical procedures (methods) and software
development (applications).

5
Analytical Instrument Qualification
Documented evidence that an
instrument performs suitably for
its intended purpose and is
properly maintained and
calibrated.

Quality Standards and Regulations
All GMP,GLP and GCP regulations require analytical
equipment to be qualified and calibrated.
Example: FDA cGMP 21 CFR 211.160 i(4) requires
The calibration of instruments, apparatus, gauges, and recording
devices at suitable intervals in accordance with an established
written program containing specific directions, schedules, limits
for accuracy and precision.
Instruments not meeting established specifications shall not be
used.
CFR: Code of Federal Regulations
GMP: Good Manufacturing Practices
GLP: Good Laboratory Practices
GCP: Good Clinical Practices
6

7
Analytical Instruments
Provides Valid Data for Research, Development,
Manufacturing and Quality Control (FDA 21 CFR 210 and 211)
cGMP regulations require equipment supporting the
product testing is “fit for use”.
Demonstrate the precision and accuracy of analytical
Instruments used.
Demonstrate/record training of operators.
AAPS “A Scientific Approach to Analytical Instrument
Validation” March 2003
USP Chapter <1058> 2008
ICH Q7A

8
Instrument Categories
Group A Instruments Simple instruments whose conformance to user requirements is
determined by visual observation.
No independent qualification process is required.
Group B Instruments Instruments whose conformance to user requirements is
performed according to the instruments’ SOP. Conformity assessments are usually unambiguous.
Installation is relatively simple and instrument failure is readily detected by simple observations.
Group C Instruments Complex instruments whose conformance to user requirements
is highly method specific.
Installation can be complicated and may require specialists.
A full-qualification process must be applied to these instruments.

9
Instrument Categories
Group A Instruments Light Microscope
Magnetic Stirrer
Mortar & Pestle
Spatula
Vortex Mixers
Group B Instruments Balances
Incubators
Melting Point Apparatus
Muffle Furnace
Ovens
Group B Instruments (continued) pH Meters
Pipettes
Refractometers
Refrigerators-Freezers
Thermocouples
Thermometers
Titrators
Vacuum Ovens
Viscometers

10
Instrument Categories Group C Instruments
Atomic Absorption Spectrometers
Densitometers
Differential Scanning Calorimeters
Diode-Array/UV-Vis Detectors
Dissolution Apparatus
Electron Microscope
Elemental Analyzers
Flame Absorption Spectrometers
Gas Chromatographs
HPLCs
Group C Instruments (continued) NIRs
FTIRs
Mass Spectrometers
Raman Spectrometers
Micro-plate Readers
UV/Vis Spectrometers
Thermal Gravimetric Analyzers
Inductively Coupled Plasma Emission Spectrometers
X-ray Fluorescence Spectrometers

ValidationFDA-guidelines:
Validation is establishing documented evidence which provides a
high degree of assurance that a specific process will consistently
produce a product meeting its pre-determined specifications and
quality attributes
EU-guidelines
Action of proving, in accordance with GMP-principles that any
procedure, process, equipment, material, activity or system actually
leads to the expected results
11

What Methods to be Validated?
Defined for:
- identification
- quantitative tests for content of impurities
- limit tests for control of impurities
- quantitative tests for active moiety in drug
substances and drug products
Referred to:
- dissolution testing
- particle size determination (drug substance)
12

Components of Data Quality
Analytical Methods Validation
Documented evidence that an analytical method does
what it purports to do and delivers the required
attributes.
Defined procedures from User Groups & Regulatory
Agencies. (See References)
Common Parameters:
Accuracy Sensitivity Specificity
Precision/Repeatability Linearity
Analyte Stability Limits of Detection and Quantitation
13

Recommended Validation characteristics of various Types of Tests
Type of tests/Characteristics IdentificationTesting for impurities
Assay/
Dissolution Specific
Tests
Quantitative Limits
Accuracy - + - + +
Precision-repeatability - + - + +
Precision-Intermediate precision
(Ruggedness)- + - + +
Specificity + - + + +
Detection limit - + + - -
Quantitation Limit - + - - -
Linearity - + - + -
Range - + - + -
Robustness - + - + +
14

Components of Data Quality
System Suitability Tests
Documented evidence that the system works
according to the performance expectations
and criteria set forth in the method at the time
of the analysis
Quality Control Checks
Analyses of reference or calibration
standards.
Documented evidence that results on quality
control check samples yield expected results.
15

What is a Method
A method is a set of instrument
parameters that define the conditions of
the instrument during the time the data is
collected.
16

HPLC Method Mobile Phases: Water, Buffer, Acetonitrile, Methanol
Flow Rate of Mobile Phase (1mL/min)
Composition of Mobile Phase (gradient, isocratic)
Run Time
Column:
Type (C18, C8, CN, NH2, SAX)
Dimensions and particle size (150mm x 4.6mm, 3m)
Temperature (40C)
Detector Type (UV-Vis, ELSD, RI, Fl, MS)
Wavelength for UV or Fl
Other parameters for ELSD or MS)
Injection Volume
17

Typical HPLC MethodMethod Name MA000157X
Column Phenomenex Aqua C18 150x4.6mm 3m
Temp 40°C
Mobile Phase A Water w/0.05%TFA
Mobile Phase B Acetonitrile w/0.05%TFA
Flow Rate 1mL/min
Gradient
0 min 20% B
20 min 80% B
21min 20% B
Run Time 25min
Detector Diode Array UV-Vis
Wavelength 235nm
Injection Volume 5mL
18

Method Validation Linearity (R2 ≥ 0.998)
Range (80% to 120% of nominal concentration)
Accuracy (98% to 102%)
Precision/Repeatability (%RSD ≤1%)
Detection Limit (TBD)
Quantitation Limit (TBD)
Robustness
Ruggedness
Specificity (no co-elution)
System Suitability Testing http://www.fda.gov/cder/guidance/cmc3.pdf
19

Method Validation
LinearityThe linear range of detectability that obeys Beer's Law is dependent on the compound analyzed and detector used. The working sample concentration and samples tested should be in the linear range.
A linear relationship should be evaluated across the range of the analytical method. It may be demonstrated directly on the drug substance (by dilution of a standard stock solution) and/or separate weighings of the drug product components.
20
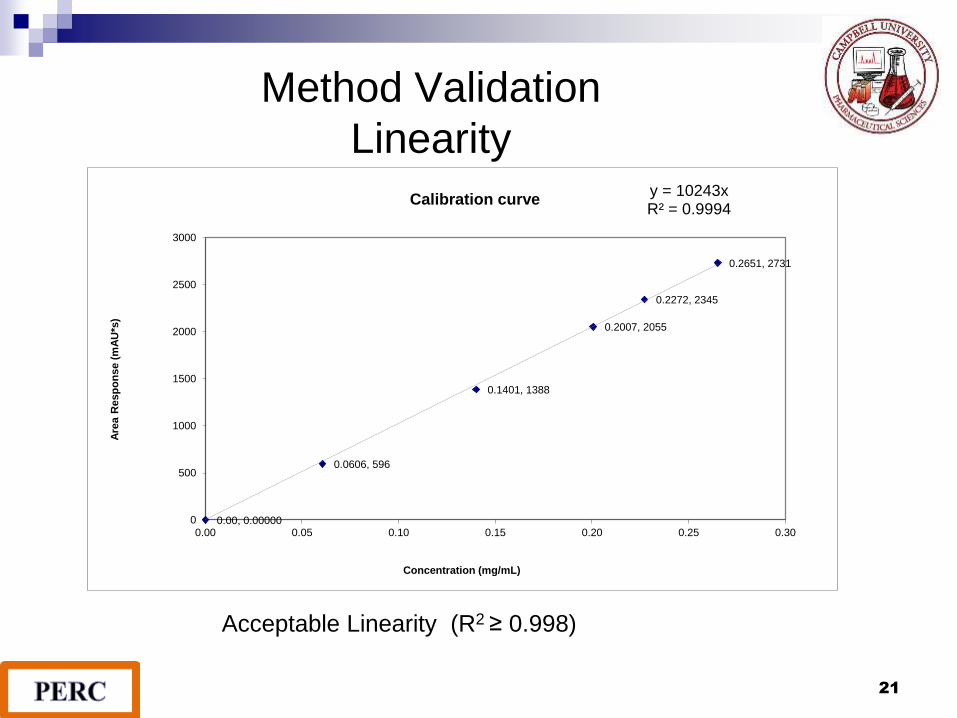
Method Validation
Linearity
21
0.00, 0.00000
0.0606, 596
0.1401, 1388
0.2007, 2055
0.2272, 2345
0.2651, 2731
y = 10243xR² = 0.9994
0
500
1000
1500
2000
2500
3000
0.00 0.05 0.10 0.15 0.20 0.25 0.30
Are
a R
esp
on
se (
mA
U*s
)
Concentration (mg/mL)
Calibration curve
Acceptable Linearity (R2 ≥ 0.998)

Method ValidationRange
Range is the interval between the high and low levels of analyte
studied.
The specified range is normally derived from linearity studies and
depends on the intended application of the method. It is established
by confirming that the analytical method provides an acceptable
degree of linearity, accuracy, and precision when applied to samples
containing amounts of analyte within or at the extremes of the
specified range of the analytical method.
The following minimum specified ranges should be considered.
For the content assay of a drug substance or a finished (drug)
product: From 80 to 120 percent of the product label strength.
For content uniformity: Covering a minimum of 70 to 130 percent of
the product label strength.
For some methods may be much lower depending on needs of
assay
22

Method Validation
Accuracy
Accuracy is the measure of how close the
experimental value is to the true value.
For the drug product, this is performed
frequently by the addition of known amounts of
drug by weight or volume (dissolved in diluent)
to the placebo formulation working in the linear
range of detection of the analyte.
23

Method ValidationAccuracy
Theoretical 0.862 mg/mL
Inj 1 1492.23 (AUC)
Inj 2 1514.52
Inj 3 1484.93
Ave 1497.23
SD 15.41
%RSD 1.03
weight mg/mL 0.855
Accuracy % 99.18%
24
Acceptable Accuracy (98% to 102%)
Method Validation
PrecisionPrecision is the measure of how close the data values are to each other for a number of measurements under the same analytical conditions. ICH has defined precision to contain three components: repeatability, intermediate precision and reproducibility.
Injection Repeatability (Precision)
The precision as measured by multiple injections of a homogeneous sample (prepared solution) indicates the performance of the HPLC instrument under the chromatographic conditions and day tested. The specification, as the coefficient of variation in % or relative standard deviation (RSD), set here will determine the variation limit of the analysis.
25

Injection AUC
Inj 1 843.00
Inj 2 852.84
Inj 3 837.84
Inj 4 836.44
Inj 5 833.81
Inj 6 833.59
Ave 839.59
SD 7.34
%RSD 0.87
Precision Data
26
(Acceptable %RSD ≤1%)

Method Validation
Limit of Detection and Limit of QuantitationThese limits are normally applied to related substances in the drug substance or drug product. Specifications on these limits are submitted with the regulatory impurities method relating to release and stability of both drug substance and drug product.
Detection limit (LOD) is the lowest concentration of analyte in a sample that can be detected, but not necessarily quantified, under the stated experimental conditions.
Quantitation limit (LOQ) is the lowest concentration of analyte in a sample that can be determined with acceptable precision and accuracy under the stated experimental conditions.
27

LOD & LOQ
Method 1: Determine the peak to peak noise on Y scale and
determine from the calibration linearity curve of conc. vs.
height, the concentrations where:
LOD = 3.3 times the noise
LOQ = 10 times the noise
28
AU

LOD & LOQ
Plot Peak Height vs Concentration
29

Method Validation
Robustness
Robustness is a measure of the method's capability to remain
unaffected by small, but deliberate variations in method parameters.
Robustness can be partly assured by good system suitability
specifications. Thus, it is important to set tight, but realistic, system
suitability specifications.
Testing varying some or all conditions, e.g., age of columns, column
type, column temperature, pH of buffer in mobile phase, reagents, is
normally performed.
30

Method Validation
Intermediate Precision (Ruggedness)
Ruggedness evaluates the reliability of the method in a
different environment other than that used during
development of the method. The objective is to ensure
that the method will provide the same results when
similar samples are analyzed once the method
development phase is over.
The method can be tested on multiple days, analysts,
instruments, etc.
31

Method ValidationSpecificity/Selectivity (Peak Purity)
The representative analyte should have no interference from other extraneous
components and be well resolved from them. A chromatogram or profile should be
generated and submitted to show that the extraneous peaks either by addition of
known compounds or samples from stress testing are baseline resolved from the
parent analyte.
Examples of the extraneous peaks are as follows:
For the drug substance or raw material, the related substances to consider are
process impurities from the synthesis process. For the drug product, the related
substances may be impurities present in the active drug, degradation products,
interaction of the active drug with excipients, extraneous components.
Submission of data from stress testing of the drug substance using acid and base
hydrolysis, temperature, photolysis and oxidation.
32

Method ValidationSpecificity
33

The system must be shown to be suitable for performing the
analytical testing during the assay by employing discriminating
limits to assays of the standard or other reference solutions. The
parameters employed function on the entire system as a discrete
unit and are normally determined by empirical testing. No sample
analysis is acceptable unless the requirements of system
suitability have been met.
1. Resolution
2. Precision/Injection repeatability
3. Retention time reproducibility
4. Tailing Factor
5. Standard Accuracy (Check)
System Suitability
34

Typical SequenceSequence
name
vial sample inj/vial type method
1 MP blank 2 blank MA00001
2 Std A 3 Calib MA00001
3 Std B 3 Calib MA00001
4 Stdrepeat 6 Calib MA00001
5 Sample 1 3 sample MA00001
6 Sample 2 3 sample MA00001
7 Sample 3 3 sample MA00001
8 Sample 4 3 sample MA00001
9 Sample 5 3 sample MA00001
10 Sample 6 3 sample MA00001
11 Std A 3 Calib MA00001
12 Sample 7 3 sample MA00001
13 Sample 8 3 sample MA00001
14 Sample 9 3 sample MA00001
15 Sample 10 3 sample MA00001
16 Sample 11 3 sample MA00001
17 Sample 12 3 sample MA00001
18 Std A 3 Calib MA00001
35

ResolutionThe resolution, R,, is a measure of how well two peaks
are separated and is a function of column efficiency, and
is specified to ensure that closely eluting compounds are
resolved from each other.
R of > 2 between the peak of interest and the closest potential
interfering peak (impurity, excipient, degradation product, internal
standard, etc.) is desirable.
36

Precision/Injection Repeatability
The area under the curve (AUC) for replicate
injections of a standard preparation used in the
assay are compared to ascertain whether
requirements for precision are met. Unless
otherwise specified in the individual monograph,
data from five replicate injections of the analyte
are used to calculate the relative standard
deviation, %RSD. Typically the requirement is
1.0%
37

Injection and Retention Time
Reproducibility
AUC Ret. Time
Inj 1 1361.25 3.182
Inj 2 1375.16 3.184
Inj 3 1371.77 3.183
Inj 4 1357.26 3.182
Inj 5 1358.23 3.180
Inj 6 1381.02 3.177
Ave 1367.45 3.181
Std Dev 11.42 0.003
%RSD 0.83% 0.079%
38
≤ 1% ≤ 1%

Tailing Factor
The tailing factor, T, a measure of peak symmetry, is unity for
perfectly symmetrical peaks and its value increases as tailing
becomes more pronounced. As peak asymmetry increases,
integration, and hence precision, becomes less reliable.
T = W0.05 / 2f T 2 is recommended
39
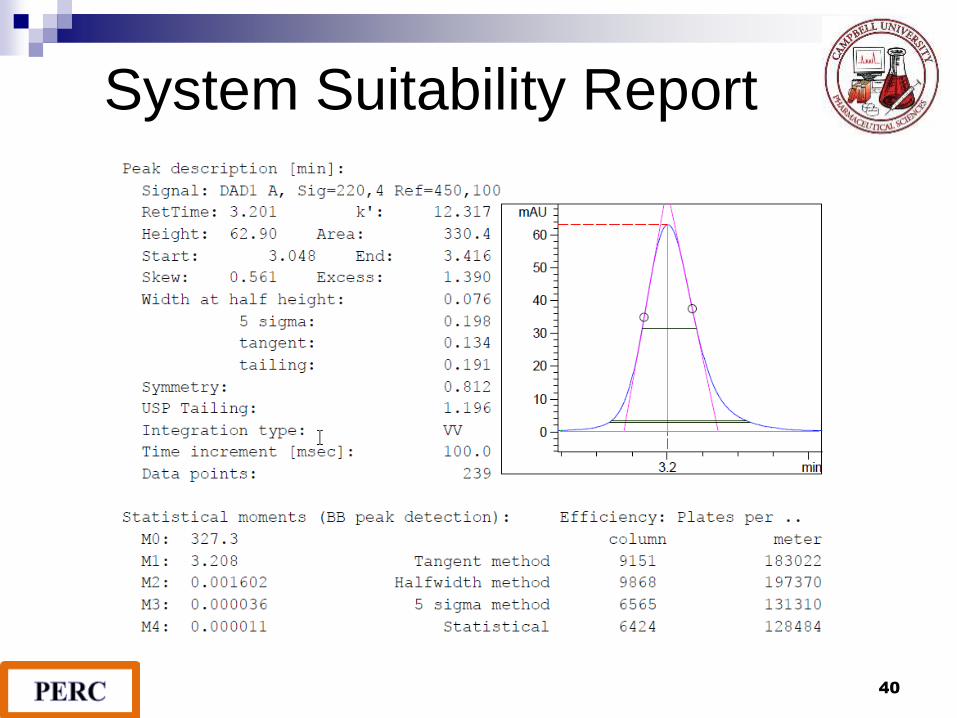
System Suitability Report
40

Standard Check
Conc Std A = Conc Std B
AUC Std A AUC Std B
AUC Std A x Conc Std B = 98.0% to 102.0%
Conc Std A AUC Std B
41

Questions on Method Validation
42