analytical measurement uncertainty - aphl home · analytical measurement uncertainty ... •...
TRANSCRIPT
QMS Quick Learning Activity
www.aphl.org
Analytical Measurement UncertaintyISO/IEC 17025:2005

QMS Quick Learning Activity
Abbreviations and Acronyms• Please see the accompanying Analytical Measurement Uncertainty
Learning Aid, including Dictionary of Terms
• FDA-Food and Drug Adminstration• SOP-Standard Operating Procedure• EPA-Environmental Protection Agency• NIOSH-National Institute for Occupational Safety and Health• OSHA-Occupational Safety and Health Administration• ASTM-American Society for Testing and Materials Internationa• AIHA-American Industrial Hygiene Association
2
QMS Quick Learning Activity
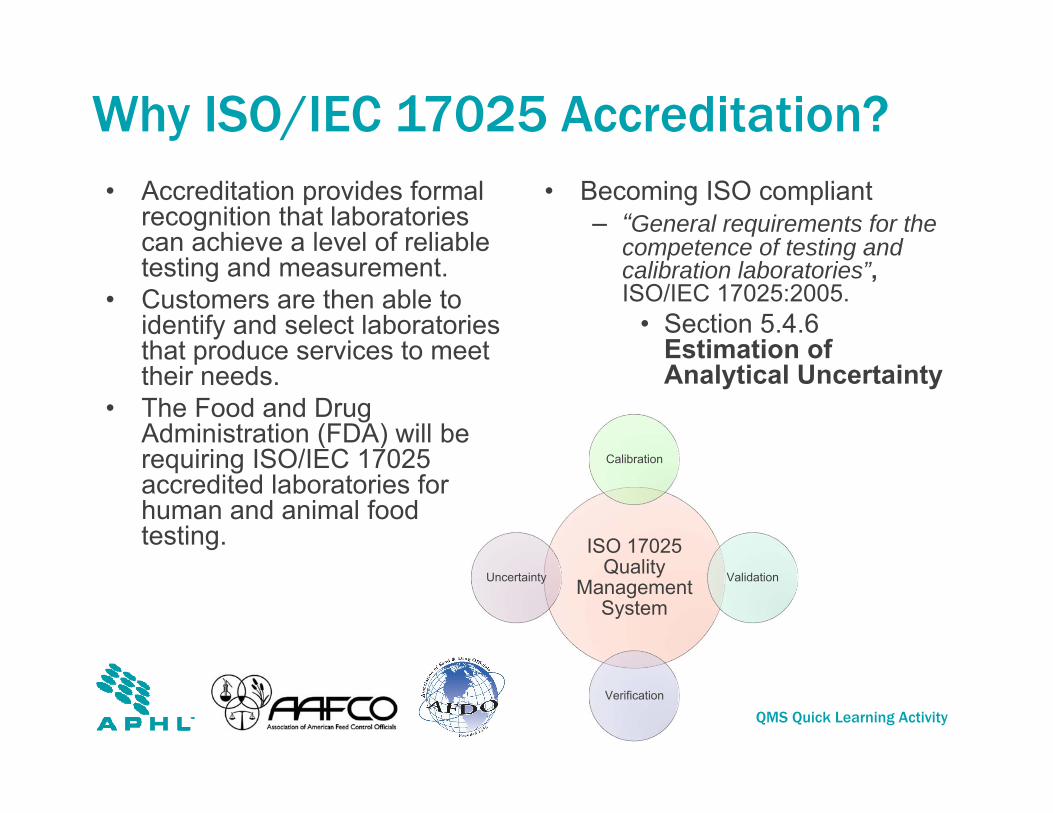
Why ISO/IEC 17025 Accreditation?• Accreditation provides formal
recognition that laboratories can achieve a level of reliable testing and measurement.
• Customers are then able to identify and select laboratories that produce services to meet their needs.
• The Food and Drug Administration (FDA) will be requiring ISO/IEC 17025 accredited laboratories for human and animal food testing.
• Becoming ISO compliant– “General requirements for the
competence of testing and calibration laboratories”, ISO/IEC 17025:2005.
• Section 5.4.6 Estimation of Analytical Uncertainty
ISO 17025 Quality
Management System
Calibration
Validation
Verification
Uncertainty
QMS Quick Learning Activity
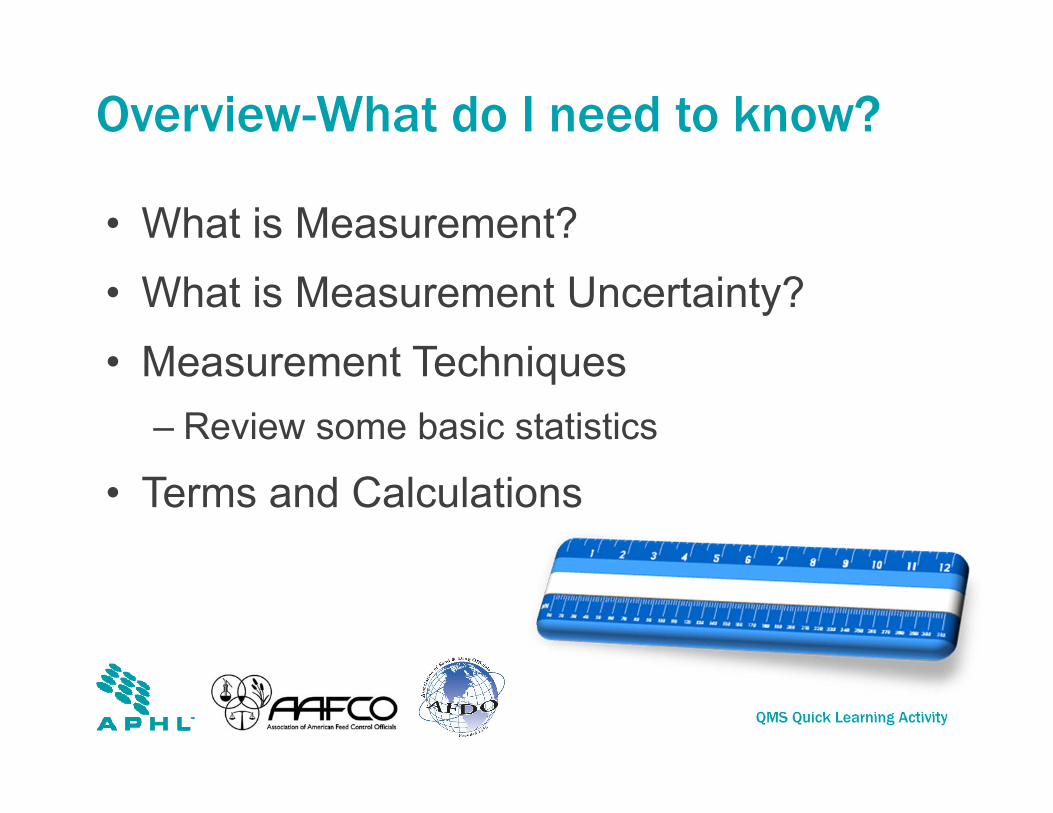
Overview-What do I need to know?
• What is Measurement? • What is Measurement Uncertainty?• Measurement Techniques
– Review some basic statistics
• Terms and Calculations
QMS Quick Learning Activity
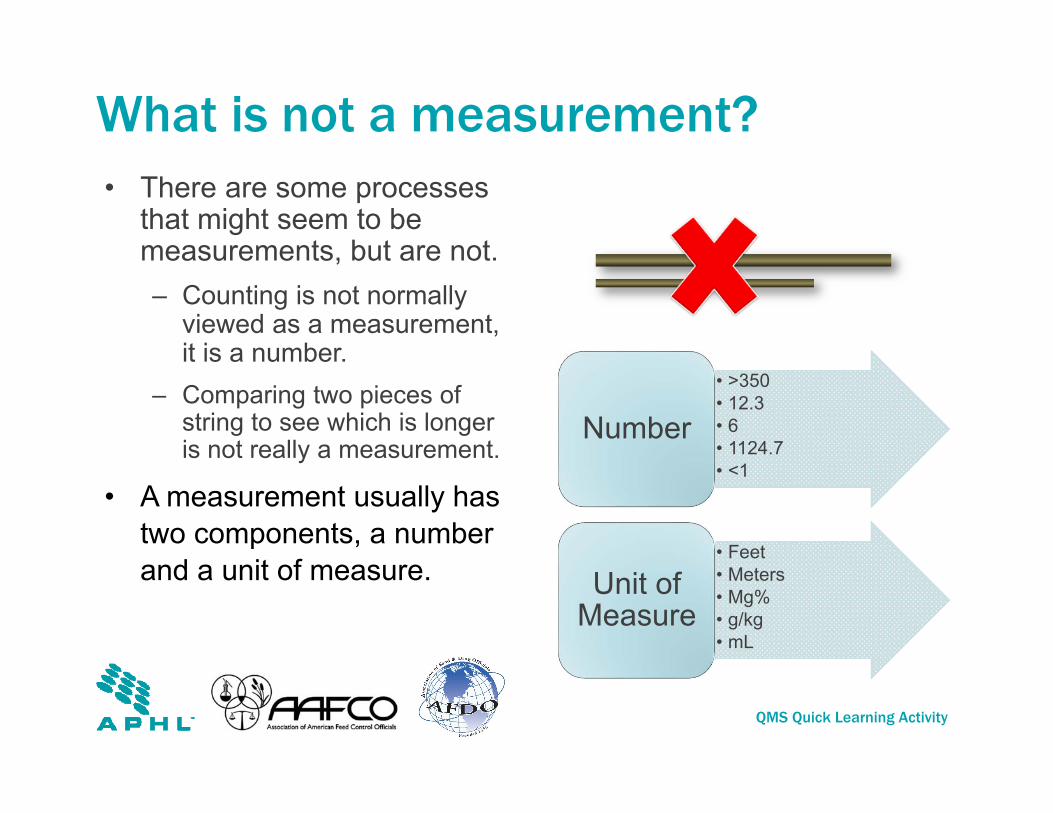
What is not a measurement?• There are some processes
that might seem to be measurements, but are not. – Counting is not normally
viewed as a measurement, it is a number.
– Comparing two pieces of string to see which is longer is not really a measurement.
• A measurement usually has two components, a number and a unit of measure.
• >350• 12.3• 6• 1124.7• <1
Number
• Feet• Meters• Mg%• g/kg• mL
Unit of Measure

QMS Quick Learning Activity
What is a Measurement?
• A set of operations that determine the value of a quantity.• It tells us about a property of something (how heavy, hot, or long an
object is).• They are made using an instrument (e.g., rulers, weighing scales,
stopwatches, thermometers, etc.)• A measurement is taken by comparing an unknown quantity, such
as the length of the stick we looked at previously… with a standard unit like a ruler.
• The instruments used to make these comparisons can be simple ones, like rulers, scales, stopwatches and thermometers or they can be complex scientific instruments.
Measurement is:
QMS Quick Learning Activity
What is the Purpose of Measurement?
• To obtain a value (result).• To provide information about a quantity of
interest—a measurand.• Definition of Measurand:
– A particular quantity (of something) being measured.
• Use “analyte” to refer to the substance being measured, not the quantity.
7
QMS Quick Learning Activity
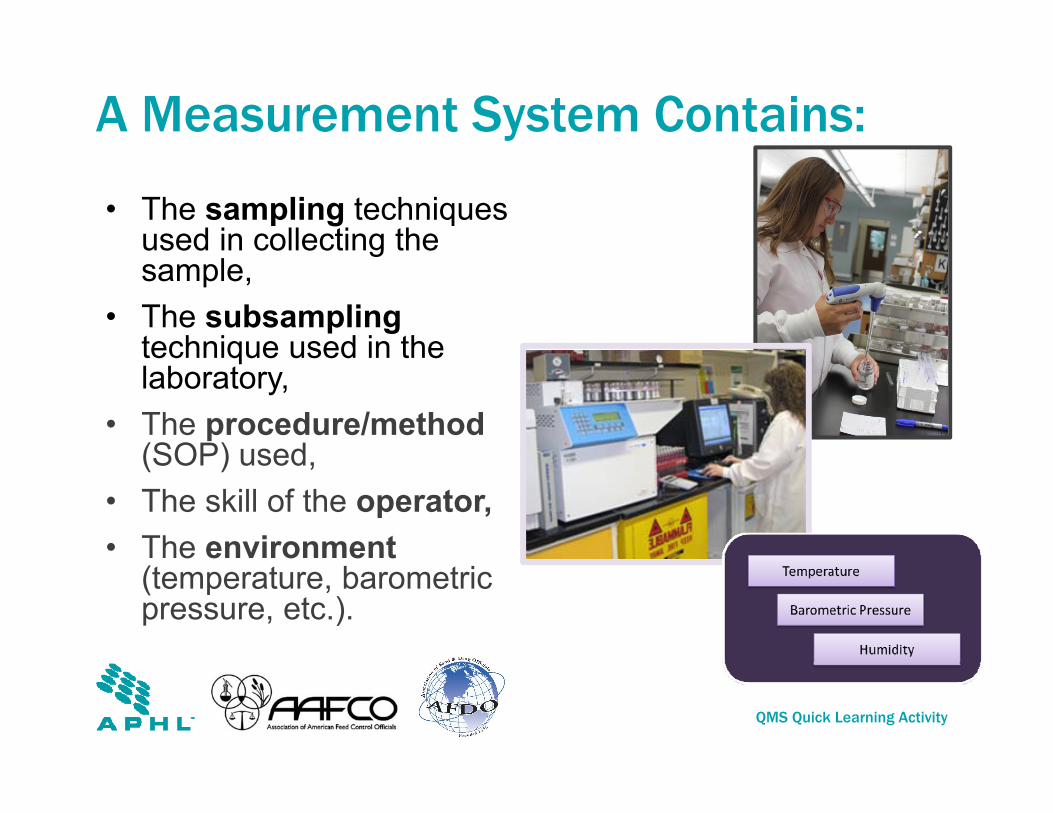
A Measurement System Contains:
• The sampling techniques used in collecting the sample,
• The subsamplingtechnique used in the laboratory,
• The procedure/method(SOP) used,
• The skill of the operator,• The environment
(temperature, barometric pressure, etc.).

QMS Quick Learning Activity
Comparing Unknown to Known
• No matter what instrument or unit of measure we use or how carefully we perform the measurement, we are still making a comparison.
• A comparison cannot ever be perfect, even with very precise instruments. So all measurements inherently include some degree of error.
QMS Quick Learning Activity
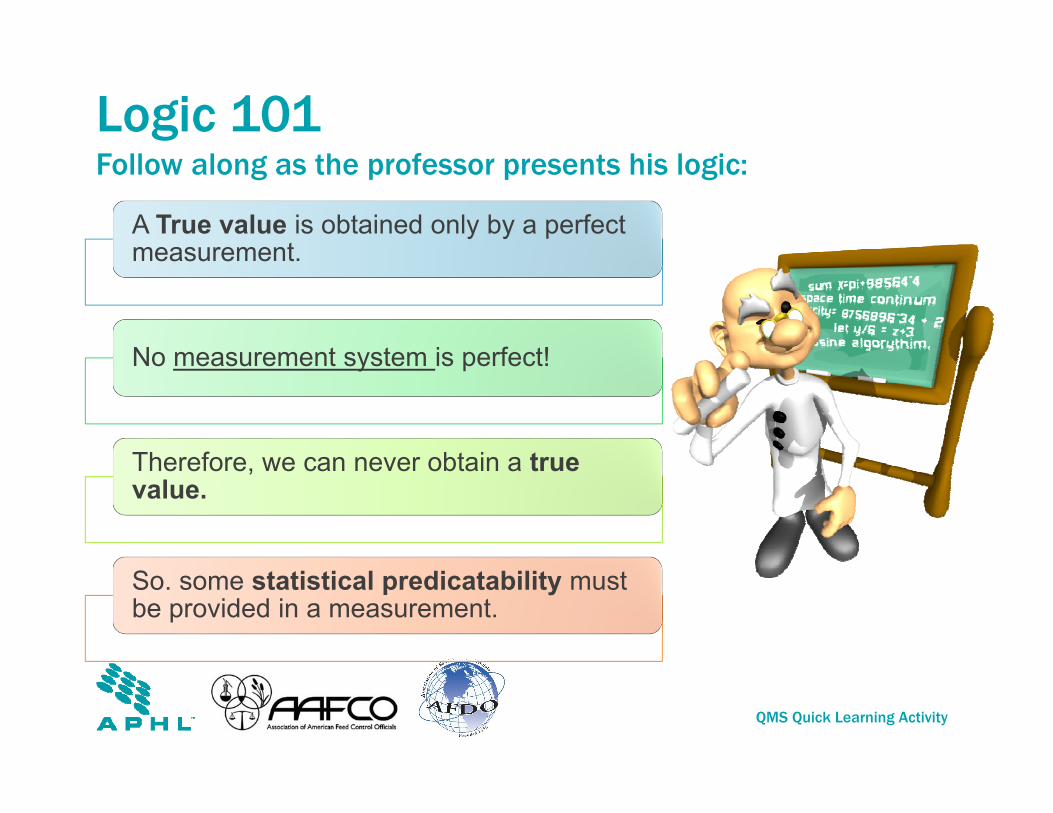
Logic 101Follow along as the professor presents his logic:
A True value is obtained only by a perfect measurement.
No measurement system is perfect!
Therefore, we can never obtain a true value.
So. some statistical predicatability must be provided in a measurement.
QMS Quick Learning Activity
What is Measurement Uncertainty (MU)?
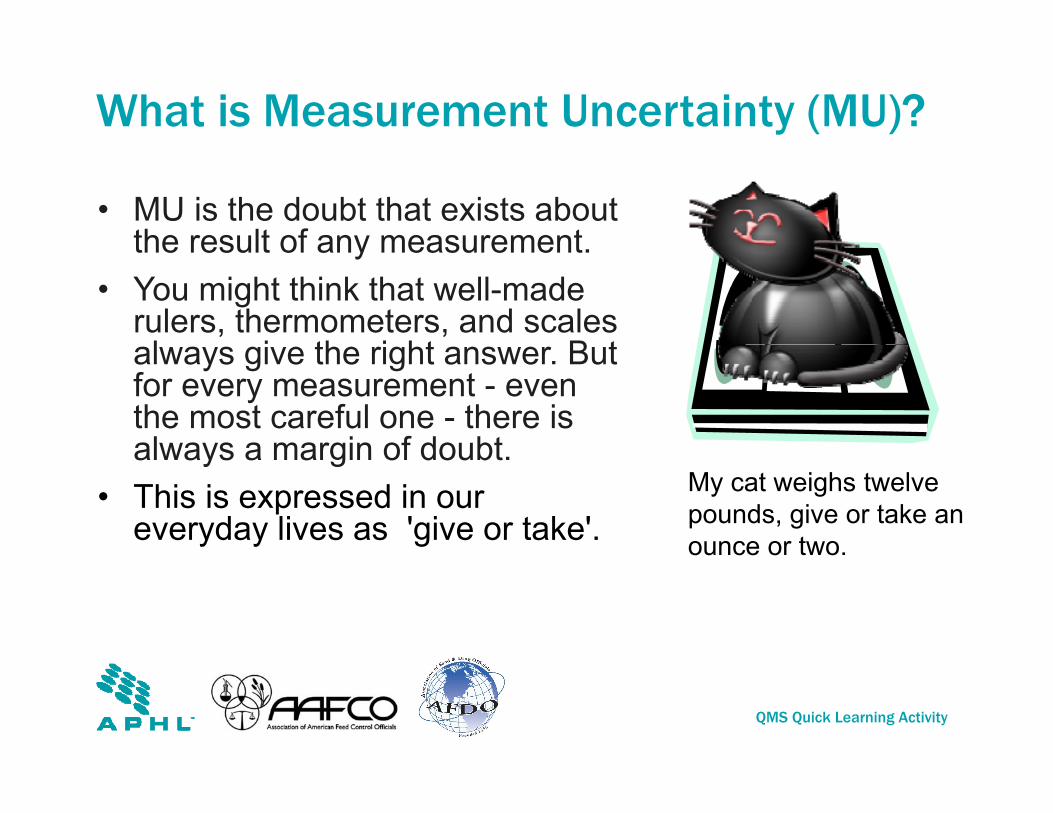
• MU is the doubt that exists about the result of any measurement.
• You might think that well-made rulers, thermometers, and scales always give the right answer. But for every measurement - even the most careful one - there is always a margin of doubt.
• This is expressed in our everyday lives as 'give or take'.
My cat weighs twelve pounds, give or take an ounce or two.
QMS Quick Learning Activity
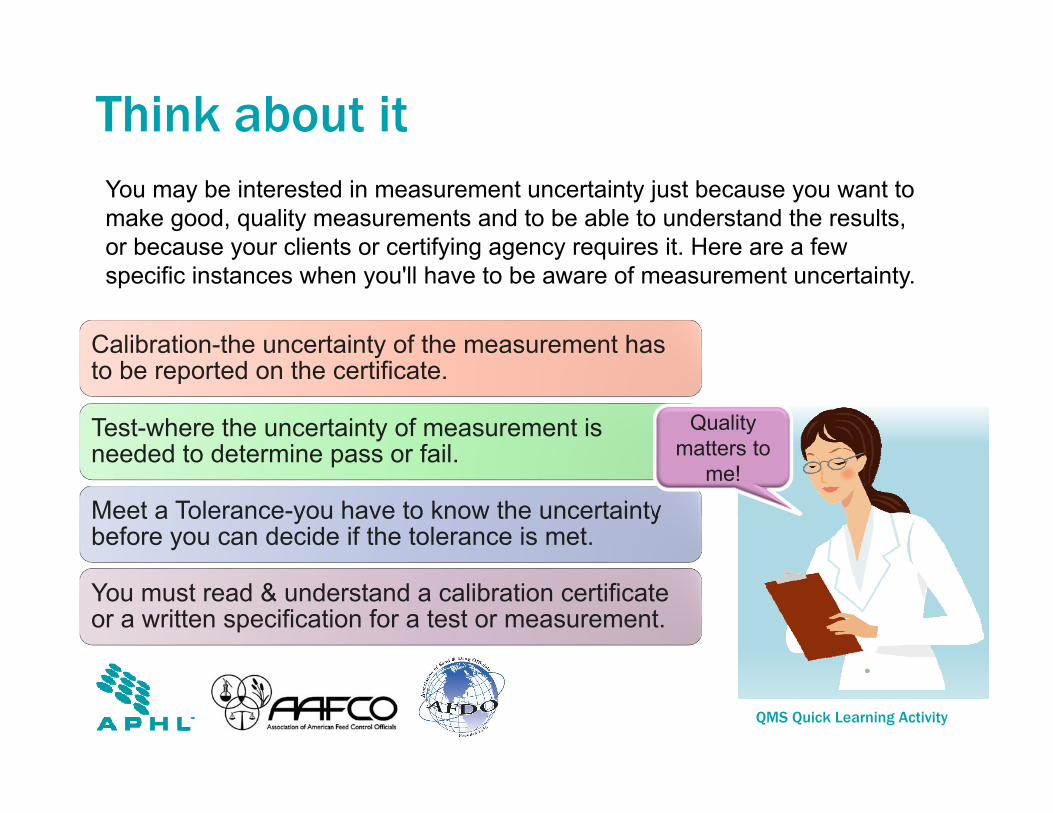
Think about it
Calibration-the uncertainty of the measurement has to be reported on the certificate.
Test-where the uncertainty of measurement is needed to determine pass or fail.
Meet a Tolerance-you have to know the uncertainty before you can decide if the tolerance is met.
You must read & understand a calibration certificate or a written specification for a test or measurement.
Quality matters to
me!
You may be interested in measurement uncertainty just because you want to make good, quality measurements and to be able to understand the results, or because your clients or certifying agency requires it. Here are a few specific instances when you'll have to be aware of measurement uncertainty.
QMS Quick Learning Activity
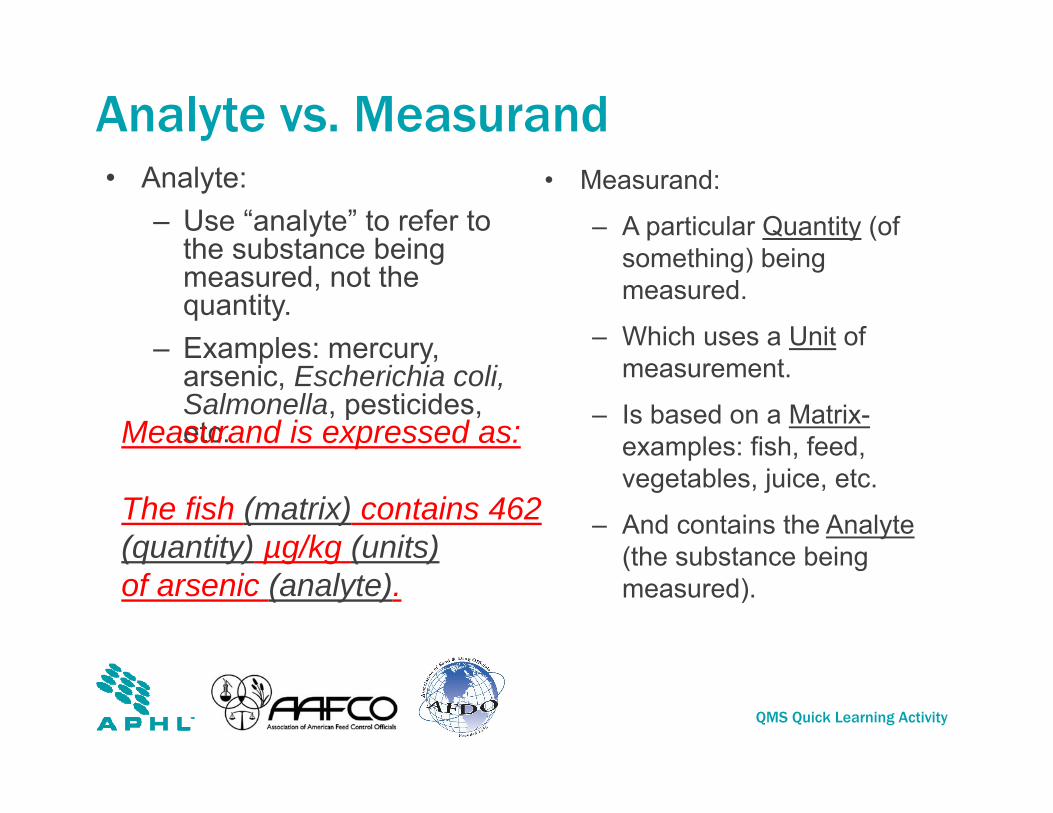
Analyte vs. Measurand• Analyte:
– Use “analyte” to refer to the substance being measured, not the quantity.
– Examples: mercury, arsenic, Escherichia coli,Salmonella, pesticides, etc.
• Measurand:
– A particular Quantity (of something) being measured.
– Which uses a Unit of measurement.
– Is based on a Matrix-examples: fish, feed, vegetables, juice, etc.
– And contains the Analyte(the substance being measured).
Measurand is expressed as:
The fish (matrix) contains 462(quantity) µg/kg (units)of arsenic (analyte).
QMS Quick Learning Activity
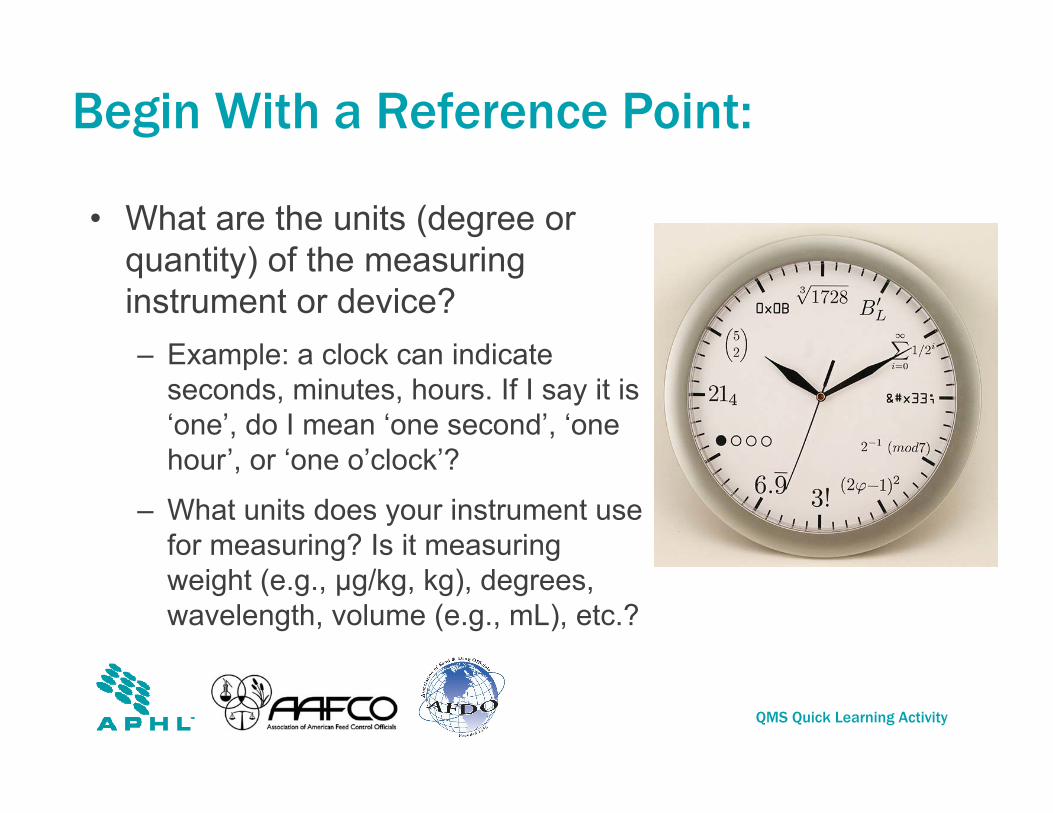
Begin With a Reference Point:
• What are the units (degree or quantity) of the measuring instrument or device?– Example: a clock can indicate
seconds, minutes, hours. If I say it is ‘one’, do I mean ‘one second’, ‘one hour’, or ‘one o’clock’?
– What units does your instrument use for measuring? Is it measuring weight (e.g., µg/kg, kg), degrees, wavelength, volume (e.g., mL), etc.?

QMS Quick Learning Activity
Other Reference Points:
• The uncorrected result (raw number),
• The corrected result (calculations used in the method),
• Whether averages were used to obtain result.
QMS Quick Learning Activity
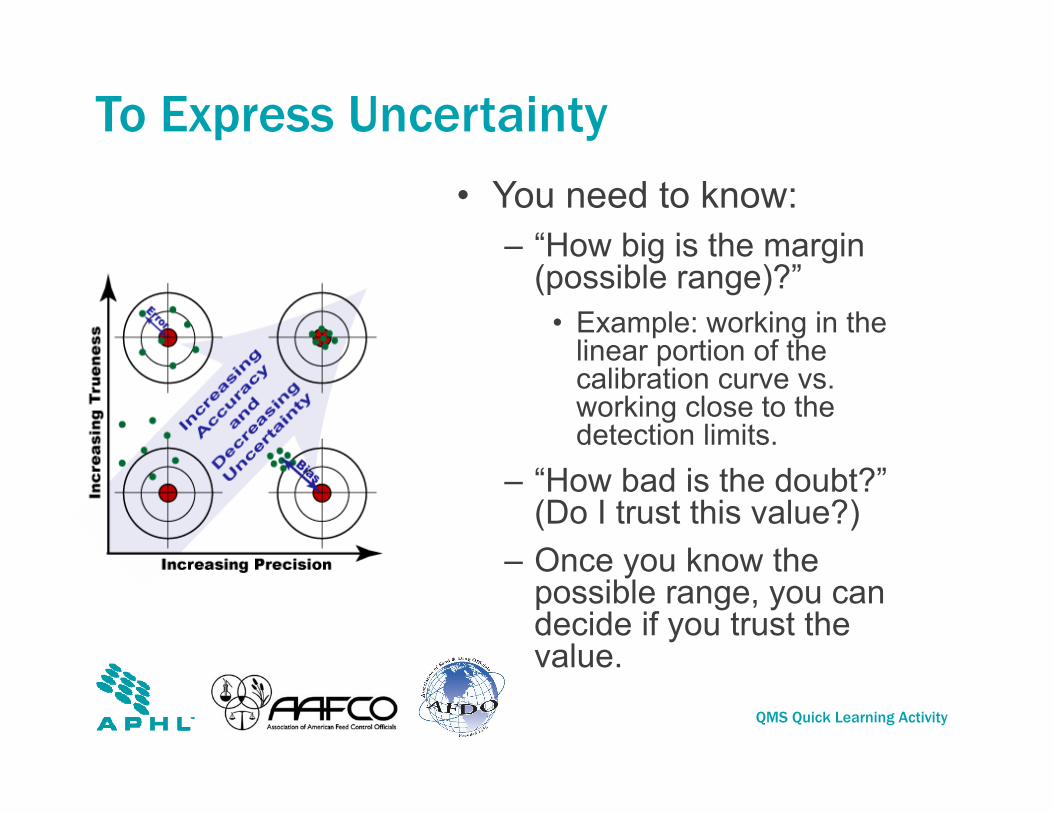
To Express Uncertainty
• You need to know:– “How big is the margin
(possible range)?”• Example: working in the
linear portion of the calibration curve vs. working close to the detection limits.
– “How bad is the doubt?” (Do I trust this value?)
– Once you know the possible range, you can decide if you trust the value.
QMS Quick Learning Activity
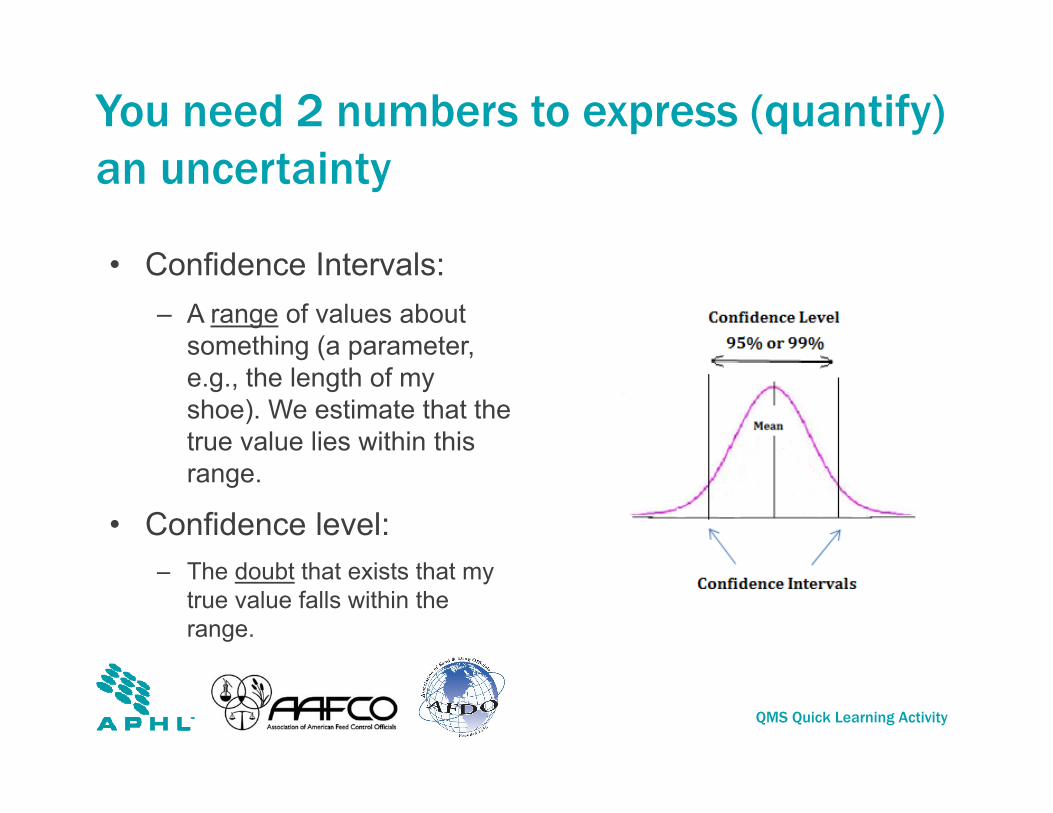
You need 2 numbers to express (quantify) an uncertainty
• Confidence Intervals:– A range of values about
something (a parameter, e.g., the length of my shoe). We estimate that the true value lies within this range.
• Confidence level:– The doubt that exists that my
true value falls within the range.
QMS Quick Learning Activity
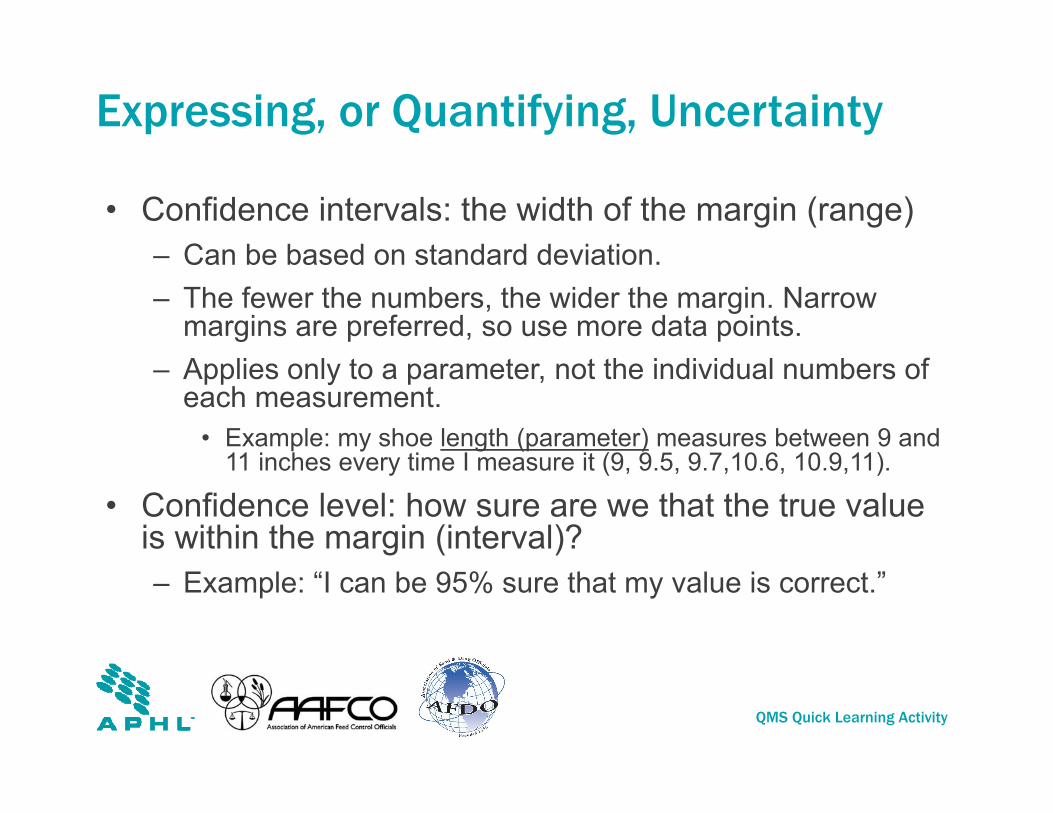
Expressing, or Quantifying, Uncertainty
• Confidence intervals: the width of the margin (range)– Can be based on standard deviation.– The fewer the numbers, the wider the margin. Narrow
margins are preferred, so use more data points.– Applies only to a parameter, not the individual numbers of
each measurement.• Example: my shoe length (parameter) measures between 9 and
11 inches every time I measure it (9, 9.5, 9.7,10.6, 10.9,11).
• Confidence level: how sure are we that the true value is within the margin (interval)? – Example: “I can be 95% sure that my value is correct.”

QMS Quick Learning Activity
Example• The length of a shoe is
10 inches plus or minus 1 inch, at the 95 percent confidence level
• Written as, “10 in. ± 1 in., at a level of confidence of 95%
• “I’m 95% sure that the shoe is 9-11 in. long”
QMS Quick Learning Activity
Uncertainty is Not Error!
• Uncertainty should not be confused with: – Errors or mistakes,
– Tolerances (which are usually based on instrumentation),
– Specifications (which can be method or instrument based),
– Accuracy, or rather, Inaccuracy,
– Statistical Analysis (uncertainty analysis is one of the uses of statistics).
• Uncertainty is the quantification of the doubt about the measurement result.
20
QMS Quick Learning Activity
Error vs. Uncertainty
• Error is the difference between the measured value and the true value of the measurand, which can never be exactly known.
• Uncertainty is quantifiable.
• Uncertainty is not an estimate of error or its limits unless you are sure that no systematic effects have been overlooked.
• There are two types of errors:– Systematic; also called
measurement bias.• Remains constant.
– Random; when the repeated value is different from the previous value.
• Cannot be predicted.
QMS Quick Learning Activity
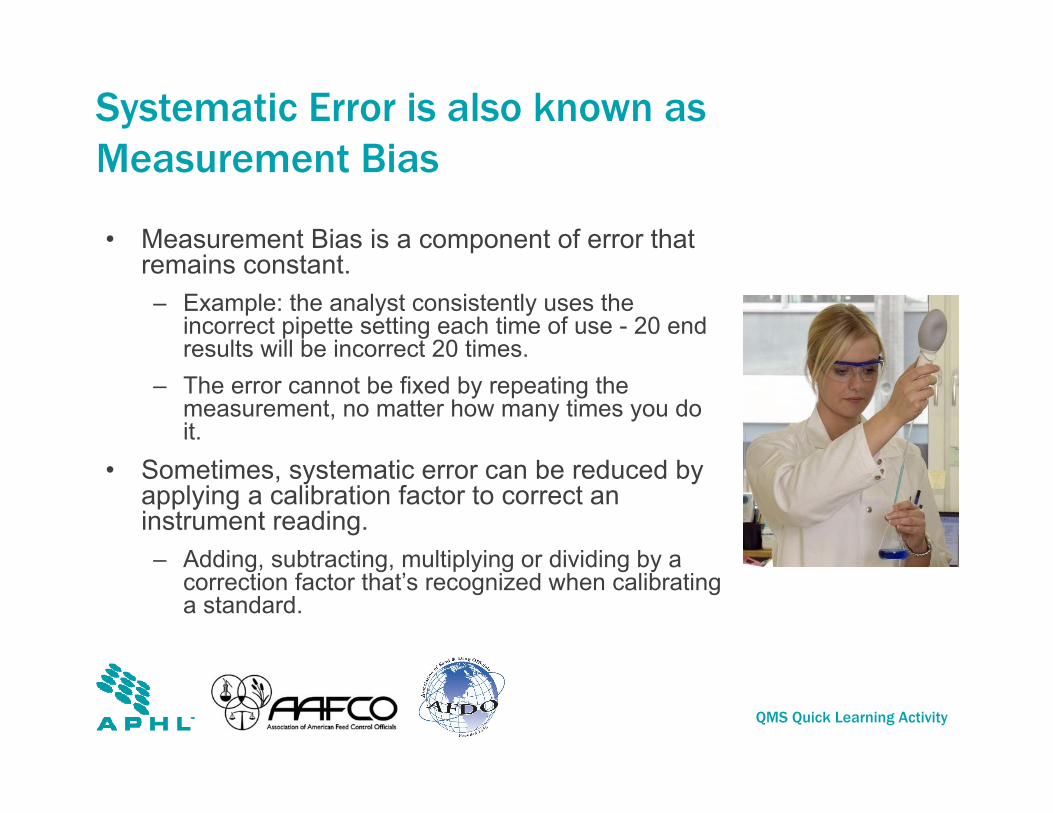
Systematic Error is also known as Measurement Bias
• Measurement Bias is a component of error that remains constant.– Example: the analyst consistently uses the
incorrect pipette setting each time of use - 20 end results will be incorrect 20 times.
– The error cannot be fixed by repeating the measurement, no matter how many times you do it.
• Sometimes, systematic error can be reduced by applying a calibration factor to correct an instrument reading.– Adding, subtracting, multiplying or dividing by a
correction factor that’s recognized when calibrating a standard.
QMS Quick Learning Activity
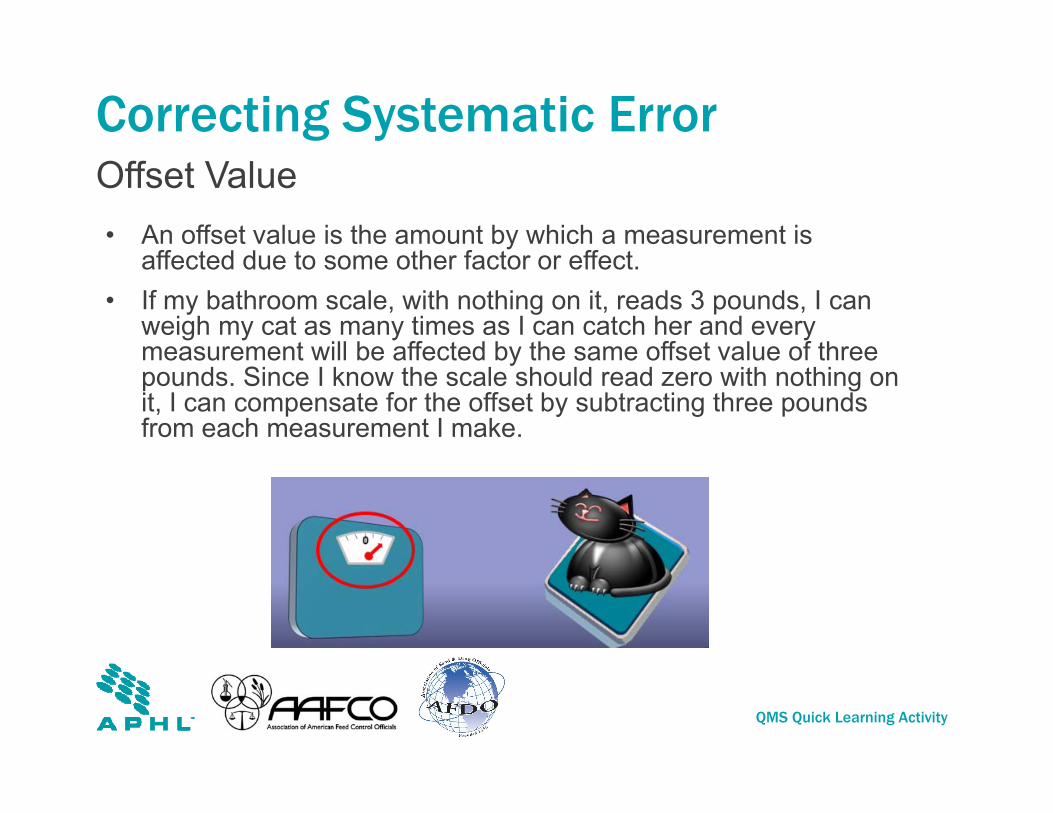
Correcting Systematic Error
• An offset value is the amount by which a measurement is affected due to some other factor or effect.
• If my bathroom scale, with nothing on it, reads 3 pounds, I can weigh my cat as many times as I can catch her and every measurement will be affected by the same offset value of three pounds. Since I know the scale should read zero with nothing on it, I can compensate for the offset by subtracting three pounds from each measurement I make.
Offset Value

QMS Quick Learning Activity
Error
• Random error is always present in a measurement and is caused by variations in the readings of the instrument due to precision limitations or in the operator’s interpretations.
• Random errors can not be predicted because every repeated value is different from the previous value.
• Unlike systematic errors, random errors can be reduced by averaging a large number of observations.
Random Error
Random

QMS Quick Learning Activity
Reducing random error• Reduce the effects of random error by
increasing the number of measurements.
– The first time the scientist weighed the substance, the result was 9.54 milligrams.
– The second measurement was 9.48 mg.
– We have no way of knowing if either of these two numbers is close to the true weight.
• Random error is closely related to precision.
– The greater the precision of a measurement instrument, the smaller the variations in its readings.
• By taking ten separate measurements, we can total them and find the average, or mean value.
• Taking multiple measurements reduces the effects of random error and the average provides a better estimate of the true value than does a single measurement.
QMS Quick Learning Activity
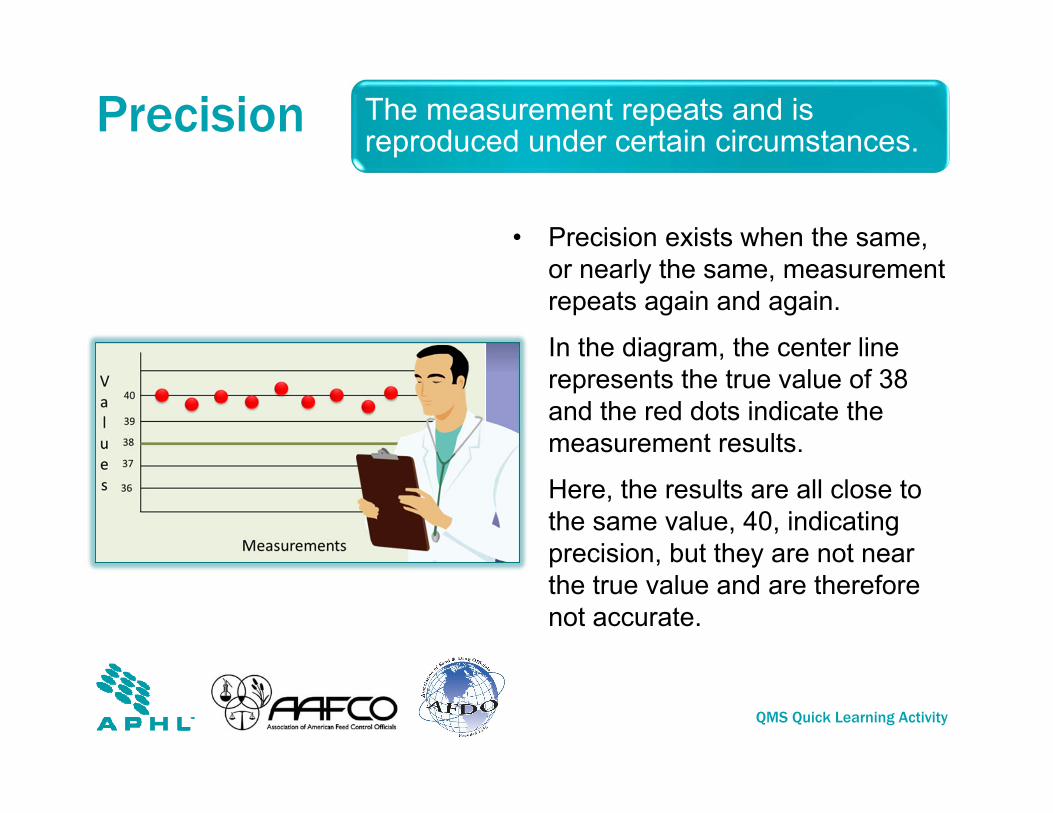
Precision
• Precision exists when the same, or nearly the same, measurement repeats again and again.
• In the diagram, the center line represents the true value of 38 and the red dots indicate the measurement results.
• Here, the results are all close to the same value, 40, indicating precision, but they are not near the true value and are therefore not accurate.
The measurement repeats and is reproduced under certain circumstances.
QMS Quick Learning Activity
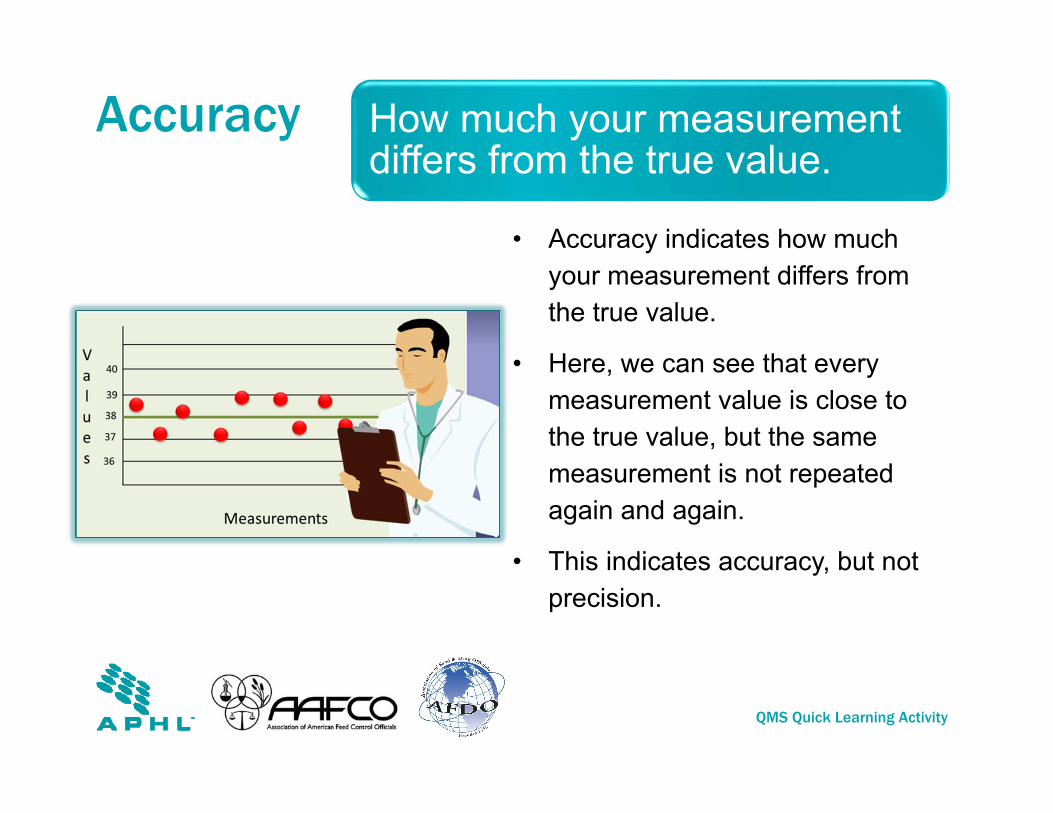
Accuracy
• Accuracy indicates how much your measurement differs from the true value.
• Here, we can see that every measurement value is close to the true value, but the same measurement is not repeated again and again.
• This indicates accuracy, but not precision.
How much your measurement differs from the true value.
QMS Quick Learning Activity
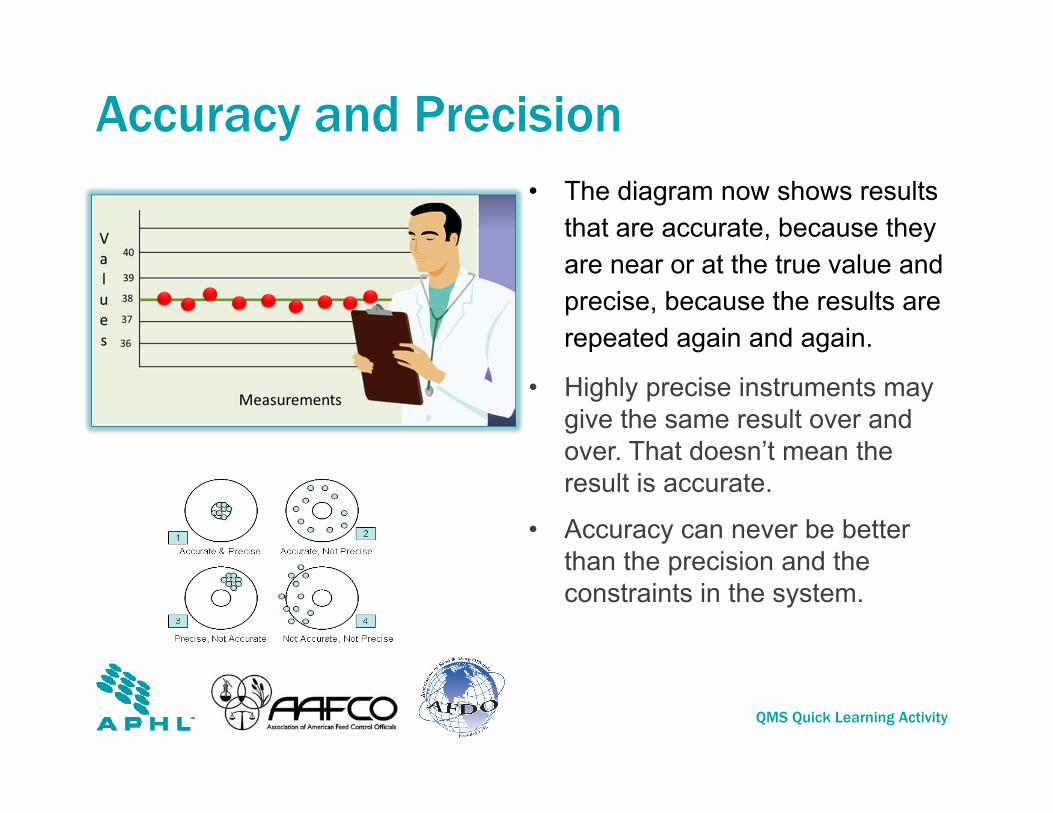
Accuracy and Precision• The diagram now shows results
that are accurate, because they are near or at the true value and precise, because the results are repeated again and again.
• Highly precise instruments may give the same result over and over. That doesn’t mean the result is accurate.
• Accuracy can never be better than the precision and the constraints in the system.
QMS Quick Learning Activity
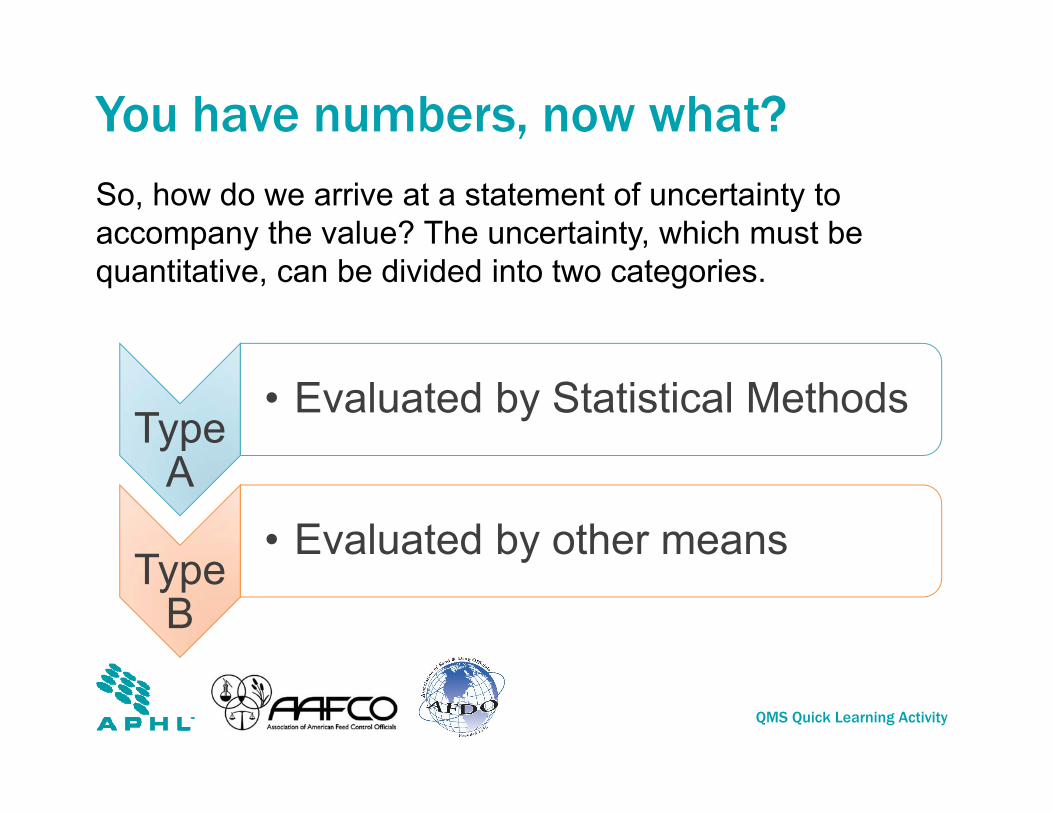
You have numbers, now what? So, how do we arrive at a statement of uncertainty to accompany the value? The uncertainty, which must be quantitative, can be divided into two categories.
Type A
• Evaluated by Statistical Methods
Type B
• Evaluated by other means
QMS Quick Learning Activity
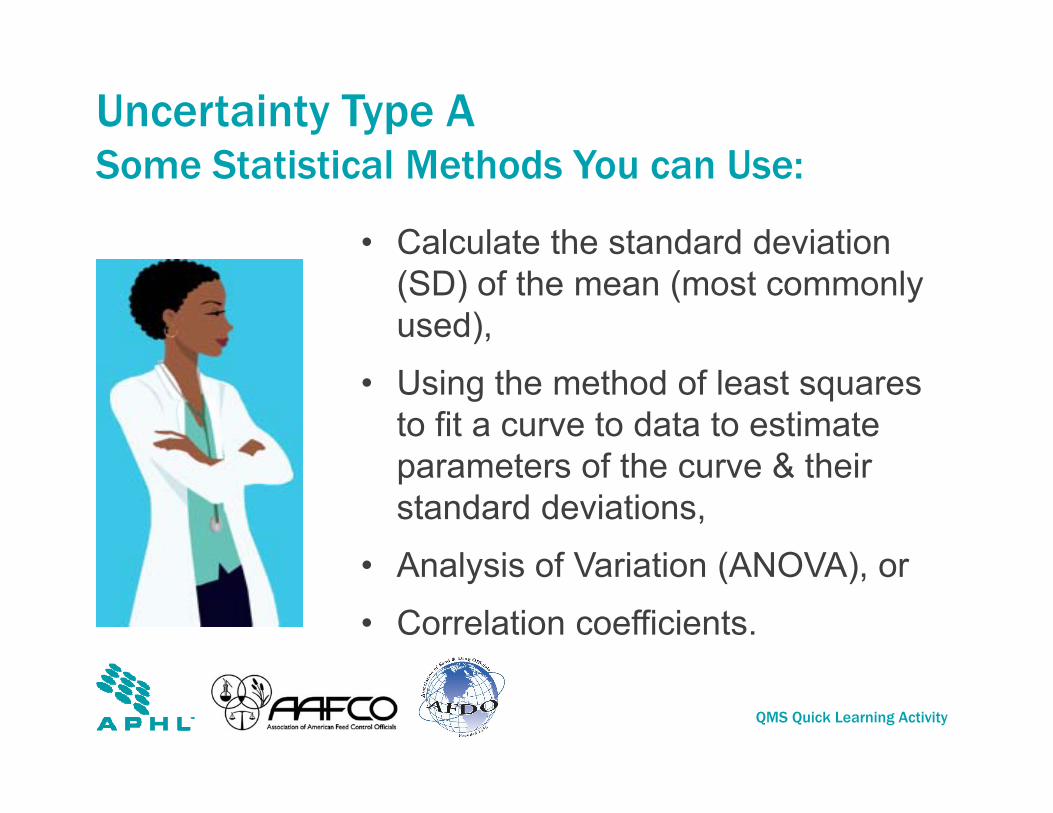
Uncertainty Type ASome Statistical Methods You can Use:
• Calculate the standard deviation (SD) of the mean (most commonly used),
• Using the method of least squares to fit a curve to data to estimate parameters of the curve & their standard deviations,
• Analysis of Variation (ANOVA), or• Correlation coefficients.
QMS Quick Learning Activity
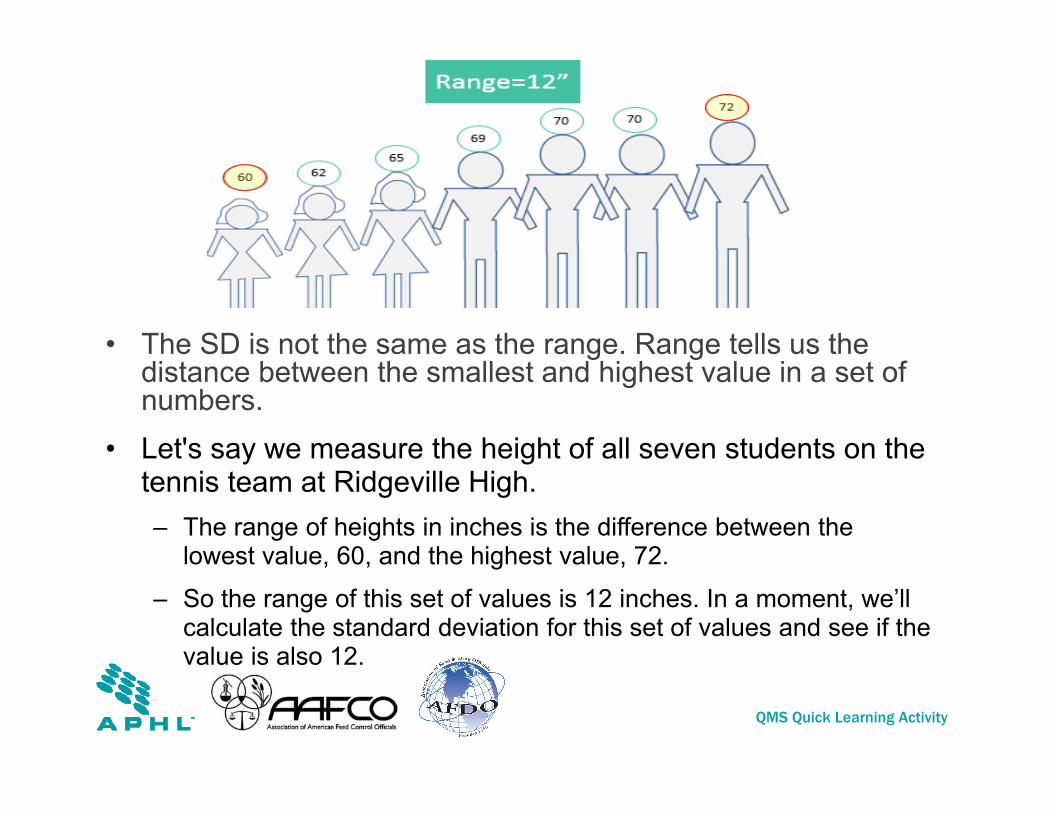
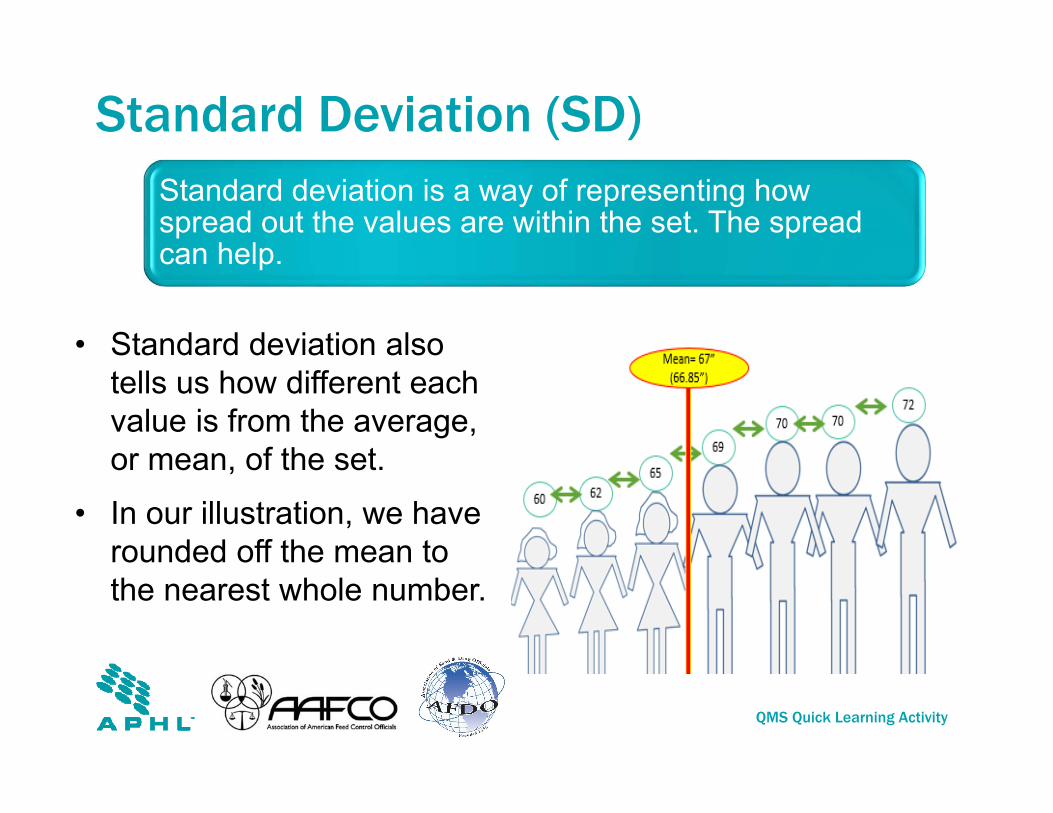
• The SD is not the same as the range. Range tells us the distance between the smallest and highest value in a set of numbers.
• Let's say we measure the height of all seven students on the tennis team at Ridgeville High. – The range of heights in inches is the difference between the
lowest value, 60, and the highest value, 72. – So the range of this set of values is 12 inches. In a moment, we’ll
calculate the standard deviation for this set of values and see if the value is also 12.
QMS Quick Learning Activity
Standard Deviation (SD)
• Standard deviation also tells us how different each value is from the average, or mean, of the set.
• In our illustration, we have rounded off the mean to the nearest whole number.
Standard deviation is a way of representing how spread out the values are within the set. The spread can help.

QMS Quick Learning Activity
To calculate the mean or average, we simply added all the values, which in our example, total 468. We then divide the total by the number of values in the set, 7, to find the mean. The mean of our seven values is 67.
QMS Quick Learning Activity
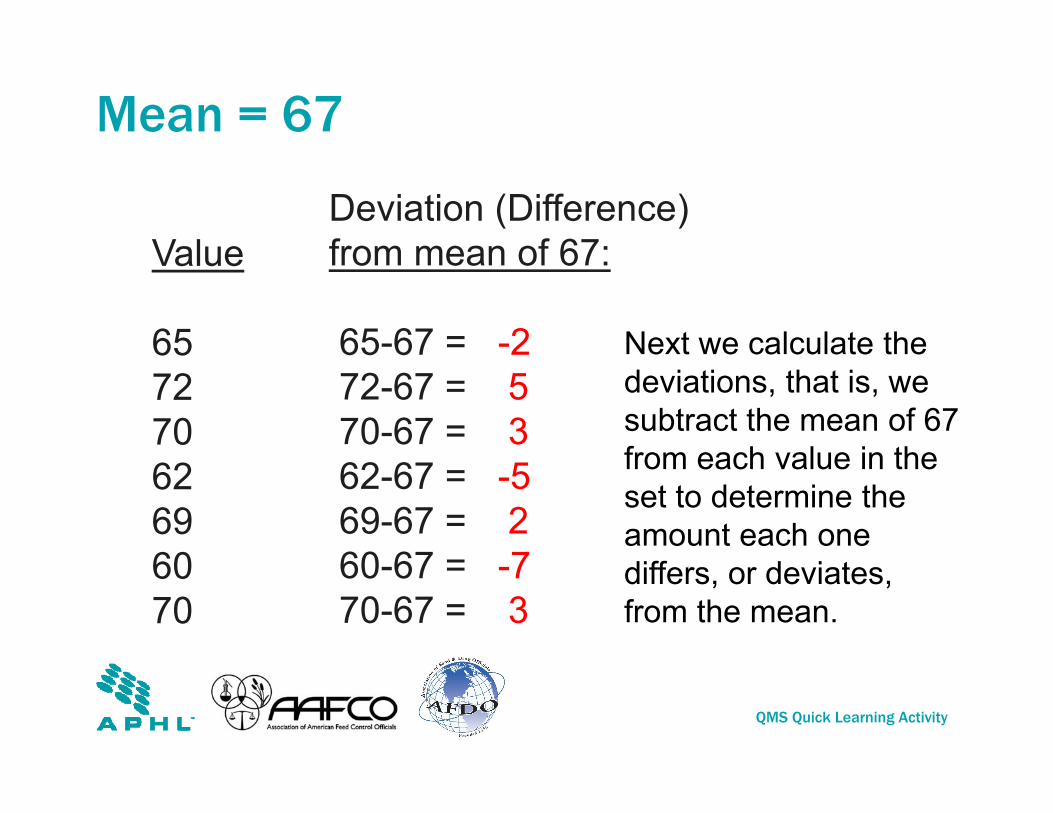
Mean = 67
Value
65727062696070
Deviation (Difference) from mean of 67:
65-67 = -272-67 = 570-67 = 362-67 = -569-67 = 260-67 = -770-67 = 3
Next we calculate the deviations, that is, we subtract the mean of 67 from each value in the set to determine the amount each one differs, or deviates, from the mean.
QMS Quick Learning Activity
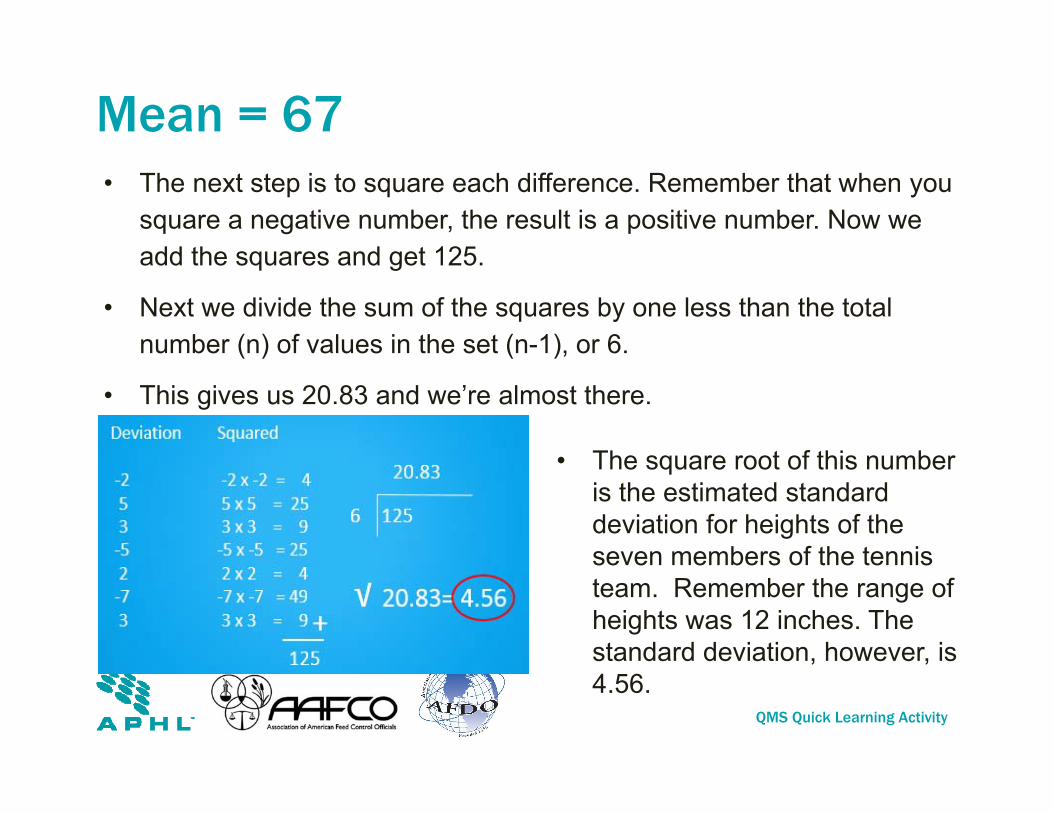
Mean = 67• The next step is to square each difference. Remember that when you
square a negative number, the result is a positive number. Now we add the squares and get 125.
• Next we divide the sum of the squares by one less than the total number (n) of values in the set (n-1), or 6.
• This gives us 20.83 and we’re almost there.
• The square root of this number is the estimated standard deviation for heights of the seven members of the tennis team. Remember the range of heights was 12 inches. The standard deviation, however, is 4.56.
QMS Quick Learning Activity
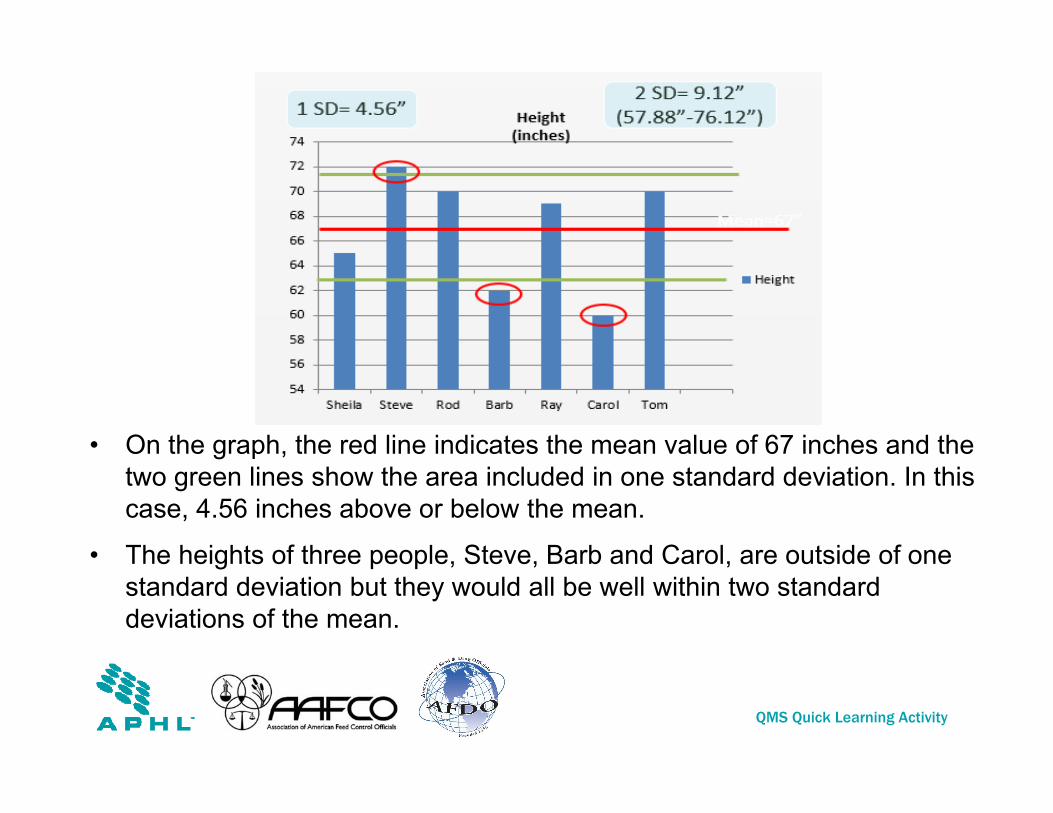
• On the graph, the red line indicates the mean value of 67 inches and the two green lines show the area included in one standard deviation. In this case, 4.56 inches above or below the mean.
• The heights of three people, Steve, Barb and Carol, are outside of one standard deviation but they would all be well within two standard deviations of the mean.
QMS Quick Learning Activity
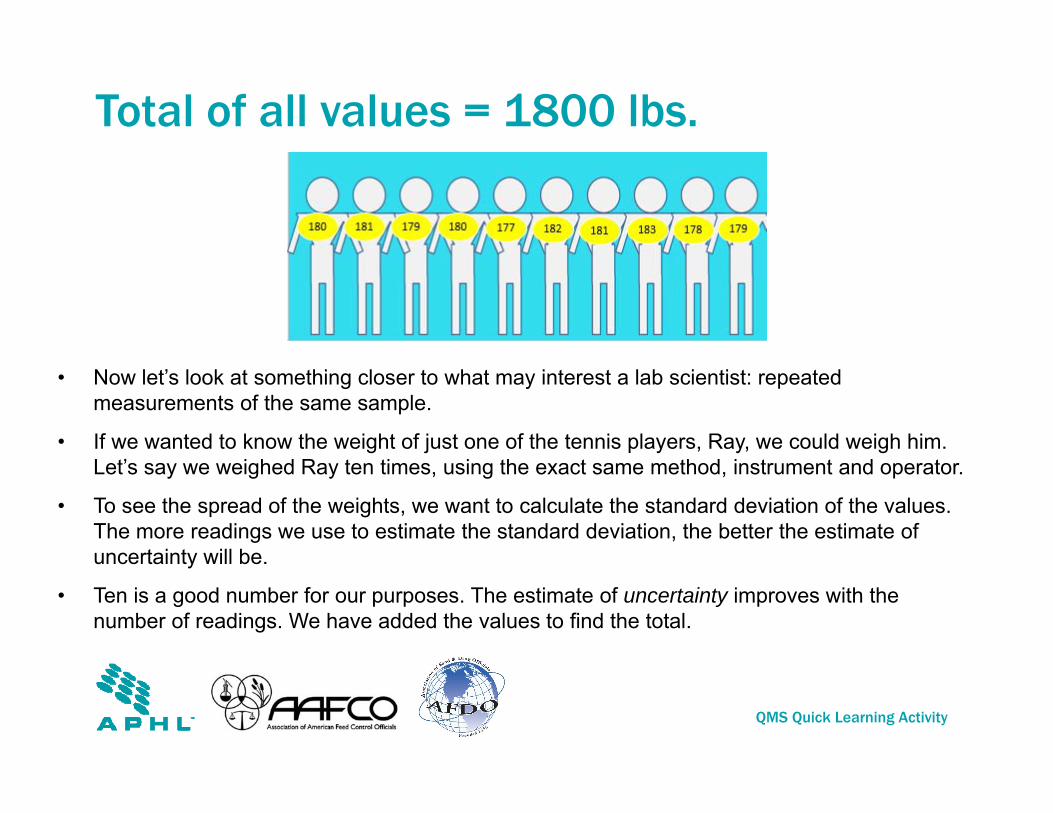
Total of all values = 1800 lbs.
• Now let’s look at something closer to what may interest a lab scientist: repeated measurements of the same sample.
• If we wanted to know the weight of just one of the tennis players, Ray, we could weigh him. Let’s say we weighed Ray ten times, using the exact same method, instrument and operator.
• To see the spread of the weights, we want to calculate the standard deviation of the values. The more readings we use to estimate the standard deviation, the better the estimate of uncertainty will be.
• Ten is a good number for our purposes. The estimate of uncertainty improves with the number of readings. We have added the values to find the total.
QMS Quick Learning Activity
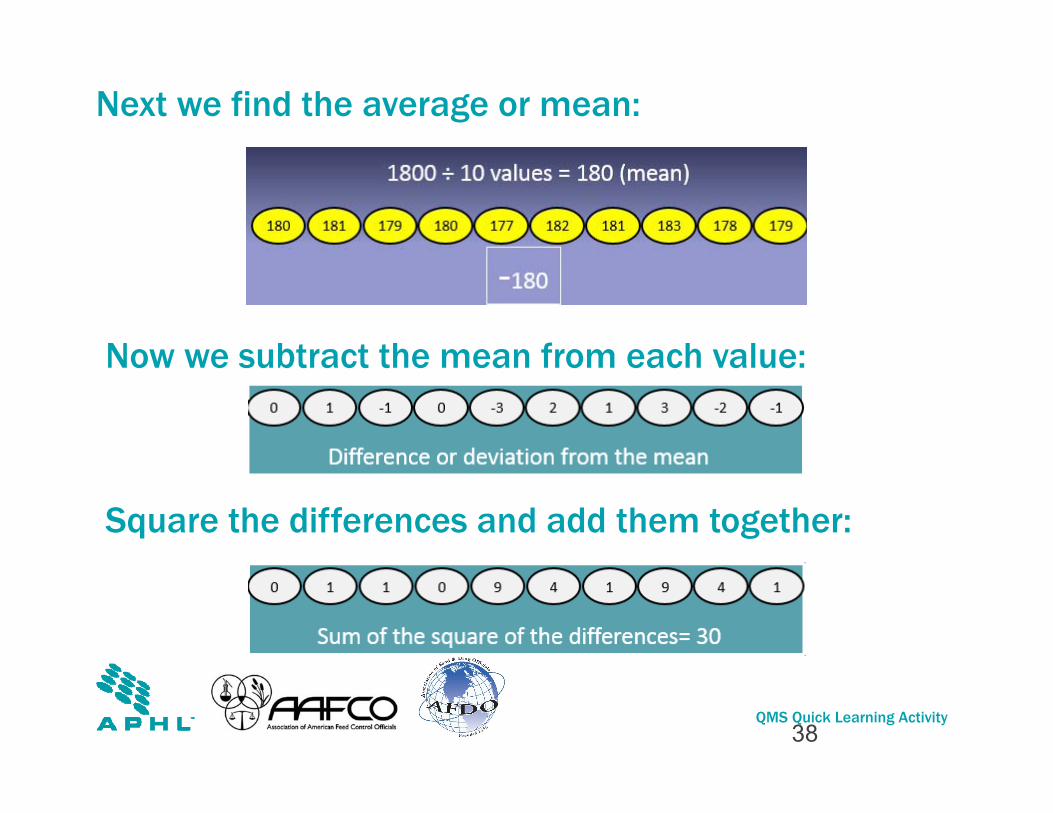
Next we find the average or mean:
38
Now we subtract the mean from each value:
Square the differences and add them together:
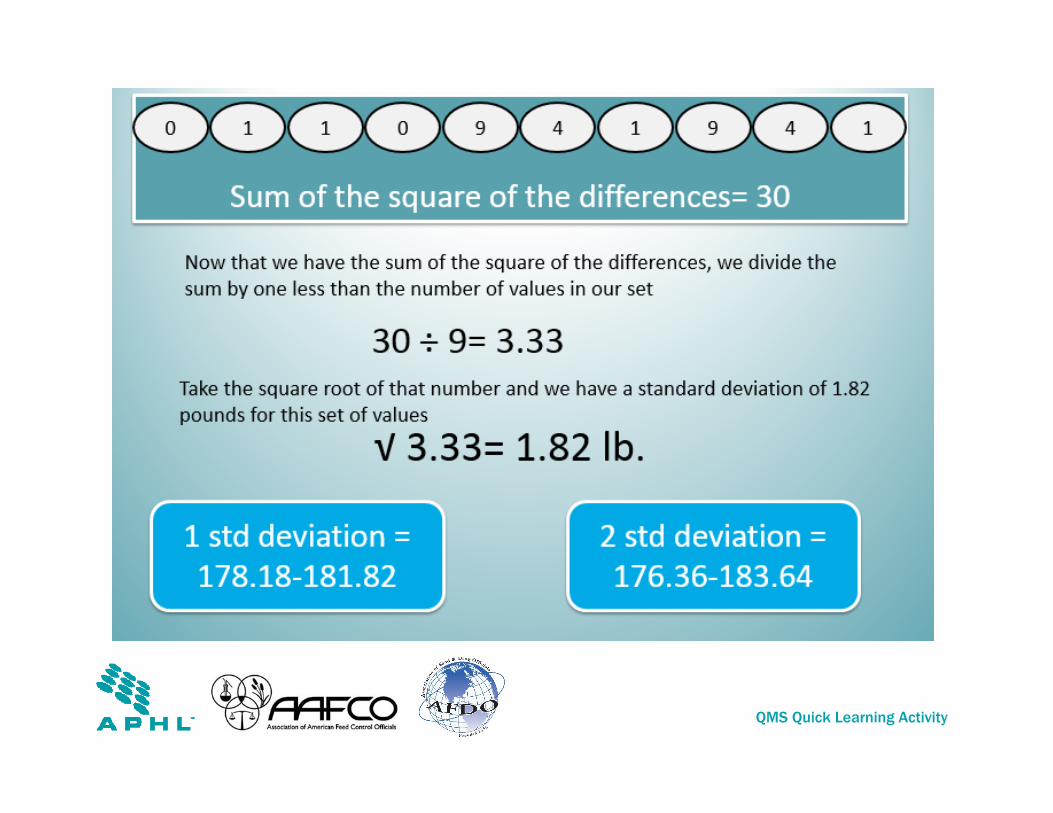
QMS Quick Learning Activity
QMS Quick Learning Activity
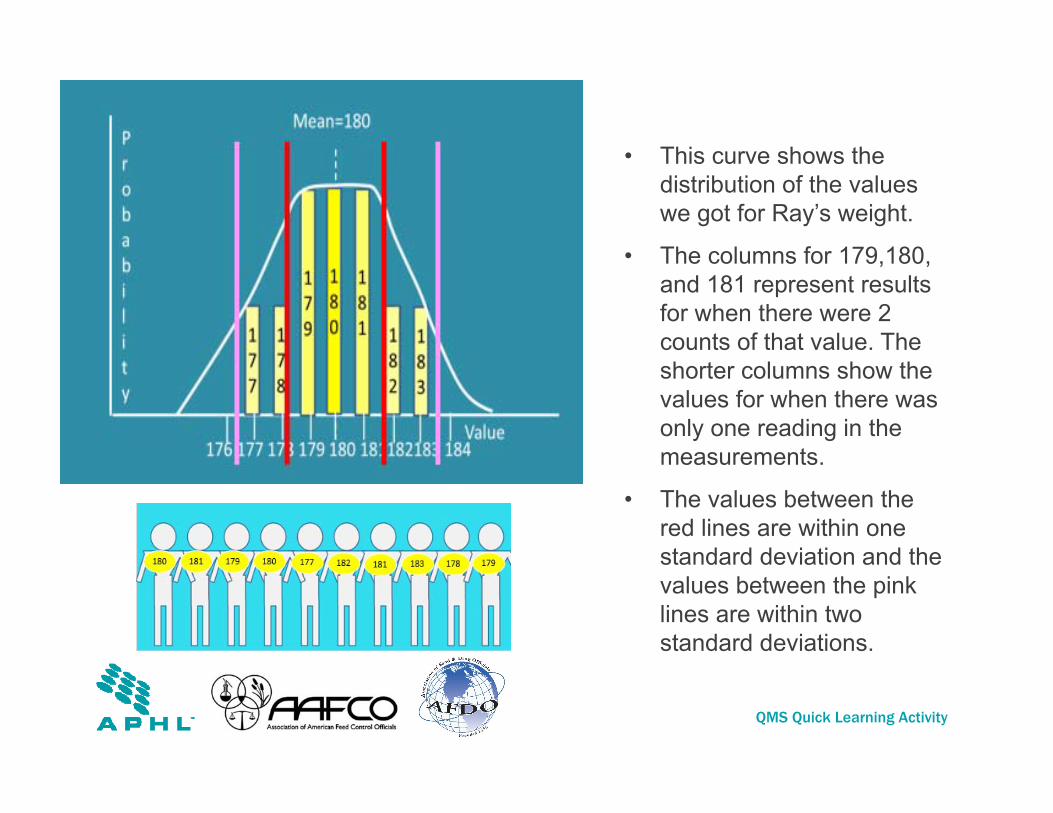
• This curve shows the distribution of the values we got for Ray’s weight.
• The columns for 179,180, and 181 represent results for when there were 2 counts of that value. The shorter columns show the values for when there was only one reading in the measurements.
• The values between the red lines are within one standard deviation and the values between the pink lines are within two standard deviations.

QMS Quick Learning Activity
Distribution-shape of errors
• The curve is symmetrical, indicating that deviations from the mean are comparable in either direction. When plotting the values of repetitive measurements, we would expect to see a normal distribution curve because all the values should be close to the mean.
• As a ‘rule of thumb’, in a normal distribution, roughly two thirds of all readings will fall between plus and minus one standard deviation of the average. Roughly 95% of all readings will fall within two standard deviations. This ‘rule’ applies widely although it is by no means universal.
Normal (Gaussian) distribution; values are more likely to fall near the mean.

QMS Quick Learning Activity
What the shape tells us• The curve we made from Ray's weight
measurements was a normal distribution, or Gaussian curve, named in honor of the mathematician Carl Gauss.
• A normal distribution curve, such as would be expected in the distribution of repeated test results on a sample, or calibration values for a single standard, is bell-shaped; most of the values fall closer to the mean than away from it.
• We can make some assumptions with data when all we know is the mean and standard deviation, which control the height and width of the curve.
• The values for this curve have a mean value of 5. The number of readings for each value in this graph is represented by the height of the yellow bars, the taller bars represent more readings of the value.
The appearance of this curve tells us that most readings are near the mean of 5.0 because the shape of the curve is tall and narrow.
QMS Quick Learning Activity
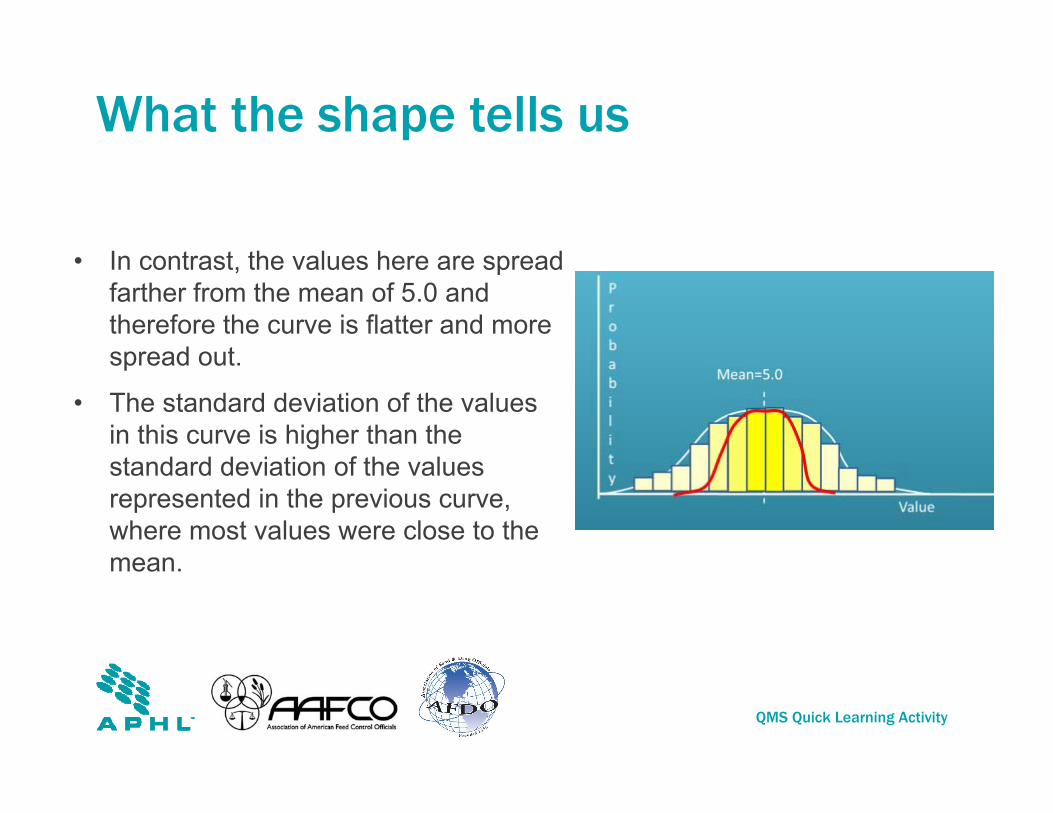
What the shape tells us
• In contrast, the values here are spread farther from the mean of 5.0 and therefore the curve is flatter and more spread out.
• The standard deviation of the values in this curve is higher than the standard deviation of the values represented in the previous curve, where most values were close to the mean.
QMS Quick Learning Activity
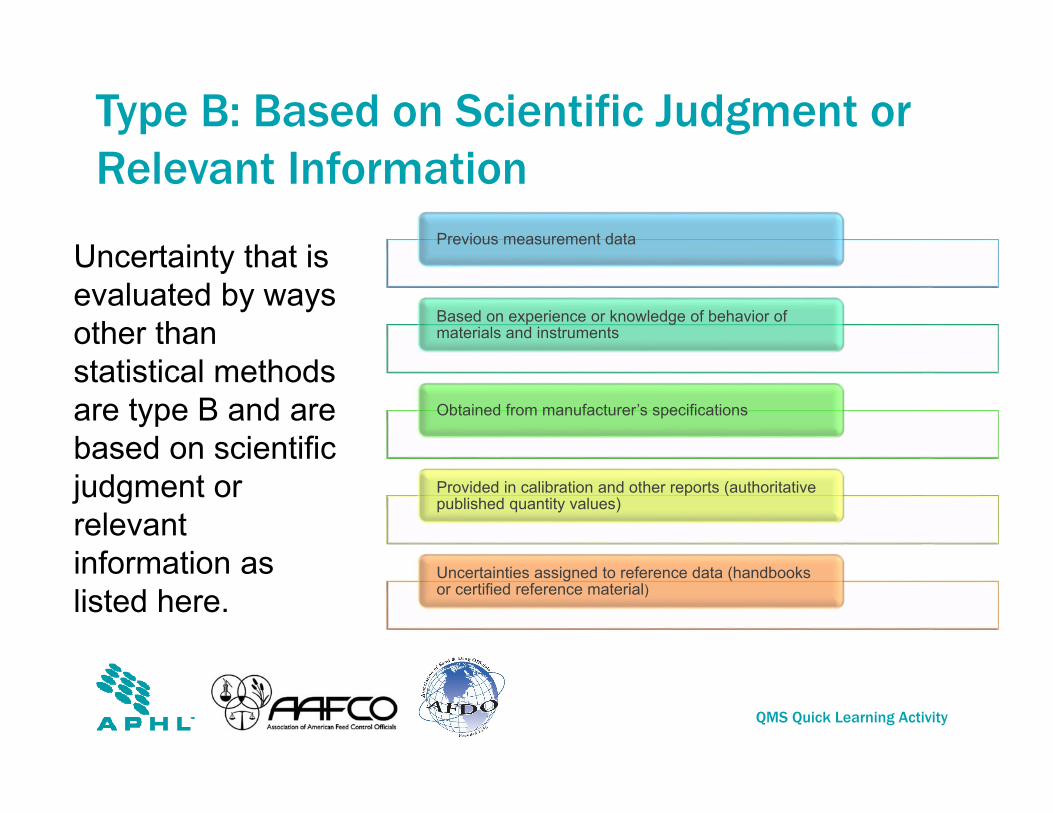
Previous measurement data
Based on experience or knowledge of behavior of materials and instruments
Obtained from manufacturer’s specifications
Provided in calibration and other reports (authoritative published quantity values)
Uncertainties assigned to reference data (handbooks or certified reference material)
Type B: Based on Scientific Judgment or Relevant Information
Uncertainty that is evaluated by ways other than statistical methods are type B and are based on scientific judgment or relevant information as listed here.
QMS Quick Learning Activity
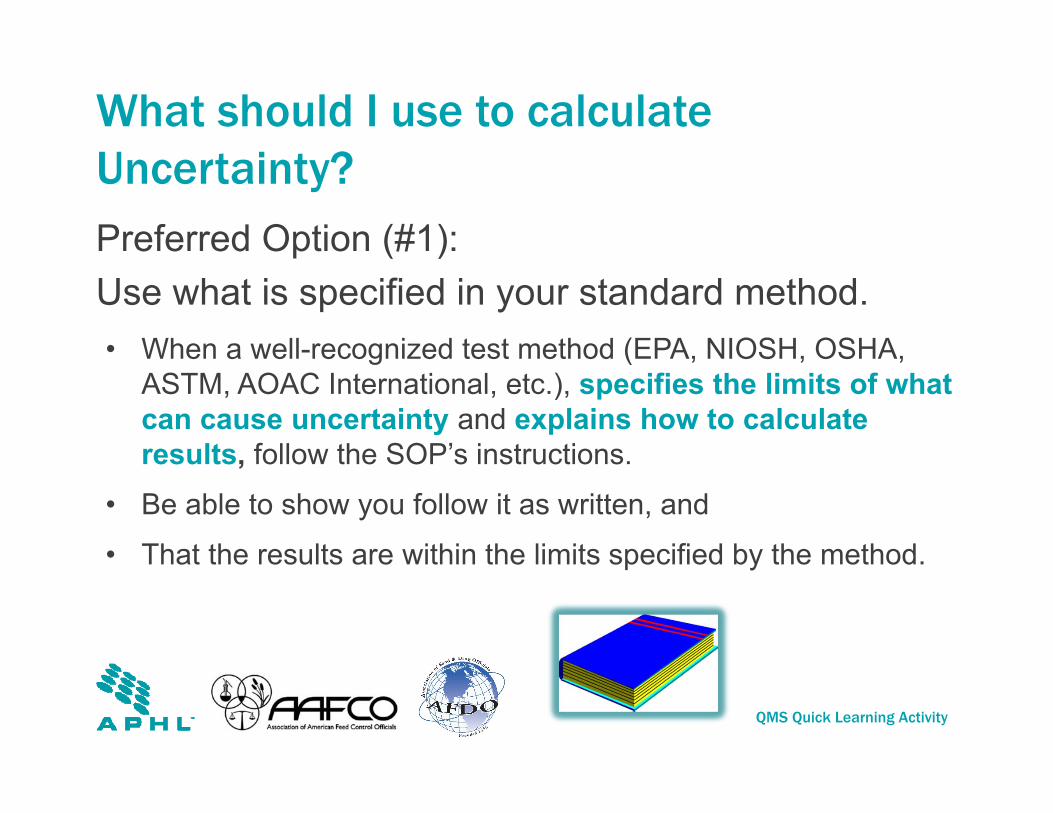
What should I use to calculate Uncertainty?
• When a well-recognized test method (EPA, NIOSH, OSHA, ASTM, AOAC International, etc.), specifies the limits of what can cause uncertainty and explains how to calculate results, follow the SOP’s instructions.
• Be able to show you follow it as written, and
• That the results are within the limits specified by the method.
Preferred Option (#1): Use what is specified in your standard method.
QMS Quick Learning Activity
What else can I use?
• Next Option (#2): Use Laboratory Control Samples (LCS) or Matrix Spikes– Use standard deviation of
long term data collected from routine sample runs.
– For new test methods, use the standard deviation of the LCS or matrix spike data collected in the method validation/verification studies.

QMS Quick Learning Activity
Method Specified Uncertainty when there is no Duplicate Sub-sampling
• Example: Industrial Hygiene (IH) lead (Pb) in air samples (units are mg/M³)
• For IH air samples and Pb Wipes or other samples where there is no duplicate sub-sampling, the uncertainty will be calculated using the SD of long term data collected from LCS and Laboratory Control Sample Duplicates (LCSD) specific to the analyte and matrix of the sample.
• Uncertainty will be reported in the same unit as the analytical result
• (Confidence level of 95% is referred to as ‘k=2’)
47
QMS Quick Learning Activity
Method Specified Uncertainty when there is no Duplicate Sub-sampling
• Example using a Test Result of: 0.25 mg/M³– SD of last 40 data points for the Pb LCS = 4.0 – At 95% Confidence (k = 2) [Confidence level: I can be 95%
sure that my value is…] – Uncertainty of the system = SD times 2 (k) = 4.0 x 2 =
8.0% (.08)– Sample Uncertainty Calculation: (0.25) (.08) = 0.02
• Result for Pb is 0.25 mg/M³ with an analytical uncertainty ± 0.02 mg/M³ at 95% confidence level (where k=2).
48
QMS Quick Learning Activity
Method Specified Uncertainty when there is no Duplicate Sub-sampling, cont’d.
Bias is calculated using average percent recovery of the LCS.
Example: where the Mean Recovery of the LCS = 98.2%
• 100-98.2 = 1.8; therefore there is a -1.8% bias to the system (negative because the recovery is < 100%)
– Calculation: Result x the system bias = sample bias
– 0.25 mg/M³ x (-0.018) = - 0.0045 mg/M³
• When requested by the client, the result will be reported with the uncertainty and bias associated with that result.
• For the above example when reporting a result of 0.25 mg/M³ Lead: – “0.25 mg/M³ Lead with an
analytical uncertainty of ± 0.02 mg/M³ at the 95% confidence level (where k=2) with a probable bias of - 0.0045 mg/M³”
49

QMS Quick Learning Activity
What else can I use?
• Option #3: Use Duplicate Data – Use long term duplicate data (should be
over the reporting limit) collected from routine sample runs
– For new test methods, use the duplicate data collected in the method validation/verification studies
QMS Quick Learning Activity
When Sample Duplicates are Available
For samples where duplicate analysis data is available along with the LCS data, the calculation is expanded to include the SD of the % recovery of the LCS and the pooled relative standard deviation (RSD) of the duplicate (LCSD) analysis data. Use this formula:
Combined Relative Standard Deviation (SDc) = √ [SD1² + SD2²]
51
QMS Quick Learning Activity
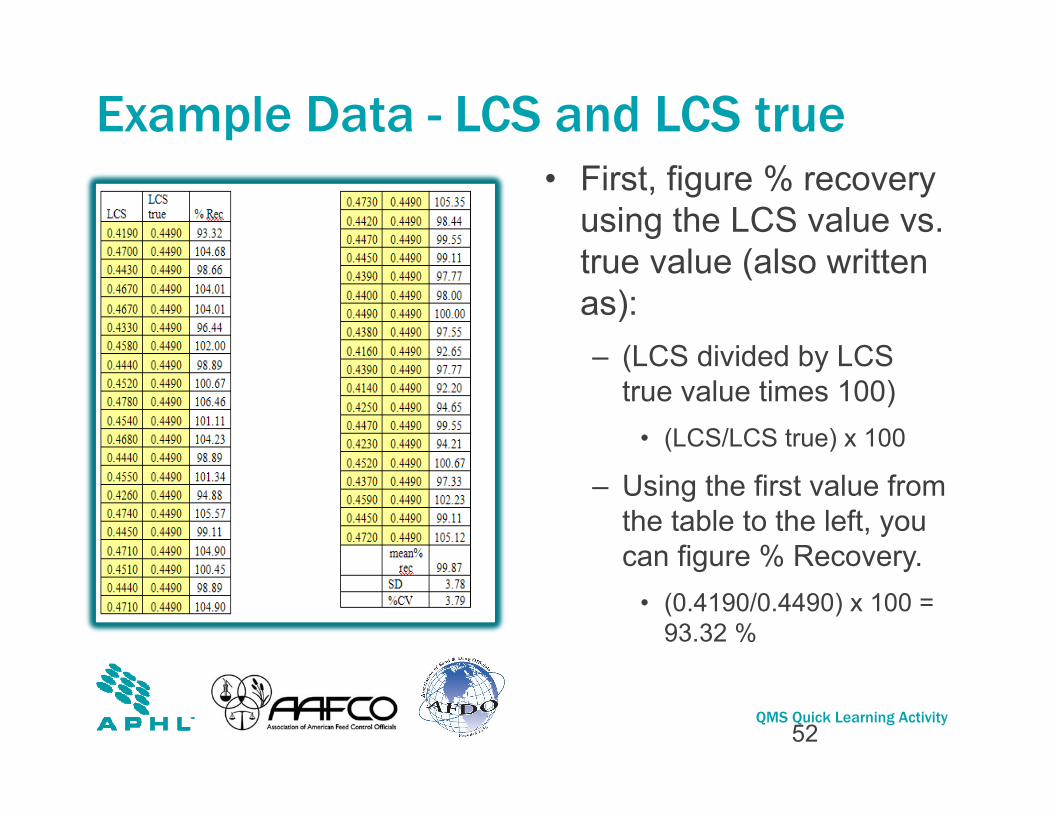
Example Data - LCS and LCS true• First, figure % recovery
using the LCS value vs. true value (also written as): – (LCS divided by LCS
true value times 100) • (LCS/LCS true) x 100
– Using the first value from the table to the left, you can figure % Recovery.
• (0.4190/0.4490) x 100 = 93.32 %
52
QMS Quick Learning Activity
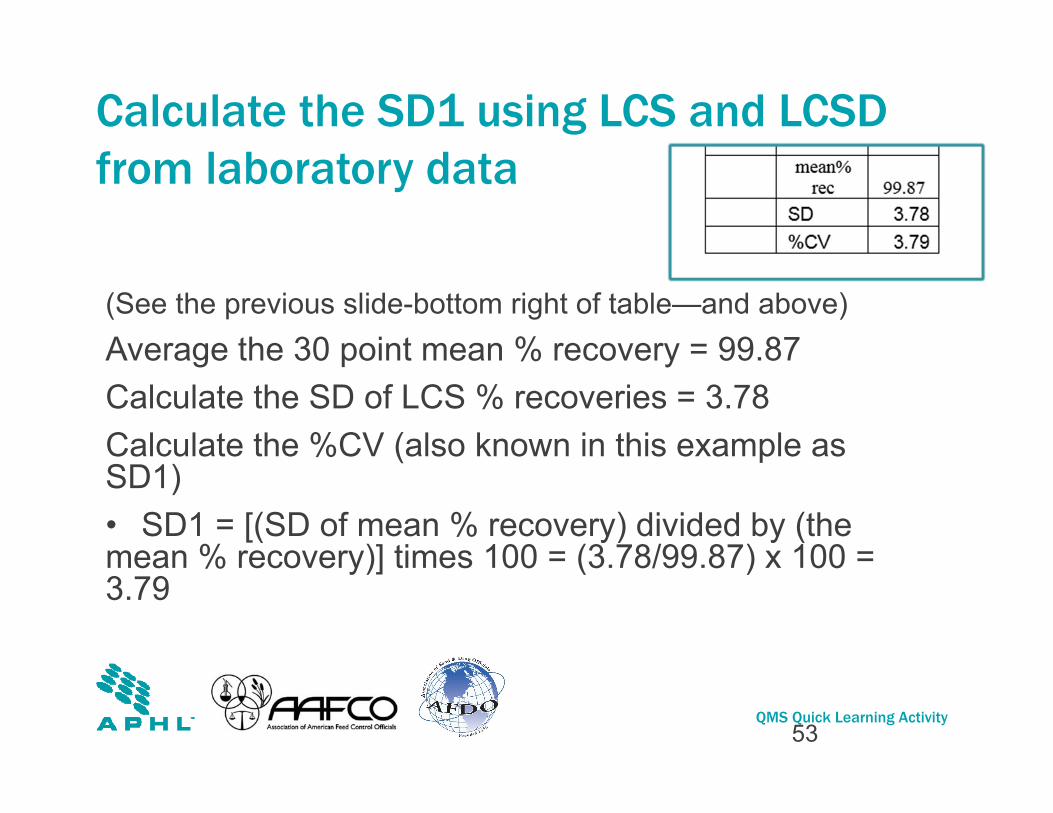
Calculate the SD1 using LCS and LCSD from laboratory data
(See the previous slide-bottom right of table—and above)Average the 30 point mean % recovery = 99.87Calculate the SD of LCS % recoveries = 3.78 Calculate the %CV (also known in this example as SD1) • SD1 = [(SD of mean % recovery) divided by (the mean % recovery)] times 100 = (3.78/99.87) x 100 = 3.79
53
QMS Quick Learning Activity
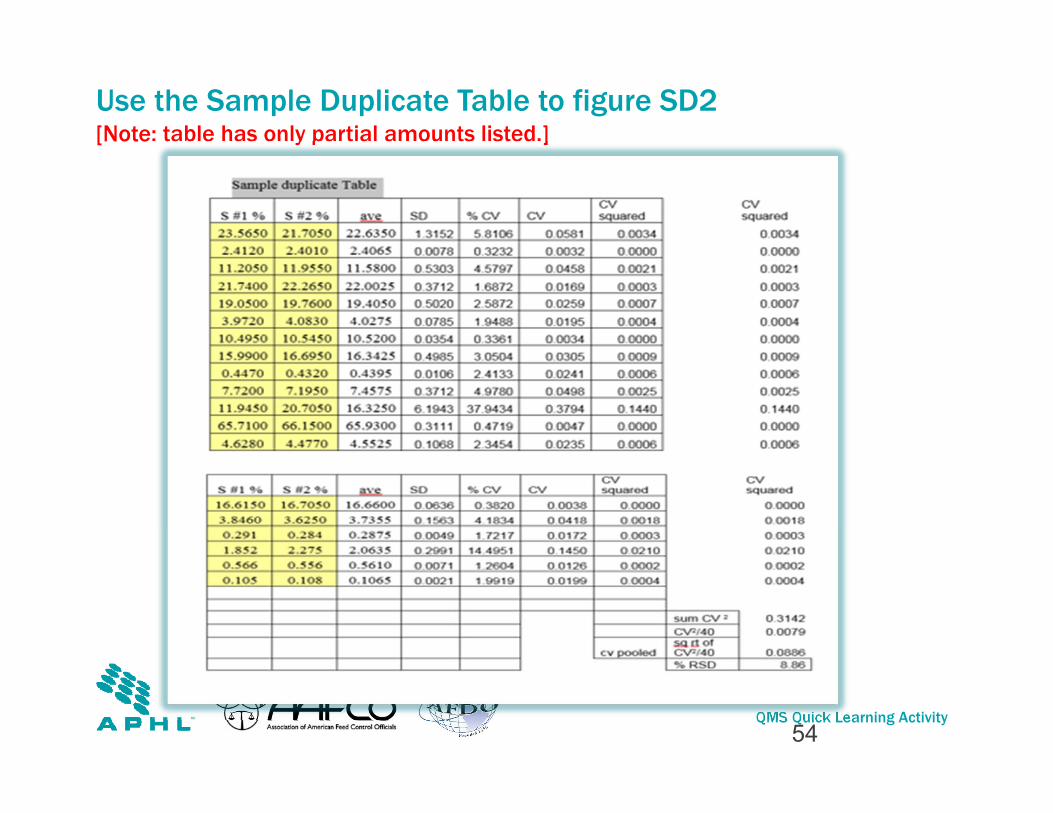
Use the Sample Duplicate Table to figure SD2 [Note: table has only partial amounts listed.]
54
QMS Quick Learning Activity
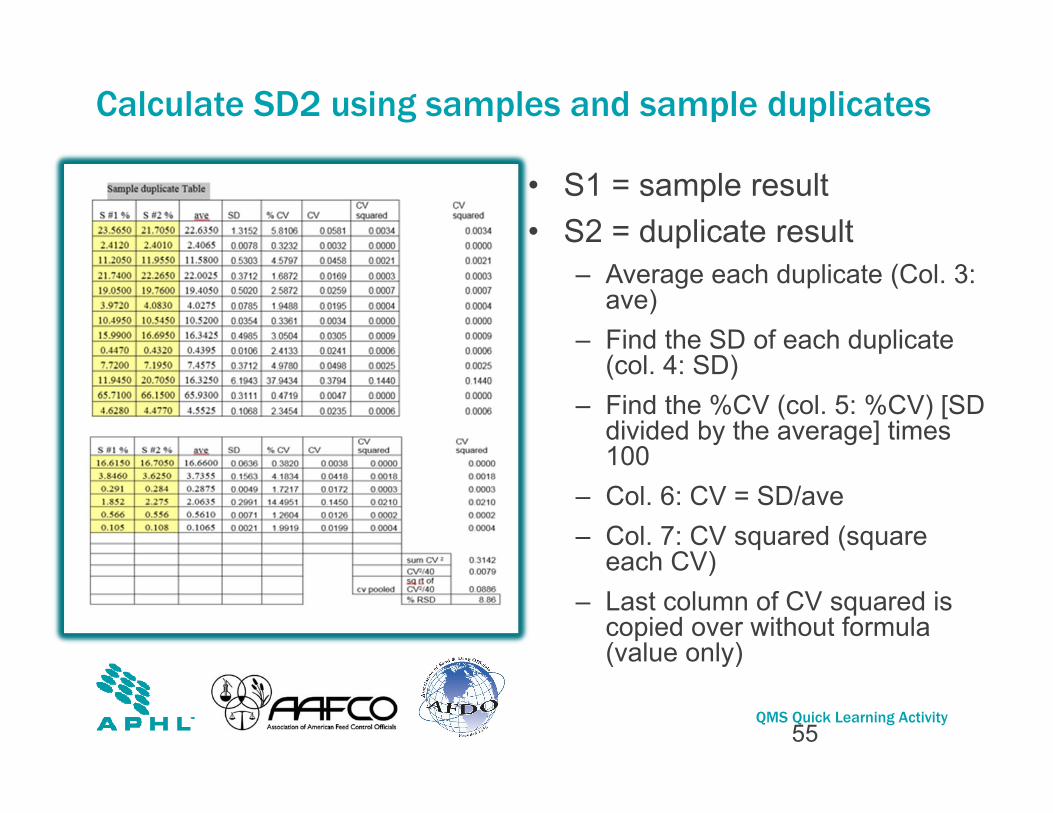
Calculate SD2 using samples and sample duplicates
• S1 = sample result• S2 = duplicate result
– Average each duplicate (Col. 3: ave)
– Find the SD of each duplicate (col. 4: SD)
– Find the %CV (col. 5: %CV) [SD divided by the average] times 100
– Col. 6: CV = SD/ave– Col. 7: CV squared (square
each CV)– Last column of CV squared is
copied over without formula (value only)
55
QMS Quick Learning Activity
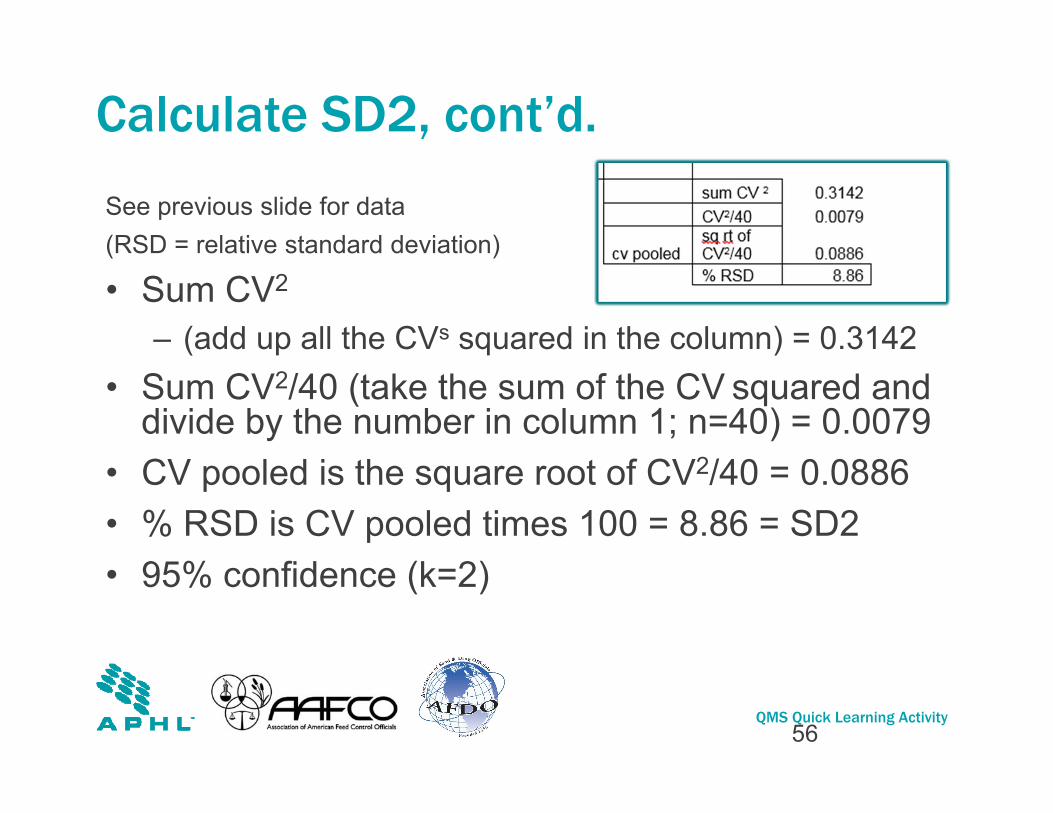
Calculate SD2, cont’d.
See previous slide for data(RSD = relative standard deviation)
• Sum CV2
– (add up all the CVs squared in the column) = 0.3142• Sum CV2/40 (take the sum of the CV squared and
divide by the number in column 1; n=40) = 0.0079• CV pooled is the square root of CV2/40 = 0.0886• % RSD is CV pooled times 100 = 8.86 = SD2• 95% confidence (k=2)
56

QMS Quick Learning Activity
Combined Relative Standard Deviation (SDc) = √ [SD1² + SD2²]
• SDc = √ [(3.79)2 + (8.86)2] • SDc = √ [14.36 + 78.49]• SDc = √ [92.85] = 9.64%
Expanded MU @ 95% Conf (k=2) = SDc x 2 = % RSD
– 9.64 x 2 = 19.28% RSD
57
QMS Quick Learning Activity
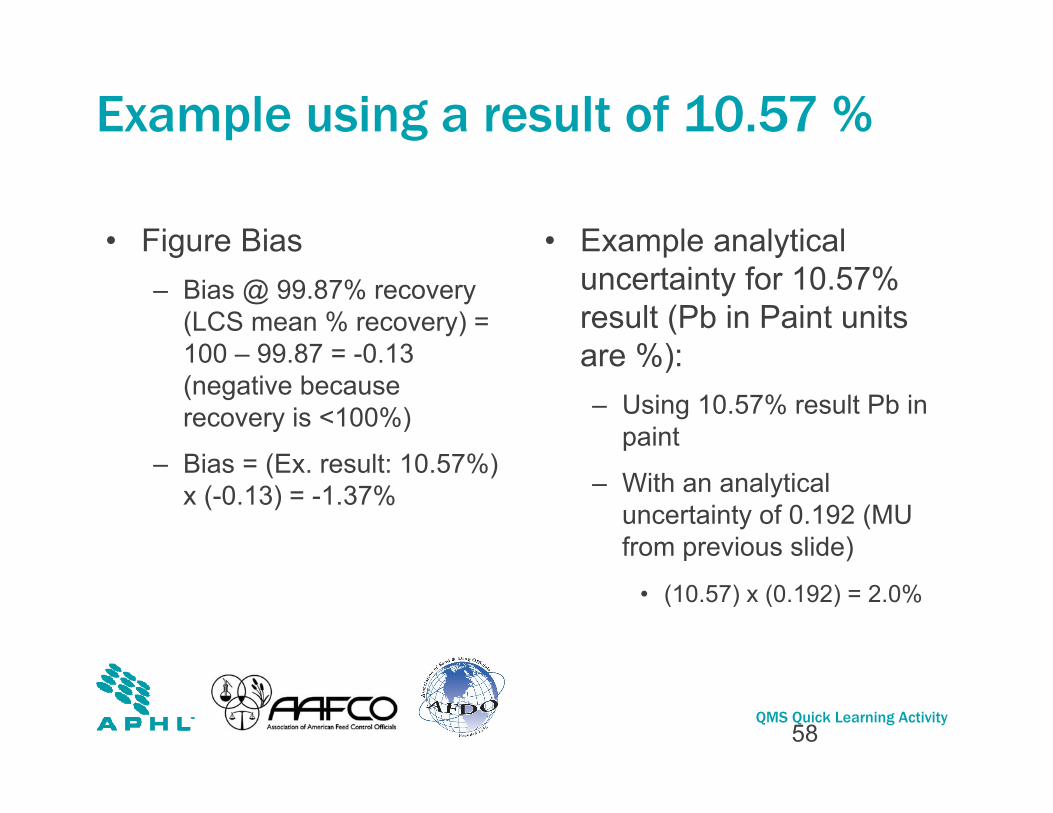
Example using a result of 10.57 %
• Figure Bias– Bias @ 99.87% recovery
(LCS mean % recovery) = 100 – 99.87 = -0.13 (negative because recovery is <100%)
– Bias = (Ex. result: 10.57%) x (-0.13) = -1.37%
• Example analytical uncertainty for 10.57% result (Pb in Paint units are %): – Using 10.57% result Pb in
paint
– With an analytical uncertainty of 0.192 (MU from previous slide)
• (10.57) x (0.192) = 2.0%
58
QMS Quick Learning Activity
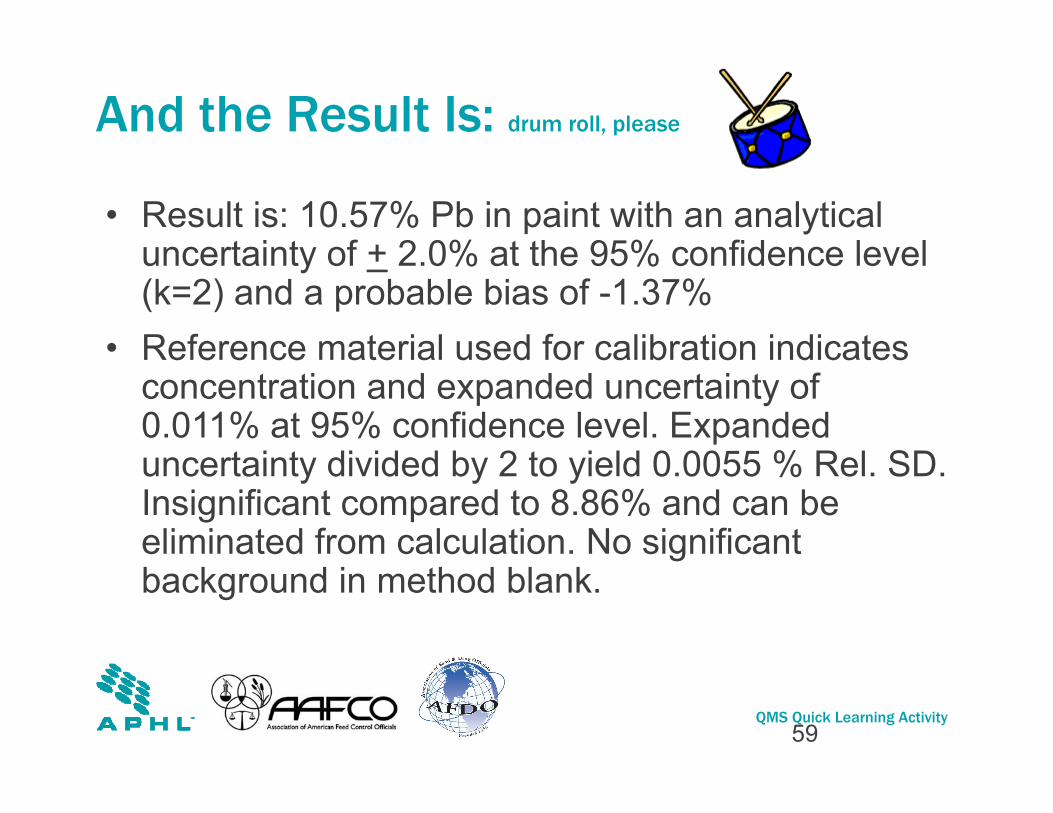
And the Result Is: drum roll, please
• Result is: 10.57% Pb in paint with an analytical uncertainty of + 2.0% at the 95% confidence level (k=2) and a probable bias of -1.37%
• Reference material used for calibration indicates concentration and expanded uncertainty of 0.011% at 95% confidence level. Expanded uncertainty divided by 2 to yield 0.0055 % Rel. SD. Insignificant compared to 8.86% and can be eliminated from calculation. No significant background in method blank.
59

QMS Quick Learning Activity
What else can I use?
• Least Preferred Option (#4): Proficiency Testing (PT) Sample Data. – In cases where the previous options are not
available and where PT samples are analyzed with sufficient data above the reporting limit, use existing PT sample data to estimate uncertainty.
QMS Quick Learning Activity
What else should I do?
• Update your procedure manuals to indicate:– What you are measuring (the
measurand)
• What variables contribute to uncertainty:– transportation, storage, holding
time, sample preparation, reagent lots, temperature, instruments, operators, barometric pressure, etc.
QMS Quick Learning Activity
Update your procedure manuals:
• List the details of the approaches used (Type A and/or B).
• What calculations are you using? Do they make sense?– Standard deviations, formulas specified in
methods, quality control measurements, etc.)
• Refer to any requirements by accrediting bodies.
• Make sure the procedures are implemented.
• How is it reported when required?– Your laboratory must have the ability to report
uncertainty, even if the customer is currently not requesting it.

QMS Quick Learning Activity
AIHA Guidance on the Estimation of Uncertainty of Measurement
http://www.aihaaccreditedlabs.org/Policies/2016%20Policies/8%202%202%20LAP%20Guidance%20on%20the%20Est%20of%20UoM_R3_FINAL.pdf
63
QMS Quick Learning Activity
AIHA-Examples of Analytical Measurement Uncertainty for Lead in Painthttp://www.aihaaccreditedlabs.org/Policies/Resources/Example%20Chemistry%20Measurement%20Uncertainty%20Calculations%20V3%20corrected%20031312.xls

QMS Quick Learning Activity
References
• ISO/IEC 17025:2005– https://www.iso.org/standard/39883.html
• Learning Aid:– Introduction to Analytical Measurement of
Uncertainty: Dictionary of Terms– Calculating Standard Deviation– Determining Measurement Uncertainty Using
Combined and Expanded Uncertainty