analytical chemistry division quarterly progress report
TRANSCRIPT


ORNL-1474
This document consists of 70 pages.
Copy .5 of 141 copies. Series A.
Contract No. W-7 405-eng-26
ANALYTICAL CHEMISTRY DIVISION
QUARTERLY PROGRESS REPORT
For Period Ending January 10, 1953
M. T. Kelley, DirectorC. D. Susano, Associate Director
DATE ISSUED
m 11 mm
OAK RIDGE NATIONAL LABORATORY
Operated by
CARBIDE AND CARBON CHEMICALS COMPANY
A Division of Union Carbide and Carbon Corporation
Post Office Box P
Oak Ridge, Tennessee
MARTIN MARIETTA ENERGY SYSTEMS LIBRARIES
3 445b D3531AA 1

11
1.
2.
3.
4.
5-6.
7-12.
13.
14.
15.
16.
17.
18.
19.
20.
21.
22.
23.
24.
25.
26.
27.
28.
29.
30.
31.
32.
33.
34.
35.
36.
37.
ORNL-1474
Progress
INTERNAL DISTRIBUTION
Biology LibraryHealth Physics LibraryReactor ExperimentalEngineering Library
Central Research LibraryCentral Fil«
C. E. Lars onI
W. B. Humes (M-2 5)L. B. Emlet (1&12)A. M. WeinberglJ. A. Swartout
E. D. ShipleyE. J. MurphyF. C. VonderLageM. T. KelleyE. H. TaylorA. H. Snell
F. L. SteahlyS. C. Lind
R. C. Briant
J. S. Felton
C. E. Winters
A. Hollaender
K. Z. MorganC. P. Keim
G. H. Clewett
A. S. Householder
D. W. Cardwell
E. M. KingC. D. Susano
G. E. Boyd
38.iT R. B. Briggs
39M: G. W. Parker
m L. J. Brady•M. H. P. House
M. 0. Menis
•-3. C. H. Secoy144. L. E. Burkhart
45. R. N. Lyon46. S. A. Reynolds47. P. F. Thorn a son
48. R. Ro wan, Jr.49. D. E. LaValle
50. A. R. Brosi
51. A. F. Roemer, Jr.52. E. I. Wyatt53. G. W. Leddicotte
54. C. Fe1dm an
55. T. E. Willmarth
56. C. L. Burros
57. J. H. Edgerton58. L. T. Corbin
59. D. D. Co wen
60. P. M. Reyling61. S. D. Schiffman (K-25)62. H. P. Raaen
63. J. C. White
64. w. K. Miller
65. U. Koskela
66. D. J. Fi sh e r
67. G. C. Williams
68. E. P. Wigner (consultant)

69-76.
77 -8 1.
82-85.
86-89.
90-96.
97-100.
101.
102-104.
105.
106-120.
121-124.
125-128.
129-132.
133-134.
135.
136-137.
138-140.
141.
Ar
Atom
Bro
Knoll
General
Los A lam
Mound Lab
New York
Patent Br
Technic aL»;Universi
Carbid
duPont JPompNew B
Sava
Wes<
Id
N
EXTERNAL miBUTION
National Lab
•gy CoN a ti on
mm
1C
ctri
Sci>
Poi
tory
on, Washingtonboratory
Laboratoryompany, Richland (1 copy to A.
ific Laboratory
H. Bushey)
itions Office
Washingtonlation Service, Oak Ridge
fornia Radiation LaboratoryChemicals Company (Y-12 Plant)
anx
any
ck LabdlOpever
use Electri
rations Off
rican Aviat
tory
ions Office, Wilmingtonorporation
1 copy to Phillips Petroleum)Inc.
in

IV
Reports previously
ORNL-686
ORNL-788
ORNL-867
ORNL-955
ORNL-1088
ORNL-1113
ORNL-1129
ORNL-1233
ORNL-1276
ORNL-1361
ORNL-1423
issued in this series are as follows:
Period Ending March 31, 1950
Period Ending June 30, 1950
Period Ending October 10, 1950
Period Ending January 10, 1951
Period Ending March 26, 1951
Period Ending June 26, 1951
Period Ending September 10, 1951
Period Ending December 26, 1951
Period Ending March 26, 1952
Period Ending June 26, 1952
Period Ending September 26, 1952

CONTENTS
Page
ABSTRACT ix
PUBLICATIONS xii
ANALYTICAL CHEMISTRY DIVISION - X-10 SITE
RESEARCH AND DEVELOPMENT 1
Ionic Analyses 1Automatic derivative polarographic titration of uranium and
iron with eerie sulfate 1Evaluation of the new model Q-1338, series no. 1, derivativepolarograph 4
Polarography of uranium in nitric acid solution 4Separation of uranium from other metals by filter paper partition
chromatography 5Separation of mercury from other metals by filter paper partition
chromatography 5Separation of protactinium-233, zirconium-95 and niobium-95 from
thorex process solutions and uranium-233 product 5Colorimetric estimation of nitrate in the presence of uranium ... 6Simultaneous spectrophotometry determination of copper, cobalt,
and nickel as diethyldithiocarbamates 6Electrolytic removal of iron from sulfate solutions of plutonium
by use of a mercury-coated silver cathode 6ORNL Master Analytical Manual 7
Analytical Instrumentation ... 8
Development of an automatically recording, internal-standard, flamephotometer. III. Evaluation 8
Revision of gating circuit of ORNL model Q-945 automatic titrator . 10Revision of ORNL model Q-983 automatic curve-follower installed in
a Q-1160 high-sensitivity polarograph 11Analytical applications of high-frequency oscillators. II. ORNLGridos 12
Microelectrode assembly for pH measurements .... 14
Radiochemical Analyses 15
Nuclear properties 15Decay scheme of cerium-141 15

Gamma energies and half life of cesium-136 15Neutron cross sections for production of scandium-46 and
strontium-8 5 15Experimental search for long-lived titanium-51 15
Instrumental analyses 16
Gamma- and x-ray spectrometry applied to analytical radiochemicalproblems lgDetermination of niobium-95 and zirconium-95 in the presence of
protactinium-233 16Identifications of activities in waste and unknown solutions . . 16Efficiency of thallium-activated sodium iodide gamma-ray
spectrometer < ig
Analysis of radioisotopes 17Determination of actinides 17Paper chromatography lgExamination of radioisotope products for gamma-emitting
contaminants ]o
Fission products joZirconium and niobium in Thorex samples 18
Analysis for heavy elements 19Plutonium analysis by alpha counting 19Determination of actinides in radioisotopes 20Rapid method for UX in uranium solutions 21Miscellaneous analyses 21
Analysis of cyclotron products 22HRP analyses 22
Neutron flux determination of HR No. 1 22Ion exchange and chromatography 23
Analysis for rare earth activities in barium-140-lanthanum-140 . 23Application of paper chromatography in radioisotope analysis . . 23
Activation Analysis 23
Determination of trace quantities of the rare-earth elements .... 23Determination of trace quantities of rare-earth elements in metals
and animal tissue 25Determination of trace quantities of cobalt, arsenic, and strontium
in animal tissue 25Determination of trace elements in soils and water 26Determination of trace amounts of aluminum in rubber 27New applications of neutron radioactivation analysis 27
Spectrochemical Analyses^.^^. ^ 28
VI

Determination of rare earths in thorium 28Determination of rare earths in stainless steel 28Determination of traces of boron 29Determination of traces of precious metals in native iron 29
Inorganic Preparations 30Solid solutions of uranium trihalides in lanthanum halides 30Chromium metal from Cr203 30Purifications and preparations 31
Optical and Electron Microscopy 31
SERVICE ANALYSES 35
Ionic Analyses • 35
Radiochemical Analyses 35
Activation Analyses 35
General Radiochemical Analyses 35
General Analysis Laboratory 35Determination of nitrate nitrogen in uranium oxides and uranylsulfate 35
Ion-exchange separation of calcium and uranium 36Observed interference in potentiometric titration of uranium by use
of the ORNL automatic titrator 37
Laboratory and Semi-Works Control 37
Pilot Plant Control ..... 38
HRE Analyses 40
Isolation Analyses 40
ANALYTICAL CHEMISTRY DIVISION - Y-12 SITE
RESEARCH AND DEVELOPMENT 41
Analytical Studies of Reactor Fuels and Their Components 41
Analytical Studies for the Raw Materials Program 41Indirect ferrous-o-phenanthroline colorimetric determination ofuranium 41
Separation of uranium by partition chromatography 42
VI1

Microdetermination of carbon and hydrogen in organophosphoruscompounds 43
Titration of amines in nonaqueous solvents 43Fluorometric determination of uranium 45Kjeldahl determination of milligram amounts of amines 45
Analytical Studies for the Homogeneous Reactor Program 45
Potentiometric determination of uranium(VI) 45Determination of uranium-to-sulfate and uranium-to-fluoride ratios . 46Determination of uranium(IV) in uranyl oxide 46Determination of microgram quantities of fluoride in uranyl
solutions 47Determination of microgram quantities of zirconium in uranyl
solutions 48Determination of traces of nitrate in uranyl oxide 49Additions to the photomultiplier tube attachment for the Beckman
spectrophotometer 49
Quality Control 49
General Analytical Chemistry Laboratory 50HRP Analytical Chemistry Laboratory 50ANP Analytical Laboratory 50Analytical chemistry laboratories 55
SERVICE ANALYSES 56
Analytical Services for ANP Project 56
Analysis of NaK for beryllium 55Gravimetric determination of zirconium 56Analysis of uranium tetrachloride 56Impurities in lead 56Analysis of alkali hydroxides 56Work for General Electric Co 56Backlog of samples 56
Analysis of Ores and Related Materials 56
Analytical Services for HRP 5g
Miscellaneous Analyses 58
Vlll

ABSTRACT
ANALYTICAL CHEMISTRY DIVISION
X-10 SITE
The development of ionic analyticalmethods has included the filter-paper-partition chromatographic separationof Pa233, Zr95, and Nb9S from Thorexprocess solutions. The chromatographicseparation of uranium from other metalshas been studied with eight additionalradionuclides. The study of a similarchromatographic separation of mercuryfrom other metals is in progress. Acolorimetric method for the determination of nitrate in uranium oxidesis proposed. The new, model Q-1338,series No. 1, derivative polarographhas been received and the evaluationprogram is outlined. The derivativepo larographic electrode system ofReilley, Cooke, and Furman has beenapplied to the determination of uraniumand iron, contained in the same solution, by use of the ORNL model Q-945automatic titrator. The status of theORNL Master Analytical Manual isindicated.
Research on analytical instrumentation has included additionaldevelopmental work on the automaticallyrecording, internal-standard, flamephotometer. The absorption filter ofthe internal-standard optical systemwas replaced by an interference filterthat reflects rather than absorbslight that it does not pass, thusminimizing heat build-up. A mono-chromator that employs a wedge-typeinterference filter is being built.Experimental results that contrastsingle-beam and double-beam operationsof the flame photometer are discussed
and functional diagrams are shown.Also, the gating circuit of the ORNLmodel Q-945 automatic titrator wasrevised to facilitate the setting ofthe diode-adjust potentiometer. Adiagram of the revised circuit isgiven. The circuit of the ORNL modelQ-983 curve—follower has been revisedto increase the stability and sensitivity. The revision is shown dia-gramatically. Design problems encountered in the work on analyticalapplications of the ORNL Gridos arediscussed. A microelectrode assemblyfor the measurement of the pH of smallvolumes of highly radioactive solutionsis described. Incorporation of a glasscapillary in the indicator electrodeeliminates the need for a sample container. The assembly is inexpensive,expendable, and can be used by remotecontrol. A diagram is given.
Radiochemical research has contributed some data on the decay schemeof Ce141. Gamma radiations of 0.83-and 1.06-Mev energies have been foundin Cs136. The neutron cross sectionsfor the production of Sc46 and Sr85have been found to be 21.6 and 1.2barns, respectively. The cross sectionfor the production of along-lived Ti *isomer is believed to be less than 10"barn, on the basis of preliminaryexperiments. The use of gamma- andx-ray spectrometers is increasing fordirect radiochemical analysis withoutprevious chemical separations. Furtherwork is reported on the determinationof plutonium by alpha counting and onthe measurement of alpha emitters(actinides) in radioisotope products.
IX

Methods are being developed for thedifficult determination of Zr and Nb
in the presence of Pa . A methodhas been completed for determining theHRE flux by measurement of the Cs 36yield. Some applications of ionexchange and paper chromatography arepresented.
A report is made of the applicationof radioactivat ion analysis to thedetermination of trace amounts of rare-
earth elements in metals and animal
tissue; cobalt, strontium, and arsenicin animal tissue; molybdenum anduranium in soil, river mud, and water;and aluminum in rubber. Routine
determinations of sodium, barium,uranium, and vanadium in variousmaterials are described. Also, newapplications of the method that havebeen suggested by inquiries from thepublic are mentioned.
Spectrochemica1 procedures aredescribed for the determination of
rare earths in thorium and stainless
steel, of traces of boron in graphiteand aluminum, and of precious metalsin native iron.
An improved procedure is reportedfor the preparation of LaCl3 for usein studies of solid solutions ofuranium trihalides in lanthanum
halides. Also, a solid solution ofUF 3 in LaCl3 was made. Metallicchromium was prepared from Cr203 foruse in the proposed study of stablechromium isotopes by the PhysicsDivision.
Optical and electron microscopywere employed to show the nature oflamellar pearlite in the nodularstructure of type B-23 steel. Evidencewas acquired that shows that etchingtime is critical in the replication of
surface detail of a metal that contains more than one constituent.
Special problems encountered in theservice analytical work are discussed,and a tabular summary of the work isgiven. Procedures are described forthe determination of nitrates in
uranium oxides and uranyl sulfate andthe ion-exchange separation of calciumand uranium and of uranium and thorium.
The possibility of a plutonium quenching effect on the fluorometric determination of uranium is indicated.A solvent-extraction procedure for theremoval of zirconium and niobium
from plutonium in the analysis ofPurex process samples is described.
ANALYTICAL CHEMISTRY DIVISION
Y-12 SITE
Analytical Studies for the ANPprogram have been of a diversifiednature during this period, with primaryinterest given to the developmentof a volumetric method for the determination of zirconium. Also, methodshave been adapted for the identification and determination of impuritiesin the proposed ARE fuel eutectic(NaF-ZrF4-UF4) and its components.
Relative to the Raw Materials
program, an indirect method for thedetermination of uranium has beendeveloped. This method is based onthe measurement of the ferrous-o-
phenanthroline complex formed whenuranium(VI) reduces iron(III) in thepresence of the complexing agent. Anapparatus for the separation of uraniumin Bartow-clay solutions by means ofpartition chromatography has beenassembled. Application of thistechnique to other phosphatic-basematerials indicated that the method was
empirical with respect to the constituents present. The titration ofhigh-molecular-weight amines in nonaqueous solvents has been shown to bea versatile, sensitive, and accuratemethod for their determination.
An investigation of the precisionof the potentiometric determinationof uranium(VI) in the presence oftrace quantities of iron(III) andchromium(VI), is under way. Thecontemplated chloranilic acid methodfor the determination of uranium(IV)has proved to be promising. Improvedprecision and sensitivity were obtainedby use of Chrome Azurol S dye for thedetermination of traces of fluoridein uranyl sulfate solutions. Work on
the determinations of traces of zir
conium and nitrate in uranyl solutionshas also continued. Modifications of
the photomultiplier tube attachmentfor the Beckman spectrophotometer havebeen made to increase the sensitivityof the instrument.
Statistical analyses have been madeof quality control data for 72 typesof determinations. A tabular summaryof results is presented.
The analytical work for the ANP,HRP, and Raw Materials projects, andother miscellaneous services are re
viewed briefly. A total of 32,475determinations was made by 48 analysts.A tabulation of the distribution of
personnel and work is given.
xi
PUBLICATIONS
M. L. Druschel, 0. Menis, and R. Rowan, Jr., Modifications of the Dimethyl-glyoxime Method for the Colorimetric Determination of Nickel Based on the Useof Potassium Persulfate as the Oxidant, ORNL-1430 (Nov. 3, 1952).
H. P. House, Analysis of South Dakota Lignite, Y-B31-396 (Dec. 11, 1952).
XII

ANALYTICAL CHEMISTRY DIVISION - X-10 SITE
RESEARCH AND DEVELOPMENT
IONIC ANALYSES
P. F. Thomason
Automatic Derivative Polarographic
Titration of Uranium and Iron with
Ceric Sulfate (A. D. Horton, P. F.Thomason, M. T. Kelley). Reilley,Cooke, and Furman * ' have made adetailed study of derivative polarographic titrations in which a model GBeckman pH meter was used to indicatethe potential changes at the end pointsof the titrations. A constant current
of about 2 fJ-a. was applied to the twoplatinum electrodes in the titratingvessel by means of a 45-volt B batteryconnected in series with a 20-megohmresistor.
In the studies, iron(III) andvanadium(V) were determined by reducingthem to iron(II) and vanadium(IV) bymeans of a lead reductor and thentitrating with ceric sulfate solution.The method is reported to give verysharp potential changes at the endpoints, as compared with the gradualchanges that occur at potentiometricend points.
Exploratory studies have been madeto determine the feasibility of theuse of the ORNL model Q-945 automatictitrator that has the gate circuit* 'for the derivative po 1 arogr a'phi ctitration of iron as an impurity inuranium. Four conditions that mayeffect this determination have beenproposed. First, uranium(VI) wouldbe reduced to uranium(IV) and iron(III)would be reduced to iron(II) by theaddition of an excess of chromium(II).The chromium(II) would be prepared by
(1)C. N. Heilley. W. D. Cooke, and N. H.Furman, "Derivative Polarographic Titration,"Anal. Chea. 23. 1223 (1951).
(2)tl. T. Kelley, J. L. Horton, J. R. Tallackson,and F. J. Miller, An Automatic Recording Titratorfor Micro- and Haero titrations. Paper presented atthe meeting of the Instrunent Society of America,Cleveland, Ohio, Sept. 11, 1952.
passing a saturated solution ofchromium potassium sulfate through aJones reductor. Second, gold insteadof platinum electrodes would be usedin the titration vessel because there
is a tendency for platinum to catalyzethe oxidation of chromium(II) byhydrogen ions. Third, the constantcurrent to the electrodes would be
about 2 fJ-a. and the titrant would beceric sulfate solution. These condi
tions are the same as those in the
work of Reilley, Cooke, and Furman.* 'Fourth, the titration, if successful,would include Redox-step titrationsof chromi.um( 11) to chromium! III) ,uranium(IV) to uranium(VI), and iron(II)to iron(III).
Solid FeS04'(NH4)2S04-6H20 and agravimetrically standardized solutionof U02S04 that contained 298.7 mg ofuranium(VI) per milliliter were usedto prepare the three test solutions.Each solution contained 1.195 mg ofuranium(VI) per milliliter and either11.95, 59.75, or 119.5 /Kg of iron(II)per milliliter.
One-mi 1liliter aliquots of eachsolution were titrated under the
conditions stated, and the resultswere recorded by the Brown recorder ofthe model Q-945 automatic titrator onchart paper that was calibrated ininches on the abscissa vs. potentialon the ordinate.
During the first titration, thepotential changes at the end pointswere beyond the 1-volt range of theBrown recorder, and it was necessaryto add an additional 20-megohm resistorin the electrode circuit. This made
a total of 40 megohms of resistance,thus producing an applied current ofabout 1 jUa.
The titration curves and end pointswere very erratic at room temperature

ANALYTICAL CHEMISTRY DIVISION QUARTERLY PROGRESS REPORT
because of the slow rate of the ceric-uranous reaction. The use of a CO-
atmosphere for the titration resultedin a slight improvement in the curves.Finally, heat was applied to thetitration cell by means of an infraredlamp. The regularity of the curvesand the sharpness of the breaks weregreatly improved. The best resultswere obtained at solution temperaturesbetween 55 and 60°C.
Table 1 shows the results obtainedby the titration of several 1-mlaliquots of each test solution. Arecording of the successive steps inthe Redox titration is shown in Fig. 1.The optimum conditions for the titrationof cerous, uranous, and ferrous ions,in addition to those stated in theproposed conditions, are: (1) the use
of a C02 atmosphere in the titrationvessel to eliminate oxidation of the
ions by atmospheric oxygen, (2) theuse of heat to speed up the rate ofthe slow uranium(IV)-cerium(IV )reaction and to improve the sharpnessof the chromium(II)-ceriumfIV) andiron(Il)-cerium(IV) curves, and (3) anapplied current of approximately 1 fj.ato bring the potential change at theend points within the range of theBrown recorder.
The results indicate that theproposed titration is entirely feasible. There are several sources oferror, most of which will produce highresults in the iron determination. A
spectrophotometrie analysis of thereagent-grade ceric sulfate showed thatit contained approximately 50 ppm of
TABLE 1. DERIVATIVE POLAROGRAPHIC TITRATION OP IRON
IN STANDARD URANYL SULFATE SOLUTION*
TEMPERATURE OF TESTSOLUTION (°C)
55
CHART TRAVEL PER REDOX STEP" (in.) IRON (Mg)
U(IV) to U(VI) Fe(II) to Fe(III) Taken Found
Titration withReagent-Grade Ce(904)2 Solution, ~0. 03 N
12.32
12.24
12.15
0.26
0.33
0.33
11.95
11.95
11.95
11.95
15.17
15.17
Diffe
0.00
+3.22
+3.22
Titration with Iron-Free, Reagent-Grade Ce(S04)2 Solution, ~0. 03 N
60
60
60
60
13.90
13.81
14.32
14.36
14.38
14.99
15.08
14.93
14.52
14.47
14.68
14.72
14.71
11.95
11.95
11.95
11.95
11.95
59.75
59.75
59.75
59.75
59.75
119.5
119.5
119.5
11.55 -0.40
12.35 +0.40
12.72 +0.77
12.34 +0.39
12.34 +0.39
60.87 +1.12
60.12 +0.37
59.75 0.00
60.91 +1.16
59.36 -0.39
123.40 +3.9
124.10 +4.6
126.10 +6.6
'Uranium concentration = 1. 195 mg of uranium(VI) per milliliter; iron concentration as indicated.
"Volume of sample titrated = 1.0 ml.

IRON (II)= IRON (I)
URANIUM BREAK (NONREVERSIBLE)
CHROMOUS BREAK -
CHROMIUM (I)=CHROM»JMan)
PERIOD ENDING JANUARY 10, 1953
URANIUM: I.l95mg
IRON: 11.95/igCHROMOUS ION; EXCESS
SOLUTION TITRATED: 1.0 ml
TITRANT:~0.03/V CelSO^.IRON FREETEMPERATURE: 55 TO 60°C
INSTRUMENT' ORNL MODELQ-945 AUTOMATICTITRATOR
0.4 0.5 0.6
POTENTIAL (wits)
Fig. 1. Derivative Polarographic Titration Curve for Uranium(IV) to Uranium(VI) and Iron(II) to Iron(III). ORNL model Q-945 automatic titrator.

ANALYTICAL CHEMISTRY DIVISION QUARTERLY PROGRESS REPORT
iron. A qualitative analysis of thechromium potaslsiifm sulfate indicatedthe presence of iron.
Once the feasibility of the procedure was established, work was begunto improve the accuracy and precisionof the titrations. The major sourceof iron interference was eliminated bythe removal of iron from the cericsulfate. Iron-free ceric sulfate wasprepared by electrolyzing saturatedcerous sulfate solution in a mercury-cathode cell at a current of approximately 1 ampere. A platinum wire wasin contact with the mercury-poolcathode, and the anode was a platinumwire inserted in a fritted tube filledwith 2 N H2S04. During the removal ofthe iron, a small amount of mercurywas dissolved in the solution. After
the mercury pool had been drained fromthe cell, the mercury was plated fromthe solution onto a silver-stripcathode. The purified cerous sulfatewas oxidized to ceric sulfate byreplacing the silver cathode with aplatinum wire and reversing thecurrent. This solution of purifiedceric sulfate was diluted to about0.03 N and used for most of thetitrations. The results improvedconsiderably. Work will be continuedon the purification of the standardsolutions and reagents in an effortto obtain precise and accurate resultsby use of this method.
Evaluation of the New, Model Q-1338,Series No. 1, Derivative Polarograph(H. H. Miller, M. T. Kelley, D. J.Fisher, L. A. Meeks(3)). The InstrumentDepartment has completed the construction of the model Q-1338, seriesNo. 1, derivative polarograph thatwas designed by M. T. Kelley, D. J.Fisher, and L. A. Meeks. The instrument is being tested to determine itsstability and sensitivity and thedegree of accuracy and precision itwill permit in measuring the diffusioncurrents for ions with half-wave
(3)ORNL Instrument Department.
potentials that differ by less than0.2 volt. A detailed report will beprepared when the evaluation is completed.
Polarography of Uranium in Nitric
Acid Solution (H. P. Raaen). Thenature of samples that are to beanalyzed polarographically for uraniumfrequently requires that nitric acidsolution be used as the supportingelectrolyte. A literature searchhas shown that the polarography ofuranium in nitric acid medium has notbeen systematically investigated,although the polarography of uraniumin several other acid media has beenstudied by Harris^4* and by Kritchevskyand Hindman.*5 *
A study of uranium polarography innitric acid medium by use of the ORNLhigh-sensitivity polarograph isplanned. The reproducibility of thepolarograms of the supporting electrolyte will be considered, and particularattention will begiven to the possibledissolution of mercury by nitrousacid, which may be present as animpurity in the nitric acid reagentor may be formed by the reaction between mercury and nitric acid. Thepotentials of the uranium(III)-uranium(IV) and uranium(V)-uranium(VI)couples in nitric acid will be determined by the use of uranyl nitrate.A determination will also be made of
the dependence of the half-wave potentials of the waves of the uranylpolarogram on the concentrations ofthe hydrogen, nitrate, and uranylions. From this information, it shouldbe possible to establish the optimumconditions for the quantitative sub-microdetermination of uranium and thedependence of the diffusion current onuranyl ion concentration.
W. E. Harris, Extracts from a Thesis on thePolarography of Uranium, CC-2702 (April 4, 1945).
E. S. Kritchevsky and J. C. Hindman, "ThePotentials of the Uranium Three-Four and Five-SixCouples in Perchloric and Hydrochloric Acids,"J. Am. Chem. Soc. 71, 2096 (1949).
(6)A. N. Kappanna and K. M. Joshi, "The Reaction
Between Mercury and Nitric Acid. A KineticStudy," J. Indian Chem. Soc. 25, 547 (1948).

A temperature-control system wasdesigned and built by H. Hemphill andN. D. Lee for use in this work. Itprovides control of the temperaturewithin the electrolysis cell, when thesolution is undisturbed, to ±0.02°Cor better, without employing a waterjacket that is fixed to the cell.
The results of this study will bedirectly applicable to the submicro-determination of uranium after itsseparation from other metals by filter-paper partition chromatography, asdescribed earlier.
Separation of Uranium from OtherMetals by Filter-Paper Partition
Chromatography (H. P. Raaen, W. D.Shults, II). The study of the micro-separation of uranium(VI) from othermetals by filter-paper partitionchromatography with H20-saturated2-methyltetrahydrofuran containing2.5 vol % of concentrated nitricacid(4) was extended to eight additional metals. The effectiveness ofthe separations was determined by useof radionuclides of the metals andsubsequent autoradiography of thechromatograms. The results aresummarized in Table 2 and will bediscussed more fully in an ORNL topicalreport. A paper on this subject waspresented at the Southwide ChemicalConference of the American Chemical
<T>, Raaen and P. F. Thomason, "Separationof Uranium(VI) from Other Metals by Filter-PaperPartition Chromatography," Anal. Chem. Quar. Prog.Rep. June 26. 1952, ORNL-1361, p. 12.
TABLE 2. SOME ADDITIONAL RADIOISOTOPES
FROM WHICH URANIUM-233 SEPARATES
SEPARATED RESULTS
Wi thoutMove ment
WithMoveme n t
NOT
CONCLUSIVE
Ag110 As73-74 W18S
Cs137 Se7S
Pm147 In192
Pa233
PERIOD ENDING JANUARY 10, 1953
Society at Auburn Polytechnic Instituteon October 23.
Separation of Mercury from OtherMetals by Filter-Paper Partition
Chromatography (H. P. Raaen, W. D.Shults, II). . Mercury was indicated tobehave in a manner similar to uraniumin filter-paper partition chromatography with 2-methyltetrahydro-furan.(7) This suggested a possiblemethod for the microseparat ion ofmercury from many other metals; however, discrepancies exist in theliterature'8,9,10) regarding thebehavior of mercury in this chromatographic system. Also, studies withthree different samples of Hg (N03)2showed irreproducible behavior of themercury. Experiments are in progressto determine whether factors such asthe valence state of the mercury,purity of the radioisotope, or peroxidecontent of the eluting solvent affectthe behavior of mercury.
Separation of Pro tactinium-233,
Zirconium-95, and Niobium-95 fromThorex Process Solutions and Uranium-
233 Product (E. I. Wyatt, H. P. Raaen,W. S. Lyon). The method of separatinguranium from other elements by use offilter-paper partition chromatographywith water-saturated 2-methyltetrahydrofuran containing 2.5 vol % ofnitric acid' ) was used in a study ofThorex process samples to indicate theefficiency of the separation of Uat various stages in the process andto check the purity of the finishedproduct. Protactinium-233, Nb , andZr were separated from each of twoprocess solutions and also from theU233 product. They were identifiedby scinti11 at ion-counter studies of
*8)T. V. Arden, F. H. Burstall, G. R. Davies,J. A. Lewis, and R. P. Linstead, "A New Method forthe Separation, Detection, and Estimation ofInorganic Compounds, • Nature 162, 691 (1948).
(9)T. V. Arden, F. H. Burstall, and R. P.Linstead, "A New Method for the Detection andDetermination of Uranium," J. Chem. Soc. S63,311 (1949).
(10)J. A. Lewis and J. M. Griffiths, "InorganicChromatography on Cellulose. IV. Determinationof Inorganic Compounds by Paper-Strip Separationand Polarography," Analyst 76, 388 (1951).

ANALYTICAL CHEMISTRY DIVISION QUARTERLY PROGRESS REPORT
the chromatographically resolved bandsof nuclides. The effectiveness of
the chromatographic technique inseparating U from the other threenuclides was demonstrated independentlyby separation studies in which Uand only one of the other nuclides wereused.
The results of these experimentssignify that the U product of theThorex process contains Pa , Nb ,and Zr impurities and suggest thatseparation of the U might possiblybe effected at an earlier stage in theThorex process by use of a cellulosesheet or column chromatographicoperation.( ' The separation of Ufrom Pa is believed to be the first
chromatographic separation of thesetwo nuclides.1 ; The details of this
work will be reported in an ORNLtopical work.
Colorimetric Estimation of Nitrate
in the Presence of Uranium (J. M.Chilton, H. T. Cutcher). Further workon the colorimetric determination of
nitrate impurities in uranyl sulfatesolutions by the brucine method' 'indicated that a number of variables,including the amount of water addedand the length of time before chillingthe solution in the color-developmentprocedure, affected the result obtained. Rather than attempt toformulate the optimum conditions forthis procedure, it was preferred toinvestigate the phenoldisulfonic acidcolorimetric procedure.' ' Thephenoldisu1fonic acid reagent wasprepared exactly as described bySnell and Snell.' * The standarddeviation of the method was found to
H. Weil, "Chromatographic Technology inRadioisotope Separation. Part I. ChromatographicEquipment," Atomics 1, 230 (1950).
(l2)Ibid., Tart II. Applications," p. 345.esp. p. 351.
( 13)v J. M. Chilton, "Colorimetric Estimation of
Nitrate in the Presence of Uranium, " Anal. Chem.Quar. Prog. Rep. Sept. 26. 1952. ORNL-1423 (inpress).
' 'F. D. Snell and C. D. Snell, ColorimetricMethods of Analysis, 3rd ed., Vol. II, p. 792,Van NoBtrand, New York, 1949.
be 1.7%. The analysis of aliquotsof a standard nitrate solution gavethe same results in the presence andabsence of added nitrate-free uranium
salts. A description of this methodwill be written for inclusion in the
ORNL Master Analytical Manual.Simultaneous Spectrophotometrie
Determination of Copper, Cobalt, and
Nickel as Diethyldithiocarbamates (J.
M. Chilton). A paper describing thiswork was presented at the SouthwideChemical Conference of the American
Chemical Society at Auburn PolytechnicInstitute on October 24.
Electrolytic Removal of Iron from
Sulfate Solutions of Plutonium by Useof a Mercury-Coated Silver Cathode
(F. J. Miller). Several factors thataffect the electrolytic removal ofmilligram quantities of iron fromsulfate solutions of plutonium werestudied. The limiting conditions ofacidity, current density, cathodearea, temperature, and other factorsare discussed below.
An increase in the acid concen
tration of the sulfate solution of
plutonium above 2.0 N prevents theremoval of iron from the solution.
Above this concentration, iron is notremoved even by an increase in thecurrent density, cooling of the solution, and vigorous stirring duringelectrolysis. It is recommended thatthe acid concentration of the solu
tion should not exceed 1.8 N.
A current density of 0.2 amp/cm2is sufficient to remove milligramamounts of iron from sulfate solution
in 1 hour. If plutonium is present,a current density of 1.0 amp/cm2 isrequired to remove the same amount ofiron in the same length of time. Thetime of removal may be shortened to10 min by increasing the current to3.0 amp, but vigorous frothing ensuesand loss of sample may result.
The cathode area limits the amountof mercury held on the silver cathodeand, consequently, the amount of ironthat can be removed from the solution.

Unless sufficient area is allowed, themercury becomes saturated with ironand no further removal of iron takesplace. A 1-cm area should be allowedper milligram of iron to be removed.
The presence of strong oxidizingagents in the solution is deleteriousto the deposition of iron and willcause the mercury of the cathode tobe partly dissolved. The presence ofmercury in the solution will preventaccurate titrations of the plutonium.
If a potential is not applied tothe electrodes prior to their immersionin the solutions, part of the mercuryon the cathode is immediately dissolved,even by dilute sulfuric acid, andtraces of mercury will still be foundin the solution after prolongedelectrolysis. If the voltage is notmaintained on the electrodes duringtheir removal from solution, not onlywill mercury be left in the solution,but the iron that has been removedwill be dissolved off the electrode.
Cooling the solution during electrolysis will effect a noticeableincrease in the amount of iron removed.
This is probably caused by a reductionin the solvation action of the solu
tion with decrease in temperature.
ORNL Master Analytical Manual (H.P. Raaen). It is anticipated that theORNL Master Analytical Manual will beissued early in January. The followingmethods have been edited and will be
included in the sections indicated.
Section 0, Editorial Instructions1. Organization of the ORNL Master
Analytical Manual and Numberingof the Methods
2. Writing Methods for the ORNLMaster Analytical Manual
3. Authorization and Classificationof Methods for the ORNL Master
Analytical Manual I4. Typing and Printing Methods for
the ORNL Master Analytical Manual5. Maintenance of the ORNL Master
Analytical Manual
PERIOD ENDING JANUARY 10, 1953
Section 1, Ionic Methods1. ORNL High-Sensitivity Polaro
graph2. Analysis of Gas Mixtures3. Calcium, Semimicro Volumetric
Oxalate Method
4. Carbon in Alloys, SemimicroGravimetric Method
5. Ethylenediamine or Propylenedi-amine in Aqueous Solutions,Volumetric Method
6. Fluoride, SpectrophotometricThoron Method
7. Fluoride, Volumetric Method8. Sulfate, Polarographic Method9. Uranium, Ammonium Thiocyanate
Colorimetric Method
10. Water, Karl Fischer VolumetricMethod
11. Zirconium, Microspectrophoto-metric Thoron Method
Section 2, Radiochemical Methods1. Barium Activity in Aqueous or
Organic Solutions2. Iodine Activity in Aqueous Solu
tions
3., Iodine Activity, Gamma Ion-Chamber Method
Section 3, Spectrographic Methods1. Measurement of Relative Chemical
Concentrations
2. Calibration of PhotographicEmulsions for SpectrographicAnalyses
Section 9, Process Methods1. Chromium in ANP Fuel Eutectic,
Spectrophotometric Method2. Iron in ANP Fuel Eutectic,
Spectrophotometric Method3. Nickel in ANP Fuel Eutectic,
Spectrophotometric Method4. Zirconium in ANP Fuel Eutectic,
Spectrophotometric Method5. Fluorides in ANP Fuel Eutectic
and Other Salts, Micropyro-hydrolysis Method
6. Free Acid in Thorex Process
Solutions
7. Uranium in HRE Solutions, Ammonium Ciuranate Gravimetric
Me tho d

ANALYTICAL CHEMISTRY DIVISION QUARTERLY PROGRESS REPORT
ANALYTICAL INSTRUMENTATION
D. J. Fisher H. L. Hemphill
Development of an AutomaticallyRecording, Internal-Standard, Flame
Photometer. III. Evaluation (M. T.Kelley, D. J. Fisher, H. L. Hemphill,N. D. Lee, C. Feldman, W. Pruessner).The automatically recording, internal-standard, flame photometer that isbeing developed has been discussedpreviously.'ls'16^ Functional diagramsthat illustrate the principles ofoperation of the ratio-and-controlcircuit have been prepared. Theoperation of the circuit that isused for recording the single-beam,photomultiplier output for the internalstandard is shown in Fig. 2, where itcan be seen that the Brown recorder
functions as a millivolt recorder in
the usual manner. Figure 3 showsthe principles of the double-beamoperation of the flame photometer.In the double-beam operation, thebalance slidewireof the Brown recorder
is not used. In its place, a helipotslidewire that is geared to the bullgear of the recorder functions as therecorder-balance slidewire. The
Brown servo balances the signal fromthe sample photomultiplier againstthe reference signal from the internal-standard photomultiplier. The Brownrecorder therefore records the ratio
of the output of the sample photomultiplier to the output of theinternal-standard photomultiplier.
The optical system of a model BBeckman spectrophotometer is nowused as a sample monochromator. Atfirst, a composite, glass filter wasused for the monochromator of the
internal standard. It appeared that
M. T. Kelley and D. J. Fisher. "Developmentof an Automatically Recording, Internal-Standard,Flame Photometer. I. 100% Feedback, Impedance-Matching, Direct-Current Amplifier," Anal. Chem.Quar. Prog. Rep. June 26. 1952, ORNL-1361, p. 4.
' M. T. Kelley and D. J. Fisher, "Developmentof an Automatically Recording, Internal-St andard,Flame Photometer. II. Ratio and Control Circuit,"Anal. Chem. Quar. Prog. Rep. Sept. 26, 1952.ORNL-1423 (in press).
heating of this filter caused considerable long-term recorder drift.An interference filter was chosen to
transmit the desired internal-standard
emission line and has proved to be asuperior filter for this application.The filter reflects rather than absorbs
the light that it does not pass. ABausch and Lomb, wedge-type, interference filter has been obtained,anda positioning device is being builtso that the filter may be used as themonochromatorfor the internal standard.
At a later time, the model B Beckmanspectrophotometer may be replaced by asimilar wedge-type monochromator,designed so that both photomultiplierssee the flame under like conditions.
In the instrument as it was first
built, no special precautions weretaken in mounting the 1P21 photo-multipliers. Several suggestions wereoffered by P. R. Bell, Jr. of thePhysics Division regarding remountingof the photomultipliers in the photometer. These suggestions werefollowed, and increased stability ofthe output of the photomultipliersresulted. Several 1P21 tubes were
found to be too noisy; however, theywere not new tubes. Ground-glassdiffusing screens were added to ensurethat the light from the monochromatorsis spread out over the photocathodes.It was found that prior deaeration oftest solutions by heating resulted inimproved steadiness of the output ofthe internal-standard photomultiplierand in a somewhat steadier outputratio.
Although the voltage supplied tothe photomultipliers has large effectson the output of a single photomultiplier, the double-beam ratio isinsensitive to fairly wide variationsin the voltage supply. Both RF-typeand series-VR-tube-type regulated-negative- vol tage supplies were tried.It was found that the latter type,such as the ORNL model Q-1210, isadequate.

INTERNAL-STANDARD
PHOTOMULTIPLIER+ .
PERIOD ENDING JANUARY 10, 1953
UNCLASSIFIEDDWG. 18018
INTERNAL-STANDARDEMISSION LINE
=r r\
INVERSION AND
IMPEDANCE-MATCHING,
100 % - FEEDBACK,
CHOPPER-STABILIZED,
d-c AMPLIFIER
MONOCHROMETER
FLAME
REGULAR BROWN
SLIDE-WIRE
-Mvm/v-
-AAA/WV-
SERVO NULLING DRIVE
BROWN AMPLIFIERAND ORNL
PREAMPLIFIER
BROWN BALANCE
MOTOR
Fig. 2. Functional Diagram of Automatically Recording, Internal-StandardFlame Photometer. Circuit shown switched to record internal-standard photomultiplier single-beam output.
Observations of the effect ofinstrument modifications on thestability of the output of the photomultipliers were made by means of alight bulb that was maintained at aconstant voltage and mounted at theflame position. The stability wasalso checked by setting both mono-chromators to the emission line-pairof sodium and burning a solution thatcontained about 15 ppm of sodium. Itwas found that the double-beam ratiowas insensitive to changes in light-
bulb intensity. After a 30-min warmupperiod of the instrument as it wasfirst constructed, the ratio of thephotomultiplier outputs drifted asmuch as 6% in 10 minutes. After a20-min warmup of the present photometer,the ratio of the photomultiplieroutputs is within 1% of its finalvalue. The amount of drift is decreased if a longer warmup period isused. For example, the presentphotometer drifts less than 1/2%after a 30-min warmup, whereas the

ANALYTICAL CHEMISTRY DIVISION QUARTERLY PROGRESS REPORT
UNCLASSIFIEDDWG. 18019
INTERNAL-STANDARD-4PHOTOMULTIPLIER *
+ .
INVERSION AND
IMPEDANCE-MATCHING,
100%-FEEDBACK,
CHOPPER-STABILIZED,
d-c AMPLIFIER
INTERNAL-STANDARD
EMISSION LINE
MONOCHROMETER
IFLAME |
IMONOCHROMETER
SAMPLE
EMISSION
LINE
SAMPLE -<
PHOTOMULTIPLIER
r*HELIPOT
BROWN SLIDE-WIRE
iMA/vW-
BROWN AMPLIFIERAND ORNL
PREAMPLIFIER
h-
SERVO
DRIVE
BROWN
BALANCE
MOTOR
Fig. 3. Functional Diagram of Automatically Recording, Internal-StandardFlame Photometer. Circuit shown switched to record double-beam ratio.
photometer as first constructeddrifted several per cent during thesecond hour.
The photometer is now being testedwith a flame and with various solutions
that contain sample substances andadded internal standards. The results
of this study will determine thefurther development of the photometerthat is needed and will be reportedin the next quarterly report. A
10
manual describing the operation ofthe instrument will be prepared.
Revision of Gating Circuit of ORNL
Model Q-945 Automatic Titrator (M. T.Kelley). The original circuit of thegate in the ORNL model Q-945 automatictitrator(17> made the proper settingof the diode-adjust potentiometerdifficult. The revised gating circuit
(17)Dwg. No. Q-945-1, ORNL Instrument Department.

shown in Fig. 4 has been found tofunction satisfactorily. The propersetting of the diode-adjust potentiometer can be described unambiguouslyin terms of the appearance of anoscillographic trace recorded whilethe titrator is in operation.
Revision of the ORNL Model Q-983
Automatic Curve-Follower Installed in
a Q-1160 High-Sensitivity Polarograph
(M. T. Kelley). The ORNL model Q-983,automatic, polarographic curve-followerhas been described in an Instrument
Department report.(18) The curve-follower that is installed in a
( M. R. Smith, Automatic Curve Follower,Q-983. Report XIII-5, ORNL Instrument Department(Sept. 18, 19S0).
INPUT
-4.5v
TO PIN 9 OF V2 OF DWG. Q 945- 1
PERIOD ENDING JANUARY 10, 1953
model Q-1160 high-sensitivity polarograph has not been completely satisfactory. The fault in the originalcircuit appeared to be an excessivebias that resulted from positive-ioncurrent in the 12AU7 tube. The originalcircuit required a selected 12AU7 tube.Over a period of time, the positive-ion bias increased. To overcome this,the output of the phototube had to beraised by increasing the voltageapplied to the two type-222 penlightbulbs above the value of 1.5 volts
specified in the original design.Still later, the voltage had to beincreased more. As a result, thelives of the penlight bulbs were veryshort and frequent replacements and
0.1 Ufliif
OUTPUT
1N56
©
10M
WW *-T0)w MULTIVIBRATOR
5
©
UNCLASSIFIEDOWG. 18020
• + I50v
VR-105
Fig. Revised Gating Circuit for ORNL Model Q-945 Automatic Titrator.
11

ANALYTICAL CHEMISTRY DIVISION QUARTERLY PROGRESS REPORT
readjustments were necessary; also,the functioning of the curve-followerwas unreliable.
The revised circuit is shown in
Fig. 5. Three changes in the originalcircuit have been made. The heater
voltage of the 12AU7 tube was reducedto 5 volts in order to reduce positive-ion current; a 10-megohm resistorwas connected in series with the
second grid to match the one in thefirst grid circuit; and the voltageat the 0.5-M potentiometer shown inFig. 5 was changed by the addition ofa 6.8-megohm series resistor. Therevised circuit operates satisfactorilywith the old 12AU7 tube and only 1.3volts applied to the two penlightbulbs.
12AU7
2-<£^r
\oa<2w
x'
MOfl>2w
iJ10M I>1w '
UNCLASSIFIEDDWG. 18021
>6.8M
-»<0.5M
>0.22M
Fig. 5. Revised Section of the
Circuit of the ORNL Model Q-983Automatic Curve Follower.
Analytical Applications of High-Frequency Oscillators. II. ORNL
Gridos (M. T. Kelley, E. R. Wagner,D.J. Fisher). In a previous quarterlyreport,(19) it was stated that agrid-dip oscillator, which is essentially a Colpitts type, had beenbuilt and given an initial evaluation.
(19)M. T. Kelley. D. J. Fisher, and E. B.Wagner, "Analytical Applications of High-FrequencyOscillators. II. ORNL Gridos, " Anal. Chem. Quar.Prog. Rep. Sept. 26, 1952, ORNL-1423 (in press).
12
This type of instrument has sincebeen applied to certain analyticalproblems that have necessitated furtherstudy of its design.(20) Methods ofobtaining linearity of response,increased sensitivity, and properoscillator functioning in the analysisof high-conductivity solutions havebeen considered. These problems arevery much interrelated; a circuitchange that would affect sensitivitycould very well also affect linearity,or even necessitate improvement instability.
An empirical approach was taken inconsidering the problems associatedwith each test solution. Estimations
of the dielectric constant and conduc
tivity of the particular solution wereused in designing the oscillator.Recause the range of the oscillatorloads will often be wide, the designprinciples of transmitters wereemployed. As an illustration, aconcentrated aqueous solution of astrong base would have a specificresistance of a few ohms and wouldload an oscillator in a way entirelydifferent from that of a 0.001 Msolution of the same base, which wouldhave a specific resistance of theorder of a thousand ohms.
Obtaining linearity of the Gridosresponse curvehas been a very difficultproblem. A single-valued functionthat is free of any maxima or inflectionpoints usually has to be accepted inlieu of perfect linearity. Thelinearizing of Gridos response curvesby causing the recorder to be suitablynonlinear has been considered but notyet tried. The cell design, oscillatorfrequency, and circuit parameters haveall been found to affect the shape ofthe curves obtained. In order toestablish optimum test conditions, thesolutions are usually studied atdifferent oscillator frequencies in acondenser and in a coil in the tank
?i
(20)Analytical Chemistry Limited Access
uarterly Report for Period Ending Dec. 20, 1952in press).

circuit of the oscillator. The most
promising cell and frequency combinationis then chosen for use in further
work in which the circuit parametersare studied as variables. For instance,the study may lead to a curve that issatisfactory for electrolyte concentrations up to 1 M, but at higherconcentrations the oscillator maycease to function because of the
loading produced by a high-conductivitysolution.
A circuit diagram of a fundamentalColpitts oscillator is shown inFig. 6 as an aid in illustrating themethod of approach to the problems.In the analysis of solutions of lowconcentration and high specificresistance, the oscillator wouldoperate essentially as if it wereunloaded; that is, a small amount ofpower would be delivered to thesolution and dissipated as losses inthe solution. Most of the circuit
losses would be as if they were causedby the d-c resistance of the coil.Therefore the main consideration, withrespect to the circuit, is to obtaina proper LC ratio in the tank circuitthat will tune the desired frequencyrange with stable oscillations. Inthe case of the previously mentioned1M electrolyte solution with a specificresistance of a few ohms, it would benecessary to design the oscillator asa power oscillator. The excitationvoltage and the plate impedance aretwo important factors in the design ofa power oscillator. One of thecritical circuit elements in theColpitts power oscillator is thecapacitor, Cl, that controls the gridexcitation voltage. If this voltageis too high, too much power will beexpended in the grid circuit. If theexcitation voltage is too low, theefficiency of the oscillator is lowand the desired oscillator output willnot be obtained. Because the partof the radiofrequency circuit betweenthe grid and the cathode consists onlyof Cj, the grid excitation voltage
PERIOD ENDING JANUARY 10, 1953
must equal the JAcx drop across Cj.Therefore the excitation voltage is afunction of the capacity, the frequency,and the current in the circuit.
Because the excitation voltage dependsupon the values of the rf circulatingcurrent, the proper grid feedbackcapacity is a function of the circuitlosses. If the power losses causedby the solution are increased by achange of specific resistance of thesolution, the capacity of Cl shouldbe increased in order to obtain a
decrease in Xq. so that the excitationvoltage is proper. In a similarmanner, the effect of the load on theoutput impedance must be consideredin relation to the plate resistance(Rp) of the tube. If the plate outputimpedance is too small, the outputof the tube will not be maximum, and,although the circuit will oscillatefreely when unloaded, it may beunstable or stop oscillating when aheavy load is applied.
The same methods that were employedin the study of'the problem of linearityapply to problems of stability and
UNCLASSIFIEDDWG. 18022
ii , c-^
—1 1
\ 1z) ^ RFC3 RFC J^
x
c< ~ - C2
L
nnmnnrewoip
Fig. 6. Circuit Diagram of aFundamental Colpitts Oscillator.
13

ANALYTICAL CHEMISTRY DIVISION QUARTERLY PROGRESS REPORT
sensitivity. This is especially truebecause these factors are often
interrelated. Increased sensitivityis obtained by substituting a Brownrecorder for a microammeter to monitor
the grid current. Extensive shieldingand filtering have been used toprevent rf from entering the Brownrecorder. Other studies have been
made to determine the effect of temperature on the long-term drift rate ofthe Gridos.
in which a thin, glass wall separatesa test solution from a 0.1 N HC1solution, varies with the hydrogen ionactivity of the solution.^ 2l) Thehalf-cell
KC1 (saU, HgaCljHgmay be replaced by the half-cell
0.1 MKC1, AgCl|Agwithout adversely affecting thisrelationship. By the use of a cellsuch as
Ag|AgCl, 0. 1 N HCl|glass|test solution| |0.1 MKC1, AgCl|Ag,
These techniques have made itpossible to build several prototypeGridos instruments that have been used
successfully to analyze solutions ofdifferent types. It is planned todesign and build a prototype Gridosfor general laboratory use that willbe mechanically stable, well shielded,and convenient for finding optimumcircuit parameters for the variousanalyses requested. Also, the usefulness of the instrument for kinetic
studies and nonaqueous titrationswill be determined. In general, theuse of the Gridos should be advantageouswhen it is desired to eliminate physicalcontact of electrodes with the test
solution, surface effects, or difficulties caused by colloids or precipitates.
Microelectrode Assembly for pH
Measurements (M. T. Kelley, H. L.Hemphill). A need existed for anexpendable microelectrode assembly tomeasure the pH of small volumes ofhighly radioactive RaLa processsolutions. Such an apparatus wouldalso find widespread use in testingother radioactively hazardous solutions.
It has been shown that the emf ofa cell, such as
an apparatus for the determination ofthe pH of small volumes of highlyradioactive solutions has been de
veloped. The apparatus is showndiagrammatically in Fig. 7.
When the assembly is in use, thetips of the reference and indicatorelectrodes are brought into contactwith the test solution. The capillarytube of the indicator electrodetransfers the test liquid into thehalf-cell. The cell is connected to apH meter, from which readings aremade.
The accuracy, precision, and rangeof pH measurements made with thisassembly compare favorably with thoseof measurements made by use of theconventional, commercial electrodeassemblies. The advantages of thistype of cell are the convenient size,low cost, and expendability. Also,it permits the use of small samplevolumes, 25 jil being adequate, eliminates the need for a sample container,and can be operated entirely by remotecontrol.
'i. M. Kolthoff and H. A. Laitinen, pH andElectro-Titrations, 2nd ed. , p. 100, Wiley, NewYork, 1944.
Ag|AgCl, 0.1 NHC11 glass |test solution ||KC1 (sat.), Hg.Cl, |Hg
14

SOLDER JOINTS
SILVER WIRE
(0.005-in.DIA.)
CAPILLARY TUBE
(0.005-mm ID,CORNING 015)
INDICATOR ELECTRODE-
TEST SOLUTION
DE KOTENSKY SEAL
BANANA PLUGS
UNCLASSIFIED0W6. 16023
POLYETHYLENE BLOCK
(lx|x% in.)
0.1 M KCI
DEKOTENSKY SEAL
REFERENCE ELECTRODE
ASBESTOS FIBER
Fig. 7. Microelectrode Assembly
for pH Measurements.
RADIOCHEMICAL ANALYSES
S. A. Reynolds
Nuclear Properties
Decay Scheme of Cerium-141 (W. S.Lyon, B. Kahn<22>). Cerium-141(t1/2 = 30 d) is of interest in thecalibration of gamma-counting equipmentbecause it decays through an excitedstate with the emission of a 0.14-Mev
gamma ray. Freedman and Engelkemeir*23*report the decay to proceed 33%directly to the ground state (0.581-Mev
(22)Health Physics Division.
*23'M. S. Freedman and D. W. Engelkeaeir,•The Radiations of Ce^l and Pa233. " Phys. Rev.79. 897 (1950).
PERIOD ENDING JANUARY 10, 1953
beta) and 66% 0.442-Mev beta followedby the 0.145-Mev gamma. Their valuesof the conversion coefficient, a, are0.25 from spectrometer measurement and0.70 from beta-gamma coincidencemeasurements. Recently, Heath^24)has published work on Ce141 thatindicates a to be 0.46.
The branching ratio and a havebeen determined for Ce141 by 477-coincidence counting to obtain theabsolute disintegrations per minute ofa Ce141 solution and by beta-gammacoincidence counting of an aliquotof the Ce141 solution. These dataindicate that the value of the productfc is 0.30 ± 0.02; / is the fractionof Ce141 that goes through the gammatransition; and c is obtained fromthe expression
c
a =
1 - c
Further, these data indicate that/=0.79, c=0.38, and a=0.61 - valuesthat are at variance with others
reported.<23'24>Gamma Energies and Half Life of
Cesium-136 (W. A. Brooksbank). Thegamma energies and half life of Ceare reported in Neutron Flux Determination of HR No. 1, of thisreport.
NeutronCross Sections for Productionof Scandium-46 and Strontium-85 (W. S.Lyon). The isotopic cross sectionsfor the reactions Sc4s(n,y)Sc46 andSr84(n,y)Sr85 have been found to be21.6 ± 2 x lO'24 and 1.2 ± 0.1 x 10'24cm2, respectively. Only the resultsof these studies are included here
becausea full report will be publishedin the open literature.
Experimental Search for Long-LivedTitanium-51 (S. A. Reynolds). It isknown that Ti51 has a 6-m half life.A few years ago, it was generallybelieved^25) that a long-lived isomerof Tis1 existed; however, nuclear
'24'b. L. Heath, It-Shell Conversion Coefficientof Ce141," Phys. Rev. 87, 1132 (1952).
(25)G. T. Seaborg and I. Perlman. "Table ofIsotopes," Revs. Modern Phys. 20, 593 (1948).
15

ANALYTICAL CHEMISTRY DIVISION QUARTERLY PROGRESS REPORT
shell theory did not predict isomerismin this nuclide.^26' The long-livedactivity assigned to titanium has beenshown to be the result of impurities.
Enriched Ti50 was bombarded in theLITR at a neutron flux of 1013 neutrons/cm 'sec, and the activity thatresulted was studied by observationof gamma decay and measurement ofgamma energies by means of the scintillation spectrometer. Preliminaryresults indicate that the cross section
of Ti50 for production of a long-lived Ti , having the propertiesformerly assigned, is less than 10"5barn.
Instrumental Analyses
Gamma- and X-Ray Spectrometry Appliedto Analytical Radiochemical Problems
(W. S. Lyon, S. A. Reynolds). Thecrystal spectrometer is a powerfultool for the analytical chemist.Recently, several applications havedemonstrated its usefulness.
Determination of Niobium-95 andZirconium-95 in the Presence ofProtactinium-233. It was desired toknow the amount of Zr95 and Nb95contaminant in "23" process solutionsand products that contained largeamounts of Pa2 . Standard radiochemical analytical procedures failedto decontaminate Pa to a degreethat would make beta counting of theZr95 and Nb95 product meaningful.However, by examination of the gammaspectra of the samples over the regionsof highest gamma intensity (0.71-MevZr95, 0.76-Mev Nb95, and 0.31-MevPa233) and by comparison of the areasbeneath the photopeaks with areasunder the photopeaks for known standardsamples similarly examined, an accuratevalue for the total activity that isdue to each nuclide was obtained.
Identifications of Activities inWaste and Unknown Solutions. The
Health Physics Division desired to
(26)J. A. Miskel, E. der Mateosian, and M.
Goldhaber, "The Question of Isomerism in Ti51,"Phys. Rev. 79, 193 (1950).
16
know what activities were presentin a waste sample. A portion of theliquid was placed in a culture tube,the tube mounted on a mounting card,and the assembly placed on the spectrometer. A quick examination of thespectra revealed the activity to bealmost entirely Cs137.
A residue of unknown compositionwas found at the liquid-liquid interfaceof a process extraction column. Aportion of the residue was examinedon the spectrometer and the activitywas identified as I131.
By use of the spectrometer, activities in process solvent samples havebeen found to be, in certain cases,I131 with small amounts of Ru103, andin others, Ru103 and Ru106.
In all these examples, the timerequired for an identification wasgenerally less than an hour, and,unless the sample was a mixture ofseveral nuclides, the identificationusually required only several minutes.Quantitative results may be obtainedby comparison with known standards.
A proportional-counter x-rayspectrometer has been received and putinto use. The design is similar tothat of Bprkowski.(27) Chambersfilled with argon-methane and krypton-methane mixtures are used for workwith x rays of different energies.This instrument has already been usedto aid in identifying Zn6S in an unknown sample by detection of copper xrays that the nuclide emits. From
this information and that obtainedfrom the scintillation spectrometer -that is, that a 1.1-Mev gamma ray wasemitted by the sample - the identification was made quickly.
Efficiency of Thallium-ActivatedSodium Iodide Gamma-Ray Spectrometer(W. S. Lyon, B. Kahn<22 >). Thecounting response of the crystalspectrometer that is located in room
(27)C. J. Borkowski, "Proportional Counter
Spectrometer," Chem. Quar. Prog. Rep. Sept. 30,191,9, ORNL-499, p. 137.

C-6 of Building 4500 has been determined for gamma rays that haveenergies between 280 and 2760 kev. Theequipment has been adjusted to detectpulses within a 10-kev energy increment,that is, a slit-width setting of 1.0at the pulse-height setting that isproportional to kilovolts. The counting rate over the pulse-height settingrange was plotted vs. the pulseheight, and a curve, such as thatshown in Fig. 8 for Ce141, was obtained.The pulse height at the peak isproportional to the energy of thegamma or x ray emitted by the nuclide,and the area beneath the peak, afterbeing corrected for background, is the
40,000
35,000
20 40 60 80
PERIOD ENDING JANUARY 10, 1953
total counting rate caused by photo-electrons produced by the gamma andx-ray quanta in the crystal. Radioisotopes with known photon disintegration rates have been used toobtain the ratio of disintegrationrate to the area under the peak (Fig.9). By use of this "efficiency"curve, quantitative evaluation ofgamma counting data can be made.
Analysis of Radioisotopes
Determination of Actinides (G. W.Smith). The determination of actinides
is described in the section Analysisfor Heavy Elements, of this report.
100 120
ENERGY (kev)
140 160
UNCLASSIFIEDDWG. 18024
180 200
Fig. 8. Gamma Ray Spectrum of Cerium-141. Determined with the thallium-activated sodium iodide crystal spectrometer.
17

ANALYTICAL CHEMISTRY DIVISION QUARTERLY PROGRESS REPORT
UNCLASSIREODWG. 18025
800
SAMPLf
SLIT W
: ON WATCH
DTH: 10 kev
GLASS ON SECOND S HELF
700
600
500
300
100
1000 2000
GAMMA ENERGY (kev)3000
Fig. 9. Variation of Response of
Thallium-Activated Sodium Iodide Gamma
Spectrometer with Gamma Energy.
Paper Chromatography (G. W. Smith).Work on paper chromatography is discussed in Ion Exchange and Chromatography, of this report.
Examination ofRadioisotope Productsfor Gamma-Emitting Contaminants (W. S.Lyon). Various radioisotope productsand other samples have been examinedfor gamma contaminants. The continuedobservation of the 0.51-Mev gamma rayof Sr in the Ca4S product has beenof particular interest. The abundanceof this nuclide has been lower than
that noted before. Calcium-45 productsnow appear with 0.01% Sr85; previously,the quantity of contaminant was atleast 10 times this amount.
A Ni63 product (Ni63-4 HSA) wasprepared by the Operations Divisionfrom high-purity nickel that had beenirradiated in the Hanford reactor.Examination of the dissolved Ni63,before it was given any chemicaltreatment, indicated the presence ofCo , which is produced by the reactionNiS8(n,p)Co58. The Co58 amounted to
18
several per cent of the total originalactivity. After its presence wasobserved, the Co was removed fromthe sample by the Operations Divisionand the cobalt fraction examined. No
Co60 was found, which indicated thatthe original nickel was cobalt-free.The Ni was re-examined after the
cobalt separation, and approximately0.01% Hg203 was found. The Hg203 wasprobably introduced from contaminatedequipment during the Co58 separation.The application of the sodium iodidecrystal spectrometer to the analysisof this one sample indicates theextreme range and versatility of theinstrument.
Fission Products
Zirconium and Niobium in Tho re x
Samples (F. L. Moore). The proposedThorex process will produce solutionsthat contain a high level of Pa233activity. It is known that thiselement will interfere seriously withthe radiochemical analyses for zirconium and niobium. In order to find
the most effective pretreatment forthe removal of Pa233, several liquid-liquid extraction systems have beeninvestigated. In these experiments,equal volumes (6 ml) of aqueous andorganic phases were mixed for 15minutes. The total amount of Pa233activity originally in the aqueousphase was 9.9 x 10⁵ gamma cpm. Theresults are given in Table 3. Eachvalue is the average of the resultsof at least two determinations.
It has been found that zirconium
carrier does not inhibit the extraction
of Pa tracer from aqueous solutionsby diisobutylcarbinol. When a solutioncontaining a total Pa233 alpha activityof 2.4 x 10 cpm was pretreated bydouble extraction with diisobutylcarbinol under the conditions ofacidity given in Table 3 and the extractions were followed by two "scavenges" with Nb20s, less than 0.02% ofthe Pa233 followed through in aradiozirconium determination. If the

PERIOD ENDING JANUARY 10, 1953
TABLE 3. EXTRACTION OF TRACER PROTACTINIUM-233 FROM AQUEOUS
SOLUTIONS WITH VARIOUS ORGANIC REAGENTS
AQUEOUS PHASE ORGANIC PHASEPa233 ACTIVITYEXTRACTED (%)
6 M HC1 5% MDOA*-xylene 95.0
5% MDOA*-chloroform 88.5
O.SJf TTA**-xylene 88.5
2 M HC1 0.5 M TTA**-xylene 95.8
6 MHN03 Diisopropylcarbinol, saturated with 6 M HC1 89.5
6 U HC1 Diisopropylcarbinol, saturated with 6 M HC1 99.6
Diisobutylcarbinol, saturated with 6 M HC1 99.9
•Hethyldioctylamine.
••Thenoyltrifluorace tone.
Thorex process sample was not pre-treated to remove Pa233, 66% of thePa233 tracer was observed to followthrough in the radiozirconium determination. Thus, additional extractionsby the diisobutylcarbinol or additionalprecipitations of Nb2Os may be used toeffect any desired degree of decontamination of the zirconium from Pa
The separation of niobium carrierfrom Pa233 is more difficult. It hasbeen found that oxalic acid (niobiumcarrier is usually prepared in anoxalic acid solution) does not inhibitthe extraction of Pa233 tracer from6 M HC1 with diisobutylcarbinol. However, when niobium carrier is mixedwith Pa233 tracer, the extraction ispoor. Experiments are in progress todetermine whether other complexinganions are present in the carrier orwhether the inhibition is actually aniobium-carrier effect.
Analysis for Heavy Elements
Plutonium Analysis by Alpha Counting(G. W. Smith). The comparison of thetitration procedure with the alphacounting procedure for the analysis ofplutonium product samples'28' wascontinued. The titration analyses ofthree of the samples were repeated.
The results, corrected for iron error,are given in Table 4. Two of the newtitration results agree well with thecounting assays, perhaps fortuitously.
To check the procedures further, a"standard" plutonium solution was usedthat was prepared by L. T. Corbin bydissolving 1.0038 g of plutonium metalof 99.86% purity'2" in HC1 anddiluting the solution to 100 ml togive a solution containing 10.03 mg ofplutonium per milliliter. The resultsof titration analyses on this solutionaveraged about 2% higher than thestated concentration, that is, about10.2 mg of plutonium per milliliter.Counting assays were made by use ofcalibrated volumetric ware and polishedplatinum plates and were counted to±0.6% reliable error as shown in Table5. Based on 400 Mwd/t, the countinganalyses are about 4% high; but because the specific activity of theplutonium is not known with any degreeof certainty, the difference may belarger or smaller than 4%.
' 'G. W. Smith, "Plutonium Analysis by AlphaCounting," Anal. Chem. Quar. Prog. Rep. Sept. 26,1952, 0BNL-1423 (in press).
Obtained from Los Alamos and stated to be400 Mwd/t product (~360g/t).
19

ANALYTICAL CHEMISTRY DIVISION QUARTERLY PROGRESS REPORT
TABLE 4. TITRATION AND COUNTING ASSAYS OF PLUTONIUM PRODUCTS
PLUTONIUM CONCENTRATION (mg/ml)
d FromSAMPLE CODE Titration Assays Counting Assays Calculate
Original New g/t Level Mass Analysis Pulse and MassAnalyses
R8-R
Scrup-R3
Scrup-R5A
28.91
20.07
18.86
26.79*
26.83
19.30
18.39
25.63
19.24
18.17
24.35
19.89
17.92
19.41
18.24
Sampled by use of calibrated volumetric glassware.
TABLE 5. COUNTING ASSAYS* OF "STANDARD" PLUTONIUM SOLUTION**
PLATE NUMBERPLUTONIUM CONCENTRATION (mg/ml)
At 300 Mwd/t At 400 Mwd/t At 500 Mwd/t
1 10.88 10.67 10.50
2 10.92 10.72 10.56
3 10.87 10.65 10.49
4 10.92 10.72 10.56
Avg. 10.90 10.69 10.53
Counting assays made by use of calibrated volumetric ware, polished platinum plates, and countedto ±0.6% reliable error.
**
Contained 10.03 mg of plutonium per milliliter.
The data indicate that countingassays will agree with titration assayson pure plutonium solutions to withina few per cent if the plates that arecounted are essentially weightless,the titration is made by use ofproperly calibrated equipment, and thespecific activity of the plutonium isknown.
Determination of Actinides inRadioisotopes (G. W. Smith). Thescintillation alpha counter'30' and acounter similar to the standard Simpsonalpha counter*31'32' were evaluatedfor the determination of actinides inradioisotope products. An alpha
Designed and built by F. M. Glass of theInstruments Department group of theORNL InstrumentDivision.
20
activity of 150 cpm/mc is tolerated inmost radioisotope products. Thife meansthat if the radioisotope falls justwithin specifications, aO.l-mc sample,if evaporated on a foil mount, wouldhave a count of only 15 cpm. Directplating seemed to be the simplestmethod for obtaining the alpha countand was therefore considered first.It is necessary that the plated samplebe essentially weightless, that is,that its solids content be less thanabout 0.1 mg/cm2. It is assumed thatmethods are available for the separation
(31)J. A. Simpson, Jr., The Proportional Alpha
Counter. CP-1527 (March 28, 1944).(32), . „.
J. A. Simpson, Jr., Manual for theProportional Alpha Counter, Model 1-C. CP-1817(Aug. 25, 1945).

of the alpha emitters from solids thatmight be present in radioisotopeproducts.
The accuracy of the Simpson-typeinstrument for alpha counting in lowranges is limited because large amounts
PERIOD ENDING JANUARY 10, 1953
UX contributes essentially all thebeta activity in recently (within afew years) purified natural uranium, agross beta measurement* ' shouldsuffice to give the desired information. The equation
equilibrium amount = 100 x gross beta cpm/ml of uranyl solutionof UX in solution (%) g of U/liter of uranyl solution x 70 gross beta cpm/mg of U
of beta activity (1 r/hr) will givefrom 2 to 50 cpm above normal background, which is of the order of thealpha activity being determined. Itwas found that a Simpson-type alphacounter assembled from a standard,
methane-gas flow chamber and a NuclearInstrument and Chemical Co. model No.
162 scaling unit would tolerate 3 r/hrof beta activity with a maximum ofabout 1 cpm over normal background.The alpha count of piated radioisotopesin a quantity that does not exceedthis beta activity could be determinedwith an accuracy that depends only onthe solids content and the statistics
of the total number of alpha countstaken.
The scintillation alpha counterused by the Operations Division wasfound to have a tolerance to 3 r/hr ofbeta radiation of about 0.1 cpm abovenormal background (zero), but to haveonly 14% counting yield as comparedwi€n*'the 52% that is characteristic ofthe Simpson-type alpha counter. Thesetting of the discriminator of thescintillation alpha counter is critical,and the counting yield is lower thanthat of the Simpson-type alpha counterby a factor of approximately 4. Forthese reasons, the assembly of thestandard, methane-gas flow chamber andthe model No. 162 scaling unit seemspreferable for determining actinidesin radioisotopes.
Rapid Method for UX in UraniumSolutions (S. A. Reynolds). It wasdesired to measure the degree ofremoval of UX activity (24-d Th234 andits daughter, 1.1-m Pa234) from uranylsolutions in HRE loop tests. Because
was used to calculate the per cent ofthe equilibrium amount of UX thatremained in solution. The numerical
value 70 cpm/mg of uranium was determined by C. L. Burros by gross betameasurements on a uranyl solution ofknown concentration and with UX in
equilibrium with the uranium.*34'The above rapid method was checked
by observing growth of UX in HRE fuelsamples for several days. Comparativeresults for typical samples arepresented in Table 6. The observedaccuracy is adequate for the intendedpurpose.
TABLE 6. EQUILIBRIUM UX ACTIVITY IN
HRE FUEL SOLUTIONS
EQUILIBRIUM UX ACTIVITY (%)
SAMPLEFrom Gross BetaMeasurements
From UX-GrowthMeasurements
1 5 3
2 MOO MOO
3 4 6
4 15 13
5 54 48
Miscellaneous Analyses (F. L.Moore). Special analyses for alphaactivities have been made on secret
AEC samples. Assistance has been givento the control laboratories in the
isolation andpurification ofplutonium.
(33) M. T. Kelley et al., "Gross Beta Activity,"Manual of Analyt ical Procedure s for the 1/235Recovery Process, Method No. 28, OHNL-983 (Aug.20, 1951).
(34) C. L. Burros, unpublished results (1952).
21

ANALYTICAL CHEMISTRY DIVISION QUARTERLY PROGRESS REPORT
Analysis of Cyclotron Products
T. H. Handley
The second phase of work on thedetermination of fission yield vs.mass curves*35' is virtually complete.The laboratory work has been completed,and counting data are to be assembledin proper form.
Good progress has been made in thestudy of ip,t) and (t,p) reactions.*36^A detailed topical report of this workwill soon be issued.
A search for short-lived isotopeswill be made by use of a closed, circulating system that is now beingassembled.
HRP Analyses
Neutron Flux Determination of HRNo. 1 (W. A. Brooksbank). All preliminary experimental work necessaryfor the determination of the neutron
flux of HR No. 1 has been completed.*37'The analyses on the fuel will be madewhen the reactor operates at thedesired power level.
Cesium-136 was chosen as the nuclide
to be used in measuring the flux, forreasons already given. Glendeninreports the half life of Cs136 to be13.7 d and the radiation to be a
0.35-Mev /3~ , followed by two gammarays in cascade, each of approximately0.9 Mev energy.*38' No attempt wasmade to measure beta radiation from
Cs for the purpose of flux determination because of the large amount ofinterfering Cs137 beta radiation. Thescintillation spectrometer was used tomeasure the Cs gamma radiation in
(35)T. H. Handley, "Analysis of Cyclotron
Products," Anal. Chem. Quar. Prog. Rep. March 26,1952. 0BNL-1276. p. 33.
(36)B. L. Cohen and T. H. Handley, An Experi
mental Search for the Dineutron. Part I. Searchfor a Stable Dineutron. ORNL-1382 (Sept. 23, 1952).
(37)W. A. Brooksbank, "Flax Determinations for
the Homogeneous Reactor," Anal. Chem. Quar. Prog.Rep. March 26. 1952. ORNL-1276, p. 34.
(38 ) L. E. Glendenin, The Distribution ofNuclear Charge in Fission. Technical Report No. 35,Laboratory for Nuclear Science and Engineering,MIT, p. 23-8 (Dec. 12, 1949).
22
the presence of Cs137. The gammaenergies experimentally found were0.830 ± 0.025 and 1.06 ± 0.02 Mev.
The half life was found to be 14.2 d,a value that is in good agreement withthat reported by Glendenin.*38'
As has been proposed,*37' threesamples of HR No. 1 fuel, each containing about 10 mg of total uranium,were irradiated in hole C-44 of the
LITR for 4 hr, but at three differentpower levels. The bombarding neutronfluxes, as measured by a cobaltaluminum alloy, were 4.81 x 10 1 2
9.73 x 10¹², and 1.69 * 1013 neutrons/cm 'sec. A radiochemical cesiumseparation was made on the entirequantity of each bombarded sample, andthe gamma spectrum of the separatedcesium was determined by means of thescintillation spectrometer at settingsof PHS = 505, gain = 4, and slitwidth = 1.00 volt. The area under the
1.06-Mev peak that is characteristicof Cs was evaluated graphically.The quantity of uranium that wasbombarded was determined colori-
metrically. The Cs 6 activity wasnormalized to Cs136 activity permilligram of uranium and plottedagainst the neutron flux of the LITR.The resulting calibration curve shownin Fig. 10 will be used to determine
DWG 18026
30
20
10
n
y
12 4 6 8 10 12 14 16 18 20NEUTRON FLUX x10",2,(nejtrons/cm2-sec)
Fig. 10. Reactor Neutron-Flux
Calibration Curve. Based on the 1.06-
Mev gamma radiation of cesium-136.

the neutron flux of the HR No. 1.This will require that a Csl36 blankbe determined on a sample of HR No. 1fuel before agiven period of operationof the reactor in order to correct forthe Cs136 present from previous reactoroperation. When this blank is subtracted from the Cs136 found in thefuel after the 4-hr operating periodand the resulting value is correctedto Cs136 activity per milligram ofuranium in the fuel, the final corrected value may be used to determinethe neutron flux of the HR No. 1 fromthe calibration curve of Fig. 10.
Ion Exchange and Chromatography
G. W. Smith
Analysis for Rare Earth Activitiesin Barium-140-Lanthanum-140. A requestis occasionally made for the determination of the rare earth content ofBa140-La140 product. Because ionexchange seemed to be the only suitablemethod of effecting a rare earthseparation, the ion-exchange techniquesof the Manhattan Project*39' wereconsidered.
Several ion-exchange experimentsthat were made by use of Ce144-Prxand La140 tracers as adjacent elementshave shown that elution of the testsolution through a 120- to 170-meshDowex-50 resin column, 10 by 0.23 cm,with an ammonium citrate solution(50 g of citric acid per liter) of pHapproximately 3.2 effects a completeseparation of the rare earths fromlanthanum in one day. It is believedthat a routine method can be developedthat uses this type of column, a flowpipet, a count rate meter, and arecorder.
Application of Paper Chromatographyin Radioisotope Analysis. A method isneeded for the determination of totalnickel in Crsl product. Both elementsare present in macro amounts in the
<39'ror bibliography see F. C. Nachod, IonExchange, p. 221-2, Academic Press, New York, 1949.
PERIOD ENDING JANUARY 10, 1953
product. The nickel is sometimespresent in amounts equivalent to 2%of the chromium. A paper chromatographic method was thought to beapplicable for the nickel- chromiumseparation, especially if the nickelcould be eluted from the paper stripwithout movement of the chromium.
Preliminary experiments with acollidine-0.4 N HN03 mixture (1:1 byvolume), according to Elbeih, McOmie,and Pollard,*40' showed that nickelmoves with the liquid front and thatchromium does not. The locations ofthe nickel and the chromium were determined by means of hydrogen sulfideand an ultraviolet lamp source,respectively. It seems probable thata suitable method can be developed bywhich collidine or some more volatilesolvent is used to elute the nickelfrom a paper strip for subsequentcolorimetric determination.
ACTIVATION ANALYSIS
G. W. Leddicotte
Determination of Trace Quantities
of the Rare-Earth Elements (W. A.Brooksbank, G. W. Leddicotte). Theusefulness of radioactivation analysisin determining trace quantities of therare-earth elements has been reportedby a number of investigators. Hevesyand Levi*41' have shown that individualrare earths can be determined inrare-earth mixtures. Others, includingKetelle and Boyd,*42' have separatedall the components of rare-earthmixtures by ion exchange. This technique offers a starting point forroutine, quantitative determinations
<40)I. I. H. Elbeih, J. F. W. McOmie, and F. H.Pollard, "The Application to Qualitative Analysisof the Separation of Inorganic Metallic Compoundson Filter Paper by Partition Chromatography,"Discussions Faraday Soc. 7, 183 (1949).
(4l)G. Hevesy and H. Levi, "The Action ofNeutrons on the Rare Earth Elenents," DanskeVidenskab. Selskab. Math.-fys. Medd. 14, No. 5(1936).
<42)B. H. Ketelle and G. E. Boyd, "The ExchangeAdsorption of Ions froa Aqueous Solutions byOrganic Zeolites," J. Am. Chem. Soc. 69, 2800(1947).
23

ANALYTICAL CHEMISTRY DIVISION QUARTERLY PROGRESS REPORT
of the rare-earth elements in a 97 cm, at 100°C by use of 5% ammoniumvariety of samples, such as ores and citrate buffer of pH 3.2 to 3.4. Thebiological materials, by neutron- use of other complexing agents and newactivation analysis. However, certain elution techniques should be considered,factors require consideration before Side reactions must be utilized forroutine analyses can be effected by the determination of certain of thethe combined use of these methods. individual rare-earth elements. For
Theoretically, the rare-earth example, the end products of theelements can be detected by normal reactions
Dy164 JhZ> Dyl«S Jhl> Dy16. _£_> Ho166 (27>3 h) (1)81 h
Gd160_^4 Gd161 _£_^ ^,61 (^7i3 d)3.6 m
Nd148._JLl2^Nd149_J?Z> pm,49 (4? h) (3)1.7 h
radioactivation analysis methods in are used for the determination ofquantities of the order of 10" 1J to dysprosium, gadolinium, and neodymium,10" gram. However, with few ex- respectively. The interference fromceptions, the half lives range from a the end product of the first reactionfew minutes to a few days. Therefore must be considered in the holmiumit is necessary to consider the determination, which employs thepractical sensitivity of detection, reactionthat is, whether a measurable amount n,yof activity is present within some Ho > Ho166 (27.3 h) .time interval after discharge of the The decay schemes of all the rare-sample from the reactor, because the earth radioactivities become factorsseparation procedure could require as in achieving a practical sensitivitymuch time as 48 hours. of detection for these elements. Some
The reported*43' cross sections, study of these complex decay schemesthat is, the probabilities of the *s a necessary part of the investi-nuclear reactions occurring, for the gation.(n,y) reactions of certain of the The preliminary separation of therare-earth elements are not known with rare-earth group from other con-accuracies better than 20 to 40%. stituents in a sample must also beThis might cause overestimation of the considered. Quantitative separationsdetection sensitivity of the procedure. ^y use of a known amount of an inactive
As already indicated, a long time ""*"' ^ asLCerium> shou^ beis required for the separation of each Posslble' BV such * procedure, themember of this element group. The """"-""-earth precipitate isprocedure of Boyd and Ketelle effects ?lss°lved «"i an aliquot of the solutionthe separation of a 270- to 325-mesh " flrSt taken f°r the ""-exchangeDowex-50 resin column, 0.26 cm2 by seParatlon °[ the "re earths. Another
aliquot is then used to determine the(43,ir » „ i r u „ o recovery of the carrier, and thereby
K. Way, L. Fano, M. R. Scott, and K. Thew, fLD „„„ _i r , 'Nuclear Data. NBS Circular No. 499, p. 268 (Sept. rare earths, from the group*• 19S0)- * separation.
24

A method is now being investigatedthat employs the group and individualrare-earth separation proceduresjust described. The optimum conditions for the elution of the in
dividual rare earths from the ion-
exchange column and for their subsequent quantitative determinations willbe established. G. E. Boyd of theChemistry Division has furnishedsamples of all the stable rare-earthelements for this investigation. Todate, optimum elution conditions andcalibrations have been obtained for
radionuclides of holmium, erbium,dysprosium, europium, lutetium, andthulium.
Determination of Trace Quantities
of Rare-Earth Elements in Metals and
Animal Tissue (W. A. Brooksbank, G. W.Leddicotte). Trace amounts of cerium,dysprosium, and neodymium in thoriummetal have been semiquantitativelyestimated by radioactivation analysissupplemented with an ion-exchangeseparation. Cerium, neodymium, andlanthanum were detected in the same
material by spectrographic analysis.It is assumed that the failure of
radioactivation analysis to detectlanthanum could be attributed to the
decay of the 40-h La140, which has aconsiderably shorter half life thanthe half lives of those radioisotopesof cerium, dysprosium, and neodymiumthat were employed in the activationanalysis.
Radioactivation analysis, supplemented with an ion-exchange method, isbeing applied to the determination ofrare-earth elements in hard and soft
animal tissues. The presence of someof these elements was detected in bone,but with difficulty, because theamounts of radioactivity in the eluatesfrom the ion-exchange column weregenerally lower than those detectableby ordinary solution-flow countingequipment.
PERIOD ENDING JANUARY 10, 1953
Determination of Trace Quantities
of Cobalt, Arsenic, and Strontium in
Animal Tissue (W. A. Brooksbank, G. W.Leddicotte, H. A. Mahlman). Tracequantities of cobalt, arsenic, andstrontium have been determined in
animal tissue or homogenates of crudeanimal tissue by radioactivationanalysis. All these elements wereseparated from the sample by precipitation methods after the irradiatedmaterial had been put into solution.A discussion of the analysis for eachfollows.
In the determination of cobalt,samples of tissue and homogenates oftissue were irradiated for two weeks
in the ORNL graphite reactor. Afterthe irradiation, the samples weredissolved in a mixture of concentrated
H2S04 and HN03. Known amounts of inactive cobalt as a carrier for the
cobalt activity, and iron, copper,strontium, and sodium holdback carrierswere added to the solution and the
solution was concentrated. After a
series of scavenging steps for theholdback carriers, the radioactivecobalt plus the inactive cobalt wasisolated as potassium cobaltinitrite,the solution filtered, the precipitatedried at 110°C, and the yield calculated from the formula K,Co(NO,L-H,0(12.3% cobalt). The radioactivityproduced by the nuclear reaction,CoS9(n,y)Co60 (5.3 y) in the unknownsamples was compared with the Co60radioactivity in a standard sample ofcobalt metal that was processed underthe same conditions. The radioactivitywas measured by means of a gammascintillation counter. Concentrations
of cobalt as small as 0.01 ppm weredetermined with a precision of betterthan 10%.
Strontium was determined in samplesof hard (bone) and soft (liver, heart,spleen, etc.) animal tissues that wereirradiated for 2.5 hr in the ORNL
graphite reactor. The slow-neutronirradiation of Sr86 will produce 2.7-h
25

ANALYTICAL CHEMISTRY DIVISION QUARTERLY PROGRESS REPORT
Sr ". After the irradiation, thesamples were dissolved in concentratedHC1 and a known amount of inactive
strontium carrier as a carrier for the
strontium activity and iron, copper,barium, and sodium holdback carrierswere added. The solution was then
processed by the procedure given in aprevious report.* ' Comparativesamples containing known amounts ofstrontium were irradiated and processedin the same way. Some results obtainedby this analysis are reported inTable 7.
TABLE 7. DETERMINATION OF STRONTIUM
IN BONE
SAMPLE STRONTIUM (ppm)
1 6.1, 5.6, 6.1
2 33.2, 31.0, 31.0
3 45.6, 45.9, 45.4
4 58.5, 62.9, 61.3
Trace amounts.of arsenic have been
determined in animal tissue after the
irradiation of the samples in the ORNLgraphite reactor for approximately 16.0hours. The slow-neutron bombardment
of A
After the irradiation, the sampleswere dissolved in concentrated HN03,inactive arsenic was added as a carrierfor the arsenic activity, and iron,copper, sodium, and barium holdbackcarriers were added. The sample wasthen transferred to a 50-ml centrifugetube and the BaSO centrifuged out anddiscarded. Sulfuric acid was added
and the volume of the solution reduced
until heavy fumes of H2S04 appeared.The radioactive and inactive arsenic
were then precipitated as the sulfides.The sulfide precipitate was dissolvedin concentrated HN03, and the arsenicprecipitated as MgNH4As04•6H20. Theprecipitate was dried 30 min at 100°C
, 7 S 'ill produce 26.8-h As 7 6
'G. W. Leddicotte, "Strontium," Anal. Chem.Quar. Prog. Rep. June 26. 1951. ORNL-1113, p. 41.
26
and weighed as MgNH4As04•1/2H20. Theamount of arsenic in the sample isdetermined by comparing the radioactive As 6 in the unknown with thatfound in a known amount of arsenic
processed in the same way. Concentrations of arsenic from 1 to 35 ppmwere determined in a series of samplesby this method.
Determination of Trace Elements in
Soils and Water (H. A. Mahlman, G. W.Leddicotte). The usefulness of radioactivation analysis in detecting anddetermining trace amounts of molybdenumin soil and of uranium in water and
river mud has been demonstrated. A
brief discussion of the applicationsfollows.
Samples of soil were irradiated inthe graphite reactor for 62 hours. Inthis time, sufficient radioactive Mo"was produced by the nuclear reactionMo98(n,y)Mo" (tjj = 67 h) to be determined by the following procedure.The soil sample was digested in amixture of hot concentrated H2S04,HC104, HN03, and HF. Additional HFwas added to convert the excess silicon
into the volatile fluoride. After the
soil was dissolved, the solution wasconcentrated until heavy fumes of H2S04appeared. Standardized molybdenumcarrier and holdback carriers of iron,copper, sodium, and strontium wereadded, and the solution was carriedthrough a series of scavenging stepsto remove extraneous radioactivities.
The molybdenum was finally precipitatedas Ag2Mo04 , and the precipitate wasfiltered, dried, weighed, and counted.The radioactivity that was due to theMo" in the unknown and to the Mo" in
a comparative sample of molybdenummetal that was processed in the sameway was counted on a gamma scintillationcounter. The ratio of these activities
gave the concentration of the molybdenumin the unknown sample. Concentrationsof molybdenum of the order of 0.1 to1.0 ppm can be determined in this mannerwith a precision of 10% or better.

PERIOD ENDING JANUARY 10, 1953
Samples of river mud and water were possess abnormal the r ma 1 - n eu tr onirradiated in the graphite reactor for cross sections.16 hours. In this time, sufficientradioactive Np239 was produced by the If quantitative determinations are
desired, a known quantity of pure typeP-nuclear reaction U238(n,y)U239 * 2S aluminum metal can be irradiated
<2o.5m simultaneously with the unknown sample.Np239 (ty = 2.33 d) to permit the This serves effectively as a controldetermination of trace amounts of sample, resolving such variables asuranium. The analytical procedure fluctuations in pile power and neutron-used was similar to that reviewed in a flux depression caused by the proximityprevious report.*4S) Concentrations of materials with high neutron crossof uranium of the order of 10 to 100 sections. After irradiation, theppm were determined in a series of unknown and control samples aresamples from rivers and dams of the quickly mounted on scotch tape that isTennessee Valley. stretched across a cardboard mounting
card. The samples are counted alter-Determination of Trace Amounts of nately for 1-min intervals. The
Aluminum in Rubber (H. A. Mahlman). radioactivity is recorded as countsTrace amounts of aluminum may be per minute by means of a Brown recorder,determined, with considerable precision, When the activity in the unknown hasqualitatively and/or quantitatively by decayed to a nearly constant value,radioactivation analysis. The nuclear the recorder chart is removed andreaction Al2 7(n ,y )A12 8 ( X.% = 2.3 m) analyzed graphically. The aluminumproduces sufficient radioactivity to present in the unknown is calculatedpermit the determination of aluminum from the ratio of the amount of thewith the equipment described in the Al28 in the unknown to that in theprevious report.*46' known. Both quantities are corrected
to the same time by use of the decayThe following procedure was used law A = AQe~ , so that the radio-
for the determination of aluminum in active aluminum found will be directlyrubber. Samples of the rubber were proportional to the amount of inactiveirradiated in the graphite reactor for aluminum present in either material.2.3 minutes. This irradiation time is For convenience, the t value used isthe most advantageous because the the time that the sample was dis-desired radioactive isotope is then at charged from the reactor.50% of its saturated activity valueand isotopes of longer half lives will Ne" Applications of Neutron Radio-not have been formed in any appreciable activation Analysis (G. W. Leddicotte).
rp, • n „„«„i..j^«. The public announcement of activationamount. This, of course, precludes r . .....the possibility that those nuclei analysis service has evoked inquiriesundergoing (n,y) type of reactions to regarding the suitability of the methodform long-lived isotopes are present for the determination of trace amountsin low concentrations and do not of elements m paints, pigments and
related materials, baby cereals,grains, flour and wheat products, and
H. A. Mahlman and G. w. Leddicotte, in vinylite resins; copper in heart'•Determination of Natural Ur.»iu. (U»«) by muscle; iodine in homogenates of ratRadioactivation Analysis, Anal. Chem. Quar. Prog. °Rep. June 26. 1952. 0RNL-1361, p. 21. tissue; arsenic in catalytic agents;
(46)w. A. Brooksbank and G. w. Leddicotte, zinc in animal tissue; and tracetermination of Trace Elements by Deans of Their „„,„«•,„«-,, n
• - ...... . ... i^.i .» n dlIIUUlll/3 U„-*;rt-Lived Radioisotopes, Anal. Chem. Quar. Prog.Rep. Sept. 26. 1952. 0RNL-1423 (in press). in rubber
27

ANALYTICAL CHEMISTRY DIVISION QUARTERLY PROGRESS REPORT
SPECTROCHEMICAL ANALYSES
C. Feldman
J. Y. Ellenburg M. MurrayA. J. Estepp M. K. Wittels
Determination of Rare Earths in
Thorium. The eellulose-column procedure* ' for the isolation ofmicrogram quantities of rare earthspresent in thorium metal gave a productthat contained too much thorium,calcium, and magnesium to permit theaccurate determination of rare earths.
This residual thorium was removed bypassing the product through a secondcellulose column by use of the sameprocedure as was used for the firstrun. The column was then ignited, theash dissolved in approximately 100 mlof dilute HC1, and the solutiontreated with 10 mg of iron carrier asFeCl3. The iron and rare earths werethen precipitated as the hydroxides byadding car bonate-free NH OH that wasfreshly prepared from gaseous NH3 anddistilled water. This precaution wasused to prevent the coprecipitation ofCaC03 and/or MgCO with the hydroxides.The hydroxide precipitate was removedby filtration, washed with water containing a few drops of ammonium hydroxide, and dissolved in approximately20 ml of 9 N HC1. This solution was
passed through aDowex-1 anion-exchangecolumn to remove the iron. The eluate
(47)E. J. Center, W. M. Henry, and R. Householder,
Determination of Rare Earths in Thorium, BMI-260(May 15, 1952).
was boiled down to a 1-ml volume,treated with 75 /Lig of cobalt(II) asinternal standard, and exposed by theporous-cup technique. In order totest the recovery of rare earths, athorium sample was dissolved and thesolution divided into two aliquots. Aquantity of CeO++ equivalent to 7.2ppm of cerium referred to the thoriummetal was added to one aliquot. Results of this analysis are presentedin Table 8 and are compared withresults obtained previously on anotherportion of the same material. In theprevious analysis, the thorium wasextracted from the rare earths with
TBP.
Determination of Rare Earths in
Stainless Steel. The rare earth
content of five stainless steel samplessubmitted by the General Electric Co.was determined. A 1-g sample wasdissolved and the solution evaporatedbarely to dryness. The residue wastreated repeatedly with concentratedHN03 until it was free of chlorides.Ten milliliters of 20% H2S04 wasadded and the mixture warmed to dis
solve as much of the residue as
possible. The solution was thendiluted to approximately 150 ml,treated with 2 to 3 ml of 6% S02solution, and electrolyzed at 1.7 ampuntil it was free of iron, nickel, andchromium. It was then concentrated,freed of silica with HF, boiled withconcentrated HC104 to decompose anyremaining carbides, and with H..SU.. to
2 4
TABLE 8. COMPARISON OF CELLULOSE COLUMN AND TBP EXTRACTION PROCEDURES
FOR SEPARATING TRACES OF RARE EARTHS FROM THORIUM
SEPARATION METHOD CONDITIONSAMOUNT FOUND (ppm)
Ce La Nd
TBP extraction 18.4 3.5 •
Cellulose column Aliquot 1, noCe added 27.3 5.9 7.0
Aliquot 2, 7.2 ppm ofCe added 35.0 5.5 7.0
28

dissolve any hydrated tantalum and/orniobium oxides. This solution was
then diluted with 10% H2S04 andtreated with sufficient cobalt to givea concentration of 75 ppm. Cerium andlanthanum were determined in the 50-
to 500-ppm range (relative to thesteel) by the porous-cup technique.The same solution-preparation techniqueis being investigated for the determination of niobium and tantalum in
stainless steels.
Determination of Traces of Boron.
Boron in artificial graphite must beassumed to be present as boron carbide.Standards for this determination were
therefore prepared by grinding boroncarbide with boron-free graphite orcarbon powder containing gold as theinternal standard. Moving-plateexposures have shown that although thevolatilization curves of gold andboron as boron carbide differ appreciably, the intensity ratio
B 2497.7
Au 2427.95
can be reproduced to within ±3.5% byburning a 10-mg charge at 9 amp in aStrock type of carbon electrode. Thedanger of erratic results inherent inthe wandering of the arc was avoidedby use of a spherical lens at thestigmatic position of the spectrographto focus an image of the source on thecollimator. Tests of the homogeneityof the standard mixture are not com
plete, but present evidence indicatesthat the method has a sensitivity ofwell below 1 ppm of boron in graphite,a value corresponding to an absolutesensitivity of less than 0.01 fig ofboron.
Moving-plate exposures of a boron-in-graphite standard prepared byevaporating aH3B03 solution on powderedgraphite indicate that most of theboron is converted to the carbide
before volatilization.
In the case of aluminum, preliminaryexperiments showed that (1) microgram
PERIOD ENDING JANUARY 10, 1953
quantities of boron as B03 could berecovered quantitatively from solutionby coprecipitation on CaC03 in alkalinesolution, (2) metallic boron is easilysoluble in NaOH solution, and (3) asensitivity limit of 1.5 ppm of boronin CaO can be reached by burning amixture of 2 mg of CaO (containingboron as Ca3(B03)2) and 8 mg of carbonunder the conditions that were out
lined above for graphite. Thiscorresponds to an absolute sensitivityof 0.003 /i.g of boron. The followingprocedure was therefore adopted. A3-g sample of aluminum was transferredto a 300-ml quartz dish and dissolvedin a suitable volume of NaOH solution.
Four milligrams of calcium(II) wasthen added as CaCl,, and CO, wasbubbled through the solution untilprecipitation of CaC03 (+Ca3(B03)2)appeared to be complete. The precipitate was filtered, washed free ofsodium ions, ignited to CaO, andburned in the d-c arc as indicated,
tinder the conditions given, thesensitivity of detection is 0.002 ppmof boron in aluminum. It is plannedto adapt this technique to the determination of boron in thorium, uranium,and other materials.
Determination of Traces of Precious
Metals in Native Iron. Sensitivitylimits in graphite matrix were determined for the metals listed in
Table 9. The standard mixture was
prepared by evaporating a solutioncontaining these elements on graphitepowder and heating this mixture at600°C for 1 hr in a stream of H2 toreduce them to metallic form.
In order to explore the cyanogenband region, several sensitivity testswere made in argon and oxygen atmospheres. The argon atmosphere loweredthe arc temperature to an extent thatunduly prolonged the volatilization ofthe metals; the oxygen atmosphereeliminated the CN bands without
sacrificing sensitivity.
29

ANALYTICAL CHEMISTRY DIVISION QUARTERLY PROGRESS REPORT
TABLE 9. SENSITIVITY LIMITS FOR PRECIOUS METALS BY THE
DIRECT-CURRENT ARC AND POROUS-CUP TECHNIQUES
MOST SENSITIVE
LINE (A)
APPROXIMATE ABSOLUTE SENSITIVITY <Mg)
ELEMENT Direct-Current Arc
with Graphite MatrixPorous-Cup Electr ode
Ag 3280.7 0.005 0.2
Au 2675.9 0.4 4.0
Pt 2659.4 0.4 7.0
Ir 2543.9 0.5 20.0
Rh 3434.9 0.1 3.0
Pd 3404.6 0.05 2.0
Ru 3436.7 1.0 20.0
INORGANIC PREPARATIONS
D. E. LaValle R. H. Sampley
Solid Solutions of Uranium Tri
halides in Lanthanum Halides (D. E.
LaValle). The studies of the solidsolutions of uranium trihalides in
lanthanum halides, thus far preparedfor the Nuclear Physics and LowTemperature group of the PhysicsDivision, resolved several problemsand determined the requirements forthe final experiments. The analysisfor trivalent uranium has been suc
cessfully worked out by J. M. Chiltonof the Ionic Analyses group. It wasfound that in the solutions of UC13,approximately two-thirds of the uraniumhad been lost by sublimation, and inthe solutions of UF3, approximatelyone-half was lost. . Since no apparentdifference in final results is obtained
with either compound, it was decidedto use UF3 henceforth.
A large amount of anhydrous LaClwas made. The problem of the flecksof carbon that had persisted inprevious preparations was solved bydistilling the anhydrous material at1000°C. The Physics Division foundthat in the use of the solid solutions
in the low-temperature apparatus,crystal orientation occurred in the
30
magnetic field. This difficulty wasovercome by using a new capsuledesigned to permit better packing,and by grinding and screening thesolid solution to 30-mesh size.
For the final experiments, it wasdecided that four solid solutions of
UF3 of approximately 1, 4, 8, and 12mole % in LaCl3 were required. Toapproximate the 12 mole % solution, astarting mixture of 22 mole % wasused. The analysis of this materialafter fusion showed 13.46 wt % uranium,13.30% of which was in the trivalent
form. The resulting solution, therefore, was 14.10 mole % UF3. Atpresent, this material is under studyby the Physics Division. To determinewhether tetravalent uranium has anyinfluence in these experiments, aproduct of 10 mole % UF4 was preparedand submitted for study.
Chromium Metal from Cr203. Inconnection with a proposed study ofsome stable isotopes of chromium, theNeutron Diffraction group of thePhysics Division requested a preparationof chromium metal from Cr203. Thematerial is to be received from the
Y-12 site in the form of the ignitedoxides. The electrolytic methodsseemed to be the most feasible, and

three such methods were considered.
In each case, the Cr203 was dissolvedby treatment with HC104. Electrolysisinto -a mercury cathode was tried afterreduction of the chromic acid with
H202. This method has been unsuccessful to date because of the dif
ficulty of lowering the aciditysufficiently without precipitating thehydroxide. Solid Cr2(S04)3 was prepared in order to overcome this difficulty, but the waste and salvageinvolved in the preparation would bea problem in the conversion of theisotopes. The well-known method ofchrome-plating from a bath of chromicacid and copper cathodes was used toprepare 10 g of chromium, but themetal that was deposited in the laststages of electrolysis was spongy.This material has been submitted to
the Physics Division for investigation.The plating-out of chromium on coppercathodes from trivalent chromic sulfate
solutions will also be attempted.Purifications and Preparations
(R. H. Sampley). Large quantities oflithium chloride and ammonium carbonate
were purified for use in the preparationof lithium carbonate and lithium
fluoride. Hydriodic acid, lithiumiodide, ammonium fluoride, and smallquantities of the halides of the rareearths were also prepared. Muchexploratory work in preparing phosphors, by use of lithium carbonate,lithium chloride, lithium fluoride,and lithium iodide as bases that were
activated with the halides of the rare
earths, was done for the PhysicsDivision.
OPTICAL AND ELECTRON MICROSCOPY
T. E. Willmarth
F. D. McNeer I. H. Gary
A recent problem of interest inelectron metallography was the preparation of replicas to show the natureof lamellar pearlite in the nodularstructure of type B-23 steel. Thiswork emphasized the criticalness of
PERIOD ENDING JANUARY 10, 1953
etching time in the replication ofsurface detail of a metal that con
tained more than two constituents.The preliminary steps necessary to
the examination of the steel includedcoarse-polishing and fine-polishing ofthe sample by the method of Kehl,etching, and replicating. The etchantwas an FeCl3-HC1- methano1 solutionrecommended by Grube.*49' The replicating material was polyvinyl alcohol,which gives a negative replica fromwhich a positive formvar replica ismade; the polyvinyl alcohol is dissolved off in water.
The polished sample was prepared foroptical metallographic examination bybeing etched for the standard time of20 seconds. It was found that althoughgood contrast was achieved for opticalmicroscopy at high power by use of anoi1-immersion objective of NA 1.32,the fine detail of the nodules was not
resolved. All attempts to stripreplicas for electron microscopicexamination from a surface thus treated
were unsuccessful.
The optimum etching time requiredto form a surface from which an undamaged replica film, suitable forelectron microscopy, could be removedwas determined by varying the etchingtime of a sample of type B-23 steelfrom 2 to 20 seconds. The FeCl3-HCl-methanol etchant was used. The samplewas repolished after each etching, andif a replica could be obtained, theapproximate minimum lamellar spacingwas observed. It was found thatstripping of replicas was impossibleif the etching period had been longerthan 10 seconds. Etching periods of6 to 10 sec produced surfaces fromwhich replicas could be stripped, butelectron microscopic examination ofthe replicas showed strain lines and
i dfi iG. L. Kehl, The Principles of Metal lographic
Laboratory Practice, 3rd ed. Ch. 1, McGraw-Hill,New York, 1949.
*49'w. L. Grube, "Useful Etchants for ElectronMetallography," Trans. Am. Inst. Mining and Met.Engrs. 191, 1171 (1952).
31

ANALYTICAL CHEMISTRY DIVISION QUARTERLY PROGRESS REPORT
distorted structure. Periods of 3 to
6 sec gave surfaces from which replicaswere easily removed without distortion;also, the detail was good and thecontrast was such that shadowcastingwas not necessary for the productionof electron micrographs. The minimumtime required for disclosure of themetal structure by selective attack onthe steel by the etchant was found tobe 2 to 3 sec; however, some difficultywas encountered in stripping replicasfrom surfaces etched less than 3
seconds. The influence of etchingtime on replica production from finepearlitic steel is summarized graphically in Fig. 11. These results agreeclosely with those that Nutting andCosslett* ' that were obtained by useof a picral etchant on steel ofapproximate minimum lamellar spacinggreater than 2000 A. Extrapolation oftheir results indicated good agreement
(50)J. Nutting and V. E. Cosslett, "The DryStripping of Formvar Replicas from Etched MetalSurfaces," p. 65-74 in Metallurgical Applicationsof the Electron Microscope, The Institute ofMetals, London, 1950.
30I I I
with those of Fig. 11. Regardless ofthe etchant used, short etching periodsof close tolerance are necessary iffinely detailed and easily removablereplicas are to be obtained. Opticaland electron micrographs of the steelare given in Fig. 12.
The study of oxide films preparedunder a variety of conditions hascontinued. Of these, the film obtainedby G. H. Cartledge of the ChemistryDivision on type 347 stainless steelby use of technetium as an inhibitoris perhaps of greatest interest. Asmall sample of steel on which such afilm had formed was examined with the
optical microscope. The film displayedinterference colors, which indicatedthat its thickness was only approximately 300 to 700 A and was veryuniform. Attempts to remove this filmfor electron microscopy and diffractionstudies by stripping in a HBr-methanolelectrolyte were unsuccessful. Thefilm came off in segments too smallfor collection on the 200-mesh screens
required for electron microscopy.
UNCLASSIFIEDDWG. 48027
r~rr "FT
25
20
^CEMENTITE(PEARLITE)
¥-\
— MEASURED SPACING
A MAXIMUM TIME LIMITS AT WHICH REPLICAS MAY BE
STRIPPED-STRAIN LINES PRESENT
O UPPER TIME LIMITS TO DEVELOP CONTRAST AND
ALLOW STRIPPING WITHOUT STRAIN LINES
• MINIMUM ETCHING TIME TO DEVELOP STRUCTURE
ETCHANT: FeCI3-HCI - METHANOL
15
Io
w io
0
32
I0 200 400 600 800 1000 1200 1400 1600 1800 2000 2200
APPROXIMATE MINIMUM LAMALLAE SPACING OBSERVED ON SURFACE OF B-23 STEEL SAMPLE (£)
Fig. 11. Effect of Time of Etching of Pearlitic Steel on Removal of
Polyvinyl Alcohol Replicas by Dry Stripping.
1 II


Other samples of this film are beingprepared for use in developing asuitable stripping technique.
Electron microscopy has also beenemployed in a Biology Division problemin which the size of cytoplasmicparticles from Escherichia coli wasneeded. Figure 13 is an electronmicrograph of these particles. Otherwork has included numerous optical and
PERIOD ENDING JANUARY 10, 1953
electron studies of UO 'H.O in which
particle size and shape factors wereof importance. Particle-size determinations have been made of Pu02, naturalLiF, LiF bombarded in a graphitereactor, LiF heated in an open flameafter irradiation, and NaCl crystals.Observations of the surface of elec-
trolytically polished nickel have beenmade.
SERVICE ANALYSES
A summary of the service analysesmade at the X-10 Analytical ChemistryDivision laboratories is given inTable 12.
IONIC ANALYSES
P. F. Thomason
The service work by the IonicResearch and Development group consisted primarily of analyses performedfor the Orex process. The discussionof methods will be contained in a
forthcoming report.
RADIOCHEMICAL ANALYSES
S. A. ReynoldsMany analyses of cyclotron-bombarded
materials were performed for theElectromagnetic Research Division. Asin the past, radioisotope analyses andidentifications were done for the
Operations Division. Special plutoniumanalyses and fission -produet andprotactinium identifications wereperformed for the Chemical TechnologyDivision. UX identifications and
assays and fission -product analyseswere done for the Reactor ExperimentalEngineering Division.
ACTIVATION ANALYSES
G. W. Leddicotte
Analyses were made for sodium inaluminum, barium in process solutions,strontium in animal tissue, uranium onpaper chromatograms, and vanadium inpetroleum and related materials.
GENERAL RADIOCHEMICAL ANALYSES
C. L. Burros
The major portion of radiochemicalanalyses was done for the Pilot Plantrelative to Purex process runs atradiation levels eight to ten timeshigher than those of the runs madelast quarter. The radiation levelswere a result of processing 60-daycooled slugs rather than 90- to 100-day cooled slugs. Assistance wasgiven to the Pilot Plant section byanalyzing process samples from decontamination studies for gross betaactivity, ruthenium, zirconium,niobium, total rare earths, and iodine.The Chemical Technology Division wasassisted in the Thorex process studiesof the decontamination of thorium fromfission products, recovery of plutoniumfrom process samples of the Scrupprogram, and decontamination of stainless steel. The Heal th Physics Divisionwas assisted in ecological studies ofWhite Oak Lake and of the extent df
contamination of the White Oak Dam and
settling basin.
GENERAL ANALYSIS LABORATORY
J. H. Edgerton
Determination of Nitrate Nitrogen
in Uranium Oxides and Uranyl Sulfate
(J. H. Edgerton, J. F. Emery). Thedetermination of the nitrate nitrogencontent of uranium oxides and uranium
35

ANALYTICAL CHEMISTRY DIVISION QUARTERLY PROGRESS REPORT
sulfate samples from the Harshaw Co.and the Mallinckrodt Chemical Co. and
samples from Purex process productswas requested by the Chemical Technology Division and K-25. The nitratewas determined by reacting it withsalicylic acid^ ' in a concentratedsulfuric acid solution. The nitrated
salicylic acid was then reduced withsodium thiosulfate and the solution
digested in the presence of a catalyst,selenium.(2^ The solution was thenmade alkaline with NaOH and steam
distilled in a semimicro Kjeldahl
N. H. Furman (Editor-in-Chief), Scott'sStandard Methods of Chemical Analysis, 5th ed.,Vol. 1, p. 632-3, Van Nostrand, New York, 1950.
(2)H. F. Lauro, "Use of Selenium as Catalyst
in Determination of Nitrogen by Kjeldahl Method,"Anal. Chem. 3, 401 (1931).
apparatus designed by H. L. Hemphilland modified by J. F. Emery and J. H.Edgerton. The apparatus is shown inFig. 14. The liberated ammonia wascollected in boric acid solution and
titrated with standard acid.v3^ Table
10 gives data for the analysis ofstandard solutions of KN03. It isbelieved possible to determine aslittle as 50 ppm of nitrate with anaccuracy of ±5% by this method, whichwill be recorded in the ORNL Master
Analytical Manual.Ion-Exchange Separation of Calcium
and Uranium (J. H. Edgerton, H. G.Davis). A request was made for thedetermination of calcium in the U23S
(3)L. W. Einkler, "Beitrag zur titrinetrischen
Bestimnung des Anmoniaks," Z. angew. Chem. 26,231 (1913).
UNCLASSIFIEDDWG. 17480A
SAMPLE ENTRY AND
SODIUM HYDROXIDE RESERVOIR
(60-ml) LIQUID TRAP
ABSORPTION TRAIN FOR
REMOVAL OF NITROGEN
COMPOUNDS FROM AIR
•-SODIUM HYDROXIDE ^—CHROMIC ACID CLEANINGTRAP (500-ml) SOLUTION (500-ml)
CONDENSER
,IR JACKET
REACTION TUBE
RECEIVING FLASK
Fig. 14. Kjeldahl Distillation Apparatus for Semimicro Determination ofNitrogen.
36
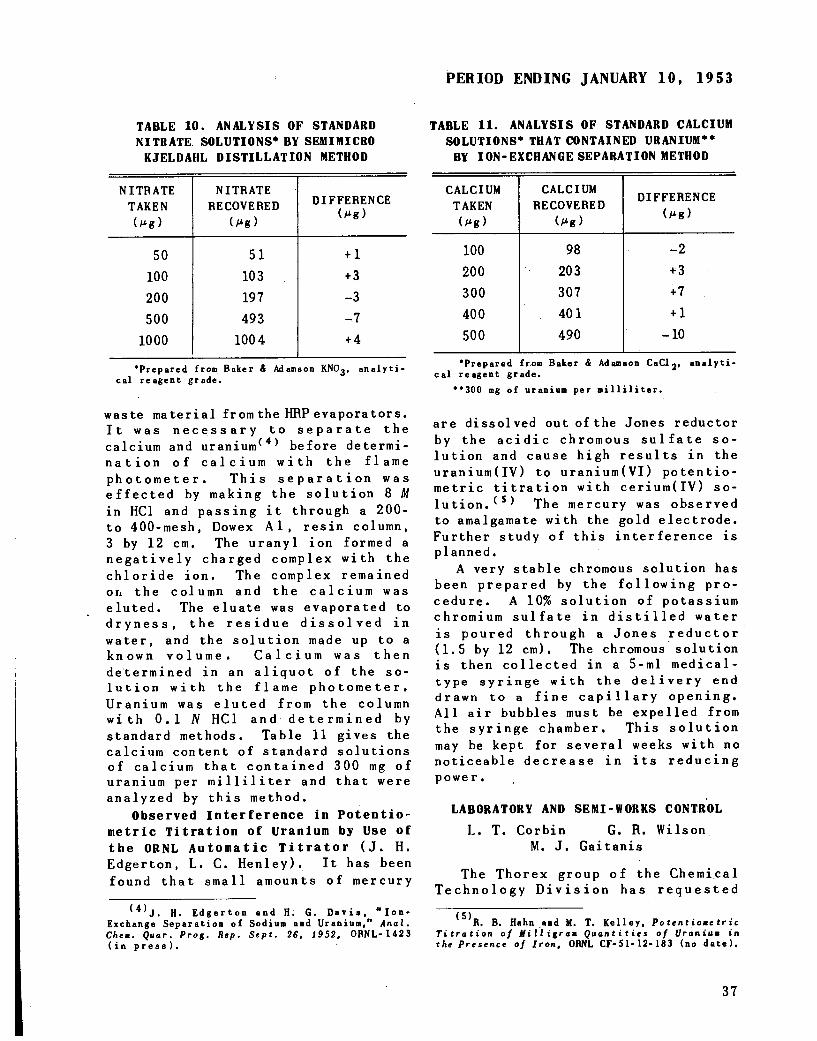
TABLE 10. ANALYSIS OF STANDARD
NITRATE SOLUTIONS* BY SEMIMICRO
KJELDAHL DISTILLATION METHOD
NITRATE
TAKEN
(Mg)
NITRATE
RECOVERED
(Mg)
DIFFERENCE
(Mg)
50
100
200
500
1000
51
103
197
493
1004
+ 1
+ 3
-3
-7
+ 4
'Prepared from Baker & Adamson KNO3, analytical reagent grade.
waste material from the HRP evaporators.It was necessary to separate thecalcium and uranium* ' before determination of calcium with the flamephotometer. This separation waseffected by making the solution 8 Min HC1 and passing it through a 200-to 400-mesh, Dowex Al, resin column,3 by 12 cm. The uranyl ion formed anegatively charged complex with thechloride ion. The complex remainedor, the column and the calcium was
eluted. The eluate was evaporated todryness, the residue dissolved inwater, and the solution made up to aknown volume. Calcium was then
determined in an aliquot of the solution with the flame photometer.
Uranium was eluted from the column
with 0.1 N HC1 and determined bystandard methods. Table 11 gives thecalcium content of standard solutions
of calcium that contained 300 mg ofuranium per milliliter and that wereanalyzed by this method.
Observed Interference in Potentio-
metric Titration of Uranium by Use of
the ORNL Automatic Titrator (J. H.Edgerton, L. C. Henley). It has beenfound that small amounts of mercury
(4) J. H. Edgerton and H. G. Davis, "Ion-Exchange Separation of Sodium and Uranium," Anal.Chem. Quar. Prog. Rep. Sept. 26, 1952. ORNL-1423(inpress).
PERIOD ENDING JANUARY 10, 19 53
TABLE 11. ANALYSIS OF STANDARD CALCIUM
SOLUTIONS* THAT CONTAINED URANIUM**
BY ION-EXCHANGE SEPARATION METHOD
CALCIUM
TAKEN
(Mg)
CALCIUM
RECOVERED
(Mg)
DIFFERENCE
(Mg)
100
200
300
400
500
98
203
307
401
490
-2
+ 3
+7
+ 1
-10
'Prepared from Baker & Adamson CaCl,. analytical reagent grade.
"300 mg of uranium per milliliter.
are dissolved out of the Jones reductor
by the acidic chromous sulfate solution and cause high results in theuranium(IV) to uranium(VI) potentio-metric titration with cerium(IV) so
lution.^ * The mercury was observedto amalgamate with the gold electrode.Further study of this interference isplanned.
A very stable chromous solution hasbeen prepared by the following procedure. A 10% solution of potassiumchromium sulfate in distilled water
is poured through a Jones reductor(1.5 by 12 cm). The chromous solutionis then collected in a 5-ml medical-type syringe with the delivery enddrawn to a fine capillary opening.All air bubbles must be expelled fromthe syringe chamber. This solutionmay be kept for several weeks with nonoticeable decrease in its reducingpowe r.
LABORATORY AND SEMI-WORKS CONTROL
L. T. Corbin G. R. Wilson
M. J. Gaitanis
The Thorex group of the ChemicalTechnology Division has requested
R. B. Hahn and M. T. Kelley, Potent iome trieTitration of Milligram Quantities of Uranium inthe Presence of Iron, ORNL CF-51-12-183 (no date).
37

ANALYTICAL CHEMISTRY DIVISION QUARTERLY PROGRESS REPORT
determinations of uranium at approximate concentrations of 5 x 10"6 mg/mlof solution that contained 60 mg ofthorium per milliliter. This uraniumconcentration is below the sensitivityrange of the fluorometric method because the uranium and thorium must be
separated by ahexone extraction beforethe uranium can be determined fluoro-
metrically. It was thought that byuse of Dowex-Al, anion-exchange resinthe thorium and the uranium could be
separated and the uranium concentrated. To check this, a solutionthat contained a total of 475 mg ofthorium and 1.25 fig of uranium in6.5 N HC1 was passed through a 10 mmby 4 cm column of the resin. Theseparation was made in triplicate, acolorimetric analysis for thorium wasmade on the eluates, and all thethorium was recovered to within +3%,in each case. The uranium was theneluted from the resin with 0.1 iV HC1.
This eluate was evaporated to a smallvolume and diluted to 10 milliliters.The solution was analyzed for uraniumf1uorometrica1ly and for thoriumcolorimetrica1ly. Analysis of theeluate gave an average value of 50 figfor thorium and 1.85 /xg for uranium.A blank containing a total of 475 mgof thorium and presumably no uraniumwas passed through a similar Dowex-Alresin column, and the eluate was foundto contain 0.8 /xg of uranium. Subtraction of the blank of 0.8 tig from1.85 fig leaves 1.05 fig, a result thatis within the usual accuracy of thefluorometric uranium method.
Because the uranium is held on the
resin column and the thorium passesthrough, it should be possible todetermine small amounts of thorium in
the presence of large amounts ofuranium. A solution containing 1 g ofuranium and 25 fig of thorium in 6.5 NHC1 was passed through a Dowex-Al resincolumn, 22 mm by 4 cm, and the thoriumin the eluate determined. The colori
metric results indicated that 46 fig ofthorium was present. This high value
38
may have been the result of contamination, interference in the colorimetric thorium determination by something that washes out of the resin, orpossibly some thorium in the uranium.Further work is being done and will bereported later.
PILOT PLANT CONTROL
L. T. Corbin C. E. Lamb
Normal operation of the laboratoryhas been resumed with the startup ofthe second phase in the Purex programfollowing the shutdown after the firstphase of that program. However, thetotal number of analyses required hasbeen reduced, as a result of thecompletion of the Scrup and "23" programs. To facilitate operation, 40%of the Pilot Plant Control Laboratorypersonnel has been transferred to theADP Control Laboratory.
Investigation of the effect ofplutonium on the fluorescence ofuranium was begun at the suggestionof D. A. Orth.(6) While working onthe ion-exchange coupling process,Orth found that the fluorometric
uranium*7^ results of the analyses ofPurex products were consistently lowin comparison with the polarographicuranium* ' results on solutions thatcontained more than 1 mg of plutoniumper milliliter and less than 0.2 mg ofuranium per milliliter. The study isnot complete, but evidence thus farindicates that the plutonium has aquenching*9^ effect on the fluorometric uranium determination by a
(6)
(7).Du Pont Co. employee.
M. T. Kelley, P. F. Thomason, L. T. Corbin,S. A. Reynolds, C. L. Burros, and E. J. Frederick,"Uranium-Fluorometric Determinetion," Manual ofAnalytical Procedures for the 1/235 Recovery Process,Method No. 12, 0RNL-983 (Aug. 20, 1951).
H. H. Miller, "Polarographic Determinationof Uranium in Plutonium Solutions," Chem. Quar.Prog. Rep. March 31, 1950, 0RNL-686, p. 21.
(9)C. J. Roddin (Editor-in-Chief), Analytical
Chemistry of the Manhattan Project, p. 122-35,McGraw-Hill, New York. 1950.
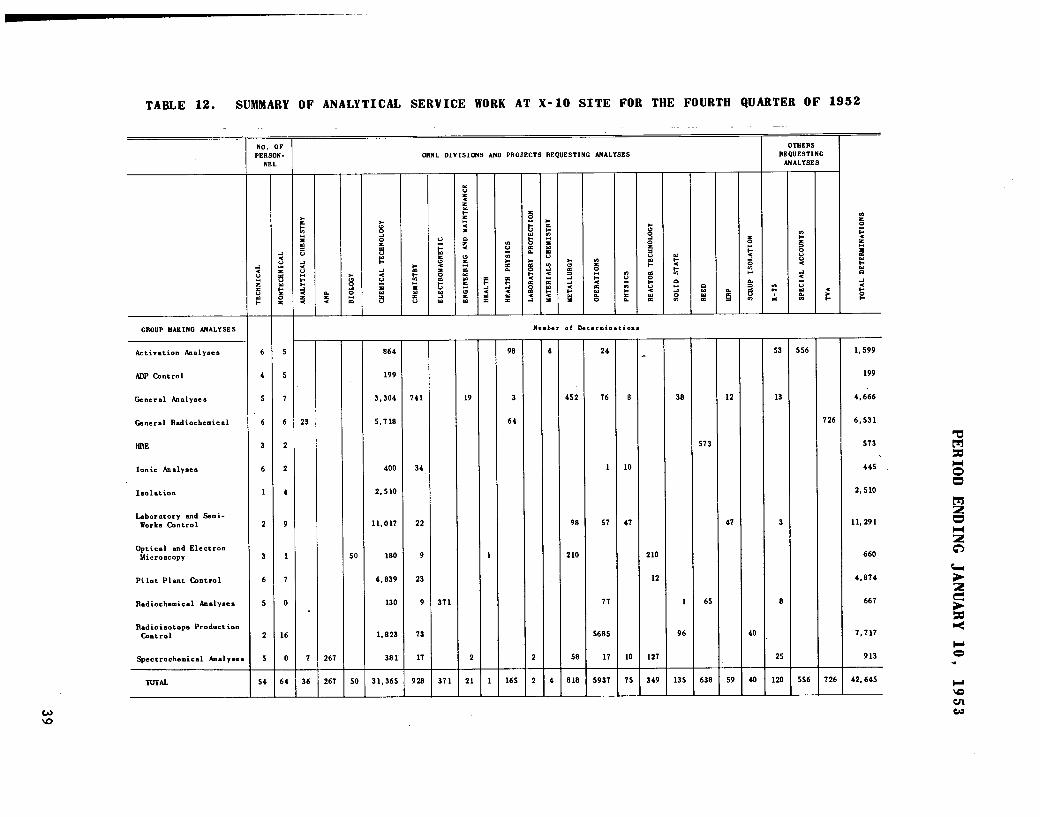
c*>
TABLE 12. SUMMARY OF ANALYTICAL SERVICE WORK AT X-10 SITE FOR THE FOURTH QUARTER OF 1952
NO. OF OTHEnS
PERSON ORNL DIVISIONS AND PROJECTS REQUESTING ANALYSES BEQUESTING
NEL ANALYSES
u(JZ<ZU
j
CJ
ZSCJtil
r-
o
sesc<_>uH
sas
>•CC
HV)
31U
u
•J<
J<
<
o.Z
g•JO
CO
oo-Joasscjtil
-1
O
u
3
>«cc(-in
31tilSu
u
Htilzo
31Oa.
dsw
z
<31
Q
5Oz
Ku
uE
Uzu
td
COo
CO>«Eft.
P<til
X
cu
5CC
gH
CEOca<
VI
aui
«j•<
CEtil(--c
oces
j<HWai
«zo
CEtilCL,o
COCJ
m
BO.
oo-JozB(Ju
c=oHCJ<
CE
ai
i-<Hm
a
«ioto
QUtilcc
CEB
o
5-JOCQ
a.3
6c
COH
§ocjo<
<
uua.m
<>
zo
P<z
31cetdHtdQ
J•<
S
GROUP MAKING ANALYSES
6 5
Number of Determination.
Activation Analyses 864 98 4 24-,
53 556 1,599
ADP Control 4 5 199 199
General Analyses 5 7 3.304 741 19 3 452 76 8 38 12 13 4,666
General Radiochemical 6 6 23 5,718 64 726 6,531
HRE 3 2 573 573
Ionic Analyses 6 2 400 34 1 10 44S
Isolation 1 4 2,510 2,510
Laboratory and Semi-Works Control 2 9 11,017 22 98 57 47 47 3 11,291
Optical and ElectronMicroscopy 3 1 50 180 9 1 210 210 660
Pilot Plant Control 6 7 4,839 23 12 4,874
Radiochemical Analyses 5 0 130 9 371 77 I 65 8 667
Radioisotope ProductionControl 2 16 1,823 73 5685 96 40 7,717
Spectrochemical Analyses 5 0 7 267 381 17 2 2 58 17 10 127 25 913
TOTAL 54 64 36 267 50 31,365 928 371 21 1 165 2 4 818 5937 75 349 135 638 59 40 120 556 726 42,645
13MSOi—l
Oa
M2aM
o
2e
90
VI
w

ANALYTICAL CHEMISTRY DIVISION QUARTERLY PROGRESS REPORT
factor of approximately 5. The fluorometric procedure* ' requires the extraction of the uranium into TBP-Amsco
solution in the presence of HN03. Someplutonium is presumably also extractedfrom the Purex product sample. Inseparate tests, ferrous sulfamate andhydroxylamine were added to the aqueousPurex product solution in an effort toreduce the plutonium(VI) and preventit from extracting with the uranium.The hydroxylamine was not effective.However, the fluorometric uraniumresults obtained when ferrous sulfamate
was used agreed with the polarographicresults to within ±10%.
HRE ANALYSES
U. Koskela
Following the temporary breakdownof the HRE, the group has been operating with reduced personnel pendingresumption of the experiment.
ISOLATION ANALYSES
L. T. Corbin J. H. Cooper
The analytical methods for thedetermination of uranium and plutoniumin Scrup dissolver solutions have beendeveloped. Thirty dissolver solutionswere analyzed for total plutonium anduranium. R. W. Foster^10) is preparinga topical report that will include theanalytical methods, precision andaccuracy data, and a discussion of thevarious contributions to this programthat have been-made by members of theAnalytical Chemistry Division.
Da Pont Co. employee.
<U)H. H. Willard and H. Diehl, AdvancedQuanti tat ive Analys is, p. 196, Van Nostrand, NewYork, 1943.
40
An investigation and evaluation ofthe molybdiphosphate'*1) reductionmethod presently used at ORNL(12) forthe colorimetric determination of
microquantities of phosphate in Purexprocess samples was recently completed by C. E. Pietri.(10) Certainrefinements and additions were made in
order to increase the accuracy of theprocedure. A simple and safe methodfor converting pyro- and metaphosphatesto orthophosphates was developed.^13^The new procedure is also applicableto the determination of total phosphatein aqueous Purex process solutions withacceptable precision and accuracy.
Considerable difficulty has beenencountered by the Purex controllaboratories because of the high betaand gamma radiation present on alphamounts prepared for counting. Thishigh radiation, 2 to 20 r/hr, notonly offers a severe hazard to personnel,but causes the alpha proportionalcounters to give very erratic and highplutonium results. D. Madinabeitia('°Jhas developed a solvent-extractionmethod for the removal of zirconium
and niobium from plutonium during theanalysis of Purex process wastesamples. Because zirconium and niobiumare extracted along with plutonium byTTA, it was necessary to incorporate azirconium-niobium cleanup step in thestandard TTA plutonium method.(14)Details of the procedure will be recorded in the Purex Control Manual.
(12 1"Private files of P. F. Thomason, ORNL
Analytical Chemistry Division.
(13)p< p Treadwell and w_ T< Hall> AnalyticalChemistry, 9th ed., Vol. 1, p. 390-9, Wiley, NewYork, 1939.
(14),."Total Plutonium in Aqueous Solutions - TTA
Method," Purex Control Manual (Revision of KAPLProcedure Manual No. 348).
PERIOD ENDING JANUARY 10, 1953
ANALYTICAL CHEMISTRY DIVISION- Y-12 SITE
RESEARCH AND DEVELOPMENT
ANALYTICAL STUDIES OF REACTOR FUELS
AND THEIR COMPONENTS
J. C. White J. E. Lee, Jr.C. M. Boyd W. J. Ross
C. K. Talbott
The development of methods for theanalysis of reactor fuels and theircomponents has been of a diversifiednature during the past period. Themajor problem was to develop a volumetric method for the determination
of zirconium. Other problems that havebeen studied include the colorimetricdetermination of chromium, the determination of oxygen in metallic oxides,the separation and determination oftraces of aluminum in reactor fuels,the determination of water in materialsproposed for use in reactor fuels,the design of an apparatus for measuring the conductivity of hydrofluoricacid in order to determine its water
content, the identification of theproducts that are produced by thereaction of NaK with components ofreactor fuels, and the adaptation ofa method for determining uraniumdioxide in uranyl trifluoride. Discussion of the work done on theseproblems is included in an ANP quarterlyprogress report.( J
ANALYTICAL STUDIES FOR THE
RAW MATERIALS PROGRAM
J. C. White
Analytical studies for the RawMaterials project have included thedevelopment of an indirect method fordetermining uranium in Bartow claysand in organophosphorus-keroseneextracts, evaluation of partitionchromotography for separating uranium
' J. C. White et al., "Chemical Analysis ofReactor Fuels," ANP Quar. Prog. Rep. Dec. 10, 1952,ORNL-1439, p. 190.
in raw materials, microdeterminationof carbon and hydrogen in organophosphorus compounds, application oftitrations in nonaqueous solvents tothe determination of high-molecular-weight amines, fluorometric determination of uranium with the modelQ-1165 fluorometer, and the determination of milligram amounts ofamines by the Kjeldahl procedure.The progress of these studies isdiscussed below.
Indirect Ferrous-o-Phenanthroline
Colorimetric Determination of Uranium
(D. L. Manning). Further experimentshave been conducted on the indirectferrous-o-phenanthroline colorimetricmethod for uranium that was outlinedin a previous report,' ' In orderfor the method to be applied successfully to samples that contain uranium,an efficient separation of the uraniumfrom iron and phosphate must beachieved because any iron that ispresent in the solution during thestep in which uranium(VI) is reducedto uranium(IV) will also be reduced,and the results will be in error. Anappreciable amount of phosphate shouldbe avoided because uranium(IV) isprecipitated by phosphate.
An ion-exchange separation procedurewas tested in which uranium was retained as the complex sulfate on astrong-base, anion-exchange resin andeluted with HC1 solution. The testresults indicated that the uranium wasnot completely retained on the resin.
A double extraction of uranium from
a 10% HNO, solution with tributylphosphate (TBP) by use of A1(N03)3 asa salting-out and phosphate-complexingreagent has proved to be a satisfactory
(2)W. K. Miller, D. L. Manning, and J. J.McCown, "Determination of Uranium in Bartow Clays,"Anal. Chem. Quar. Prog. Rep. Sept. 26, 1952,ORNL-1423 (in press).
41

ANALYTICAL CHEMISTRY DIVISION QUARTERLY PROGRESS REPORT
method for separating uranium fromlow-grade ores. The TBP phase isstripped with 1 N (NH4)2C03 solutionto remove uranium as the uranyl tri-carbonate ion and to hydrolyze anyiron and aluminum extracted. The
aqueous phase is evaporated to asmall volume, taken to dryness withH2S04, and the residue dissolved in1 N H2S04. The uranium(VI) in thesolution is reduced to uranium(IV)at a mercury cathode and determinedco 1 orimetrica 11y with ferrous-o-phenanthroline .
Initial tests of zinc and cadmium
microreductors, 0.5 by 8 to 12 cm,made by use of standard uranyl solutions, showed that either of themicroreductors is satisfactory foreffecting the reduction of uranium(VI)to uranium(IV). It was necessary touse suction to assure an even rate of
solution flow through the reductors.Further tests with these reductors on
synthetic Bartow clay samples thatcontained known amounts of uranium(VI)and that had been extracted with TBP
yielded erratic results. It is believed that this was caused, in part,by traces of iron in the final spectrophotometric volume of solution beingpresent in spite of the steps takento effect its removal. This belief
was verified by applying the TBPextraction procedure to syntheticsamples that contained no uranium.Appreciable blanks were obtained ineach case. Reduction of the last
traces of iron by means of the mercurycathode eliminated the blanks. Al
though initial tests with this reduction method gave erratic results,it was found that increasing thevolume of solution taken for elec
trolysis and immersing only a minimumportion of the platinum anode in thesolution gave reproducible results.Partial immersion of the anode was
necessary to minimize anodic oxidation.Experiments are planned with isolatedcell compartments in an effort toeliminate anodic oxidation. The use
42
of cadmium'3' as an anode has alsobeen suggested for this purpose.
This procedure was applied tostandard solutions in the concentration range of 50 to 400 fig ofuranium per 50 ml of final volume andgave a colorimetric factor of 14.7 figof uranium per milliliter per opticaldensity unit (unit cell length) witha standard deviation of 10%. Use of
the procedure for analyzing syntheticBartow clay samples that containeduranium in the same concentration
range and that had been carried throughthe TBP separation procedure, gavethe same colorimetric factor with a
standard deviation of 13%. The method
was also applied to organophosphorus-kerosene extracts that contained
uranium; the standard deviation forduplicates was 6%. Further evaluationof the method is now in progress.
Separation of Uranium by Partition
Chromatography (J. J. McCown). Theseparation of uranium by means ofof cellulose in column or strip formhas been discussed previously.'4'Results of these investigations werenot entirely satisfactory. A partitionchromatographic technique suggestedby W. J. Frierson(5) that employedthe apparatus shown in Fig. 15 wastested on synthetic Bartow clay solutions .
Two glass plates, 5 by 6 in., werecoated on one side with Desiccote to
render them water-repellent. Twostrips of Eaton-Dykeman, 320 grade,1/8 in.-thick cellulose (2 by 6.5 in.)were placed between the plates sothat they touched the coated sides.The strips were notched twice at thetop and cut to a point that protrudedapproximately 0.5 in. below the glass-plate holder. A dropping funnel was
(3)H. H. Willard, private communication to
J. C. White, Dec. 3, 1952.(4)
W. K. Miller, D. L. Manning, and J. J. McCown,"Determination of Uranium in Bartow Clays," Anal.Chem. Quar. Prog. Rep. Sept. 26, 1952, ORNL-1423(in press ).
Summer research participant from AgnesScott College, Decatur, Ga.

DROPPING FUNNEL
UNCLASSIFIEDDWG. 18028
ETHER-5% HN03 MIXTURE
WIRE SUPPORT
DOUBLE- THICKNESSFILTER PAPER: Z*6\z in.
-5X6-in. GLASS PLATES
(2 REQUIRED)
SPRING CLAMPS(2 REQUIRED)
Fig. 15. Apparatus for Cellulose-
Strip Separation of Uranium.
used to dispense the eluting solvent,and a beaker placed beneath the paperstrips was used to catch the eluate.
A HNO3 solution of the clay wasplaced in the V-shaped pockets, andthe uranium was eluted rapidly with200 ml of a solution of HN03 in ether(5 wt vol %). The eluate was evaporatedto dryness and the organic materialdestroyed by oxidation with a HN03-HC10. mixture. The final determinationof uranium was made by the i-ascorbicacid colorimetric method.
Several factors were found to becritical. The flow of eluting solventhad to be regulated at a rapid butconstant rate. Slight deviations inflow rate produced erratic results.Evaporation of the ether-HN03 eluateon a steam bath resulted in unexplainedexplosions. These explosions wereprevented by evaporating the eluate
C. D. Rothenberger and W. R. Grimes, Use ofI-Ascorbic Acid as a Colorimetric Reagent forUranium, H-4.360.13 (June 9, 1947).
PERIOD ENDING JANUARY 10, 1953
under infrared lamps. Frequentrecoating of the glass plates withDesiccote was also necessary to ensureuniform wetting of the cellulosestrips. Phosphate ion was eluted underthese conditions, an interferencethat was eliminated by adding excessiron(III) to the uranium solution toform the immobile iron phosphatecomplex.
Studies of the separation of uraniumfrom synthetic Bartow clay solutionsshowed that this method was entirelysatisfactory. However, application ofthe procedure to other phosphatic-basematerials indicated that it wasempirical and largely dependent uponthe nature and concentration of con
stituents in the original material. Itdoes not appear possible to applythe same conditions for the separationof uranium to all types of phosphaticraw materials. A specific procedurefor the determination of uranium in
Bartow clays is being prepared.Microdetermination of Carbon and
Hydrogen in Organophosphorus Compounds(W. J. Ross, D. L. Manning). The RawMaterials group of the MaterialsChemistry Division is preparing a largenumber of new organophosphorus compounds of the phosphinic and phosphonicacid families. These compounds areextremely stable and have boilingpoints of the order of 200°C at apressure of 1 fi Hg. A microfurnacehas been set up for the determination,by combustion, of carbon and hydrogenin these compounds. Because of theirgreat thermal stability, it is necessaryto ignite the samples at 900°C inorder to completely convert the carbonto carbon dioxide. Special techniqueshave been employed to prevent flashingduring combustion. The standarddeviation of the method for duplicatedeterminations of carbon and hydrogenon 16 samples was found to be 2.2% forcarbon and 1.0% for hydrogen.
Titration of Amines in Nonaqueous
Solvents (W. J. Ross). The titrationof amines in nonaqueous solvents has
43

ANALYTICAL CHEMISTRY DIVISION QUARTERLY PROGRESS REPORT
been evaluated for determining purityand concentration of amines in organicand aqueous solvents. The work ofFritz^7' has been used as a guide.
Studies have been limited to the
high-molecular-weight primary, secondary, and tertiary amines that arebeing considered as possible extractantsfor uranium. These amines were dis
solved in glacial acetic acid andtitrated with 0.01 N HC104 in glacialacetic acid. Special precautions weretaken to avoid absorption of water.Both colorimetric and potentiometricmethods have been used to determine
the end point. Crystal violet appearedto be satisfactory as an indicatorexcept at low concentrations of amines,where potentiometric end-point de-tection by means of the glass electrode-calomel electrode system was required.
(7)J. S. Frits, Ac id-Base Titrations in Non
aqueous So Ivents, The G. Frederick Smith ChemicalCo., Columbus, Ohio, 1952.
The end-point break was of the orderof 100 mv for as little as 5 mg ofamine in 50 ml of solution (approximately 0.0005 M). Results of thetitrations of various amines are shown
in Table 13.
At the present time, the puritiesof only di-n-heptylamine and di-2-ethylhexylamine have been established.The remaining amines listed werecommercial grade, and no furtherpurification had been attempted beforetitration. The method is indicated
to be inherently sensitive, usableover a wide concentration range, andof good accuracy and precision. Thestandard deviation of the method for
a range of 3 to 118 mg of amine was0.4 milligram. The feasibility ofdetermining traces of amines in aqueoussolution by this method, after removingthe water by evaporation on a steambath, is being investigated.
TABLE 13. TITRATION OF HIGH-MOLECULAR-WEIGHT AMINES IN
GLACIAL ACETIC ACID WITH 0. 01ZV PERCHLORIC ACID
AMINEMILLIGRAMS OF AMINE
Taken Found Dif ference
Di-n-heptylamine 111.6
117.4
41.0
18.9
2.5
111.6
118.0
40.8
18.4
2.7
0.0
-0.6
0.2
0.5
-0.2
Di-2-ethylhexylamine 240.5
235.7
235.7
240.0
236.4
235.2
0.5
-0.7
0.5
3,5,5-Trimethylhexylamine* 146.1
132.3
184.0
184.6
125.3
117.4
163.1
164.5
20.8
14.9
20.9
20.1
Di-n-octylmethylamine* 251.9
271.1
229.8
247.6
22.1
23.5
Didecylmethylamine* 359.7
349.6
367.0
356.1
-7.3
-6.5
'Purity unknown.
44

Fluorometric Determination of
Uranium (J. E. Lee, Jr.). Some difficulty has been encountered in the useof the ORNL model Q-1165 fluorometerfor the determination of uranium.
Previous work indicated that therelationship between the concentrationsof uranium and the millivolt readingsof the instrument was linear over the
concentration range of 0 to 100 fig ofuranium per milliliter of test solution. At present, this particularbehavior is shown only in the rangeof 15 to 60 fig of uranium per milliliter. Low readings were obtainedabove this concentration range anderratic results below it. Meker
burners have been substituted for
air-blast burners in an effort to
maintain a more uniform fluxingtemperature. A critical survey of theentire procedure is currently underway.
Kjeldahl Determination of Milligram
Amounts of Amines (H. Grady). Studieshave been made to ascertain the cause
of the low results usually obtainedby the Kjeldahl procedure for thedetermination of milligram amounts ofhigh-molecular-weight amines. Conditions for the digestion were established, that is, a digestion temperature of 350 to 400°C and mercury asthe catalyst. The well-known use ofboric acid(8) to trap liberatedammonia and permit the direct titrationwith standard acid was also incorporatedin the procedure. Preliminary resultsobtained with the revised procedureindicated some improvement. Thestandard deviation was approximately6%. Control samples will be usedto determine whether a true bias
exists. It is planned to investigatethe Nessler colorimetric method for
the determination of amounts of amines
equivalent to less than 1 mg of nitrogen.
N. H. Furman (Editor-in-chief), Scott'sStandard Methods of Chemical Analysis, 5th ed.,Vol. 1, p. 633, Van Nostrand, New York, 1946.
PERIOD ENDING JANUARY 10, 1953
ANALYTICAL STUDIES FOR THE HOMOGENEOUS
REACTOR PROGRAM
0. Menis
The analysis of uranyl sulfate,uranyl fluoride, and uranyl oxide solutions and solids that are used as
fuels in the HRP required the followingstudies: potentiometric titration ofuranium(VI) in the presence of metalliccorrosion products; determination ofuranium-to-sulfate and uranium-to-
fluoride ratios in uranyl solutions,uranium(IV) in UCL, microgram quantities of fluoride and zirconium in
uranyl solutions, and microgram quantities of nitrate in U03; and theadaptation of the Beckman photomultiplier tube attachment to spectrophotometric analyses. The progress ofthese investigations is discussedbe low.
Potentiometric Determination of
Uranium(VI)^(T. R. Phillips). In theHRP long-duration corrosion studies,it is necessary to conserve the testsolution by limiting the sample sizeto be used for analyses. Therefore aprocedure is being studied for thedetermination on a single sample ofuranium(IV), iron(III), chromium(VI),and other corrosion products from thestainless steel systems. The procedurebeing used is automatic potentiometrictitration with chromous sulfate.
The general procedure, accuracy,and precision of the chromous titrationfor uranium(VI) have been reportedpreviously.^9' * ' However, it isdesired to know the precision of thedetermination for 1 to 15 mg quantitiesof uranium in the presence of traces
(9)R. H. Lefferty, Jr. and R. Winget, Jr.,The Determination of Uranyl Ion by Direct Titrationvith Chromous Sulfate, A-4018 (April 1, 1946).
(10)0. Menis and C. K. Talbott, "Determinationof Uranium by Direct Titration with ChromousSolution," Anal. Chem. Quar. Prog. Rep. Dec. 26,1951, ORNL-1233, p. 73.
0. Menis and F. E. Jenkins, "Determinationof Uranium by Direct Titration with ChromousSulfate,* Anal. Chem. Quar. Prog. Rep. March 26,1952, ORNL-1276, p. 79.
45

ANALYTICAL CHEMISTRY DIVISION QUARTERLY PROGRESS REPORT
of iron(III) and chromium(VI). Com- quantities of complexing agents andplexing agents, such as the thiocyanate the degree of control of other variablesion and Versene, are being added to that will be required for the esti-increase the potential change at the mation of microgram quantities of theequivalence point for better esti- trace elements in the corrosive testmation of the end point, and tempera- solution are to be determined,ture effects and electrode conditions Determination of Uranium-to-Sulfateare being investigated. The stability and Uranium-to-Fluoride Ratios (T. R.of the standard chromous solution over Phillips). The ion-exchange methoda long period of time is also being described by Day, Gill, Jones, andchecked. Marshall'12' is rapid and reliable for
Uranyl solutions that did and did determining fluoride or sulfate innot contain corrosion products were uranyl solutions. The method employstitrated withahigh degree of precision the selective adsorption of uranylafter the proper conditions were ions on a 1- by 4-in. column ofestablished. The range of standard cation-exchange resin (Dowex-50, 12%deviations of the method, for a series cross linked, 200 to 400 mesh) followedof solutions that contained 1.5 to 15 by titration of the hydrofluoric ormg of uranium, was 1 to 0.4%. sulfuric acid in the eluate from the
In the presence of 40 to 500 fig of exchange column.iron(III), the potential break was This method for the determinationfound to be sharp when NH4CNS was of sulfate has been used for low con-used as the complexing agent, and the centrations; earlier work on higherprecision of the uranium determination concentrations was reported by thewas of the same order of magnitude as Analytical Service Laboratory.' IJ'in the absence of iron. For the lower concentrations, ranging
A study of the uranium results from 4 to 11 mg, the standard deviationobtained in the presence of chromate was 3%.ions in the range of 50 to 250 fig of Determination of Uranium(IV) inchromium(VI) indicated improved pre- uranyl Oxide (M. L. Druschel). Acision when the temperature was raised simple, direct, preferably colorimetricfrom 80 to 95°C or when Versene was procedure is needed for the determi-added. For a concentration of 200 mg nation of microgram quantities ofof Versene per milliliter, the curve uranium(IV) in the presence of milli-was reproducible. For higher concen- gram quantities of uranium(VI) intrations of Versene, the height of the slurries of U03 . Indirect methodschromium curve gradually decreased. were used but were not satisfactoryUnder those conditions, the end points because of the numerous steps andwere easier to determine because of precautions required. The separationthe steeper slope of the titration 0f uranium(IV) as UF4 by means ofcurve at the inflection point. The fluoride ions in the presence ofstandard deviation of the determi- lanthanum as a carrier has been dis-nation of 1.5 mg of uranium is of the cussed.'14' The thiocyanate methodorder of 1%. It was noted that at low
concentrations of uranium an increase (12).. „ „ . „.,,. , , , H. 0. Day, J. S. Gill, E. V. Jones, and
in the potential change occurs at the w. L. Marshall, A Search for a Reliable Sulfateend point when the electrode is cleaned Analysis of Uranyl Sulfate; the Ion Exchange Method,
. l uMn j ti j u r u ORNL CF-52-2-50 (Feb. 7, 1952).with HIND, and llamed before each (13). ., „ . ,..,,„. ,
J A. F. Roemer, Jr., Analytical Services fortitration. The 0.05 N CrS04 solution the HRP," Anal. Chem. Quar. Prog. Rep. June 26,in 0.25 M H2S04 showed only a 2% i95*f ornl-1361. p. 60.change from the initial titer value ...„„,va?l "r^'^i I'lTrl^Ti ?*/'»*. ^rl*'° Analysis 01 Uranyl Sulfate Solutions, Anal. Chem.OVer a period of 25 days. The critical Quar. Prog. Rep. June 26, 1951, ORNL-1113, p. 73.
46

was used for the final uranium determi
nation after the oxidation of uranium(IV)
to uranium(VI).
A perchloric acid solution ofuranium(IV) was observed to give arather high absorbancywith chloranilicacid, and it was thought that thisreaction could be made the basis for a
simple colorimetric procedure. Whenthe study was first initiated, difficulty was encountered in the preparationof a stable uranium(IV) stock solutionwith a concentration of approximately500 fig of uranium per milliliter. Theprocedure found most satisfactory wasto prepare uranium(IV) from a standardized perchloric acid solution of U03by the Jones reductor method. Analiquot of the stock uranium(IV)perchloric acid solution was dilutedin iced, oxygen-free water to give astandard solution of 500 fig of urani-um(IV) per milliliter. This dilutesolution, when kept iced, was found tobe stable for at least 1.5 hours. The
U03 was analyzed by placing the solidUO sample and an aliquot of thestandard uranium(IV) solution in a50-ml volumetric flask, adding 20 mlof a 2.6 x 10"3 M chloranilic acidsolution and 15 ml of concentrated
HC104, and agitating the mixture untilall the UO, went into solution. Thesolution was then brought approximatelyto volume, cooled, and diluted to thedesired volume with water. The opticaldensity was determined after a color-development period of about 20 minutes.A reference solution of equivalenturanium(VI) concentration that contained all the reagents was used. Inthis determination, the absorbancy maybe measured at 333 mfi, the wavelengthat which the maximum absorbancy occurs.However, if large concentrations ofuranium(IV) are present (20 to 50fig/ml) , the 340-m/u, wavelength may beused, a condition under which there isalso less absorption by the reagent.Uranium(IV) may be determined in theconcentration range of 2.5 to 50 figof uranium per milliliter of spectro
PERIOD ENDING JANUARY 10, 1953
photometric volume with a precision ofless than 5% in the presence of asmuch as 150 mg of U03. There areseveral factors yet to be investigated,for example, conditions favorable togreater stability of the complex at auranium(IV) concentration of less than5 fig of uranium per milliliter ofspectrophotometric volume. Under thepresent test conditions and at theconcentration range used, the complexremains stable in the volumetric flask
for over 20 min ; however , its absorbancychanges rapidly after 1 min when thesolution is transferred to a cuvette.
Also, the limit of the concentrationof U03 above which Beer's law is nolonger obeyed is to be determined.
Determination of Microgram Quanti
ties of Fluoride in Uranyl solutions
(M. L. Druschel). A sensitive andprecise colorimetric procedure for thedetermination of microgram quantitiesof fluoride inuranyl sulfate solutionswas desired. The method of Revinson
and Harley,'15' which is based on themeasurement of the fading of a ChromeAzurol S-thorium lake in the presenceof microgram quantities of fluoride,was adopted. Interfering ions, suchas iron, aluminum, uranium, tin,titanium, beryllium, zirconium, sulfates, and phosphates, are removed bya modified Willard and Winter(16)distillation prior to the colorimetricfluoride determination.
The Chrome Azurol S dye is preparedas 0.04% aqueous solution with thymoland gum arabic added as stabilizers.If the solution is allowed to stand
for two to three weeks and is then
filtered and stored in a dark bottle,
the analytical factor'17' for fluorideD. Revinson and J. H. Harley, Spectro
photometric Determination of Fluoride Ion vithChrome Azurol S, Analytical Branch, Health andSafety Division, New York Operations Office,U. S. Atomic Energy Commission (no date ordocument number).
(16)H. H. Willard and 0. B. Winter, "VolumetricMethod for Determination of Fluorine," Ind. Eng.Chem., Anal. Ed. 5, 7 (1933).
(17) Milligrams of F per milliliter of spectrophotometric volume, divided by optical densityunit for 1-cm cell length.
47
ANALYTICAL CHEMISTRY DIVISION QUARTERLY PROGRESS REPORT
will not vary from day to day. Thorium the method. To determine whether thenitrate solution, 0.00018 M, is pre- uranyl or the sulfate ions cause thispared in 0.001 M perchloric acid to decrease, separate tests were carriedprevent adsorption of the thorium on out in the presence of uranyl ionsglass. A buffer of pH 4 is prepared (from U03) and of sulfate ions. Thefrom perchloric acid, o-toluidine, and effect of increased perchloric acidwater. Redistilled water is used for concentration on this interference wasall reagent preparation and as the also examined. The presence of asreference blank. All spectrophoto- much as 12.6 x 10"3 moles per millilitermetric measurements are made at 605 mfi. of sulfate solution, equivalent to 3 mg
The conditions and results of this of uranium in UO SO , does not lowermethod differ somewhat from those the sensitivity. However, higher con-originally reported.'15' A color centrations cause a proportional lower-development period of only 1 hr was ing of sensitivity. Uranyl ions inrequired, compared with the 2-hr concentrations up to 3 mg of uranium(VI)period specified in the original per milliliter in perchloric acidprocedure. The color was stable for solution do not change the factor, butanother 3 hours. A precision of 3 to in the concentration range from 3 to7% was achieved - a slight improvement 5 mg of uranium(VI) per milliliter, aover the 10% reported. A twofold in- slight reduction in sensitivity iscrease in sensitivity over that re- noted. Thus it was found that bothported was obtained, that is, a fluoride ions tend to decrease the sensitivityanalytical factor of 1.65; Revinson of the method. A further study of theand Harley reported 3.52. These uranyl sulfate interference in whichimproved results may be partly ex- the molarity of perchloric acid wasplained by the quality of the Chrome increased from 2.9 to 3.5 brought aboutAzurol S received from Geigy.'18' an approximately twofold reduction in
Determination of Microgram Quanti- sensitivity; but in the range 0 to 5 mgties of Zirconium in Uranyl Solutions of uranium per milliliter, the deviation(S. K. Gross). The study of the in the value of the factor did notchloranilic acid method' ' for the exceed the standard deviation of thedetermination of zirconium in uranyl method, indicating that under thosesolutions was continued. This method conditions a single factor could berequires the use of a Beckman spectro- used for the uranium concentrationphotometer equipped with the photo- range below 5 mg of uranium permultiplier attachment described below. milliliter.The factors studied were the interference of sulfate ions associated with A study of the reduction of theuranyl ions, the effect of increaseof interference of iron(III) with in-perchloric acid concentration on the creasing HC104 concentration showedreduction of interferences, and the that as the molarity of the acid waselimination of fluoride ion inter- increased from 2 to 3.5 M in incrementsference. Also, a uranyl fluoride °* 0*5 Af, the interference was reducedsample was analyzed for zirconium. from 20 to 4% of the zirconium ab-
As was described in the previous sorbancy. Increase in the HC104report,'19' the presence of uranyl molarity to 4.0 gave no further decreasesulfate decreases the sensitivity of ln iron interference. However, the
-__ analytical factor for zirconium alsoGeigy Company, inc., 89-91 Barklay St., New decreased with increasing HC104 con-
Y°rk(l9N)' Y' centration. For 2, 3, and 4.0 MHC10,,0. Menis, Analysis of Uranyl Sulfate and ,. l _ *„„».„.,„ _ o e n o j n n
Uranium Oxide," Anal. Chem. Quar. Prog. Rep. the faCt0rS were 3«5> 7'3. a"d 9.0,Sept. 26, 1952, ORNL-1423 (in press). respectively.
48
Determination of Traces of Nitrate
in Uranyl Oxide (S. A. Ross). Themethod described in a previous report'19 'for the determination of traces ofnitrate in UO by the use of phenoldi-sulfonic acid was abandoned becausethe absorbancy of the blank was highand difficult to reproduce. A methodemploying chromous reduction of thenitrate to ammonia and Kjeldahl distillation of the ammonia'20' is presentlybeing considered.
Additions to the Photomultiplier
Tube Attachment for the BeckmanSpectrophotometer (0. Menis). RecentlyBeckman Instruments, Inc. has madeavailable a photomultiplier attachment'21' that greatly enhances thesensitivity of spectrophotometricinstruments. Three additions to theattachment have been made to permitits use with the Beckman model DUspectrophotometer, that is, a voltagetap switch, an additional load resistor,and a filter adapter for the tungstenlamp housing.
The attachment as supplied isequipped with a closed battery boxthat houses a series of dry batteriesthat produce 630 volts. In order toadjust the sensitivity of the phototube, opening of the high voltage boxand disconnection of some of the leadsare required. The voltage tap switchthat was added permits control of thevoltage in steps of 45 volts, therebyproviding sensitivity control at aconstant slit width. Batteries werealso added to permit increase of thetotal voltage, by 135 volts if stillhigher sensitivity is desired.
An additional phototube loadresistor (20 megohms in parallel witha 0.01-/xf capacitor) was installed tocontrol the fluctuation of the galvanometer needle and to facilitateinstrument reading.
0. Menis and C. K. Talbott, 'Determinationof Trace Elements," Anal. Chem. Quar. Prog. Rep.Dec. 26. 1951, ORNL-1233, p. 76.
(21) Beckman Instruments, Inc., South Pasadena,Cal., Bulletin 282.
PERIOD ENDING JANUARY 10, 1953
One of the most important featuresof the additions to the attachment isthe filter adapter in front of thetungsten-lamp light source. By use offilters that absorb scattered light ofthe wavelengths above that measured,closer adherence to Beer's law hasbeen attained. The analytical factorfor solutions of potassium dichromate(50 to 100 fig of K2Cr207), which isknown to conform to Beer's law whenmeasured at 353 rafi, was 42.9 fig ofK2Cr207/ml/optical density unit with astandard deviation o,f 16%. The factorfor the same solution when measured bythe use of a Corning filter No. 5970was 31.7 with a standard deviation of1%. This improvement in standarddeviation is an indication of theimproved linearity of absorbancy as afunction of concentration that isachieved by use of the filter. Similarly, the analytical factor foruranyl sulfate solutions in the concentration range of 10 to 50 mg ofuranium per milliliter and measured at418 mfi by the use of a Corning No.5113 filter, was 17.8 (mg/ml/opticaldensity unit) with a standard deviationof 0.3%.
QUALITY CONTROL
R. L. McCutchen
The control programs for both theGeneral Analytical Laboratory and theANP Analytical Laboratory have beenrevised and expanded during thisperiod. Daily control standards andregular process determinations havebeen used to maintain the accuracy andprecision of the reported test results.Youden's method of control was continued in the HRP analytical laboratories. The control programs forthe analytical laboratories at theX-10 site remained unchanged duringthis quarter.
During this period 10,208 determinations for control purposes werereported by the five laboratoriesparticipating in the control program
49
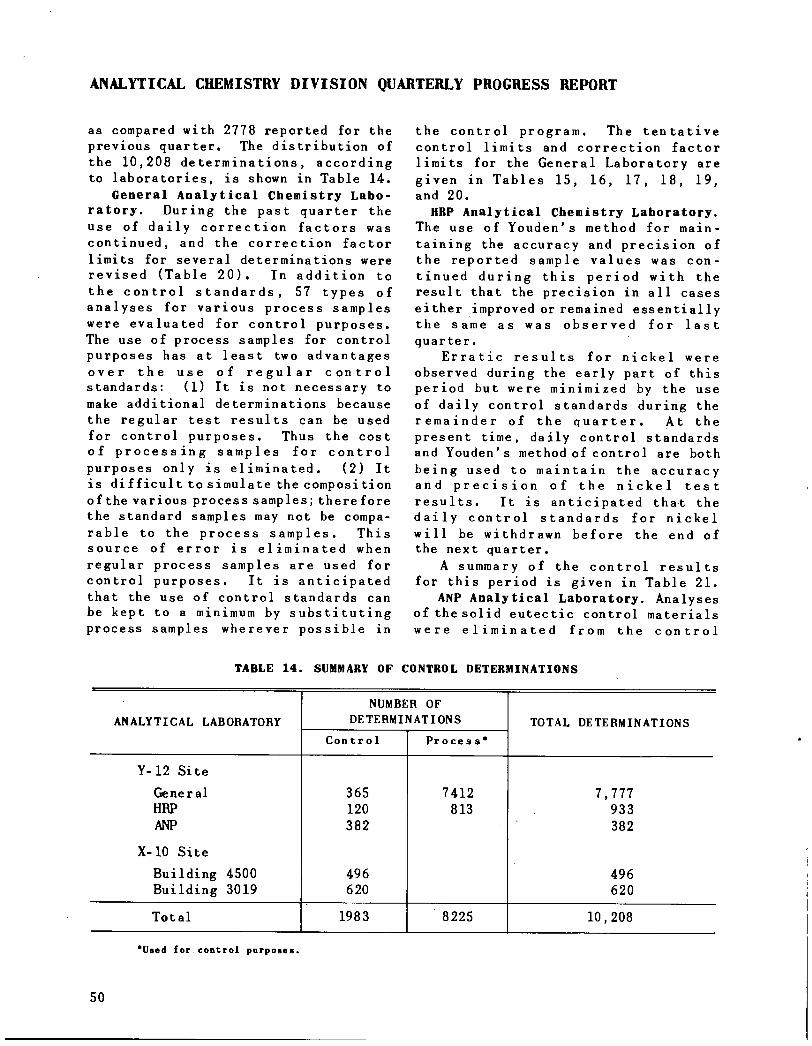
ANALYTICAL CHEMISTRY DIVISION QUARTERLY PROGRESS REPORT
as compared with 2778 reported for theprevious quarter. The distribution ofthe 10,208 determinations, accordingto laboratories, is shown in Table 14.
General Analytical Chemistry Laboratory. During the past quarter theuse of daily correction factors wascontinued, and the correction factor
limits for several determinations wererevised (Table 20). In addition to
the control standards, 57 types ofanalyses for various process sampleswere evaluated for control purposes.The use of process samples for controlpurposes has at least two advantagesover the use of regular controlstandards: (1) It is not necessary tomake additional determinations because
the regular test results can be usedfor control purposes. Thus the costof processing samples for controlpurposes only is eliminated. (2) Itis difficult to simulate the compositionof the various process samples; thereforethe standard samples may not be comparable to the process samples. Thissource of error is eliminated when
regular process samples are used forcontrol purposes. It is anticipatedthat the use of control standards canbe kept to a minimum by substitutingprocess samples wherever possible in
the control program. The tentativecontrol limits and correction factor
limits for the General Laboratory aregiven in Tables 15, 16, 17, 18, 19,and 20.
HRP Analytical Chemistry Laboratory.
The use of Youden's method for main
taining the accuracy and precision ofthe reported sample values was continued during this period with theresult that the precision in all caseseither improved or remained essentiallythe same as was observed for last
quarter.
Erratic results for nickel were
observed during the early part of thisperiod but were minimized by the useof daily control standards during theremainder of the quarter. At thepresent time, daily control standardsand Youden's method of control are both
being used to maintain the accuracyand precision of the nickel testresults. It is anticipated that thedaily control standards for nickelwill be withdrawn before the end ofthe next quarter.
A summary of the control resultsfor this period is given in Table 21.
ANP Analytical Laboratory. Analysesof the solid eutectic control materialswere eliminated from the control
TABLE 14. SUMMARY OF CONTROL DETERMINATIONS
NUMBER OF
ANALYTICAL LABORATORY DETERMINATIONS TOTAL DETERMINATIONS
Control Process*
Y-12 Site
General 365 7412 7,777HRP 120 813 933
ANP 382 382
X-10 Site
Building 4500 496 496
Building 3019 620 620
Total 1983 8225 10,208
'Used for control purposes.
50

PERIOD ENDING JANUARY 10, 1953
TABLE 15. TENTATIVE CONTROL LIMITS BASED ON THE DIFFERENCE BETWEEN
DUPLICATE DETERMINATIONS BY GRAVIMETRIC METHODS
Weight of Final Precipitate: 100 mg
DETERMINATIONNUMBER OF
DUPLICATES
STANDARD DEVIATION
(%)
CONTROL LIMITS
(Limit of error, %)*
Fe 4 4 10
. Ni 31 0.8 1.5
Al 2 1.0 2.0
Zr 2 7.0 15
MgMg*»
71
16
1.5
15
3.0
30
Li 30 1.5 3.0
o> 7 2.0 4.0
Nb 11 4.0 10
Si 33 1.5 3.0
Br 6 0.7 1.5
so;- 97 2.0 4.0
PO;-" 45 0.5 1.0
cio; 2 0.5 1.0
Loss on Ignition 29 1.3 2.5
•95% probability level.
"Less than 100 mg of final precipitate.
TABLE 16. TENTATIVE CONTROL LIMITS BASED ON THE DIFFERENCE BETWEEN
DUPLICATE DETERMINATIONS BY VOLUMETRIC METHODS
NUMBER VOLUME STANDARD CONTROL
DETERMINATION OF OF TITRANT DEVIATION LIMITS
DUPLICATES (ml) (%) (Limit of error, %)*
Fe 53 >5 2.8 5.0
Ca 46 >5 1.5 3.0
Al 65 >5 1.8 3.0
Mg 11 >5 0.5 1.0
Mn 33 >5 1.5 3.0
Cr 24 ~10 0.8 1.5
V 4 5 to 10 2.0 5.0
NH3 9 ~10 2.5 5.0
Cl 379 >2 1.6 3.0
Br 4 >2 1.0 2.0
Alkalinity 153 10 to 15 0.5 1.0
PDA 2 >5 0.7 1.5
U** 25 15 to 25 0.3 0.5
U*** 12 ~4 1.2 2.5
•95% probability level
"Jones reductor-ceric sulfate method.
'"Potentiometric titration-chromus-ferric method.
51
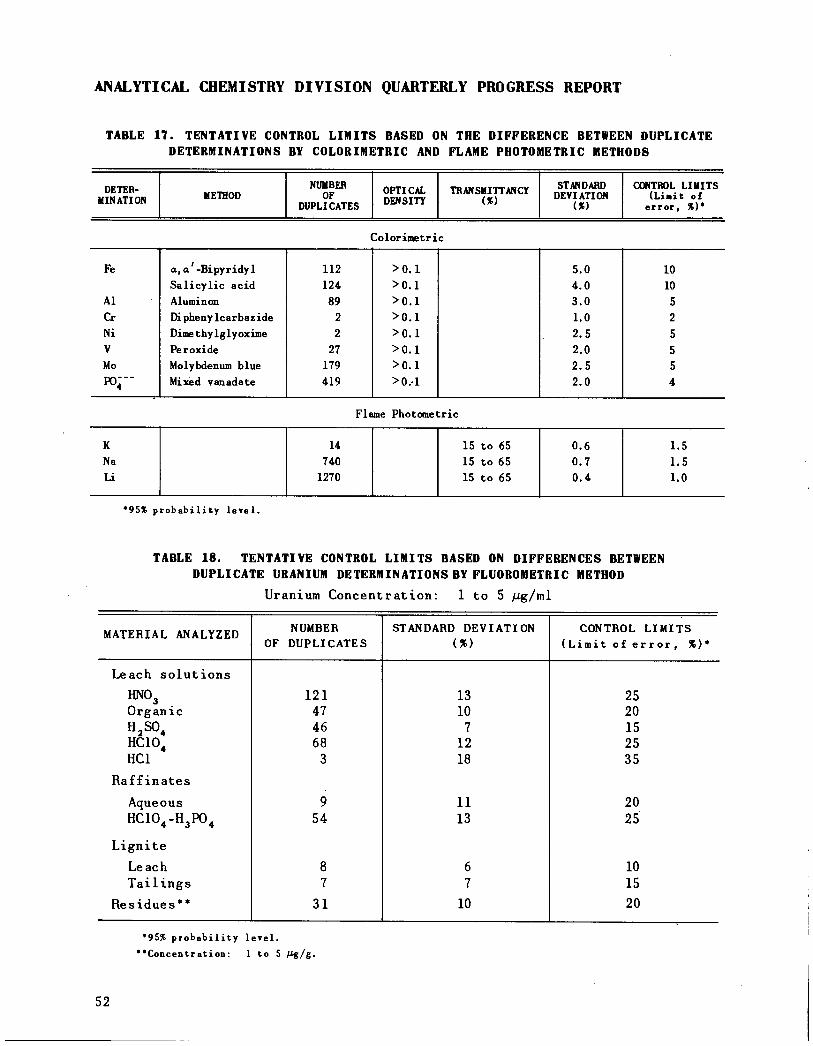
ANALYTICAL CHEMISTRY DIVISION QUARTERLY PROGRESS REPORT
TABLE 17. TENTATIVE CONTROL LIMITS BASED ON THE DIFFERENCE BETWEEN DUPLICATE
DETERMINATIONS BY COLORIMETRIC AND FLAME PHOTOMETRIC METHODS
DETER
MINATIONMETHOD
NUMBER
OF
DUPLICATES
OPTICALDENSITY
TRANSMITTANCY
(%)
STANDARDDEVIATION
(%)
CONTROL LIMITS(Limit oferror, %)*
Colorimetric
Fe a, a -Bipyridyl 112 >0.1 5.0 10
Salicylic acid 124 >0.1 4.0 10
Al Aiuminon 89 >0.1 3.0 5
Cr Diphenylcarbazide 2 >0.1 1.0 2
Ni Dimethylglyoxime 2 >0.1 2.5 5
V Peroxide 27 >0.1 2.0 5
Mo Molybdenum blue 179 >0.1 2.5 5
po4- Mixed vanadate 419 >0.1 2.0 4
Flame Photometric
K 14 15 to 65 0.6 1.5
Na 740 15 to 65 0.7 1.5
Li 1270 15 to 65 0.4 1.0
•95% probability level.
TABLE 18. TENTATIVE CONTROL LIMITS BASED ON DIFFERENCES BETWEEN
DUPLICATE URANIUM DETERMINATIONS BY FLUOROMETRIC METHOD
Uranium Concentration: 1 to 5 /ug/ml
MATERIAL ANALYZEDNUMBER
OF DUPLICATES
STANDARD DEVIATION
(%)
CONTROL LIMITS
(Limit of error, %)*
Leach solutions
HN03 121 13 25
Organic 47 10 20
H2S04 46 7 15
HC104 68 12 25
HC1 3 18 35
Raffinates
Aqueous 9 11 20
HC104-H3P04 54 13 25
Lignite
Leach 8 6 10
Tailings 7 7 15
Residues** 31 10 20
52
•95% probability level.
"Concentration: 1 to 5 Mg/g.

PERIOD ENDING JANUARY 10, 1953
TABLE 19. TENTATIVE CONTROL LIMITS BASED ON DIFFERENCES BETWEEN DUPLICATE
URANIUM DETERMINATIONS BY I-ASCORBIC ACID COLORIMETRIC METHOD
Optical Density: > 0.1
SOLUTIONNUMBER OF STANDARD DEVIATION CONTROL LIMITS
DUPLICATES (%) (Limit of error, %)*
Leach solution
Organic 277 4 10
HC104 28 2.3 5HC1 16 1.7 3
Stripping solution
Aqueous 29 4.2 10
Na2C03 8 2.8 5
H3P04 6 3.8 10
Lignite leach 2 3.0 5
•95% probability level.
TABLE 20. REVISED CONTROL LIMITS AND CORRECTION FACTOR
LIMITS BASED ON CONTROL STANDARDS
DETERMI•NATION
METHOD
NUMBEROF
DUPLICATES
MAGNITUDE OFQUANTITYMEASURED
STANDARDDEVIATION
(%)
CONTROL LIMITS(Linit of
error, %)*
CORRECTIONFACTOR LIMITS
<%)
U Fluorometric (new) 12 0.010 to0.060 fig 4.5 10 0.90 to 1.10
Fluorometric (old) 25 1 to 5 Mg/ml 3.2 5 0.90 to 1.10
I-Ascorbic acid 19 O.D. >0.1*» 2.0 5 0.95 to 1.05
Fe a,a -Bipyridyl 33 O.D. >0.1 2.5 5 0.95 to 1.05
Salicylic 10 O.D. > 0.1 2.2 5 0.95 to 1.05
Volumetric 10 >5ml 1.5 3 0.98 to 1.02
Al Aiuminon 31 O.D. >0.1 5.0 10 0.80 to 1.10
V Peroxide 7 O.D. >0.1 1.5 3 0.95 to 1.05
Mo Molybdenum blue 31 O.D. > 0.1 3 5 0.95 to 1.05
Ca Volumetric 6 ~15 ml 1.5 3 0.95 to 1.05
•95% probability level.
"O.D. = optical density.
program as a result of the study reported last quarter.^ ' Consequently,standard-control solutions were used
exclusively to maintain the accuracyand precision of reported samplevalues.
During this period, it was observedthat the precision and accuracy of the
(22)R. L. McCutchen, "ANP Analytical Laboratory,"
Anal. Chem. Quar. Prog. Rep. Sept. 26, 1952,ORNL-1423 (in press).
uranium and zirconium values were
unsatisfactory. Investigation of themethods being used led to the conclusion that zirconium was probablyinterfering with the uranium determination and that arsenic and silicawere
contaminating the zirconium oxideresidues. The necessary remedialaction will be taken, and it isanticipated that the accuracy andprecision of both the uranium and
53

ANALYTICAL CHEMISTRY DIVISION QUARTERLY PROGRESS REPORT
TABLE 21. STATISTICAL EVALUATION OF THE PRECISION AND ACCURACY OF CONTROL
RESULTS OBTAINED BY USE OF YOUDEN' S METHOD OF DAILY DIFFERENCE
DETERMIMETHOD
NUMBER OF
DETERMINATIONS
CONCENTRATION
RANGE
(Mg/»D
STANDARD DEVIATION(%) DIFFERENCES
OUTSIDE
CONTROL
LIMITS(o) (%)NATION Fourth
QuarterThird
Quarter
U Jones reductor -
ceric sulfate 43 25 to 50(fc) 0.25 0.4 5
Ni Dimethylglyoxime*6' 40 10 to 40 2 2 13
Dime thylglyoxime( ' 33 10 to 40 5 7
Cr Diphenylcarbazide
bismuthate 44 10 to 40 1.5 1 9
Fe a,a -Bipyridyl 40 10 to 40 1.5 2.5 18
Mn Periodate 8 10 to 40 2.5 2.5 0
(a)
(c)
(d)
95% probability level.
/ml."g
Process samples.
Daily control standards.
TABLE 22. STATISTICAL EVALUATION OF THE PRECISION AND ACCURACY OF TEST
RESULTS REPORTED FOR STANDARD EUTECTIC CONROL SOLUTIONS
DETERMINATION
METHOD
NUMBER OFDETERMI
NATIONS
MAGNITUDE OFMEASURED
QUANTITY
CONCENTRATIONRANGE
(Mg/ml)
STANDARDDEVIATION
(%)
CONTROL
LIMITS(Limit of
error, %)*
BIAS
U Potentiometric(chromous-ferric) 64 ~4 ml 0.6 to 1.1" 1.7 3.5 Positive
Zr Phenylarsonicacid 64 ~0.15 mg 1.0 to 2.5** 2.0 4 Positive
Fe o-Phenan-throline 81 O.D. > 0.1*" 3 to 5 6.5 13 Positive
Ni Dimethyl-glyoxime(5-cm cells) 85 O.D. > 0.1 3 to 5 8.5 17 Positive
Dimethyl-glyoxime(1-cm cells) 23 O.D. >0.1 3 to 5 9.0 18 Positive
Cr Diphenylcarbazide 59 O.D. >0.1 3 to 5 5.0 10 None
•95% probability level
"l»g/ml.
"•O.D . = optical densit y.
54

zirconium test results will be improvedduring the next quarter.
The reason for the positive biasthat was observed during this periodfor the nickel and iron values isbeing investigated. It is believedthat residual fluoride may be onesource of trouble; however, at thistime it is not possible to reach anydefinite conclusion.
A summary of the control valuesreported for this quarter is given inTable 22.
Analytical Chemistry Laboratories
(X-10). In general, the precision ofthe uranium and thorium test results
PERIOD ENDING JANUARY 10, 19 53
has been good, with some improvementbeing noted for the fluorometricuranium values. The trend toward anegative bias observed for the colorimetric thorium results (47 fig ofthorium per milliliter) continued butwas corrected when a new thorium
standard (250 fig of thorium per milliliter) was substituted. Such biasesas were observed last quarter havebeen eliminated either by substitutionof new control standards or by appropriate remedial action. Thereforethe accuracy for this period issatisfactory. The control resultsreported for uranium and thorium aresummarized in Table 23.
TABLE 23. ANALYTICAL LABORATORIES (X-10 SITE) URANIUM AND THORIUM PROGRAM
SAMPLE
CODE
LABORA
TORYNO.
DETERMI
NATIONMETHOD
NUMBEROF
DUPLI
CATES
CONCEN
TRATION
(Mg/ml)
CONTROL LIMITS(Limit of error, %)*
DETERMI
NATIONS
OUTSIDE
CONTROL
LIMITS
(%)
BIASNO.
Found Established
E-l
D-2
Th-6
Th-5
G-2
Th-4
4500
3019
4500
3019
4500
4500
4500
3019
4500
U
U
U
U
Th
Th
U
U
Th
Fluorometric
Fluorometric
Colorimetric(thiocyanate)
Colorimetric(thiocyanate)
Colorimetric(Thoron)
Colorimetric(Thoron)
Colorimetric
(thiocyanate)
Colorimetric(thiocyanate)
Colorimetric(Thoron)
64
160
19
54
45
19
45
108
64
2.5
2.5
506
506
250
47
2.53"
2.53**
93**
5
7
3
2
3
3
3
2
2
10
11
2
3
3
3
2
3
2
3
6
5
2
5
0
10
2
3
None
None
Negative
Negative
None
Negative
Positive
None
Positive
*95% probability level.
/ml.*mg
55

ANALYTICAL CHEMISTRY DIVISION QUARTERLY PROGRESS REPORT
SERVICE ANALYSES
H. P. House
ANALYTICAL SERVICES FOR ANP PROJECT
L. J. Brady S. A. ReedJ. R. Lund
Analysis of NaK for Beryllium.
During the latter part of the quarter,the number of samples to be analyzedfor beryllium increased significantly.A major group of these samples camefrom tests that were carried out bythe Reactor Chemistry group to determine the compatibility of BeO andand NaK. In addition to the analysisof alcoholic and aqueous solutions, afew solid samples that consisted ofsegments of metal tubes and flangesfrom test equipment were dissolved andtested for beryllium. Interferingmetal ions were removed by electrolyticdeposition in a mercury cathode, andthe beryllium was determined colori-metrically by a method that employedp - nitrobenzeneazo-orcinol as thechromogenic agent.
Gravimetric Determination of Zir
conium. The results of comparativetests completed during this periodindicate that mandelic acid affords
several advantages over phenylarsonicacid as a precipitating agent in thegravimetric determination of zirconiumin fluoride eutectics. Therefore the
mandelic acid method was adopted forall routine zirconium determinations
during the last half of this period.
Analysis of Uranium Tetrachloride.
A series of samples of UC1. wasanalyzed for the major components,uranium and chloride, and for theimpurities, U02 and U0C12. Each samplewas refluxed with ammonium oxalate,and the uranium content of the residue
was then determined and reported asU02 . The U0C12 was determined indirectly by measuring the chloridecontent of the residue after dissolution
of theUCl4 byanhydrous methyl acetate.
56
Impurities in Lead. Minor impurities(Fe, Ni, Cr) in lead were determinedby applying colorimetric methods tothe analysis of the electrolytefollowing removal of the lead byelectrolytic deposition.
Analysis of Alkali Hydroxides.Alkali hydroxide samples were analyzedfor iron, chromium, and nickel. Because the material as received was not
homogeneous and could not be reducedto fine particle size, the entiresample was dissolved to ensure that arepresentative aliquot was used in thetest.
Work for General Electric Co. Work
completed for the General Electric Co.included: tests of alkali metals to
determine the relative concentrations
of sodium and lithium, tests forimpurities in sodium, and specificationtests of mineral oil.
Backlog of Samples. The backlog ofsamples was reduced from 203 to 115during the quarter. A total of 951samples was analyzed. Approximately60% of the work was submitted by theReactor Chemistry group, 22% by theANP Experimental Engineering section,and 18% came from miscellaneous
sources.
ANALYSIS OF ORES AND RELATED MATERIALS
W. F. Vaughan
The major portion of the work consisted of the analysis of Florida LeachZone ores, leached residues, tailings,aqueous leach solutions, organic extracts, and raffinates for uranium
and, inmany cases, for major componentswhich included Al, Fe, Ca, NO3 , SO^ " ,PO;-', and Si02.
Increased emphasis was placed on theanalysis of lignites and of samplesderived from the experimental processingof uraniferous lignites for uraniumrecovery. A study was made of the

IS
32
H-
wS s
£i
g"b
toft
«T
3^
Q3
^ft
on
ns C
Os
S*8-
Si> r
H-h
-P,
g)
gft
a •1
B •<
B r-
•<
oift
o-
H»
rt
rt
0B
>H
-H
*v»
se
>H
-o
O
toto
BB
Z
h*
TE
CH
NIC
AL
^>
ZK
9I-"
i—»
*-
*•
to
2»
Pto
co
W ON
4k..
h*
ON
NO
NT
EC
HN
ICA
L
tOto
tOto
AN
P-^
IO
CO
H^
-4
O0
0V
O
O
EL
EC
TR
OM
AG
NE
TIC
SO z~
4-J
r-
hH
4»
ISO
TO
PE
RE
SE
AR
CH
AN
DP
RO
DU
CT
ION
•<
4*
*•
CA
o z CO
l->
ON
cn
ON
4*
9
00
ON
Co
00
MA
TE
RIA
LS
CH
EM
IST
RY
PI
OK
3O
-J
CO
cC
O0
0O
Nvo
n CO
H hH
h-»
!-•
zIO
to
zo
to
IO
o
c BR
EE
D
zO
Nca
ca
otr
ON
©o
ON
>
oC
OH
»
CH
EM
ICA
LT
EC
HN
OL
OG
Ym C
OV
Ovo
ft
n
ON
>-•
ON
i BC
HE
MIS
TR
Y*
•*
-P B rt
cn
l-»
cn
0Y
-12
AD
PP
RO
CE
SS
IMP
RO
VE
ME
NT
»-*
}-*
0 to
o H
C/1
cn
Y-1
2S
TO
RE
So
ogc
o
3S
to
ON
to
to
MA
INT
EN
AN
CE
BU
ILD
ING
AN
DS
HO
PS
I-"
00
>-*
oo
GE
NE
RA
LE
LE
CT
RIC
CO
MP
AN
YH
!-•
i-"
z
1—
cn
cn
MIS
CE
LL
AN
EO
US
to
I-*
S3
tn
ON
-j
to
*»
-J
to
-J
cn
h*
TO
TA
LD
ET
ER
MIN
AT
ION
S-J
-J
cn
cn
CO
cn
CO
to
©V
O-a
cn
SS6T
'01
AHVUMVf
9MI0M3
(101U3d
> 09
r tn to Ilk
03
w X o •n H M n > r cn
pj
so
M o pj
o sb
> H GO
PI
H SB
P3
•53
O e so
H > ss
H PI
SO CO
w to

effects of high sulfate content of during this quarter, but an increaselignites, such as is found in the is anticipated in the near future,lignites under test, on the interpre- Samples from dynamic corrosion teststation of test results, especially included uranyl salt solutions andproximate analysis results. The uranium oxide slurries. The amount ofresults of this study have been re- this work was essentially the same asported separately. during the previous quarter.
A series of organophosphorus com- The number of samples of uranylpounds is being synthesized by the sulfate solutions of low uranium con-Materials Chemistry Division. The centration (approximately 5 g ofprecision and accuracy required in uranium per liter) increased sharply;carbon and hydrogen determinations samples of high concentration (approxi-incident to these syntheses, often mately 300 g of uranium per liter)with small amounts of sample, made it decreased markedly.necessary to employ microcombustion As aresult of the over-all decreasetechniques. The necessary precision in samples, the number of laboratoryand accuracy have been attained and personnel was decreased from 12 to 8.several operators have been trained A total of 1413 samples was receivedfor this work. by the laboratory and results of the
analyses of 1517 samples were reportedduring the quarter, 12,079 determi-
ANALYTICAL SERVICES FOR HRP nations having been made. A backlogA. F. Roemer, Jr. of 139 samples exists.
The work of the HRP AnalyticalLaboratory continues to consist almostentirely of the analysis of uranyl W* F' Vaughansulfate and uranyl fluoride solutions The Y-12 Stores has initiated aand of uranium trioxide slurries. program of specification testing ofThese materials are analyzed for lubrication oils. The required testsuranium and corrosion products, are being performed by this laboratoryprincipally nickel, iron, and chromium, and consist of the determinations ofby methods that have been reviewed in specific gravity, viscosity, moisture,previous reports. No significant steam emulsion number, neutralizationchange in methods has been made during number, and carbon residue,the quarter. A total of 3582 samples was received,
The number of samples from static and analytical results for 3385 samplescorrosion tests decreased sharply have been reported during the period.
58
MISCELLANEOUS ANALYSES