analytical calculations of helicopter torque coefficient ...of helicopter parasite power is an...
TRANSCRIPT

Analytical Calculations of Helicopter Torque Coefficient (CQ) and Thrust
Coefficient (CT) Values for the Helicopter Performance (HELPE) Model
Ki C. Kim
ARL-TR-1986 JUNE 1999
19990713 146 ;; i \ Approved for public release; distribution is unlimited.

The findings in this report are not to be construed as an official Department of the Army position unless so designated by other authorized documents.
Citation of manufacturer’s or trade names does not constitute an offkial endorsement or approval of the use thereof.
Destroy this report when it is no longer needed. Do not return it to the originator.
Army Research Laboratory Aberdeen Proving Ground, MD 21005-5068
ARL-TR- 1986 June 1999
Analytical Calculations of Helicopter Torque Coefficient (CQ) and Thrust Coefficient (CT) Values Model
for the Helicopter Performance (HELPE)
Survivability/Lethality Analysis Directorate
Approved for public release; distribution is unlimited.
i

Abstract
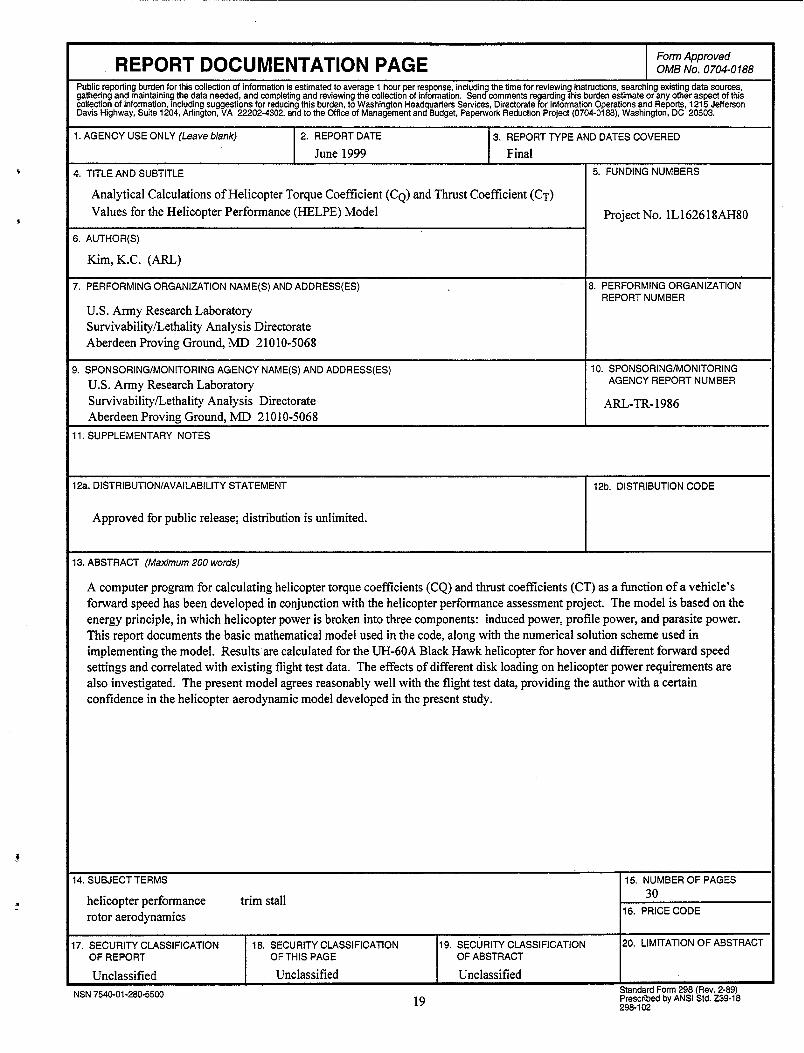
A computer program for calculating helicopter torque coefficients (CQ) and thrust coefficients (CT) as a function of a vehicle’s forward speed has been developed in conjunction with the helicopter performance assessment project. The model is based on the energy principle, in which helicopter power is broken into three components: induced power, profile power, and parasite power. This report documents the basic mathematical model used in the code, along with the numerical solution scheme used in implementing the model. Results are calculated for the UH-6OA Black Hawk helicopter for hover and different forward speed settings and correlated with existing flight test data. The effects of different disk loading on helicopter power requirements are also investigated. The present model agrees reasonably well with the flight test data, providing the author with a certain confidence in the helicopter aerodynamic model developed in the present study.
ii

TABLE OF CONTENTS
.
LIST OF FIGURES .......................................... v
LIST OF TABLES ........................................... vii
1. INTRODUCTION. .......................................... 1
2. NOMENCLATURE.......................................... 2
3. FORMULATION . . . . . . . . . . . . . . . . . . . . . . . . . . . . . . . . . . . . . . . . . . . 3
3.1 Equivalency of CQ and Cp ...................................... 3 3.2 Helicopter Power Coefficient, Cp ................................. 4 3.3 Vehicle Trim Solution ......................................... 7
4. RESULTS AND DISCUSSION . . . . . . . . . . . . . . . . . . . . . . . . . . . . . . . . . . 8
5. SUMMARY . . . . . . . . . . . . . . . . . . . . . . . . . . . . . . . . . . . . . . . . . . . . . . . 13
REFERENCES.............................................. 15
DISTRIBUTION LIST . . . . . . . . . . . . . . . . . . . . . . . . . . . . . . . . . . . . . . . . 17
REPORT DOCUMENTATION PAGE . . . . . . . . . . . . . . . . . . . . . . . . . . . . 19
. . . 111

INTENTIONALLY LEFT BLANK
iv

LIST OF FIGURES
Figure Pag;e
1. Variations of Helicopter Power Coefficient (Cp ) Versus Forward Speed (CT= 0.0066) . . . . . . . . . . . . . . . . . . . . . . . . . . . . . . . . . . . . . . . . . . . . . . 9
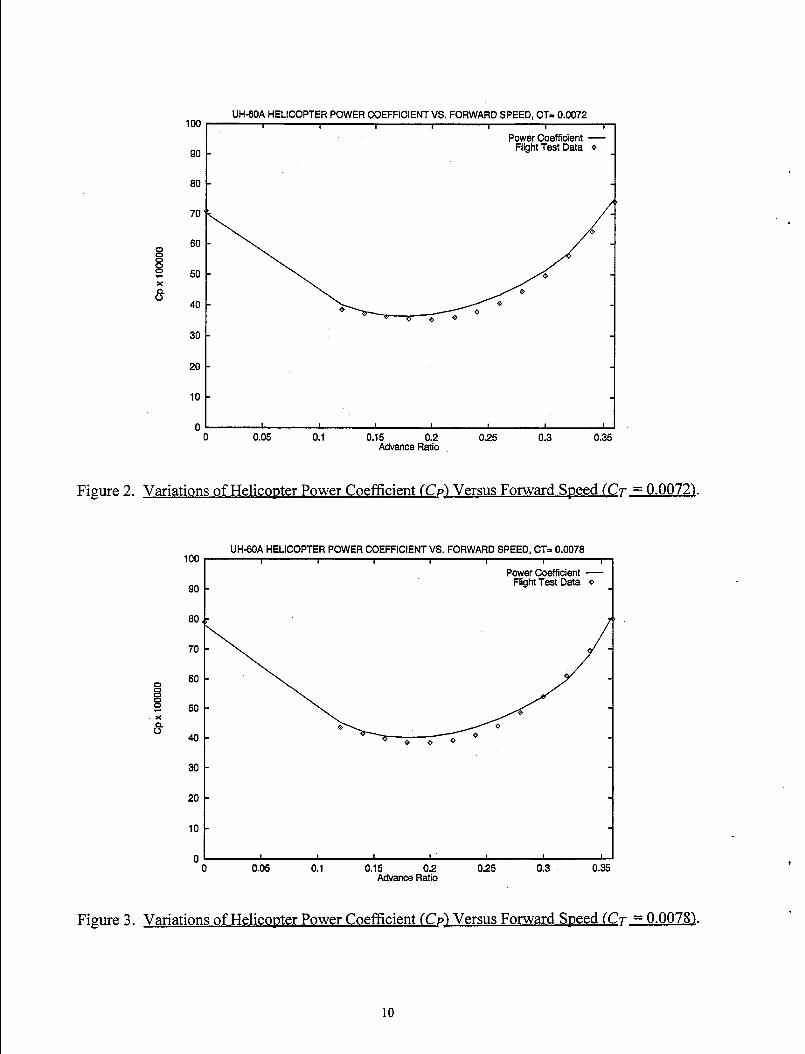
2. Variations of Helicopter Power Coefficient (Cp ) Versus Forward Speed (CT= 0.0072) . . . . . . . . . . . . . . . . . . . . . . . . . . . . . . . . . . . . . . . . . . . . . . 10
3. Variations of Helicopter Power Coefficient (Cp ) Versus Forward Speed (CT= 0.0078) . . . . . . . . . . . . . . . . . . . . . . . . _ . . . . . . . . . . . . . . . . . . . . . 10
4. Variations of Helicopter Power Coefficient (Cp ) Versus Forward Speed (c~=o.o084) . . . . . . . . . . . . . . . . . . . . . . . . . . . . . . . . . . . . . . . . . f . . . . 11
5. Variations of Helicopter Power Coefficient (Cp ) Versus Forward Speed (CT= 0.0090) . . . . . . . . . . . . . . . . . . . . . . . . . . . . . . . . . . . . . . . . . . . . . . 11
6. Variations of Helicopter Power Coefficient (Cp ) Versus Forward Speed (CT= 0.0096) . . . . . . . . . . . . . . . . . . . . . . . . . . . . . . . . . . . . . . . . . . . . . . 12
7. Variations of Helicopter Power Coefficient (Cp ) Versus Forward Speed (CT= 0.0102) . . . . . . . . . . . . . . . . . . . . . . . . . . . . . f . . . . . . . . . . . . . . . .
8. The Effects of Disk Loading on Helicopter Power Coefficient (Cp ) . . . . . . . . . .
I .
.

INTENTIONALLY LEFT BLANK
vi

LIST OF TABLES
Table Paae
1. UH-60A Black Hawk Helicopter Characteristics . . . . . . . . . . . . . . . . . . . . . . . 8
vii

INTENTIONALLY LEFT BLANK
. . . Vlll

ANALYTICAL CALCULATIONS OF HELICOPTER TORQUE COEFFICIENTS (CQ)
AND THRUST COEFFICIENTS (CT) VALUES FOR THE HELICOPTER PERFORMANCE (HELPE) MODEL
1. INTRODUCTION
As a Fiscal Year 1998 mission project, the Air System Engineering Analysis Team (ASEAT)
of the Survivability/Lethality Analysis Directorate (SLAD) of the U.S. Army Research Laboratory
(ARL) was tasked to develop an engineering analysis model to calculate the helicopter steady state performance. The model, which is to be used in support of helicopter ballistic vulnerability assessment projects, should be capable of determining the performance degradation of a helicopter when its engine is damaged during combat.
After literature surveys and lengthy discussions among team members as well as academia professionals (e.g., University of Maryland, Georgia Tech Research Institute, etc.) for a possible candidate program, ARL decided to adopt the existing Helicopter Performance (HELPE) code.[l]
The reasons for the selection of the code are ease of use, quick turn-around time, and the availability of source code and a documentation report. HELPE requires many engineering data to be input, and most of them are fixed parameters specific to the helicopter to be investigated. For example, helicopter gross weight, empty weight, rotor diameter, rotor rpm, blade aerodynamic coefficients, available engine powers, etc., are required for the HELPE input.
Other necessary input data for the HELPE code is a set of helicopter torque coefficients (CQ) and thrust coefficients (CT) as a function of a vehicle’s forward speed @). However, flight
test data specifying these values are not readily available for most helicopters. To expand the
applicability of the HELPE model, a computer code to numerically calculate these input values needed to be developed.
In this report, formulation and analysis details of the recently developed code for calculating CQ and CT of a generic helicopter system are presented, including brief descriptions of basic input-output relations of the code. Numerical results are obtained for UH-60 Black Hawk helicopter using the present code and correlated with flight test data. [2] Based on results
obtained, conclusions are drawn, with some recommendations for future works.
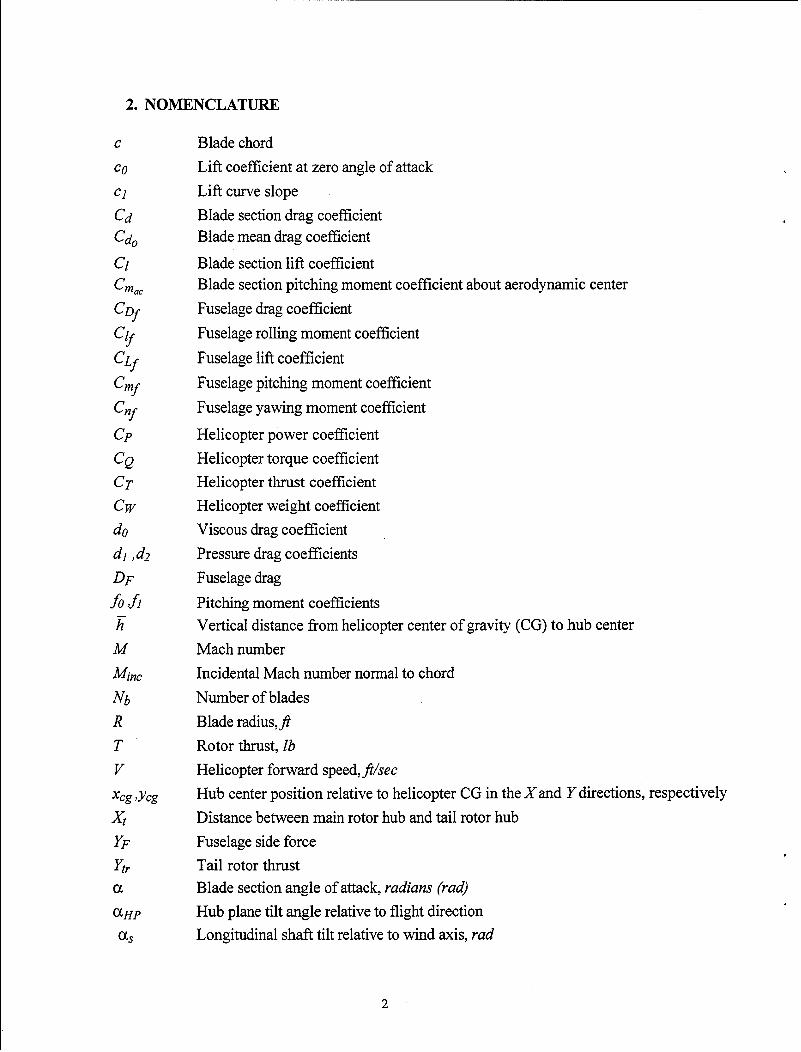
2. NOMENCLATURE
c
CO
Cl
cd
cdo Cl C 47,
cDf
9 cLf C
mf
cnf
CP
CQ
CT
cw do
4 42 DF
fo 2.h F M
M. mc
Nb R
T
V
xcg Jcg
xt
YF
ytr
a
aHP
as
Blade chord Lift coefficient at zero angle of attack
Lift curve slope
Blade section drag coefficient Blade mean drag coefficient
Blade section lift coefficient Blade section pitching moment coefficient about aerodynamic center
Fuselage drag coefficient
Fuselage rolling moment coefficient
Fuselage lift coefficient
Fuselage pitching moment coefficient
Fuselage yawing moment coefficient
Helicopter power coefficient Helicopter torque coefficient Helicopter thrust coefficient Helicopter weight coefficient Viscous drag coefficient Pressure drag coefficients Fuselage drag
Pitching moment coefficients Vertical distance from helicopter center of gravity (CG) to hub center Mach number Incidental Mach number normal to chord
Number of blades
Blade radius,$ Rotor thrust, Zb Helicopter forward speed&sec Hub center position relative to helicopter CG in the X and Y directions, respectively
Distance between main rotor hub and tail rotor hub Fuselage side force Tail rotor thrust Blade section angle of attack, radians (rad) Hub plane tilt angle relative to flight direction Longitudinal shaft tilt relative to wind axis, rad
2

Rotor coning angle, rad Lateral and longitudinal rotor disk tilt angle, respectively, rad Lateral and longitudinal cyclic trim input, respectively, rad Collective blade pitch at 75% radius, rad Helicopter flight path angle relative to the longitudinal axis Tail rotor collective control setting Advance ratio, VYm Rotor solidity ratio, ivbc,&rl? Lateral shaft tilt, rad Air density, slug@
Rotor rotational speed, rad/sec
3. FORMULATION
3.1 Equivalency of CQ and Cp
Let Q and P be the torque and power required for a helicopter to sustain the level forward
flight, respectively. Then, based on the fundamental physics, we have the following relationship between P and Q:
P=Qi2 (1)
By expressing Q and P in terms of its coefficients and other helicopter parameters,
Q = C,pAR(QR)’ P = cpp&2R)3
(2)
Substituting Equation (2) into Equation (l), we can obtain the following equivalency of CQ and cp:
cQ= cp (3)
Therefore, we can calculate the power coefficients instead of the torque coefficients for the HELPE code input.
In the next section, formulations and procedure to calculate the helicopter power
coefficient, Cp, are presented.
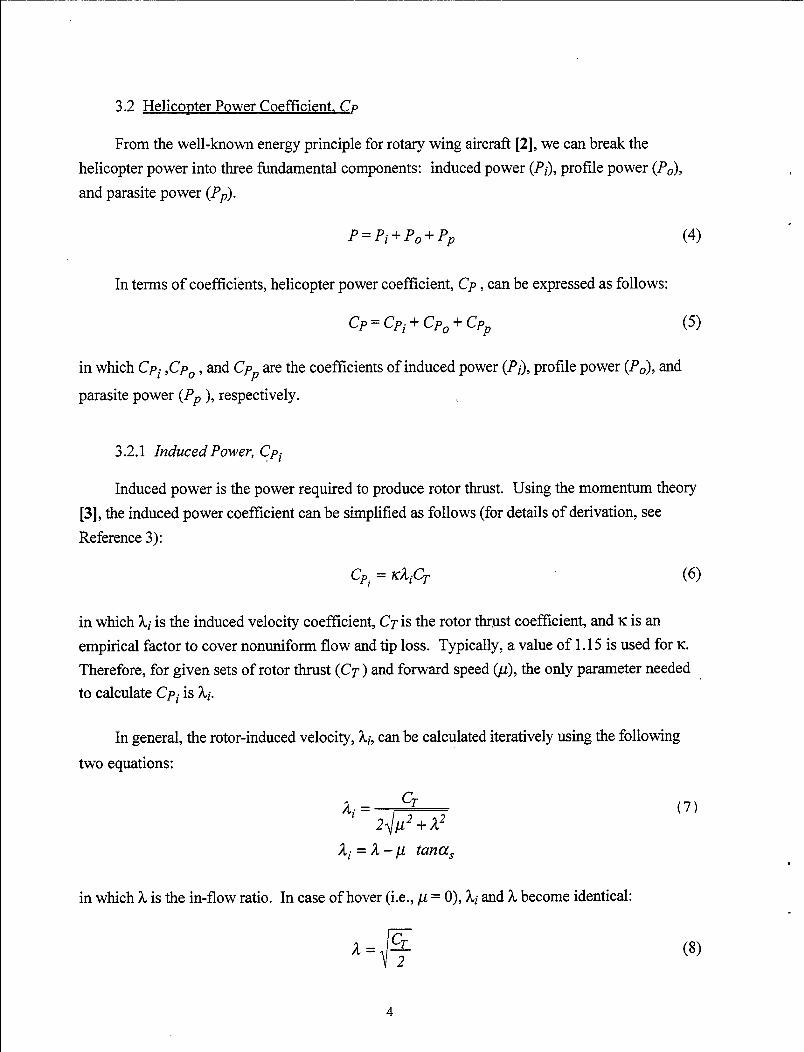
3.2 Helicoater Power Coefficient, Cp
From the well-known energy principle for rotary helicopter power into three fundamental components:
and parasite power (PJ.
wing aircraft [2 1, we can break the induced power (Pi), profile power (PO),
(4)
In terms of coeffkients, helicopter power coefficient, Cp , can be expressed as follows:
Cp = Cpi + Cpo + Cp~ (5)
in which Cpi ,CpO , and Cpp are the coefficients of induced power (Pi), profile power (PO), and
parasite power (Pp ), respectively. I
3.2.1 Induced Power, Cpi
Induced power is the power required to produce rotor thrust. Using the momentum theory
[3], the induced power coefficient can be simplified as follows (for details of derivation, see Reference 3):
Cpi = KAiCT (6)
in which hi is the induced velocity coefficient, CT is the rotor thrust coefficient, and K is an empirical factor to cover nonuniform flow and tip loss. Typically, a value of 1.15 is used for K.
Therefore, for given sets of rotor thrust (CT) and forward speed (JL), the only parameter needed t0 calculate Cpi is hi.
In general, the rotor-induced velocity, hi, can be calculated iteratively using the following
two equations:
&. = CT 24.7z
ili = A-/L tancx,
in which h is the in-flow ratio. In case of hover (i.e., /J = 0), hi and h become identical:
4

Therefore, the calculation of hi requires another parameter, the longitudinal tilt of the rotor shaft, a,. This involves solutions of nonlinear systems of equations considering the vehicle equilibrium
condition. The formulation and solution of the vehicle equilibrium equations are discussed in a
later section.
3.2.2 Projle Power, CpO
Profile power is a power required to turn the rotor in air (i.e., viscous drag). Typically, the
calculation of profile power requires a knowledge of the blade section profile drag coefficient, preferably including its dependence on angle of attack (a) and Mach number (A4). Often, it is
difficult to obtain a complete and reliable set of even static, two-dimensional airfoil data.
Alternatively, the rotor analysis can use a mean profile drag coefficient (Cd,) to represent
the overall effects of the blade drag on the rotor.[4] The use of a mean drag coefficient is
sufficiently accurate for some purposes, such as preliminary design, or when detailed aerodynamic characteristics for the blade section are not available.
One of the major setbacks using the mean drag coefficient is that rotor analysis using the mean drag coefficient often fails to capture stall and compressibility effects in forward flight. Additional corrections or a more detailed analysis thus are required for rotors at extreme operating conditions.
In the present calculation, an improved approach to calculate a mean profile drag coefficient using a drag polar of the form [5] is adopted to calculate the profile power, along with the use of Prandtl-Glauert’s compressibility correction.
In Reference 5, an estimation of Cd0 is given when the blade drag coefficient is known in the
form of c, = 6, + &a+ 6$X2:
in which CL is the mean disk loading:
Then, the coefficient of profile power is calculated as follows:

C&2 = $q1+4.6p2) (11)
3.2.3 Parasite Power, Cpp
Parasite power is a power required to overcome the drag of the helicopter. The estimation
of helicopter parasite power is an important aspect of performance calculation because it
establishes the propulsive force and power requirement at high speed. The power required to overcome the parasite drag of helicopter (D), can be expressed as
Pp=DV (12)
in which V is the speed of helicopter.
By rewriting Pp in terms of its coefficients and other helicopter parameters, similar to Equation (2), we have
CPp = DV
PA&W3 (13)
Further, the drag force acting on a helicopter can be expressed as
D I = ,pV2f (14)
in which f is the parasite drag area of helicopter including rotor hub. Except for compressibility or Reynolds number effects, f is generally independent of speed.
By substituting Equation (14) into Equation (13), we obtain the following equation for the parasite power coefficient:
cpP I v3 f lf3 =- - -_=_- 2(~4~ A 2A’
(15)
in which f/A is the equivalent flat plate area correlated with rotor area (A). It is found that f/A can be as high as 0.025 for old helicopters, about 0.01 to 0.015 for helicopters in current production, and 0.004 to 0.008 for a clean helicopter design.
In this section, it was shown that power coefficient, Cp, can be calculated from Equations
(6), (1 l), and (15). H owever, as mentioned earlier, the solution of Equation (6) requires a
6

knowledge of rotor shaft tilt angle, a,, for a given set of thrust coefficient and forward speed, and
thus a vehicle trim solution. In the next section, a formulation and solution procedure for vehicle trim is presented.
3.3 Vehicle Trim Solution
Propulsive trim, which simulates an aircraft free flight condition, is used to calculate the initial rotor control settings as well as the vehicle orientation (i.e., a, and $J. The solution is
determined from the overall equilibrium equations: three force (vertical 2, longitudinal X, and
lateral Y) and three moment (pitch, roll, and yaw) equations. These are
Fl = FgO + DFcosaHp - Tsina, = 0
F2 = Fr”, + YFcos$, - Yt,. + Tsin$, = 0
F3=Fz”, - Tcosa,cosqb, - DFcos$,sinaHp + Y,sinq$ = 0 (16)
F4 = MC0 + MxF + T( hcosa,sin@, - ~&OS@,) + YF (ECosa&os@, + Y&in@,) = 0
F, = Mr”, + My, +T(hsina,- x,,~o~Cr,)+D~(-hCosaHp +X,@aHP)=o
F6=M~+Mz/XtYtr=0
in which Fl, FJ, and FJ are, respectively, the force equilibrium equations in the X, Y, and 2 directions, and F.q, F5, and F6 are the rolling, pitching, and yawing moment equilibrium equations,
respectively. Also, DF is the fuselage drag; YF is the fuselage side force; Yty is the tail rotor thrust; T is the main rotor thrust; xcg and ycg and K are, respectively, the relative location of the
rotor hub center with respect to the vehicle CG in the X, Y, and 2 directions; X, is the nondimensional length (divided by rotor radius) between the main rotor hub and the tail rotor hub; and a, and & are the longitudinal and lateral shaft tilts, respectively. Furthermore,
% = aHP -eFP (17)
in which aHp is the hub plane tilt relative to the flight direction, and &p is the flight path angle
relative to the longitudinal axis.
3 For a specified thrust coefficient CT and a forward speed @), the unknown quantities to be
determined from the vehicle equilibrium equations are
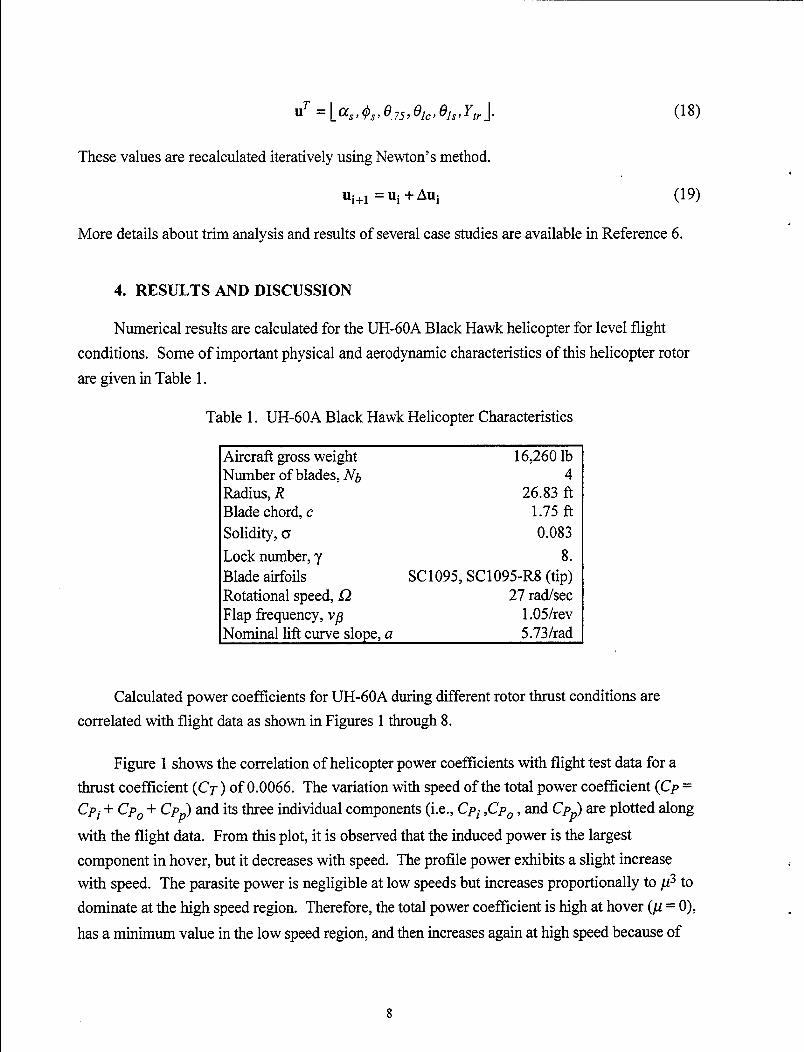
UT = l~~,~~~e,,e,,,e,,:r,J. (18)
These values are recalculated iteratively using Newton’s method.
ui+l = Ui + AU1 (19)
More details about trim analysis and results of several case studies are available in Reference 6.
4. RESULTS AND DISCUSSION
Numerical results are calculated for the UH-6OA Black Hawk helicopter for level flight
conditions. Some of important physical and aerodynamic characteristics of this helicopter rotor
are given in Table 1.
Table 1. UH-6OA Black Hawk Helicopter Characteristics
Aircraft gross weight 16,260 lb Number of blades,Nb Radius, R Blade chord, c Solidity, (7 Lock number, y Blade airfoils Rotational speed, R Flap frequency, vg
4 26.83 ft
1.75 fi 0.083
8. SC1095, SC1095-R8 (tip)
27 rad/sec 1.05lrev
Nominallift curve slope, a 5.73frad
Calculated power coefficients for UH-60A during different rotor thrust conditions are
correlated with flight data as shown in Figures 1 through 8.
Figure 1 shows the correlation of helicopter power coefficients with flight test data for a thrust coefficient (CT) of 0.0066. The variation with speed of the total power coefficient (Cp = Cpi + Cpo + Cp& and its three individual components (i.e., Cpi ,Cpo , and Cpp) are plotted along
with the flight data. From this plot, it is observed that the induced power is the largest
component in hover, but it decreases with speed. The profile power exhibits a slight increase with speed. The parasite power is negligible at low speeds but increases proportionally to ~3 to
dominate at the high speed region. Therefore, the total power coefficient is high at hover (/J = 0),
has a minimum value in the low speed region, and then increases again at high speed because of
8

the parasite power. This trend is quite agreeable with References 2 through 4. The results obtained from the present analysis agree very well with flight test, as shown in Figure 1.
UH-GOA HELICOPTER POWER COEFFICIENT VS. FORWARD SPEED, CT= 0.0066
Tokl Power _l. Induced Power ----.
Profile Power .----’ Parasite Power -..-“-.
80 Flight Test Data o
0.15 0.2 Advance Ratio
Figure 1. Variations of Heliconter Power Coefficient (CP) Versus Forward Speed (CT = 0.0066).
Figures 2 and 6 show the similar correlations but with different rotor thrust settings. Figure 7 shows the correlation of power coefficient at very high thrust condition (CT = 0.0102). In low speed regions, the analytical results correlate well with flight data. However, the present model under-predicts the power coefficients at the high speed region (high speed/high thrust). This is
most likely because of the shock-boundary layer interactions, which are not accurately modeled in the present study. In the future, the use of full Navier-Stokes computational fluid dynamics
(CFD) code, along with the wind tunnel experiment, may improve predictions of rotor and fuselage drag.
The effects of disk loading on the helicopter power required are shown in Figure 8. As expected, the power required increases as the rotor thrust increases. This is mainly attributable
to high in-flow velocity associated with high disk loading at low speeds and because of compressibility/stall effects at high speed.
UH-GOA HELICOPTER POWER COEFFICIENT VS. FORWARD SPEED, CT- 0.0072 loo
90
80
70
60
50
40
30
20
10
0
Power Coeflicient - Flight Test Data o
I I 0 I 1 I I
0 0.05 0.1 0.15 0.2 Advance Ratio
0.25 0.3 0.35
Figure 2. Variations of Helicopter Power Coefficient (CP) Versus Forward SDeed (CT = 0.0072).
100 UH-GOA HELICOPTER POWER COEFFICIENT VS. FORWARD SPEED, CT;. 0.0078
1 I I 1 I I I Power Coefficient -
90 - Flight Test Data Q
80 I
0 0.05 0.1 0.15 Advance R:;:
0.25 0.3 0.35
Figure 3. Variations of HelicoPter Power Coefficient (CP) Versus Forward Speed (CT = 0.0078).
10

.
UH-GOA HELICOPTER POWER COEFFICIENT VS. FORWARD SPEED, CT= 0.0064 100 I I I I , I I
Power Coefficient - 90 Flight Test Data Q -
* 0
60 -
30 -
20 -
10 -
0 I I I I I , I 0 0.05 0.1 0.15 0.2 025 0.3 0.35
Advance Ratio
Figure 4. Variations of HelicoDter Power Coefficient ((7~) Versus Forward Speed (CT,Z&Q@&L
UH-GOA HELICOPTER POWER COEFFICIENT VS. FORWARD SPEED, CT= 0.009
Power Coefficient - Flight Test Data Q
0 I
0.05 I
0.1 I I I I I
0.15 Advance
R% 0.25 0.3 0.3
Figure 5. Variations of HelicoDter Power Coefficient (CA Versus Forward Speed (CT = 0.0090).
11

140 UH-GOA HELICOPTER POWER COEFFICIENT VS. FORWARD SPEED, CT= 0.0096
130
120
110
100
90
:: 80 8 s 70 x 0” 60
50
40
0.15 0.2 Advance Ratio
Figure 6. Variations of Helicopter Power Coefficient (CP) Versus Forward SPeed (CT = 0.0096).
UH-GOA HELICOPTER POWER COEFFICIENT VS. FORWARD SPEED, CT- 0.0102 I I I I I I I I I
Power Coefficient - Flight Test Data Q
150
140
130
120
110
100
90
80
70
60
50
n
0.05 0.1 0.15 0.2 Advance Ratio
0.25 0.3 0.35
Figure 7. Variations of Helicopter Power Coefficient (CP) Versus Forward Speed (CT = 0.01021.
12

UH-GOA HELICOPTER POWER COEFFICIENT VS. FORWARD SPEED
0.15 0.2 Advance Ratio
Figure 8. The Effects of Disk Loading: on Heliconter Power Coefficient (Cp).
Overall, numerical results obtained from the present analysis agree reasonably well
available flight test data. [1]
with
Presently, another activity is under way to further validate the present model with a different
helicopter, an AH-64D Longbow Apache attack helicopter. Initial results from the AH-64D study also show good correlation with flight data, providing the author with a certain confidence in the helicopter aerodynamic model developed in the present study.
5. SUMMARY
A computer program calculating helicopter power coefficients and thrust coefficients as a function of a vehicle’s forward speed is developed in support of the helicopter performance assessment project. The model is based on the energy principle, in which helicopter power is
broken into three components: induced power, profile power, and parasite power. For induced power calculation, rotor shaft tilt angle obtained from the vehicle trim solution is used. Numerical results are calculated for the UH-60A Black Hawk helicopter for hover and different forward speed
settings and correlated reasonably with existing flight test data.
13

Based on results obtained in this study and further correlation study, the present computer model can be used to estimate sufficiently accurate power coefficients for a generic helicopter.
5.1 Recommendation for Future Studv
In the present study, an attempt was made to include stall and compressibility effects in
the helicopter power calculation by using the polar form of blade drag coefficient along with
Prandtl-Glauert’s compressibility correction. Based on results obtained, however, additional corrections or a more detailed analysis is required for rotors at extreme operating conditions (i.e.,
high speed/high disk loading). A future study investigating these phenomena would be of great
interest.
The computer code can be used to generate the trim parameters, a,, 0. 75, Olc, Ols, required
as level flight conditions for other ARL vulnerability analyses.
14

REFERENCES
[l] Kiwan, A. R. “Helicopter Performance Evaluation (HELPE) Computer Model.” Army Research Laboratory Technical Report, ARL-TR-489, Aberdeen Proving Ground, MD, July 1994.
[2] Gessow, A. and Myers, G. C. Jr. Aerodvnamic of the Heliconters. 8th Edition: College Park Press, 1983.
[3] Johnson, W. “A Comprehensive Analytical Model of Rotorcraft Aerodynamic and Dynamics.” NASA Technical Memorandum (TM) No. 8 1182, NASA Ames, CA, June 1980.
[4] Chopra, I. “Helicopter Dynamics and Aeroelasticity.” Technical Notes, Center for Rotorcraft Education and Research, Aerospace Engineering Department, University of Maryland, College Park, MD, January 199 1.
[5] McCormick, B.W. Aerodvnamics of V/STOL Flight. Academic Press, 1967.
[6] Kim, K.C. “Helicopter Trim Calculation in Forward Flight.” Proceedings of the 1993 Summer Computer Simulation Conference, pp. 374-379, ISBN: l-56555-057-9, Boston, MA, July 1993.
E
‘
15
INTENTIONALLY LEFT BLANK
e
16

NO. OF COPIES
2
1
1
1
1
1
1
1
1
ORGANIZATION
ADMINISTRATOR DEFENSE TECHNICAL INFO CENTER ATTN DTIC OCP 8725 JOHN J KINGMAN RD STE 0944 FT BELVOIR VA 22060-62 18
DIRECTOR US ARMY RESEARCH LABORATORY ATTN AMSRL CS AL TA REC MGMT 2800 POWDER MILL RD ADELPHI MD 20783-I 197
DIRECTOR US ARMY RESEARCH LABORATORY ATTN AMSRL CI LL TECH LIB 2800 POWDER MILL RD ADELPHI MD 207830-l 197
DIRECTOR US ARMY RESEARCH LABORATORY ATTN AMSRL DD J J ROCCHIO 2800 POWDER MILL RD ADELPHI MD 20783-l 197
OUSD AT TWP ATTN GEORGE SCHNEITER RM 3E130 THE PENTAGON WASHINGTON DC 203 10-3 100
UNDER SEC OF THE ARMY DUSA OR1 RM 2E660 102 ARMY PENTAGON WASHINGTON DC 203 10-O 102
DEPUTY CHIEF OF STAFF OPERATIONS AND PLANS DAM0 SW RM 3C6301 400 ARMY PENTAGON WASHINGTON DC 203 10-0400
US ARMY TRADOC ANL CTR ATTN ATRC W WHITE SANDS MISSILE RANGE NM
88002-5502
US ARMY TRNG & DOCTRINE CMD ATT-N ATCD B FT MONROE VA 23561
NO. OF COPIES
2
1
1
1
1
2
24
1 DIRECTOR
ORGANIZATION
ABERDEEN PROVING GROUND
DIRECTOR US ARMY RESEARCH LABORATORY ATT-N AMSRL CI LP (TECH LIB) BLDG 305 APG AA
US ARMY TECOM ATTN AMSTE TA RYAN BLDG
US ARMY AMSAA ATTN AMXSY D APG MD 21005-5071
US ARMY AMSAA ATTN AMXSY ST APG MD 21005-5071
DIRECTOR US ARMY RESEARCH LABORATORY ATTN AMSRL SL DR WADE BLDG 328 APG MD 21005-5068
DIRECTOR US ARMY RESEARCH LABORATORY ATTN AMSRL SL B MS W WINNER
MS JILL SMITH BLDG 328 APG MD 21005-5068
DIRECTOR US ARMY RESEARCH LABORATORY AMSRL SL BD J A MORFUSSEY
S POLYAK J FRIES D LINDELL K KIM (20 CYS)
BLDG 1068 APG MD 21005-5068
US ARMY RESEARCH LABORATORY ATTN AMSRL SL BE D BELY BLDG 328 APG MD 21005-5068
17

NO. OF ORGANIZATION COPIES
1 DIRECTOR US ARMY RESEARCH LABORATORY ATTN AMSRL SL E DR STARKS BLDG 328 APG MD 21005-5068
ABSTRACT ONLY
1 DIRECTOR US ARMY RESEARCH LABORATORY ATTN AMSRL CS AL TP TECH PUB BR 2800 POWDER MILL RD ADELPHI MD 20783-l 197
18
1
‘
E
7
F
1 I
REPORT DOCUMENTATION PAGE Form Approved OMB No. 0704-0188
I. AGENCY USE ONLY (Leave blank)
I. TITLE AND SUBTITLE
2. REPORT DATE
June 1999 3. REPORT TYPE AND DATES COVERED
Final 5. FUNDING NUMBERS
Analytical Calculations of Helicopter Torque Coefficient (CQ) and Thrust Coefficient (CT) Values for the Helicopter Performance (HELPE) Model Project No. lLl62618AHSO
i. AUTHOR(S) I Kim, K.C. (ARL)
‘. PERFORMING ORGANIZATION NAME(S) AND ADDRESS 8. PERFORMING ORGANIZATION REPORT NUMBER
U.S. Army Research Laboratory Survivability/Lethality Analysis Directorate Aberdeen Proving Ground, MD 21010-5068
1. SPONSORING/MONITORING AGENCY NAME(S) AND ADDRESS
U.S. Army Research Laboratory Survivability/Lethality Analysis Directorate Aberdeen Proving Ground. MD 21010-5068
10. SPONSORING/MONITORING AGENCY REPORT NUMBER
ARL-TR-1986
1. SUPPLEMENTARY NOTES
2a. DISTRIBUTION/AVAILABILITY STATEMENT
Approved for public release; distribution is unlimited.
12b. DISTRIBUTION CODE
3. ABSTRACT (Maximum 200 words)
A computer program for calculating helicopter torque coefficients (CQ) and thrust coefficients (CT) as a function of a vehicle’s forward speed has been developed in conjunction with the helicopter performance assessment project. The model is based on the energy principle, in which helicopter power is broken into three components: induced power, profile power, and parasite power. This report documents the basic mathematical model used in the code, along with the numerical solution scheme used in implementing the model. Results are calculated for the UT-J-60A Black Hawk helicopter for hover and different forward speed settings and correlated with existing flight test data. The effects of different disk loading on helicopter power requirements are also investigated. The present model agrees reasonably well with the flight test data, providing the author with a certain confidence in the helicopter aerodynamic model developed in the present study.
4. SUBJECT TERMS 115. NUMBER OF PAGES
helicopter performance rotor aerodynamics
trim stall
7. SECURITY CLASSIFICATION 18. SECURITY CLASSIFICATION 19. SECURITY CLASSIFICATION 20. LIMITATION OF ABSTRACT OF REPORT OFTHIS PAGE OF ABSTRACT
1
Unclassified NSN 7540-01-280-5500
I Unclassified 1 Unclassified I Standard Form 298 (Rev. 2-89)
19 Prescribed by ANSI Std. 239-18 29E102