analytical assessment of an irregular … · analytical assessment of an irregular rc frame for...
TRANSCRIPT

See discussions, stats, and author profiles for this publication at: https://www.researchgate.net/publication/254303769
Analytical assessment of an irregular RC frame for full-scale 3D pseudo-
dynamic testing Part I: Analytical model verification
Article in Journal of Earthquake Engineering · January 2005
DOI: 10.1080/13632460509350535
CITATIONS
69
2 authors:
Some of the authors of this publication are also working on these related projects:
New Madrid Seismic Zone Catastrophic Earthquake Planning View project
Croatian Science Foundation project IP-06-2016-5325: Seismic base isolation of a building by using natural materials - shake table testing
and numerical modeling View project
Seong-Hoon Jeong
Inha University
36 PUBLICATIONS 365 CITATIONS
SEE PROFILE
Amr S. Elnashai
University of Houston
302 PUBLICATIONS 6,246 CITATIONS
SEE PROFILE
All content following this page was uploaded by Seong-Hoon Jeong on 14 March 2017.
The user has requested enhancement of the downloaded file.

November 30, 2004 2:30 WSPC/124-JEE 00190
Journal of Earthquake Engineering, Vol. 9, No. 1 (2005) 95–128c© Imperial College Press
ANALYTICAL ASSESSMENT OF AN IRREGULAR RCFRAME FOR FULL-SCALE 3D PSEUDO-DYNAMIC TESTING
PART I: ANALYTICAL MODEL VERIFICATION
SEONG-HOON JEONG∗
Research Assistant, Civil Engineering DepartmentResearch Assistant, Mid-America Earthquake CenterUniversity of Illinois at Urbana-Champaign, USA
AMR S. ELNASHAI†
Willett Professor, Civil Engineering DepartmentDirector, Mid-America Earthquake Center
University of Illinois at Urbana-Champaign, USA
Received 11 May 2004Revised 7 September 2004Accepted 7 September 2004
In this paper, a detailed description of the analytical modelling of a full-scale irregularRC test structure intended for Pseudo-dynamic (PsD) testing is presented. Extensivepre-test assessment was performed to investigate the capacity and dynamic character-istics of the test structure. The use and applicability of static and dynamic analysismethods are discussed. A systematic approach to determine an earthquake scenario forthe highly irregular test model was developed which satisfies three criteria: (i) collapseprevention, (ii) severe damage level for the acquisition of data on structural damage and(iii) maximum torsional response. Four pre-test models with different assumptions werecompared in addition to the comparison of analytical and experimental results.
Keywords: Pre-test analysis; Irregular RC frame; Experimental testing; Earthquakescenario.
1. Introduction
The advancement of seismic assessment of structures depends on three main ingre-dients, namely well-controlled testing techniques, accurate analytical simulationsand the existence of measured data for verification. Recent advancements in testingand analysis are well-documented, and the literature abounds with simulationapproaches, both physical and computational. However, real data from the seismicperformance of structures of the required characteristics and at the sought after
∗1240 Newmark Laboratory, 205 N. Mathews Ave., Urbana, Illinois 61801, USA; e-mail:[email protected].†2129e Newmark Laboratory, 205 N. Mathews Ave., Urbana, Illinois 61801, USA; e-mail:[email protected].
95
November 30, 2004 2:30 WSPC/124-JEE 00190
96 S.-H. Jeong & A. S. Elnashai
limit states is severely lacking. This is a consequence of the limited number of fullscale tests conducted around the world. The number of tests of this type is aroundten for the wide class of reinforced concrete structures [Rossetto and Elnashai, 2003].With regard to data collected after earthquakes, the quality of observations is sub-jected to the following considerations:
(1) The number of structures with light damage is significantly larger than thenumber of cases of partial and total collapse. Therefore, the statistical viabilityof the latter is at best questionable.
(2) It is unlikely that the building stock subjected to earthquake motion is thatwhich is being investigated by researchers; i.e. work on dual frame-wall struc-tures require data on seismic response of the same system, preferably designedto the same criteria.
(3) Design and construction practices are regional, hence damage data from oneregion may not be transferable due to ‘supply incompatibilities’.
(4) Ground motion characteristics are also regional thus limiting the transferabilityof damage data due to ‘demand incompatibility’.
The above discussion lends weight to allocating resources to full scale testing aspossibly the most promising and controlled means of obtaining structural perfor-mance data under earthquake loading for the verification of structural systems, thefurther development of testing procedures and the calibration of analytical models.In this context, a full scale test of a three storey two-by-two bay irregular rein-forced concrete structure was carried out at the European Laboratory for Struc-tural Assessment (ELSA) of the Joint Research Centre (JRC) in Ispra, Italy, underthe auspices of the European Union (EU) project Seismic Performance Assessmentand Rehabilitation (SPEAR). Details of the experiment are given in Negro et al.[2004].
As part of the aforementioned project, this paper presents detailed seismicassessment of the building and pre-test analysis. For a large-scale test of a complexstructure, it is essential to perform extensive and dedicated numerical simulationswith a fully detailed analytical model. This is to aid in refining the test details,defining the sequence of testing, selecting the most suitable input motion record,and determining the intensity that will cause the structure to reach the desiredlimit state. The contribution of the Mid-America Earthquake Center researcherswas confined to the following activities:
• Pre-test analysis• Decision on earthquake record, direction and intensity for the test• Refinement of the numerical model based on material test results• Analysis of the condition of the test structure after transportation damage• Mass calculation for the pseudo-dynamic test• Verification of force and displacement demands imposed on test instrumentation• Post-test analysis and comparison with simulation models.
November 30, 2004 2:30 WSPC/124-JEE 00190
Analytical Assessment of an Irregular RC Frame for Full-Scale 3D PsD Testing — Part I 97
Below, full structure-, storey- and member-level seismic assessments of the testmodel are described, and comparison of pre-test analytical models are presented.This paper is the first of two companion publications, the second paper [Jeong andElnashai, 2005] deals with pre-test condition assessment, selection of initial loadingconditions and determination of the demand imposed on test equipment.
2. Analytical Modelling
2.1. Test structure
The test building has been designed to gravity loads alone, using the concretedesign code applied in Greece between 1954 and 1995. It was built with the con-struction practice and materials used in Greece in the early 1970s. The structuralconfiguration is also typical of non-earthquake-resistant construction of that period.Smooth bars were utilised for the reinforcement. Members are provided with mini-mal amount of stirrups to withstand low levels of shear forces and the core concreteis virtually not confined. Columns are slender and more flexible than beams, andbeam-column connections were built without stirrups.
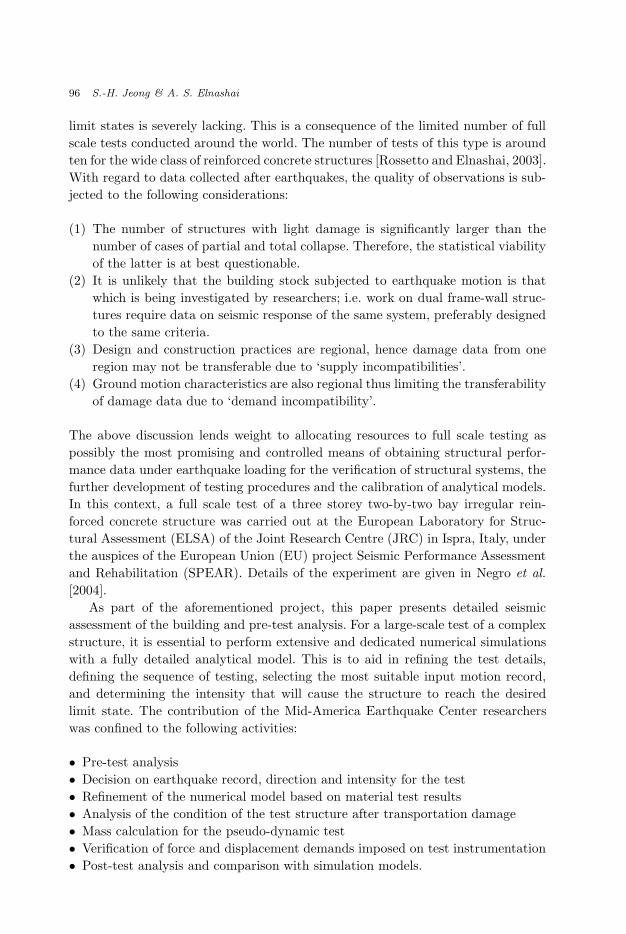
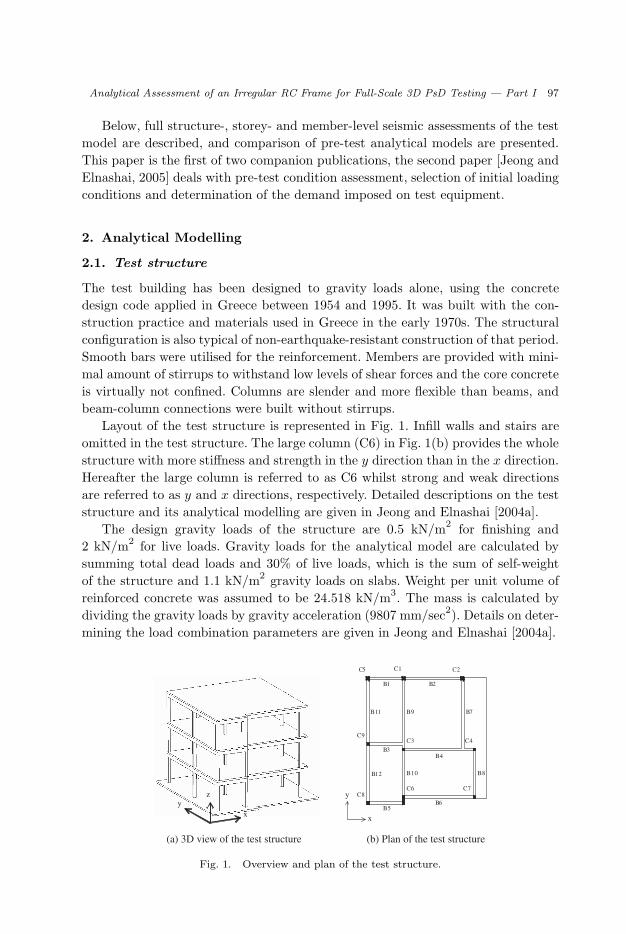
Layout of the test structure is represented in Fig. 1. Infill walls and stairs areomitted in the test structure. The large column (C6) in Fig. 1(b) provides the wholestructure with more stiffness and strength in the y direction than in the x direction.Hereafter the large column is referred to as C6 whilst strong and weak directionsare referred to as y and x directions, respectively. Detailed descriptions on the teststructure and its analytical modelling are given in Jeong and Elnashai [2004a].
The design gravity loads of the structure are 0.5 kN/m2 for finishing and2 kN/m2 for live loads. Gravity loads for the analytical model are calculated bysumming total dead loads and 30% of live loads, which is the sum of self-weightof the structure and 1.1 kN/m2 gravity loads on slabs. Weight per unit volume ofreinforced concrete was assumed to be 24.518 kN/m3. The mass is calculated bydividing the gravity loads by gravity acceleration (9807 mm/sec2). Details on deter-mining the load combination parameters are given in Jeong and Elnashai [2004a].
x
zy
y
x
B12
B1 B2
B3B4
B5B6
B10 B8
B9 B7B11
C1 C2C5
C3 C4C9
C6 C7C8
(a) 3D view of the test structure (b) Plan of the test structure
Fig. 1. Overview and plan of the test structure.

November 30, 2004 2:30 WSPC/124-JEE 00190
98 S.-H. Jeong & A. S. Elnashai
2.2. Analysis program
The finite element analysis program ZEUS-NL [Elnashai et al., 2002] was utilised toperform necessary analyses for the assessment of the test model such as nonlinearstatic pushover analysis, eigenvalue analysis and nonlinear dynamic response his-tory analysis. This program was originally developed at Imperial College, London,UK [Izzuddin and Elnashai, 1989], and has been thoroughly tested and validatedover the past 15 years on members and structure levels. The program is capable ofrepresenting spread of inelasticity within the member cross-section and along themember length utilising the fibre analysis approach. ZEUS-NL can be used to pre-dict the behaviour of frames under static or dynamic loading, taking into accountboth geometric and material nonlinear behaviour. Accurate concrete and steel mate-rial models are available, together with a large library of three-dimensional elementsthat can be used with a wide choice of steel, concrete and composite section con-figurations. The applied loading can be constant or variable forces, displacementsand accelerations.
2.3. Modelling considerations
In the analytical model, slabs are omitted and their contribution to beam stiffnessand strength is reflected by effective width of the T-section of beams. The effectiveflange width is assumed to be the beam width plus 7% of the clear span of thebeam on either side of the web [Fardis, 1994]. This provides values between theconservative flange width from EC8, which is intended for design purposes, andthe width recommended for gravity load design [Mwafy, 2001].
For the first iteration of the pre-test model, rigid elements are placed at beam-column connections as shown in Fig. 2(a). This connection modelling prevents plas-tic hinges from developing inside the connections, i.e. between the face and thecentre line of the columns. Since the columns of the test model are weaker than thebeams, plastic hinges may form at the ends of a column earlier than at the endsof adjacent beams. Therefore, the same concept is applied to the ends of columns.
Rigid links
Column
Beam
B5B5
B6
C6
B6
C6
Structure Analytical model
(a) Rigid offsets (elevation) (b) Rigid arms for modelling the connection at C6 (plan)
Fig. 2. Rigid arms at the beam-column connections.
November 30, 2004 2:30 WSPC/124-JEE 00190
Analytical Assessment of an Irregular RC Frame for Full-Scale 3D PsD Testing — Part I 99
The plan of the test structure in Fig. 1(b) shows that beams adjacent to C6 are notin alignment, thus gaps between centre lines of beams (B5 and B6) and the column(C6) should be considered in the modelling of the beam-column connection at C6.As shown in Fig. 2(b), rigid elements are utilised to connect centre lines of beamsand the column in order to model the force transfer between members and torsioncaused by gaps between centre lines of members.
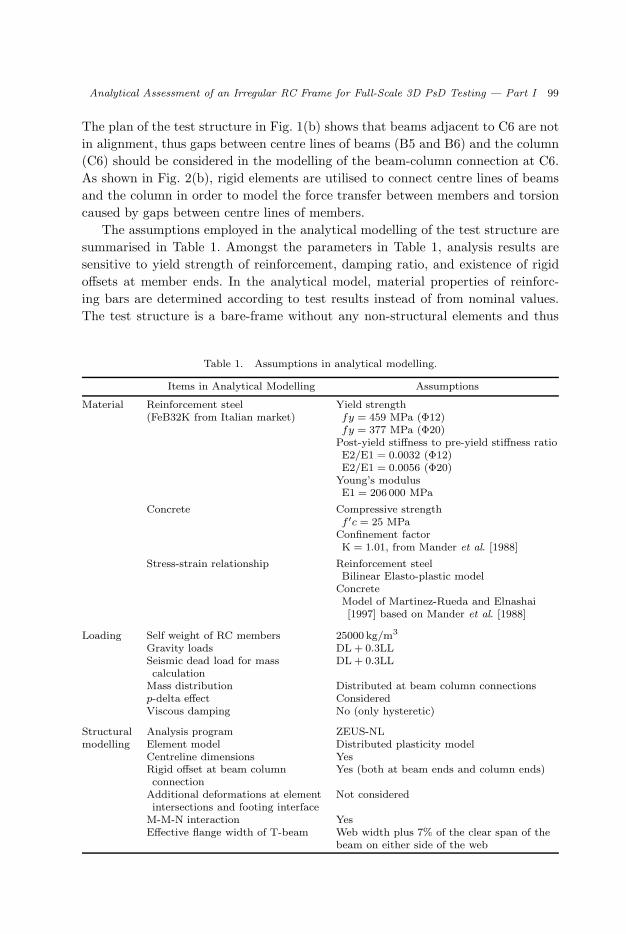
The assumptions employed in the analytical modelling of the test structure aresummarised in Table 1. Amongst the parameters in Table 1, analysis results aresensitive to yield strength of reinforcement, damping ratio, and existence of rigidoffsets at member ends. In the analytical model, material properties of reinforc-ing bars are determined according to test results instead of from nominal values.The test structure is a bare-frame without any non-structural elements and thus
Table 1. Assumptions in analytical modelling.
Items in Analytical Modelling Assumptions
Material Reinforcement steel Yield strength(FeB32K from Italian market) fy = 459 MPa (Φ12)
fy = 377 MPa (Φ20)Post-yield stiffness to pre-yield stiffness ratioE2/E1 = 0.0032 (Φ12)E2/E1 = 0.0056 (Φ20)
Young’s modulusE1 = 206 000 MPa
Concrete Compressive strengthf ′c = 25 MPa
Confinement factorK = 1.01, from Mander et al. [1988]
Stress-strain relationship Reinforcement steelBilinear Elasto-plastic model
ConcreteModel of Martinez-Rueda and Elnashai[1997] based on Mander et al. [1988]
Loading Self weight of RC members 25000 kg/m3
Gravity loads DL + 0.3LLSeismic dead load for masscalculation
DL + 0.3LL
Mass distribution Distributed at beam column connectionsp-delta effect ConsideredViscous damping No (only hysteretic)
Structural Analysis program ZEUS-NLmodelling Element model Distributed plasticity model
Centreline dimensions YesRigid offset at beam columnconnection
Yes (both at beam ends and column ends)
Additional deformations at element Not consideredintersections and footing interface
M-M-N interaction YesEffective flange width of T-beam Web width plus 7% of the clear span of the
beam on either side of the web
November 30, 2004 2:30 WSPC/124-JEE 00190
100 S.-H. Jeong & A. S. Elnashai
has virtually no source of energy dissipation except hysteretic damping. Therefore,viscous damping is not included in the analytical model whilst hysteretic dampingis considered by nonlinear material modelling. Rigid elements are used at mem-ber ends in order to prevent plastic hinges from forming inside the beam-columnconnections.
2.4. Aspects of non-ductile responses
Investigation of the seismic performance of gravity-load-designed reinforced con-crete (RC) buildings has been undertaken by several researchers. Bracci et al.[1992b], Kunnath et al. [1995], El-Attar et al. [1997] and Lee and Woo [2002]reported experimental results from shaking table tests on small-scale RC buildingsincluding comparison with analytical studies. Specifically, structural deficienciesand resulting member actions of a gravity-load-designed building with non-seismicdetailing provisions are presented in Bracci et al. [1992a].
For a comprehensive representation of the local seismic response of gravity-load-designed RC frames, non-ductile failure modes should be considered in theanalytical model. Discussion of shear and axial-flexural failure of members is givenin the following subsections and details on shear deformation at beam-column jointsis described with the refinement of the pre-test model in Sec. 5.3. Bond-slip ofreinforcing bars at beam-column connections is not analytically modeled but itseffect is accounted for by allowing extra flexibility at column ends (removal of rigidlinks). The analytical model without rigid links accounts for the effect of rotationat column ends (fixed-end rotation) due to bond-slip on the overall behaviour, asdiscussed in Jeong and Elnashai [2005].
Investigation on shear failure of members
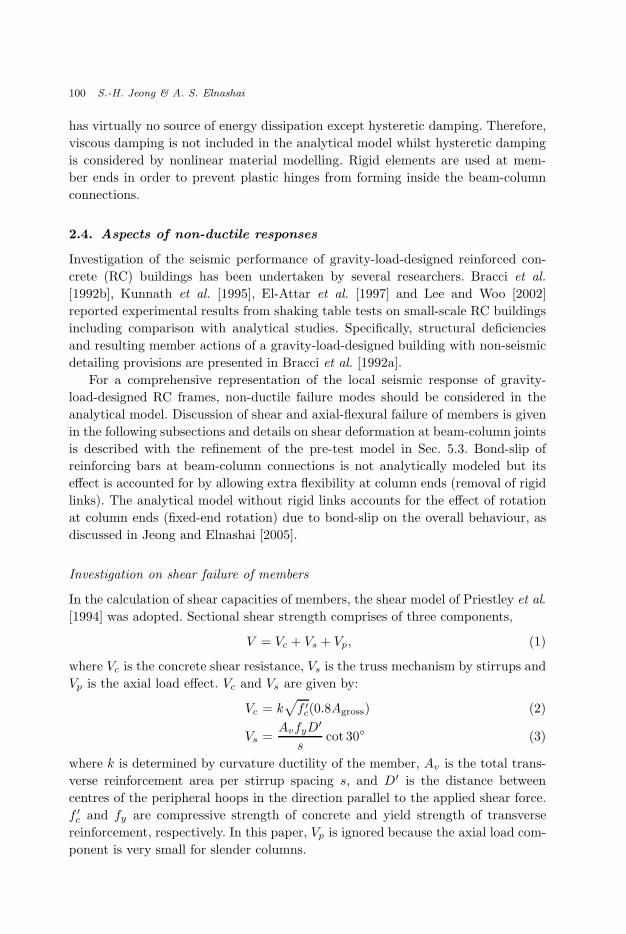
In the calculation of shear capacities of members, the shear model of Priestley et al.[1994] was adopted. Sectional shear strength comprises of three components,
V = Vc + Vs + Vp, (1)
where Vc is the concrete shear resistance, Vs is the truss mechanism by stirrups andVp is the axial load effect. Vc and Vs are given by:
Vc = k√
f ′c(0.8Agross) (2)
Vs =AvfyD
′
scot 30◦ (3)
where k is determined by curvature ductility of the member, Av is the total trans-verse reinforcement area per stirrup spacing s, and D′ is the distance betweencentres of the peripheral hoops in the direction parallel to the applied shear force.f ′
c and fy are compressive strength of concrete and yield strength of transversereinforcement, respectively. In this paper, Vp is ignored because the axial load com-ponent is very small for slender columns.
November 30, 2004 2:30 WSPC/124-JEE 00190
Analytical Assessment of an Irregular RC Frame for Full-Scale 3D PsD Testing — Part I 101
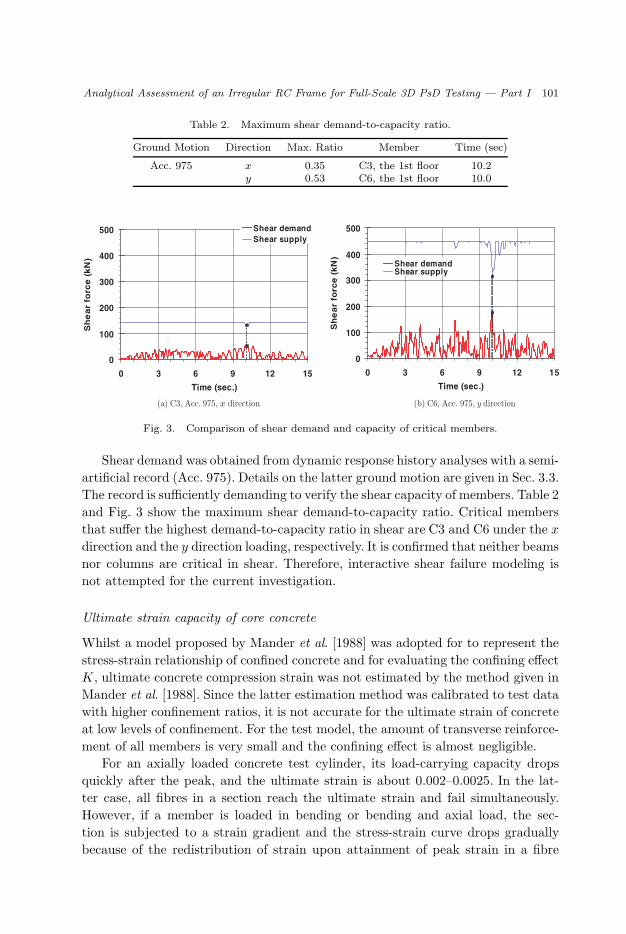
Table 2. Maximum shear demand-to-capacity ratio.
Ground Motion Direction Max. Ratio Member Time (sec)
Acc. 975 x 0.35 C3, the 1st floor 10.2y 0.53 C6, the 1st floor 10.0
0
100
200
300
400
500
0 3 6 9 12 15
Time (sec.)
Sh
ea
r fo
rce
(k
N)
Shear demandShear supply
0
100
200
300
400
500
0 3 6 9 12 15
Time (sec.)
Sh
ea
r fo
rce
(k
N)
Shear demandShear supply
Fig. 3. Comparison of shear demand and capacity of critical members.
Shear demand was obtained from dynamic response history analyses with a semi-artificial record (Acc. 975). Details on the latter ground motion are given in Sec. 3.3.The record is sufficiently demanding to verify the shear capacity of members. Table 2and Fig. 3 show the maximum shear demand-to-capacity ratio. Critical membersthat suffer the highest demand-to-capacity ratio in shear are C3 and C6 under the x
direction and the y direction loading, respectively. It is confirmed that neither beamsnor columns are critical in shear. Therefore, interactive shear failure modeling isnot attempted for the current investigation.
Ultimate strain capacity of core concrete
Whilst a model proposed by Mander et al. [1988] was adopted for to represent thestress-strain relationship of confined concrete and for evaluating the confining effectK, ultimate concrete compression strain was not estimated by the method given inMander et al. [1988]. Since the latter estimation method was calibrated to test datawith higher confinement ratios, it is not accurate for the ultimate strain of concreteat low levels of confinement. For the test model, the amount of transverse reinforce-ment of all members is very small and the confining effect is almost negligible.
For an axially loaded concrete test cylinder, its load-carrying capacity dropsquickly after the peak, and the ultimate strain is about 0.002–0.0025. In the lat-ter case, all fibres in a section reach the ultimate strain and fail simultaneously.However, if a member is loaded in bending or bending and axial load, the sec-tion is subjected to a strain gradient and the stress-strain curve drops graduallybecause of the redistribution of strain upon attainment of peak strain in a fibre

November 30, 2004 2:30 WSPC/124-JEE 00190
102 S.-H. Jeong & A. S. Elnashai
0
10
20
30
40
0 0.005 0.01 0.015 0.02
strain
stre
ss (
Mpa
)K=1.01K=1.50
cu
Fig. 4. Stress-strain relationship of confined concrete.
[MacGregor, 1997]. Therefore, the ultimate compressive strain of beams and eccen-trically loaded columns is larger than that of concentrically loaded columns; 0.0038is proposed by Hognestad [1951] and the CEB-FIP Model Code proposes 0.0035.In the analysis program ZEUS-NL, unconfined parts of concrete members are alsoformulated by the model of Mander et al. [1988] by assuming the confinement factorK is 1.0. This material formulation can accurately predict the stress-strain relation-ship of unconfined concrete when the strain ranges from zero to the value at peakstress. After the peak stress point, however, this model overestimates the stress andstrain of unconfined concrete. Thus even in a very large strain range, the analyticalmodel assumes that cover concrete exists and contributes to some parts of memberstrength. Therefore, at the extreme fibre of the core region, the strain obtainedfrom ZEUS-NL is expected to be somewhat lower than the real strain. Consideringthe latter argument, it is desirable to use a value lower than the 0.0038 suggestedby Hognestad [1951] or the 0.0035 suggested by the CEB-FIP Model Code-1990.Therefore, the ultimate strain of compressive concrete for columns in the pre-testassessment is conservatively assumed to be 0.003, as shown in Fig. 4.
The ultimate strain of confined concrete is utilised to define one of the collapselimit state of the member response rather than to implement abrupt loss of resis-tance in the analytical model. Axial-flexural failure of a member is assumed to occurwhen the extreme fibre of the confined core concrete reaches the ultimate strain.Figure 4 shows the non-ductile behaviour of concrete used in the test structure(K = 1.01) by comparing its stress-strain relationship with that of well-confinedconcrete (K = 1.50). As indicated, the approach used in this study includes explic-itly axial-flexural failure of concrete members.
3. Pre-Test Analysis
3.1. Analysis method
According to FEMA 356, analysis procedures are categorized as Linear StaticProcedure (LSP), Nonlinear Static Procedure (NSP), Linear Dynamic Procedure

November 30, 2004 2:30 WSPC/124-JEE 00190
Analytical Assessment of an Irregular RC Frame for Full-Scale 3D PsD Testing — Part I 103
(LDP) and Nonlinear Dynamic Procedure (NDP). Since linear analysis procedures(LSP and LDP) cannot represent inelastic responses and energy dissipation of struc-tures exposed to earthquake loadings, NSP and NDP, which are commonly knownas pushover analysis and inelastic dynamic response history analysis, respectably,should be utilised for an advanced seismic assessment.
Whilst it is generally accepted that inelastic dynamic response history analysisis the most accurate method, the procedural simplicity of pushover analysis hasattracted analysts to employ the latter approach in assessing a wide range of struc-tures. Therefore, considerable effort has been directed towards improving pushoveranalysis procedures [e.g. Gupta and Kunnath, 2000; Elnashai, 2002; Mwafy andElnashai, 2001; Chopra and Goel, 2002; Hernandez-Montes et al., 2004]. Whilst theoverall pattern of inelastic deformation of structures can be reasonably obtainedthrough conventional or improved pushover analysis, the estimation of responsedemand still resorts to response spectra. Conventional earthquake spectra cannotbe more than approximate estimations if they are used for structures which areirregular, exposed to bi-directional earthquake loading or responding in severalcombined modes. Therefore, in spite of the additional effort to obtain the improvedpushover curves, NSP methods that have been developed are still approximationsof the seismic response of complex structures. In addition to the above-discussedlimitation, the conceptual complexity of the approach discourages the analyst fromusing improved (e.g. adaptive) pushover analysis.
In this paper, conventional pushover analysis was selected for the followingassessment objectives:
• To obtain overall capacity of the structure such as yield displacement, peak baseshear and ultimate displacement.
• To investigate the soft storey and location of critical members.• To estimate approximate responses before the input ground motion was not deter-
mined.
For other assessment objectives such as estimation of peak displacement demand,amount of torsion, and member level damage assessment under earthquakeground acceleration inputs for the test, dynamic response history analyses wereperformed.
3.2. Pushover analysis
Inelastic pushover analyses were performed in order to estimate overall capacityand basic characteristics of the test structure such as peak base shears, the weakdirection and soft storey. In this paper, the 1st mode shape is utilised to determinethe vertical distribution of the lateral forces on the structure, instead of the heightabove the base to the floor level used in UBC 97. Thus, equivalent lateral force

November 30, 2004 2:30 WSPC/124-JEE 00190
104 S.-H. Jeong & A. S. Elnashai
distribution is proportional to the 1st mode shape and the mass distribution asexpressed in Eq. (4).
Fi = V ×[φi · mi
/ n∑i=1
φi · mi
], (4)
where Fi is the equivalent lateral force on the ith floor, V is base shear, φi is thedisplacement at the ith floor, mi is the mass on the ith floor and n is the totalnumber of floors. This force on each floor is redistributed on loading points atframes, and its magnitude is proportional to the mass supported by each frame asshown in Fig. 5(a).
In Fig. 5, the positive x direction is denoted as ‘xp’ and negative as ‘xn’.Similarly, directions along the y axis are denoted as ‘yp’ and ‘yn’, respectively.Fig. 5(b) shows that in the y direction, the structure is stiffer, stronger and morestable after its peak base shear than in the x direction. This is due to the contri-bution of a large column C6 to the lateral resistance in the y direction. Strengthreduction after its peak value is mainly caused by p − ∆ effect and is governed bythe magnitude of interstorey drift. Comparing the curves in Fig. 5(b) implies thatstorey drift is larger in the x direction and causes more p − ∆ effect than in they direction. If loading was applied along the y axis, large differences in strengthwould be observed between positive and negative loading. In the case of positivey direction loading (yp), the concrete of large column C6 is in tension, and thecontribution of the concrete to the structure is negligible. However, if lateral loadsare applied to the building in the negative y direction (yn), the large column C6 isin compression and concrete in that section fully resists the external forces. Thus,the strength of ‘yn100’ is higher than that of ‘yp100’ in Fig. 5(b).
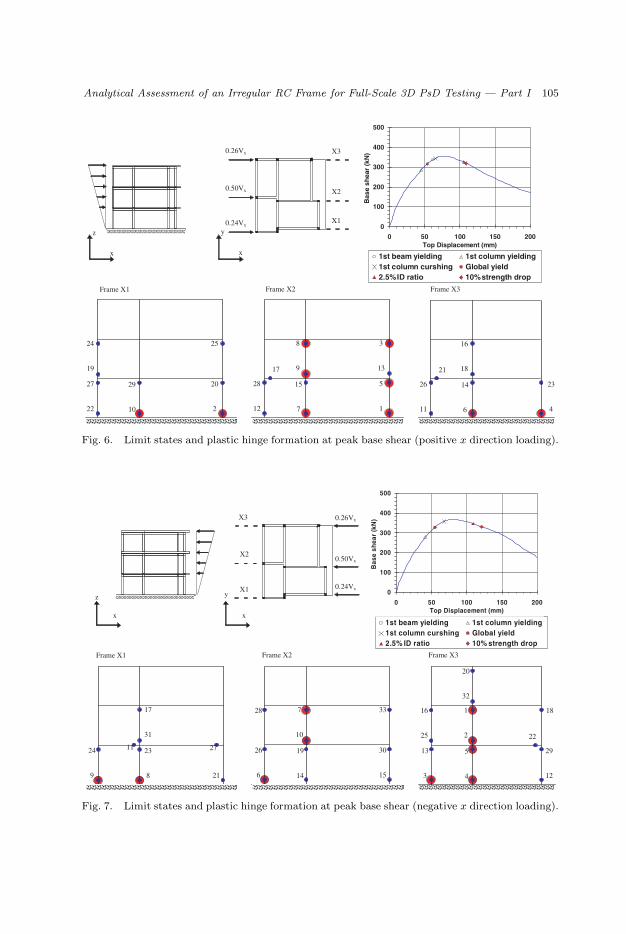
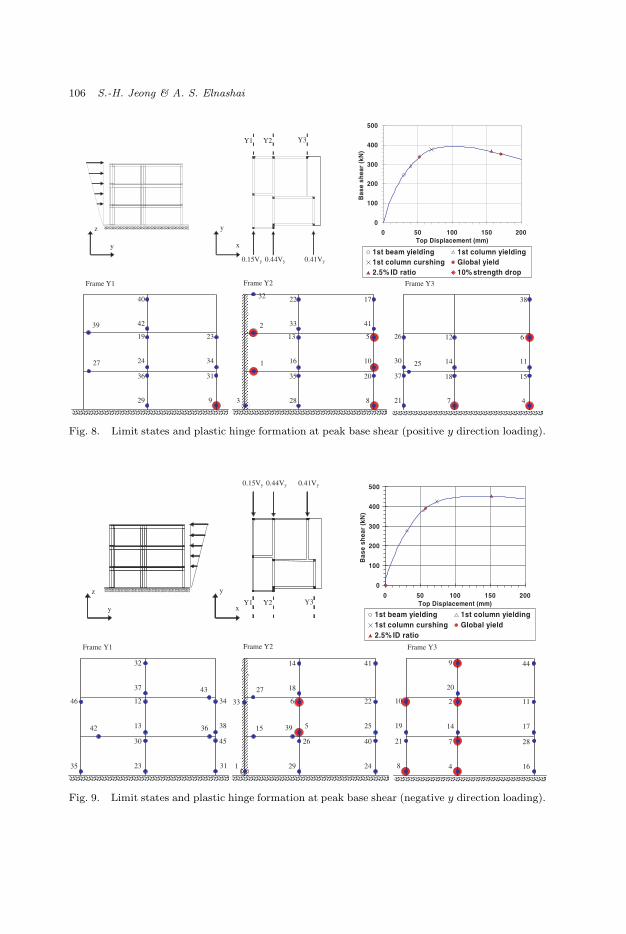
Damage states due to inelastic deformation of the structure are representedon the capacity curves in Figs. 6–9. Three-dimensional pushover analyses wereperformed and the top displacement was monitored at the centre column (C3).
x
y
xp
0.24Vx
0.50Vx
0.26Vx
0.15Vy 0.44Vy 0.41Vy
yp
xn
0.24Vx
0.50Vx
0.26Vx
yn
0.15Vy 0.44Vy 0.41Vy
(a) Distribution of equivalent lateral loads on the plan (b) Pushover curves under unidirectional loading
Fig. 5. Load distribution and pushover curves.
0
100
200
300
400
500
-200 -150 -100 -50 0 50 100 150 200Top displacement at the centre column (C3) (mm)
Bas
e sh
ear (
kN)
xn100 xp100yn100 yp100
November 30, 2004 2:30 WSPC/124-JEE 00190
Analytical Assessment of an Irregular RC Frame for Full-Scale 3D PsD Testing — Part I 105
16
18
26
11
23
4
14
6
21
8
9
28
12
3
5
1
15
7
17 13
24
19
27
22
25
20
2
29
10
Frame X3Frame X2Frame X1
0
100
200
300
400
500
0 50 100 150 200Top Displacement (mm)
Bas
e sh
ear
(kN
)
1st beam yielding 1st column yielding1st column curshing Global yield2.5% ID ratio 10% strength drop
x
y
0.26Vx
0.50Vx
0.24Vx
X3
X2
X1
x
z
Fig. 6. Limit states and plastic hinge formation at peak base shear (positive x direction loading).
1
2
13
3
29
12
5
4
22
20
32
16
25
187
10
26
6
33
30
15
19
14
2817
31
24
9
11 27
21
23
8
Frame X3Frame X2Frame X1
1st beam yielding 1st column yielding1st column curshing Global yield2.5% ID ratio 10% strength drop
0
100
200
300
400
500
0 50 100 150 200Top Displacement (mm)
Bas
e sh
ear
(kN
)
x
y
0.26Vx
0.50Vx
0.24Vx
X3
X2
X1
x
z
Fig. 7. Limit states and plastic hinge formation at peak base shear (negative x direction loading).
November 30, 2004 2:30 WSPC/124-JEE 00190
106 S.-H. Jeong & A. S. Elnashai
12
14
18
7
6
11
15
4
25
38
26
30
37
21
13
16
35
28
22
33
5
10
20
8
2
1
32 17
41
3
19
24
36
29
40
42
23
34
31
9
39
27
Frame Y3 Frame Y2 Frame Y1
1st beam yielding 1st column yielding1st column curshing Global yield2.5% ID ratio 10% strength drop
0
100
200
300
400
500
0 50 100 150 200Top Displacement (mm)
Bas
e sh
ear
(kN
)
x
y
0.15Vy 0.44Vy 0.41Vy
Y3Y2Y1
y
z
Fig. 8. Limit states and plastic hinge formation at peak base shear (positive y direction loading).
4 168 29 241 31
2
14
7
11
17
28
44
10
19
21
9
20
6
5
26
14
18
22
25
40
27
15
33
41
39
12
13
30
23
32
37
34
38
45
43
36
46
35
42
all stame Y3ame Y2 rame Y1
0
200
300
0
500
0 00 0 00 Displacement (mm)
beam yielding column yielding column curshing lobal yield
5% ID ratio
0.15Vy 0.44Vy 0.41Vy
FrFrF
0
10
40
0 5 1 15 2Top
Bas
e sh
ear
(kN
)
1st 1st1st G2.
x
y
Y3Y2Y1y
z
Fig. 9. Limit states and plastic hinge formation at peak base shear (negative y direction loading).
November 30, 2004 2:30 WSPC/124-JEE 00190
Analytical Assessment of an Irregular RC Frame for Full-Scale 3D PsD Testing — Part I 107
Plastic hinges are defined as the locations where longitudinal reinforcing bars beginto yield. Member yielding is conservatively defined as corresponding to the axialstrain of steel reaching its yield strain (εy = 0.002). Column crushing is definedas corresponding to the extreme fibre of core concrete reaching the crushing strain(εu = 0.003).
For the global collapse damage state, Interstorey Drift (ID) and strength degra-dation on the pushover curve are used. Several values corresponding to collapse fora building have been suggested by different researchers. At values in excess of thecollapse limit defined by ID, it is assumed that significant p − ∆ effect leads tofailure of a building. An ID of 2% has been suggested by Sozen [1981] as the col-lapse limit for three-quarters of RC buildings, and 2.5% was suggested by SEAOC[1995]. In studies by Broderick and Elnashai [1994] and Kappos [1997], 3% wasrecommended as an upper limit of ID. However, the structure under considerationin this report is not built with modern seismic codes, and it will be much weakerthan those structures used in previous studies to obtain 3% ID limit. Therefore,2.5% can be assumed as an appropriate ID limit at collapse for the structure in thispaper. Significant degradation in strength or stiffness can be a criterion for collapsepoints on pushover curves. Based on strength degradation, collapse is consideredto have occurred when lateral resistance of the structure drops by more than 10%below its peak value [Mwafy, 2001]. The pushover curve in the negative y directiondoes not have 10% strength drop due to the role of C6 in lateral resistance.
In Figs. 6–9, the sequence of plastic hinge formation is represented by numbers;larger circles represent plastic hinges formed at early stages (from the 1st to 10th).In the x directional loading, plastic hinges are concentrated at the lower two storeysand begin to form at columns even at a small displacement whilst in the y directionthe large column C6 has the role of distributing damage over the structure and thuspreventing a weak storey. In the y direction, plastic hinges begin to form at beamsand the bottom of the large column C6 because this column attracts more loadsdue to its larger stiffness. C6 distributes damage over the structure by making allstoreys move together and prevents the formation of plastic hinges at columns beforethe plastic hinge forms at the bottom of itself. This is followed by the formation ofplastic hinges at other columns because the building without intact large column C6becomes a weaker structure. However, after the forming of plastic hinge at C6, thislarge column still contributes to the better behaviour of the structure by spreadingthe damage over the structure rather than concentrating at one storey. More plastichinges are formed in the middle frames because more lateral loads are acting onthe middle frame to simulate the earthquake load proportional to the mass.
3.3. Dynamic response history analysis
Before the determination of earthquake scenario for the test, two artificially gener-ated (source model) ground motions were used to assess the dynamic response of thestructure. Figure 10 represents acceleration time histories of two ground motions

November 30, 2004 2:30 WSPC/124-JEE 00190
108 S.-H. Jeong & A. S. Elnashai
-0.4
-0.2
0
0.2
0.4
0 3 6 9 12 15
Time (sec.)
Acc
eler
atio
n (
g
-0.4
-0.2
0
0.2
0.4
0 3 6 9 12 15
Time (sec.)
Acc
eler
atio
n (
g
) )
(a) Acc. 475 (b) Acc. 975
Fig. 10. Acceleration time histories of input ground motions.
0
0.2
0.4
0.6
0.8
1
1.2
1.4
0 3 6 9 12 15
Time (sec.)
Per
iod
(se
c.)
Acc. 475 xAcc. 475 y
Acc. 975 x
Acc. 975 y
(a) Period time histories (b) Elastic response spectra with 5% damping ratio
0
0.5
1
0 1 2 3Period (sec.)
Pse
ud
o A
ccel
erat
ion
(g
) Acc. 475Acc. 975
Tx-975
Ty-975
Tx-475
Ty-475
Fig. 11. Inelastic periods of the structure.
with return periods of 475 and 975 years and detailed description on them is givenin Campos-Costa and Pinto [1999]. They are referred to hereafter as Acc. 475 andAcc. 975. The advantages of using these records for seismic assessment are:
• The records have flat spectra in the intermediate period range, hence the demandimposed on the models is not sensitive to the change in structural period.
• They were used in pre-test analysis and actual testing of the full scale ICONSframe [Pinho and Elnashai, 2001; Pinto et al., 2002].
• They represent clearly-defined return period earthquakes that effectively matchtwo performance targets: damage control (475 year return period) and collapseprevention (975 year return period).
Inelastic periods of the structure under Acc. 475 and Acc. 975 earthquakes areobtained by Discrete Fourier Amplitude analysis, and the period time histories ofthe structure are plotted in Fig. 11(a) with their range on response spectra of theinput ground motions in Fig. 11(b). Tx-975 and Ty-975 are the period ranges ofthe structure under Acc. 975 in the x direction and in the y direction, respectively.Similarly, Tx-475 and Ty-475 are the period ranges under Acc. 475.
November 30, 2004 2:30 WSPC/124-JEE 00190
Analytical Assessment of an Irregular RC Frame for Full-Scale 3D PsD Testing — Part I 109
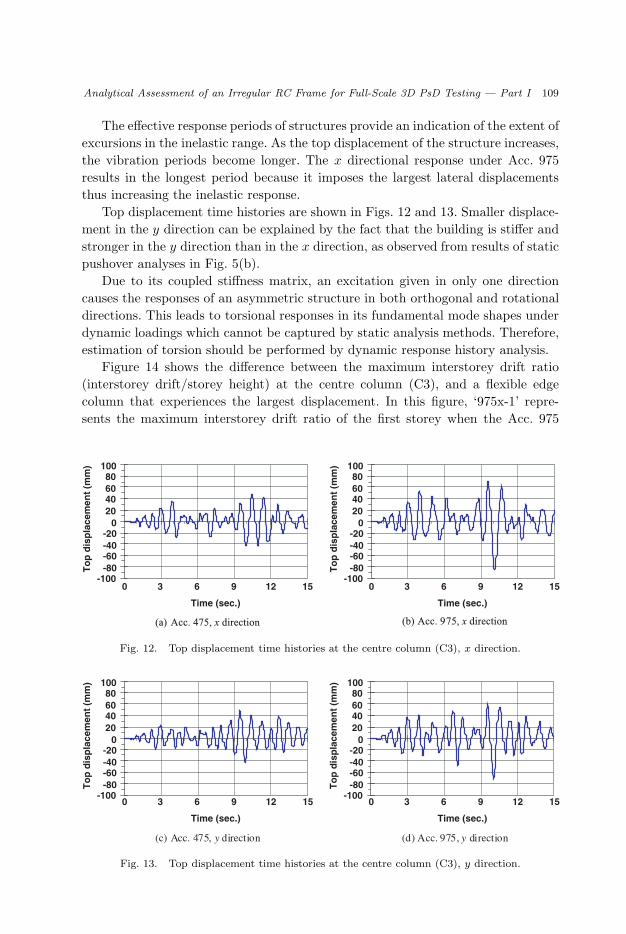
The effective response periods of structures provide an indication of the extent ofexcursions in the inelastic range. As the top displacement of the structure increases,the vibration periods become longer. The x directional response under Acc. 975results in the longest period because it imposes the largest lateral displacementsthus increasing the inelastic response.
Top displacement time histories are shown in Figs. 12 and 13. Smaller displace-ment in the y direction can be explained by the fact that the building is stiffer andstronger in the y direction than in the x direction, as observed from results of staticpushover analyses in Fig. 5(b).
Due to its coupled stiffness matrix, an excitation given in only one directioncauses the responses of an asymmetric structure in both orthogonal and rotationaldirections. This leads to torsional responses in its fundamental mode shapes underdynamic loadings which cannot be captured by static analysis methods. Therefore,estimation of torsion should be performed by dynamic response history analysis.
Figure 14 shows the difference between the maximum interstorey drift ratio(interstorey drift/storey height) at the centre column (C3), and a flexible edgecolumn that experiences the largest displacement. In this figure, ‘975x-1’ repre-sents the maximum interstorey drift ratio of the first storey when the Acc. 975
-100-80-60-40-20
020406080
100
0 3 6 9 12 15
Time (sec.)
To
p d
isp
lace
men
t (m
m)
(a) Acc. 475, x direction
-100-80-60-40-20
020406080
100
0 3 6 9 12 15
Time (sec.)
To
p d
isp
lace
men
t (m
m)
(b) Acc. 975, x direction
Fig. 12. Top displacement time histories at the centre column (C3), x direction.
-100-80-60-40-20
020406080
100
0 3 6 9 12 15
Time (sec.)
To
p d
isp
lace
men
t (m
m)
(c) Acc. 475, y direction
-100-80-60-40-20
020406080
100
0 3 6 9 12 15
Time (sec.)
To
p d
isp
lace
men
t (m
m)
(d) Acc. 975, y direction
Fig. 13. Top displacement time histories at the centre column (C3), y direction.

November 30, 2004 2:30 WSPC/124-JEE 00190
110 S.-H. Jeong & A. S. Elnashai
0
0.5
1
1.5
2
975x-1
975x-2
975x-3
975y-1
975y-2
975y-3
Inte
rsto
rey
dri
ft r
atio
(%)
Additional ID of critical mamber=ID by torsion
ID at centre of a storey
Fig. 14. Difference of interstorey drift between the centre and edge column.
earthquake record is applied in the x direction. Similarly, ‘975y-3’ represents themaximum interstorey drift ratio of the third storey when the record is applied inthe y direction. The significant difference between two interstorey drifts — whichis also the additional interstorey drift (ID) of critical member — is due to thetorsional response. Therefore, interstorey drift at a single location of a storey canbe misleading in damage assessment. The effect of torsion should be accounted forin the damage assessment of irregular structures. A detailed study of this topic isgiven in Jeong and Elnashai [2004b].
4. Determination of Earthquake Scenario for the Test
Providing the most appropriate load condition for a full scale test which can be per-formed only once is an onerous and high-risk task. In order to obtain comprehensivedata for the investigation of the deficiencies of gravity-load-designed buildings andsuitable repair schemes, significant damage, without collapse, should be inflicted.For a systematic approach to deal with many scenarios of earthquakes, the proce-dure was divided into three steps followed by individual decision and reduction inthe number of combinations. At first, an earthquake record was selected consider-ing the possibility of collapse during the test. Then, the intensity of the selectedrecord was determined to obtain sufficient information on damage after the test.Finally, the direction of record application was selected to cause the largest amountof torsion for understanding the response of an asymmetric building.
Through discussions amongst partners of the SPEAR project, seven records inTable 3 were selected as candidates for the test execution. Each of the seven recordsconsists of two orthogonal components of horizontal accelerations; longitudinal (L)and translational (T). The time histories were modified from the natural records tobe compatible to the EC8 Type 1 (for moderate or large events) design spectrum,soil type C (dense sand, gravel or stiff clay) and 5% damping. The latter recordswere normalised to peak ground acceleration (PGA) of 1.0 g on rock, which meansthat PGA is 1.15 g on soil type C.

November 30, 2004 2:30 WSPC/124-JEE 00190
Analytical Assessment of an Irregular RC Frame for Full-Scale 3D PsD Testing — Part I 111
Table 3. List of semi-artificial records.
No. Earthquake Station Components PGA (g)
1 Montenegro 1979 Ulcinj L, T 1.152 Montenegro 1979 Herceg Novi L, T 1.153 Friuli 1976 Tolmezzo L, T 1.154 Imperial Valley 1940 El Centro Array #9 L, T 1.155 Kalamata 1986 Prefecture L, T 1.156 Loma Prieta 1989 Capitola L, T 1.157 Imperial Valley 1979 Bonds Corner L, T 1.15
4.1. Selection of the input record
Two orthogonal components of each record in Table 3 were simultaneously appliedto the analytical model, after scaling down to 0.2 g PGA. The direction of groundmotion corresponds to scenario D1 in Fig. 17. The responses of the building underthe seven records were investigated by interstorey drift time histories. Failure pre-vention was considered as an important criterion for selection of a record to obtainmore controllable results and a stream of good response data in the real test.Montenegro 1979 (Herceg Novi) was selected because no pronounced peak wasobserved and the latter part of the response is larger than the earlier part, thusallowing considerable experimental results prior to subjecting the structure to themaximum demand region. This response characteristic is clearly shown by com-paring the responses of selected (Fig. 15(a)) and one of the excluded records(Fig. 15(b)).
4.2. Intensity of ground motion for the test
To determine an appropriate intensity of ground motion, damage levels of the struc-ture under the selected record (Montenegro 1979-Herceg Novi) with various PGA
-120
-90
-60
-30
0
30
60
90
120
0 3 6 9 12 15Time (sec.)
Inte
rsto
rey
dri
ft in
x (
mm
)
1st level 2nd level 3rd level
-120
-90
-60
-30
0
30
60
90
120
0 3 6 9 12 15Time (sec.)
Inte
rsto
rey
dri
ft in
x (
mm
)
1st level 2nd level 3rd level
(a) Montenegro 1979 (Herceg Novi, 0.2 g) (b) Kalamata 1986 (Prefecture, 0.2 g)
Fig. 15. Interstorey drift time histories in the x direction at the centre column C3, direction ofinput records-D1.
November 30, 2004 2:30 WSPC/124-JEE 00190
112 S.-H. Jeong & A. S. Elnashai
levels were investigated. As a damage index, interstorey drift was preferred to curva-ture demand because the former is easy to monitor and accurate enough to estimatedamage inflicted on critical columns. The demand-to-capacity ratio (DCR) of eachcolumn was calculated by Eq. (5) in order to account for the bi-directional responseof the structure.
DCR =√
(∆x/∆u,x)2 + (∆y/∆u,y)2, (5)
where, ∆x and ∆y are the interstorey drift in the x direction and in the y direction,respectively. The subscript u represents ultimate interstorey drift. The ultimateinterstorey drift of each column is the drift where the curvature of the columnreaches the ultimate value under average axial force. The aforementioned drift wascalculated from 3D building analyses instead of isolated column analyses becausedisplacement of a member is affected by boundary conditions and stress distributionalong the member. The ultimate curvature is the curvature where the strain of theconfined core concrete is 0.003 or the rupture strain of tension steel is 0.1 andaverage axial force is calculated by static analysis with dead loads and 30% of liveloads, excluding the effect of overturning moment under ground motions.
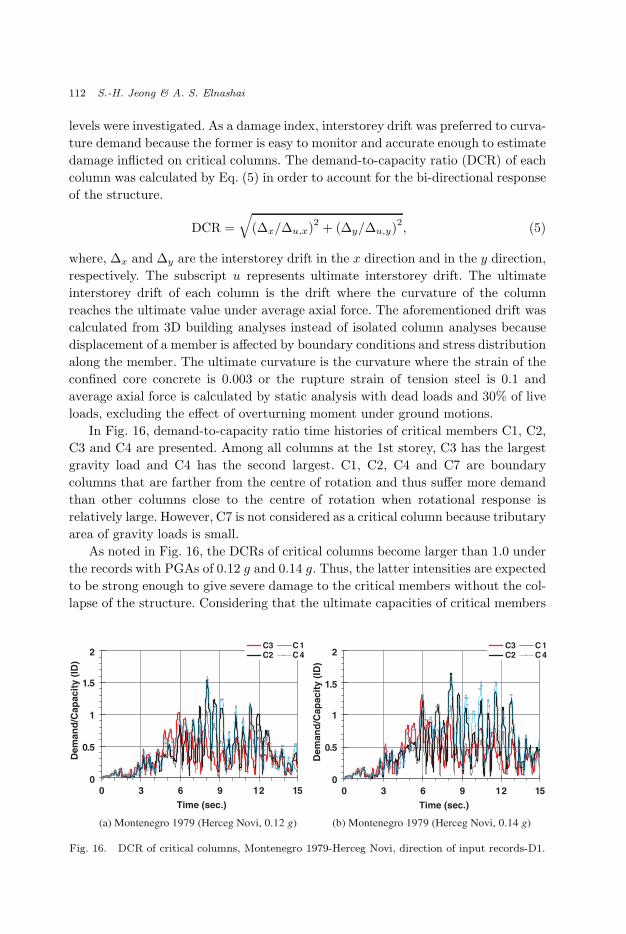
In Fig. 16, demand-to-capacity ratio time histories of critical members C1, C2,C3 and C4 are presented. Among all columns at the 1st storey, C3 has the largestgravity load and C4 has the second largest. C1, C2, C4 and C7 are boundarycolumns that are farther from the centre of rotation and thus suffer more demandthan other columns close to the centre of rotation when rotational response isrelatively large. However, C7 is not considered as a critical column because tributaryarea of gravity loads is small.
As noted in Fig. 16, the DCRs of critical columns become larger than 1.0 underthe records with PGAs of 0.12 g and 0.14 g. Thus, the latter intensities are expectedto be strong enough to give severe damage to the critical members without the col-lapse of the structure. Considering that the ultimate capacities of critical members
0
0.5
1
1.5
2
0 3 6 9 12 15
Time (sec.)
Dem
and
/Cap
acit
y (I
D)
C3 C1C2 C4
0
0.5
1
1.5
2
0 3 6 9 12 15
Time (sec.)
Dem
and
/Cap
acit
y (I
D)
C3 C1C2 C4
(a) Montenegro 1979 (Herceg Novi, 0.12 g) (b) Montenegro 1979 (Herceg Novi, 0.14 g)
Fig. 16. DCR of critical columns, Montenegro 1979-Herceg Novi, direction of input records-D1.
November 30, 2004 2:30 WSPC/124-JEE 00190
Analytical Assessment of an Irregular RC Frame for Full-Scale 3D PsD Testing — Part I 113
are conservatively assumed, 0.12 g PGAs were suggested for the test as a lowerbound of appropriate levels of intensity for the test.
4.3. Direction of ground motion
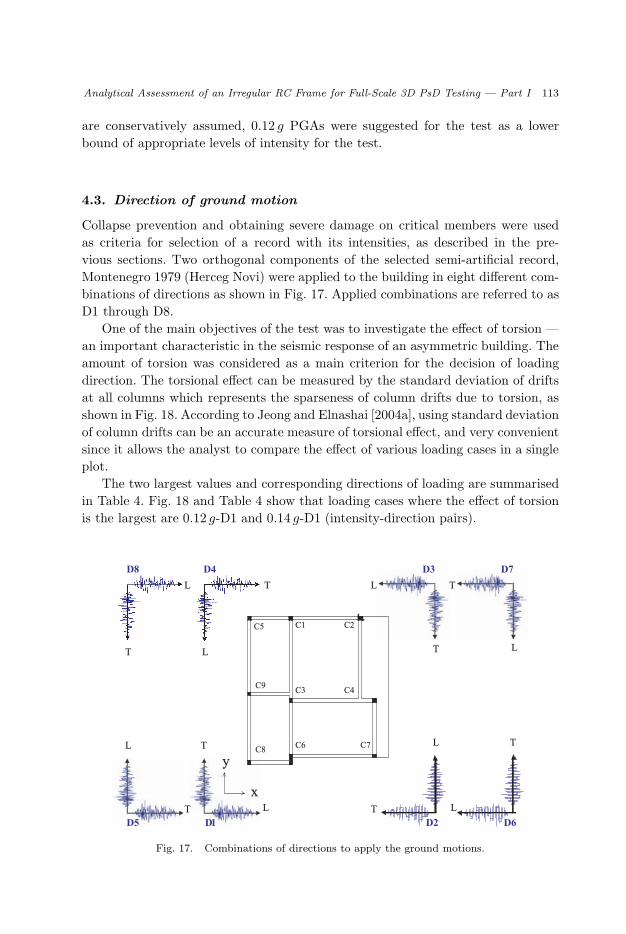
Collapse prevention and obtaining severe damage on critical members were usedas criteria for selection of a record with its intensities, as described in the pre-vious sections. Two orthogonal components of the selected semi-artificial record,Montenegro 1979 (Herceg Novi) were applied to the building in eight different com-binations of directions as shown in Fig. 17. Applied combinations are referred to asD1 through D8.
One of the main objectives of the test was to investigate the effect of torsion —an important characteristic in the seismic response of an asymmetric building. Theamount of torsion was considered as a main criterion for the decision of loadingdirection. The torsional effect can be measured by the standard deviation of driftsat all columns which represents the sparseness of column drifts due to torsion, asshown in Fig. 18. According to Jeong and Elnashai [2004a], using standard deviationof column drifts can be an accurate measure of torsional effect, and very convenientsince it allows the analyst to compare the effect of various loading cases in a singleplot.
The two largest values and corresponding directions of loading are summarisedin Table 4. Fig. 18 and Table 4 show that loading cases where the effect of torsionis the largest are 0.12 g-D1 and 0.14 g-D1 (intensity-direction pairs).
T
x
C1 C2C5
C3 C4C9
C6 C7C8
L
L
L
L
T
T
TL
L
L
L
T
T
T
T
D1D5 D6D2
D4D8 D7D3
y
Fig. 17. Combinations of directions to apply the ground motions.

November 30, 2004 2:30 WSPC/124-JEE 00190
114 S.-H. Jeong & A. S. Elnashai
0
10
20
30
40
0 3 6 9 12 15
Time (sec.)
Sta
ndar
d d
evia
tion
of d
eman
d
D1 D2 D3 D4D5 D6 D7 D8
0
10
20
30
40
0 3 6 9 12 15
Time (sec.)
Sta
ndar
d d
evia
tion
of
dem
and
D1 D2 D3 D4D5 D6 D7 D8
(a) 0.12g (b) 0.14g
Fig. 18. Standard deviation of drift demands of all columns, Montenegro 1979-Herceg Novi.
Table 4. Two largest standard deviations of drifts at columns.
Standard deviation of displacement (mm)
PGA (g) 1st 2nd
0.12 D1 (28.1) D3 (26.2)0.14 D1 (30.9) D3 (29.8)
According to the previous discussions, the selected record with intensity of 0.12 g
PGA in direction D1 and 0.14 g PGA in direction D1 were recommended as inputground motion for the test.
5. Refinement of the Pre-Test Analytical Model
At the final stage of the test setup, detailed material and layout information onthe test structure became available and the pre-test analytical model was refinedaccording to this additional information. More representative analytical modelswere generated by implementing rigid diaphragm for slab floors, actual materialproperties and shear deformation modelling of beam-column joints.
5.1. Rigid diaphragm modelling of floor slabs
At each floor, four actuator-mounting blocks of thickness 350mm and two pairs ofconnecting elements were monolithically constructed with the floor slab as shownin Fig. 19(a).
Figure 19(b) indicates that the mounting blocks are highly reinforced and fas-tened to each other by connecting elements where prestressing bars (DYWDAG Φ36 mm) are embedded. This configuration ensures adequate load transferring con-ditions from loading pistons to the test structure and provides much higher stiffnessagainst horizontal twist to the floor slab than the original model which is presentedin Fig. 20(a). Thus the implementation of rigid diaphragm of floor slabs became

November 30, 2004 2:30 WSPC/124-JEE 00190
Analytical Assessment of an Irregular RC Frame for Full-Scale 3D PsD Testing — Part I 115
(a) Drawing of actuator mounting blocks (b) Construction of actuator mounting blocks
Fig. 19. Actuator connecting elements on slabs.
1000 mm
15 mm
Concrete (f'c=26.7MPa)
Steel (fy=474MPa)
As=100 mm2
As=50 mm2
(a) 3D model without rigid diaphragm (b) 3D model with rigid diaphragm
(c) Section of the horizontally rigid member
Fig. 20. Rigid diaphragms in 3D analytical modelling.
necessary for more accurate analytical modelling. In order to model slabs as rigiddiaphragms, each corner of a slab is diagonally connected to the opposite corner byhorizontally rigid members as shown in Fig. 20(b).
Due diligence was applied to the determination of the properties of the membersrepresenting floor diaphragms. The dimensions and reinforcement of connecting

November 30, 2004 2:30 WSPC/124-JEE 00190
116 S.-H. Jeong & A. S. Elnashai
-9
-6
-3
0
3
6
9
0 5 10 15Time (sec.)
An
gle
of
tors
ion
(E
-3 r
ad)
-9
-6
-3
0
3
6
9
0 5 10 15Time (sec.)
An
gle
of
tors
ion
(E
-3 r
ad)
(a) Without rigid diaphragm in slap modelling (b) With rigid diaphragm in slap modelling
Fig. 21. Angle of torsion time histories at all columns in the 1st storey (Montenegro 1979 —Herceg Novi, 0.2 g, bidirectional loading, D1).
members for the rigid diaphragm modelling were determined for the additionalmembers not to provide duplicated stiffness to the flexural behaviour of beams,because the contribution of slabs to flexural stiffness of beams is already modelledby effective width of T-beam models. As shown in Fig. 20(c), the thin section of thehorizontally rigid members and single-layered reinforcement present only horizontalstiffness to the floor without vertically stiffening the adjacent beams.
Figure 21 represents the angle of torsion at all corners of slabs that arelocated at column points. The analytical model with additional connecting mem-bers (Fig. 20(b)) shows the same angle of torsion at every corner and this behavioursatisfies the assumption of slab diaphragm.
5.2. Material properties update
Three types of material properties are compared in Table 5 and Fig. 22. The designwas undertaken using nominal material strengths. These were updated based onmaterial parameters supplied by the steel manufacturers and concrete contractors.They are referred to as “pre-test” values. The values of actual material propertiesare compared with the design and pre-test values in Table 5 and Fig. 22. As soon
Table 5. Actual and designed material properties.
Concrete Steel
Design f ′c Pre-test f ′c Actual Bar Design Fy Pre-test ActualMember (MPa) (MPa) f ′c (MPa) Size (MPa) Fy (MPa) Fy (MPa)
1st FL. column 25 25 24.73 8mm 220 467 4791st FL. slab 25 25 26.7
2nd FL. column 25 25 26.7 12mm 360 459 4742nd FL. slab 25 25 27.53
3rd FL. column 25 25 25.32 20mm 360 377 3973rd FL. slab 25 25 27.39

November 30, 2004 2:30 WSPC/124-JEE 00190
Analytical Assessment of an Irregular RC Frame for Full-Scale 3D PsD Testing — Part I 117
(a) Compressive strength ( f ’c) of concrete (b) Yield strength (Fy) of steel
Fig. 22. Comparison of material properties from original design and actual test.
0
100
200
300
400
500
0 50 100 150 200Top displacement in x (mm)
Bas
e sh
ear
in x
(kN
)
Actual material propertiesPre-test material propertiesDesigned material properties
0
100
200
300
400
500
0 50 100 150 200Top displacement in y (mm)
Bas
e sh
ear
in y
(kN
)
Actual material propertiesPre-test material propertiesDesigned material properties
(a) x direction (b) y direction
Fig. 23. Capacities with material properties of the original design and actual test.
as actual material test results were made available, these were employed in theanalytical model.
Capacity curves using actual material properties are compared with those ofthe designed and pre-test material properties in Fig. 23. Material property changeonly affects the strength of the test structure. The difference between the capacitycurves in Fig. 5(b) and the curves of pre-test material properties in Fig. 23 is causedby the implementation of rigid diaphragm for slab modelling.
All the analyses before this section were performed with the “pre-test” materialproperties. In the final refinement of the analytical modelling, the actual Fy valueswere obtained directly from construction materials used.
5.3. Beam-column joint shear modelling
According to the detailed construction drawings of the SPEAR test structure, stir-rups do not continue in the beam-column connections. This feature of beam-columnconnection detail increases the probability of joint shear failure under earthquake

November 30, 2004 2:30 WSPC/124-JEE 00190
118 S.-H. Jeong & A. S. Elnashai
0
1
2
3k2
k1
�c
�p
4
0 0.5 1 1.5
Shear strain (1E-3 rad)
Sh
ear
stre
ss (
Mp
a)
Fig. 24. Tri-linear shear stress-strain relationship.
Table 6. Parameters for the shear stress-strain relationship.
Parameters Descriptions
Strength τc Shear stress at cracking (MPa)τp Shear stress at maximum capacity (MPa)
Stiffness k1 Stiffness up to cracking (MPa) = G (Shear modulus of elasticity)k2 Stiffness between cracking and maximum capacity (MPa)
loadings. Therefore, joint elements that represent shear deformation of beam-column connections were implemented into the pre-test analytical model.
The shear strain-stress relationship is assumed to be tri-linear, as shown inFig. 24. Parameters to define the tri-linear model are explained in Table 6. Exper-imental data on reinforced concrete beam-column joints without stirrups are givenin Walker [2001], where most of the specimens showed a non-softening constantload region after the peak strength until the strain reaches about 0.0025 in theshear strength-strain relationships. Based on the latter reference, decrease in shearresistance after the peak strength (τp) was not modelled and ultimate shear straincapacity was assumed to correspond to a shear strain of 0.002 radians.
The actual calculation of the strength values described in Table 6 is describedbelow.
Shear strength estimation
In order to estimate appropriate shear strength of beam-column joints, vari-ous references were reviewed and compared, as shown in Table 7 and Fig. 25.FEMA 356 presents shear capacity of RC beam-column connections in various sit-uations of adjacent members and all range of transverse steel ratios. As a result,FEMA 356 was utilised in calculating the shear stress at maximum capacity.Cracking stress and stiffness are calculated by using the nonlinear section anal-ysis program ‘Response 2000’ by Bentz [2000] and test data from Walker [2001], asrepresented in Table 8.

November 30, 2004 2:30 WSPC/124-JEE 00190
Analytical Assessment of an Irregular RC Frame for Full-Scale 3D PsD Testing — Part I 119
Table 7. References for estimating joint shear capacity.
References Comments
ACI 318 This provision overestimates the shear capacity by assuming that thebeam-column joint has a minimum amount of transverse reinforcement.
FEMA 356 The case of low transverse steel ratio (less than 0.3%) is applicable toSPEAR frame.
Response 2000-Bentz [2000]
This program underestimates the shear capacity because confinementeffect by adjacent members cannot be modelled.
Calvi et al. [2002] Joints tested in this paper do not have transverse beams and thus areweaker than those of the SPEAR frame. Though the test wasconducted with interior joint, exterior joint and knee joint, only thesub-assembly with external joint failed due to joint capacity limitation.Only the strength of interior joint is available.
Walker [2001] Only the internal joint case was tested.
0
5
10
15
20
25
0 5 10 15 20 25 30Column #
Sh
ear
stre
ng
th f
acto
rs
ACI 318FEMA 356Response 2000Calvi et al. 2002Walker 2001
0
5
10
15
20
25
0 5 10 15 20 25 30Column #
Sh
ear
stre
ng
th f
acto
rs
ACI 318FEMA 356Response 2000Calvi et al. 2002Walker 2001
(a) x direction (b) y direction
Fig. 25. Comparison of shear strength factors (Column #: 1st storey: 1∼9, 2nd storey: 11∼19,3rd storey: 21∼29; the ones place digits represent column numbers in Fig. 1(b)).
Joint shear strength may be calculated by Eq. (6) [ACI 318].
Vj = γj ·√
f ′c · Aj , (6)
where Vj is the nominal joint shear force in lb, γj is the joint shear factor, f ′c is the
compressive strength of concrete in psi and Aj is the effective horizontal joint areain in2. For beam-column joints, the nominal cross-sectional area, Aj , is defined bya joint depth equal to the column dimension in the direction of framing and a jointwidth equal to the smallest of (i) the column width, (ii) the beam width plus thejoint depth, and (iii) twice the smaller perpendicular distance from the longitudinalaxis of the beam to the column side [FEMA 356]. In order to compare shear capaci-ties from various references, shear strength factor defined in Eq. (7) is utilised. Thisfactor is normalised by cross sectional area and compressive strength of concrete:
γj =Vj√
f ′c · Aj
. (7)

November 30, 2004 2:30 WSPC/124-JEE 00190
120 S.-H. Jeong & A. S. Elnashai
Shear stiffness estimation
The average stiffness before cracking (k1) obtained from analytical models of‘Response 2000’ is 8587.7MPa. This value is similar to the G (shear modulus ofelasticity) of concrete calculated by Eq. (8).
G =τ
γ=
Ec
2(1 + v)=
20 0002(1 + 0.2)
= 8333 Mpa. (8)
In calculating G by Eq. (8), it is assumed that the material is normal weight concreteand its Young’s modulus Ec ≈ 20 000MPa and Poisson’s ratio ν ≈ 0.2.
The shear stiffness after cracking (k2) is estimated from the relationship betweenmaximum shear strength (τp) and shear strain at maximum strength (dp), as shownin Eq. (9).
k2 =τp − τc
dp − dc. (9)
The shear strain at cracking (dc) is calculated from dc = τc/k1. Cracking shearstresses (τc) and shear strain at maximum strengths (dp) for knee joint and internaljoint without transverse beams are obtained from ‘Response 2000’ simulation andexperimental data from Walker [2001]. Cracking strength and stiffness of otherjoint types are calculated by interpolating or extrapolating the values of ‘Kneejoint’ and ‘Internal joint without transverse beams’ which are known by ‘Response2000’ simulation and experimental data from Walker [2001], respectively, as shownin Table 8.
The post-cracking shear stiffness (k2) of each beam-column joint is representedin Table 9. The joint type numbers in the latter table are same as the numbersin Table 8. The location of beam-column joints of the test model is expressed inthe format of ‘column number storey (direction)’. For example, ‘C1 3(y)’ is a jointbehaviour at the top of column C1 on the 3rd storey in the y direction.
Table 8. Parameters of shear stress-strain relationship according to joint types.
Shear Strength Factor (γj )Initial Stiffness Shear Strain at τc
No. Joint Type Cracking Point Max. Point k1 (MPa) dp (radian)
1 Knee joint 4 4 8587.7 0.0002(R-2000) (FEMA 356) (R-2000) (R-2000)
2 External joint 4.5 6 8587.7 0.0018without transverse (FEMA 356)beams
3 External joint w/ 5 8 8587.7 0.0034transverse beams (FEMA 356)
4 Internal joint 5.5 10 8587.7 0.005without transverse (Walker, 2001) (FEMA 356) (Walker, 2001)beams
5 Internal joint w/ 6 12 8587.7 0.0066transverse beams (FEMA 356)

November 30, 2004 2:30 WSPC/124-JEE 00190
Analytical Assessment of an Irregular RC Frame for Full-Scale 3D PsD Testing — Part I 121
Table 9. Shear stiffness of beam-column joints.
Joint Type Joint Locations in the SPEAR Frame k1 (MPa) k2 (MPa)
No 1 C1 3(y), C2 3(x), C2 3(y), C3 3(x), C4 3(x), C4 3(y),C5 3(x), C5 3(y), C6i 3(x), C6o 3(x), C6o 3(y), C7 3(x),C7 3(y), C8 3(x), C8 3(y), C9 3(x)
8587.7 0
No 2 C2 1(x), C2 1(y), C4 1(x), C4 1(y), C5 1(x), C5 1(y),C6o 1(x), C6o 1(y), C7 1(x), C7 1(y), C8 1(x), C8 1(y),C2 2(x), C2 2(y), C4 2(x), C4 2(y), C5 2(x), C5 2(y),C6o 2(x), C6o 2(y), C7 2(x), C7 2(y), C8 2(x), C8 2(y)
8587.7 393.5
No 3 C1 1(y), C3 1(x), C6i 1(x), C9 1(x), C1 2(y), C3 2(x),C6i 2(x), C9 2(x), C3 3(y)
8587.7 394.4
No 4 C1 1(x), C6i 1(y), C9 1(y), C1 2(x), C6i 2(y), C9 2(y),C1 3(x), C6i 3(y), C9 3(y)
8587.7 394.6
No 5 C3 1(y), C3 2(y) 8587.7 394.8
Fig. 26. Shear strength-strain relationships.
Shear strength-strain relationships of five types of beam-column joints definedin Tables 8 and 9 are presented in Fig. 26.
A simplified beam-column connection model where the distortion is modelled bya rotational spring and the joint shear force is converted to the moment differencebetween the column-end and beam-end rigid links was implemented in the analyticalmodel. Further details of the latter joint model are given in Calvi et al. [2002]. Theunloading stiffness is assumed to equal to the stiffness up to cracking (k1). Typicalcyclic response of beam-column joints is shown in Fig. 27 with its tri-linear envelopcurve.
6. Comparison of Analytical and Experimental Results
Pre-test analytical models and the modelling options employed are representedin Table 10. The parameter values for each modelling were determined accord-ing to the discussions in previous sections. Difficulties in the prediction of beam-column connection behaviour lead to the decision to keep ‘rigid links at column
0
2
4
6
8
10
12
14
0 0.002 0.004 0.006 0.008 0.01Shear strain (rad)
Shea
r stre
ss fa
ctor
No1 No2 No3 No4 No5

November 30, 2004 2:30 WSPC/124-JEE 00190
122 S.-H. Jeong & A. S. Elnashai
-12
-6
0
6
12
-0.008 -0.004 0 0.004 0.008Shear strain (rad)
Sh
ear
fact
or
Fig. 27. Cyclic response of joint C2 1(y) under Montenegro 1979 — Herceg Novi, 0.12 g,bidirectional loading, D1.
Table 10. Pre-test analytical models.
Slab Rigid Rigid Links at Beam-ColumnDiaphragm Column Ends Joint Shear
Model #1 Yes No NoModel #2 Yes Yes NoModel #3 Yes No YesModel #4 Yes Yes Yes
Fig. 28. Comparison of capacity curves.
ends’ and ‘beam-column joint shear model’ as an option. The assumption of ‘slabrigid diaphragm’ was implemented into all pre-test models. Capacity curves of thefour pre-test models are compared in Fig. 28.
It was concluded, after discussions amongst the project partners, that using0.12 g PGA record-one of the suggested intensities in Sec. 4.2 would be veryconservative. Therefore, in the real test, the intensity of the ground motion wasadjusted to 0.15 g PGA whilst the record (Montenegro, 1979 — Herceg Novi) andloading direction (D1 in Fig. 17) were adopted as suggested in this paper.
The responses of four pre-test analytical models are compared with the exper-imental results (0.15 g PGA), as shown in Fig. 29. The response estimations by
0
100
200
300
400
500
-200 -100 0 100 200
Top displacement in x (mm)
Bas
e sh
ear i
n x
(kN
)
Model #1Model #2Model #3Model #4
0
100
200
300
400
500
-200 -100 0 100 200
Top displacement in z (mm)
Bas
e sh
ear i
n y
(kN
)
Model #1Model #2Model #3Model #4
c
(a) x direction (b) y direction

November 30, 2004 2:30 WSPC/124-JEE 00190
Analytical Assessment of an Irregular RC Frame for Full-Scale 3D PsD Testing — Part I 123
-120
-80
-40
0
40
80
120
0 5 10 15
Time (sec.)
Top
dis
pl. i
n x
(mm
)
ELSA test result
Pre-test simulation (Model #1)
-120
-80
-40
0
40
80
120
0 5 10 15
Time (sec.)
Top
dis
pl. i
n z
(mm
)
ELSA test result
Pre-test simulation (Model #1)
-120
-80
-40
0
40
80
120
0 5 10 15
Time (sec.)
Top
dis
pl. i
n x
(mm
)
ELSA test result
Pre-test simulation (Model #2)
-120
-80
-40
0
40
80
120
0 5 10 15
Time (sec.)
Top
dis
pl. i
n z
(mm
)
ELSA test resultPre-test simulation (Model #2)
-120
-80
-40
0
40
80
120
0 5 10 15
Time (sec.)
Top
dis
pl. i
n x
(mm
)
ELSA test resultPre-test simulation (Model #3)
-120
-80
-40
0
40
80
120
0 5 10 15
Time (sec.)
Top
dis
pl. i
n z
(mm
)
ELSA test resultPre-test simulation (Model #3)
(a) Test result and model #1, x direction (b) Test result and model #1, y direction
(c) Test result and model #2, x direction (d) Test result and model #2, y direction
(e) Test result and model #3, x direction (f) Test result and model #3, y direction
-120
-80
-40
0
40
80
120
0 5 10 15
Time (sec.)
To
p d
isp
l. in
x (
mm
)
ELSA test resultPre-test simulation (Model #4)
-120
-80
-40
0
40
80
120
0 5 10 15
Time (sec.)
To
p d
isp
l. in
z (
mm
)
ELSA test resultPre-test simulation (Model #4)
(g) Test result and model #4, x direction (h) Test result and model #4, y direction
Fig. 29. Comparison of top displacements at the centre of mass.

November 30, 2004 2:30 WSPC/124-JEE 00190
124 S.-H. Jeong & A. S. Elnashai
Table 11. Comparisons between experimental results and pre-test analyses.
Max. Top Displacement
Value (mm) % Difference
x y x y
Test result 70.06 47.52 0.00 0.00
Model #1 67.32 59.63 −3.91 25.48Model #2 62.60 83.49 −10.65 75.70Model #3 66.12 56.16 −5.62 18.19Model #4 46.92 56.81 −33.04 19.56
Model #1 and Model #3 are acceptably close to the experimental results. InFigs. 29(c), (d), (g) and (h) Model #2 and Model #4 underestimate both periodand small-amplitude responses in the x direction. The latter models adopted rigidlinks at column ends, and thus they are stiffer and stronger than the former models.The comparisons shown in Fig. 29 are summarised in Table 11.
7. Conclusion
In this paper, a detailed and systematic procedure for pre-test assessment of acomplex 3D RC building model is given. The structure was designed for a full-scalepseudo-dynamic test at the Joint Research Centre, Ispra, Italy under the auspicesof the EU project Seismic Performance Assessment and Rehabilitation (SPEAR),with the Mid-America Earthquake Center as an external collaborator. Modellingconsiderations to accurately represent the seismic response of the test structure arepresented. Inelastic behaviour of RC members, torsion of irregular buildings, effectof slab diaphragm and the effect of beam-column joint shear deformation on theseismic response of the structure are accounted for. Analysis results of four differentnumerical models are compared, and measured data from the test are presented.A summary of the issues discussed is given below:
Pre-test seismic assessment of the building
• The building was designed to withstand only gravity loads and not in compli-ance with modern seismic codes. Smooth bars were utilised for the reinforcement.Members were provided with a minimal amount of stirrups hence the core con-crete is virtually unconfined. Columns are slender and more flexible than beams,and beam-column connections do not have stirrups.
• Static pushover analyses were performed to obtain the capacity curve of the build-ing which allows estimation of elastic and inelastic stiffness, yield displacement,ultimate displacement, peak base shear, ductility, storey mechanism and quali-tative estimation of the p−∆ effect. The deformational capacity of the buildingwas assessed by marking various damage states on the capacity curves in fourdifferent loading directions.
November 30, 2004 2:30 WSPC/124-JEE 00190
Analytical Assessment of an Irregular RC Frame for Full-Scale 3D PsD Testing — Part I 125
• Dynamic response history analyses were performed for assessment purposes suchas estimation of peak displacement demand, amount of torsion and the determi-nation of the earthquake scenario for test execution.
• Pre-test analyses showed that the building, which does not satisfy the require-ments of seismic design provisions, suffers from the following deficiencies:(i) insufficient confinement increases the risk of collapse due to column crushing,(ii) a strong-beam weak-column condition results in the formation of a weakstorey mechanism and (iii) poor connection detail causes large shear deformationat beam-column joint.
• In the x direction, plastic hinges are concentrated at the critical storey, whichresults in a weak storey mechanism. The weak storey is the second storey in theanalytical models without rigid links. The first storey is the weak floor in themodels with rigid links.
• When the load is applied to the structure in the y direction, the larger columnC6 prevents plastic hinges from occurring at the critical storey. Even after thelarger column C6 develops a plastic hinge at the bottom; it still distributes theloads over the entire building.
• Pre-test models without rigid links (Model #1 and Model #3) provided a goodestimation of the test results.
• On the whole, the agreement between analysis and test results on the globalresponse level was very good. The analytical results were invaluable for steeringthe test sequence.
Effect of torsion
• Extensive pre-test analysis was performed to investigate the effect of irregulari-ties on the response of the test structure. Since torsional modes are fundamen-tally mixed direction modes, pushover analysis cannot predict torsional responseaccurately. Hence, dynamic response history analysis is a more appropriate anal-ysis method to estimate the response of an asymmetric building.
• Torsion causes variation in the displacements of columns within a floor. Addi-tional displacement due to torsion should be considered for accurate damageassessment of each member. Thus damage assessment based on the interstoreydrift at the centre of a plan is inadequate as a damage measure of torsionallyimbalanced structures.
Interactions between the analytical assessment and the test preparation
• The analytical model was continuously updated as information on the test struc-ture and its constituent materials became available. Such synergy between theanalytical and the experimental investigation teams is an essential feature of largeand costly tests.
• The high irregularity in plan renders extensive pre-test analysis essential to con-strain the response to a level of damage that meets the purpose of the test.

November 30, 2004 2:30 WSPC/124-JEE 00190
126 S.-H. Jeong & A. S. Elnashai
The selection of earthquake scenarios was performed to satisfy three criteria:(i) collapse prevention, (ii) severe damage level for the acquisition of data onrepair and (iii) maximum torsion for understanding the response of an asymmetricbuilding.
Acknowledgements
The work presented above was undertaken as part of the Mid-America Earthquake(MAE) Center research project CM-4: Structural Retrofit Strategies (PrincipalInvestigator, Mary Beth Hueste, Texas A & M University, USA), which is under theConsequence Minimization Thrust Area, lead by Barry Goodno and Steve French(Georgia Institute of Technology, USA). The MAE Center is a National ScienceFoundation Engineering Research Center (ERC), funded through contract referenceNSF Award No. EEC-9701785. The detailed configuration and experimental resultsof the SPEAR test structure were provided by the partners of the SPEAR projectfunded by the European Union. Thanks are due to Professors P. Pinto, M. Fardis,M. Calvi and Drs. E. Carvalho and P. Negro. The cooperation of members of theEU Joint Research Centre, Ispra, especially Elena Mola, is gratefully acknowledged.The authors benefited from discussion of the Principal Investigator of the project.The paper was expertly proof-read by Patricia Cutsinger, Administration Managerat the CEE Department at UIUC.
References
ACI 318-99 [1999] Building Code Requirements for Structural Concrete and Commentary,American Concrete Institute.
Bentz, E. C. [2000] “Sectional analysis of reinforced concrete members,” PhD Thesis,Department of Civil Engineering, University of Toronto.
Bracci, J. M., Reinhorn, A. M. and Mander, J. B. [1992a] “Seismic resistance of reinforcedconcrete frame structures designed only for gravity loads: Part I — Design and prop-erties of a one-third scale model structure,” Technical Report NCEER-92-0027, StateUniversity of New York, Buffalo.
Bracci, J. M., Reinhorn, A. M. and Mander, J. B. [1992b] “Seismic resistance of reinforcedconcrete frame structures designed only for gravity loads: Part III — Experimentalperformance and analytical study of a structural model,” Technical Report NCEER-92-0029, State University of New York, Buffalo.
Broderick, B. M. and Elnashai, A. S. [1994] “Seismic resistance of composite beam-columnsin multi-story structures, Part 2: Analytical model and discussion of results,” Journalof Construction Steel Research 30(3), 231–258.
Calvi, G. M., Magenes, G. and Pampanin, S. [2002] “Relevance of beam-column jointdamage and collapse in RC frame assessment,” Journal of Earthquake Engineering6(SI.1), 75–100.
Campos-Costa, A. and Pinto, A. V. [1999] “European seismic hazard scenarios — Anapproach to the definition of input motions for testing and reliability assessment ofcivil engineering structures,” JRC Special Publication No. X.99.XX, JRC, Ispra, Italy.
CEB-FIP Model Code-1990 [1993] Design Code Comite EURO-International Du Buton,American Society of Civil Engineers.
November 30, 2004 2:30 WSPC/124-JEE 00190
Analytical Assessment of an Irregular RC Frame for Full-Scale 3D PsD Testing — Part I 127
Chopra, A. K. and Goel, R. K. [2002] “A modal pushover analysis procedure for estimatingseismic demands for buildings,” Earthquake Engineering and Structural Dynamics31(3), 561–582.
El-Attar, A. G., White, R. N. and Gergely, P. [1997] “Behavior of gravity load designedreinforced concrete buildings subjected to earthquake,” ACI Structural Journal94(2), 133–145.
Elnashai, A. S., Papanikolaou, V. and Lee, D. -H. [2002] ZEUS-NL User Manual,Mid-America Earthquake Center (MAE) Report.
Elnashai, A. S. [2002] “Do we really need inelastic dynamic analysis?,” Journal of Earth-quake Engineering 6(1), 123–130.
Fardis, M. N. [1994] “Analysis and design of reinforced concrete buildings according toEurocode 2 and 8,” Configuration 3, 5 and 6, Reports on Prenormative Research inSupport of Eurocode8.
FEMA356 [2000] Prestandard and Commentary for the Seismic Rehabilitation of Build-ings, Federal Emergency Management Agency, Washington, D.C.
Gupta, B. and Kunnath, S. K. [2000] “Adaptive spectra-based pushover procedure forseismic evaluation of structures,” Earthquake Spectra 16(2), 367–391.
Hernandez-Montes, E., Kwon, O.-S. and Aschheim, M. A. [2004] “An energy-based for-mulation for first- and multiple-mode nonlinear static (pushover) analyses,” Journalof Earthquake Engineering 8(1), 69–88.
Hognestad, E. [1951] “A study of combined bending and axial load in reinforced con-crete members,” Bulletin 399, University of Illinois Engineering Experiment Station,Urbana, Illinois.
Izzuddin, B. A. and Elnashai, A. S. [1989] “ADAPTIC — A program for adaptive largedisplacement elastoplastic dynamic analysis of steel, concrete and composite frames,”Research Report ESEE Report No. 89/7, Imperial College, London.
Jeong, S.-H. and Elnashai, A. S. [2004a] “Analytical assessment of an irregular RC fullscale 3D test structure,” Mid-America Earthquake Center (MAE) Report, CD Release04-03.
Jeong, S. -H. and Elnashai, A. S. [2004b] “Analytical and experimental seismic assess-ment of irregular RC buildings,” Proc. of the 13th World Conference on EarthquakeEngineering, Vancouver, BC Canada, No. 113.
Jeong, S.-H. and Elnashai, A. S. [2005] “Analytical assessment of an irregular RC framefor full-scale 3D pseudo-dynamic testing — part II: Condition assessment and testdeployment,” submitted to Journal of Earthquake Engineering, May.
Kappos, A. J. [1997] “A comparative assessment of R/C structures designed to the 1995Eurocode 8 and the 1985 CEB seismic code,” The Structural Design of Tall Buildings6(1), 59–83.
Kunnath, S. K., Hoffmann, G., Reinhorn, A. M. and Mander, J. B. [1995] “Gravity load-designed reinforced concrete buildings. Part I: Seismic evaluation of existing construc-tion,” ACI Structural Journal 92(3), 343–354.
Lee, H. S and Woo, S. W. [2002] “Seismic performance of a 3-story RC frame in a low-seismicity region,” Engineering Structures 24(6), 719–734.
MacGregor, J. G. [1997] Reinforced Concrete Mechanics and Design, 3rd edn. (PrenticeHall, Inc., New Jersey).
Mander, J. B., Priestley, M. J. N. and Park, R. [1988] “Theoretical stress-strain model forconfined concrete,” ASCE Journal of Structural Engineering 114(8), 1804–1826.
Martinez-Rueda, J. E. and Elnashai, A. S. [1997] “Confined concrete model under cyclicload,” Materials and Structures 30(197), 139–147.
Mwafy, A. M. [2001] “Seismic performance of code-designed RC buildings,” Ph.D. Thesis,Imperial College, University of London, London.

November 30, 2004 2:30 WSPC/124-JEE 00190
128 S.-H. Jeong & A. S. Elnashai
Mwafy, A. M. and Elnashai, A. S. [2001] “Static pushover versus dynamic collapse analysisof RC buildings,” Engineering Structures 23(5), 407–424.
Negro, P., Mola, E., Molina, J. and Magonette, G. [2004] “Full scale bi-directional PSDtesting of a torsionally imbalanced three storey non-seismic RC Frame,” 13th WorldConference on Earthquake Engineering, Vancouver, Canada, Paper 968.
Pinho, R. and Elnashai, A. S. [2001] “Dynamic collapse testing of a full-scale four storyRC frame,” ISET Journal of Earthquake Technology 37(SI.4), 143–163.
Pinto, A. V., Verzeletti, G., Molina, J., Varum, H., Pinho, R. and Coelho, E. [2002]“Pseudo-dynamic tests on non-seismic resisting RC frames (bare and selective retrofitframes),” Report EUR 20244, European Commission, Joint Research Centre, IPSC,ELSA, Ispra, Italy.
Priestley, M. J. N., Verma, R. and Xiao Y. [1994] “Seismic shear strength of reinforcedconcrete columns”, ASCE Journal of Structural Engineering 120(8), 2310–2329.
Rossetto, T. and Elnashai, A. S. [2003] “Derivation of vulnerability functions for European-type RC structures based on observational data,” Engineering Structures 25(10),1241–1263.
SEAOC [1995] Performance Based Seismic Engineering of Buildings, Vision 2000 Com-mittee, Structural Engineers Association of California, Sacramento, California.
Sozen, M. A. [1981] “Review of earthquake response of RC buildings with a view todrift control,” State-of-the-Art in Earthquake Engineering (Kelaynak Press, Ankara,Turkey).
Uniform Building Code-1997 Edition [1997] International Conference of Building Officials,Whittier, California.
Walker, S. [2001] “Seismic performance of existing reinforced concrete beam-columnjoint,” MS. Thesis, Department of Civil and Environmental Engineering, Universityof Washington, Seattle, Washington.
View publication statsView publication stats