analysts’ suspicions of earnings management and conference
TRANSCRIPT

Analysts’ Suspicions of Earnings Management and Conference Call Narratives
Yuan Ji Montana State University [email protected]
Oded Rozenbaum
The George Washington University [email protected]
Current draft: November 20, 2018
Abstract The Q&A section of earnings conference calls allows participants to ask questions and resolve uncertainties. We examine whether conference call participants question managers when they obtain signals that discretionary expenses contributed to firms meeting or narrowly beating analysts’ expectations. We observe more questions on discretionary expenses when abnormal discretionary expenses are lower only for firms that meet or narrowly beat analysts’ expectations. We also find that there are more questions on discretionary expenses when discretionary expenses are lower compared to both the prior and subsequent year, again, only for firms that meet or narrowly beat analysts’ expectations. We then examine the consequences of analysts’ suspicions of real earnings management. We find that questions on discretionary expenses are associated with lower market reaction and analysts’ revisions for firms that meet or narrowly beat analysts’ expectations. These results are stronger when firms’ cost of engaging in real earnings management and abnormal discretionary expenses are lower. Our findings suggest that analysts identify signals of real earnings management, inquire about them at conference calls, and update their expectations accordingly. We appreciate the comments and suggestions of Yakov Amihud, Dan Amiram, Kevin Butler (discussant), Agnes Cheng, Dina Elmahdy (discussant), Chris Jones, Avner Kalay, Itay Kama, Sok-Hyon Kang, Jeffery Ng, Linda Parsons, Mikhail Pevzner, James Potepa, Shiva Rajgopal, Katherine Schipper, Liang Tan, Kyle Welch, Jenny Zha-Geidt, Youli Zou, and of workshop participants at Montana State University, Tel Aviv University, The George Washington University, University of Baltimore, 2017 Hong Kong Junior Accounting Faculty Conference, 2017 AAA Mid-Atlantic regional meeting, and at the 2017 AAA annual meeting. All errors are our own.

1
1. Introduction
Managers face pressure to meet expectations because failure to do so may lead to adverse
outcomes ranging from lower compensation to termination (Matsunaga and Park 2001; Farrell and
Whidbee 2003). Analysts’ consensus estimates serve as an important performance benchmark for
managers. Multiple studies document that missing analysts’ expectations can result in a reduction
in firm value (Bartov, Givoly, and Hayn 2002; Kasznik and McNichols 2002; Skinner and Sloan
2002) and, therefore, managers have strong incentives to manage earnings to meet or beat analysts’
expectations. Consequently, the literature categorizes firms that meet or narrowly beat analysts’
expectations as suspects of earnings manipulation (Degeorge, Patel, and Zeckhauser 1999).1
However, there is no evidence in the literature on the actions that investors take to resolve their
suspicions of earnings manipulations. In this study, we examine whether investors, when obtaining
signals that a firm managed earnings to meet or narrowly beat analysts’ expectations, raise their
concerns during the question and answer (Q&A) section of earnings conference calls.
Graham, Harvey, and Rajgopal (2005) find in their survey of CFOs that 79.9% of
respondents agree or strongly agree that their firm may lower discretionary expenses to meet
analysts’ expectations. Motivated by this finding, we use conference call transcripts to examine
whether analysts raise questions on discretionary expenses when they obtain signals that
discretionary expenses were used to meet or narrowly beat analysts’ expectations and the
consequences that are associated with those questions.2,3
1 Additional studies that use meeting or beating analysts’ expectations as a proxy for earnings management include, but are not limited to, Dhaliwal, Gleason, and Mills (2004); Doyle, Jennings, and Soliman (2013); Baber, Fairfield, and Haggard (1991); Roychowdhury (2006); Bergstresser, Desai, and Rauh (2006); and Matsumoto (2002). 2 Throughout the study, discretionary expenses refer to selling, general and administrative (SG&A), marketing, and research and development (R&D) expenses. 3 Different types of investors may raise questions during conference calls. However, since Jung, Wong, and Zhang (2018) find that sell-side equity analysts ask the majority of questions at conference calls, we refer to them in the text.

2
Firms usually initiate conference calls in proximity to earnings announcements. Managers
use conference calls to articulate on the firm’s performance. Investors, mostly sell-side analysts,
use the Q&A portion of the conference call to probe managers and obtain further clarifications on
items in the earnings announcement and on information provided in the presentation portion of the
conference call. Sell-side analysts are sophisticated investors with in-depth knowledge of the firms
that they cover (Amiram, Owens, and Rozenbaum 2016). We posit that sell-side analysts are more
diligent when firms meet or narrowly beat analysts’ expectations and that they seek signals that
discretionary expenses were cut to meet expectations in an unsustainable way. We further argue
that if analysts observe signals that make them question the sustainability of reported discretionary
expenses, two outcomes will unfold. First, analysts will ask for clarifications from the management
on those expenses during the Q&A portion of the conference call. For example, in Novo Nordisk’s
conference call held on August 6, 2015, Tim Race from Deutsche Bank questions the low R&D
expense: “…could you just help us understand how R&D may pick up in the short-term or not,
and also just where you think a sustainable level is going forward?”4 Second, analysts (and
investors) will lower their expectations of the firm’s future performance since they suspect that
discretionary expenses may increase in the future and, therefore, current earnings are
unsustainable.
There are several reasons for not observing more questions on discretionary expenses in
earnings conference calls when analysts observe signals that a firm opportunistically deflated
discretionary expenses to meet or narrowly beat analysts’ expectations. First, investors may raise
more questions on complex expense items and not because of suspicions of manipulation. Second,
Mayew (2008) finds that firms have discretion in choosing the analysts that ask questions during
4 http://seekingalpha.com/article/3419376-novo-nordisk-a-s-nvo-ceo-lars-rebien-sorensen-on-q2-2015-results-earnings-call-transcript

3
earnings conference calls. It is possible that firms use their discretion to block questions on items
they have manipulated (Cohen, Lou, and Malloy 2013). Third, if investors cannot observe
indicators of earnings manipulations in earnings announcements, they will not be able to raise
relevant questions at earnings conference calls. Therefore, the association between analysts’
questions on discretionary expenses during conference calls and observable signals that those
expenses were lowered to meet or just beat analysts’ expectations is an empirical question.
It is also unclear whether analysts’ questions on discretionary expenses at earnings
conference calls when firms meet or narrowly beat analysts’ expectations are associated with a
downward revision by analysts and investors of their expectations for the firm’s future
performance. Investors may raise more questions on complex expense items and not because of
suspicions of manipulation. Further, the response of managers to questions about the sustainability
of current earnings may alleviate those concerns.5
To study these research questions, we read over 200 conference call transcripts to create a
word dictionary for discretionary expenses. We then count the number of times these words appear
in questions to the management during the earnings conference call and scale the values by the
total length of all questions.6 We use this measure to examine whether analysts ask questions on
discretionary expenses when there are observable signals that discretionary expenses are deflated.
We expect the association between our measure of analysts’ questions on discretionary expenses
5 In untabulated analysis, we include the tone of the management’s response as an additional explanatory variable in the model. We find a positive and marginally significant (insignificant) association between the tone of the management’s response and the market reaction (analysts’ revision). These results suggest that managers can sometimes alleviate analysts’ concerns that discretionary expenses were used to meet or just beat analysts’ expectations. 6 We also examine the association between the tone of analysts’ questions and observable signals that the firm opportunistically lowered discretionary expenses to meet or just beat expectations. We do not have predictions for this association because even if analysts suspect that the firm manipulated discretionary expenses, they may be careful in the way that they frame the question since wrongly accusing a firm of earnings manipulations can have an adverse effect on the analyst (McNichols and O’Brien 1997; Mayew 2008).

4
and observable signals that discretionary expenses are deflated to be the strongest when firms meet
or narrowly beat analysts’ expectations, since managers face strong incentives to meet that
benchmark. We therefore examine three different samples throughout our analyses: (1) firms that
meet or narrowly beat analysts’ expectations, (2) firms that just miss analysts’ expectations, and
(3) firms that beat analysts’ expectations by a wide margin.7 We choose firms that just miss
analysts’ expectations as a control group because firms that manipulated discretionary expenses to
meet or just beat analysts’ expectations would have belonged to the group of firms that just miss
analysts’ expectations without the manipulation. Thus, we believe that firms that meet or just beat
analysts’ expectations are most comparable to firms that just miss analysts’ expectations.
However, since the group of “just miss” firms may be populated by firms that also manipulated
discretionary expenses but failed to meet expectations (Bhojraj, Haribar, Picconi, and McInnis
2009; Bird, Karolyi, and Ruchti 2018), we include firms that beat analysts’ expectations by a wide
margin as an additional control group.8
We find that the frequency of questions on discretionary expenses is higher for firms that
meet or narrowly beat analysts’ expectations compared to firms that just miss or beat analysts’
expectations. We also observe a negative association between the frequency of questions on
discretionary expenses and abnormal discretionary expenses only when firms meet or narrowly
beat analysts’ expectations. Lastly, we find that the frequency of questions on discretionary
expenses in earnings conference calls is higher when current discretionary expenses are lower
7 We define firms with an actual EPS that is between zero and 5 cents per share higher than the median analysts’ consensus estimate as firms that meet or just beat analysts’ expectations. We further define firms that miss analysts’ consensus EPS estimate by up to five cents per share as “just miss” firms and firms that beat analysts’ consensus EPS estimate by a range of 5 to 10 cents per share as “beat” firms. 8 Bird et al. (2018) find that more than 86 percent of manipulating firms belong to the “just beat” group while slightly more than 11 percent of all manipulating firms belong to the “just miss” group. We believe that the small percentage of manipulating firms that belong to the “just miss” group allows it to serve as a meaningful control group. Furthermore, the existence of manipulating firms in the “just miss” group biases against finding significant differences between the “just beat” and “just miss” group of firms.

5
compared to both the prior and subsequent year only for firms that meet or narrowly beat analysts’
expectations. Those findings collectively suggest that analysts’ questions on discretionary
expenses at earnings conference calls are indicative of their suspicions that discretionary expenses
were opportunistically lowered to meet or narrowly beat analysts’ expectations.
Next, we examine that market implications associated with a higher frequency of questions
on discretionary expenses when firms meet or narrowly beat analysts’ expectations. In univariate
tests, we find that, on average, cumulative abnormal returns (CAR) in the three days around
conference calls are 0.32 percent lower and analysts’ revisions of their EPS estimates are 6.64
percent lower when analysts ask questions on discretioanry expenses during conference calls of
firms that meet or narrowly beat expecations. We do not observe comparable results for the control
group of firms that just miss or beat analysts’ expectations. These results provide support that our
findings are attributed to suspecions of discretionary expense management and not to the complex
nature of those expense items. If the results were driven by the inherent complexity of those items,
we would have expected to observe an attenuated market reaction and lower analysts’ revisions
when there are more questions on discretionary expenses, regardless of whether a firm meets or
narrowly beats analysts’ expectations. We obtain similar inferences in multivariate analysis and
further find that the tone of analysts’ questions is positively associated with the revisions of their
EPS estimates and the market reaction to the conference call.
An alternative interpretation of our results is that the attenuated market reaction and
analysts’ revisions when analysts ask questions on discretionary expenses may be attributed to
adverse economic changes that result in general cost cutting and not to suspicions of discretionary
expense manipulations. We perform several tests to alleviate this concern. First, we find that
discretionary expenses are lower compared to the previous and subsequent year when analysts ask

6
questions on discretionary expenses only for firms that meet or just beat analysts’ expectations.
These results suggest that those firms opportunistically decrease discretionary expenses (Vorst
2016). We do not find comparable results for our control sample of firms that narrowly miss or
beat analysts’ expectations, which strengthens the validity of our inferences. Second, if the results
were attributed to adverse economic changes and general cost cutting, we would expect to observe
an attenuated market reaction and lower analysts’ revisions when the overall length of analysts’
questions is higher; we do not observe results that are consistent with this hypothesis. Third,
Skinner (1994) argues that firms are more likely to disclose bad news. Therefore, if the results we
observe were attributed to adverse economic changes, we would also expect to observe lower
market reaction and analysts’ revisions when there is increased discussion on discretionary
expenses during the management presentation portion of earnings conference calls. We fail to find
such associations, which further reduces the likelihood that this alternative explanation drives our
results.9
We conduct additional cross-sectional tests to validate the inferences we draw from our
findings. Prior studies document that firms use real earnings management when the cost to do so
is low (e.g., Cohen, Day, and Lys 2008; Zang 2012). We partition our sample based on Zang’s
(2012) measure of the cost of engaging in real earnings management. Consistent with our
expectations, we find a stronger negative association between analysts’ questions on discretionary
expenses and both the market reaction and analysts’ revisions (for firms that meet or just beat
analysts’ expectations) when the cost of engaging in real earnings management is lower.
9 Analysts’ questions on discretionary expenses may be attributed to firm-specific characteristics. In robustness tests, we pool all sample groups together and include a two-way interaction between the sample group and our measure of analysts’ questions on discretionary expenses, as well as replace the industry fixed effects with firm fixed effects. Inferences remain unchanged.

7
Second, analysts may question the sustainability of discretionary expenses after evaluating
the discretionary expenses metrics in the earnings announcement. Therefore, we follow Cohen and
Zarowin (2010) to construct a measure of abnormal discretionary expenses. We then partition the
sample of firms that meet or just beat analysts’ expectations into two groups, with high and low
abnormal discretionary expenses. We find that the negative association between analysts’
questions on discretionary expenses and the market reaction and analysts’ revisions is stronger for
firms that meet or just beat analysts’ expectations and have low abnormal discretionary expenses.
We perform additional analyses to validate our findings. First, we decompose discretionary
expenses into R&D, advertising, and SG&A expenses. We find a negative association between
analysts’ questions on each one of those expenses and their abnormal value for firms that meet or
just beat analysts’ expectations. We also find a significantly negative association between analysts’
questions on R&D expenses and both the market reaction and analysts’ revisions only when firms
meet or just beat analysts’ expectations. We do not find significant results for advertising expenses.
The lack of results may be attributed to the lower economic significance of advertising expenses
to many firms or because some firms do not present advertising expenses as a separate line item
on the income statement. Lastly, we find a negative association between the number mentions of
SG&A expenses in analysts’ questions and the market reaction, but not with analysts’ revisions.
In our final test, we manually match the names of the analysts on the conference calls with
their estimates that we obtain from the I/B/E/S detail file. Using this data, we find that, on average,
all analysts on the conference call revise their estimates downwards at the same magnitude as the
revision of the analysts that ask questions on discretionary expenses. These results, together with
the negative market reaction associated with analysts’ questions on discretionary expenses, suggest

8
that questions on discretionary expenses reflect the general suspicion of analysts and investors and
are not limited to the suspicions of the asking analysts.
Our study makes multiple contributions to the literature. First, our study extends the
literature on the informativeness of earnings conference calls10 and provides evidence on the
information gathering efforts by analysts. Prior studies suggest that investors rely on observable
evidence to identify accounting manipulations (Bartov et al. 2002; Defond and Park 2001). In
addition, Lee (2016) finds that market prices react negatively when managers respond to questions
in the Q&A portion of conference calls from a prepared script. We extend the literature by
documenting the intervention of conference call participants to acquire information when they
suspect firms manipulated discretionary expenses to meet or just beat analysts’ expectations.
Tasker (1998) documents a substitution effect between the information content of earnings
announcements and earnings conference calls. Our study suggests that when firms meet or
narrowly beat analysts’ expectations, analysts use earnings conference calls to complement the
information they obtain from earnings announcements.
Our study also contributes to the literature on earnings management. Many studies use the
rule of whether firms meet or narrowly beat analysts’ expectations as a proxy for earnings
management.11 Our study suggests that this proxy is subject to type I errors (i.e., falsely rejecting
the null of no earnings management). Our measure of the number of mentions of discretionary
expenses in analysts’ questions during the Q&A portion of conference calls can be used to improve
the identification of firms that are suspected of earnings management using discretionary expenses.
10 See, for example, Brown, Hillegeist, and Lo (2004); Bowen, Davis, and Matsumoto (2002); Chen, Nagar, and Schoenfeld (2018); Frankel, Johnson, and Skinner (1999); and Matsumoto, Pronk, and Roelofsen (2011). 11 e.g., Barua, Lin, and Sbaraglia 2010; Doyle et al. 2013; Haribar, Jenkins, and Johnson 2006.

9
2. Motivation and research questions
Analysts’ expectations are an important benchmark for managers. In a survey by Graham
et al. (2005), 73.5% of responding CFOs claim that analysts’ consensus forecasts are an important
benchmark they seek to achieve. The responding CFOs further claim that meeting earnings
benchmarks help them build credibility with the capital markets (86.3% of respondents) and
maintain or increase stock price (82.2% of respondents). Consistent with this evidence, multiple
studies document a negative market reaction when firms miss analysts’ expectations (Bartov et al.
2002; Kasznik and McNichols 2002; Skinner and Sloan 2002). As a result, managers face constant
pressure to meet analysts’ expectations. Prior studies find that missing analysts’ expectations can
lead to adverse outcomes to managers, ranging from lower compensation to termination
(Matsunaga and Park 2001; Farrell and Whidbee 2003). The pressure to meet analysts’
expectations may lead managers to pursue real and accrual-based earnings management. In the
survey by Graham et al. (2005), 79.9% of responding CFOs claim that their firm decreases
discretionary spending to meet benchmarks. Motivated by this result, we focus this study on
discretionary expense manipulations to meet or just beat analysts’ expectations.12
The strong incentives of managers to meet or narrowly beat earnings expectations are likely
known to stock market participants.13 Keung, Lin, and Shih (2010) find that when firms meet or
just beat earnings expectations, stock market participants assess the likelihood that the firm
engaged in earnings management to reach that benchmark and incorporate this assessment in
determining the firm’s value. Similarly, AU Section 316 (Consideration of Fraud in Financial
12 Graham et al. (2005) also find that approximately 40% of respondents claim that their firm would inflate revenues by booking revenues early or providing incentives to customers to buy more in the current period. While exploring the role of revenue manipulations is interesting, we do not pursue this avenue for technical reasons. Discussions on revenues in conference calls generally go into specifics of product lines and revenue sources. Therefore, it is difficult to identify a comprehensive dictionary of words that represent revenues. Notwithstanding, we tested revenues as well and did not find significant results. However, we cannot rule out that the lack of results is due to a misspecified proxy. 13 Stock market participants include but are not limited to investors, regulators, auditors, and sell-side analysts.

10
Statement Audit) requires the auditor to consider managers’ incentives to meet analysts’
expectations when assessing the audit risk (p. 1749). As a result, a large number of studies identify
firms that meet or narrowly beat analysts’ expectations as suspects of earnings manipulation.14
In this study, we argue that sell-side analysts scrutinize the financial performance of firms
that meet or just beat analysts’ expectations to assess whether they managed earnings and whether
current period’s performance is sustainable. Consequently, analysts will look for observable
signals of earnings management. We further argue that earnings conference calls provide
opportunities for sell-side analysts to inquire about the sustainability of current period’s
performance. To the extent that conference call participants observe signals that discretionary
expenses were deflated to meet or just beat analysts’ expectations, they can inquire about the
sustainability of those expenses during earnings conference calls.
There are multiple reasons for not observing more questions on discretionary expenses
when analysts observe signals that discretionary expenses were lowered to meet expectations.
First, Mayew (2008) finds that firms have discretion to choose the analysts that ask questions at
conference calls. Therefore, it is possible that firms would use their discretion to block questions
on items they manipulated (Cohen et al. 2013). Second, if analysts cannot observe indicators of
earnings manipulations in earnings announcements, they will not be able to raise relevant questions
during conference calls. Third, analysts may raise more questions on complex expense items, and
not because of suspicions of manipulations. Thus, it is unclear, ex ante, whether analysts ask more
questions on discretionary expenses when they observe signals that discretionary expenses were
opportunistically lowered to meet expectations.
14 See, for example, Baber, Kang, and Li (2011); Black and Christensen (2009); Cook, Huston, and Omer (2008); Caskey and Ozel (2017); and Doyle et al. (2013).

11
H1: There are no more questions on discretionary expenses at earnings conference calls when analysts observe signals that discretionary expenses were lowered to meet or narrowly beat analysts’ expectations.
Keung et al. (2010) find that the market reaction and analysts’ revisions following earnings
announcements are attenuated when firms meet or just beat analysts’ expectations. These results
suggest that when firms meet or just beat analysts’ expectations, investors suspect that current
period’s performance is not sustainable, and incorporate it in assessing the firm’s value.15 If
conference call participants raise questions on discretionary expenses when they suspect that those
expenses were opportunistically lowered to meet or beat analysts’ expectations, we expect to
observe a negative association between the number of questions on discretionary expenses in
earnings conference calls and the magnitude of the market reaction and analysts’ revisions. This
reasoning also implies that we should not observe comparable results for firms that just miss or
beat analysts’ expectations. Finding comparable results for firms that do not meet or narrowly beat
analysts’ expectations may open the results to additional alternative interpretations, such as the
inherent complexity of discretionary expenses or adverse outlook for the firm.
Analysts’ concerns may be alleviated following the firm’s response to the questions. If so,
the frequency of questions on discretionary expenses during conference calls will not be associated
with either the market reaction or analysts’ revisions. Therefore, it is unclear whether there is an
association between the frequency of questions on discretionary expenses and the market and
analysts’ reaction to the conference call.
H2: The frequency of questions on discretionary expenses during earnings conference calls when firms meet or narrowly beat analysts’ expectations is not associated with the market reaction and analysts’ revisions.
15 While Keung et al. (2010) find that investors incorporate their suspicions of earnings management into firm value, Bhojraj et al. (2009) find that suspicions of earnings management are not fully priced.

12
3. Research design
3.1 Identifying mentions of discretionary expenses during earnings conference calls
Roychowdhury (2006) and Graham et al. (2005) document that firms cut discretionary
costs, such as R&D and SG&A, to meet or beat earnings expectations. To test our research
questions, we count the number of mentions of discretionary expenses in questions asked during
the Q&A portion of conference calls. To do so, we read over 200 conference call transcripts and
identified a vocabulary of words that relate to discretionary expenses. We proxy for the number of
mentions of discretionary expenses by counting the number of times “R&D”, “research and
development”, “G&A”, “SG&A”, “selling, general and administrative”, “general and
administrative”, “marketing expenses”, and “advertising expenses” appear in questions that are
asked during the Q&A portion of earnings conference calls. We then scale this value by the log
transformation of the total number of words used in all questions. In addition, we control for the
tone of the questions by measuring the difference between the sum of positive tone words and
negative tone words in analysts’ questions scaled by the total length of the questions. We
categorize positive and negative tone words using Loughran and McDonald’s (2011) dictionary.
Detailed variable definitions can be found in the Appendix.
3.2 Testing Hypothesis 1
H1 examines whether analysts ask more questions on discretionary expenses when they
suspect that discretionary expenses were temporarily lowered to meet or narrowly beat analysts’
expectations. Analyst’s suspicions can arise if they observe irregularities in discretionary expenses,
i.e., discretionary expenses are abnormally low. We follow Cohen and Zarowin (2010) in

13
calculating abnormal discretionary expenses. First, we estimate normal levels of discretionary
expenses using the following model, by industry and year:
Disc.Expensesi,t = a01 + a1Salesi,t-1 + εi.t (1)
where all variables are scaled by lagged total assets. We then subtract the predicted values from
actual discretionary expenses to obtain abnormal discretionary expenses (AbDisc.Expenses). Next,
we regress abnormal discretionary expenses on the number of mentions of discretionary expenses
in analysts’ questions and additional control variables.
AbDisc.Expensesi,t = b0 + b1Q_Disc.Expensesi,t + b2Q_Tonei,t + b3Q_Lengthi,t + b4BTMi,t + b5Sizei,t + b6Lossi,t + b7Earni,t + b8AltmanZi,t + b9MarketSharei,t + b10Inst.Ownershipi,t + b11MTRi,t + ∑IndustryFixedEffects + ∑YearFixedEffects + ei,t (2)
Q_Disc.Expenses is our variable of interest, which measures the number of mentions of
discretionary expenses in analysts’ questions during earnings conference calls. A negative
coefficient estimate on Q_Disc.Expenses implies that analysts ask more questions on discretionary
expenses when abnormal discretionary expenses are lower. Since managers have incentives to
manipulate discretionary expenses downwards to meet or narrowly beat analysts’ expectations, a
negative coefficient estimate for firms that meet or narrowly beat expectations is consistent with
analysts asking questions on discretionary expenses when they suspect that those expenses were
opportunistically lowered. We estimate Eq. (2) using three different samples: (1) firms that meet
or just beat analysts’ expectations by up to 5 cents per share, (2) firms that miss analysts’
expectations by up to 5 cents per share, and (3) firms that beat analysts’ expectations by 5 to 10
cents per share. The group of “just miss” firms may be populated by firms that also manipulated
discretionary expenses but failed to meet expectations (Bhojraj et al. 2009; Bird et al. 2018), which
may bias our tests against finding meaningful differences between “just beat” and “just miss”
firms. Bird et al. (2018) find that more than 86 percent of manipulating firms belong to the “just

14
beat” group while slightly more than 11 percent of all manipulating firms belong to the “just miss”
group. Therefore, we believe that the small percentage of manipulating firms that belong to the
“just miss” group allows it to serve as a meaningful control group. In addition, we include firms
that were able to beat analysts’ expectations by a wide margin as an additional control group. We
control for the tone and the length of analysts’ questions (with Q_Tone and Q_Length,
respectively). In addition to conference call characteristics, we also include firm-level variables,
including book-to-market (BTM), firm size (Size), earnings before extraordinary items (EARN),
the firm’s market share (MarketShare), institutional ownership (Inst.Ownership) and the firm’s
marginal tax rate (MTR). Firm performance is measured using Loss and AltmanZ. Finally, industry
and year fixed effects are also included in the model.
We proxy for analysts’ suspicions that a firm opportunistically lowered discretionary
expenses to meet or just beat expectations with two additional measures. The first measure is the
change in next fiscal year’s discretionary expenses compared to current year’s level
(∆Disc.Expensest+1). If firms opportunistically lower discretionary expenses to meet or just beat
analysts’ expectations in year t, those expenses are likely to increase in year t+1 (Vorst 2016).
While next year’s discretionary expenses are not known at the time of the earnings conference call,
analysts’ suspicions of a downward manipulation of discretionary expenses imply that
discretionary expenses may increase in the future. Analysts’ suspicions can arise if they observe a
significant decrease in discretionary expenses compared to the prior year. Therefore, we use
current fiscal year’s change in discretionary expenses relative to the prior year (∆Disc.Expensest)
as an additional proxy. We use those two variables as the dependent variables in the following
model:

15
∆Disc.Expensesi,t+1 = c0 + c1Q_Disc.Expensesi,t + c2P_Disc.Expensesi,t + c3Q_Lengthi,t + c4P_Lengthi,t + c5Participantsi,t + c6ForecastDispersioni,t
+ c7BTMi,t + c8Sizei,t + c9ROAi,t + c10Lossi,t + ∑IndustryFixedEffects + ∑YearFixedEffects + ei,t (3)
A positive (negative) association between Q_Disc.Expenses and ∆Disc.Expensest+1
(∆Disc.Expensest) when firms meet or narrowly beat the analysts’ consensus estimate is consistent
with analysts asking questions on discretionary expenses when they suspect discretionary expenses
were opportunistically lowered to meet expectations. As before, we estimate Eq. (3) using three
subsamples: (1) firms that meet or just beat expectations by up to 5 cents per share, (2) firms that
miss expectations by up to 5 cents per share, and (3) firms that beat expectations by 5 to 10 cents
per share. Control variables include the total length of the questions in the Q&A portion of the
conference call (Q_Length), the total number of words in the presentation portion (P_Length), the
number of analysts attending the conference call (Participants), analyst forecast dispersion
(Dispersion), book-to-market ratio (BTM), firm size (Size), return on assets (ROA) and firm
performance (Loss). We present details on the variables and their construction in the Appendix.
3.3 Testing Hypothesis 2
We test H2, the market implications associated with analysts’ questions on discretionary
expenses, using the following OLS regression:
CARi,t [Revisioni,t] = d0 + d1SURi,t + d2Q_Disc.Expensesi,t + d3Q_Tonei,t + d4Q_Lengthi,t + d5P_Disc.Expensesi,t + d6P_Tonei,t + d7P_Lengthi,t
+ d8Participantsi,t + d9ForecastDispersioni,t + d10BTMi,t + d11Sizei,t + d12ROAi,t + d13Lossi,t + ∑IndustryFixedEffects + ∑YearFixedEffects + ei,t (4)
CAR is the three-day cumulative abnormal returns around firm i’s conference call date for year t’s
results. Revision is the change in next year’s analysts’ consensus estimate immediately following
the conference call. SUR is firm i’s unexpected EPS in year t (compared to the prevailing analysts’

16
consensus estimate). We control for the tone of analysts’ questions (Q_Tone) since it can reflect
their perceptions of the firm’s performance. We also control for the number of mentions of
discretionary expenses in the management’s presentation portion of the conference call
(P_Disc.Expenses), the management’s tone (P_Tone) and the overall length of the presentation
portion of the conference call (P_Length). The rest of the variables are as previously defined. We
estimate Eq. (4) separately for our treatment group of firms that meet our just beat analysts’
expectations by up to 5 cents per share and our control groups of firms that just miss or beat
analysts’ expectations.16 A negative and significant coefficient estimate on Q_Disc.Expenses for
firms that meet or just beat analysts’ expectations is consistent with analysts and investors
incorporating into their assessment of future earnings their suspicions that current discretionary
expenses are not sustainable and likely increase in the future.
4. Sample selection and descriptive statistics
4.1 Sample selection
We download all available articles from the transcript center of SeekingAlpha.com, which
contains conference call transcripts from January 1st, 2005 to December 31st, 2016.17 We use
Python to remove articles that are either audio webcasts or non-earnings conference calls to ensure
our sample is restricted to conference call transcripts. Specifically, we require that the title of the
article includes either “earnings call transcript” or “earnings conference call transcript” and
16 In robustness tests, we pool all groups together and include a two-way interaction between the sample group and our measure of analysts’ questions on discretionary expenses, as well as replace the industry fixed-effects with firm fixed-effects. Inferences remain unchanged. 17 SeekingAlpha.com was founded in 2004 by former Wall Street analyst David Jackson. It provides articles and research that cover a wide range of investment portfolios. It also provides daily updated conference call transcripts, which are publicly available. While the data is available for the year 2000 onwards, prior to 2005 the data is scarce.
17
remove articles with the word “webcast” in the title. We also require each transcript to include
three parts: a participant list, a presentation portion, and a question-and-answer portion. We
download all transcripts in raw HTML format, which enables us to identify the main body of each
transcript and remove other content. We then collect the following information from each
transcript: the ticker symbol of the firm, the date of the conference call, the number of analysts
participating in the call, and two separate parts, one for the presentation portion and one for the
Q&A portion. We begin with an initial sample of 107,544 earnings conference call transcripts for
our sample period. However, as we focus on meet or beat analyst forecast behavior for the full
fiscal year, we remove conference call transcripts for the first three fiscal quarters.18 This process
reduces the sample size to 26,886 unique earnings conference call transcripts.
We use firm ticker symbols and fiscal period end to merge the conference call data with
the Compustat annual financial file and the CRSP daily stock file to obtain additional accounting-
based variables and returns data. We obtain analyst EPS consensus estimates from the I/B/E/S
summary file and merge it with our data based on the ticker symbol and fiscal year. This matching
process reduced the sample by 9,075 observations. Lastly, we restrict our sample to firms that
either meet or just beat analysts’ expectations by up to 5 cents per share (“just beat”), firms that
just miss analysts’ expectations by up to 5 cents per share (“just miss”), or firms that beat analysts’
expectations by 5 to 10 cents per share (“beat”). Consequently, our full sample contains 11,394
earnings conference call transcripts covering the years 2005 to 2016.
18 We restrict the sample to fourth quarter earnings conference calls because we include R&D and advertising expenses in the analyses and those variables are scarcely available on the Compustat quarterly file.

18
4.2 Descriptive statistics
Table 1 presents descriptive statistics for the main variables we use in our analyses. We are
interested in distinguishing between the group of firms that meet or narrowly beat analysts’
expectations and our control group of firms that just miss or beat analysts’ expectations. Therefore,
we present the means of all variables separately for those three subsamples. Mean
Q_Disc.Expenses for the subsample of firms that meet or narrowly beat analysts’ expectations is
0.118, and 0.110 (0.109) for firms that just miss (beat) analysts’ expectations. The difference
between the “just beat” group and the “just miss” group is 0.008 and is statistically significant at
the 5 percent level. Similarly, the difference between the mean for the “just beat” group and the
mean for the group of firms that beat expectations is 0.009 and is statistically significant at the 1
percent level. These results suggest that there are more questions asked on discretionary expenses
during the Q&A portion of conference calls when firms meet or just beat analysts’ expectations.
We do not find comparable patterns for discussions on discretionary expenses in the presentation
portion of conference calls (P_Disc.Expenses). Specifically, there are fewer mentions of
discretionary expenses when firms meet or just beat expectations, which may suggest that
managers are trying to obfuscate their use of discretionary expenses to meet or just beat
expectations.
We further find that firms that belong to the “just beat” group have more participants at
conference calls compared to the number of participants in conference calls of firms that either
just miss or beat expectations. The earnings surprise (SUR) is, by construction, slightly positive
for “just beat” firms, with a mean of 0.019, slightly negative for “just miss” firms, with a mean of
–0.023, and positive for “beat” firms, with a mean of 0.071. Consistently, the market reaction
(CAR) and analysts’ revisions (Revision) follow the same pattern. Mean CAR is 0.008 for “just

19
beat” firms, compared to a mean of –0.018 (0.027) for “just miss” (“beat”) firms. Mean Revision
is –0.082 for firms that just beat expectations, and –0.179 (–0.067) for firms that just miss (beat)
expectations. The difference, 0.097 (–0.015), is statistically and economically significant.
Furthermore, the change in discretionary expenses in the subsequent year, ∆Disc.Expensest+1, is
higher and the change in discretionary expenses in the current year, ∆Disc.Expensest, is lower for
firms that meet or just beat expectations. These results suggest that discretionary expenses of firms
that meet or just beat analysts’ expectations were opportunistically lowered and are unsustainable.
Lastly, we find that abnormal discretionary expenses as well as its components (R&D, advertising,
and SG&A) are lower for firms that meet or just beat expectations. These results are consistent
with Graham et al.’s (2005) finding that firms lower discretionary expenses to meet or beat
analysts’ expectations.
5. Results
5.1 Tests of H1: There are no more questions on discretionary expenses at conference calls when analysts observe signals that discretionary expenses were lowered to meet or narrowly beat analysts’ expectations
We present the results for testing H1 in Table 2. Column 1 reports the results for the
subsample of firms that beat analysts’ expectations by up to 5 cents per share. The coefficient
estimate on the variable of interest, Q_Disc.Expenses, is –0.518 (t-statistic = –2.562), suggesting
that analysts ask more questions on discretionary expenses when discretionary expenses are lower.
Regarding economic significance, a one standard deviation increase in the number of mentions of
discretionary expenses in analysts’ questions is associated with 10.52 percent (= –0.518 * 0.203)
lower abnormal discretionary expenses. This result suggests that analysts ask more questions on
discretionary expenses during conference calls when they observe signals that those expenses were

20
opportunistically lowered to meet or narrowly beat analysts’ expectations. We do not find
comparable results for the subsample of firms that just miss expectations (column 2) or beat
expectations by a wide margin (column 3), which provides preliminary support that our findings
are attributed to analysts’ suspicions of earnings manipulation and are less likely to be driven by
alternative explanations, such as the complex nature of discretionary expenses.
We proxy for analysts’ suspicions that firms lowered discretionary expenses to meet or
narrowly beat analysts’ expectations with two additional proxies. Those proxies include the change
in next fiscal year’s discretionary expenses compared to current year’s level (∆Disc.Expensest+1)
and current fiscal year’s change in discretionary expenses relative to the prior year
(∆Disc.Expensest). If firms opportunistically lower discretionary expenses to meet or just beat
analysts’ expectations, then we expect those expenses to be lower compared to next and prior
year’s discretionary expenses (Vorst 2016). We present the results in Table 3.
Columns 1–3 report the results of the association between Q_Disc.Expenses and
∆Disc.Expensest+1 for “just beat”, “just miss”, and “beat” firms, respectively, while columns 4–6
show the results of the association between Q_Disc.Expenses and ∆Disc.Expensest for the three
subsamples. The coefficient estimate on Q_Disc.Expenses in column 1 is 0.028 (t-statistic =
2.448), which suggests that analysts ask more questions on discretionary expenses when they
suspect that those expenses were opportunistically lowered to meet or narrowly beat analysts’
expectations. We do not find comparable results for the group of firms that just miss analysts’
expectations or beat them by a wide margin, as reported in columns 2 and 3.
The coefficient estimate on Q_Disc.Expenses in column 4 is –0.047 (t-statistic = –2.092),
which implies that analysts ask more questions on discretionary expenses when they observe that
discretionary expenses are significantly lower than in the prior year for firms that meet or narrowly

21
beat analysts’ expectations. We do not observe significant results for firms that just miss analysts’
expectations or beat them by a wide margin. We also find that the coefficient estimate on
P_Disc.Expenses is economically and statistically insignificant in columns 1 and 3, suggesting that
managers do not discuss discretionary expenses at a different frequency during the presentation
portion of conference calls when discretionary expenses are abnormally low. Skinner (1994)
argues that firms are more likely to disclose bad news. Therefore, if the results we observe were
attributed to adverse economic changes, we would also expect to observe increased discussion on
discretionary expenses during the management presentation portion of earnings conference calls.
Overall, the results in Table 3 and Table 4 are consistent with analysts raising questions
on discretionary expenses when they observe signals that discretionary expenses were
opportunistically lowered to meet or narrowly beat analysts’ expectations.
5.2 Test of H2: The frequency of questions on discretionary expenses during conference calls when firms meet or narrowly beat analysts’ expectations is not associated with the market reaction and analysts’ revisions
Tables 4 and 5 present the results for testing H2. Table 4 presents univariate results while
Table 5 reports the regression results. The results in column 1 of Panel A show that the market
reaction is 0.318 percent lower when analysts ask questions on discretionary expenses at earnings
conference calls of firms that meet or narrowly beat analysts’ expectations (t-statistic = –2.759).
In contrast, the market reaction is 0.301 percent (0.557 percent) higher when analysts ask questions
on discretionary expenses at conferences calls of firms that just miss analysts’ expectations (beat
them by a wide margin). We observe similar results when we examine analysts’ revision of next
fiscal year’s EPS estimate. Specifically, analysts’ revision of next year’s EPS estimate is 6.643
percent lower when analysts ask questions on discretionary expenses at conference calls of firms

22
that meet or narrowly beat analysts’ expectations. We do not observe comparable results for the
groups of firms that narrowly miss analysts’ expectations or beat them by a wide margin.
Consistent with Bhojraj et al.’s (2009) findings, we find that the market reaction (CAR) for
“just beat” firms with questions on discretionary expenses (likely manipulators) is 0.646 percent
compared to CAR of –1.909 percent for “just miss” firms with no questions on discretionary
expenses (likely non-manipulators). The difference in the market reaction implies that analysts and
investors cannot fully unravel real earnings management.19 Therefore, the market reaction for “just
beat” firms with questions on discretionary expenses incorporates the probability that the firm
engaged in real earnings management multiplied by the amount of the suspected earnings
management. The higher CAR we observe for “just beat” firms with no questions on discretionary
expenses relative to “just beat” firms with questions on discretionary expenses (0.964 percent
compared to 0.646 percent) captures the probability that the suspect firms actually manipulated
discretionary expenses to meet expectations. Overall, the results suggest that investors and analysts
incorporate their suspicions that current levels of discretionary expenses are unsustainable in their
assessment of firm value and future performance.
Panel B of Table 4 presents the results for the presentation portion of conference calls. We
fail to document any significant differences in the cumulative abnormal returns (CAR) around the
conference call date, as well as in analysts’ revisions, conditional on whether managers mention
discretionary expenses in the presentation section. In summary, the univariate results provide
preliminary evidence that investors and analysts lower their expectations for the firm’s future
performance when they suspect that the firm lowered discretionary expenses to meet or just beat
analysts’ expectations.
19 If analysts and investors knew with certainty whether a firm manipulated earnings, we would expect similar CAR for “just beat” manipulators and “just miss” non-manipulators.

23
Table 5 presents the results for our multivariate analyses. Column 1 presents the results of
examining the three-day cumulative abnormal returns around the conference call date when firms
meet or narrowly beat analysts’ expectations. The coefficient estimate on our main variable of
interest, Q_Disc.Expenses is –0.009 (t-statistic = –2.161), which implies a lower market reaction
when there are more questions on discretionary expenses during the Q&A portion of conference
calls. With respect to economic significance, a one standard deviation increase in the number of
mentions of discretionary expenses in analysts’ questions is associated with a 22.8 percent
reduction in the market reaction compared to the median market reaction for firms that meet or
narrowly beat analysts’ expectations (–0.009 * 0.203 / 0.008).20 We do not observe a comparable
coefficient estimate in column 3 (5) for firms that just miss (beat) analysts’ expectations. This
finding provides additional support that our results are attributed to investors’ suspicions of
earnings manipulation and are less likely driven by the complexity of discretionary expenses.
Column 2 presents the results for examining the revisions of analysts’ consensus estimates
following the conference call of firms that meet or just beat analysts’ expectations. We find that
analysts’ revisions of their expectations are lower when there are more mentions of discretionary
expenses in their questions. The coefficient estimate on Q_Disc.Expenses is –0.012 (t-statistic =
–1.986). This coefficient estimate implies that a one standard deviation increase in the number of
mentions of discretionary expenses in analysts’ questions is associated with a 13.53 percent
decrease in analysts’ revisions relative to the median revision for firms that meet or just beat
analysts’ expectations (–0.012 * 0.203 / 0.018). We do not observe comparable coefficient
estimates for the subset of firms that just miss expectations (in column 4) or beat them by a wide
margin (in column 6). The coefficient estimate on Q_Tone is significantly positive in all
20 We Follow Lee’s (2016) method of interpreting the economic significance of coefficient estimates.
24
specifications, suggesting that the tone of analysts’ questions provides information on their
perception of the firm.21
We do not find a significant association between the number of mentions of discretionary
expenses by the management at the presentation portion of conference calls and either the market
reaction or analysts’ revisions. These findings suggest that managers do not provide information
that reveals earnings management to the same extent as the information investors obtain during
the Q&A portion. These results do not support the alternative explanation that the negative
association between the number of mentions of discretionary expenses in analysts’ questions and
the market and analysts’ reaction is attributed to deteriorating market conditions and managers’
cost cutting in response. If the results were attributed to adverse economic changes, we would
expect to observe comparable results in the presentation portion of conference calls.
In summary, the results in Table 4 and Table 5 suggest that analysts’ questions on
discretionary expenses at conference calls reflect their suspicions that those expenses were
opportunistically lowered to meet or just beat expectations, and analysts and investors incorporate
those suspicions in their assessment of firm value and future performance. We do not find
comparable results when firms just miss expectations or beat them by a wide margin, which
provides additional support that our findings are attributed to analysts’ suspicions of earnings
manipulation and are less likely to be driven by alternative explanations, such as the complex
nature of discretionary expenses.
21 In untabulated analyses, we include an interaction term between Q_Disc.Expenses and Q_Tone. We find that this interaction term is statistically indifferent from zero, which implies that the market and analysts’ reaction to the tone of analysts’ questions is the same for questions on discretionary expenses and other types of questions.

25
6. Cross-sectional analyses
6.1 The cost of engaging in real earnings management
We perform two cross sectional tests in which we partition our sample of firms that meet
or narrowly beat analysts’ expectations into two subsamples based on our expectation that
analysts’ questions on discretionary expenses better (less) reflect their suspicions of manipulations.
Firms incur costs when engaging in real earnings management (Cohen et al. 2008; Zang
2012). Since our study focuses on discretionary expense manipulation, a form of real earnings
management, we expect analysts’ questions on discretionary expenses to be more reflective of
their suspicions of earnings manipulations when the cost of engaging in real earnings management
is low. In other words, we hypothesize that the likelihood of firms opportunistically lowering
discretionary expenses to meet or just beat analysts’ expectations is higher when the cost of
engaging in real earnings management is low. Therefore, analysts’ questions on discretionary
expenses are more likely to reflect their suspicions of earnings manipulations in those cases. We
follow Zang (2012) and construct a measure of the cost of engaging in real earnings management
(details on the variable construction are available in the Appendix). We then partition our sample
of firms that meet or just beat analysts’ expectations based on the median value of the estimated
costs of engaging in real earnings management. Next, we estimate a variation of estimate Eq. (4)
using the two subsamples.
We present the results in Table 6. The dependent variable in columns 1 and 2 is the three-
day cumulative abnormal returns around the conference call date (CAR). The dependent variable
in columns 3 and 4 is the change in the analysts’ EPS consensus estimate following the conference
call for the next fiscal period (Revision). As expected, we find stronger results when there are lower

26
costs to engage in real earnings management. The coefficient estimate on Q_Disc.Expenses for
firms with low real earnings management costs is –0.013 (t-statistic = –2.063), compared to a
coefficient estimate of –0.005 (t-statistic = –0.513) for the subsample of firms with high costs of
engaging in real earnings management. 22 We observe comparable results when examining
analysts’ revisions following the conference call. The coefficient estimate on Q_Disc.Expenses for
firms with low (high) real earnings management cost is –0.018 (0.012) (t-statistic = –1.674; t-
statistic = 0.991).
6.2 Abnormal discretionary expenses as a signal for discretionary expense manipulations
Earnings conference calls are initiated after and in proximity to the earnings announcement.
Investors are likely to obtain red flags on manipulations of discretionary expenses from the
information available in the earnings announcement. We expect that analysts’ questions on
discretionary expenses are more reflective of their suspicions of earnings manipulations when they
observe that discretionary expenses are abnormally low. We follow Cohen and Zarowin (2010)
and construct a measure of abnormal discretionary expenses (AbDisc.Expenses). We then partition
our sample of firms that meet or just beat analysts’ expectations into firms with low abnormal
discretionary expenses (with values below the sample’s median) and firms with high abnormal
discretionary expenses (with values above the sample’s median). We present the results for
estimating a variation of equation (4) for the two subsamples in Table 7.
22 In additional analysis, we find a significantly negative association between the number of mentions of discretionary expenses in analysts’ questions during the Q&A portion of conference calls and our proxy for the cost of engaging in real earnings management. This finding informs that analysts’ questions on discretionary expenses capture the cost of engaging in real earnings management.

27
Columns 1 and 2 provide the results for the market reaction tests. The coefficient estimates
on Q_Disc.Expenses are –0.006 (t-statistic = –0.627) and –0.011 (t-statistic = –1.775) for firms
with high and low abnormal discretionary expenses, respectively. We present the results for
analysts’ revisions in columns 3 and 4. The coefficient estimate on Q_Disc.Expenses for firms
with high abnormal discretionary expenses is 0.010 (t-statistic =0.695), compared to –0.026 (t-
statistic = –2.232) for firms with low abnormal discretionary expenses. Overall, the results suggest
that analysts’ questions on discretionary expenses are more reflective of their suspicions that those
expenses were opportunistically lowered when discretionary expenses are abnormally low.
7. Additional analyses
We perform two additional tests to further corroborate the inferences we obtain from our
results. In the main analyses, we proxy for analysts’ suspicions that discretionary expenses were
opportunistically lowered by counting the number of times R&D, SG&A and advertising expenses
appear in questions by analysts during the Q&A portion of conference calls. To understand which
types of discretionary expenses are more likely to drive analysts’ suspicions, we estimate Eq. (2)
separately for abnormal R&D (AbR&D), abnormal advertising expenses (AbAdvertising), and
abnormal SG&A expenses (AbSG&A).
Panel A of table 8 presents the results for abnormal R&D expenses. The results are
consistent with our main findings. Specifically, in column 1, we find that the coefficient estimate
on Q_R&D is –0.020 (t-statistic = –1.669), suggesting that analysts ask more questions on R&D
expenses when abnormal R&D expenses are lower. We do not find significant results using our
control groups of firms that just miss analyst’s expectations or beat them by a wide margin. Panels
B and Panel C of Table 8 present the results for advertising and SG&A expenses, respectively.

28
The results are qualitatively similar to the findings for R&D expenses. Specifically, we observe a
significantly negative association between the number of questions on advertising and SG&A
expenses and the abnormal values of those expenses for firms that meet or narrowly beat analysts’
expectations. We do not observe significant results for our control groups.
Next, decompose discretionary expenses to R&D, advertising, and SG&A expenses, and
examine the market implications of analysts’ suspicions that those components were manipulated.
Specifically, we modify Eq. (4) by decomposing discretionary expenses and estimate it separately
for our sample of firms that meet or narrowly beat expectations and the two additional control
groups. Results are reported in Table 9. We find a significantly negative association between
analysts’ questions on R&D expenses and both the market reaction and analysts’ revisions only
when firms meet or just beat analysts’ expectations. We do not find significant results for
advertising expenses. The lack of results may be attributed to the lower economic significance of
advertising expenses to many firms or because some firms do not present advertising expenses as
a separate line item on the income statement. Lastly, we find a negative association between the
number mentions of SG&A expenses in analysts’ questions and the market reaction, but not with
analysts’ revisions for firms that meet or narrowly beat analysts’ expectations.
Overall, the results in Table 8 and Table 9 show that the main inferences we obtain from
our study hold when we decompose discretionary expenses to R&D, advertising, and SG&A
expenses. We find that that analysts and investors incorporate their suspicions that R&D expenses,
and to a lesser extent SG&A expenses, were opportunistically lowered and likely increase the
future when assessing the firm’s performance.
In our final analyses, we examine whether questions on discretionary expenses reflect the
suspicions of the analysts asking the questions or the suspicions of all analysts on the conference

29
call. To examine this question, we limit our analysis to firms that meet or just beat analysts’
expectations and manually match every analyst’s name and affiliation with the analyst’s name and
affiliation on the I/B/E/S detail file, when available. Our sample includes 30,662 observations that
reflect unique firm-year-analyst combinations. We then augment Eq. (4) with the variable
Q_Disc.ExpensesAnalyst that is equal to zero if the analyst on the conference call did not ask a
question on discretionary expenses, and greater than zero otherwise. We present the results in
Table 10. Column 1 excludes analyst fixed effects while column 2 includes them. For brevity we
discuss the results in column 2. The coefficient estimate on Q_Disc.ExpensesConference Call is –0.186
(t-statistic = –2.55), which suggests that all analysts on the conference call revise their estimates
downwards, on average, when there are mentions discretionary expenses in analysts’ questions.
The coefficient estimate on Q_Disc.ExpensesAnalyst is –0.009 (t-statistic = –0.57), which implies
that the revision of the analyst asking the question on discretionary expenses is not significantly
different from the revision of other analysts on the call. The results in Table 10, together with the
negative market reaction associated with analysts’ questions on discretionary expenses, suggest
that questions on discretionary expenses reflect the general suspicion of analysts and investors and
are not limited to the suspicions of the asking analysts.
8. Conclusion
Firms face significant pressure to meet or beat analysts’ expectations. According to the
survey by Graham et al. (2005), the most common form of earnings management to meet earnings
expectations is to opportunistically decrease discretionary expenses. In this study, we examine
whether analysts use earnings conference calls to question the management on their suspicions
that discretionary expenses were used to meet or narrowly beat analysts’ expectations.

30
We document a negative association the number of mentions of discretionary expenses in
questions by analysts during earnings conference calls and three different measures of abnormal
discretionary expenses when firms meet or narrowly beat analysts’ expectations. We further
examine two different control samples of firms that narrowly miss analysts’ expectations or beat
them by a wide margin. We do not observe comparable results using those two control samples.
These findings suggest that our results are less likely to be attributed to the complexity of
discretionary expenses or to adverse economic changes. Overall, the results suggest that analysts
ask managers questions on discretionary expenses at earnings conference calls when they observe
signals that discretionary expenses were opportunistically lowered to meet or just beat analysts’
expectations.
We then examine the market implications that are associated with analysts’ questions on
discretionary expenses when firms meet or just beat analysts’ expectations. We argue that if
analysts and investors suspect that firms manipulated discretionary expenses to meet or just beat
analysts’ expectations, they are going to (1) attenuate their assessment of firm value and future
performance, and (2) inquire about their suspicions during the Q&A portion of earnings conference
calls. We find that, within the subset of firms that meet or just beat analysts’ expectations, there is
a negative association between the number of mentions of discretionary expenses in analysts’
questions and both the market reaction and analysts’ revisions. We do not find significant results
for our control group of firms that just miss or beat analysts’ expectations, which makes some
alternative explanations less likely.
We perform two cross-sectional tests for the association between analysts’ questions on
discretionary expenses and both the market reaction and analysts’ revisions. We find stronger
results for firms that face lower costs of engaging in real earnings management. Those firms are

31
therefore more likely to manipulate discretionary expenses. We also document stronger results for
firms with lower abnormal discretionary expenses. Our results suggest that when investors observe
signals that discretionary expenses were opportunistically reduced to meet or just beat analysts’
expectations, they raise questions on discretionary expenses at conference calls and update their
expectations about the firm’s future performance.
Our study makes multiple contributions to the literature. First, our study extends the
literature on the informativeness of conference calls. It provides evidence on the information
gathering efforts by analysts before and during conference calls. Second, we also contribute to the
literature on earnings management. Many studies use the rule of whether firms meet or narrowly
beat analysts’ expectations as a proxy for earnings management. Our study documents differential
investor behavior for firms that meet or just beat analysts’ earnings expectations, which suggests
that this proxy is subject to type I errors (i.e., falsely rejecting the null of no earnings management).
Our measure of the number of mentions of discretionary expenses in analysts’ questions during
the Q&A portion of conference calls can be used to improve the identification of firms that are
suspected of earnings management using discretionary expenses.

32
Appendix – Variable definitions Variables Definition Q_Disc.Expenses The number of times “G&A”, “SG&A”, “selling, general and
administrative”, “general and administrative”, “marketing expenses”, “advertising expenses”, “research and development”, and “R&D” appear in questions during the Q&A section of the conference call scaled by the log transformation of the total number of words used in the questions (Seeking Alpha).
Q_R&D The number of times “research and development” and “R&D” appear in questions during the Q&A section of the conference call scaled by the log transformation of the total number of words used in the questions (Seeking Alpha).
Q_Advertising The number of times “advertising expenses” appear in questions during the Q&A section of the conference call scaled by the log transformation of the total number of words used in the questions (Seeking Alpha).
Q_SG&A The number of times “G&A”, “SG&A”, “selling, general and administrative”, “general and administrative”, and “marketing expenses” appear in questions during the Q&A section of the conference call scaled by the log transformation of the total number of words used in the questions (Seeking Alpha).
P_Disc.Expenses The number of times “G&A”, “SG&A”, “selling, general and administrative”, “general and administrative”, “marketing expenses”, “advertising expenses”, “research and development”, and “R&D” appear in the presentation portion of the conference call scaled by the log transformation of the total number of words used in the presentation portion (Seeking Alpha).
Q_Tone The difference between the sum of positive tone words and negative tones words in questions during the Q&A section of the conference call scaled by the log transformation of the total number of words used in the questions. We categorize positive and negative tone words using Loughran and McDonald’s (2011) dictionary (Seeking Alpha).
P_Tone The difference between the sum of positive tone words and negative tones words in the presentation portion of the conference call scaled by the log transformation of the total number of words in the presentation portion. We categorize positive and negative tone words using Loughran and McDonald’s (2011) dictionary (Seeking Alpha).
Q_length The natural logarithm of the number of words used in questions during the Q&A section of the conference call (Seeking Alpha).
P_length The natural logarithm of the number of words in the presentation portion of the conference call (Seeking Alpha).
Participants The number of analysts participating in the conference call (Seeking Alpha).
ForecastDispersion The standard deviation of the last estimate for fiscal year t by all analysts covering firm i deflated by the absolute value of the median estimate (I/B/E/S).
Size The natural logarithm of total assets (AT) (Compustat).

33
ROA Return on assets (IB/AT) in year t (Compustat). Loss An indicator variable that is equal to one if net income (NI) is negative,
and zero otherwise (Compustat). SUR Actual EPS minus the most recent analysts’ median consensus estimate
(I/B/E/S). BTM The ratio of book value of equity (CEQ) to market value of equity
(PRCC_F * CSHO) (Compustat). CAR Cumulative abnormal returns over the three-days surrounding firm i’s
conference call date for fiscal year t (CRSP and Seeking Alpha). Abnormal returns are defined as firm i's returns less the value-weighted market returns.
Revision Analysts’ median consensus estimate for next year’s earnings immediately after the conference call minus the analysts’ median consensus estimate immediately before the conference call, scaled by the absolute value of analysts’ median consensus estimate immediately before the conference call (I/B/E/S).
∆Disc.Expensest+1 The sum of next year’s discretionary expenses minus current year’s discretionary expenses, scaled by current year’s discretionary expenses (Compustat).
∆Disc.Expensest The sum of current year’s discretionary expenses minus prior year’s discretionary expenses, scaled by prior year’s discretionary expenses (Compustat).
AbDiscExp Following Cohen and Zarowin (2010). Actual discretionary expenses (XRD + XAD + XSGA) less predicted discretionary expenses based on the following industry-year regression: DiscExpi,t = a01 + a1tSalesi,t-1 + εi.t
where all variables are scaled by lagged total assets. AbR&D Following Kothari, Mizik and Roychowdhury (2016). Actual R&D
expenses (XRD) minus predicted R&D expenses based on the following fixed-effect first-order autoregressive model: R&Di,t = αR&D,i + μR&D,t + θR&DR&Di,t-1 + λR&DSalesi,t-1 + εR&D,i,t
AbAdvertising Actual advertising expenses (XAD) minus predicted advertising expenses based on the following fixed-effect first-order autoregressive model: Advertisingi,t = αadvertising,i + μadvertising,t + θadvertisingadvertisingi,t-1 + λadvertisingSalesi,t-1 + εadvertising,i,t
AbSG&A Actual selling, general & administrative expenses (XSGA) minus predicted selling, general & administrative expenses based on the following fixed-effect first-order autoregressive model: SG&Ai,t = αSG&A,i + μSG&A,t + θSG&AR&Di,t-1 + λSG&ASalesi,t-1 + εSG&A,i,t
Cost of REM Based on the proxy by Zang (2012). The sum of four types of costs of engaging in real earnings management. Those costs include firm i’s market share at the beginning of the year, Altman’s Z score, institutional ownership, and firm i’s marginal tax rate (Compustat).

34
EARN Earnings before extraordinary items minus discretionary accruals and production costs, plus discretionary expenditures (Compustat).
AltmanZ Modified Altman's Z-score, constructed as: Altman Z = 1.2(working capital / total assets) + 1.4(retained earnings / total assets) + 3.3(EBIT / total assets) + 0.6(market value of equity / total assets) + 0.999(sales / total assets) (Compustat).
MarketShare The ratio of total sales (SALE) to the total sales of the industry. Industry grouping is based on 3-digit SIC codes (Compustat).
Inst.Ownership The institutional ownership percentage of firm i at year t (Thomson Financial).
MTR Marginal tax rate. Available at http://faculty.fuqua.duke.edu/~jgraham/

35
References
Amiram, D., E. Owens, and O. Rozenbaum. 2016. Do information releases increase or decrease information asymmetry? New evidence from analyst forecast announcements. Journal of Accounting and Economics 62(1), 121-138. Baber, W. R., P. M. Fairfield, and J. Haggard. 1991. The effect of concern about reported income on discretionary spending decisions: the case of research and development. The Accounting Review 66(4), 818-829. Baber, W. R., S. H. Kang, and Y. Li. 2011. Modeling discretionary accrual reversal and the balance sheet as an earnings management constraint. The Accounting Review 86(4), 1189- 1212. Bartov, E., D. Givoly, and C. Hayn. 2002. The rewards to meeting or beating earnings expectations. Journal of Accounting and Economics 33(2), 173-204. Barua, A., S. Lin, and A. M. Sbaraglia. 2010. Earnings management using discontinued operations. The Accounting Review 85(5), 1485-1509. Bergstresser, D., M. Desai, and J. Rauh. 2006. Earnings manipulation, pension assumptions, and managerial investment decisions. Quarterly Journal of Economics 121(1), 157-195. Bhojraj, S., P. Hribar, M. Picconi, and J. McInnis. 2009. Making sense of cents: An examination of firms that marginally miss or beat analyst forecasts. The Journal of Finance 64(5), 2361- 2388. Bird, A., S. Karolyi, and T. Ruchti. 2018. Understanding the 'Numbers Game'. Working Paper. Black, D. E., and T. E. Christensen. 2009. US managers’ use of ‘pro forma’ adjustments to meet strategic earnings targets. Journal of Business Finance & Accounting 36(3-4), 297-326. Bowen, R. M., A. K. Davis, and D. A. Matsumoto. 2002. Do conference calls affect analysts’ forecasts? The Accounting Review 77(2), 285-316. Brown, S., S. A. Hillegeist, and K. Lo. 2004. Conference calls and information asymmetry. Journal of Accounting and Economics 37(3), 343-366. Caskey, J., and N. B. Ozel. 2017. Earnings expectations and employee safety. Journal of Accounting and Economics 63(1), 121-141. Chen, J. V., V. Nagar, and J. Schoenfeld. 2018. Manager-analyst conversations in earnings conference calls. Review of Accounting Studies (forthcoming). Cohen, D. A., A. Day, and T. Z. Lys. 2008. Real and accrual-based earnings management in the
pre- and post- Sarbanes-Oxley periods. The Accounting Review 83(3), 757-787. Cohen, D. A., and P. Zarowin. 2010. Accrual-based and real earnings management activities
around seasoned equity offering. Journal of Accounting and Economics 50(1), 2-19. Cohen, L., D. Lou, and C. Malloy. 2013. Playing favorites: How firms prevent the revelation of bad news. Working Paper. Cook, K. A., G. R. Huston, and T. C. Omer. 2008. Earnings management through effective tax rates: the effects of tax-planning investment and the Sarbanes-Oxley Act of 2002. Contemporary Accounting Research 25(2), 447-471. Defond, M. L., and C. W. Park. 2001. The reversal of abnormal accruals and the market valuation of earnings surprises. The Accounting Review 76(3), 375-404. Degeorge, F., J. Patel, and R. Zeckhauser. 1999. Earnings management to exceed thresholds. Journal of Business 72(1), 1-33. Dhaliwal, D., C. A. Gleason, and L. F. Mills. 2004. Last-chance earnings management: using the tax expense to meet analysts’ forecasts. Contemporary Accounting Research 21(2), 431-459.

36
Doyle, J. T., J. N. Jennings, and M. T. Soliman. 2013. Do managers define non-GAAP earnings to meet or beat analyst forecasts? Journal of Accounting and Economics 56(1), 40-56. Farrell, K. A., and D. A. Whidbee. 2003. Impact of firm performance expectations on CEO turnover and replacement decisions. Journal of Accounting and Economics 36(1-3), 165-196. Frankel, R., M. Johnson, and D. J. Skinner. 1999. An empirical examination of conference calls as a voluntary disclosure medium. Journal of Accounting Research 37(1), 133-150. Graham, J. R., C. R. Harvey, and S. Rajgopal. 2005. The economic implications of corporate financial reporting. Journal of Accounting and Economics 40(1), 3-73. Hribar, P., N. T. Jenkins, and W. B. Johnson. 2006. Stock repurchases as an earnings management device. Journal of Accounting and Economics 41(1), 3-27. Jung, M. J., M. H. F. Wong, and X. F. Zhang. 2018. Buy-side analysts and earnings conference calls. Journal of Accounting Research 56(3), 913-952. Kasznik, R., and M. F. McNichols. 2002. Does meeting earnings expectations matter? Evidence from analyst forecast revisions and share prices. Journal of Accounting Research 40(3), 727- 759. Keung, E., Z. X. Lin, and M. Shih. 2010. Does the stock market see a zero or small positive earnings surprise as a red flag? Journal of Accounting Research 48(1), 91-121. Kothari, S. P., N. Mizik, and S. Roychowdhury. 2015. Managing for the moment: The role of earnings management via real activities versus accruals in SEO valuation. The Accounting Review 91(2), 559-586. Lee, J. 2016. Can investors detect managers’ lack of spontaneity? Adherence to predetermined scripts during earnings conference calls. The Accounting Review 91(1), 229-250. Loughran, T. and B. McDonald. 2011. When is a liability not a liability? Textual analysis, dictionaries, and 10‐Ks. The Journal of Finance 66(1), 35-65. Matsumoto, D. A. 2002. Management’s incentives to avoid negative earnings surprises. The Accounting Review 77(3), 483-514. Matsumoto, D., M. Pronk, and E. Roelofsen. 2011. What makes conference calls useful? The information content of managers’ presentations and analysts’ discussion sessions. The Accounting Review 86(4), 1383-1414. Matsunaga, S. R., and C. W. Park. 2001. The effect of missing a quarterly earnings benchmark on the CEO’s annual bonus. The Accounting Review 76(3), 313-332. Mayew, W. J. 2008. Evidence of management discrimination among analysts during earnings conference calls. Journal of Accounting Research 46(3), 627-659. McNichols, M. and P. C. O'Brien. 1997. Self-selection and analyst coverage. Journal of Accounting Research 35, 67-199. Public Company Accounting Oversight Board (PCAOB). 2002. Consideration of Fraud in a Financial Statement Audit. AU Section 316. Roychowdhury, S. 2006. Earnings management through real activities manipulation. Journal of Accounting and Economics 42(3), 335-370. Skinner, D. J. 1994. Why firms voluntarily disclose bad news. Journal of Accounting Research 23(1), 38-60. Skinner, D. J., and R. G. Sloan. 2002. Earnings surprises, growth expectations, and stock returns or don’t let an earnings torpedo sink your portfolio. Review of Accounting Studies 7(2), 289- 312. Tasker, S. C. 1998. Bridging the information gap: Quarterly conference calls as a medium for voluntary disclosure. Review of Accounting Studies 3(1-2), 137-167.

37
Vorst, P. 2016. Real earnings management and long-term operating performance: The role of reversals in discretionary investment cuts. The Accounting Review 91(4), 1219-1256. Zang, A.Y. 2012. Evidence on the trade-off between real activities manipulation and accrual- based earnings management. The Accounting Review 87(2), 675-703.
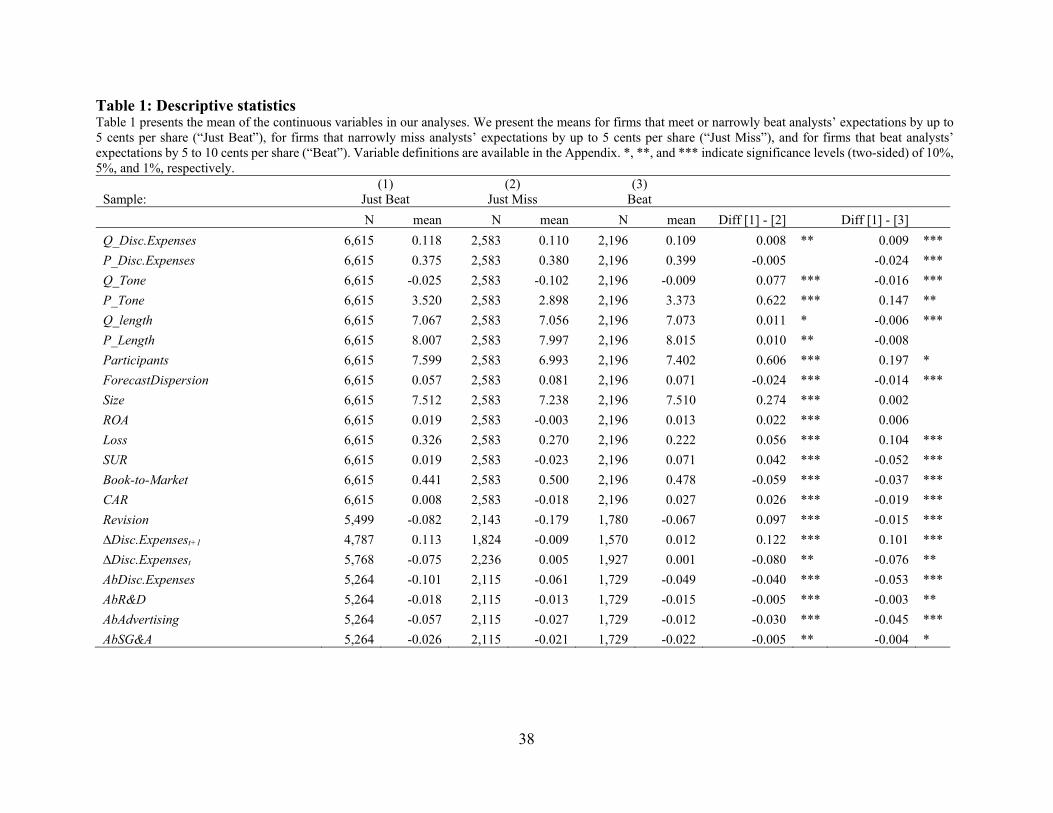
38
Table 1: Descriptive statistics Table 1 presents the mean of the continuous variables in our analyses. We present the means for firms that meet or narrowly beat analysts’ expectations by up to 5 cents per share (“Just Beat”), for firms that narrowly miss analysts’ expectations by up to 5 cents per share (“Just Miss”), and for firms that beat analysts’ expectations by 5 to 10 cents per share (“Beat”). Variable definitions are available in the Appendix. *, **, and *** indicate significance levels (two-sided) of 10%, 5%, and 1%, respectively.
(1) (2) (3) Sample: Just Beat Just Miss Beat
N mean N mean N mean Diff [1] - [2] Diff [1] - [3] Q_Disc.Expenses 6,615 0.118 2,583 0.110 2,196 0.109 0.008 ** 0.009 ***
P_Disc.Expenses 6,615 0.375 2,583 0.380 2,196 0.399 -0.005 -0.024 ***
Q_Tone 6,615 -0.025 2,583 -0.102 2,196 -0.009 0.077 *** -0.016 ***
P_Tone 6,615 3.520 2,583 2.898 2,196 3.373 0.622 *** 0.147 **
Q_length 6,615 7.067 2,583 7.056 2,196 7.073 0.011 * -0.006 ***
P_Length 6,615 8.007 2,583 7.997 2,196 8.015 0.010 ** -0.008 Participants 6,615 7.599 2,583 6.993 2,196 7.402 0.606 *** 0.197 *
ForecastDispersion 6,615 0.057 2,583 0.081 2,196 0.071 -0.024 *** -0.014 ***
Size 6,615 7.512 2,583 7.238 2,196 7.510 0.274 *** 0.002
ROA 6,615 0.019 2,583 -0.003 2,196 0.013 0.022 *** 0.006
Loss 6,615 0.326 2,583 0.270 2,196 0.222 0.056 *** 0.104 ***
SUR 6,615 0.019 2,583 -0.023 2,196 0.071 0.042 *** -0.052 ***
Book-to-Market 6,615 0.441 2,583 0.500 2,196 0.478 -0.059 *** -0.037 ***
CAR 6,615 0.008 2,583 -0.018 2,196 0.027 0.026 *** -0.019 ***
Revision 5,499 -0.082 2,143 -0.179 1,780 -0.067 0.097 *** -0.015 ***
∆Disc.Expensest+1 4,787 0.113 1,824 -0.009 1,570 0.012 0.122 *** 0.101 ***
∆Disc.Expensest 5,768 -0.075 2,236 0.005 1,927 0.001 -0.080 ** -0.076 **
AbDisc.Expenses 5,264 -0.101 2,115 -0.061 1,729 -0.049 -0.040 *** -0.053 ***
AbR&D 5,264 -0.018 2,115 -0.013 1,729 -0.015 -0.005 *** -0.003 **
AbAdvertising 5,264 -0.057 2,115 -0.027 1,729 -0.012 -0.030 *** -0.045 ***
AbSG&A 5,264 -0.026 2,115 -0.021 1,729 -0.022 -0.005 ** -0.004 *

39
Table 2: Conference call questions on discretionary expenses and reported abnormal discretionary expenses Table 2 reports the results of estimating Eq. (2) for testing the association between questions on discretionary expenses and their reported abnormal value. “Just Beat” firms meet or beat analysts’ expectations by up to 5 cents per share. “Just Miss” firms miss analysts’ expectations by up to 5 cents per share. “Beat” firms beat analysts’ expectations by 5 to 10 cents per share. All variable definitions are presented in the Appendix. Robust t-statistics are reported in parentheses. *, **, and *** indicate significance levels (two-sided) of 10%, 5%, and 1%, respectively.
(1) (2) (3)
Sample: Just Beat Just Miss Beat
Dependent variable: AbDisc.Expenses AbDisc.Expenses AbDisc.Expenses
Intercept -0.318 0.878 -2.728***
(-0.530) (0.979) (-2.687)
Q_Disc.Expenses -0.518** -0.315 0.368
(-2.562) (-1.122) (0.964)
Q_Tone -0.030 -0.021 -0.146
(-0.764) (-0.360) (-1.631)
Q_Length 0.089 -0.052 0.353***
(1.238) (-0.515) (2.670)
BTM -0.251** -0.202 -0.153
(-2.301) (-1.642) (-0.831)
Size -0.090** -0.017 -0.116*
(-2.396) (-0.326) (-1.778)
Loss 0.186* -0.101 0.176
(1.820) (-0.628) (0.921)
Earn -0.000 -0.000** -0.000**
(-1.578) (-2.222) (-2.022)
AltmanZ 0.012* -0.007 -0.000
(1.868) (-0.993) (-0.022)
MarketShare 0.591 -0.465 0.389
(1.437) (-0.889) (0.619)
Inst.Ownership 0.096 0.011 0.081
(0.521) (0.040) (0.234)
MTR 0.160 -0.201 -0.245
(0.454) (-0.413) (-0.494)
Year and Industry Effects Yes Yes Yes
Clustered Standard Errors Firm and Year Firm and Year Firm and Year
Observations 5,264 2,115 1,729
Adj R-squared 0.051 0.037 0.057

40
Table 3: The sustainability of discretionary expenses Table 3 presents the results of estimating Eq. (3) for testing the association between the number of mentions of discretionary expenses in questions during conference calls and the change in discretionary expenses relative to the prior and subsequent year. “Just Beat” firms meet or beat analysts’ expectations by up to 5 cents per share. “Just Miss” firms miss analysts’ expectations by up to 5 cents per share. “Beat” firms beat analysts’ expectations by 5 to 10 cents per share. All variable definitions are presented in the Appendix. Robust t-statistics are reported in parentheses. *, **, and *** indicate significance levels (two-sided) of 10%, 5%, and 1%, respectively.
(1) (2) (3) (4) (5) (6) Sample: Just Beat Just Miss Beat Just Beat Just Miss Beat Dependent variable: ∆Disc.Expensest+1 ∆Disc.Expensest+1 ∆Disc.Expensest+1 ∆Disc.Expensest ∆Disc.Expensest ∆Disc.Expensest Intercept 0.152* 0.210*** 0.348** 0.055 0.376 -0.704*
(1.684) (2.819) (2.442) (0.435) (1.390) (-1.945) Q_Disc.Expenses 0.028** 0.019 0.005 -0.047** 0.075 0.020
(2.448) (1.220) (0.147) (-2.092) (1.196) (0.697) P_Disc.Expenses -0.007 -0.021 0.029 0.022 0.156 -0.030
(-0.609) (-0.725) (1.447) (1.151) (1.391) (-1.067) Q_Length -0.019*** -0.003 -0.021 -0.006 0.054 0.060
(-2.760) (-0.219) (-0.992) (-0.516) (0.822) (1.436) P_Length 0.002 -0.025** 0.004 -0.005 -0.142 0.025
(0.144) (-1.981) (0.267) (-0.452) (-1.328) (1.586) Paricipants 0.001 -0.002 0.000 0.002 0.001 0.002
(1.142) (-0.726) (0.152) (1.459) (0.122) (0.450) ForecastDispersion -0.028 0.003 -0.118** -0.011 0.045 -0.040
(-0.503) (0.192) (-2.470) (-0.943) (0.422) (-0.820) BTM -0.021 -0.020 -0.036 0.035*** 0.049 0.021
(-1.608) (-1.324) (-1.482) (3.647) (1.107) (0.668) Size -0.006 0.004 -0.009 0.001 0.027 -0.008
(-1.391) (1.255) (-1.351) (0.166) (0.741) (-0.879) ROA -0.237*** -0.089** -0.157 0.005 0.102 -0.017
(-3.274) (-2.346) (-0.989) (0.106) (1.483) (-0.152) Loss 0.027 0.058*** 0.057 0.002 0.081 0.020
(1.597) (2.611) (1.263) (0.133) (1.248) (0.699) Year and Industry Effects Yes Yes Yes Yes Yes Yes Clustered Standard Errors Firm and Year Firm and Year Firm and Year Firm and Year Firm and Year Firm and Year Observations 4,787 1,824 1,570 5,768 2,236 1,927 Adj R-squared 0.048 0.054 0.076 0.016 0.017 0.031

41
Table 4: Analysts’ revisions and the market reaction to mentions of discretionary expenses in conference calls Table 4 presents the market reaction and analysts’ revisions conditional on mentions of discretionary expenses during conference calls. Panel A reports the results for the Q&A portion of conference calls and Panel B presents the results for the presentation portion of conference calls. “Just Beat” firms meet or beat analysts’ expectations by up to 5 cents per share. “Just Miss” firms miss analysts’ expectations by up to 5 cents per share. “Beat” firms beat analysts’ expectations by 5 to 10 cents per share. All variable definitions are presented in the Appendix. t-statistics are reported in parentheses. *, **, and *** indicate significance levels (two-sided) of 10%, 5%, and 1%, respectively.
Panel A: Q&A section of the conference call (1) (2) (3) Just Beat Just Miss Beat Questions of discretionary expenses? CAR N CAR N CAR N (A) No 0.964% 4,157 -1.909% 1,675 2.540% 1,425 (B) Yes 0.646% 2,458 -1.608% 908 3.096% 771 Difference (B) - (A) -0.318%*** 0.301% 0.557% t-statistic (-2.759) (1.226) (1.331) Difference (1) - (2) -0.619%*** F-Statistic 9.93 Difference (1) - (3) -0.875%*** F-Statistic 6.90
(1) (2) (3) Just Beat Just Miss Beat Questions of discretionary expenses? Revision N Revision N Revision N (A) No -5.674% 3,443 -18.685% 1,377 -6.284% 1,147 (B) Yes -12.318% 2,056 -16.514% 766 -7.364% 633 Difference (B) - (A) -6.643%*** 2.171% -1.080% t-statistic (-6.296) (1.207) (-1.555) Difference (1) - (2) -8.814%** F-Statistic 5.12 Difference (1) - (3) -5.563%* F-Statistic 3.58

42
Panel B: Presentation section of the conference call (1) (2) (3) Just Beat Just Miss Beat Mentions of discretionary expenses? CAR N CAR N CAR N (A) No 0.989% 1,943 -1.563% 847 2.775% 694 (B) Yes 0.784% 4,672 -1.920% 1,736 2.715% 1,502 Difference (B) - (A) -0.205% -0.357% -0.060% t-statistic (-0.990) (-1.509) (-1.253) Difference (1) - (2) 0.152% F-Statistic 0.46 Difference (1) - (3) -0.146% F-Statistic -0.11
(1) (2) (3) Just Beat Just Miss Beat Mentions of discretionary expenses? Revision N Revision N Revision N (A) No -8.655% 1,645 -17.898% 691 -6.010% 563 (B) Yes -7.946% 3,854 -17.932% 1,452 -6.970% 1,217 Difference (B) - (A) 0.709% -0.035% -0.960% t-statistic (1.023) (-0.786) (-1.092) Difference (1) - (2) 0.744% F-Statistic 0.17 Difference (1) - (3) 1.669% F-Statistic 0.12

43
Table 5: Multivariate analyses of analysts’ revisions and the market reaction to mentions of discretionary expenses in conference calls Table 5 presents the results of estimating Eq. (4) for testing the association between mentions of discretionary expenses in conference calls and the market reaction and analysts’ revisions. “Just Beat” firms meet or beat analysts’ expectations by up to 5 cents per share. “Just Miss” firms miss analysts’ expectations by up to 5 cents per share. “Beat” firms beat analysts’ expectations by 5 to 10 cents per share. All variable definitions are presented in the Appendix. Robust t-statistics are reported in parentheses. *, **, and *** indicate significance levels (two-sided) of 10%, 5%, and 1%, respectively.
(1) (2) (3) (4) (5) (6) Sample: Just Beat Just Beat Just Miss Just Miss Meet Meet Dependent variable: CAR Revision CAR Revision CAR Revision Intercept 0.107*** 0.268*** 0.057* 0.238 0.105* 0.322***
(3.586) (3.231) (1.940) (1.441) (1.869) (2.952) SUR 0.603*** 0.317*** 0.674*** 0.680*** 0.056 0.230
(8.146) (3.607) (3.766) (2.865) (1.352) (0.745) Q_Disc.Expenses -0.009** -0.012** -0.001 -0.007 0.007 0.001
(-2.161) (-1.986) (-0.135) (-0.657) (0.771) (0.037) Q_Tone 0.009*** 0.011*** 0.009*** 0.019*** 0.008*** 0.006
(6.381) (4.261) (4.730) (3.516) (6.266) (1.397) Q_Length -0.002 -0.012*** -0.001 -0.010 -0.003 -0.018*
(-0.554) (-2.999) (-0.335) (-0.868) (-0.811) (-1.950) P_Disc.Expenses 0.001 -0.003 0.001 -0.007 -0.003 -0.019
(0.231) (-0.294) (0.310) (-0.534) (-0.495) (-1.002) P_Tone 0.002*** 0.003*** 0.001* 0.006*** 0.001 0.005***
(4.434) (3.280) (1.870) (2.909) (1.389) (5.450) P_Length -0.012*** -0.041*** -0.012*** -0.054*** -0.004 -0.042***
(-4.819) (-4.428) (-3.295) (-3.125) (-0.674) (-3.661) Paricipants 0.000 0.000 0.000 -0.003* 0.001 -0.002
(0.372) (0.290) (0.545) (-1.814) (1.309) (-1.169) ForecastDispersion 0.003 -0.038 -0.008* -0.072 -0.004 -0.094**
(1.338) (-1.628) (-1.853) (-1.500) (-0.242) (-2.413) BTM 0.002 -0.020 0.013*** -0.063*** 0.017*** -0.049***
(0.711) (-1.560) (2.723) (-6.331) (2.987) (-3.167) Size -0.001*** 0.015*** 0.004*** 0.028*** -0.007*** 0.013***
(-3.176) (7.697) (4.058) (11.582) (-6.387) (3.297) ROA 0.010 -0.003 -0.010 -0.008 0.039 -0.073**
(1.016) (-0.271) (-0.547) (-0.122) (1.079) (-2.172) Loss -0.000 -0.116*** 0.003 -0.165*** -0.005 -0.109***
(-0.045) (-8.305) (0.565) (-7.520) (-0.457) (-8.377) Year and Industry Effects Yes Yes Yes Yes Yes Yes Clustered Standard Errors Firm and
Year Firm and
Year Firm and
Year Firm and
Year Firm and
Year Firm and
Year Observations 6,615 5,499 2,583 2,143 2,196 1,780 Adj R-squared 0.044 0.183 0.058 0.292 0.058 0.179

44
Table 6: Analysts’ revisions and the market reaction to questions on discretionary expenses during conference calls partitioned on the cost of engaging in real earnings management Table 6 presents the results of estimating Eq. (4) for two subgroups of firms that meet or narrowly beat analysts’ expectations. We partition the sample into firms with estimated costs of engaging in real earnings management that are above (below) the population’s median value. We use Zang’s (2012) measure of the cost of engaging in real earnings management. All variable definitions are presented in the Appendix. Robust t-statistics are reported in parentheses. *, **, and *** indicate significance levels (two-sided) of 10%, 5%, and 1%, respectively.
(1) (2) (3) (4) Sample (Just Beat): Higher Cost of
REM Lower Cost of
REM Higher Cost of
REM Lower Cost of
REM Dependent variable: CAR CAR Revision Revision Intercept 0.047 0.114*** 0.346*** 0.175**
(1.117) (3.751) (3.490) (2.281) SUR 0.773*** 0.611*** 0.718** 0.768***
(6.164) (4.580) (1.986) (3.532) Q_Disc.Expenses -0.005 -0.013** 0.012 -0.018*
(-0.513) (-2.063) (0.991) (-1.674) Q_Tone 0.010*** 0.002*** 0.025*** 0.021***
(6.905) (6.667) (4.153) (7.469) Q_Length -0.005 -0.014*** -0.045*** -0.019*
(-0.931) (-3.618) (-3.204) (-1.762) Paricipants 0.001 -0.000 0.006** -0.002**
(1.059) (-1.060) (2.469) (-2.549) ForecastDispersion -0.008 0.036*** -0.063 0.016***
(-0.670) (4.535) (-0.758) (2.858) BTM 0.002 -0.000 -0.013* -0.040***
(0.239) (-0.022) (-1.780) (-3.109) Size -0.003*** -0.003*** -0.010*** 0.002
(-3.020) (-2.957) (-3.207) (0.563) ROA -0.018 0.037* -0.075*** 0.009
(-0.488) (1.704) (-3.265) (0.287) Loss 0.001 -0.004 -0.027*** -0.016
(0.076) (-0.703) (-2.661) (-0.842) Year and Industry Effects Yes Yes Yes Yes Clustered Standard Errors Firm and Year Firm and Year Firm and Year Firm and Year Observations 2,643 2,651 2,176 2,173 Adj R-squared 0.057 0.050 0.132 0.098

45
Table 7: Analysts’ revisions and the market reaction to questions on discretionary expenses during conference calls partitioned on abnormal discretionary expenses Table 7 presents the results of estimating Eq. (4) for two subgroups of firms that meet or narrowly beat analysts’ expectations: (1) firms with high levels of abnormal discretionary expenses (levels above the sample’s median value); and (2) firms with low levels of abnormal discretionary expenses (levels below the sample’s median value). All variable definitions are presented in the Appendix. Robust t-statistics are reported in parentheses. *, **, and *** indicate significance levels (two-sided) of 10%, 5%, and 1%, respectively.
(1) (2) (3) (4) Sample (Just Beat): Higher
AbDisc.Expenses Lower
AbDisc.Expenses Higher
AbDisc.Expenses Lower
AbDisc.Expenses Dependent variable: CAR CAR Revision Revision Intercept 0.065** 0.008 0.138 0.096
(2.248) (0.262) (1.463) (1.609) SUR 0.804*** 0.635*** 0.632*** 0.055
(10.001) (4.021) (3.763) (0.216) Q_Disc.Expenses -0.006 -0.011* 0.010 -0.026**
(-0.627) (-1.775) (0.695) (-2.232) Q_Tone 0.012*** 0.012*** 0.012*** 0.014***
(4.607) (7.701) (3.242) (4.637) Q_Length -0.007* -0.001 -0.033** -0.028***
(-1.856) (-0.287) (-2.461) (-3.925) Paricipants 0.001 0.001** 0.001 -0.001
(1.471) (1.971) (0.731) (-0.472) ForecastDispersion 0.003 0.017 -0.134* -0.047
(0.388) (0.861) (-1.919) (-1.271) BTM -0.003 0.008 -0.064*** -0.015***
(-0.528) (1.408) (-3.694) (-2.736) Size -0.001 -0.002*** 0.014*** 0.016***
(-1.032) (-3.316) (4.185) (8.573) ROA -0.010 0.024 0.046 -0.109***
(-0.528) (1.123) (0.929) (-3.824) Loss -0.001 -0.004 -0.096*** -0.145***
(-0.193) (-0.390) (-6.558) (-6.638) Year and Industry Effects Yes Yes Yes Yes Clustered Standard Errors Firm and Year Firm and Year Firm and Year Firm and Year Observations 2,629 2,635 2,573 2,578 Adj R-squared 0.049 0.064 0.202 0.189

46
Table 8: The association between conference call questions on the components of discretionary expenses and their abnormal value Table 8 reports the results of estimating Eq. (2) for testing the association between analysts’ questions on the components of discretionary expenses at earnings conference calls and the reported abnormal value of those components. Panel A presents the results for R&D expenses while Panel B and Panel C present the results for advertising and SG&A expenses, respectively. “Just Beat” firms meet or beat analysts’ expectations by up to 5 cents per share. “Just Miss” firms miss analysts’ expectations by up to 5 cents per share. “Beat” firms beat analysts’ expectations by 5 to 10 cents per share. All variable definitions are presented in the Appendix. Robust t-statistics are reported in parentheses. *, **, and *** indicate significance levels (two-sided) of 10%, 5%, and 1%, respectively.
Panel A: R&D expenses (1) (2) (3) Sample: Just Beat Just Miss Beat Dependent variable: AbR&D AbR&D AbR&D Intercept 0.135*** 0.027 0.153***
(4.301) (0.753) (2.707) Q_R&D -0.020* 0.010 -0.016
(-1.669) (0.495) (-0.745) Q_Tone 0.001 0.001 0.000
(0.665) (0.570) (0.073) Q_Length 0.003 0.002 -0.003
(0.864) (0.420) (-0.472) BTM -0.065*** -0.046*** -0.044***
(-10.055) (-7.213) (-6.390) Size -0.021*** -0.014*** -0.017***
(-11.586) (-7.783) (-7.733) Loss 0.052*** 0.034*** 0.040***
(9.238) (5.281) (4.972) Earn -0.000*** -0.000*** -0.000***
(-4.316) (-4.611) (-3.954) AltmanZ 0.001 0.001 0.001
(1.034) (0.717) (0.853) MarketShare 0.069*** 0.018 0.031*
(6.303) (1.408) (1.874) Inst.Ownership -0.012 0.004 -0.007
(-1.354) (0.412) (-0.527) MTR -0.034*** -0.002 -0.029*
(-3.069) (-0.115) (-1.784) Year and Industry Effects Yes Yes Yes Clustered Standard Errors Firm and Year Firm and Year Firm and Year Observations 5,264 2,115 1,729 Adj R-squared 0.298 0.224 0.266

47
Panel B: Advertising expenses
(1) (2) (3)
Sample: Just Beat Just Miss Beat
Dependent variable: AbAdvertising AbAdvertising AbAdvertising
Intercept -0.420 0.953 -5.089***
(-0.679) (1.035) (-3.199)
Q_Advertising -1.897*** -1.257 0.040
(-4.121) (-1.525) (0.039)
Q_Tone -0.038 -0.024 -0.452**
(-0.910) (-0.412) (-2.318)
Q_Length 0.045 -0.074 0.748***
(0.623) (-0.762) (2.908)
BTM -0.057 -0.030 0.190
(-0.533) (-0.249) (0.420)
Size -0.026 0.026 -0.146
(-0.724) (0.495) (-1.438)
Loss 0.071 -0.196 0.217
(0.700) (-1.241) (0.700)
Earn -0.000 -0.000** -0.000*
(-1.526) (-2.073) (-1.816)
AltmanZ 0.008 -0.002 0.004
(1.294) (-0.780) (0.361)
MarketShare 0.423 -0.330 0.558
(1.133) (-0.694) (0.706)
Inst.Ownership 0.126 0.016 -0.167
(0.694) (0.056) (-0.230)
MTR 0.202 -0.243 0.009
(0.569) (-0.507) (0.012)
Year and Industry Effects Yes Yes Yes Clustered Standard Errors Firm and Year Firm and Year Firm and Year
Observations 5,264 2,115 1,729
Adj R-squared 0.050 0.039 0.055

48
Panel C: SG&A expenses (1) (2) (3) Sample: Just Beat Just Miss Beat Dependent variable: AbSG&A AbSG&A AbSG&A Intercept 0.122** 0.101 0.055
(1.985) (1.274) (0.689) Q_SG&A -0.055** 0.022 0.016
(-2.256) (0.610) (0.352) Q_Tone 0.006 -0.005 0.003
(1.597) (-1.107) (0.587) Q_Length 0.025*** -0.001 0.028***
(3.174) (-0.144) (2.713) BTM -0.137*** -0.113*** -0.109***
(-9.905) (-7.960) (-7.282) Size -0.036*** -0.024*** -0.032***
(-10.824) (-6.181) (-7.236) Loss 0.086*** 0.076*** 0.072***
(6.162) (5.088) (4.112) Earn 0.000 -0.000 0.000
(0.777) (-0.408) (0.224) AltmanZ 0.004*** -0.001 0.004**
(3.341) (-0.480) (1.975) MarketShare 0.068** -0.052 0.008
(2.488) (-1.506) (0.210) Inst.Ownership -0.030 0.009 -0.079***
(-1.445) (0.405) (-2.590) MTR -0.045 -0.010 -0.063
(-1.604) (-0.223) (-1.287) Year and Industry Effects Yes Yes Yes Clustered Standard Errors Firm and Year Firm and Year Firm and Year Observations 5,264 2,115 1,729 Adj R-squared 0.167 0.177 0.182

49
Table 9: Analysts’ revisions and the market reaction to mentions of the components of discretionary expenses in questions during conference calls Table 9 presents the results of estimating Eq. (4) with the individual components of discretonary expenses. “Just Beat” firms meet or beat analysts’ expectations by up to 5 cents per share. “Just Miss” firms miss analysts’ expectations by up to 5 cents per share. “Beat” firms beat analysts’ expectations by 5 to 10 cents per share. All variable definitions are presented in the Appendix. Robust t-statistics are reported in parentheses. *, **, and *** indicate significance levels (two-sided) of 10%, 5%, and 1%, respectively.
(1) (2) (3) (4) (5) (6) Sample: Just Beat Just Beat Just Miss Just Miss Meet Meet Dependent variable: CAR Revision CAR Revision CAR Revision Intercept 0.046** 0.015 -0.031 -0.187** 0.078*** 0.001
(2.520) (0.304) (-1.236) (-2.006) (3.323) (0.017) SUR 0.607*** 0.302*** 0.679*** 0.697*** 0.056 0.223
(8.192) (3.271) (3.765) (2.966) (1.331) (0.727) Q_R&D -0.122* -0.035* 0.024 -0.016 0.001 -0.007
(-1.691) (-1.700) (0.313) (-0.324) (0.006) (-0.272) Q_Advertising 0.014 -0.023 0.002 0.021 -0.017 -0.024
(0.588) (-0.705) (0.358) (0.764) (-0.688) (-0.279) Q_SG&A -0.019*** -0.013 -0.004 -0.007 -0.011 0.008
(-2.814) (-0.252) (-0.391) (-0.205) (-0.288) (0.214) Q_Tone 0.010*** 0.012*** 0.009*** 0.022*** 0.008*** 0.007*
(7.605) (4.783) (3.789) (4.626) (5.682) (1.737) Q_Length -0.002 -0.022*** -0.002 -0.005 -0.003 -0.017*
(-0.893) (-3.160) (-0.479) (-0.389) (-0.745) (-1.919) Paricipants 0.000 -0.000 0.000 -0.003** 0.001 -0.002
(0.550) (-0.216) (0.583) (-1.970) (1.477) (-0.939) ForecastDispersion 0.002 -0.037 -0.009* -0.067 -0.004 -0.098**
(1.285) (-1.622) (-1.941) (-1.322) (-0.252) (-2.458) BTM 0.001 -0.020 0.013*** -0.064*** 0.016*** -0.051***
(0.667) (-1.551) (2.588) (-7.141) (3.151) (-3.572) Size -0.001*** 0.014*** 0.004*** 0.026*** -0.007*** 0.011***
(-2.949) (7.866) (4.150) (10.893) (-5.993) (3.576) ROA 0.011 -0.006 -0.009 -0.002 0.041 -0.072**
(1.070) (-0.439) (-0.497) (-0.030) (1.099) (-2.023) Loss -0.001 -0.115*** 0.003 -0.162*** -0.005 -0.112***
(-0.223) (-7.774) (0.572) (-7.515) (-0.481) (-7.212) Year and Industry Effects Yes Yes Yes Yes Yes Yes Clustered Standard Errors Firm and
Year Firm and
Year Firm and
Year Firm and
Year Firm and
Year Firm and
Year Observations 6,615 5,499 2,583 2,143 2,196 1,780 Adj R-squared 0.042 0.181 0.054 0.284 0.057 0.171

50
Table 10: Revision of earnings estimates by individual analysts who participate in earnings conference calls Table 10 presents the results of estimating a variation of Eq. (4) for testing the association between mentions of discretionary expenses in analysts’ questions during conference calls and analysts’ revisions at the analyst level. The sample is restricted to firms that meet or just beat analysts’ expectations by up to 5 cents per share and for analysts that we were able to match with analyst names on the I/B/E/S detail file. All variable definitions are presented in the Appendix. Robust t-statistics are reported in parentheses. *, **, and *** indicate significance levels (two-sided) of 10%, 5%, and 1%, respectively.
(1) (2) Dependent variable: Revision Revision Intercept 1.186 1.008
(1.16) (0.64) SUR 0.083*** 0.085**
(5.08) (2.19) Q_Disc.ExpensesConference Call -0.153** -0.186**
(-2.48) (-2.55) Q_Disc.ExpensesAnalyst -0.007 -0.009
(-0.44) (-0.57) Q_ToneConference Call 0.001 0.002
(0.37) (0.34) Q_LengthConference Call -0.056 -0.076
(-0.73) (-1.02) Paricipants 0.023*** 0.029**
(2.76) (2.53) ForecastDispersion -0.952*** -0.046
(-4.22) (-0.00) BTM 0.032 0.170
(0.07) (0.37) Size -0.124 -0.128
(-0.86) (-0.86) ROA 1.381* 1.237
(1.88) (1.43) Loss -0.472** -0.472
(-2.31) (-0.80) Firm-Year Effects Yes Yes Analyst Effects No Yes Clustered Standard Errors Firm Firm Observations 30,662 30,662 Adj. R-squared 0.686 0.706