analysts riefing : no.3/2016 -...
TRANSCRIPT

ANALYST’S BRIEFING : No.3/2016
August 30, 2016

This presentation was made from the analysis of reliable information in order to assist investment community to
better understand the company's financial status and operation. It also supports the "Good Corporate Governance
Project" of the Securities and Exchange Commission (SEC).
However, the information within this presentation has been derived from the existing factors in the present time.
Therefore, the forward-looking information on this presentation may not occur in the future if the aforementioned
factors or situations are changed. Investors are, nevertheless, required to use their own discretion regarding the use
of information contained in this presentation for any purpose.
For further information, please contact Investor Relations Section of the Electricity Generating Public Company
Limited (EGCO) at Tel: (662) 998-5146-9 or Email: [email protected]
2

3
Projects in Pipeline Q2/2016 Financial Results EGCO’s Overview
EGCO’s Overview Q2/2016
Financial Results Projects in Pipeline
3

Portfolio and
Corporate Strategies
4
Projects in Pipeline Q2/2016 Financial Results EGCO’s Overview
EGCO’s Shareholders
EGCO’s Group Overview

As of March 15, 2016
5
Projects in Pipeline EGCO’s Overview Q2/2016 Financial Results
EGAT 25.41%
TEPDIA 23.94%
Thai Investors 24.39%
Foreign Investors
7.72%
TEPCO 50%
MC 50%
NVDR 18.54%

Portfolio and
Corporate Strategies
6
Projects in Pipeline Q2/2016 Financial Results EGCO’s Overview
EGCO’s Shareholders
EGCO’s Group Overview

Power Plant: Renewable (Domestic)
EGCO’s Shares
Contracted Cap. (MW)
MW Equity
NED 66.67% 63.00 41.99
SPP2 100.00% 8.00 8.00
SPP3 100.00% 8.00 8.00
SPP4 100.00% 6.00 6.00
SPP5 100.00% 8.00 8.00
GPS 60.00% 26.00 15.60
TWF 90.00% 6.90 6.21
Solarco 49.00% 57.00 27.93
GIDEC 50.00% 6.50 3.25
Total 124.98
Power Plant: Overseas
EGCO’s Shares
Contracted Cap. (MW)
MW Equity
NTPC 35.00% 1,070.00 374.50
QPL 100.00% 460.00 460.00
MPPCL Unit 1&2 49.00% 630.00 308.70
MPPCL Battery Energy Storage
49.00% 10.00 4.90
SEG 20.00% 227.00 45.40
BRWF 100.00% 113.00 113.00
Total 1,306.50
57.72%
6.92%
3.09%
32.27%
EGCO Group’s portfolio comprises 23 operating power plants, total contracted capacity 4,048.85 MWe.
IPP
SPP
Renewable (Domestic)
Overseas
7
Projects in Pipeline Q2/2016 Financial Results EGCO’s Overview
Power Plant: SPP
EGCO’s Shares
Contracted Cap. (MW)
MW Equity
EGCO Cogen 80.00% 112.18 89.75
Roi-Et Green 70.30% 8.80 6.19
GCC 50.00% 109.10 54.55
NKCC 50.00% 124.60 62.30
SCC 50.00% 114.45 57.23
GYG 50.00% 20.20 10.10
Total 280.12
Power Plant: IPP
EGCO ‘s Shares
Contracted Cap. (MW)
MW Equity
KN 4 100.00% 930.00 930.00
KK2 50.00% 1,468.00 734.00
BLCP 50.00% 1,346.50 673.25
Total 2,337.25

47.61%
35.62%
16.77%
8
Projects in Pipeline Q2/2016 Financial Results
Natural Gas Coal Renewable
The percentage of power plant generation fuel mix derived from:
• Natural Gas 47.61% • Coal 35.62% • Renewable 16.77%
EGCO’s Overview
Solar 2.85%
Geothermal 1.12% Biomass 0.40% Battery Energy Storage 0.12%
Hydro 9.25%
Wind 2.95%
Waste 0.08%

67.73%
32.27%
9
Projects in Pipeline Q2/2016 Financial Results
The percentage of power plants was classified by location:
• Domestic 67.73 % • Overseas 32.27 %
EGCO’s Overview
Domestic Overseas
Philippines 19.11%
Laos 9.25%
Australia 2.79% Indonesia 1.12%

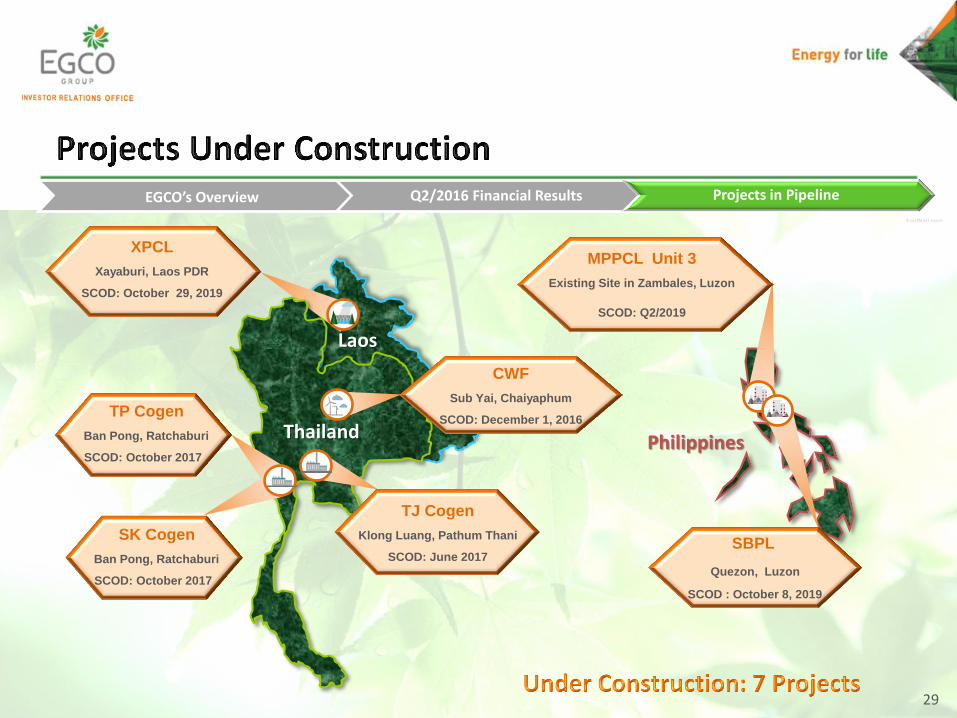
EGCO Group’s portfolio consists of 7 under construction projects, total contracted capacity 941.10 MWe.
10
Projects in Pipeline Q2/2016 Financial Results EGCO’s Overview
Power Plant: Under Construction
EGCO’s Shares Contracted Cap.
(MW) MW Equity
CWF 90.00% 80.00 72.00
TJ Cogen 100.00% 102.00 102.00
XPCL 12.50% 1,280.00 160.00
TP Cogen 100.00% 113.00 113.00
SK Cogen 100.00% 107.00 107.00
MPPCL Unit 3 49.00% 335.00 164.15
SBPL 49.00% 455.00 222.95
Total 941.10

EASTW (18.72%)
MME (40%)
ESCO (100%)
EGCO Group’s other business portfolio comprises 5 companies:
Q2/2016 Financial Results EGCO’s Overview Projects in Pipeline
QMS (100%)
PEPOI (100%) O&M
Service Management Coal Mining
Water
O&M
11

12
Projects in Pipeline Q2/2016 Financial Results EGCO’s Overview
Operate power plants to achieve optimum
efficiency and manage projects
under construction to achieve COD on time
Boost long-term earnings by acquisition of greenfield projects
and/or expansion of existing projects
Acquire operating assets to realize
quick earnings, with focus on
the Asia Pacific region

13
EGCO’s Overview Q2/2016
Financial Results Projects in Pipeline
13
Projects in Pipeline Q2/2016 Financial Results EGCO’s Overview

Power Generation Others
Unit: Million Baht
MD&A -301 MB or -12%
14
2,597 2,296
115
2,482
Projects in Pipeline Q2/2016 Financial Results EGCO’s Overview
(12)
2,308

Under Construction
1 (304)
(23)
Change of AP KN2&3 50 BLCP 50 KK2 (99)
Unit: Million Baht
15
2,597 2,296
Projects in Pipeline Q2/2016 Financial Results EGCO’s Overview
Operating Performance SEG 166 KK2 56 MPPCL 55 BRWF 32 QPL 32 EGCO 20 BLCP 17 EGCO Cogen 12
MME (10) RYPP (26) EGCOM Tara (36) Renewable Group (38) GEC (41) KN2&3 (50) ESCO (81) NTPC (103) North Pole (309)
New Power Plants KN4 25
25

Unit: Million Baht
16
MD&A -301 MB or -12 %
Projects in Pipeline Q2/2016 Financial Results EGCO’s Overview
(1,191)
2,296
(90) (164)
Deferred Tax
Net Profit before FX, DT and TFRIC 4&12
FX
TFRIC 4&12
6
(84)
75
2,597
1,397
2,048

Unit: Million Baht
17
MD&A 400 MB or 10%
Projects in Pipeline Q2/2016 Financial Results EGCO’s Overview
(1,077)
4,299
578 25
(135)
243
3,899
2,930 Deferred Tax
Net Profit before FX, DT and TFRIC 4&12
FX
TFRIC 4&12
Impairment of Assets
(69) (196)
4,637

18
-
500
1,000
1,500
2,000
2,500
3,000
3,500
4,000
4,500
5,000
Q1 Q2 HALF-YEAR
1,302
2,597
3,899
2,003 2,296
4,299
2015 2016
Million Baht
18
Projects in Pipeline Q2/2016 Financial Results EGCO’s Overview

19
-
500
1,000
1,500
2,000
2,500
3,000
3,500
4,000
4,500
5,000
Q1 Q2 HALF-YEAR
1,533 1,397
2,930 2,589
2,048
4,637
2015 2016
Million Baht
19
Projects in Pipeline Q2/2016 Financial Results EGCO’s Overview

20 Note: Excluding EGCO
BLCP 1,560 MB
Quezon 1,271 MB
Renewable (Domestic) 875 MB
MPPCL 563 MB
KK2 550 MB
NTPC 490 MB
KN2&3 326 MB
Renewable (Overseas) 295 MB
SPP (GEC, EGCO Cogen) 252 MB Other Business (ESCO, MME) 71 MB, 1%
Projects in Pipeline EGCO’s Overview Q2/2016 Financial Results
24%
20%
14%
9%
9%
8%
5% 5%
4%
KN4 25 MB, 1%

21 Note: Excluding EGCO
Domestic 3,655 MB
Overseas 2,624 MB
Projects in Pipeline EGCO’s Overview Q2/2016 Financial Results
58.21% 41.79%

AUD 239 M
Total Outstanding (Baht equivalence)
Total Outstanding
As of Jun 30, 2016
Total Outstanding
As of Mar 31, 2016
22
USD 1,652 M
THB 28,596 M
THB 91,737 M
AUD 238 M
USD 1,783 M
THB 30,533 M
THB 94,558 M
Projects in Pipeline Q2/2016 Financial Results EGCO’s Overview
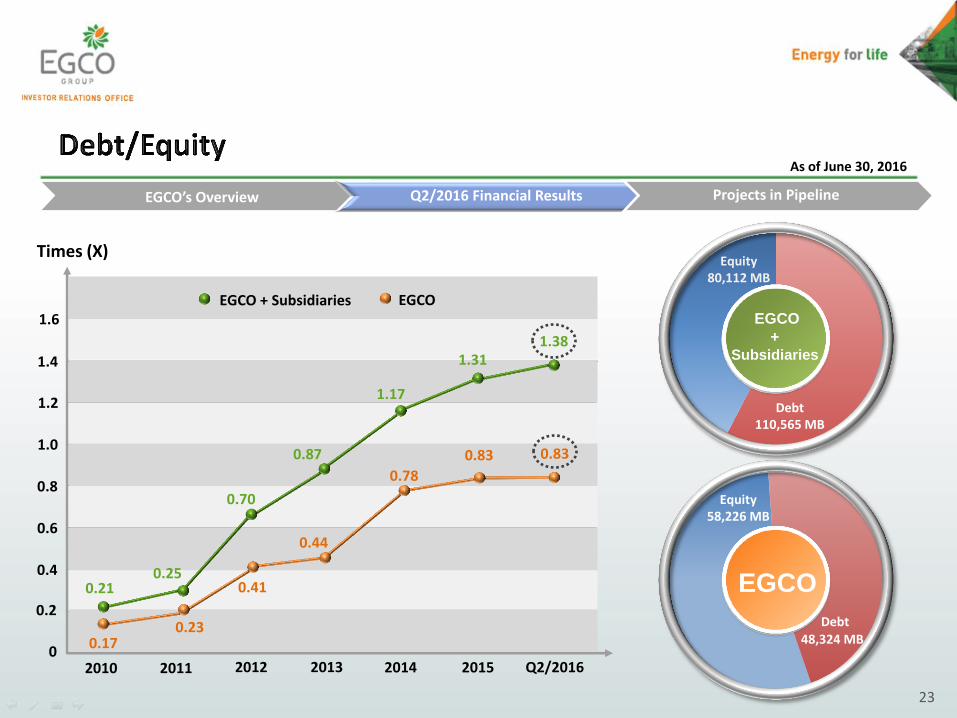
Times (X)
0
0.2
0.4
1.2
0.8
1.0
0.6
1.6
1.4
2010 2011 2012 2013 2014 2015
Debt 110,565 MB
Equity 80,112 MB
Debt
48,324 MB
Equity 58,226 MB
EGCO + Subsidiaries EGCO
23
Projects in Pipeline Q2/2016 Financial Results EGCO’s Overview
EGCO
+ Subsidiaries
EGCO
As of June 30, 2016
Q2/2016
0.17 0.23
0.41
0.44
0.78
0.83 0.83
0.21 0.25
0.70
0.87
1.17
1.38 1.31

Unit: Million Baht Q2/2016
Beginning Cash 2,675
Cash Payments from Operations (EGCO) (458)
Cash Payments from RYPP (35)
Net Cash Payments in Operating Activities (493)
Dividend Receipts from Subsidiaries, Joint Venture & Others 2,494
Investment in subsidiary (KN4) (2,005)
Other Investments (Payments) and Interest Receipts (271)
Net Cash Receipts from Investing Activities 218
Loan Receipts and Payments 1,677
Interest Payments and Financing Fee (741)
Dividend Payments (1,711)
Net Cash Payments in Financing Activities (775)
Ending Cash 1,625
24
Projects in Pipeline Q2/2016 Financial Results EGCO’s Overview
As of June 30, 2016

Baht/Share
25
Interim Payment Final Payment
EGCO Group’s Overview
Projects in Pipeline Q2/2016 Financial Results EGCO’s Overview
6.00
5.25 5.25 5.25
4.75
4.00
3.25 3.00
2.75 2.50
2.25
6.00
5.00
6.25 6.25
Note • Our dividend policy is 40% of the consolidated net profit after tax. • Board of Directors approved the appropriation of net profit from the first-half year operation of 2016
at 3.25 baht for the interim dividend payment which will be paid on Sep 16, 2016.
-
1.00
2.00
3.00
4.00
5.00
6.00
7.00
2001 2002 2003 2004 2005 2006 2007 2008 2009 2010 2011 2012 2013 2014 2015 2016
2.25 2.50 2.50 2.50 2.50 2.75 2.75 3.00 3.00 3.25 1.25 1.25
1.50 1.75
2.00
2.50 2.50 2.75 2.75 2.75
3.25 3.25 3.25 3.25
1.00 1.25 1.25 1.50 1.50
2.00
1.50

26
EGCO Group’s Overview
Projects in Pipeline Q2/2016 Financial Results EGCO’s Overview
Project Sponsor of the Year
Best energy/ Renewable energy deal- Wind,
Chaiyaphum Wind Farm Company
Best Power Deal, Thailand for Klongluang Utilities Company
Best Power Deal, Philippines for San Buenaventura Power Limited Company
Best Power Deal, Highly commended, Philippines for Masinloc Power Partners Company
EGCO Group has honored to 5 prestigious awards on new power project development awards at The Asset Triple A Asia Infrastructure Awards 2016.

27
EGCO’s Overview Q2/2016
Financial Results Projects in Pipeline
27
Projects in Pipeline Q2/2016 Financial Results EGCO’s Overview

2020 2019 2018
Projects in Pipeline
Projects in Pipeline Q2/2016 Financial Results EGCO’s Overview
28
CWF (Wind) XPCL (Hydro)
SBPL (Coal)
TP Cogen (Gas)
SK Cogen (Gas)
TJ Cogen (Gas)
2017 2016
MPPCL Unit 3 (Coal)
29
XPCL
Xayaburi, Laos PDR
SCOD: October 29, 2019
Laos
Thailand
Projects in Pipeline Q2/2016 Financial Results EGCO’s Overview
TJ Cogen
Klong Luang, Pathum Thani
SCOD: June 2017 SBPL
Quezon, Luzon
SCOD : October 8, 2019
Philippines
MPPCL Unit 3
Existing Site in Zambales, Luzon
SCOD: Q2/2019
TP Cogen
Ban Pong, Ratchaburi
SCOD: October 2017
SK Cogen
Ban Pong, Ratchaburi
SCOD: October 2017
CWF
Sub Yai, Chaiyaphum
SCOD: December 1, 2016

30
Projects in Pipeline Q2/2016 Financial Results EGCO’s Overview
Chaiyaphum Wind Farm (CWF)
Overall Progress : Ending Q2/2016, the overall progress was 93.50%. (The construction plan was 97.72%.)
Type : Wind Power Plant
Location : Sub Yai, Chaiyaphum
Shareholders : EGCO 90%, PVI Group 10% SCOD : December 1, 2016
Contractual Type : SPP Non-Firm
Contracted Capacity : 80 MW with EGAT Adder : 3.50 Baht/kWh for 10 years

31
Projects in Pipeline Q2/2016 Financial Results EGCO’s Overview
TJ Cogeneration Project
Type : Cogeneration Power Plant
Location : Klong Luang, Pathum Thani Shareholders : EGCO 100%
SCOD : June 2017
Contractual Type : SPP Cogeneration Installed Capacity : 115 MW
Contracted Capacity : 90 MW with EGAT Contracted Capacity with IU : 12 MW and 13 t/h of steam
Overall Progress : Ending Q2/2016, the overall progress was 63.03%. (The construction plan was 62.51%.)

32
Projects in Pipeline Q2/2016 Financial Results EGCO’s Overview
TP&SK Cogeneration Project
Type : Cogeneration Power Plant
Location : Ban Pong, Ratchaburi Shareholders : EGCO 100%
SCOD : October 2017
Contractual Type : SPP Cogeneration Installed Capacity : 125 MW each
Contracted Capacity : 90 MW each with EGAT Contracted Capacity with IU : TP Cogen 23 MW and 40 t/h of steam SK Cogen 17 MW and 60 t/h of steam
Project Description Project Progress
Overall Progress: Ending Q2/2016, the overall progress was 58.66%. (The construction plan was 62.15%.)

33
Projects in Pipeline Q2/2016 Financial Results EGCO’s Overview
Overall Progress : Ending Q2/2016, the overall progress was 66.69%. (The construction plan was 52.95%.)
Type : Hydro Power Plant (Run-of- River)
Location : Xayaburi District, Laos PDR
Shareholders : EGCO 12.5%, CKP 30%, EDL 20%, BEM 7.5%, GPSC 25%, PT Construction and Irrigation Co., Ltd. 5% SCOD : October 29, 2019
Contractual Type : IPP
Contracted Capacity : 1,220 MW with EGAT and 60 MW with EDL PPA : 29 years with EGAT and EDL
Xayaburi Power Plant Project (XPCL)

34
Projects in Pipeline Q2/2016 Financial Results EGCO’s Overview
MPPCL Unit 3
Overall Progress : Ending Q2/2016,
site preparation and construction equipment
survey are ongoing.
Type : Brownfield expansion - Coal-fired Power Plant Project is an expansion at the same campus for Units 1&2 with same shareholders and project holding company
Technology : Supercritical Boiler
Location : Existing Site in Zambales, Luzon
Shareholders : EGCO 49.00% and AES 51%
SCOD : Q2/2019
Installed Capacity : 335 MW
Contracted Capacity : 335 MW to date with
Electric Cooperatives (EC)
Term of Contract : 20 years with the ECs

35
Projects in Pipeline Q2/2016 Financial Results EGCO’s Overview
Sanbuenaventura Power Co. Ltd (SBPL)
Type : Coal-Fired Power Plant
Technology : Supercritical Boiler
Location : Quezon, Luzon, The Philippines
Shareholders : EGCO Group 49%, MPG 51% SCOD : October 8, 2019 Contractual Type : IPP
Installed Capacity : 500 MW
Contracted Capacity : 455 MW with Meralco PSA Term : 20 years with 5-year extension
Overall Progress: Ending Q2/2016,
constructions of EPC Contractor’s site office and camp were completed. Engineering and procurement works are ongoing.

36
CWF
Projects in Pipeline Q2/2016 Financial Results EGCO’s Overview
TJ Cogen XPCL
Plan 97.72%
Actual 93.50%
Plan 62.51%
Actual 63.03% Actual 66.69%
Plan 52.95%
TP&SK Cogen
Actual 58.66%
Plan 62.15%

37
KN 4
Khanom, Nakhon Si Thammarat
SCOD: June 19, 2016
Projects in Pipeline Q2/2016 Financial Results EGCO’s Overview
3 Significant Events
Thailand Philippines
MPPCL
Zambales, Luzon
Add. Share Purchase: July 8, 2016
Indonesia
SEG
Bandung, West Java
Tariff Adjustment : April 5, 2016

38
Type: Combined Cycle Power Plant
Location: Khanom, Nakhon Si Thammarat
Shareholders : EGCO 100%
SCOD : June 19, 2016
Contractual Type : IPP
Contracted Capacity : 930 MW
PPA : 25 years with EGAT
Capacity Factor Rate : 92.5%
Project Description
Projects in Pipeline Q2/2016 Financial Results EGCO’s Overview
Achievement
COD on June 19, 2016
COD Khanom Power Plant Project Unit 4 (KN4)

39
Projects in Pipeline Q2/2016 Financial Results EGCO’s Overview
MPPCL Additional Shares Purchase
Achievement
Acquisition of additional shares of 8.05%
in MPPCL from IFC.
Share Transfer was completed on July 8, 2016.
Project Description
Type : Coal Fired Power Plant
Technology : Subcritical Boiler
Location : Zambales Province, Luzon, The Philippines Shareholders : EGCO 49%, AES 51% Installed Capacity : Unit 1&2 – 2x315 MW (COD: 1998) Unit 3 - 335 MW (SCOD: Q2/2019)
Battery Energy Storage - 10 MW
(ASPA: December 2016)
40
Projects in Pipeline Q2/2016 Financial Results EGCO’s Overview
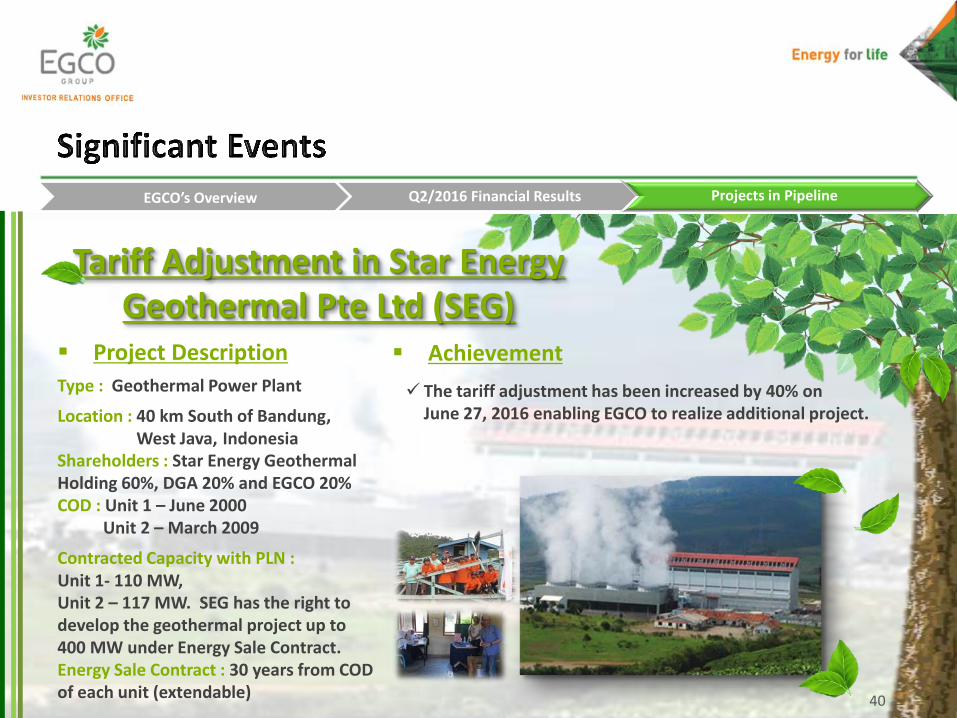
Tariff Adjustment in Star Energy Geothermal Pte Ltd (SEG)
Achievement
The tariff adjustment has been increased by 40% on June 27, 2016 enabling EGCO to realize additional project.
Project Description
Type : Geothermal Power Plant
Location : 40 km South of Bandung, West Java, Indonesia Shareholders : Star Energy Geothermal Holding 60%, DGA 20% and EGCO 20% COD : Unit 1 – June 2000 Unit 2 – March 2009
Contracted Capacity with PLN : Unit 1- 110 MW, Unit 2 – 117 MW. SEG has the right to develop the geothermal project up to 400 MW under Energy Sale Contract. Energy Sale Contract : 30 years from COD of each unit (extendable)

41
Laos
Cambodia
Malaysia
Yala Gulf-GYG
Rayong BLCP EGCO Cogen
Khammouane
Nam Theun 2
Roi-Et Roi-Et Green SPP 5
Nakorn Si Thammarat
Samutprakarn Gulf-SCC
Philippines
IPP
SPP
Coal
Coal Mining
Geothermal
Waste
Xayaburi Xayaburi
Luzon
Quezon
Saraburi Gulf-GCC Gulf-NKCC Gulf-GPG (Kaeng Khoi 2) SPP2
Lopburi
NED solar
Thailand
Ratchaburi TP Cogen SK Cogen
Pathumthani TJ Cogen
GPS Nakhon Sawan (Phase 1-2) Chai Nat (Phase 3) Petchaboon (Phase 4)
Chaiyaphum TWF
Nakorn Pathom/
Suphanburi
Solarco
Biomass
Hydro
Solar
Wind
Battery Storage
Under Construction
South Sumatra MME Coal Mining
NSW
Boco Rock
Chaiyaphum CWF
Khanom 4
Luzon
MPPCL Unit 1&2
Luzon SBPL
West Java Star Energy
MPPCL Unit 3
EGCO’s Investment Map
MPPCL Battery Storage Project Sisaket SPP3-4
Songkhla GIDEC

THANK YOU
42

Analyst Site Visit To Khanom 4
Schedule: Wednesday 30th November - Thursday 1st December, 2016
Flight Schedule: Air Asia Airline
Don Mueang -> Surat Thani FD3237 (9.45) (11.00)
Surat Thani -> Don Mueang FD3240 (13.20) (14.20)

Analyst Site Visit To Khanom 4
Wednesday 30th November, 2016 (1st Day) 9.45 hrs. Departure from Bangkok by Air Asia (FD 3237) 11.00 hrs. Arrival at Surat Thani Airport 12.00 hrs. Transfer to Khanom Power Plant 12.30 hrs. Lunch 15.30 hrs. Power Plant Site Visit 19.00 hrs. Dinner and Stay overnight
Thursday 1st December, 2016 (2nd Day) Breakfast
09.00 hrs. Transfer to Surat Thani Airport
11.00 hrs. Lunch
13.20 hrs. Departure from Surat Thani by Air Asia (FD 3240)
14.20 hrs. Arrival at Bangkok Airport

45

61.6% 13.5%
18.2%
6.7%
NATURAL GAS HYDRO COAL OTHERS*
46
Classified by Producer Classified by Fuel type
As of June 2016, Thailand’s Power Installed Capacity was 41,097.25 MW.
EGAT : 16,376 MW SPP : 5,895 MW
IPP : 14,949 MW Import : 3,878 MW
*OTHERS = Fuel Oil, Diesel, Renewable
Source: EGAT
39.8%
36.4%
14.4%
9.4%
EGAT IPP SPP IMPORT
Natural Gas : 25,281 MW Coal : 7,496 MW
Hydro : 5,553 MW Others* : 2,768 MW

15,000
20,000
25,000
30,000
January February March April May June July August September October November December
2009 2010 2011 2012 2013 2014 2015 2016
47
MW
Source: EGAT
8.3%
27,345.80 MW (June 11, 2015)
29,619.80 MW (May 11, 2016)
As of June 2016
26,471.20 MW (June 9, 2016)

FX Gain/(Loss) Q2/2015 Q2/2016 +/- EGCO (1,197.10) 75.79 1,272.89 BPU (0.16) 1.73 1.90 KLU - (6.81) (6.81) KN23 - - - KN4 (392.62) (113.12) 392.62 EGCO Cogen - - - Roi-Et Green (0.37) - 0.37 ESCO 2.85 (0.36) (3.22) PEPOI 0.50 1.02 0.52 Quezon (6.21) (13.08) (6.87) QMS 0.19 0.57 0.38 SPP2 - - - SPP3 - - - SPP4 - - - SPP5 - - - TWF 0.01 0.08 - Solarco 0.24 0.73 0.49 CWF 14.74 9.43 (5.31) BRWF 2.98 0.21 (2.77) North Pole 0.09 0.07 (0.02) Total Subs FX (1,574.87) (43.74) 1,644.18 BLCP 279.18 (24.12) (303.30) GPG (KK2) (54.27) 2.32 56.59 GEC(GCC, NKCC, SCC, GYG) (9.65) 1.18 122.55 NTPC 155.96 (14.52) (170.48) NED - - - GPS - - - GIDEC (0.01) - - MME 0.01 - (0.01) SBPL 0.60 (0.54) (1.14) MPPCL 12.89 (15.11) (28.00) SEG (1.20) 3.70 4.90 Total JVEs FX 383.50 (47.09) (318.89) Grand Total (1,191.36) (90.83) 1,325.30
FX Variance MD&A
48

Deferred Income (Expense) Tax
49
Deferred Income (Expense) Tax Q2/2015 Q2/2016 Variance
EGCO 27.44 - (27.44)
RYPP 0.15 (0.73) (0.88)
KN23 1.86 5.66
KN4 136.02 56.46 (79.56)
EGCO Cogen (0.06) (0.53) (0.48)
Roi-Et Green (0.19) (0.19) 0.00
ESCO 0.35 0.48 0.13
EGCOM Tara (0.11) - 0.11
PEPOI (11.29) - 11.29
Quezon (39.09) (76.50) (37.41)
QMS 0.17 0.18 0.01
SPP2 0.02 - (0.02)
SPP3 0.02 - (0.02)
SPP4 0.01 - (0.01)
SPP5 0.02 - (0.02)
TWF 0.06 0.05 (0.01)
BRWF (35.34) (23.17) 12.17
Total Subs Net Profit 80.03 (38.30) (122.12)
BLCP (125.88) (8.94) 116.93
GPG (KK2) - - -
GEC (GCC, NKCC, SCC, GYG) (0.36) 2.59 2.95
NTPC 0.22 0.28 0.06
NED - - -
GPS 0.01 (0.02) (0.02)
GIDEC - - -
MME - 1.40 1.40
SBPL - (6.55) (6.55)
MPPCL (2.48) (35.74) (33.27)
SEG (35.72) (78.25) (42.53)
Total JVEs Net Profit (164.22) (125.24) 38.98
Grand Total (84.19) (163.53) (83.14)

(153)
178
3
70
(1)
(172)
13
(71)
81
(6)
87
(250)
(150)
(50)
50
150
250
KEGCO Roi-EtGreen
BLCP GPG GYG NTPC ET
6M/2015
6M/2016
Impact of the Adoption of TFRIC 4 and TFRIC 12
50
Million Baht
+ 243 MB
- 68 MB
144
2

* FX gains/losses from Income Statements including financial cost from foreign currency loans (EGCO & Subs and JVs)
51
6M/2015 6M/2016
Debt to Equity (Time) 1.25 1.38
Net Debt to Equity (Time) 1.09 1.18
Net Profit before FX* (Million Baht) 3,764 2,132
EPS (Baht) 7.15 3.88
Operating Cash Flow / share (Baht) 4.96 6.36
BV / share (Baht) 142.92 151.18
Financial Ratio Highlights (Consolidated)

52
Segmental Operating Results, Ended June 30, 2016
Joint Ventures
Others
(Million Baht) EGCO RYPPKEGCO
(KN2&3)
KEGCO
(KN4)
EGCO
Cogen
Roi-Et
GreenSPP4 SPP3 Solarco SPP2 SPP5 TWF Quezon
TJ
Cogen
TP&SK
CogenCWF BRWF BLCP KK2 GEC NED NT2 GPS GIDEC SBPL MPPCL SEG ESCO MME
Sales of Electricity - - 399 540 426 58 48 44 338 46 48 15 2,700 - - - 259 4,921 - - - 4,921
- Capacity Payment - - 388 167 - - - - - - - - - - - - - 555 - - - 555
- Energy Payment - - 11 373 426 58 48 44 338 46 48 15 2,700 - - - 259 4,366 - - - 4,366
Sales of Water - - - - - - - - - - - - - - - - - - - - - -
Service Income - - - - - - - - - - - - - - - - - - 107 137 246 246
Cost of Sales - - 233 422 354 33 10 12 78 13 12 6 1,378 - - - 105 2,656 - - - 2,656
Cost of Services - - - - - - - - - - - - - - - - - - 112 (116) (323) (323)
Gross Profit - - 166 118 72 25 38 32 260 33 36 9 1,322 - - - 154 - - - - - - - - - - 2,265 (5) 253 569 2,834
EBITDA (723) (238) 734 128 170 35 62 83 633 82 87 29 2,478 (12) (15) (6) 345 2,370 1,202 202 461 1,036 137 13 (18) 1,374 455 11,104 92 26 (143) 10,961
EBIT (787) (239) 394 94 119 28 47 64 504 62 68 21 2,149 (12) (15) (6) 187 1,917 801 202 358 817 96 2 (18) 1,066 361 8,280 82 25 (155) 8,125
Net Profit before FX and
deferred income tax(1,558) (239) 326 25 101 28 30 42 333 40 47 12 1,226 (13) (15) (11) 15 1,560 550 152 290 490 70 (14) (18) 563 280 4,312 66 5 (209) 4,103
Net Profit before FX (1,558) (201) 328 90 100 28 30 42 333 40 47 12 1,234 (13) (15) (11) (30) 1,624 550 156 290 532 70 (14) (25) 538 154 4,331 67 8 (203) 4,128
Net Profit (677) (201) 328 58 100 28 30 42 334 40 47 12 1,233 (18) (2) 19 (30) 1,436 584 160 290 424 70 (14) (91) 545 162 4,909 67 8 (203) 4,706
6M2016 HoldingSubsidiaries Joint Ventures
Total Power
generation
Total Other
businesses
Grand
Total
Power Generation Power Generation Others
Subsidiaries

53
Segmental Operating Results, Ended June 30, 2015
Joint Ventures
Others
(Million Baht) EGCO RYPPKEGCO
(KN2&3)
KEGCO
(KN4)
EGCO
Cogen
Roi-Et
GreenSPP4 SPP3 Solarco SPP2 SPP5 TWF Quezon
TJ
Cogen
TP&SK
CogenCWF BRWF BLCP KK2 GEC NED NT2 GPS GIDEC SBPL MPPCL SEG ESCO MME
Sales of Electricity - - 712 - 891 117 74 48 338 99 100 38 4,729 - - - 380 7,526 - - - 7,526
- Capacity Payment - - 680 - 417 54 - - - - - - - - - - - 1,151 - - - 1,151
- Energy Payment - - 32 - 474 63 74 97 696 99 100 38 4,729 - - - 380 6,782 - - - 6,782
Sales of Water - - - - - - - - - - - - - - - - - - - - - -
Service Income - - - - - - - - - - - - - - - - - - 473 473 473
Cost of Sales - - 562 - 848 78 18 25 155 25 26 13 2,741 - - - 191 4,682 - - - 4,682
Cost of Services - - - - - - - - - - - - 163 - - - - 163 377 377 540
Gross Profit - - 150 - 43 39 56 23 183 74 74 25 1,825 - - - 189 - - - - - - - - - - 2,681 96 - 96 2,777
EBITDA (853) (42) 462 - 32 34 67 90 653 89 90 29 2,071 (7) 2 (3) 307 1,565 936 266 358 998 148 (8) 8 1,233 108 8,633 155 18 173 8,806
EBIT (913) (43) 81 - (21) 28 52 71 523 69 71 21 1,749 (7) 2 (3) 151 1,565 936 266 358 1,022 107 (8) 8 955 108 7,148 145 18 163 7,311
Net Profit before FX and
deferred income tax(1,420) (42) 33 - (23) 27 33 46 333 47 49 13 1,058 (7) 2 (3) 8 1,216 607 168 286 693 78 (22) 8 482 36 3,706 104 17 121 3,827
Net Profit before FX (1,444) (54) 180 - 28 35 36 49 375 48 51 13 1,021 (7) 2 (3) (46) 1,128 606 104 281 694 78 (22) 7 477 (3) 3,634 43 17 60 3,694
Net Profit (2,177) (54) (406) - 28 34 36 49 376 48 51 13 1,017 (7) 1 8 (50) 1,310 577 100 281 803 78 (22) 8 471 (12) 2,561 38 17 55 2,616
6M2015 HoldingSubsidiaries Joint Ventures
Total Power
generation
Total Other
businesses
Grand
Total
Power Generation Power Generation Others
Subsidiaries

2,9
52
4,7
83
2,1
27
4,0
04
2,6
93
1,1
55
5,6
43
5,4
76
5,8
16
5,3
11
5,1
88
5,2
58
4,7
78
10
,01
8
10
,03
6
10
,61
7
10
,77
0
10
,15
7
10
,82
5
10
,78
4
9,3
29
9,8
57
8,8
13
10
,84
8
9,3
23
6,1
50
5,0
73
-
4,9
76
6,3
61
5,7
70
6,2
74
6,2
83
5,3
14
- 2,000 4,000 6,000 8,000
10,000 12,000
2009 2010 2011 2012 2013 2014 2015
RYPP KEGCO (KN2&3) BLCP KK2 NT2
Net Generation
GWh
Electricity Sales
Million Baht
REGCO and KEGCO receive the capacity payment (Rayong Power Plant) or availability payment (KEGCO) for maintaining the availability of the power plants, regardless of whether the electric power will be supplied to EGAT
or not.
EGAT is the sole off-taker for electricity produced by Rayong Power Plant and KEGCO under long term cost-plus based Power Purchase Agreements (PPAs).
54
Annual Net Generation & Electricity Sales for the Year 2009-2015
2,3
19
2,7
88
2,1
70
1,7
62
2,0
38
1,5
28
1,3
97
17
,90
9
17
,70
6
17
,86
8
18
,50
5
17
,25
5
18
,65
5
18
,56
1
22
,50
6
22
,75
0
22
,65
5
29
,64
9
27
,47
0
20
,46
2
16
,77
1
6,3
17
7,6
72
8,1
07
7,9
37
8,6
67
8,9
98
-
10,000
20,000
30,000
40,000
2009 2010 2011 2012 2013 2014 2015
KEGCO (KN2&3) BLCP KK2 NT2

55
Major Maintenance Expenses
Million Baht
2015
Quarter 1 2 3 4 Total
Actual Actual Actual Actual
Spare Parts 0.89 3.44 7.02 4.09 15.44
Service Charge 3.59 2.28 20.50 5.06 31.43
Total 4.48 5.72 27.52 9.15 46.87
KEGCO
2016
KEGCO
Quarter 1 2 3 4 Total
Actual Actual Actual Actual
Spare Parts 0.00 0.00
Service Charge 0.00 0.00
Total 0.00 0.00

Operating Performance Equivalent Availability Factor
56
KEGCO
Target EAF (%) Actual EAF (%) Target EAF (%) Actual EAF (%) Target EAF (%) Actual EAF (%) Target EAF (%) Actual EAF (%)
Barge #2 91.00 91.89 91.00 93.70 91.00 86.69 90.38 100.00
CCGT #3 96.00 94.06 90.59 93.96 88.09 92.07 91.75 97.74
KEGCO
Target EAF (%) Actual EAF (%) Target EAF (%) Actual EAF (%) Target EAF (%) Actual EAF (%) Target EAF (%) Actual EAF (%)
Barge #2 91.00 100.00 90.49 100.00
CCGT #3 88.28 98.70 88.67 90.68
Khanom Unit 4 - - 91.30 100.00
2015
Plant Type1Q15 2Q15 3Q15 4Q15
2016
Plant Type1Q16 2Q16 3Q16 4Q16

57
Net Generation and Fuel Consumption
KEGCO
Barge # 2 1Q15 2Q15 3Q15 4Q15 1Q16 2Q16 3Q16 4Q16
Net Generation
- By Natural Gas (GWh) 67 43 56 13 8 -
- By Secondary Fuel (GWh) - - - - - -
Fuel Consumption
- By Natural Gas (MMBTU) 869,558 580,306 740,593 165,593 99,015 -
- By Secondary Fuel (Million Litre) 0.027 0.030 0.046 - 0.010 -
CCGT # 3 1Q15 2Q15 3Q15 4Q15 1Q16 2Q16 3Q16 4Q16
Net Generation
- By Natural Gas (GWh) 1,195 1,181 1,156 1,067 1,143 856
- By Secondary Fuel (GWh) - - - - - -
Fuel Consumption
- By Natural Gas (MMBTU) 10,269,184 9,728,099 9,518,343 8,973,170 9,523,751 7,260,397
- By Secondary Fuel (Million Litre) - 0.081 0.012 0.032 0.014 -
Khanom Unit 4 1Q15 2Q15 3Q15 4Q15 1Q16 2Q16 3Q16 4Q16
Net Generation
- By Natural Gas (GWh) - 247
- By Secondary Fuel (GWh) - -
Fuel Consumption -
- By Natural Gas (MMBTU) - 1,598,928
- By Secondary Fuel (Million Litre) - -
20162015

58
Net Generation and Fuel Consumption
QPL
Target EAF (%) Actual EAF (%) Target EAF (%) Actual EAF (%) Target EAF (%) Actual EAF (%) Target EAF (%) Actual EAF (%)
51.42% 46.57% 93.39% 98.43% 91.43% 94.56% 95.06% 95.51%
QPL
Target EAF (%) Actual EAF (%) Target EAF (%) Actual EAF (%) Target EAF (%) Actual EAF (%) Target EAF (%) Actual EAF (%)
62.23% 78.23% 93.00% 89.90% 93.00% 93.00%
2015
Plant Type1Q15 2Q15 3Q15 4Q15
2016
Plant Type1Q16 2Q16 3Q16 4Q16

59
Net Generation and Fuel Consumption
1Q15 2Q15 3Q15 4Q15 1Q16 2Q16 3Q16 4Q16
Net Generation
- By Coal (GWh) 354 912 887 848 668 865
- By Secondary Fuel (GWh)
Fuel Consumption
- By Coal (Ton) 173,021 443,885 421,633 402,647 352,374 406,766
- By Secondary Fuel (Million Litre)
QPL20162015
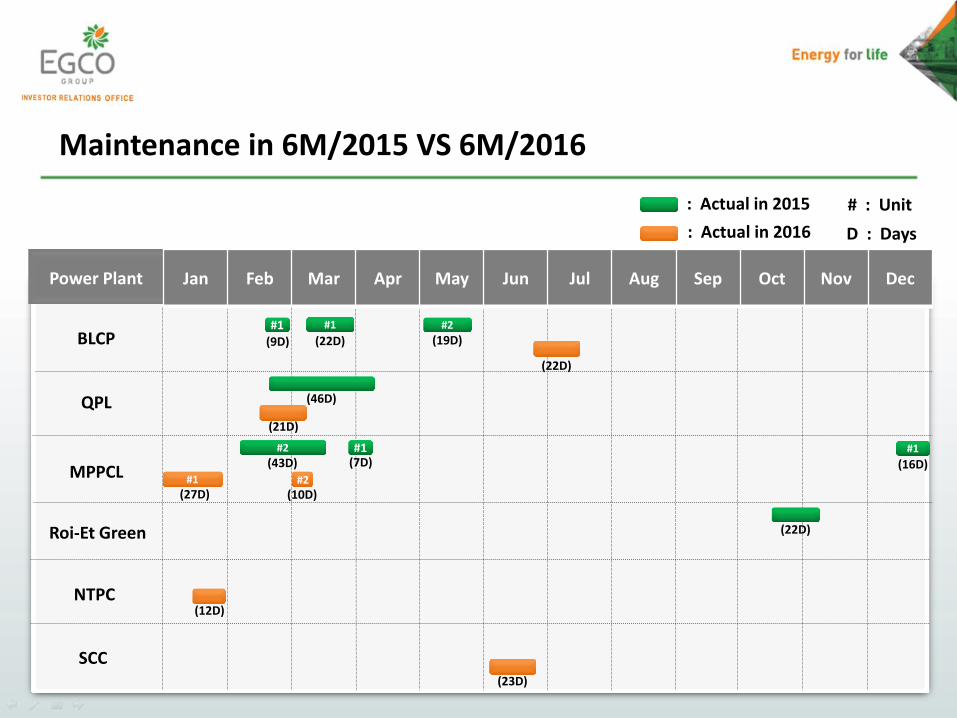
Maintenance in 6M/2015 VS 6M/2016
60
# : Unit : Actual in 2015
: Actual in 2016 D : Days
Power Plant
QPL
MPPCL (7D) (43D)
BLCP
May
Roi-Et Green
Jan Feb Mar Apr May Jun Jul Aug Sep Oct Nov Dec
#1
(46D)
(9D) (22D)
#1
#1 #2
#2
(19D)
(22D)
NTPC
(21D)
#1
#1
(27D)
(16D) #2
(10D)
(12D)
(22D)
SCC (23D)
