analyst presentation of 2017 annual results - hkland.com · 2017 results 5 investment properties...
TRANSCRIPT

2017 ResultsPresentation
9 March 2018
2017 ResultsPresentation

2017 Results 2
1. 2017 Results Highlights
2. Investment Properties
3. Development Properties
4. Financial Highlights
5. Outlook
6. Q&A
Speakers: Robert Wong, Chief Executive & Simon Dixon, Chief Financial Officer
Agenda

2017 Results 3
Key figures
Profit1: US$5,585m (2016: US$3,346m)
Net debt: US$2.5bn (Dec 2016: US$2.0bn)
NAV per share: US$15.63 (Dec 2016: US$13.30)
Final dividend per share: US¢14 (1H 2017: US¢6)
Highlights
Underlying profit up 14% to a record US$970m
Full-year dividend up 5%
Net Asset Value per share up 18%
WF CENTRAL retail complex opens in Beijing
Ten new projects secured in 2017; two new projects in
YTD 2018
2017 Results Highlights
US$970mUnderlying profit
US$36.8bnShareholders’ funds
905
848
970
2015 2016 2017
29 3137
Dec 2015 Dec 2016 Dec 2017
+14% YoY +18% YoY
1 Attributable to Shareholders of the Company

42017 Results
Investment Properties

2017 Results 5
Investment Properties Overview
Investment properties are primarily located in Hong Kong and Singapore
9,214*
TOTAL
TOTAL COMPLETED AREA (HKL’s share)
7,152
1,458
604
Office
Retail
Hotel
(000’s sq. ft NFA)
257TOTAL
OTHERS
1,780TOTAL
88TOTAL
HONG KONG
4,139
590
143
MACAU98
151
HANOI75
8
BANGKOK27
61
SINGAPORE1,651
129
42
215
4,872TOTAL
83TOTAL
JAKARTA1,033
92
1,125TOTAL
PHNOM PENH185
91
95
*Equivalent to 856,000 sq. m.
249TOTAL
371TOTAL
389TOTAL
BEIJING389
*As at 8 Mar 2018

2017 Results 6
Accounting
2015 2016 2017
Average net rent(HK$ psf/month)
101 103 108
Year-end vacancy 3.4% 2.2% 1.4%
Weighted average lease expiry (years)
4.1 3.8 3.7
2018 2019 2020
Total lettable office area subject to expiration/rent revisions(’000 sq. ft)
1,293 1,026 1,144
% of area subject to expiration/rent revisions
31% 25% 28%
- Expiration 17% 19% 23%
- Rent revisions 14% 6% 5%
Average expiring net rent(HK$ psf/month)
101 116 112
AVERAGE RENTS & VACANCY
EXPIRATION AND INTERIM RENT REVISIONS
Positive rental reversions and lower vacancy as market supply remained tight
Hong Kong Portfolio – Office
41%
30%
7%
6%
3%
1%
12%
OFFICE TENANT PROFILE
Trading
Banks and Other Financial Services
Legal
Government Others
Property

2017 Results 7
2015 2016 2017
Average net rent(HK$ psf/month)
221 218 224
Year-end vacancy 0% 0% 0.1%
Weighted average lease expiry (years)
2.4 2.8 2.7
AVERAGE RENTS & VACANCY
Higher rents due to positive 2016 reversions
Hong Kong Portfolio – Retail
48%
31%
5%
16%
RETAIL TENANT PROFILE
Fashion & Accessories
Jewellery & Watches Others
Food & Beverages

2017 Results 8
2018 2019 2020
HKL’s Share: Total lettable office area subject to expiration/rent revisions (’000 sq. ft)
687 284 340
% of area subject to expiration/rent revisions
42% 17% 21%
- Expiration 5% 10% 13%
- Rent revisions 37% 7% 7%
Average expiring gross rent(S$ psf/month)
8.8 7.6 9.1
Low vacancy rate
Singapore Portfolio – Office
2015 2016 2017
Average gross rent(S$ psf/month)
9.5 9.3 9.1
Year-end vacancy 3.0% 0.1% 0.3%
Weighted average lease expiry (years)
5.1 4.8 4.1
73%
7%
5%
6%
3%2% 4%
OFFICE TENANT PROFILE EXPIRATION AND INTERIM RENT REVISIONS
AVERAGE RENTS & VACANCY
Banks and Other Financial Services
Legal
Natural Resources
Accounting
IT Services & Consultancy
Property
Others

2017 Results 9
Rest of Asia Portfolio
Beijing – WF CENTRAL (84%-owned)
Prestigious retail centre, which includes an exclusive luxury hotel (Mandarin Oriental)
Destination for renowned art and cultural exhibitions in the city
Trusted partner of prominent fashion houses making their debuts in mainland China
43,000 sq. m. NFA of retail space
Retail soft opened in Nov 2017, with over 110 tenants committed
Diverse range of retail brands and F & B offerings
Occupancy: 77% (at Feb 2018)
Hotel opening in 2H 2018
Jakarta – Jakarta Land (50%-owned)
Existing portfolio features 209,000 sq. m. NFA, including WTC 3 which was completed in early 2018
Average gross rent: US$25 psm per month (2016: US$25 psm per month)
Occupancy: 92%
Phnom Penh – EXCHANGE SQUARE (100%-owned)
Completed in early 2017
NFA: 25,000 sq. m.
Average gross rent: US$25 psm per month
Occupancy: 65%
MAINLAND CHINA SOUTHEAST ASIA
WF CENTRAL opened in Beijing, while completions took place in Cambodia and Indonesia

2017 Results 10
JV with Central Group (49%-owned)
Located in the prime CBD area of Bangkok near the junction of Wireless Road and Rama I Road
Site area: 3.6 ha
Office and retail to be developed in two phases to 2025
GFA: 440,000 sq. m.
New Project in Thailand
THAILAND
Expanding our portfolio of prime investment properties in the heart of Bangkok

112017 Results
Development Properties

2017 Results 12
Development Properties Overview
The development properties portfolio spans seven countries and 14 cities, with a key focus on mainland China and Singapore
823 TOTAL
THE PHILIPPINES170
653
797TOTAL
INDONESIA30
767
8,602*
TOTAL
TOTAL DEVELOPABLE AREA (HKL’s share)
2,774
5,828
Constructed
Under construction/ to be developed
(000’s sq. m. GFA)5,759TOTAL
MAINLAND CHINA2,478
3,281
19TOTAL
THAILAND-
19
VIETNAM-
168
285TOTAL
SINGAPORE-
285
3TOTAL
OTHERS3
-
*Includes newly acquired projects up to 8 Mar 2018
748 TOTAL MALAYSIA
93
655
168TOTAL

2017 Results 13
CHENGDU
CHONGQING
NANJING SHANGHAI
Mainland China Portfolio – Overview
Eight projects
Total GFA 6.4 million sq. m.
(HKL’s share: 4.3 million sq. m.)
WE City (50%-owned)
Total GFA 896,000 sq. m.
(HKL’s share: 448,000 sq. m.)
Parkville (50%-owned)
Total GFA 230,000 sq. m.
(HKL’s share: 115,000 sq. m.)
Two projects
Total GFA 453,000 sq. m.
(HKL’s share: 307,000 sq. m.)
IMAGE TO BE CONFIRMED
HANGZHOU
New Project in Xiaoshan (30%-owned)
Total GFA 776,000 sq. m.
(HKL’s share: 233,000 sq. m.)
Wuhan Dream Land (50%-owned)
Total GFA 493,000 sq. m.
(HKL’s share: 246,000 sq. m.)
WUHAN BEIJING
Central Park (40%-owned)

2017 Results 14
REVENUE RECOGNISED* CONTRACTED SALES* SOLD BUT UNRECOGNISED SALES*
Mainland China Portfolio
Strong contracted sales and improved profit contribution as a result of continued positive market sentiment and further completions
-
200
400
600
800
1,000
1,200
1,400
1,600
2015 2016 2017
-
200
400
600
800
1,000
1,200
1,400
1,600
2015 2016 2017
US$m US$m
-
200
400
600
800
1,000
1,200
2015 2016 2017
US$m
$505m
$676m
$1,347m
$802m
$1,105m $1,112m$821m
$1,083m$1,032m
Chongqing Chengdu
Shanghai Beijing
Sales to be recognised next 12 months
Sales to be recognised after next 12 months
Chongqing Chengdu
Shanghai Beijing
* The above analysis includes share of Joint Ventures & Associates

2017 Results 15
SOL ACRES
Singapore Portfolio – Overview
LAKEVILLE
699 units
674,000 sq. ft GFA (63,000 sq. m.)
Completed in 2017
100% sold
LAKE GRANDE
710 units
537,000 sq. ft GFA(50,000 sq. m.)
Completion: 2019
Pre-sold: 98%
MARGARET VILLE
309 units
239,000 sq. ft GFA(22,200 sq. m.)
Completion: 2021
IMAGE TO BE UPDATED
EUNOSVILLE
1,399 units (estimated)
1.05 million sq. ft GFA (98,000 sq. m.)
Completion: 2021
1,327 units
1.24 million sq. ft GFA (115,000 sq. m.)
Completion: 2018
Pre-sold: 96%
IMAGE TO BE UPDATED

2017 Results 16
REVENUE RECOGNISED CONTRACTED SALES SOLD BUT UNRECOGNISED SALES
Singapore Portfolio
0
100
200
300
400
500
600
700
800
2015 2016 2017
$707m
0
100
200
300
400
500
600
700
800
2015 2016 2017
0
200
400
600
800
1,000
1,200
1,400
2015 2016 2017
$453m
$687m
$491m
$1,183m
$1,294m
$996m*
US$m US$m US$m
$561m
$615m
Hallmark Residence J Gateway
LakeVille
Hallmark Residence LakeVille
Sol Acres Lake Grande
Sales to be recognised next 12 months
Sales to be recognised after next 12 months
Palms
Ripple Bay Palms
Revenue and profit contribution driven by the completion of LakeVille
Marina Bay Marina Bay
*Reflects sales to be recognised in future periods under percentage of completion method. Total sold but unrecognised sales under the completed contract method amounted to US$1,242m as at 31 Dec 2017.
2017 Results 17
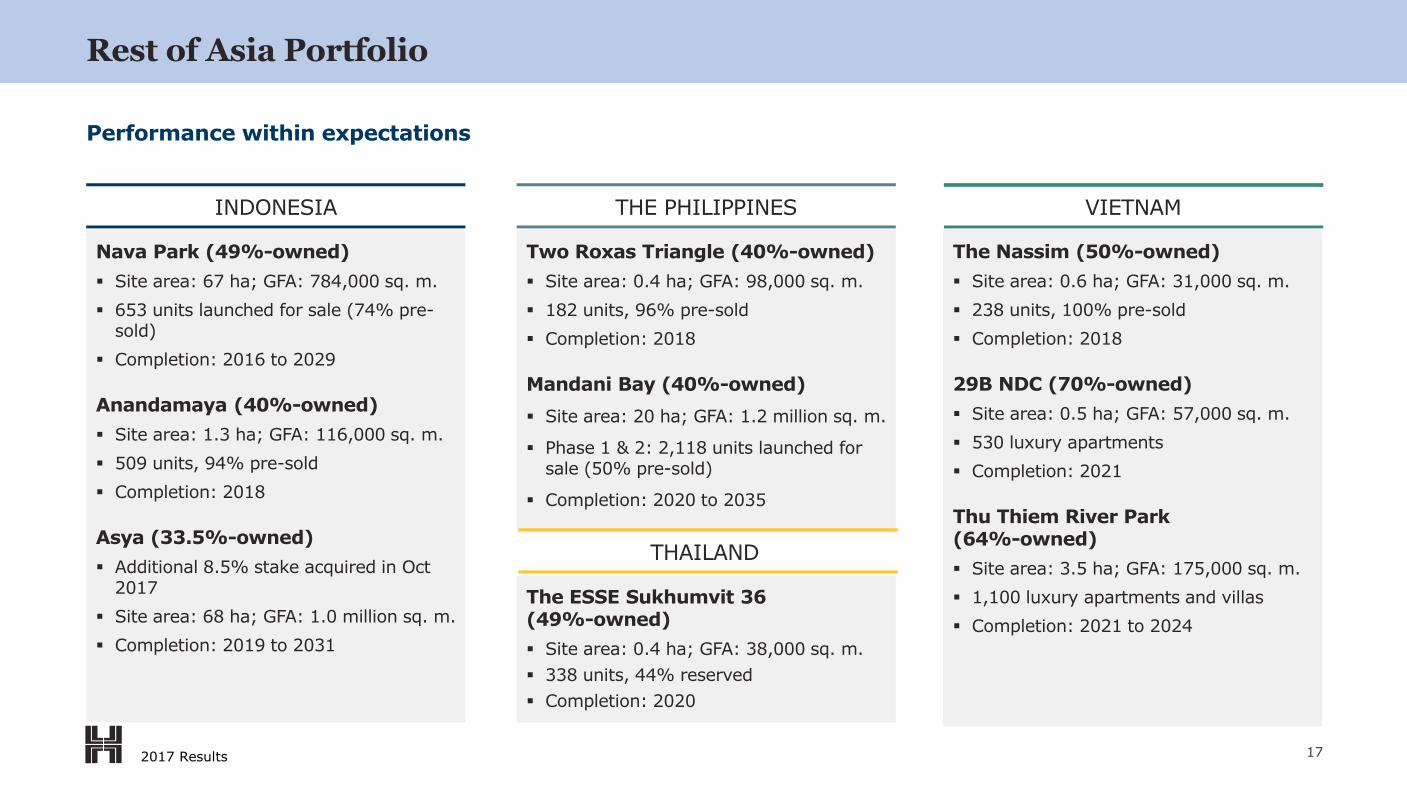
Rest of Asia Portfolio
Nava Park (49%-owned)
Site area: 67 ha; GFA: 784,000 sq. m.
653 units launched for sale (74% pre-sold)
Completion: 2016 to 2029
Anandamaya (40%-owned)
Site area: 1.3 ha; GFA: 116,000 sq. m.
509 units, 94% pre-sold
Completion: 2018
Asya (33.5%-owned)
Additional 8.5% stake acquired in Oct 2017
Site area: 68 ha; GFA: 1.0 million sq. m.
Completion: 2019 to 2031
Two Roxas Triangle (40%-owned)
Site area: 0.4 ha; GFA: 98,000 sq. m.
182 units, 96% pre-sold
Completion: 2018
Mandani Bay (40%-owned)
Site area: 20 ha; GFA: 1.2 million sq. m.
Phase 1 & 2: 2,118 units launched for sale (50% pre-sold)
Completion: 2020 to 2035
The ESSE Sukhumvit 36 (49%-owned)
Site area: 0.4 ha; GFA: 38,000 sq. m.
338 units, 44% reserved
Completion: 2020
INDONESIA THE PHILIPPINES
THAILAND
Performance within expectations
VIETNAM
The Nassim (50%-owned)
Site area: 0.6 ha; GFA: 31,000 sq. m.
238 units, 100% pre-sold
Completion: 2018
29B NDC (70%-owned)
Site area: 0.5 ha; GFA: 57,000 sq. m.
530 luxury apartments
Completion: 2021
Thu Thiem River Park(64%-owned)
Site area: 3.5 ha; GFA: 175,000 sq. m.
1,100 luxury apartments and villas
Completion: 2021 to 2024

2017 Results 18
New Projects
CHONGQING WUHAN
New Project - Liangjiang (100%-owned)
Adjacent to New Bamboo Grove
Mixed-use project
GFA: 161,000 sq. m.
Completion: 2020
New Project - Lijia (50%-owned)
Located in Lijia, along the Jialing River
JV with CMSK
Mixed-use project
GFA: 114,000 sq. m.
Completion: 2020
.
Nine new development property projects were added during 2017, two so far in 2018
HANGZHOU
Wuhan Dream Land (50%-owned)
JV with Zall Group
Mixed-use project
GFA: 493,000 sq. m.
Completion: 2019 to 2022
New Project - Xiaoshan (30%-owned)
JV with Transfar Group and Yanlord
Mixed-use project
GFA: 776,000 sq. m.
Completion: 2020 to 2022

192017 Results
New Projects
NANJING
Yue City (33%-owned)
JV with CMSK & Country Garden
Mixed-use project
GFA: 218,000 sq. m.
Completion: 2019 to 2021
Nine new development property projects were added during 2017, two so far in 2018
New Project – Xinjiekou (100%-owned)
Office and retail
GFA: 235,000 sq. m.
Completion: 2023
THAILAND
The ESSE Sukhumvit 36 (49%-owned)
JV with Singha Estate
Luxury condominium project
GFA: 38,000 sq. m.
338 units
Completion: 2020
SINGAPORE
Eunosville, MCL Land (100%-owned)
Residential project
GFA: 1.05 million sq. ft (98,000 sq. m.)
1,399 units
Completion: 2021

202017 Results
New Projects
Nine new development property projects were added during 2017, two so far in 2018
VIETNAM
Thu Thiem River Park (64%-owned)
Conditionally acquired
JV with CII
Mixed-use project
Thu Thiem New Urban Area
GFA: 175,000 sq. m.
Completion: 2021 to 2024
29B NDC (70%-owned)
Conditionally acquired
Luxury condominium project
District 1
GFA: 57,000 sq. m.
Completion: 2021
Arumaya (40%-owned)
JV with Astra
Residential project
GFA: 26,000 sq. m.
262 units
Completion: 2022
INDONESIA

212017 Results
Financial Highlights

2017 Results 22
FY2016 (US$m) FY2017 %YoY
1,994 Revenue 1,960 -2
(1,023) Net operating costs (1,052) 3
971 Operating profit 908 -6
117 Share of results of joint ventures 298 155
(69) Net financing charges (78) 13
(168) Tax (157) -7
(3) Non-controlling interests (1) -67
848 Underlying profit 970 14
2,498 Non-trading items 4,615 85
3,346 Profit attributable to shareholders 5,585 67
Record underlying profit of US$970 million, up 14% year-on-year
Consolidated Profit and Loss Account

2017 Results 23
Movement in Underlying Profit
Increase in underlying profit driven by higher completions in mainland China
US$m
$848m
$970m+$36m
+$254m
-$168m
0
200
400
600
800
1,000
1,200
1,400
Underlying profit 2016 Investment Properties
operating profit(pre-tax)
Development
Properties operatingprofit
(pre-tax)
Increase in taxes, non-
controlling interests &other expenses
Underlying profit 2017
* The above analysis includes share of Joint Ventures & Associates

2017 Results 24
Operating Profit by Segment and Region
INVESTMENT PROPERTIES* DEVELOPMENT PROPERTIES*
Hong Kong and mainland China remain the largest profit contributors
$799m
$10m
$120m
$24m
$953m
$843m
$10m
$116m
$19m
$988m
$0
$100
$200
$300
$400
$500
$600
$700
$800
$900
$1,000
2016 2017US$m US$m
-$3m
$170m
$119m
-
$286m
-$6m
$469m
$77m
-
$540m
-$100
$0
$100
$200
$300
$400
$500
$600
2016 2017
Hong Kong MainlandChina & Macau
Singapore Rest of Asia Total Hong Kong MainlandChina
Singapore Rest of Asia Total
* The above analysis includes share of Joint Ventures & Associates

2017 Results 25
Consolidated Cash Flow
Strong operating cashflows
FY2016 (US$m) FY2017 %YoY
1,096 Operating activities 800 -27
(245) Investing activities (947) 286
(442) Financing activities (193) -56
409 Net cash inflow/(outflow) (340) -183
1,566 Cash and cash equivalents at beginning of the year 1,898 21
(77) Effect of exchange rate changes 59 -177
1,898 Cash and cash equivalents at end of the year 1,617 -15
(3,906) Gross debt (excluding bank overdrafts) (4,166) 7
(2,008) Net debt at end of the year (2,549) 27

2017 Results 26
0
5,000
10,000
15,000
20,000
25,000
30,000
35,000
40,000
31 Dec 2015 31 Dec 2016 31 Dec 2017
Hong Kong Mainland China & Macau
Singapore Rest of Asia
-2,000
-1,000
0
1,000
2,000
3,000
4,000
5,000
6,000
Mainland China, HK & Macau
Rest of Asia
Properties Carrying Values
INVESTMENT PROPERTIES - TOTAL VALUE* DEVELOPMENT PROPERTIES – NET INVESTMENT*
Cap rate compression and higher market rents in Hong Kong; new projects increase net investment in Development Properties
31 Dec 2015 31 Dec 2016 31 Dec 2017
$29,253m
$31,892m
$36,813m
US$m
31 Dec 2015 31 Dec 2016 31 Dec 2017
US$m
Pre-sale proceeds
Singapore
$3,298m$2,416m
$4,007m
* The above analysis includes share of Joint Ventures & Associates

2017 Results 27
0
500
1,000
1,500
2,000
2,500
2018 2019 2020 2021 2022 2023+
Bank facilities (drawn & undrawn) Bonds*
Treasury Management
MATURITY PROFILE OF COMMITTED FACILITIES / BONDS (AS AT 31 DEC 17)
Financial position and liquidity remain strong
US$m
$593m $662m
$308m
$812m
$2,216m $2,239m
* Issued under MTN Programme which are at face value
2016 2017
Net debt (US$m) 2,008 2,549
Net gearing 6% 7%
Average tenor of debt (years)
6.4 5.9
Average interest cost
3.4% 3.6%
Credit ratings
- S&P A A
- Moody’ s A3 A3

282017 Results
Outlook

2017 Results 29
Outlook
Investment properties are expected to continue to generate stable returns
Contribution from WF CENTRAL in Beijing. Opening of Mandarin Oriental hotel in 2H 2018
Continue to look for attractive opportunities to construct prime investment properties in key gateway cities in Asia
Strong mainland China contribution expected to continue
Project completions in Indonesia, Singapore and Vietnam expected in 2018
The Group remains active in seeking development opportunities in mainland China and Southeast Asia
Net gearing expected to move modestly higher due to recent investments
Balance sheet remains strong, with capacity to further invest in new projects
Maintain disciplined approach in assessing opportunities
Adoption of “percentage of completion” accounting in Singapore, Malaysia and the Philippines
INVESTMENT PROPERTIES DEVELOPMENT PROPERTIES FINANCIAL
Continued strong performance expected in 2018

302017 Results
Q & A

312017 Results
Appendix

2017 Results 32
HKL’ s SHARE(’ 000 sq. ft NFA)
OFFICE RETAIL HOTEL TOTAL1
One Exchange Square 569 - - 569
Two Exchange Square 505 - - 505
Three Exchange Square 323 - - 323
Exchange Square Podium - 49 - 49
The Forum 41 - - 41
Jardine House 635 45 - 680
Chater House 417 48 - 465
Alexandra House 325 49 - 374
Gloucester Tower 471 - - 471
Edinburgh Tower 339 - - 339
The Landmark Mandarin Oriental - - 143 143
York House 110 - - 110
Landmark Atrium - 255 - 255
Prince’s Building 404 144 - 548
Total 4,139 590 143 4,8722
Hong Kong Investment Properties Summary
1 Excluding residential properties in Hong Kong of 71,000 sq. ft
2 Equivalent to 453,000 sq. m.

2017 Results 33
Singapore Investment Properties Summary
HKL’ s SHARE(’ 000 sq. ft NFA)
OFFICE RETAIL TOTAL
One Raffles Link 243 68 311
One Raffles Quay 442 1 443
MBFC 966 60 1,026
Total 1,651 129 1,7801
1 Equivalent to 165,000 sq. m.

2017 Results 34
Other Investment Properties Summary
HKL’ s SHARE(’ 000 sq. ft NFA)
OFFICE RETAIL HOTEL TOTAL
Beijing - 389 - 389
Macau - 98 151 249
Jakarta 1,033 92 - 1,125
Hanoi 75 8 - 83
Bangkok 27 61 - 88
Phnom Penh 185 91 95 371
Others 42 - 215 257
Total 1,362 739 461 2,5621
1 Equivalent to 237,600 sq. m.

2017 Results 35
HKL’ s SHARE
PROJECT CITY INTERESTYEAR OF
ACQUISITIONSITE AREA
(ha)DEVELOPABLE AREA
(m sq. m.)CONSTRUCTED
(m sq. m.)
UNDER CONSTRUCTION
(m sq. m.)
TO BE DEVELOPED(m sq. m.)
Central Park Beijing 40% 2001 40.2 0.13 0.13 - -
Yorkville South Chongqing 100% 2010 38.6 0.88 0.56 0.12 0.20
Yorkville North Chongqing 100% 2011 53.8 1.09 0.37 0.16 0.56
Bamboo Grove Chongqing 50% 2005 77.9 0.72 0.72 - -
New Bamboo Grove Chongqing 50% 2015 34.8 0.32 0.11 0.19 0.02
Landmark Riverside Chongqing 50% 2009 22.2 0.50 0.21 0.09 0.20
Central Avenue Chongqing 50% 2013 40.2 0.55 0.07 0.16 0.32
New Project - Liangjiang Chongqing 100% 2017 14.2 0.16 - - 0.16
New Project - Lijia Chongqing 50% 2017 9.5 0.06 - - 0.06
WE City Chengdu 50% 2010 19.0 0.45 0.20 0.15 0.10
New Project – Xiaoshan Hangzhou 30% 2017 38.6 0.23 - - 0.23
Yue City Nanjing 33% 2017 19.9 0.07 - - 0.07
New Project – Xinjiekou Nanjing 100% 2018 2.5 0.24 - - 0.24
Parkville Shanghai 50% 2015 9.1 0.11 0.11 - 0.00
Wuhan Dream Land Wuhan 50% 2017 16.4 0.25 - - 0.25
Total 436.9 5.76 2.48 0.87 2.41
Mainland China Development Properties Summary

2017 Results 36
HKL’ s SHARE
PROJECT INTERESTYEAR OF
ACQUISITIONSITE AREA
(ha)
DEVELOPABLE AREA
(m sq. m.)
CONSTRUCTED(m sq. m.)
UNDER CONSTRUCTION
(m sq. m.)
TO BE DEVELOPED(m sq. m.)
Sol Acres 100% 2014 3.3 0.12 - 0.12 -
Lake Grande 100% 2015 1.8 0.05 - 0.05 -
Margaret Ville 100% 2017 0.5 0.02 - - 0.02
Eunosville 100% 2018 3.5 0.10 - - 0.10
Total 9.1 0.29 - 0.17 0.12
Singapore Development Properties Summary

2017 Results 37
HKL’ s SHARE
PROJECT COUNTRY INTERESTYEAR OF
ACQUISITIONSITE AREA
(ha)DEVELOPABLE AREA
(m sq. m.)CONSTRUCTED
(m sq. m.)
UNDER CONSTRUCTION
(m sq. m.)
TO BE DEVELOPED(m sq. m.)
Nava Park Indonesia 49% 2012 67.0 0.38 0.03 0.05 0.30
Anandamaya Residences Indonesia 40% 2013 1.3 0.05 - 0.05 -
Asya Indonesia 33.5% 2016 68.0 0.35 - - 0.35
Arumaya Indonesia 40% 2018 3.4 0.01 - - 0.01
The ESSE Sukhumvit 36 Thailand 49% 2017 0.4 0.02 - - 0.02
Two Roxas Triangle The Philippines 40% 1995 0.4 0.04 - 0.04 -
Mandani Bay The Philippines 40% 2013 19.6 0.47 - 0.03 0.44
Northpine The Philippines 40% 1996-2016 150.7 0.31 0.17 0.02 0.12
The Nassim Vietnam 50% 2014 0.6 0.02 - 0.02 -
Thu Thiem River Park1 Vietnam 64% 2017 3.5 0.11 - - 0.11
29B NDC1 Vietnam 70% 2017 0.5 0.04 - - 0.04
Others Malaysia & others n/a n/a 113.6 0.75 0.09 0.02 0.64
Total 429.0 2.55 0.29 0.23 2.03
Other Development Properties Summary
1 Conditionally acquired

2017 Results 38
Consolidated Cash Flow - Operating Activities
FY2016 (US$m) FY2017 %YoY
971 Operating profit excluding non-trading items 908 -6
(75) Net interest paid (118) 57
(141) Tax paid (137) -3
(79) Payments for development properties sites (549) 595
(336)Development expenditure on development properties projects
(298) -11
953 Proceeds from development properties sales 1,018 7
88 Dividends received from joint ventures 94 7
(285) Others (118) -59
1,096 800 -27
2017 Results 39
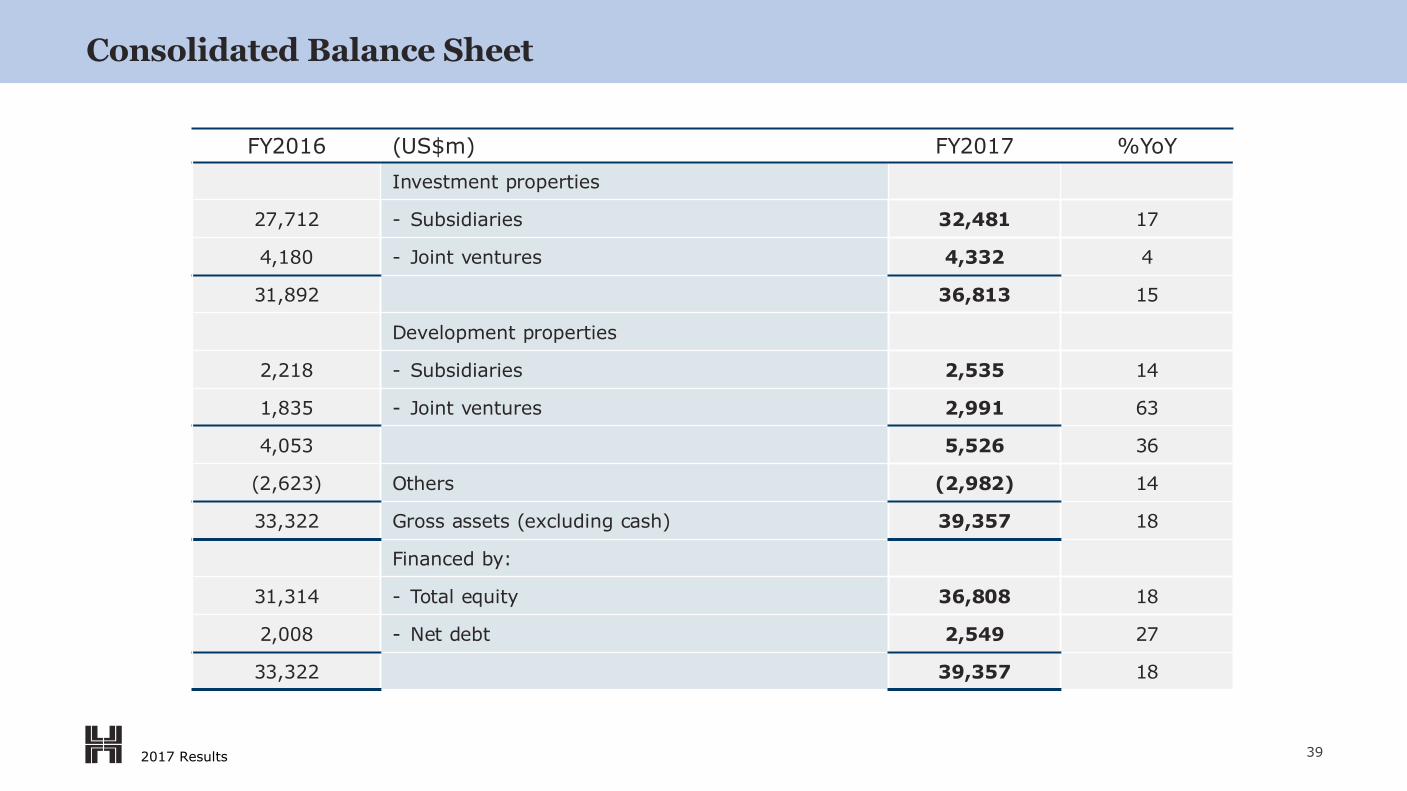
FY2016 (US$m) FY2017 %YoY
Investment properties
27,712 - Subsidiaries 32,481 17
4,180 - Joint ventures 4,332 4
31,892 36,813 15
Development properties
2,218 - Subsidiaries 2,535 14
1,835 - Joint ventures 2,991 63
4,053 5,526 36
(2,623) Others (2,982) 14
33,322 Gross assets (excluding cash) 39,357 18
Financed by:
31,314 - Total equity 36,808 18
2,008 - Net debt 2,549 27
33,322 39,357 18
Consolidated Balance Sheet

2017 Results 40
Gross Assets as at 31 Dec 2017
77%
12%
11%
GROSS ASSETS BY LOCATION
Mainland China and MacauHong Kong Southeast Asia
90%
10%
GROSS ASSETS BY ACTIVITY
Investment Properties Development Properties

2017 Results 41
2016 1H 2017 2017
Hong Kong Office –Exchange Square 1 & 2
3.50% 3.25% 3.00%
Hong Kong Retail –Landmark Atrium
4.50% 4.50% 4.50%
Singapore Office –MBFC
3.50% 3.25% 3.25%
CAPITALISATION RATES
Investment Property – Basis of Valuation

2017 Results 42
Treasury Management
LIQUIDITY AS AT 31 DEC 2017 (All figures in US$ billion)
Liquidity as at 31 DEC 2016
HK$1 S$2 US$ RMB TOTAL
Committed lines 6.5 5.0 1.3 0.0 0.5 6.8
Gross debt 3.9 3.1 0.6 0.0 0.4 4.1
Available lines 2.6 1.9 0.7 0.0 0.1 2.7
Cash 1.9 0.0 0.6 0.8 0.2 1.6
Available liquidity 4.5 1.9 1.3 0.8 0.3 4.3
1 HK$ debt includes US$ debt swapped into HK$
2 S$ debt includes HK$ debt swapped into S$

2017 Results 43
Treasury Management
DEBT MANAGEMENT AND HEDGING POLICIES AS AT 31 DEC 2017
0
10
20
30
40
50
60
70
80
90
100
Type of Facilities Currency Interest Rate
Banks 58%
Bonds 42%
Fixed 52%
Floating 48%
HK$76%
S$ 15%
%
RMB 9%
1