analyst presentation first-half results 2017 - ordina/media/files/ordinacom/financieel... · giarte...
TRANSCRIPT

Analyst presentation
First-half results 2017
Amsterdam, 24 August 2017

H1 2017First half result under pressure
Growth in public sector
Jo Maes

3
First half result under pressure; growth in public sector
* The number of workable days in the Netherlands was 126 (H1 2016: 125).
The number of workable days in Belgium/Luxembourg was 125 (H1 2016: 125).
** Including redundancy costs (H1 2017: EUR 3.3 mln and H1 2016: EUR 3.4 mln).
*** Net debt/adjusted EBITDA
Revenue*Rounded off, in millions of euro
EBITDA**Rounded off, in millions of euro
EBITDA margin**
177.8
H1 2016
172.9
H1 2017
8.3 7.0 4.7% 4.0%
H1 2016 H1 2017 H1 2016 H1 2017
Net profitRounded off, in millions of euro
Net cashRounded off, in millions of euro
Leverage ratio***
3.0
H1 2016
1.0
H1 2017
0.1 2.2 (0.0) (0.1)
H1 2016 H1 2017 H1 2016 H1 2017

4
Revenue *Rounded off, in millions of euro
EBITDA**Rounded off, in millions of euro
EBITDA margin**
Results Q2 2017
87.9
Q2 2016
84.7
Q2 2017
3.7 2.7 4.2% 3.2%
* The number of workable days in the Netherlands and in Belgium/Luxembourg was 61 (Q2 2016: 62).
** Adjusted for redundancy costs (Q2 2017: EUR 2.4 million and Q2 2016: EUR 1.5 million).
Q2 2016 Q2 2017 Q2 2016 Q2 2017

5
Operational highlights
Client & market Innovation & profiling House in order
Growth public sector
in the Netherlands and Belgium / Luxembourg
Introduction
Five core propositions
– Strong start
high performance
teams
70 Young
Professionals
started
Giarte Recommendtion
index score 96%
Continued
improvement in
net cash
position
Effectiveness and
& Efficiency
programme on
course
6
Markets: Public sector
30.5 29.231.1 31.0
0
25
50
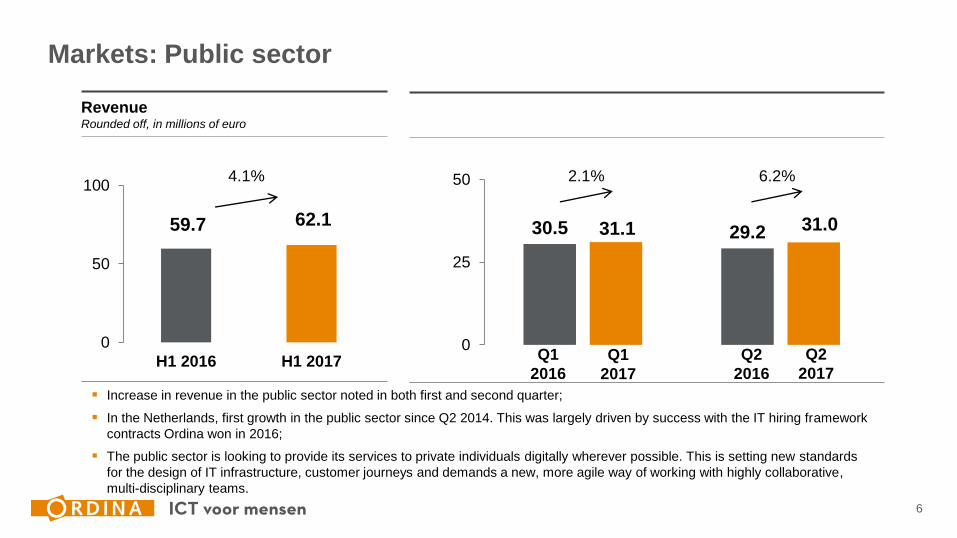
RevenueRounded off, in millions of euro
Increase in revenue in the public sector noted in both first and second quarter;
In the Netherlands, first growth in the public sector since Q2 2014. This was largely driven by success with the IT hiring framework
contracts Ordina won in 2016;
The public sector is looking to provide its services to private individuals digitally wherever possible. This is setting new standards
for the design of IT infrastructure, customer journeys and demands a new, more agile way of working with highly collaborative,
multi-disciplinary teams.
59.7 62.1
0
50
100
H1 2016 H1 2017
4.1%
Q1
2016
Q1
2017
Q2
2016
Q2
2017
2.1% 6.2%
7
Markets: Financial services
27.9 26.324.1 22.6
0
25
50
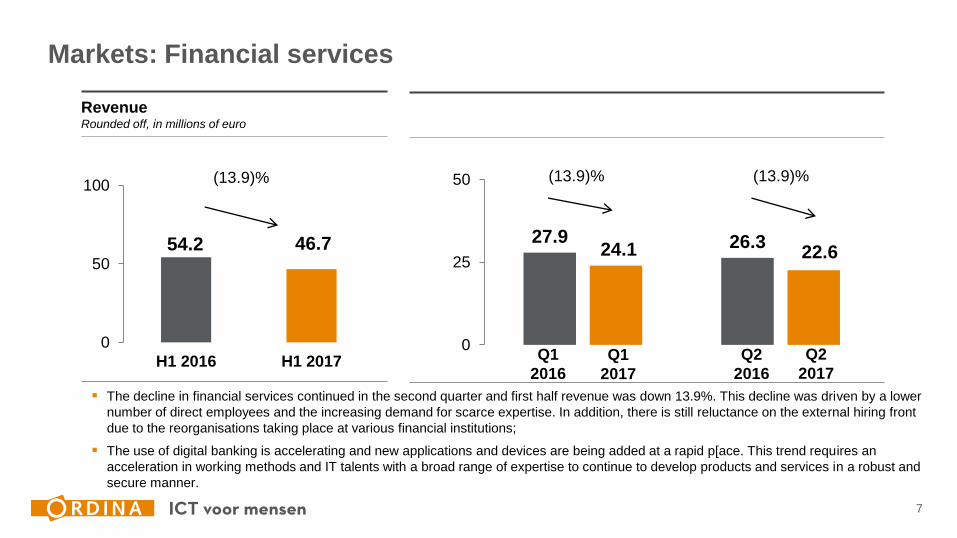
RevenueRounded off, in millions of euro
The decline in financial services continued in the second quarter and first half revenue was down 13.9%. This decline was driven by a lower
number of direct employees and the increasing demand for scarce expertise. In addition, there is still reluctance on the external hiring front
due to the reorganisations taking place at various financial institutions;
The use of digital banking is accelerating and new applications and devices are being added at a rapid p[ace. This trend requires an
acceleration in working methods and IT talents with a broad range of expertise to continue to develop products and services in a robust and
secure manner.
54.2 46.7
0
50
100
H1 2016 H1 2017
(13.9)%
Q1
2016
Q1
2017
Q2
2016
Q2
2017
(13.9)% (13.9)%
8
Markets: Industry
25.4 26.126.9 25.3
0
25
50
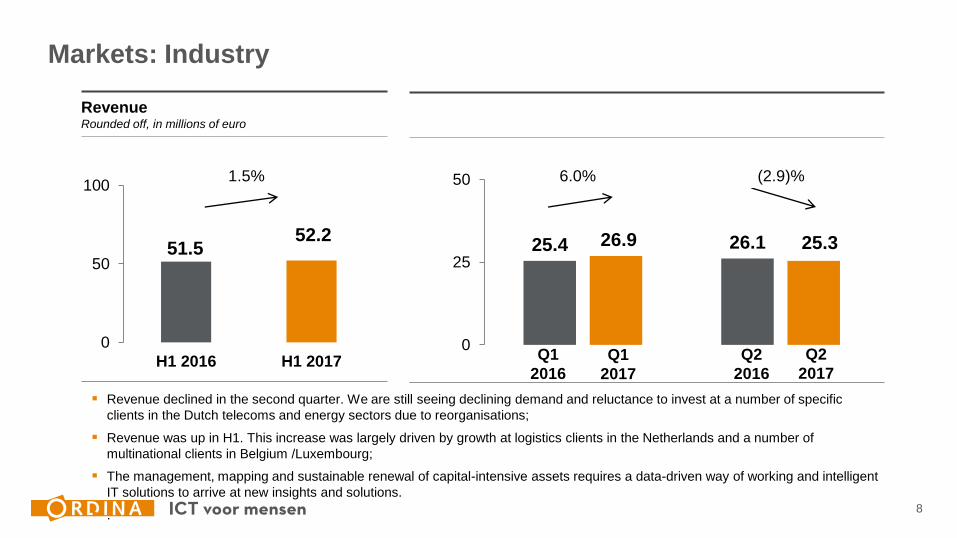
RevenueRounded off, in millions of euro
Revenue declined in the second quarter. We are still seeing declining demand and reluctance to invest at a number of specific
clients in the Dutch telecoms and energy sectors due to reorganisations;
Revenue was up in H1. This increase was largely driven by growth at logistics clients in the Netherlands and a number of
multinational clients in Belgium /Luxembourg;
The management, mapping and sustainable renewal of capital-intensive assets requires a data-driven way of working and intelligent
IT solutions to arrive at new insights and solutions.
.
51.552.2
0
50
100
H1 2016 H1 2017
1.5%
Q1
2016
Q1
2017
Q2
2016
Q2
2017
6.0% (2.9)%

9
Markets: Healthcare
6.1 6.36.2 5.7
0
10
20
RevenueRounded off, in millions of euro
Revenue declined in the second quarter as a result of a reduced focus on compliance consultancy in the pharmaceutical sector in
Belgium/Luxembourg;
Revenue in the Netherlands remained stable in the first half of the year;
Healthcare providers face the considerable challenge of providing higher quality of care at a lower cost. There is demand for IT
applications that increase self-sufficiency and improve the healthcare experience of patients, clients and their immediate environment.
12.4 11.9
0
25
50
H1 2016 H1 2017
(4.2)%
Q1
2016
Q1
2017
Q2
2016
Q2
2017
1.4% (9.5)%

10
Revenue share top 10 clients
TOP 10 CLIENTS (alphabetical)
European Commission**
Johnson & Johnson
Ministry of Home Affairs
Ministry of Economic Affairs
Ministry for Infrastructure and Environment
Ministry for Education, Culture and Science
Ministry for Social Affairs and Employment
Police
Prorail**
Rabobank
Revenue share top 10 clientsIn %
56
44 46 44 43
0
30
60
H12013
H12014
H12015
H12016
H12017
*
* Offshore component Rabobank contract € 10.9 million = 5.5%.
** European Commission and Prorail are new/back in the top 10 and have replaced the Finance Ministry and Philips.
11
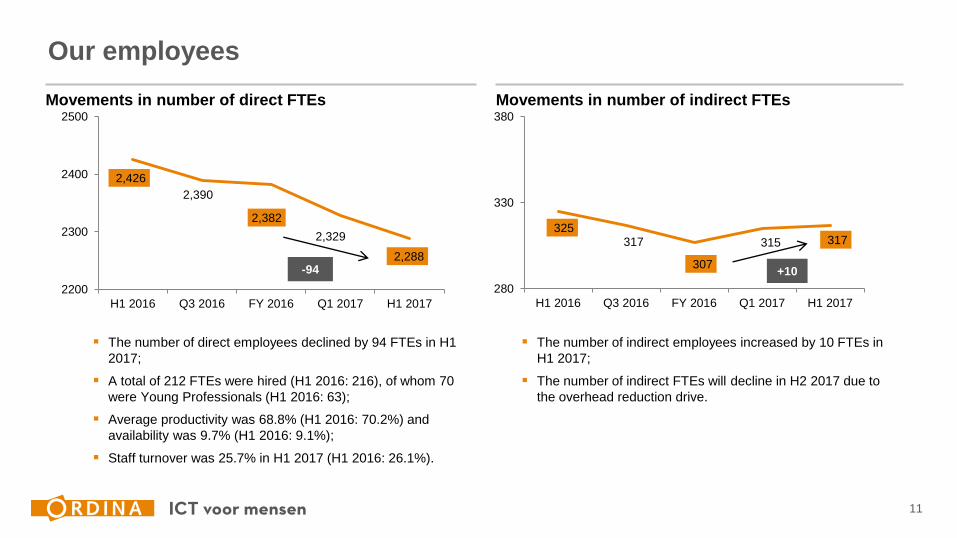
Movements in number of indirect FTEs
325 317
307
315 317
280
330
380
H1 2016 Q3 2016 FY 2016 Q1 2017 H1 2017
Movements in number of direct FTEs
2,426
2,390
2,382
2,329
2,288
2200
2300
2400
2500
H1 2016 Q3 2016 FY 2016 Q1 2017 H1 2017
Our employees
The number of direct employees declined by 94 FTEs in H1
2017;
A total of 212 FTEs were hired (H1 2016: 216), of whom 70
were Young Professionals (H1 2016: 63);
Average productivity was 68.8% (H1 2016: 70.2%) and
availability was 9.7% (H1 2016: 9.1%);
Staff turnover was 25.7% in H1 2017 (H1 2016: 26.1%).
The number of indirect employees increased by 10 FTEs in
H1 2017;
The number of indirect FTEs will decline in H2 2017 due to
the overhead reduction drive.
-94 +10

Financial performance
H1 2017
Annemieke den Otter

13
Revenue
(Rounded off, in millions of euro) H1 2016* H1 2017Growth
%
Revenue
The Netherlands 133.6 126.7 (5.1)%
Delivery 123.6 116.7 (5.6)%
Innovation cluster 10.0 10.0 0.4%
Belgium / Luxembourg 44.2 46.2 4.6%
Total 177.8 172.9 (2.7)%
* 2016 figures have been adjusted in line with the new organisational structure for comparison purposes.
.
Revenue divisionIn %
Netherlands
Belgium / Luxembourg
73
27
75
25
H1 2017
H1 2016
Netherlands
Belgium / Luxembourg
14
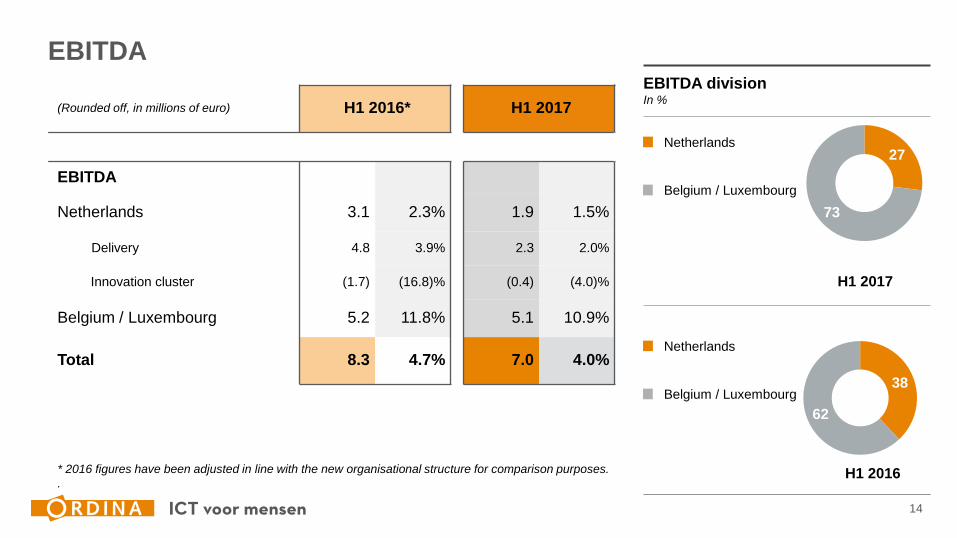
EBITDA
(Rounded off, in millions of euro) H1 2016* H1 2017
EBITDA
Netherlands 3.1 2.3% 1.9 1.5%
Delivery 4.8 3.9% 2.3 2.0%
Innovation cluster (1.7) (16.8)% (0.4) (4.0)%
Belgium / Luxembourg 5.2 11.8% 5.1 10.9%
Total 8.3 4.7% 7.0 4.0%
* 2016 figures have been adjusted in line with the new organisational structure for comparison purposes.
.
EBITDA divisionIn %
Netherlands
Belgium / Luxembourg
27
73
38
62
H1 2017
H1 2016
Netherlands
Belgium / Luxembourg

15
Overhead reduction close to completion
Ordina announced an overhead reduction in July 2017. The programme Effectiveness &
Efficiency, will yield around EUR 5.0 million in structural annual savings. As part of this
programme, Ordina has taken measures to both reduce costs and improve processes;
The overhead reduction will have an impact of around EUR 1-2 million on the result in H2 2017
and around EUR 3-4 million in 2018;
The costs related to the overhead reduction have been recognised in the redundancy costs for
the second quarter.

16
Statement of profit and loss
Personnel costs fell by EUR 3.3 million due to the
lower number of FTEs employed;
Work contracted out increased due to an increase
in the hiring of external staff (for example self-
employed staff). This was partly driven by the IT
hiring framework contracts won in the public
sector;
Depreciation costs were higher largely due to the
accelerated depreciation of one of the modules in
our ERP application (one-off impact of EUR 1.7
million H1 2017);
Other operating expenses declined by EUR 3.6
million, largely due to the release of the provision
for vacant office space;
Net profit declined to EUR 1.0 million in the first
half of 2017, from EUR 3.0 million in H1 2016.
(Rounded off, in millions of euro) H1 2016 H1 2017
Net revenue 177.8 172.9
Purchase value HWSW and other costs
Work contracted out
Personnel costs
Redundancy costs
Depreciations on tangible and intangible fixed
assets
Other operating expenses
4.3
39.2
113.9
3.4
2.7
8.6
3.3
43.8
110.6
3.3
4.2
5.0
Total operating expenses 172.1 170.1
Operating result (EBIT) 5.7 2.8
Interest expenses (0.3) (0.2)
Result before taxes (EBT) 5.3 2.5
Taxes (2.4) (1.5)
Net profit 3.0 1.0
17
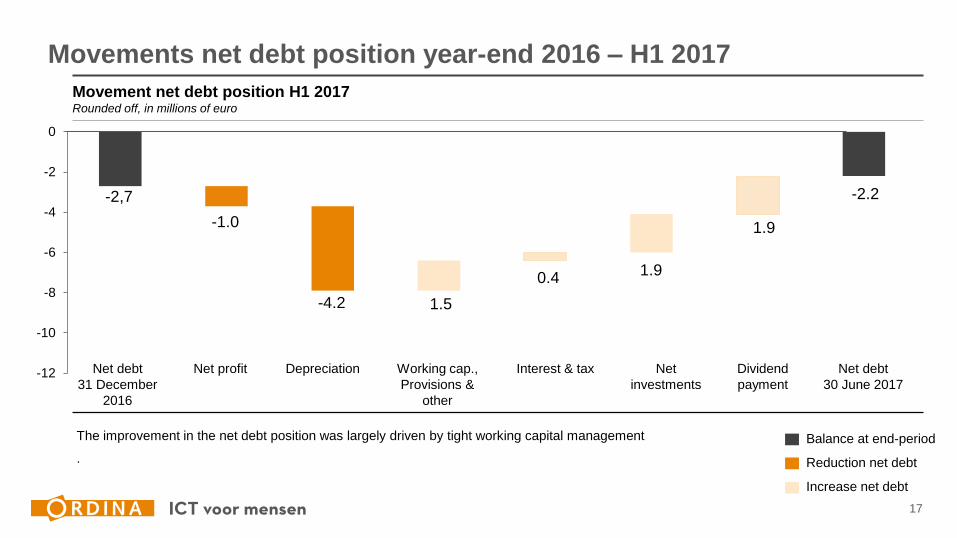
Movements net debt position year-end 2016 – H1 2017
Movement net debt position H1 2017Rounded off, in millions of euro
-2,7
-1.0
-4.2 1.5
0.41.9
1.9
-2.2
-12
-10
-8
-6
-4
-2
0
Net debt
31 December
2016
Net profit Depreciation Working cap.,
Provisions &
other
Interest & tax Net
investments
Dividend
payment
Net debt
30 June 2017
Balance at end-period
Reduction net debt
Increase net debt
The improvement in the net debt position was largely driven by tight working capital management
.
18
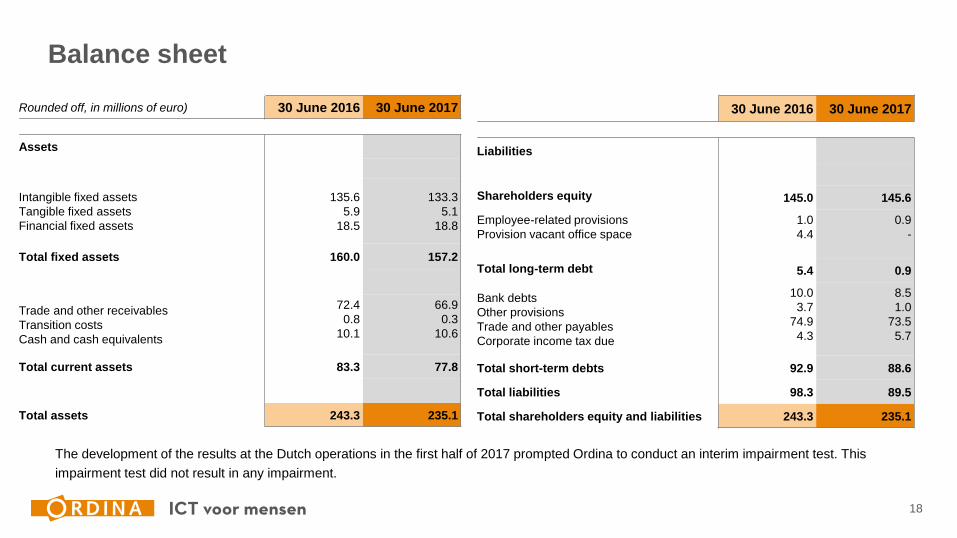
Balance sheet
Rounded off, in millions of euro) 30 June 2016 30 June 2017
Assets
Intangible fixed assets
Tangible fixed assets
Financial fixed assets
135.6
5.9
18.5
133.3
5.1
18.8
Total fixed assets 160.0 157.2
Trade and other receivables
Transition costs
Cash and cash equivalents
72.4
0.8
10.1
66.9
0.3
10.6
Total current assets 83.3 77.8
Total assets 243.3 235.1
30 June 2016 30 June 2017
Liabilities
Shareholders equity 145.0 145.6
Employee-related provisions
Provision vacant office space
1.0
4.4
0.9
-
Total long-term debt 5.4 0.9
Bank debts
Other provisions
Trade and other payables
Corporate income tax due
10.0
3.7
74.9
4.3
8.5
1.0
73.5
5.7
Total short-term debts 92.9 88.6
Total liabilities 98.3 89.5
Total shareholders equity and liabilities 243.3 235.1
The development of the results at the Dutch operations in the first half of 2017 prompted Ordina to conduct an interim impairment test. This
impairment test did not result in any impairment.

19
Financing: covenants
The financing agreement closed in May 2015 has a term of five years, with an initial term of
three years and an option to extend twice for a period of one year. In April 2017, Ordina agreed
the second extension of one year to May 2020 under the same conditions.
H1 2016 H1 2017Financing
agreement
Net debt at end-period (in EUR million) (0.1) (2.2)
Leverage ratio (0.0) (0.1) =< 2.5
Interest Cover Ratio 46.7 43.1 >= 5.0

Management agenda
Key priorities
Jo Maes

21
Competitive environment
Standardisation
Standard solutions from the cloud reducing
client-specific solutions
Insourcing
Companies want IT expertise in-house
Scale & low costs
High capacity at low prices
(offshore)
Small and nimble
Niche players respond quickly to
innovations
Innovative &
reliable
Close and engaged
Ag
ility
Partnership & co-creation
En
tre
pre
neu
rsh
ip &
sca
le-u
p
Added value

22
Management agenda 2017
Broadening and deepening the
relationship with key clients
through reliable delivery and
relevant innovations
Growth
Number 1 position among local
mid-size clients by providing total
solutions
Growth with our own
employees
Increasing our effectiveness and efficiency
Enthusiastic and
enterprising
Ordina employees
Future proof fit with clients through
strategic competence development
A sharper innovative image
and a common go-to-market
by loading corporate themes consistently with market visions, expertise,
propositions & Showcases

23
Position in the market
Adaptability Innovative strength Intuitive technology Safe and robust
Inspiring Corporate
themes
Business
propositions
Vision & Mission
High
performance
teams
Intelligent, data-
driven
organisations
Business
platforms
Security and
privacy
Digital
acceleration

24