analyst notes archive page 1 of 21 pepsico inc qqq
TRANSCRIPT

Morningstar Equity Analyst Report | Report as of 22 Apr 2021 15:18, UTC | Reporting Currency: USD | Trading Currency: USD | Exchange: NASDAQ Page 1 of 21
© Morningstar 2021. All Rights Reserved. Unless otherwise provided in a separate agreement, you may use this report only in the country in which its original distributor is based. The information, data, analyses and opinions presented herein do not constitute investment advice; are provided solely for informational purposes and therefore are not an offer to buy or sell a security; and are not warranted to be correct, complete or accurate. The opinions expressed are as of the date written and are subject to change without notice. Except as otherwise required by law, Morningstar shall not be responsible for any trading decisions, damages or other losses resulting from, or related to, the information, data, analyses or opinions or their use. The information contained herein is the proprietary property of Morningstar and may not be reproduced, in whole or in part, or used in any manner, without the prior written consent of Morningstar. Investment research is produced and issued by subsidiaries of Morningstar, Inc. including, but not limited to, Morningstar Research Services LLC, registered with and governed by the U.S. Securities and Exchange Commission. To order reprints, call +1 312-696-6100. To license the research, call +1 312-696-6869. Please see important disclosures at the end of this report.
ß®
PepsiCo Inc PEP QQQ 22 Apr 2021 15:17, UTC
Last Price Fair Value Estimate Price/FVE Market Cap Economic MoatTM Moat TrendTM Uncertainty Capital Allocation
146.27 USD22 Apr 2021
146.00 USD22 Apr 2021 15:13, UTC
1.00 203.07 USD Bil21 Apr 2021
Wide Stable Low Exemplary
Price vs. Fair Value
0
50
100
150
200
Last Close: 146.27
Fair Value: 146.0022 Apr 2021 15:13, UTC
Over ValuedUnder Valued
2016 2017 2018 2019 2020 YTD
0.99 1.02 0.91 1.03 1.06 1.00 Price/Fair Value
7.68 17.64 -4.88 27.14 11.45 -0.20 Total Return %
Morningstar Rating
Total Return % as of 21 Apr 2021. Last Close as of 22 Apr 2021. Fair Value as of 22 Apr 2021 15:13, UTC.
Contents
Business Description
Business Strategy & Outlook (22 Apr 2021)
Bulls Say / Bears Say (22 Apr 2021)
Economic Moat (22 Apr 2021)
Fair Value and Profit Drivers (22 Apr 2021)
Risk and Uncertainty (22 Apr 2021)
Capital Allocation (22 Feb 2021)
Analyst Notes Archive
Financials
Research Methodology for Valuing Companies
Important Disclosure
The conduct of Morningstar’s analysts is governed by Code of Ethics/Code of
Conduct Policy, Personal Security Trading Policy (or an equivalent of), and
Investment Research Policy. For information regarding conflicts of interest, please
visit: http://global.morningstar.com/equitydisclosures.
The primary analyst covering this company does not own its stock.
Investments in System Capacity and Go-To-Market
Capabilities Shoring Up Pepsi’s Growth Profile
Business Strategy & Outlook Nicholas Johnson, CFA, Equity Analyst, 22 Apr 2021
For many consumers, the Pepsi trademark elicits images of cola containers and curated ads extolling the
brand’s taste superiority versus Coke. While PepsiCo is still a beverage behemoth, its exploits now
extend beyond this industry, with Frito-Lay and Quaker products accounting for over half of sales and
over 65% of profits, by our estimate. A diversified portfolio across snacks and beverages is the crux of
many of the company’s competitive advantages, in our view. Though management missteps have
stymied performance in the past, the confluence of better execution and benefits inherent to its
integrated business model has allowed Pepsi to reaccelerate profitable growth, and we see plenty of
room to run.
After years of sluggish sales growth and underinvestment, Pepsi has committed to reinvigorating its top
line. To that end, significant investments have been made in manufacturing capacity (for example,
production lines to meet demand for reformulated packaging), system capacity (route optimization and
sales technology), and productivity (harmonization and automation). We view these investments as
prudent and believe they will allow the company to strengthen key trademarks such as Mountain Dew
and Gatorade, deepen its presence in growth markets like sub-Saharan Africa, while also yielding
enough cost savings to reinvest and widen profits. Recent strategic pivots within the energy category
(such as the acquisition of Rockstar and Mountain Dew line extensions) should also underpin growth
Morningstar Equity Analyst Report | Report as of 22 Apr 2021 15:18, UTC | Reporting Currency: USD | Trading Currency: USD | Exchange: NASDAQ Page 2 of 21
© Morningstar 2021. All Rights Reserved. Unless otherwise provided in a separate agreement, you may use this report only in the country in which its original distributor is based. The information, data, analyses and opinions presented herein do not constitute investment advice; are provided solely for informational purposes and therefore are not an offer to buy or sell a security; and are not warranted to be correct, complete or accurate. The opinions expressed are as of the date written and are subject to change without notice. Except as otherwise required by law, Morningstar shall not be responsible for any trading decisions, damages or other losses resulting from, or related to, the information, data, analyses or opinions or their use. The information contained herein is the proprietary property of Morningstar and may not be reproduced, in whole or in part, or used in any manner, without the prior written consent of Morningstar. Investment research is produced and issued by subsidiaries of Morningstar, Inc. including, but not limited to, Morningstar Research Services LLC, registered with and governed by the U.S. Securities and Exchange Commission. To order reprints, call +1 312-696-6100. To license the research, call +1 312-696-6869. Please see important disclosures at the end of this report.
ß®
PepsiCo Inc PEP QQQ 22 Apr 2021 15:17, UTC
Last Price Fair Value Estimate Price/FVE Market Cap Economic MoatTM Moat TrendTM Uncertainty Capital Allocation
146.27 USD22 Apr 2021
146.00 USD22 Apr 2021 15:13, UTC
1.00 203.07 USD Bil21 Apr 2021
Wide Stable Low Exemplary
and margins.
Pepsi’s growth trajectory is not without risk, as the company faces secular headwinds such as shifts in
consumer behavior. Additionally, shifting go-to-market dynamics, such as online commerce that
encourages real-time price comparisons and obviates the extent of Pepsi’s retail distribution advantage,
allow for more nimble and aggressive competition. Still, we believe that structural dynamics emanating
from Pepsi’s scale, the cachet of its brands, and the breadth of its portfolio, which support its wide
moat, should enable the company to maintain and augment its competitive positioning.
Bulls Say Nicholas Johnson, CFA, Equity Analyst, 22 Apr 2021
u In still beverages, a category facing fewer secular challenges, particularly in the U.S., Pepsi is a much
more formidable competitor to Coca-Cola.
u Pepsi’s global dominance in salty snacks may be underappreciated; with volume share more than 10
times that of the next-largest competitor, the firm benefits from unparalleled unit economics and go-to-
market optionality.
u The firm’s consolidated beverage and snack distribution operations, combined with its direct store
delivery capabilities, allow for better execution in merchandising.
Bears Say Nicholas Johnson, CFA, Equity Analyst, 22 Apr 2021
u In most beverage categories globally, Pepsi is still a distant number two to Coke.
u A corollary of Pepsi’s less focused product portfolio is inherently less operating leverage in its business
model.
u The firm has been aiming to reinvigorate its North America beverage business for quite some time, and
while it’s been reasonably successful on the top line, getting the business back to midteens margins will
be a challenge.
Economic Moat Nicholas Johnson, CFA, Equity Analyst, 22 Apr 2021
We believe several structural dynamics, centered on cost advantages and intangible assets, have
solidified PepsiCo's competitive positioning and secured it a wide economic moat. At a high level, we
see characteristics of the snack and beverage categories where Pepsi competes, and its positioning
within these categories, that should allow the company to continue to glean economic profits. While the
firm's integrated business models across food and beverages have pros and cons, we think the
combination of diversity, synergy, and flexibility that they facilitate will allow Pepsi to maintain its
standing even as its core categories face secular headwinds.
Scale is usually the epicenter of the cost advantage moat source when it appears in the snack food and
beverage spaces, and we believe both industries are conducive to scale efficiencies. The primary
beverage and snack categories where Pepsi competes, carbonated soft drinks and salty snacks, are
Sector Industry
s Consumer Defensive Beverages - Non-Alcoholic
Business Description
PepsiCo is one of the largest food and beverage
companies globally. It makes, markets, and sells a slew
of brands across the beverage and snack categories,
including Pepsi, Mountain Dew, Gatorade, Doritos, Lays,
and Ruffles. The firm uses a largely integrated go-to-
market model, though it does leverage third-party
bottlers, contract manufacturers, and distributors in
certain markets. In addition to company-owned
trademarks, Pepsi manufactures and distributes other
brands through partnerships and joint ventures with
companies such as Starbucks. The firm segments its
operations into five primary geographies, with North
America (comprising Frito-Lay North America, Quaker
Foods North America, and North America beverages)
constituting over 60% of consolidated revenue.

Morningstar Equity Analyst Report | Report as of 22 Apr 2021 15:18, UTC | Reporting Currency: USD | Trading Currency: USD | Exchange: NASDAQ Page 3 of 21
© Morningstar 2021. All Rights Reserved. Unless otherwise provided in a separate agreement, you may use this report only in the country in which its original distributor is based. The information, data, analyses and opinions presented herein do not constitute investment advice; are provided solely for informational purposes and therefore are not an offer to buy or sell a security; and are not warranted to be correct, complete or accurate. The opinions expressed are as of the date written and are subject to change without notice. Except as otherwise required by law, Morningstar shall not be responsible for any trading decisions, damages or other losses resulting from, or related to, the information, data, analyses or opinions or their use. The information contained herein is the proprietary property of Morningstar and may not be reproduced, in whole or in part, or used in any manner, without the prior written consent of Morningstar. Investment research is produced and issued by subsidiaries of Morningstar, Inc. including, but not limited to, Morningstar Research Services LLC, registered with and governed by the U.S. Securities and Exchange Commission. To order reprints, call +1 312-696-6100. To license the research, call +1 312-696-6869. Please see important disclosures at the end of this report.
ß®
PepsiCo Inc PEP QQQ 22 Apr 2021 15:17, UTC
Last Price Fair Value Estimate Price/FVE Market Cap Economic MoatTM Moat TrendTM Uncertainty Capital Allocation
146.27 USD22 Apr 2021
146.00 USD22 Apr 2021 15:13, UTC
1.00 203.07 USD Bil21 Apr 2021
Wide Stable Low Exemplary
CompetitorsPepsiCo Inc PEP Coca-Cola Co KO General Mills Inc GIS Keurig Dr Pepper Inc KDP
Fair Value146.00Uncertainty : Low
Last Close146.27
Fair Value55.00Uncertainty : Low
Last Close54.61
Fair Value57.00Uncertainty : Low
Last Close62.76
Fair Value28.50Uncertainty : Medium
Last Close36.31
Economic Moat Wide Wide Narrow Narrow
Moat Trend Stable Stable Negative Negative
Currency USD USD USD USD
Fair Value 146.00 22 Apr 2021 15:13, UTC 55.00 24 Feb 2021 20:16, UTC 57.00 4 Jan 2021 15:58, UTC 28.50 1 Mar 2021 19:58, UTC
1-Star Price 182.50 68.75 71.25 38.48
5-Star Price 116.80 44.00 45.60 19.95
Assessment Fairly Valued 21 Apr 2021 Fairly Valued 21 Apr 2021 Over Valued 21 Apr 2021 Over Valued 21 Apr 2021
Morningstar Rating QQQ22 Apr 2021 15:17, UTC QQQ21 Apr 2021 21:19, UTC QQ21 Apr 2021 21:19, UTC QQ21 Apr 2021 21:19, UTC
Analyst Nicholas Johnson, Equity Analyst Nicholas Johnson, Equity AnalystRebecca Scheuneman, Equity
AnalystNicholas Johnson, Equity Analyst
Capital Allocation Exemplary Exemplary Standard Standard
Price/Fair Value 1.00 0.99 1.10 1.27
Price/Sales 2.86 7.06 2.09 4.44
Price/Book 14.56 11.57 4.31 2.14
Price/Earning 27.22 32.70 15.23 39.04
Dividend Yield 2.78% 3.02% 3.22% 1.65%
Market Cap 203.07 Bil 235.42 Bil 38.28 Bil 51.10 Bil
52-Week Range 126.53—148.77 43.20—54.93 53.96—66.14 25.55—36.45
Investment Style Large Core Large Core Large Value Large Core
highly consolidated, with the top three players controlling anywhere from 40%-70% of global volume,
according to Euromonitor. Concurrently, the taste sensitivity of each player's core consumer is belied by
the relative similarity across ingredient formulations. This means that even as market share vacillates at
the margin, category leaders can typically maintain volume within a range that is suitable for cost
leverage.
Pepsi enjoys leading production volume in many of its categories, which allows for favorable unit
economics in manufacturing processes. The efficiency of the firm's beverage business is less
pronounced relative to snacks, given the higher capital intensity; beverages have more-involved
production lines because of the various infrastructure requirements, such as piping, tubing, and filters,
in addition to less streamlined packaging. Still, we believe the cost structures of the company's two core
operations compare favorably with those of most peers, due to Pepsi's ability to better leverage fixed
costs and reduce variable costs through procurement advantages. In beverages, we see Pepsi's unit

Morningstar Equity Analyst Report | Report as of 22 Apr 2021 15:18, UTC | Reporting Currency: USD | Trading Currency: USD | Exchange: NASDAQ Page 4 of 21
© Morningstar 2021. All Rights Reserved. Unless otherwise provided in a separate agreement, you may use this report only in the country in which its original distributor is based. The information, data, analyses and opinions presented herein do not constitute investment advice; are provided solely for informational purposes and therefore are not an offer to buy or sell a security; and are not warranted to be correct, complete or accurate. The opinions expressed are as of the date written and are subject to change without notice. Except as otherwise required by law, Morningstar shall not be responsible for any trading decisions, damages or other losses resulting from, or related to, the information, data, analyses or opinions or their use. The information contained herein is the proprietary property of Morningstar and may not be reproduced, in whole or in part, or used in any manner, without the prior written consent of Morningstar. Investment research is produced and issued by subsidiaries of Morningstar, Inc. including, but not limited to, Morningstar Research Services LLC, registered with and governed by the U.S. Securities and Exchange Commission. To order reprints, call +1 312-696-6100. To license the research, call +1 312-696-6869. Please see important disclosures at the end of this report.
ß®
PepsiCo Inc PEP QQQ 22 Apr 2021 15:17, UTC
Last Price Fair Value Estimate Price/FVE Market Cap Economic MoatTM Moat TrendTM Uncertainty Capital Allocation
146.27 USD22 Apr 2021
146.00 USD22 Apr 2021 15:13, UTC
1.00 203.07 USD Bil21 Apr 2021
Wide Stable Low Exemplary
cases per manufacturing facility and cost of goods sold per unit case as evidence of the firm's top-tier
capacity utilization and procurement, respectively. The firm materially trails Coca-Cola in these two
metrics (by factors of 3 in both respects), owing to the latter's structurally lower-cost position in the
supply chain (focusing primarily on beverage concentrates in lieu of finished drink manufacturing) as
well as its more streamlined raw material procurement. Still, Pepsi is superior in these regards to
established peers like Keurig Dr Pepper and other competitors. While a dearth of available data inhibits
us from explicitly estimating similar metrics to elucidate Pepsi's relative positioning on the cost curve in
the snack industry, we believe the firm is far better positioned than peers. With Pepsi's leading unit
share, combined with the relative similarity across basic ingredient composition and manufacturing
processes, we would be shocked if any snack competitor were able to achieve better productivity or
procurement leverage than Pepsi.
The breadth of the firm's portfolio, spanning a variety of snacks and beverages, also begets synergies in
distribution that support its cost advantage, in our view. Unlike Coca-Cola, Pepsi owns a large portion of
its distribution apparatus, whether it be bottling plants and warehouses or delivery trucks. While the
value/volume profile of certain snacks can make distribution less economically desirable, Pepsi is able to
increase its distribution route density by filling trucks with both beverage and snack stock-keeping units,
leading to economies of scope as the firm spreads distribution costs across a greater number of
products. In some cases where large customers are ordering products that span the gamut of Pepsi's
portfolio, the firm leverages third-party distributors to streamline this delivery, in light of the greater SKU
complexity and dispersion of its various manufacturing facilities. We believe this also yields superior
economics for Pepsi, and while the utilization of third-party distributors is replicable, our view is that the
company's ability to do this comes from the breadth of its product portfolio and the accompanying
volume, which make it worthwhile for these distributors to service Pepsi's customers on terms that are
economically palatable to both sides. These are structural characteristics, and it would be difficult for
upstarts to replicate similar pecuniary benefits, in our view.
Brand resonance is the most salient avenue through which the intangible assets moat source manifests
itself in the consumer packaged goods space, and we believe Pepsi's categories boast characteristics
that are conducive to brand development. These include relatively conspicuous consumption in various
on-trade contexts and heightened taste sensitivity among a large cohort of consumers. Additionally,
private-label penetration in many beverage and snack categories is relatively low--between low single
digits and low double digits on a volume basis. These numbers are even lower on a value basis, given
the price disparities of these SKUs vis-a-vis branded products.
Against this backdrop, we see Pepsi's stable of trademarks as among the most iconic and enduring in
the world. The firm consistently appears in surveys highlighting the most favored brands among fast-
moving CPG wares (with a strong CSD brand in Pepsi and a number-one sports drink in Gatorade, for
Morningstar Equity Analyst Report | Report as of 22 Apr 2021 15:18, UTC | Reporting Currency: USD | Trading Currency: USD | Exchange: NASDAQ Page 5 of 21
© Morningstar 2021. All Rights Reserved. Unless otherwise provided in a separate agreement, you may use this report only in the country in which its original distributor is based. The information, data, analyses and opinions presented herein do not constitute investment advice; are provided solely for informational purposes and therefore are not an offer to buy or sell a security; and are not warranted to be correct, complete or accurate. The opinions expressed are as of the date written and are subject to change without notice. Except as otherwise required by law, Morningstar shall not be responsible for any trading decisions, damages or other losses resulting from, or related to, the information, data, analyses or opinions or their use. The information contained herein is the proprietary property of Morningstar and may not be reproduced, in whole or in part, or used in any manner, without the prior written consent of Morningstar. Investment research is produced and issued by subsidiaries of Morningstar, Inc. including, but not limited to, Morningstar Research Services LLC, registered with and governed by the U.S. Securities and Exchange Commission. To order reprints, call +1 312-696-6100. To license the research, call +1 312-696-6869. Please see important disclosures at the end of this report.
ß®
PepsiCo Inc PEP QQQ 22 Apr 2021 15:17, UTC
Last Price Fair Value Estimate Price/FVE Market Cap Economic MoatTM Moat TrendTM Uncertainty Capital Allocation
146.27 USD22 Apr 2021
146.00 USD22 Apr 2021 15:13, UTC
1.00 203.07 USD Bil21 Apr 2021
Wide Stable Low Exemplary
example), and we believe the company's leadership across its categories evinces this sentiment. In
beverages, the firm's global nonalcoholic ready-to-drink volume share of roughly 7% is only one third of
Coke's, but is still almost double that of the next closest competitor (Nestle, due to its water portfolio),
according to Euromonitor. In global CSDs, Pepsi's market share of close to 20% is again less than half of
Coca-Cola's, but close to 5 times that of the next-largest player (Keurig Dr Pepper). In snacks, Frito-Lay
products boast pre-eminent status in corn/tortilla chips and other extruded snack categories, as well as
potato chips, with volume share in the mid-30s and mid-40s respectively, according to Euromonitor. The
firm is number one in these snack categories by an even larger margin in the U.S.
While we view Pepsi's sustained elevated market share across industries as a core tenet supporting its
intangible assets, we also believe the firm's pricing history represents demonstrably strong evidence.
The dynamic and channel-specific nature of retail pricing, particularly exacerbated by the prevalence of
behavioral algorithms in online commerce and the ability of consumers to compare prices in real time,
makes general statements about relative pricing difficult. Still, we believe the firm has been a price
leader in many of its categories. Pepsi has historically garnered outsize top-line gains from the
combination of discrete pricing actions and mix shifts, in the mid- to high-single-digit range in some of
its most penetrated markets in the Americas, which we find impressive. Even in beverages, where the
firm's relative positioning is much weaker, there are a few markets--in Latin America, for example--
where Pepsi boasts material price premiums (as high as 40%) above Coca-Cola.
A natural corollary of brand appeal is the supply chain entrenchment and relationships with retailers
that it facilitates. The categories in which Pepsi competes constitute approximately a third of total food
and grocery sales in the U.S., based on Euromonitor retail data. Owing to its category leadership across
snacks and beverages, Pepsi is often viewed as a strategic partner by retailers, helping to incubate
strategies to increase overall category value. Pepsi and its retail customers also share data centered on
consumer insights. We think that in an era where competitive differentiation is increasingly driven by
technology-enabled analytics and algorithms, the data feedback loop that these retail relationships
engender will serve to perpetuate Pepsi's advantage.
We view Pepsi's distribution apparatus as another core pillar supporting the firm's intangible asset moat
source, whether it is company-controlled direct store delivery or customer warehouse systems
(depending on the nature of the product and its responsiveness to in-store merchandising), or even its
ability to deploy third-party distributors in an economically viable way. The firm's distribution reach
encompasses over 200 countries, and this apparatus has been refined over decades, making the
company more equipped to strategically and tactically deploy the appropriate go-to-market approach
that will extract the best possible economics from its businesses. Unlike the alcoholic beverage industry,
there are no laws mandating distribution to customers through an intermediary, which makes the
nonalcoholic industry more susceptible to secular shifts in distribution and fulfilment. In general, and
Morningstar Equity Analyst Report | Report as of 22 Apr 2021 15:18, UTC | Reporting Currency: USD | Trading Currency: USD | Exchange: NASDAQ Page 6 of 21
© Morningstar 2021. All Rights Reserved. Unless otherwise provided in a separate agreement, you may use this report only in the country in which its original distributor is based. The information, data, analyses and opinions presented herein do not constitute investment advice; are provided solely for informational purposes and therefore are not an offer to buy or sell a security; and are not warranted to be correct, complete or accurate. The opinions expressed are as of the date written and are subject to change without notice. Except as otherwise required by law, Morningstar shall not be responsible for any trading decisions, damages or other losses resulting from, or related to, the information, data, analyses or opinions or their use. The information contained herein is the proprietary property of Morningstar and may not be reproduced, in whole or in part, or used in any manner, without the prior written consent of Morningstar. Investment research is produced and issued by subsidiaries of Morningstar, Inc. including, but not limited to, Morningstar Research Services LLC, registered with and governed by the U.S. Securities and Exchange Commission. To order reprints, call +1 312-696-6100. To license the research, call +1 312-696-6869. Please see important disclosures at the end of this report.
ß®
PepsiCo Inc PEP QQQ 22 Apr 2021 15:17, UTC
Last Price Fair Value Estimate Price/FVE Market Cap Economic MoatTM Moat TrendTM Uncertainty Capital Allocation
146.27 USD22 Apr 2021
146.00 USD22 Apr 2021 15:13, UTC
1.00 203.07 USD Bil21 Apr 2021
Wide Stable Low Exemplary
particularly for snack consumption situations where immediacy of need is low, digitization and the
concomitant growth in the e-commerce channel have disrupted shopping paradigms, both in the ways
CPG firms deliver their wares and the ways consumers make purchasing decisions. However, we see
various normative trends that will ensure distribution prowess and retail relationships remain pertinent
to competitive dynamics in both the snack and beverage spaces. Chief among these is consumers'
penchant for social consumption, which makes on-premise food and beverage consumption a staple in
many public communal settings. This type of social behavior is much less likely to be disrupted by e-
commerce, in our view. Also, we believe there will be a plethora of scenarios, where purchases are
impromptu and the immediacy of the need is high, that will continue to be conducive to physical
purchases. We think the resiliency of convenience store and supermarket share of grocery purchases
supports our views in this regard.
There are mutually reinforcing dynamics at play in the firm's intangible assets, in our view. The breadth
of its distribution network (which we believe is tied to the broad appeal of its brands) makes Pepsi a
choice partner of smaller beverage and snack companies. In the realm of product development, the
prospect of being able to scale distribution of the final product quickly and broadly makes other
companies willing to embark on joint ventures with Pepsi. Such codevelopment and distribution
initiatives can be seen in Pepsi's partnership with Starbucks for ready-to-drink coffee and its Lipton
partnership with Unilever. Partnerships like this further diversify Pepsi's brand portfolio and increase the
avenues through which the company can monetize its innovation. In addition to the synergistic
relationship among intangible assets, these partnerships improve Pepsi's capacity utilization and
distribution density, thus bolstering its cost advantage.
We believe intangible assets represent Pepsi's primary moat source, with cost advantages secondary,
which is the converse of our view of wide-moat Coca-Cola. Though geographic and portfolio-related
idiosyncrasies make generalities difficult to make for the two behemoths, we believe that, in the
aggregate, the confluence of brand strength and retailer relationships is more important to Pepsi's
economic rent generation. The premise for this argument lies in the two firms' relative marketing
spending, with Pepsi spending appreciably less as a percentage of revenue (midsingle digits) than Coca-
Cola (low double digits). Some may argue that Coke's more robust market share in beverages is
evidence of a stronger intangible asset. However, we think a brand-predicated moat is not best
reflected in popularity (for which market share is the best proxy), but in the ability to parlay popularity
into profitability and excess returns on capital. We think Coke's relatively higher marketing spending
reflects the firm's choice to leverage superior margins emanating from its scale efficiencies to reinforce
its brands and maintain market share. While the absolute spending levels by the firms are similar, we
believe Pepsi has been able to leverage the breadth of its portfolio across both snacks and beverages,
and the inherent promotional synergies that accompany this breadth, to achieve a similar level of brand

Morningstar Equity Analyst Report | Report as of 22 Apr 2021 15:18, UTC | Reporting Currency: USD | Trading Currency: USD | Exchange: NASDAQ Page 7 of 21
© Morningstar 2021. All Rights Reserved. Unless otherwise provided in a separate agreement, you may use this report only in the country in which its original distributor is based. The information, data, analyses and opinions presented herein do not constitute investment advice; are provided solely for informational purposes and therefore are not an offer to buy or sell a security; and are not warranted to be correct, complete or accurate. The opinions expressed are as of the date written and are subject to change without notice. Except as otherwise required by law, Morningstar shall not be responsible for any trading decisions, damages or other losses resulting from, or related to, the information, data, analyses or opinions or their use. The information contained herein is the proprietary property of Morningstar and may not be reproduced, in whole or in part, or used in any manner, without the prior written consent of Morningstar. Investment research is produced and issued by subsidiaries of Morningstar, Inc. including, but not limited to, Morningstar Research Services LLC, registered with and governed by the U.S. Securities and Exchange Commission. To order reprints, call +1 312-696-6100. To license the research, call +1 312-696-6869. Please see important disclosures at the end of this report.
ß®
PepsiCo Inc PEP QQQ 22 Apr 2021 15:17, UTC
Last Price Fair Value Estimate Price/FVE Market Cap Economic MoatTM Moat TrendTM Uncertainty Capital Allocation
146.27 USD22 Apr 2021
146.00 USD22 Apr 2021 15:13, UTC
1.00 203.07 USD Bil21 Apr 2021
Wide Stable Low Exemplary
recognition and channel entrenchment as Coca-Cola, but to do so in a much more efficient way in terms
of relative advertising dollars. Moreover, we see no demonstrable evidence that Coke's higher relative
spending has been more productive. In our view, these realities lend credence to our contention that
Pepsi's intangible assets have been a stronger contributor to its competitive advantage.
We believe the characteristics we have outlined are self-perpetuating and mutually reinforcing. These
structural dynamics, in our view, are highly unlikely to be replicated by a new entrant in a way that
fundamentally alters Pepsi's competitive positioning, and we believe the firm's edge is more likely than
not to persist over the next 20 years. In conjunction with returns on invested capital (averaging in the
high teens historically and over the course of our explicit forecast) well in excess of the firm's cost of
capital, we believe these support a wide moat rating.
Fair Value and Profit Drivers Nicholas Johnson, CFA, Equity Analyst, 22 Apr 2021
We’re raising our fair value estimate for Pepsi to $146 from $145 due to time value. The firm’s snack
portfolio continues to perform well as the pandemic lingers, and near-term weakness in on-premises
sales (affecting the beverage business disproportionately), as well as heightened supply chain costs,
should moderate throughout 2021. 2020 performance belied the volatile operating environment, and
solid first-quarter results have confirmed that we should expect more of the same in 2021. Longer term,
its trajectory should remain supported by innovation, revenue growth management, and investments in
system capacity/efficiency. Our valuation implies a 2021 adjusted earnings multiple of 24.
We envision snack foods, roughly 55% of revenue, growing faster than beverages and increasing as a
proportion of the total mix. We see particularly auspicious results for the Frito-Lay brands, which have
greater international brand equity than signature Pepsi beverages, with the latter afflicted by huge
share disparities in most international markets relative to Coke. We also expect stellar growth from
“better-for-you” snack brands like Smartfood and Off The Eaten Path.
From a division perspective, we forecast price/mix contributing the preponderance of revenue growth
except in Asia and Africa, where we expect more unit growth as lower per capita consumption and
recent acquisitions (like Pioneer) support volume gains. Latin America, a predominantly snack business
where the firm boasts dominant share and per capita consumption of its products is high, should be
particularly conducive to price/mix growth (roughly 6% on average in our projection). All in, we model a
five-year top-line CAGR of 4.2%.
We model gross and operating margins widening to 55.7% and 16.9%, respectively, in 2025, versus
54.5% and 14.3% in 2020. Margins were hit in 2020 as Pepsi booked charges for merger integration and
system implementation associated with its productivity initiatives, in addition to incremental strategic
investments. Still, we believe harmonization of systems, technology-fueled analytics, and optimization of

Morningstar Equity Analyst Report | Report as of 22 Apr 2021 15:18, UTC | Reporting Currency: USD | Trading Currency: USD | Exchange: NASDAQ Page 8 of 21
© Morningstar 2021. All Rights Reserved. Unless otherwise provided in a separate agreement, you may use this report only in the country in which its original distributor is based. The information, data, analyses and opinions presented herein do not constitute investment advice; are provided solely for informational purposes and therefore are not an offer to buy or sell a security; and are not warranted to be correct, complete or accurate. The opinions expressed are as of the date written and are subject to change without notice. Except as otherwise required by law, Morningstar shall not be responsible for any trading decisions, damages or other losses resulting from, or related to, the information, data, analyses or opinions or their use. The information contained herein is the proprietary property of Morningstar and may not be reproduced, in whole or in part, or used in any manner, without the prior written consent of Morningstar. Investment research is produced and issued by subsidiaries of Morningstar, Inc. including, but not limited to, Morningstar Research Services LLC, registered with and governed by the U.S. Securities and Exchange Commission. To order reprints, call +1 312-696-6100. To license the research, call +1 312-696-6869. Please see important disclosures at the end of this report.
ß®
PepsiCo Inc PEP QQQ 22 Apr 2021 15:17, UTC
Last Price Fair Value Estimate Price/FVE Market Cap Economic MoatTM Moat TrendTM Uncertainty Capital Allocation
146.27 USD22 Apr 2021
146.00 USD22 Apr 2021 15:13, UTC
1.00 203.07 USD Bil21 Apr 2021
Wide Stable Low Exemplary
the supply chain and manufacturing apparatus will allow for margin expansion while reinvesting
appropriately for growth. The margin improvements will be buttressed by continued growth in the U.S.
ready-to-drink coffee market, which the firm is exposed to through its joint venture with Starbucks (via
Nestle), as well as growing exploits in the high-margin energy category.
Risk and Uncertainty Nicholas Johnson, CFA, Equity Analyst, 22 Apr 2021
Various dynamics, many of which are related to environmental, social, or governance issues, introduce
risk to Pepsi’s competitive positioning. One of the most salient, from our vantage point, is consumers’
increasing penchant for more natural food and drinks. As much as Pepsi has pivoted its portfolio and its
messaging, it still has to battle the stigma that accompanies processed food and drink companies due to
increased social awareness of the potential health implications. There are structural impediments to
these dynamics in developing and emerging countries, but Pepsi is disproportionately exposed to
markets like the U.S. where these sentiments seem unabated.
More stringent environmental regulation also represents a risk. For example, some states in the U.S.
have bottle deposit return systems in place, which charge consumers deposits that are refundable, as
an incentive mechanism to reduce waste. Many legislatures are seeking to place more of the financial
burden for these types of policies on producers like Pepsi. To the extent that more cumbersome laws
and proposals come to fruition, there could be a nontrivial impact on the firm’s business model.
Finally, the increasingly viral nature of the media creates omnipresent ESG risk in the form of potential
brand degradation, which is quite acute for most corporations, in our view. We believe these risks
become near existential for the most consumer-oriented firms that rely on brand resonance most
heavily. Anything that is not consistent with the zeitgeist, which can manifest in anything from a
misguided marketing campaign to disregard for human capital, gives rise to the possibility that a
company’s business model will be disrupted. While the diversity of Pepsi’s portfolio and the vast
resources at its disposal should help the firm navigate these risks, we do not think any entity is
completely immune to them.
Capital Allocation Nicholas Johnson, CFA, Equity Analyst, 22 Feb 2021
We rate capital allocation at PepsiCo as Exemplary. Its track record is not beyond reproach, but
ultimately, we believe the firm stacks up well against the three analytical pillars of our rating. The
balance sheet is sound, and we have no qualms about its financial health going forward. While there
are puts and takes informing our view on its investments, we believe that the net effect of its organic
and inorganic moves have been economically accretive and take a particularly constructive view of
recent strategic initiatives. Lastly, while the firm’s distributions skew more to share repurchases than
we’d like to see, we still believe they’re appropriate, and not anomalous relative to industry peers.
Morningstar Equity Analyst Report | Report as of 22 Apr 2021 15:18, UTC | Reporting Currency: USD | Trading Currency: USD | Exchange: NASDAQ Page 9 of 21
© Morningstar 2021. All Rights Reserved. Unless otherwise provided in a separate agreement, you may use this report only in the country in which its original distributor is based. The information, data, analyses and opinions presented herein do not constitute investment advice; are provided solely for informational purposes and therefore are not an offer to buy or sell a security; and are not warranted to be correct, complete or accurate. The opinions expressed are as of the date written and are subject to change without notice. Except as otherwise required by law, Morningstar shall not be responsible for any trading decisions, damages or other losses resulting from, or related to, the information, data, analyses or opinions or their use. The information contained herein is the proprietary property of Morningstar and may not be reproduced, in whole or in part, or used in any manner, without the prior written consent of Morningstar. Investment research is produced and issued by subsidiaries of Morningstar, Inc. including, but not limited to, Morningstar Research Services LLC, registered with and governed by the U.S. Securities and Exchange Commission. To order reprints, call +1 312-696-6100. To license the research, call +1 312-696-6869. Please see important disclosures at the end of this report.
ß®
PepsiCo Inc PEP QQQ 22 Apr 2021 15:17, UTC
Last Price Fair Value Estimate Price/FVE Market Cap Economic MoatTM Moat TrendTM Uncertainty Capital Allocation
146.27 USD22 Apr 2021
146.00 USD22 Apr 2021 15:13, UTC
1.00 203.07 USD Bil21 Apr 2021
Wide Stable Low Exemplary
Regarding investments, since merging with Frito-Lay in 1965, PepsiCo has demonstrated a proclivity for
expanding its portfolio in ways that allow it to ride various secular tailwinds, illustrated by its purchases
of Tropicana and Naked Juice, for example. Even its Quaker Foods acquisition, whose significance has
waned as the business has been beleaguered by category headwinds in cereals and robust competition,
allowed the company to attain control of Gatorade. Gatorade remains the number-one sports drink
globally, with particularly strong performance recently, and competes in a favorable category.
Former CEO Indra Nooyi was well regarded--appropriately so, in our opinion--for her ability to read the
consumer ethos and pivot the company’s portfolio accordingly. However, there were a series of
execution missteps and underinvestment, particularly in the beverage business, that stymied
momentum, in our view. Nooyi stepped down after 12 years at the helm in October 2018 and was
replaced by Ramon Laguarta. A Pepsi veteran, having been with the company for over two decades,
Laguarta has been key to a number of strategic initiatives particularly in the European business. For
example, he was instrumental in the acquisition of Russian dairy and juice company Wimm-Bill-Dann.
This strategic move significantly augmented the company’s financial position in Russia, which has
grown to become Pepsi’s third most important market behind the U.S. and Mexico.
We believe Laguarta and his team have thus far been prudent in their approach to portfolio expansion,
paying premiums for businesses with torrid growth prospects and secular tailwinds, such as
SodaStream, while picking up bargains that allow for footprint expansion in areas where the company is
underpenetrated, such as Pioneer Foods in Africa. We have a particularly favorable view of SodaStream,
a maker and distributor of sparkling water machines. It dovetails well with the consumer zeitgeist, in our
opinion, as consumers look for consumption mechanisms with reduced packaging footprints, as well as
more choice and customizability. In 2020, the firm reinvigorated its strategy for energy drinks, a high-
growth and inherently profitable category that skews to favorable channels like convenience.
Specifically, it consummated its acquisition of Rockstar Energy, a long-time partner brand that was
distributed through Pepsi's system, and also entered into an exclusive distribution agreement with
Bang, a disruptive energy player that gained market share in recent years. While the latter arrangement
has gone sour and is currently in arbitration, we believe Rockstar, in conjunction with more leeway to
parlay Mountain Dew into the energy category (the previous Rockstar agreement was more restrictive
on this front), should allow Pepsi to migrate from the energy periphery and compete more aggressively.
The firm has also been casting several nets into the e-commerce pond through Frito-Lay, not only
collaborating with retailers, but also launching various iterations of direct-to-consumer platforms. We
see fulsome promise in the latter initiatives especially, given the greater autonomy over consumer data/
analytics as well as the long-term profit implications of disintermediation.
Pepsi has been robust on the capital return front, with over a decade of dividend increases and share
buybacks of $2 billion-$3 billion over the past five years. We expect dividend increases to continue to

Morningstar Equity Analyst Report | Report as of 22 Apr 2021 15:18, UTC | Reporting Currency: USD | Trading Currency: USD | Exchange: NASDAQ Page 10 of 21
© Morningstar 2021. All Rights Reserved. Unless otherwise provided in a separate agreement, you may use this report only in the country in which its original distributor is based. The information, data, analyses and opinions presented herein do not constitute investment advice; are provided solely for informational purposes and therefore are not an offer to buy or sell a security; and are not warranted to be correct, complete or accurate. The opinions expressed are as of the date written and are subject to change without notice. Except as otherwise required by law, Morningstar shall not be responsible for any trading decisions, damages or other losses resulting from, or related to, the information, data, analyses or opinions or their use. The information contained herein is the proprietary property of Morningstar and may not be reproduced, in whole or in part, or used in any manner, without the prior written consent of Morningstar. Investment research is produced and issued by subsidiaries of Morningstar, Inc. including, but not limited to, Morningstar Research Services LLC, registered with and governed by the U.S. Securities and Exchange Commission. To order reprints, call +1 312-696-6100. To license the research, call +1 312-696-6869. Please see important disclosures at the end of this report.
ß®
PepsiCo Inc PEP QQQ 22 Apr 2021 15:17, UTC
Last Price Fair Value Estimate Price/FVE Market Cap Economic MoatTM Moat TrendTM Uncertainty Capital Allocation
146.27 USD22 Apr 2021
146.00 USD22 Apr 2021 15:13, UTC
1.00 203.07 USD Bil21 Apr 2021
Wide Stable Low Exemplary
the tune of 5% on average over the course of our explicit forecast and envision the firm buying back
roughly $1 billion worth of stock annually. Share repurchases should only be accretive when executed at
prices below our estimates of intrinsic value, in our view, and while management’s annual
commitments to buybacks strike us as too indiscriminate, we don’t believe these cash outlays come at
the expense of necessary internal reinvestment.
Analyst Notes Archive
Not Much to Dislike in Pepsi’s Q1; Comps Remain Tough, but Enough Portfolio Optionality for
Growth Nicholas Johnson, CFA, Equity Analyst, 15 Apr 2021
With headline performance in 2020 that belied the disruption across the broader economy, investors
were seemingly less enamored with wide-moat PepsiCo’s value proposition heading into its first-quarter
earnings print (as shares have been under pressure in recent months). Still, the firm continued its streak
of impressive performance (with top- and bottom-line results ahead of FactSet consensus), dispelling--at
least for now--the notion that its growth will be challenged in 2021. To be sure, comps will be toughest
in the quarters ahead, but we expect the diversification in the business to allow the firm to maintain its
growth algorithm irrespective of how consumer behavior evolves throughout the year. We don’t plan to
materially change our $145 fair value estimate outside of time value adjustments, and while current
trading levels no longer present a compelling margin of safety, we’d be happy buyers on any further
pullbacks.
Revenue of $14.8 billion represented a 6.8% year-over-year increase. Though 5 points of this bump was
due to recent strategic acquisitions (chiefly Be & Cheery in China, Pioneer in Africa, and Rockstar in the
U.S.), over 2% organic growth is still commendable given tough comps faced from March 2020 pantry
loading. In snack foods, Frito Lay remained vibrant, and Quaker brands in the U.S. continued to benefit
from elevated at-home occasions (specifically around breakfast and side dishes). Beverages had several
bright spots, with the North America business up 1.5% organically. Energy remains a key strategic focus
in this unit, revolving around Rockstar and Mountain Dew (with its Bang partnership likely sitting
ignominiously on the sidelines). The firm signed NBA superstar LeBron James as the marquee
ambassador for its new Mountain Dew energy drink (Rise); this is no small feat, and likely required a
nontrivial financial commitment, but signals to us management’s determination to compete more
aggressively in this high growth, high margin category.
Pepsi Firing on All Cylinders Heading Into 2021; Shares Might Be Getting Attractive Nicholas
Johnson, CFA, Equity Analyst, 11 Feb 2021
Since the onset of the pandemic, wide-moat PepsiCo’s results have consistently belied the tumult in the
global economy, and the company closed 2020 in similar fashion. Beyond solid fourth-quarter results
(ahead on revenue and in-line earnings relative to FactSet consensus), management issued guidance

Morningstar Equity Analyst Report | Report as of 22 Apr 2021 15:18, UTC | Reporting Currency: USD | Trading Currency: USD | Exchange: NASDAQ Page 11 of 21
© Morningstar 2021. All Rights Reserved. Unless otherwise provided in a separate agreement, you may use this report only in the country in which its original distributor is based. The information, data, analyses and opinions presented herein do not constitute investment advice; are provided solely for informational purposes and therefore are not an offer to buy or sell a security; and are not warranted to be correct, complete or accurate. The opinions expressed are as of the date written and are subject to change without notice. Except as otherwise required by law, Morningstar shall not be responsible for any trading decisions, damages or other losses resulting from, or related to, the information, data, analyses or opinions or their use. The information contained herein is the proprietary property of Morningstar and may not be reproduced, in whole or in part, or used in any manner, without the prior written consent of Morningstar. Investment research is produced and issued by subsidiaries of Morningstar, Inc. including, but not limited to, Morningstar Research Services LLC, registered with and governed by the U.S. Securities and Exchange Commission. To order reprints, call +1 312-696-6100. To license the research, call +1 312-696-6869. Please see important disclosures at the end of this report.
ß®
PepsiCo Inc PEP QQQ 22 Apr 2021 15:17, UTC
Last Price Fair Value Estimate Price/FVE Market Cap Economic MoatTM Moat TrendTM Uncertainty Capital Allocation
146.27 USD22 Apr 2021
146.00 USD22 Apr 2021 15:13, UTC
1.00 203.07 USD Bil21 Apr 2021
Wide Stable Low Exemplary
consistent with its long-term growth algorithm (mid-single-digit organic top-line growth and high-single-
digit earnings growth), which we consider particularly laudable. While there should be countervailing
forces in the firm’s trajectory over the next couple of years, with businesses like Quaker currently
growing at unsustainable levels due to COVID-19, we believe PepsiCo's portfolio breadth and system
investments give it tons of optionality in executing its growth and margin aspirations. We’ll likely raise
our $140 fair value estimate modestly after rolling our model, and with the shares down slightly after
the report, attractive entry points could be emerging. We’d recommend quality-oriented investors keep
an eye out.
Revenue was $22.5 billion, up 8.8% year over year. While this was skewed upward by acquisitions like
Pioneer, the organic performance, at 5.7%, was strikingly resilient. It was business as usual for snack
food, up 5%, as the Frito-Lay and Quaker brands continue to benefit from elevated at-home meal
preparation and incremental snacking occasions. The beverage business posted 6% growth globally,
fueled by a 5.5% uptick in the North America segment. When juxtaposed with the North America
business of its chief rival, Coca-Cola (down 3% organically), Pepsi’s performance looks particularly
impressive. While this is largely due to Coke’s disproportionate representation in on-premises channels,
we also believe PepsiCo CEO Ramon Laguarta and team have done a tremendous job augmenting the
growth profile of marquee U.S. beverage brands while carving out brand equity in secularly advantaged
categories (like Bubly in sparkling water).
The Beyond Meat-Pepsi Joint Venture Has Strategic Merit, but the Stock Reaction Is Likely
Overdone Rebecca Scheuneman, CFA, Equity Analyst, 26 Jan 2021
No-moat Beyond Meat and wide-moat PepsiCo have announced the formation of a joint venture called
The Planet Partnership to develop snacks and beverages made from plant-based protein. This is
Beyond’s first expansion outside of plant-based meats, indicating that its total addressable market is
likely larger than investors initially envisioned. The shares are responding accordingly, surging 20%,
pushing the stock into 2-star territory. We maintain our $146 fair value estimate until we hear more
details from the firms, including the timing and nature of product launches, so we can gauge the
potential market opportunity.
If the venture is limited to the types of products already in Pepsi’s lineup, the Beyond Meat stock
movement is likely an overreaction, as plant-based Frappuccino, Muscle Milk, and Matador jerky would
likely not generate the $300 million in annual revenue needed to justify it. If the venture expands to
other dairy and meat-based products outside of Pepsi’s current portfolio, the market opportunity will be
larger, but so will execution risks as the firms move further away from their traditional areas of
expertise. Additionally, while Pepsi has had several successful partnerships, not all its deals have
panned out well. For example, its distribution agreement with Bang, a disruptive energy drink company,
recently went sour and is currently in arbitration. Still, the formality of the JV structure and the

Morningstar Equity Analyst Report | Report as of 22 Apr 2021 15:18, UTC | Reporting Currency: USD | Trading Currency: USD | Exchange: NASDAQ Page 12 of 21
© Morningstar 2021. All Rights Reserved. Unless otherwise provided in a separate agreement, you may use this report only in the country in which its original distributor is based. The information, data, analyses and opinions presented herein do not constitute investment advice; are provided solely for informational purposes and therefore are not an offer to buy or sell a security; and are not warranted to be correct, complete or accurate. The opinions expressed are as of the date written and are subject to change without notice. Except as otherwise required by law, Morningstar shall not be responsible for any trading decisions, damages or other losses resulting from, or related to, the information, data, analyses or opinions or their use. The information contained herein is the proprietary property of Morningstar and may not be reproduced, in whole or in part, or used in any manner, without the prior written consent of Morningstar. Investment research is produced and issued by subsidiaries of Morningstar, Inc. including, but not limited to, Morningstar Research Services LLC, registered with and governed by the U.S. Securities and Exchange Commission. To order reprints, call +1 312-696-6100. To license the research, call +1 312-696-6869. Please see important disclosures at the end of this report.
ß®
PepsiCo Inc PEP QQQ 22 Apr 2021 15:17, UTC
Last Price Fair Value Estimate Price/FVE Market Cap Economic MoatTM Moat TrendTM Uncertainty Capital Allocation
146.27 USD22 Apr 2021
146.00 USD22 Apr 2021 15:13, UTC
1.00 203.07 USD Bil21 Apr 2021
Wide Stable Low Exemplary
favorable secular backdrop could make this a more fruitful endeavor for both firms.
We view the partnership with Pepsi as a judicious approach to leveraging Beyond’s plant-based protein
expertise and Pepsi’s marketing and distribution muscle in order to meet consumers’ growing appetite
for sustainable products. The move supports our Exemplary rating of Beyond’s capital allocation
strategies, as the firm has a strong track record of prudently investing resources in high-return projects
while maintaining a strong balance sheet.
PepsiCo and Coca-Cola Saw Diverging Fortunes in 2020; We Expect Convergence as 2021
Progresses Nicholas Johnson, CFA, Equity Analyst, 25 Jan 2021
Ahead of earnings season, we thought it’d be useful to reflect on the past year for the two soft drink
titans we cover as well as provide our early 2021 prognosis. Regarding valuation, we believe the unique
backdrop that allowed PepsiCo to deftly navigate 2020 is fully reflected in its stock price, trading in line
with our $140 fair value estimate. Conversely, we see a compelling margin of safety in Coca-Cola’s stock
relative to our $54 fair value estimate--investor concerns around recent adverse tax judgements are
misguided, in our view, and the commercial backdrop should be more favorable in 2021.
The two most salient differences between the two firms--portfolio composition and geographic
footprint--will prove decisive for anyone looking to reconcile their divergent performances in 2020. For
Coke, the coronavirus pandemic morphed its historic strengths (beverage portfolio and material non-U.S.
exposure) into glaring weaknesses. Increases in off-premises consumption could not mask the on-
premises decline, and when combined the off-premises skew to more commoditized categories, the
result was a significant revenue drop (we forecast 8.5% organically). Still, margins were resilient (down
an estimated 13%), and while the firm will still be leveraged to mobility trends and the viability of
foodservice in 2021, we expect the confluence of weak comps, vaccination efforts, and innovation (like
Topo Chico Hard Seltzer) will lead to a bounce-back year for Big Red.
For Pepsi, its stalwart snack portfolio (which benefited from new consumption occasions spurred by
COVID-19) and preeminent North America exposure (60% of normalized sales) allowed it to post
enviable 2020 organic growth (estimated over 4%) in line with its long-term algorithm and belying what
was expected to be a tumultuous year. The firm will soon have to navigate more normalized consumer
behavior, and we expect the beverage business--with its own set of idiosyncratic challenges--to return
to focus in 2021.
Business as Usual for Snacks, but Beverage Portfolio Surprises to the Upside in Pepsi’s Q3 Nicholas
Johnson, CFA, Equity Analyst, 1 Oct 2020
With wide-moat PepsiCo’s stock rallying in the days leading up to its third-quarter earnings print, it
seemed like investors were becoming increasingly enamored by the prospects of: 1) continued growth
Morningstar Equity Analyst Report | Report as of 22 Apr 2021 15:18, UTC | Reporting Currency: USD | Trading Currency: USD | Exchange: NASDAQ Page 13 of 21
© Morningstar 2021. All Rights Reserved. Unless otherwise provided in a separate agreement, you may use this report only in the country in which its original distributor is based. The information, data, analyses and opinions presented herein do not constitute investment advice; are provided solely for informational purposes and therefore are not an offer to buy or sell a security; and are not warranted to be correct, complete or accurate. The opinions expressed are as of the date written and are subject to change without notice. Except as otherwise required by law, Morningstar shall not be responsible for any trading decisions, damages or other losses resulting from, or related to, the information, data, analyses or opinions or their use. The information contained herein is the proprietary property of Morningstar and may not be reproduced, in whole or in part, or used in any manner, without the prior written consent of Morningstar. Investment research is produced and issued by subsidiaries of Morningstar, Inc. including, but not limited to, Morningstar Research Services LLC, registered with and governed by the U.S. Securities and Exchange Commission. To order reprints, call +1 312-696-6100. To license the research, call +1 312-696-6869. Please see important disclosures at the end of this report.
ß®
PepsiCo Inc PEP QQQ 22 Apr 2021 15:17, UTC
Last Price Fair Value Estimate Price/FVE Market Cap Economic MoatTM Moat TrendTM Uncertainty Capital Allocation
146.27 USD22 Apr 2021
146.00 USD22 Apr 2021 15:13, UTC
1.00 203.07 USD Bil21 Apr 2021
Wide Stable Low Exemplary
in snacks, 2) recovery in beverages, and 3) moderating coronavirus-related costs. The firm delivered on
almost all fronts, culminating in top- and bottom-line beats relative to CapIQ consensus. Management’s
full-year guidance (4% organic growth and core EPS of $5.50) was a smidge ahead of our expectations
though not meaningful enough to alter our $140 fair value estimate, leaving the shares fully valued in
our view.
Revenue came in at $18.1 billion, reflecting year-over-year growth of 5.3%. With the coronavirus
increasing the frequency of various snacking occasions, the robust 6% organic growth in the snack and
food portfolio came as no surprise, but the 3% increase in beverages was stronger than we anticipated,
due to the confluence of strength in the off-trade and less precipitous declines in food service. We were
particularly pleased with the North America beverage business (up 3% organically), and with
commentary regarding improvement in the U.S. convenience channel. Better leveraging scale and
portfolio scope to win more placements in this channel was a key rationale of the firm’s recent moves in
the energy category, namely the Rockstar acquisition and the Bang distribution agreement. As mobility
improves, we expect stakeholders within this channel to become less focused on survival and more
focused on growth, which should allow Pepsi more latitude to execute against its initiatives.
Core operating margin was resilient, down only 40 basis points to 16.8%. Margins this year have largely
been a function of direct COVID-19 costs as well as other corollaries of the crisis and their impacts on
strategic investments (like advertising). Profitability will likely be volatile in the near term, but we still
see plenty of room for margin expansion longer term.
Pepsi’s Snack Business Allowing It to Adroitly Navigate Uncertain Marketplace; Shares Fully Valued
Nicholas Johnson, CFA, Equity Analyst, 13 Jul 2020
With the second quarter widely expected to be the ugliest for most beverage companies, we think
investors had relatively facile expectations heading into wide-moat PepsiCo’s earnings print and were
primarily looking to gauge how the resilience of the snacking business (55% of sales) would offset
weakness in soft drinks. The results were comforting in this regard (top- and bottom-line beats relative
to CapIQ consensus), and management alluded to a sequential recovery from COVID-19 disruption
during the third quarter. We plan to tweak our near-term estimates modestly, but our $140 fair value
estimate will not change, and the shares look fully valued to us. Sentiment around wide-moat Coca-
Cola’s stock has been less constructive due to its pure-play beverage exposure, but despite a more
precarious near-term outlook, we still see a more compelling long-term risk/reward opportunity in Big
Red’s shares.
Sales came in at $15.9 billion for the quarter, a 3% year-over-year decline. Organic revenue, however,
was roughly flat, an impressive feat reflecting a booming snack business (up 5% globally with brands
like Tostitos and Cheetos growing double-digits) juxtaposed against weak beverage performance (down
7%, with on-premises restrictions more than offsetting strong traditional retail sales). Headline Latin

Morningstar Equity Analyst Report | Report as of 22 Apr 2021 15:18, UTC | Reporting Currency: USD | Trading Currency: USD | Exchange: NASDAQ Page 14 of 21
© Morningstar 2021. All Rights Reserved. Unless otherwise provided in a separate agreement, you may use this report only in the country in which its original distributor is based. The information, data, analyses and opinions presented herein do not constitute investment advice; are provided solely for informational purposes and therefore are not an offer to buy or sell a security; and are not warranted to be correct, complete or accurate. The opinions expressed are as of the date written and are subject to change without notice. Except as otherwise required by law, Morningstar shall not be responsible for any trading decisions, damages or other losses resulting from, or related to, the information, data, analyses or opinions or their use. The information contained herein is the proprietary property of Morningstar and may not be reproduced, in whole or in part, or used in any manner, without the prior written consent of Morningstar. Investment research is produced and issued by subsidiaries of Morningstar, Inc. including, but not limited to, Morningstar Research Services LLC, registered with and governed by the U.S. Securities and Exchange Commission. To order reprints, call +1 312-696-6100. To license the research, call +1 312-696-6869. Please see important disclosures at the end of this report.
ß®
PepsiCo Inc PEP QQQ 22 Apr 2021 15:17, UTC
Last Price Fair Value Estimate Price/FVE Market Cap Economic MoatTM Moat TrendTM Uncertainty Capital Allocation
146.27 USD22 Apr 2021
146.00 USD22 Apr 2021 15:13, UTC
1.00 203.07 USD Bil21 Apr 2021
Wide Stable Low Exemplary
America revenue (a 17% decline) reflected currency headwinds and belied the region’s relatively healthy
organic sales (which were flat). A predominantly snack food business, Pepsi’s Latin American operations
are well suited for this environment due to less on-premises exposure and more containment-induced
consumption occasions (whether for breakfast, snacking, dinner, or the like). Nevertheless, we’ll keep a
close eye on how this business holds up, given the socioeconomic realities of the region (which have
been exacerbated by COVID-19) and fundamentally different go-to-market dynamics. K

Morningstar Equity Analyst Report | Report as of 22 Apr 2021 15:18, UTC | Reporting Currency: USD | Trading Currency: USD | Exchange: NASDAQ Page 15 of 21
© Morningstar 2021. All Rights Reserved. Unless otherwise provided in a separate agreement, you may use this report only in the country in which its original distributor is based. The information, data, analyses and opinions presented herein do not constitute investment advice; are provided solely for informational purposes and therefore are not an offer to buy or sell a security; and are not warranted to be correct, complete or accurate. The opinions expressed are as of the date written and are subject to change without notice. Except as otherwise required by law, Morningstar shall not be responsible for any trading decisions, damages or other losses resulting from, or related to, the information, data, analyses or opinions or their use. The information contained herein is the proprietary property of Morningstar and may not be reproduced, in whole or in part, or used in any manner, without the prior written consent of Morningstar. Investment research is produced and issued by subsidiaries of Morningstar, Inc. including, but not limited to, Morningstar Research Services LLC, registered with and governed by the U.S. Securities and Exchange Commission. To order reprints, call +1 312-696-6100. To license the research, call +1 312-696-6869. Please see important disclosures at the end of this report.
ß®
PepsiCo Inc PEP QQQ 22 Apr 2021 15:17, UTC
Competitors Price vs. Fair Value
Coca-Cola Co KO
0
50
100
150
200
Fair Value: 55.0024 Feb 2021 20:16, UTC
Last Close: 54.61Over ValuedUnder Valued
2016 2017 2018 2019 2020 YTD
0.93 0.99 0.97 1.03 1.02 0.99 Price/Fair Value
-0.23 14.23 6.60 20.27 2.04 0.35 Total Return %
Morningstar Rating
Total Return % as of 21 Apr 2021. Last Close as of 21 Apr 2021. Fair Value as of 24 Feb 2021 20:16, UTC.
General Mills Inc GIS
0
50
100
150
200
Last Close: 62.76
Fair Value: 57.004 Jan 2021 15:58, UTC
Over ValuedUnder Valued
2016 2017 2018 2019 2020 YTD
1.07 0.97 0.68 0.99 1.11 1.10 Price/Fair Value
10.35 -0.87 -31.02 42.58 13.48 8.47 Total Return %
Morningstar Rating
Total Return % as of 21 Apr 2021. Last Close as of 21 Apr 2021. Fair Value as of 4 Jan 2021 15:58, UTC.

Morningstar Equity Analyst Report | Report as of 22 Apr 2021 15:18, UTC | Reporting Currency: USD | Trading Currency: USD | Exchange: NASDAQ Page 16 of 21
© Morningstar 2021. All Rights Reserved. Unless otherwise provided in a separate agreement, you may use this report only in the country in which its original distributor is based. The information, data, analyses and opinions presented herein do not constitute investment advice; are provided solely for informational purposes and therefore are not an offer to buy or sell a security; and are not warranted to be correct, complete or accurate. The opinions expressed are as of the date written and are subject to change without notice. Except as otherwise required by law, Morningstar shall not be responsible for any trading decisions, damages or other losses resulting from, or related to, the information, data, analyses or opinions or their use. The information contained herein is the proprietary property of Morningstar and may not be reproduced, in whole or in part, or used in any manner, without the prior written consent of Morningstar. Investment research is produced and issued by subsidiaries of Morningstar, Inc. including, but not limited to, Morningstar Research Services LLC, registered with and governed by the U.S. Securities and Exchange Commission. To order reprints, call +1 312-696-6100. To license the research, call +1 312-696-6869. Please see important disclosures at the end of this report.
ß®
PepsiCo Inc PEP QQQ 22 Apr 2021 15:17, UTC
Keurig Dr Pepper Inc KDP
0
50
100
150
200
Last Close: 36.31
Fair Value: 28.501 Mar 2021 19:58, UTC
Over ValuedUnder Valued
2016 2017 2018 2019 2020 YTD
1.23 1.06 1.19 1.11 1.19 1.27 Price/Fair Value
-0.44 9.61 34.06 15.25 12.61 14.41 Total Return %
Morningstar Rating
Total Return % as of 21 Apr 2021. Last Close as of 21 Apr 2021. Fair Value as of 1 Mar 2021 19:58, UTC.
Morningstar Equity Analyst Report | Report as of 22 Apr 2021 15:18, UTC | Reporting Currency: USD | Trading Currency: USD | Exchange: NASDAQ Page 17 of 21
© Morningstar 2021. All Rights Reserved. Unless otherwise provided in a separate agreement, you may use this report only in the country in which its original distributor is based. The information, data, analyses and opinions presented herein do not constitute investment advice; are provided solely for informational purposes and therefore are not an offer to buy or sell a security; and are not warranted to be correct, complete or accurate. The opinions expressed are as of the date written and are subject to change without notice. Except as otherwise required by law, Morningstar shall not be responsible for any trading decisions, damages or other losses resulting from, or related to, the information, data, analyses or opinions or their use. The information contained herein is the proprietary property of Morningstar and may not be reproduced, in whole or in part, or used in any manner, without the prior written consent of Morningstar. Investment research is produced and issued by subsidiaries of Morningstar, Inc. including, but not limited to, Morningstar Research Services LLC, registered with and governed by the U.S. Securities and Exchange Commission. To order reprints, call +1 312-696-6100. To license the research, call +1 312-696-6869. Please see important disclosures at the end of this report.
ß®
PepsiCo Inc PEP QQQ 22 Apr 2021 15:17, UTC
Last Price Fair Value Estimate Price/FVE Market Cap Economic MoatTM Moat TrendTM Uncertainty Capital Allocation
146.27 USD22 Apr 2021
146.00 USD22 Apr 2021 15:13, UTC
1.00 203.07 USD Bil21 Apr 2021
Wide Stable Low Exemplary
Morningstar Historical Summary
Financials as of 31 Mar 2021
Fiscal Year, ends 31 Dec 2011 2012 2013 2014 2015 2016 2017 2018 2019 2020 YTD TTM
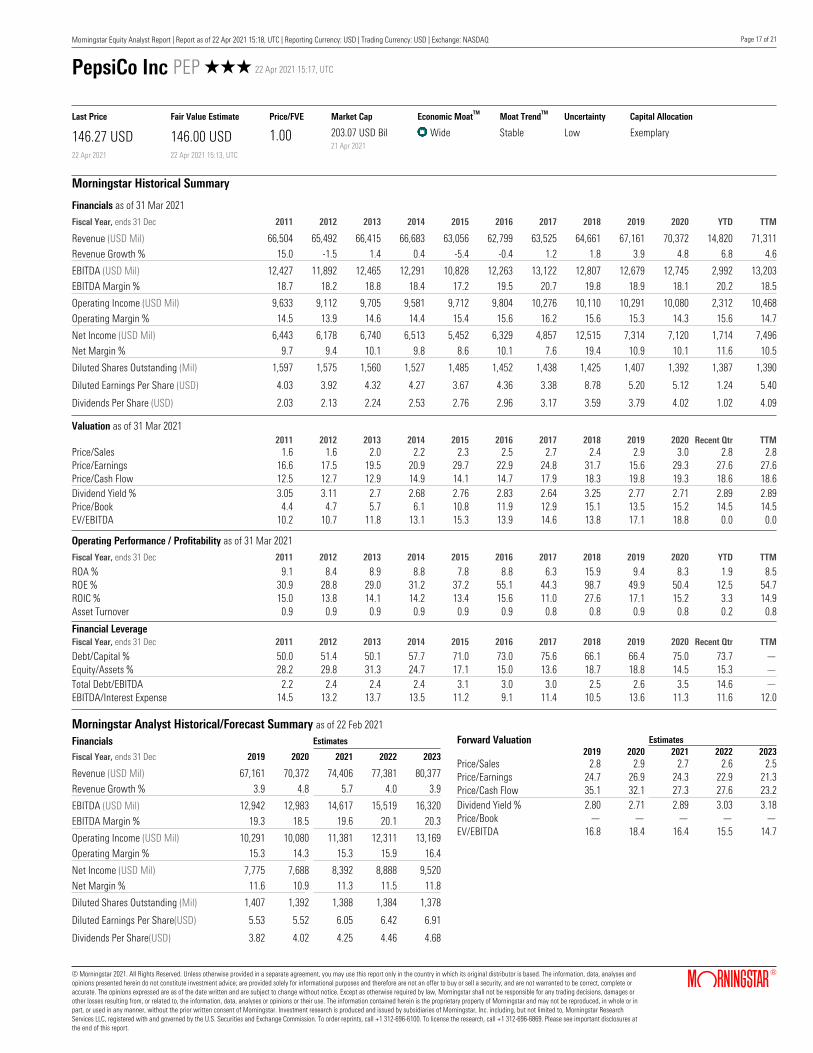
Revenue (USD Mil) 66,504 65,492 66,415 66,683 63,056 62,799 63,525 64,661 67,161 70,372 14,820 71,311
Revenue Growth % 15.0 -1.5 1.4 0.4 -5.4 -0.4 1.2 1.8 3.9 4.8 6.8 4.6
EBITDA (USD Mil) 12,427 11,892 12,465 12,291 10,828 12,263 13,122 12,807 12,679 12,745 2,992 13,203
EBITDA Margin % 18.7 18.2 18.8 18.4 17.2 19.5 20.7 19.8 18.9 18.1 20.2 18.5
Operating Income (USD Mil) 9,633 9,112 9,705 9,581 9,712 9,804 10,276 10,110 10,291 10,080 2,312 10,468
Operating Margin % 14.5 13.9 14.6 14.4 15.4 15.6 16.2 15.6 15.3 14.3 15.6 14.7
Net Income (USD Mil) 6,443 6,178 6,740 6,513 5,452 6,329 4,857 12,515 7,314 7,120 1,714 7,496
Net Margin % 9.7 9.4 10.1 9.8 8.6 10.1 7.6 19.4 10.9 10.1 11.6 10.5
Diluted Shares Outstanding (Mil) 1,597 1,575 1,560 1,527 1,485 1,452 1,438 1,425 1,407 1,392 1,387 1,390
Diluted Earnings Per Share (USD) 4.03 3.92 4.32 4.27 3.67 4.36 3.38 8.78 5.20 5.12 1.24 5.40
Dividends Per Share (USD) 2.03 2.13 2.24 2.53 2.76 2.96 3.17 3.59 3.79 4.02 1.02 4.09
Valuation as of 31 Mar 20212011 2012 2013 2014 2015 2016 2017 2018 2019 2020 Recent Qtr TTM
Price/Sales 1.6 1.6 2.0 2.2 2.3 2.5 2.7 2.4 2.9 3.0 2.8 2.8Price/Earnings 16.6 17.5 19.5 20.9 29.7 22.9 24.8 31.7 15.6 29.3 27.6 27.6Price/Cash Flow 12.5 12.7 12.9 14.9 14.1 14.7 17.9 18.3 19.8 19.3 18.6 18.6Dividend Yield % 3.05 3.11 2.7 2.68 2.76 2.83 2.64 3.25 2.77 2.71 2.89 2.89Price/Book 4.4 4.7 5.7 6.1 10.8 11.9 12.9 15.1 13.5 15.2 14.5 14.5EV/EBITDA 10.2 10.7 11.8 13.1 15.3 13.9 14.6 13.8 17.1 18.8 0.0 0.0
Operating Performance / Profitability as of 31 Mar 2021
Fiscal Year, ends 31 Dec 2011 2012 2013 2014 2015 2016 2017 2018 2019 2020 YTD TTM
ROA % 9.1 8.4 8.9 8.8 7.8 8.8 6.3 15.9 9.4 8.3 1.9 8.5ROE % 30.9 28.8 29.0 31.2 37.2 55.1 44.3 98.7 49.9 50.4 12.5 54.7ROIC % 15.0 13.8 14.1 14.2 13.4 15.6 11.0 27.6 17.1 15.2 3.3 14.9Asset Turnover 0.9 0.9 0.9 0.9 0.9 0.9 0.8 0.8 0.9 0.8 0.2 0.8
Financial LeverageFiscal Year, ends 31 Dec 2011 2012 2013 2014 2015 2016 2017 2018 2019 2020 Recent Qtr TTM
Debt/Capital % 50.0 51.4 50.1 57.7 71.0 73.0 75.6 66.1 66.4 75.0 73.7 —Equity/Assets % 28.2 29.8 31.3 24.7 17.1 15.0 13.6 18.7 18.8 14.5 15.3 —Total Debt/EBITDA 2.2 2.4 2.4 2.4 3.1 3.0 3.0 2.5 2.6 3.5 14.6 —EBITDA/Interest Expense 14.5 13.2 13.7 13.5 11.2 9.1 11.4 10.5 13.6 11.3 11.6 12.0
Morningstar Analyst Historical/Forecast Summary as of 22 Feb 2021
Financials Estimates
Fiscal Year, ends 31 Dec 2019 2020 2021 2022 2023
Revenue (USD Mil) 67,161 70,372 74,406 77,381 80,377
Revenue Growth % 3.9 4.8 5.7 4.0 3.9
EBITDA (USD Mil) 12,942 12,983 14,617 15,519 16,320
EBITDA Margin % 19.3 18.5 19.6 20.1 20.3
Operating Income (USD Mil) 10,291 10,080 11,381 12,311 13,169
Operating Margin % 15.3 14.3 15.3 15.9 16.4
Net Income (USD Mil) 7,775 7,688 8,392 8,888 9,520
Net Margin % 11.6 10.9 11.3 11.5 11.8
Diluted Shares Outstanding (Mil) 1,407 1,392 1,388 1,384 1,378
Diluted Earnings Per Share(USD) 5.53 5.52 6.05 6.42 6.91
Dividends Per Share(USD) 3.82 4.02 4.25 4.46 4.68
Forward Valuation Estimates2019 2020 2021 2022 2023
Price/Sales 2.8 2.9 2.7 2.6 2.5Price/Earnings 24.7 26.9 24.3 22.9 21.3Price/Cash Flow 35.1 32.1 27.3 27.6 23.2Dividend Yield % 2.80 2.71 2.89 3.03 3.18Price/Book — — — — —EV/EBITDA 16.8 18.4 16.4 15.5 14.7

Morningstar Equity Analyst Report | Report as of 22 Apr 2021 15:18, UTC | Reporting Currency: USD | Trading Currency: USD | Exchange: NASDAQ Page 18 of 21
© Morningstar 2021. All Rights Reserved. Unless otherwise provided in a separate agreement, you may use this report only in the country in which its original distributor is based. The information, data, analyses and opinions presented herein do not constitute investment advice; are provided solely for informational purposes and therefore are not an offer to buy or sell a security; and are not warranted to be correct, complete or accurate. The opinions expressed are as of the date written and are subject to change without notice. Except as otherwise required by law, Morningstar shall not be responsible for any trading decisions, damages or other losses resulting from, or related to, the information, data, analyses or opinions or their use. The information contained herein is the proprietary property of Morningstar and may not be reproduced, in whole or in part, or used in any manner, without the prior written consent of Morningstar. Investment research is produced and issued by subsidiaries of Morningstar, Inc. including, but not limited to, Morningstar Research Services LLC, registered with and governed by the U.S. Securities and Exchange Commission. To order reprints, call +1 312-696-6100. To license the research, call +1 312-696-6869. Please see important disclosures at the end of this report.
ß®
Research Methodology for Valuing Companies
Morningstar Equity Research Star Rating Methodology
Overview
At the heart of our valuation system is a detailed projec-tion of a company’s future cash flows, resulting from our analysts’ research. Analysts create custom industry and company assumptions to feed income statement, balance sheet, and capital investment assumptions into our glob-ally standardized, proprietary discounted cash flow, or DCF, modeling templates. We use scenario analysis, inde-pth competitive advantage analysis, and a variety of other analytical tools to augment this process. Moreover, we think analyzing valuation through discounted cash flows presents a better lens for viewing cyclical companies, high-growth firms, businesses with finite lives (e.g., mines), or companies expected to generate negative earnings over the next few years. That said, we don’t dis-miss multiples altogether but rather use them as support-ing cross-checks for our DCF-based fair value estimates. We also acknowledge that DCF models offer their own challenges (including a potential proliferation of estim-ated inputs and the possibility that the method may miss shortterm market-price movements), but we believe these negatives are mitigated by deep analysis and our longterm approach.
Morningstar’s equity research group (”we,” “our”) be-lieves that a company’s intrinsic worth results from the future cash flows it can generate. The Morningstar Rating for stocks identifies stocks trading at a discount or premi-um to their intrinsic worth—or fair value estimate, in Morningstar terminology. Five-star stocks sell for the biggest risk adjusted discount to their fair values, where-as 1-star stocks trade at premiums to their intrinsic worth.
Four key components drive the Morningstar rating: (1) our assessment of the firm’s economic moat, (2) our estimate of the stock’s fair value, (3) our uncertainty around that fair value estimate and (4) the current market price. This process ultimately culminates in our singlepoint star rat-ing.
1. Economic Moat
The concept of an economic moat plays a vital role not only in our qualitative assessment of a firm’s long-term investment potential, but also in the actual calculation of our fair value estimates. An economic moat is a structural feature that allows a firm to sustain excess profits over a long period of time. We define economic profits as re-turns on invested capital (or ROIC) over and above our es-
timate of a firm’s cost of capital, or weighted average cost of capital (or WACC). Without a moat, profits are more susceptible to competition. We have identified five sources of economic moats: intangible assets, switching costs, network effect, cost advantage, and efficient scale.
Companies with a narrow moat are those we believe are more likely than not to achieve normalized excess returns for at least the next 10 years. Wide-moat companies are those in which we have very high confidence that excess returns will remain for 10 years, with excess returns more likely than not to remain for at least 20 years. The longer a firm generates economic profits, the higher its intrinsic value. We believe low-quality, no-moat companies will see their normalized returns gravitate toward the firm’s cost of capital more quickly than companies with moats.
When considering a company's moat, we also assess whether there is a substantial threat of value destruction, stemming from risks related to ESG, industry disruption, financial health, or other idiosyncratic issues. In this con-text, a risk is considered potentially value destructive if its occurrence would eliminate a firm’s economic profit on a cumulative or midcycle basis. If we deem the probability of occurrence sufficiently high, we would not characterize the company as possessing an economic moat.
To assess the sustainability of excess profits, analysts per-form ongoing assessments of the moat trend. A firm’s moat trend is positive in cases where we think its sources of competitive advantage are growing stronger; stable where we don’t anticipate changes to competitive ad-vantages over the next several years; or negative when we see signs of deterioration.
2. Estimated Fair Value
Combining our analysts’ financial forecasts with the firm’s economic moat helps us assess how long returns on invested capital are likely to exceed the firm’s cost of capital. Returns of firms with a wide economic moat rat-ing are assumed to fade to the perpetuity period over a longer period of time than the returns of narrow-moat firms, and both will fade slower than no-moat firms, in-creasing our estimate of their intrinsic value.
Our model is divided into three distinct stages:
Stage I: Explicit Forecast
In this stage, which can last five to 10 years, analysts make full financial statement forecasts, including items such as revenue, profit margins, tax rates, changes in workingcapital accounts, and capital spending. Based on these projections, we calculate earnings before interest, after taxes (EBI) and the net new investment (NNI) to de-rive our annual free cash flow forecast.
Stage II: FadeThe second stage of our model is the period it will take the company’s return on new invested capital—the re-turn on capital of the next dollar invested (“RONIC”)—to decline (or rise) to its cost of capital. During the Stage II period, we use a formula to approximate cash flows in lieu of explicitly modeling the income statement, balance sheet, and cash flow statement as we do in Stage I. The length of the second stage depends on the strength of the company’s economic moat. We forecast this period to last anywhere from one year (for companies with no eco-nomic moat) to 10–15 years or more (for wide-moat com-panies). During this period, cash flows are forecast using four assumptions: an average growth rate for EBI over the period, a normalized investment rate, average return on new invested capital (RONIC), and the number of years until perpetuity, when excess returns cease. The invest-ment rate and return on new invested capital decline un-til a perpetuity value is calculated. In the case of firms that do not earn their cost of capital, we assume marginal ROICs rise to the firm’s cost of capital (usually attribut-able to less reinvestment), and we may truncate the second stage.
Stage III: Perpetuity
Once a company’s marginal ROIC hits its cost of capital, we calculate a continuing value, using a standard per-petuity formula. At perpetuity, we assume that any growth or decline or investment in the business neither creates nor destroys value and that any new investment provides a return in line with estimated WACC.
Because a dollar earned today is worth more than a dollar earned tomorrow, we discount our projections of cash flows in stages I, II, and III to arrive at a total present value of expected future cash flows. Because we are modeling free cash flow to the firm—representing cash available to provide a return to all capital providers—we discount future cash flows using the WACC, which is a weighted average of the costs of equity, debt, and pre-ferred stock (and any other funding sources), using ex-pected future proportionate long-term, market-value weights.
3. Uncertainty Around That Fair Value Estimate
Morningstar's Uncertainty Rating captures a range of likely potential intrinsic values for a company and uses it to assign the margin of safety required before investing, which in turn explicitly drives our stock star rating system. The Uncertainty Rating represents the analysts' ability to
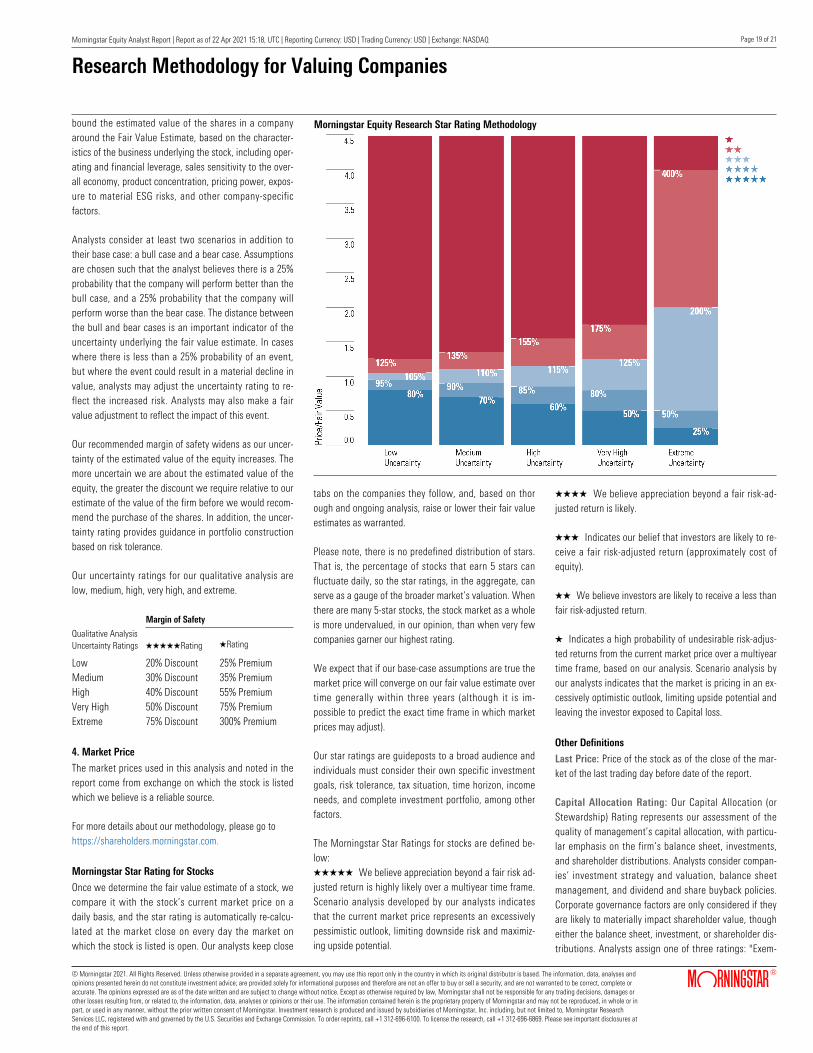
Morningstar Equity Analyst Report | Report as of 22 Apr 2021 15:18, UTC | Reporting Currency: USD | Trading Currency: USD | Exchange: NASDAQ Page 19 of 21
© Morningstar 2021. All Rights Reserved. Unless otherwise provided in a separate agreement, you may use this report only in the country in which its original distributor is based. The information, data, analyses and opinions presented herein do not constitute investment advice; are provided solely for informational purposes and therefore are not an offer to buy or sell a security; and are not warranted to be correct, complete or accurate. The opinions expressed are as of the date written and are subject to change without notice. Except as otherwise required by law, Morningstar shall not be responsible for any trading decisions, damages or other losses resulting from, or related to, the information, data, analyses or opinions or their use. The information contained herein is the proprietary property of Morningstar and may not be reproduced, in whole or in part, or used in any manner, without the prior written consent of Morningstar. Investment research is produced and issued by subsidiaries of Morningstar, Inc. including, but not limited to, Morningstar Research Services LLC, registered with and governed by the U.S. Securities and Exchange Commission. To order reprints, call +1 312-696-6100. To license the research, call +1 312-696-6869. Please see important disclosures at the end of this report.
ß®
Research Methodology for Valuing Companies
Morningstar Equity Research Star Rating Methodologybound the estimated value of the shares in a company around the Fair Value Estimate, based on the character-istics of the business underlying the stock, including oper-ating and financial leverage, sales sensitivity to the over-all economy, product concentration, pricing power, expos-ure to material ESG risks, and other company-specific factors.
Analysts consider at least two scenarios in addition to their base case: a bull case and a bear case. Assumptions are chosen such that the analyst believes there is a 25% probability that the company will perform better than the bull case, and a 25% probability that the company will perform worse than the bear case. The distance between the bull and bear cases is an important indicator of the uncertainty underlying the fair value estimate. In cases where there is less than a 25% probability of an event, but where the event could result in a material decline in value, analysts may adjust the uncertainty rating to re-flect the increased risk. Analysts may also make a fair value adjustment to reflect the impact of this event.
Our recommended margin of safety widens as our uncer-tainty of the estimated value of the equity increases. The more uncertain we are about the estimated value of the equity, the greater the discount we require relative to our estimate of the value of the firm before we would recom-mend the purchase of the shares. In addition, the uncer-tainty rating provides guidance in portfolio construction based on risk tolerance.
Our uncertainty ratings for our qualitative analysis are low, medium, high, very high, and extreme.
Margin of Safety
Qualitative Analysis Uncertainty Ratings QQQQQRating QRating
Low 20% Discount 25% PremiumMedium 30% Discount 35% PremiumHigh 40% Discount 55% PremiumVery High 50% Discount 75% PremiumExtreme 75% Discount 300% Premium
4. Market Price
The market prices used in this analysis and noted in the report come from exchange on which the stock is listed which we believe is a reliable source.
For more details about our methodology, please go to https://shareholders.morningstar.com.
Morningstar Star Rating for Stocks
Once we determine the fair value estimate of a stock, we compare it with the stock’s current market price on a daily basis, and the star rating is automatically re-calcu-lated at the market close on every day the market on which the stock is listed is open. Our analysts keep close
tabs on the companies they follow, and, based on thorough and ongoing analysis, raise or lower their fair value estimates as warranted.
Please note, there is no predefined distribution of stars. That is, the percentage of stocks that earn 5 stars can fluctuate daily, so the star ratings, in the aggregate, can serve as a gauge of the broader market’s valuation. When there are many 5-star stocks, the stock market as a whole is more undervalued, in our opinion, than when very few companies garner our highest rating.
We expect that if our base-case assumptions are true the market price will converge on our fair value estimate over time generally within three years (although it is im-possible to predict the exact time frame in which market prices may adjust).
Our star ratings are guideposts to a broad audience and individuals must consider their own specific investment goals, risk tolerance, tax situation, time horizon, income needs, and complete investment portfolio, among other factors.
The Morningstar Star Ratings for stocks are defined be-low:QQQQQ We believe appreciation beyond a fair risk ad-justed return is highly likely over a multiyear time frame. Scenario analysis developed by our analysts indicates that the current market price represents an excessively pessimistic outlook, limiting downside risk and maximiz-ing upside potential.
QQQQ We believe appreciation beyond a fair risk-ad-justed return is likely.
QQQ Indicates our belief that investors are likely to re-ceive a fair risk-adjusted return (approximately cost of equity).
QQ We believe investors are likely to receive a less than fair risk-adjusted return.
Q Indicates a high probability of undesirable risk-adjus-ted returns from the current market price over a multiyear time frame, based on our analysis. Scenario analysis by our analysts indicates that the market is pricing in an ex-cessively optimistic outlook, limiting upside potential and leaving the investor exposed to Capital loss.
Other Definitions
Last Price: Price of the stock as of the close of the mar-ket of the last trading day before date of the report.
Capital Allocation Rating: Our Capital Allocation (or Stewardship) Rating represents our assessment of the quality of management’s capital allocation, with particu-lar emphasis on the firm’s balance sheet, investments, and shareholder distributions. Analysts consider compan-ies’ investment strategy and valuation, balance sheet management, and dividend and share buyback policies. Corporate governance factors are only considered if they are likely to materially impact shareholder value, though either the balance sheet, investment, or shareholder dis-tributions. Analysts assign one of three ratings: "Exem-

Morningstar Equity Analyst Report | Report as of 22 Apr 2021 15:18, UTC | Reporting Currency: USD | Trading Currency: USD | Exchange: NASDAQ Page 20 of 21
© Morningstar 2021. All Rights Reserved. Unless otherwise provided in a separate agreement, you may use this report only in the country in which its original distributor is based. The information, data, analyses and opinions presented herein do not constitute investment advice; are provided solely for informational purposes and therefore are not an offer to buy or sell a security; and are not warranted to be correct, complete or accurate. The opinions expressed are as of the date written and are subject to change without notice. Except as otherwise required by law, Morningstar shall not be responsible for any trading decisions, damages or other losses resulting from, or related to, the information, data, analyses or opinions or their use. The information contained herein is the proprietary property of Morningstar and may not be reproduced, in whole or in part, or used in any manner, without the prior written consent of Morningstar. Investment research is produced and issued by subsidiaries of Morningstar, Inc. including, but not limited to, Morningstar Research Services LLC, registered with and governed by the U.S. Securities and Exchange Commission. To order reprints, call +1 312-696-6100. To license the research, call +1 312-696-6869. Please see important disclosures at the end of this report.
ß®
Research Methodology for Valuing Companies
plary", "Standard", or "Poor". Analysts judge Capital Alloc-ation from an equity holder’s perspective. Ratings are de-termined on a forward looking and absolute basis. The Standard rating is most common as most managers will exhibit neither exceptionally strong nor poor capital alloc-ation.
Capital Allocation (or Stewardship) analysis published pri-or to Dec. 9, 2020, was determined using a different pro-cess. Beyond investment strategy, financial leverage, and dividend and share buyback policies, analysts also con-sidered execution, compensation, related party transac-tions, and accounting practices in the rating.
Risk Warning
Please note that investments in securities are subject to market and other risks and there is no assurance or guar-antee that the intended investment objectives will be achieved. Past performance of a security may or may not be sustained in future and is no indication of future per-formance. A security investment return and an investor’s principal value will fluctuate so that, when redeemed, an investor’s shares may be worth more or less than their original cost. A security’s current investment performance may be lower or higher than the investment performance noted within the report. Morningstar’s Uncertainty Rating serves as a useful data point with respect to sensitivity analysis of the assumptions used in our determining a fair value price.
General Disclosure
Unless otherwise provided in a separate agreement, re-cipients accessing this report may only use it in the coun-try in which the Morningstar distributor is based. Unless stated otherwise, the original distributor of the report is Morningstar Research Services LLC, a U.S.A. domiciled financial institution.
This report is for informational purposes only and has no regard to the specific investment objectives, financial situation or particular needs of any specific recipient. This publication is intended to provide information to assist in-stitutional investors in making their own investment de-cisions, not to provide investment advice to any specific investor. Therefore, investments discussed and recom-mendations made herein may not be suitable for all in-vestors: recipients must exercise their own independent judgment as to the suitability of such investments and re-commendations in the light of their own investment ob-jectives, experience, taxation status and financial posi-tion.
The information, data, analyses and opinions presented herein are not warranted to be accurate, correct, com-plete or timely. Unless otherwise provided in a separate agreement, neither Morningstar, Inc. or the Equity Re-
search Group represents that the report contents meet all of the presentation and/or disclosure standards applic-able in the jurisdiction the recipient is located.
Except as otherwise required by law or provided for in a separate agreement, the analyst, Morningstar, Inc. and the Equity Research Group and their officers, directors and employees shall not be responsible or liable for any trading decisions, damages or other losses resulting from, or related to, the information, data, analyses or opinions within the report. The Equity Research Group encourages recipients recipients of this report to read all relevant is-sue documents (e.g., prospectus) pertaining to the secur-ity concerned, including without limitation, information relevant to its investment objectives, risks, and costs be-fore making an in vestment decision and when deemed necessary, to seek the advice of a legal, tax, and/or ac-counting professional.
The Report and its contents are not directed to, or inten-ded for distribution to or use by, any person or entity who is a citizen or resident of or located in any locality, state, country or other jurisdiction where such distribution, pub-lication, availability or use would be contrary to law or regulation or which would subject Morningstar, Inc. or its affiliates to any registration or licensing requirements in such jurisdiction.
Where this report is made available in a language other than English and in the case of inconsistencies between the English and translated versions of the report, the Eng-lish version will control and supersede any ambiguities associated with any part or section of a report that has been issued in a foreign language. Neither the analyst, Morningstar, Inc., or the Equity Research Group guaran-tees the accuracy of the translations.
This report may be distributed in certain localities, coun-tries and/or jurisdictions (“Territories”) by independent third parties or independent intermediaries and/or distrib-utors (“Distributors”). Such Distributors are not acting as agents or representatives of the analyst, Morningstar, Inc. or the Equity Research Group. In Territories where a Distributor distributes our report, the Distributor is solely responsible for complying with all applicable regulations, laws, rules, circulars, codes and guidelines established by local and/or regional regulatory bodies, including laws in connection with the distribution third-party research re-ports.
Conflicts of Interestu No interests are held by the analyst with respect to the
security subject of this investment research report.Morningstar, Inc. may hold a long position in the se-curity subject of this investment research report that exceeds 0.5% of the total issued share capital of the security. To determine if such is the case, please click
u
http://msi.morningstar.com and http://mdi.morningstar.com.
u Analysts’ compensation is derived from Morningstar, Inc.’s overall earnings and consists of salary, bonus and in some cases restricted stock.
u Neither Morningstar, Inc. or the Equity Research Group receives commissions for providing research nor do they charge companies to be rated.
u Neither Morningstar, Inc. or the Equity Research Group is a market maker or a liquidity provider of the security noted within this report.
u Neither Morningstar, Inc. or the Equity Research Group has been a lead manager or co-lead manager over the previous 12-months of any publicly disclosed offer of financial instruments of the issuer.
u Morningstar, Inc.’s investment management group does have arrangements with financial institutions to provide portfolio management/investment advice some of which an analyst may issue investment research re-ports on. However, analysts do not have authority over Morningstar’s investment management group’s busi-ness arrangements nor allow employees from the in-vestment management group to participate or influ-ence the analysis or opinion prepared by them.
u Morningstar, Inc. is a publicly traded company (Ticker Symbol: MORN) and thus a financial institution the se-curity of which is the subject of this report may own more than 5% of Morningstar, Inc.’s total outstanding shares. Please access Morningstar, Inc.’s proxy state-ment, “Security Ownership of Certain Beneficial Own-ers and Management” section http://investorrelations. morningstar.com/sec.cfm?doctype=Proxy&year=&x=12.
u Morningstar, Inc. may provide the product issuer or its related entities with services or products for a fee and on an arms’ length basis including software products and licenses, research and consulting services, data services, licenses to republish our ratings and research in their promotional material, event sponsorship and website advertising.
Further information on Morningstar, Inc.’s conflict of in-t e r e s t p o l i c i e s i s a v a i l a b l e f r o m h t t p s : / /shareholders.morningstar.com. Also, please note analysts are subject to the CFA Institute’s Code of Ethics and Standards of Professional Conduct.
For a list of securities which the Equity Research Group currently covers and provides written analysis on please contact your local Morningstar office. In addition, for his-torical analysis of securities covered, including their fair value estimate, please contact your local office.
For Recipients in Australia: This Report has been issued and distributed in Australia by Morningstar Australasia Pty Ltd (ABN: 95 090 665 544; ASFL: 240892). Morning-star Australasia Pty Ltd is the provider of the general ad-vice (‘the Service’) and takes responsibility for the produc-

Morningstar Equity Analyst Report | Report as of 22 Apr 2021 15:18, UTC | Reporting Currency: USD | Trading Currency: USD | Exchange: NASDAQ Page 21 of 21
© Morningstar 2021. All Rights Reserved. Unless otherwise provided in a separate agreement, you may use this report only in the country in which its original distributor is based. The information, data, analyses and opinions presented herein do not constitute investment advice; are provided solely for informational purposes and therefore are not an offer to buy or sell a security; and are not warranted to be correct, complete or accurate. The opinions expressed are as of the date written and are subject to change without notice. Except as otherwise required by law, Morningstar shall not be responsible for any trading decisions, damages or other losses resulting from, or related to, the information, data, analyses or opinions or their use. The information contained herein is the proprietary property of Morningstar and may not be reproduced, in whole or in part, or used in any manner, without the prior written consent of Morningstar. Investment research is produced and issued by subsidiaries of Morningstar, Inc. including, but not limited to, Morningstar Research Services LLC, registered with and governed by the U.S. Securities and Exchange Commission. To order reprints, call +1 312-696-6100. To license the research, call +1 312-696-6869. Please see important disclosures at the end of this report.
ß®
Research Methodology for Valuing Companies
tion of this report. The Service is provided through the re-search of investment products.
To the extent the Report contains general advice it has been prepared without reference to an investor’s object-ives, financial situation or needs. Investors should con-sider the advice in light of these matters and, if applic-able, the relevant Product Disclosure Statement before making any decision to invest. Refer to our Financial Ser-vices Guide (FSG) for more information at http://www.morningstar.com.au/fsg.pdf.
For Recipients in Hong Kong: The Report is distributed by Morningstar Investment Management Asia Limited, which is regulated by the Hong Kong Securities and Fu-tures Commission to provide services to professional in-vestors only. Neither Morningstar Investment Manage-ment Asia Limited, nor its representatives, are acting or will be deemed to be acting as an investment profession-al to any recipients of this information unless expressly agreed to by Morningstar Investment Management Asia Limited. For enquiries regarding this research, please con-tact a Morningstar Investment Management Asia Limited Licensed Representative at https://shareholders.morning-star.com.
For recipients in India: This Investment Research is is-sued by Morningstar Investment Adviser India Private Limited. Morningstar Investment Adviser India Private Limited is registered with the Securities and Exchange Board of India (Registration number INA000001357) and provides investment advice and research. Morningstar In-vestment Adviser India Private Limited has not been the subject of any disciplinary action by SEBI or any other leg-al/regulatory body. Morningstar Investment Adviser India Private Limited is a wholly owned subsidiary of Morning-star Investment Management LLC. In India, Morningstar Investment Adviser India Private Limited has one asso-ciate, Morningstar India Private Limited, which provides data related services, financial data analysis and software development. The Research Analyst has not served as an officer, director or employee of the fund company within the last 12 months, nor has it or its associates engaged in market making activity for the fund company.
*The Conflicts of Interest disclosure above also applies to relatives and associates of Manager Research Analysts in India # The Conflicts of Interest disclosure above also ap-plies to associates of Manager Research Analysts in In-dia. The terms and conditions on which Morningstar In-vestment Adviser India Private Limited offers Investment Research to clients, varies from client to client, and are detailed in the respective client agreement.
For recipients in Japan: The Report is distributed by Ib-botson Associates Japan, Inc., which is regulated by Fin-ancial Services Agency. Neither Ibbotson Associates Ja-pan, Inc., nor its representatives, are acting or will be
deemed to be acting as an investment professional to any recipients of this information.
For recipients in Singapore: For Institutional Investor audiences only. Recipients of this report should contact their financial professional in Singapore in relation to this report. Morningstar, Inc., and its affiliates, relies on cer-tain exemptions (Financial Advisers Regulations, Section 32B and 32C) to provide its investment research to recipi-ents in Singapore.