analyst gt operator's manual -...
TRANSCRIPT

Analyst® GT Multimode Reader
Operator’s Manual
PN 0112-0091 – Rev. C

ii Analyst GT Operator's Manual – Rev. C
Revision History:
Date Revision Version Description
09/02 B 1.1 Initial release
09/03 C 1.2 Text changes
©2003 Molecular Devices Corporation. All rights reserved.
Printed in the United States of America.
Reproduction of this document without prior written approval is prohibited.
Analyst is a registered trademark, and HEFP and SmartOptics are trademarks of Molecular Devices Corporation.
Analyst GT and use thereof is covered by issued (US patent nos. 6,033,100; 6,071,748; 6,097,025; 6,159,425; 6,187,267; 6,297,018; 6,313,471; 6,313,960; 6,326,605) and pending patents.
Microsoft and Windows are registered trademarks of Microsoft Corporation. SYTO 9 is a registered trademark of Molecular Probes, Inc.
The Analyst GT Multimode Reader is intended for research use only.
The design and specifications of the Analyst GT System are subject to change without warning.
Corporate Headquarters Molecular Devices Corporation 1311 Orleans Drive Sunnyvale, CA 94089 USA Tel: 408.747.1700
Sales Offices USA 800.635.5577 UK +44.118.944.8000 Germany +49.89.9620.2340 Japan +81.797.32.2877
Online Assistance Visit Molecular Devices at www.moleculardevices.com. Email: [email protected] for general inquiries and product information.

Analyst GT Operator's Manual – Rev. C iii
Contents
1 System Description. . . . . . . . . . . . . . . . . . . . . . . . . . . . . . . . . . . . . . . . . . . . . . . . . 1 1.1 Introduction . . . . . . . . . . . . . . . . . . . . . . . . . . . . . . . . . . . . . . . . . . . . . . . . . . . . . . . . 2 1.2 What’s New in the Analyst GT Multimode Reader . . . . . . . . . . . . . . . . . . . . . . . . . . . . 4 1.3 How to Use this Manual . . . . . . . . . . . . . . . . . . . . . . . . . . . . . . . . . . . . . . . . . . . . . . . 5 1.4 Safety Information . . . . . . . . . . . . . . . . . . . . . . . . . . . . . . . . . . . . . . . . . . . . . . . . . . . 5
.. Conventions Used in this Manual . . . . . . . . . . . . . . . . . . . . . . . . . . . . . . . . . . 5
.. Instrument Safety . . . . . . . . . . . . . . . . . . . . . . . . . . . . . . . . . . . . . . . . . . . . . . 6
1.5 Reader Components . . . . . . . . . . . . . . . . . . . . . . . . . . . . . . . . . . . . . . . . . . . . . . . . . . 7 .. Control Panel . . . . . . . . . . . . . . . . . . . . . . . . . . . . . . . . . . . . . . . . . . . . . . . . . 8
.. Microplate Gripper . . . . . . . . . . . . . . . . . . . . . . . . . . . . . . . . . . . . . . . . . . . . . 9
.. Bidirectional Microplate Stacker. . . . . . . . . . . . . . . . . . . . . . . . . . . . . . . . . . . . 9
.. Optical Components . . . . . . . . . . . . . . . . . . . . . . . . . . . . . . . . . . . . . . . . . . . 11
.. Input/Output Panel. . . . . . . . . . . . . . . . . . . . . . . . . . . . . . . . . . . . . . . . . . . . 12
.. AnalystHost Application and Instrument Control Program . . . . . . . . . . . . . . . 13
.. Accessory Kit. . . . . . . . . . . . . . . . . . . . . . . . . . . . . . . . . . . . . . . . . . . . . . . . . 13
1.6 Automation . . . . . . . . . . . . . . . . . . . . . . . . . . . . . . . . . . . . . . . . . . . . . . . . . . . . . . . . 14 1.7 Overview of Operation . . . . . . . . . . . . . . . . . . . . . . . . . . . . . . . . . . . . . . . . . . . . . . . . 14
.. Procedures Performed with the Reader . . . . . . . . . . . . . . . . . . . . . . . . . . . . . . 14
.. Routine Workflow. . . . . . . . . . . . . . . . . . . . . . . . . . . . . . . . . . . . . . . . . . . . . 15
.. User Accounts . . . . . . . . . . . . . . . . . . . . . . . . . . . . . . . . . . . . . . . . . . . . . . . . 16
1.8 Theory of Operation . . . . . . . . . . . . . . . . . . . . . . . . . . . . . . . . . . . . . . . . . . . . . . . . . . 17 .. Optical System . . . . . . . . . . . . . . . . . . . . . . . . . . . . . . . . . . . . . . . . . . . . . . . 17
.. Measurement Modes (F, FP, TRF, L, A). . . . . . . . . . . . . . . . . . . . . . . . . . . . . 19
.. Definitions of Counting Units . . . . . . . . . . . . . . . . . . . . . . . . . . . . . . . . . . . . 27
.. Background Subtraction . . . . . . . . . . . . . . . . . . . . . . . . . . . . . . . . . . . . . . . . 27
.. Dynamic Z . . . . . . . . . . . . . . . . . . . . . . . . . . . . . . . . . . . . . . . . . . . . . . . . . . 31
2 Operating Procedures . . . . . . . . . . . . . . . . . . . . . . . . . . . . . . . . . . . . . . . . . . . . . . 35 2.1 Starting Up the System . . . . . . . . . . . . . . . . . . . . . . . . . . . . . . . . . . . . . . . . . . . . . . . 36
.. Startup Procedure . . . . . . . . . . . . . . . . . . . . . . . . . . . . . . . . . . . . . . . . . . . . . 36
.. Run Screen . . . . . . . . . . . . . . . . . . . . . . . . . . . . . . . . . . . . . . . . . . . . . . . . . . 37
.. Importing and Exporting User Settings. . . . . . . . . . . . . . . . . . . . . . . . . . . . . . 41

Contents
iv Analyst GT Operator's Manual – Rev. C
2.2 Setting Up the System . . . . . . . . . . . . . . . . . . . . . . . . . . . . . . . . . . . . . . . . . . . . . . . . 42 .. Configuring AutoSave . . . . . . . . . . . . . . . . . . . . . . . . . . . . . . . . . . . . . . . . . . 42
.. Setting Up the Barcode Reader. . . . . . . . . . . . . . . . . . . . . . . . . . . . . . . . . . . . 42
.. Selecting the Report Format. . . . . . . . . . . . . . . . . . . . . . . . . . . . . . . . . . . . . . 43
.. Entering Names for Filters and Dichroic Mirrors . . . . . . . . . . . . . . . . . . . . . . 46
.. Setting the Instrument Date and Time . . . . . . . . . . . . . . . . . . . . . . . . . . . . . . 47
.. Selecting the Number Format . . . . . . . . . . . . . . . . . . . . . . . . . . . . . . . . . . . . 47
.. Modifying the Colorbar . . . . . . . . . . . . . . . . . . . . . . . . . . . . . . . . . . . . . . . . . 48
.. Specifying the Instrument Serial Number . . . . . . . . . . . . . . . . . . . . . . . . . . . . 48
2.3 Lamp and Plate Status . . . . . . . . . . . . . . . . . . . . . . . . . . . . . . . . . . . . . . . . . . . . . . . . 49 .. Configuring the Continuous Lamp Settings . . . . . . . . . . . . . . . . . . . . . . . . . . 49
.. Monitoring Plate Status . . . . . . . . . . . . . . . . . . . . . . . . . . . . . . . . . . . . . . . . . 50
2.4 Defining Microplates . . . . . . . . . . . . . . . . . . . . . . . . . . . . . . . . . . . . . . . . . . . . . . . . . 51 .. Defining a New Microplate Format . . . . . . . . . . . . . . . . . . . . . . . . . . . . . . . . 51
.. Modifying a Microplate Format . . . . . . . . . . . . . . . . . . . . . . . . . . . . . . . . . . . 52
.. Deleting a Microplate Format . . . . . . . . . . . . . . . . . . . . . . . . . . . . . . . . . . . . 53
.. Choosing Microplate Formats to Display . . . . . . . . . . . . . . . . . . . . . . . . . . . . 53
2.5 Defining Detection Methods . . . . . . . . . . . . . . . . . . . . . . . . . . . . . . . . . . . . . . . . . . . . 54 .. Overview of Detection Method Parameters . . . . . . . . . . . . . . . . . . . . . . . . . . . 55
.. Defining a New Detection Method . . . . . . . . . . . . . . . . . . . . . . . . . . . . . . . . 59
.. Modifying a Detection Method . . . . . . . . . . . . . . . . . . . . . . . . . . . . . . . . . . . 59
.. Deleting a Detection Method. . . . . . . . . . . . . . . . . . . . . . . . . . . . . . . . . . . . . 59
.. Defining a Fluorescence Intensity Method . . . . . . . . . . . . . . . . . . . . . . . . . . . 60
.. Defining a Fluorescence Polarization Method . . . . . . . . . . . . . . . . . . . . . . . . . 61
.. Defining a Time-Resolved Fluorescence Method. . . . . . . . . . . . . . . . . . . . . . . 62
.. Defining a Luminescence Method . . . . . . . . . . . . . . . . . . . . . . . . . . . . . . . . . 63
.. Defining an Absorbance Method . . . . . . . . . . . . . . . . . . . . . . . . . . . . . . . . . . 64
.. Defining Multi-Methods . . . . . . . . . . . . . . . . . . . . . . . . . . . . . . . . . . . . . . . . 66
.. Selecting Wells for All Detection Methods . . . . . . . . . . . . . . . . . . . . . . . . . . . 68
2.6 Defining Protocols . . . . . . . . . . . . . . . . . . . . . . . . . . . . . . . . . . . . . . . . . . . . . . . . . . . 70 .. Defining a New Protocol . . . . . . . . . . . . . . . . . . . . . . . . . . . . . . . . . . . . . . . . 70
.. Batch Timing . . . . . . . . . . . . . . . . . . . . . . . . . . . . . . . . . . . . . . . . . . . . . . . . 75
.. Incubation Periods . . . . . . . . . . . . . . . . . . . . . . . . . . . . . . . . . . . . . . . . . . . . 75
.. Using the Protocol View Screen . . . . . . . . . . . . . . . . . . . . . . . . . . . . . . . . . . . 76
2.7 Running an Assay . . . . . . . . . . . . . . . . . . . . . . . . . . . . . . . . . . . . . . . . . . . . . . . . . . . 77 .. Starting a Run . . . . . . . . . . . . . . . . . . . . . . . . . . . . . . . . . . . . . . . . . . . . . . . . 77

Contents
Analyst GT Operator's Manual – Rev. C v
.. Reviewing Results . . . . . . . . . . . . . . . . . . . . . . . . . . . . . . . . . . . . . . . . . . . . . 79
.. Saving Results Files . . . . . . . . . . . . . . . . . . . . . . . . . . . . . . . . . . . . . . . . . . . . 81
3 Performance Verification . . . . . . . . . . . . . . . . . . . . . . . . . . . . . . . . . . . . . . . . . . . 83 3.1 Verifying Detector Performance . . . . . . . . . . . . . . . . . . . . . . . . . . . . . . . . . . . . . . . . . 83
.. Method for Fluorescence Intensity Verification . . . . . . . . . . . . . . . . . . . . . . . . 84
.. Method for Fluorescence Polarization Verification. . . . . . . . . . . . . . . . . . . . . . 86
.. Method for TRF Verification . . . . . . . . . . . . . . . . . . . . . . . . . . . . . . . . . . . . . 87
3.2 Verifying Plate Formats . . . . . . . . . . . . . . . . . . . . . . . . . . . . . . . . . . . . . . . . . . . . . . . 89
4 Maintenance Procedures . . . . . . . . . . . . . . . . . . . . . . . . . . . . . . . . . . . . . . . . . . . 91 4.1 Preventive Maintenance . . . . . . . . . . . . . . . . . . . . . . . . . . . . . . . . . . . . . . . . . . . . . . . 92 4.2 Cleaning the Instrument . . . . . . . . . . . . . . . . . . . . . . . . . . . . . . . . . . . . . . . . . . . . . . . 92 4.3 Panel Removal and Replacement . . . . . . . . . . . . . . . . . . . . . . . . . . . . . . . . . . . . . . . . 93 4.4 Filter Removal and Replacement . . . . . . . . . . . . . . . . . . . . . . . . . . . . . . . . . . . . . . . . . 95
.. Filter Wheel Removal and Replacement . . . . . . . . . . . . . . . . . . . . . . . . . . . . . 95
.. Filter Cartridge Removal and Replacement . . . . . . . . . . . . . . . . . . . . . . . . . . . 96
.. Installing Filters in Cartridges . . . . . . . . . . . . . . . . . . . . . . . . . . . . . . . . . . . . 97
4.5 Dichroic Mirror Removal and Replacement . . . . . . . . . . . . . . . . . . . . . . . . . . . . . . . . . 99 4.6 Continuous Lamp Removal and Replacement . . . . . . . . . . . . . . . . . . . . . . . . . . . . . . 101 4.7 Flash Lamp Removal and Replacement . . . . . . . . . . . . . . . . . . . . . . . . . . . . . . . . . . . 102 4.8 Setting the Luminescence Aperture . . . . . . . . . . . . . . . . . . . . . . . . . . . . . . . . . . . . . 104
5 Troubleshooting . . . . . . . . . . . . . . . . . . . . . . . . . . . . . . . . . . . . . . . . . . . . . . . . . . . 105 5.1 Operation and Error Codes . . . . . . . . . . . . . . . . . . . . . . . . . . . . . . . . . . . . . . . . . . . . 105 5.2 Service Conditions . . . . . . . . . . . . . . . . . . . . . . . . . . . . . . . . . . . . . . . . . . . . . . . . . . 105 5.3 Fault Conditions. . . . . . . . . . . . . . . . . . . . . . . . . . . . . . . . . . . . . . . . . . . . . . . . . . . . 105 5.4 Troubleshooting Guide. . . . . . . . . . . . . . . . . . . . . . . . . . . . . . . . . . . . . . . . . . . . . . . 106
.. Data Problems . . . . . . . . . . . . . . . . . . . . . . . . . . . . . . . . . . . . . . . . . . . . . . 106
.. Software Observations . . . . . . . . . . . . . . . . . . . . . . . . . . . . . . . . . . . . . . . . . 112
.. Hardware Observations . . . . . . . . . . . . . . . . . . . . . . . . . . . . . . . . . . . . . . . . 114
6 Appendices . . . . . . . . . . . . . . . . . . . . . . . . . . . . . . . . . . . . . . . . . . . . . . . . . . . . . . . . 115 6.1 Relocating the System . . . . . . . . . . . . . . . . . . . . . . . . . . . . . . . . . . . . . . . . . . . . . . . 115
.. Moving the Reader Within the Lab . . . . . . . . . . . . . . . . . . . . . . . . . . . . . . . 115
.. Changing the Control Panel Position . . . . . . . . . . . . . . . . . . . . . . . . . . . . . . 116
.. Shipping the Instrument . . . . . . . . . . . . . . . . . . . . . . . . . . . . . . . . . . . . . . . 116

Contents
vi Analyst GT Operator's Manual – Rev. C
6.2 Detection Method Parameter Cross-Reference . . . . . . . . . . . . . . . . . . . . . . . . . . . . . . 117 6.3 Technical Specifications . . . . . . . . . . . . . . . . . . . . . . . . . . . . . . . . . . . . . . . . . . . . . . 123 6.4 Spare Parts . . . . . . . . . . . . . . . . . . . . . . . . . . . . . . . . . . . . . . . . . . . . . . . . . . . . . . . 125 6.5 Selecting Filters and Dichroic Mirrors . . . . . . . . . . . . . . . . . . . . . . . . . . . . . . . . . . . . 126
.. Filters . . . . . . . . . . . . . . . . . . . . . . . . . . . . . . . . . . . . . . . . . . . . . . . . . . . . . 126
.. Dichroic Mirrors . . . . . . . . . . . . . . . . . . . . . . . . . . . . . . . . . . . . . . . . . . . . . 127
6.6 Warranty Statement. . . . . . . . . . . . . . . . . . . . . . . . . . . . . . . . . . . . . . . . . . . . . . . . . 128 6.7 Index . . . . . . . . . . . . . . . . . . . . . . . . . . . . . . . . . . . . . . . . . . . . . . . . . . . . . . . . . . . . 129

Analyst GT Operator's Manual – Rev. C 1
1 System Description
Part of this manual provides background information on the system, the principal components, and how the system functions. Part contains the following sections:
• .: Introduction
• .: What’s New in the Analyst GT Multimode Reader
• .: How to Use this Manual
• .: Safety Information
• .: Reader Components
• .: Automation
• 1.7: Overview of Operation
• .: Theory of Operation
FAULT
Analyst GTMULTIMODE READER
SERVICE
POWER
Start Reset LampLoad/Eject
FAULT
Analyst GTMULTIMODE READER
SERVICE
POWER
Start Reset LampLoad/Eject
Without Stacker With Stacker
Analyst® GT Multimode Reader

1 System Description
2 Analyst GT Operator's Manual – Rev. C
1.1 Introduction
The Analyst® GT Multimode Reader is designed for use in high-throughput screening laboratories. The system can read -, -, and -well microplate formats in five detection modes:
• Fluorescence Intensity (F) • Fluorescence Polarization (FP) • Time-Resolved Fluorescence (TRF) • Luminescence (L) • Absorbance (A)
In addition, Multi-Method assay detection allows two readings at each well using any two measurement modes that utilize the same lamp.
As an option, the reader may include a microplate stacker that accepts magazines of or microplates for automatic processing. Alternatively, an individual microplate can be placed by the operator or a robot into the microplate gripper. As the plate moves into the instrument, the gripper mechanism precisely positions it to ensure accurate alignment relative to the optical heads.
The instrument connects via an Ethernet link using the TCP/IP protocol to a host computer running the Windows® operating system. Control is on a master/slave basis – the instrument relies on the host computer for instructions and communicates status information and results back to the host. If desired, you can transfer instrument data to a separate computer or laboratory information system via a network connection.
The host computer is a Pentium-class computer running the AnalystHost™ application software. The software enables you to specify the detection mode, plate format, filters, maximum integration time, desired precision, and other parameters. The operator can start and stop plate reading from the AnalystHost software or the instrument control panel.
The instrument uses an Ethernet port on the side panel for both host commands and transmitting results.
Instrument Host PCEthernet Link
Single Interface to Host Computer

1.1 Introduction
Analyst GT Operator's Manual – Rev. C 3
By means of a network connection, a second computer can be used for data collection. Data management can be automated by transferring results to a spreadsheet or database application. Alternatively, data can be exported for analysis into SoftMax® Pro (available from Molecular Devices).
Host PC
Data CollectionComputer
Ethernet Link
NetworkInstrument
Dual Interface to Host and Data Collection Computers

1 System Description
4 Analyst GT Operator's Manual – Rev. C
1.2 What’s New in the Analyst GT Multimode Reader
The AnalystHost . software includes several changes from CriterionHost release .. In addition, there are several hardware changes to the Analyst GT Multimode Reader.
Software
• An expanded Methods menu contains submenus for working with detection and protocol parameters.
• Multi-method allows the reading of two FP methods in each well.
• There is no limit to the number of methods that can be defined using the protocol sequencer.
• There are now expanded select-wells capabilities in detection methods – up to eight sample areas and eight background areas and the ability to undo and redo selections.
• Pause button access while running protocols allows you to temporarily interrupt a protocol and then resume.
• The software can be manipulated without instrument communication. This enables users to design methods, protocols, and microplate formats at a computer remote from the Analyst instrument.
• Optimization of read settings has been simplified. The user can select the desired ‘statistical precision’ of readings, and the instrument adjusts integration time to achieve that precision.
• A report format, Terse Column, is now available.
• Individual user methods and set-up preferences are password-protected.
Instrument
• Plate reading speed is dramatically increased without loss in data quality.
• Access to filter wheels and dichroic mirrors is improved.
• The installed dichroic mirrors are detected and reported automatically in the software.
• The plate gripper is thinner, allowing the read head to be positioned very close to microplates of nonstandard height (as thin as millimeters).
• The high-speed stacker is bidirectional and has improved plate sensing, allowing automated microplate loading and reloading.
• The high-speed barcode reader has better resolution, which allows it to read dense barcode labels.
• Ethernet ports allow faster and more robust communication.

1.3 How to Use this Manual
Analyst GT Operator's Manual – Rev. C 5
1.3 How to Use this Manual
This manual describes safe and proper use of the instrument. Read this manual carefully to realize the full capabilities of the reader. Also, if something is unclear during daily use or if a problem occurs, please refer to this manual.
This manual is organized as follows:
Part 1: System Description provides background information on the reader, the principal components, and how the system functions.
Part 2: Operating Procedures provides instructions for operating the reader with a Windows-based PC running the AnalystHost application software.
Part 3: Performance Verification provides procedures for verifying the performance of the detector.
Part 4: Maintenance Procedures provides instructions for routine maintenance including replacing the lamps, filters, and dichroic mirrors.
Part 5: Troubleshooting provides instructions for diagnosing and solving common problems.
Part 6: Appendices provides instructions for moving the instrument to a new location, technical specifications, list of spare parts, index, and warranty statement.
1.4 Safety Information
When operated properly in a safe environment according to the instructions in this manual, there are no known hazards associated with the Analyst GT Multimode Reader. However, proper use requires an understanding of routine situations that are potentially dangerous and can result in serious injury.
All users should be familiar with the guidelines in this section before working with the reader.
1.4.1 Conventions Used in this Manual
This manual uses the following conventions to provide technical and safety information of special interest.
Note: Background information provided to clarify a particular step or procedure.
Caution: An instruction that, if not followed, can result in damage to the reader.
Important! An instruction provided to ensure correct results and optimal performance.
Warning! An instruction that, if not followed, can result in a hazardous condition.

1 System Description
6 Analyst GT Operator's Manual – Rev. C
1.4.2 Instrument Safety
Observe the following warnings and precautions:
Environment. Operate and store the instrument in the environment specified in section ., ‘Technical Specifications’, subsection ‘Environmental Specification’. Failure to do so may cause instrument malfunction or damage.
High internal voltages. Always turn off power switch and unplug instrument power cord before removing control panel and side or top panels.
Warning labels. The symbol shown at left appears on certain instrument component labels. The purpose of the marking is to alert you to use caution when servicing a component or the instrument. Be aware that ignoring the instructions on the label can result in a hazardous condition that can cause injury.
Xenon-arc lamp. Do not look directly at the continuous lamp or flash lamp while illuminated. The lamps emit ultraviolet radiation at levels that can injure the eye if viewed directly.
Electrical grounding. Never use a two-prong plug or extension cord to connect primary power to the reader. Use of a two-prong adapter disconnects the utility ground, creating a severe shock hazard. Always connect the reader power cord directly to a three-prong receptacle with a functional ground.
Spilled liquids. Avoid spilling liquids on the reader. Fluid spilled into internal com-ponents creates a shock hazard. Wipe up all spills immediately. Do not operate the reader if internal components have been exposed to spilled fluid. Unplug instrument if there is a fluid spill in the instrument and contact your local MDC representative.
Replacement fuses. Use replacement fuses with the required current rating and specification. Improper fuses or short-circuiting the fuse holders can cause fire or damage the instrument. For instructions on fuse replacement, see , ‘Maintenance Procedures’.
Power rating. Ensure the reader is connected to a power receptacle that provides voltage and current within the specified rating. Use of an incompatible power receptacle can create electrical shock and fire hazards.
Removing side panels. Only trained personnel should remove instrument panels. Remove watches and jewelry before removing any panels from the instrument.
Intended use. Do not use the instrument in a way other than specified in this manual. Failure to do so may cause injury or equipment damage.
Lifting and carrying. For information on moving the instrument, see ., ‘Relocating the System’.
1.5 Reader Components
Analyst GT Operator's Manual – Rev. C 7
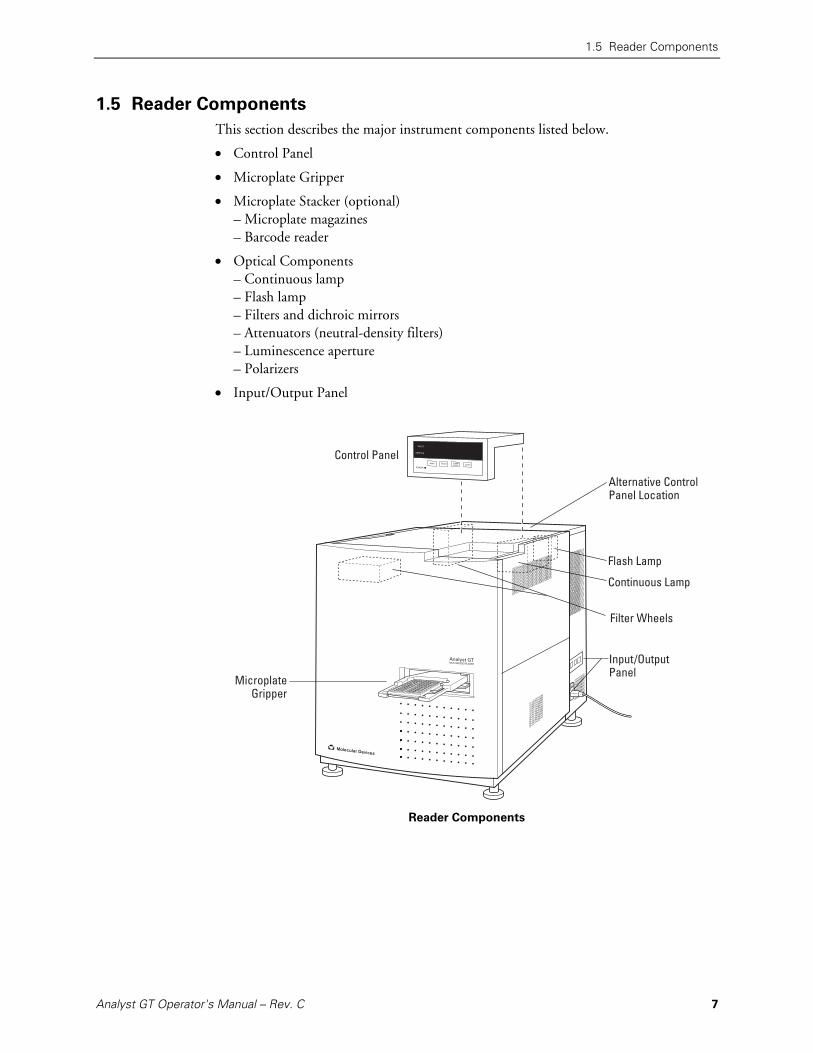
1.5 Reader Components
This section describes the major instrument components listed below.
• Control Panel
• Microplate Gripper
• Microplate Stacker (optional) – Microplate magazines – Barcode reader
• Optical Components – Continuous lamp – Flash lamp – Filters and dichroic mirrors – Attenuators (neutral-density filters) – Luminescence aperture – Polarizers
• Input/Output Panel
FAULT
Analyst GTMULTIMODE READER
SERVICE
POWER
Start Reset LampLoad/Eject
Filter Wheels
MicroplateGripper
Control Panel
Continuous Lamp
Alternative ControlPanel Location
Flash Lamp
Input/OutputPanel
Reader Components

1 System Description
8 Analyst GT Operator's Manual – Rev. C
1.5.1 Control Panel
The control panel consists of an illuminated display, keypad, indicator lights, and an audible alarm.
- Molecular Devices -
10/01/2002 15:28:57
FAULT
SERVICE
POWER
Start Reset LampLoad/Eject
Control Panel
The control panel provides a convenient means for executing certain basic functions. However, in most situations, the AnalystHost application should be used to control the instrument.
For convenience, the control panel can be mounted on the front or rear of the in-strument. For further information, see ., ‘Relocating the System’.
Display. The display provides current instrument status messages.
Keypad. The keypad below the display has four keys:
• The START key initiates a detection method or protocol using the most recent set of parameters sent to the instrument by the AnalystHost application. With plate reads, all wells will be read, even if the most recent method sent to the instrument specified a subset of wells.
• The RESET key sends all motors to their home positions, reinitializes the instrument, and turns off the audible alarm.
• The LOAD/EJECT key ejects the microplate gripper if it is currently in the instrument. If the gripper is not in the instrument, it will be pulled in.
• The LAMP key turns the continuous lamp on or off.
Indicator Lights. The three lights have the following functions:
• The POWER light comes on whenever power is supplied to the instrument.
• The FAULT light comes on whenever a critical fault has occurred that requires intervention by the operator.
• The SERVICE light comes on when a service procedure is needed – for example, when nearing the end of the life of the lamp.
Audible Alarm. The alarm sounds in the event of a fault or service condition.

1.5 Reader Components
Analyst GT Operator's Manual – Rev. C 9
1.5.2 Microplate Gripper
The plate gripper precisely positions the microplate in the instrument during detection. Precise plate positioning is essential for good performance.
1.5.3 Bidirectional Microplate Stacker
The stacker allows loading multiple microplates using magazines, or manual loading of individual plates by the operator. It includes separate input and output positions, as well as a transfer position.
FAULT
Analyst GTMULTIMODE READER
SERVICE
POWER
Start Reset LampLoad/Eject
InputOutput
Standard BarcodeReader Position
Optional BarcodeReader Position
Microplate Stacker with Magazines
Microplate Magazines
The stacker is compatible with Molecular Devices’ - and -plate magazines. A single-plate feeder is also available, allowing one plate to be placed into the stacker’s input magazine for loading and reading instead of placement directly into the gripper.

1 System Description
10 Analyst GT Operator's Manual – Rev. C
Barcode Reader
The stacker includes an integrated high-speed LED fixed-position scanner (barcode reader) that reads the identity of a labeled microplate automatically. It decodes the following symbologies:
• Code , , • NW- • Industrial of • Interleaved of • MSI • IATA • WPC (EAN-, EAN-, JAN, UPC-A, UPC-E)
Barcode labels must be positioned on the side of the plate either:
• Below last row, with a -mm space (minimum) between label and plate edge, or
• On column side with an -mm space (minimum) between label and plate edge
In the factory-installed configuration, barcodes are read on the long (bottom) edge of the microplates. If requested at the time of purchase order, the scanner can be mounted to read barcodes on the short (left) edge of the microplates. For further information regarding the barcode reader positioning, please contact technical services at Molecular Devices.
Barcodes are read as the plates move from the input position to the transfer position.
You can configure the system to either ) simply report the barcode string or ) use it to name the report file. For further information, see .., ‘Running an Assay, Saving Results Files’.
Barcode Label Specifications
Resolution (bar width) 0.13 mm (0.005 inch) minimum
Quiet Zones 6 mm minimum
Length, including Quiet Zones 70 mm maximum
Bar Height 3 mm minimum

1.5 Reader Components
Analyst GT Operator's Manual – Rev. C 11
1.5.4 Optical Components
Settings for optical components are made using the Define and Edit Methods screens (see ., ‘Defining Detection Methods’).
Lamps
The reader has two lamps:
• For F, FP, and A applications, you can specify either ) the xenon-arc lamp as a continuous light source, or ) the xenon flash lamp.
• For TRF applications, the instrument always uses the xenon flash lamp.
The lamps are user-replaceable and self-aligning for convenient installation. For information on replacing the lamps, see ., ‘Continuous Lamp Removal and Replacement’ and ., ‘Flash Lamp Removal and Replacement’.
Filters and Dichroic Mirrors
Each filter wheel can hold eight -mm (-inch) diameter filters and each optics head can hold one replaceable dichroic mirror. The reader is supplied with the following filters and dichroic mirrors preinstalled in the filter wheels and optics:
• Excitation – :- fluorescein, – are blocked.
• Emission – :- fluorescein, – are blocked.
• Dichroics – fluorescein dichroic (top), % transmittance beamsplitter (bottom).
The % beamsplitter transmits percent of incident light at all wavelengths and reflects percent of the light at all wavelengths. This property enables it to be used with the widest possible range of fluorophores, but limits the sensitivity of the instrument in some applications. When installed in the top optics, the % beamsplitter can be used for Absorbance mode readings.
To maximize sensitivity, the user can install a fluorophore-specific dichroic mirror. Dichroic mirrors are wavelength-specific and, at the specified wavelength, allow about – percent of incident light to be transmitted.
For information on selecting filters appropriate for common fluorophores, see ., ‘Selecting Filters and Dichroic Mirrors’. For information on installing filters, see ., ‘Filter Removal and Replacement’. For information on installing dichroic mirrors, see ., ‘Dichroic Mirror Removal and Replacement’.

1 System Description
12 Analyst GT Operator's Manual – Rev. C
Attenuators
Sensitivity and linear range are maximized for ‘bright’ assays by using a neutral-density filter that blocks light in the optical path of the fluorescence PMT. The attenuator can be set to one of three positions to block different amounts of light.
Mode Attenuation Factor Optical Density Out (O) 1 0 Medium (M) 100 2 High (H) 10,000 4
The luminescence attenuator can be set to either the Out or Medium position. For further information, see ., ‘Defining Detection Methods’.
Note: Attenuation factor and optical density values cited are approximate and vary with wavelength.
Polarizers
The polarizers are mounted in the top optical path. One polarizer is mounted in the excitation path, and a pair of polarizers is mounted in the emission path. The polarizers in the emission path include both an S (horizontal) and a P (vertical) polarizer. For further information, see ., ‘Defining Detection Methods’.
1.5.5 Input/Output Panel
The input/output panel includes the power switch, power entry module, and three Ethernet ports (see figure below). The instrument connects to the host computer using the Host Ethernet port and connects to the robotic control computer (if used) via the Control Ethernet port.
CONTROL 1
Power Switch
Power Entry Module
Ethernet Ports
S/N Label
CONTROL 2 HOST 1
Input/Output Panel

1.5 Reader Components
Analyst GT Operator's Manual – Rev. C 13
1.5.6 AnalystHost Application and Instrument Control Program
The AnalystHost application, which runs under Windows on the host computer, provides an easy-to-use graphical user interface (GUI) for setting up the reader, defining plates, methods, and protocols, and running an assay.
The Instrument Control Program (ICP) runs on the instrument, controlling the optical, mechanical, and electronic systems within the instrument.
TCP/IPProtocolICP
Instrument
AnalystHost
Host PC
Instrument Control Program Interface Options
The ICP communicates with the AnalystHost application using the TCP/IP protocol. The AnalystHost application converts the user’s field entries and button selections into commands that are sent to the ICP. Results from the ICP are translated into a graphical representation of the data report.
1.5.7 Accessory Kit
The Accessory Kit provides all components needed to set up the reader and get started. The kit includes:
• cable, ethernet
• cable, power
• flashlight
• fuses ( ea)
• guide, filter
• labels, filter wheel ( ea)
• manual, operator’s
• o-rings ( ea)
• rings, retention ( ea)
• screwdriver, flat blade
• screwdriver, phillips
• slug, filter
• software CD-ROM, AnalystHost v. .
Note: The contents of the accessory kit may change without notice. For an up-to-date listing, consult the packing list supplied with the reader.

1 System Description
14 Analyst GT Operator's Manual – Rev. C
1.6 Automation
Analyst GT can be integrated for operation with any of a number of robotic systems. To facilitate integration, a software package, ActiveXsuite ., is available from Molecular Devices. It provides easy-to-use application program interfaces (APIs) that allow integrators to write custom applications without worrying about underlying details and Open Protocol commands. Open Protocol, which uses ASCII commands, allows a high level of instrument control. Since changes to the instrument software can be made at any time by Molecular Devices (with a new software release, for example), Open Protocol is not officially supported, while ActiveXsuite will be validated with any future instrument software releases.
1.7 Overview of Operation
1.7.1 Procedures Performed with the Reader
In everyday operation, there are four types of procedures:
• Setting Up the Instrument • Defining Methods • Defining Protocols • Running Assays
All procedures are managed using the AnalystHost application on the host computer.
Setting Up the Instrument
Before using the reader, you must configure the system by specifying the installed filters and dichroic mirrors, types of plates to be used, and several other parameters. For further information, see:
• .: Setting Up the System • .: Lamp and Plate Status • .: Defining Microplates
Defining Methods
A method is a parameter set that specifies how an operation is to be performed.
Detection methods can be defined for each of the five optical measurement modes F, FP, TRF, L, and A. Each of the detection modes has a distinct set of parameters. For each detection mode, you can define multiple detection methods with different parameters. For further information, see ., ‘Defining Detection Methods’.
Multi-methods: Each multi-method specifies two readings using two detection methods on a per well basis (see .., ‘Defining Multi-Methods’).
Defining Protocols
A protocol is a sequence of operations, performed on a stack of plates, that can include one or both of the following steps:
• Incubate: Inserts a delay between two protocol steps (available only with Analyst GT systems that include a stacker).
• Read: Optically reads plates by one of five measurement modes.
For further information, see ., ‘Defining Protocols’.

1.7 Overview of Operation
Analyst GT Operator's Manual – Rev. C 15
Running Assays
Once methods and protocols have been defined, you can initiate running a method or a protocol from the host computer. For further information, see ., ‘Running an Assay’.
1.7.2 Routine Workflow
The following provides an overview of tasks typically performed when running a new assay with the Analyst GT Multimode Reader. The actual tasks to be performed in your laboratory may differ, depending upon the kinds of assays to be run.
Preparing a New Single-Method Assay
Setting Up the Method
1. Verify plate format to be used is predefined.
2. Define or modify detection methods as required.
Running the Assay
1. Load magazine with plates.
2. Select detection method to be run.
3. Click Start on the Run screen.
4. When reader completes measurements, review and archive data.
Preparing a New Protocol or Multi-Method Assay
Setting Up the Protocol
1. Verify plate format to be used is predefined.
2. Define or modify detection methods as required.
3. Define a protocol (incubations and reads) or Multi-method (two reads).
Running the Assay
1. Load magazine with plates.
2. Select protocol or Multi-method to be run.
3. Click Start on the Run screen.
4. When reader completes measurements, review and archive data.

1 System Description
16 Analyst GT Operator's Manual – Rev. C
1.7.3 User Accounts
The AnalystHost application takes advantage of user accounts implemented under Windows . With a user account, you can choose a password and Windows settings that will apply only to you. If you select a password, you can keep your files secure and prevent others from working with them. Files you create and save are stored in your own My Documents folder, separate from the files of others who also use the computer.
The AnalystHost application creates two types of files that you can manage from within your account:
• User setting files: A file for each user that contains the user’s setup preferences, methods, protocols, and microplate formats. For further details, see ‘User Settings’ below.
• Results files: Files with assay results in the format selected by the user. For further information, see .., ‘Selecting the Report Format’ and .., ‘Saving Results Files’.
There are two types of user accounts: administrator and limited. Administrators have full access to all files on the computer and can set up, modify, and delete any user account. Users with limited accounts can manage their own account profile and password, and have access to most of the applications on the computer, but are prevented from installing new software.
For more information about setting up and maintaining user accounts, refer to the Help topics provided with the Windows operating system.
User Settings
When you start up the AnalystHost application, the name of the user currently logged on appears at the top of the screen above the menu bar. The logged-on user is automatically assigned an AnalystHost user file that contains personalized settings that can be modified as desired. This file, with the extension .mdc, is stored in the Documents and Settings folder for the logged-on user.
The settings in the user file include the following:
• AutoSave settings • Barcode reader setting • Report format • Date and time format • Number format • Pseudocoloring settings • Protocols • Detection methods • Plate formats
The AnalystHost application allows you to save (export) the settings, including methods, protocols, and microplate formats you have defined, and use them again later by importing them back into the AnalystHost application. This feature allows you to edit your methods, protocols, and plate formats on a remote computer, save them to a file, and then use those settings later with the system. For further information, see .., ‘Importing and Exporting User Settings’.

1.8 Theory of Operation
Analyst GT Operator's Manual – Rev. C 17
1.8 Theory of Operation
1.8.1 Optical System
The instrument’s modular optical and electronic design combines high-quality components for each of five detection modes into a single, rugged, high-performance mechanical system. Each mode (F, FP, TRF, L, and A) is optimized for high sensitivity and extended dynamic range by using separate components when necessary. For instance, fluorescence and luminescence modes use different photomultiplier tubes (PMT). The luminescence PMT has low dark counts and a response shifted to the blue-green for enhanced performance in typical luminescence assays.
The heart of the instrument is the SmartOptics™ optical system, a flexible system of light sources, optics, and detectors that delivers the highest performance available using a microplate format. A diagram of the optical system is shown below.
Continuous LampFlash Lamp
Neutral Density Filters (behindfilter wheel)
Optical Shuttle
Excitation Filter Wheel
LuminescenceDetector
OpticalShuttle
Emission Filter Wheel
Fluorescence Detector
Emission Polarizers
Excitation Polarizer
Optics Heads
Optical System
SmartOptics starts with two light sources. A high-intensity, xenon-arc lamp provides the light required for fluorescence intensity, absorbance, and fluorescence polarization modes. The continuous light source provides more total photons than the flash source, resulting in higher sensitivity with shorter read times. The continuous source has a hot mirror that blocks heat-producing infrared light and limits light below nm from entering the system. The flash source is used with the time-resolved fluorescence mode, producing light during a brief interval before the signal from the sample well is integrated. It can also be used in fluorescence intensity and absorbance applications that require an ultraviolet (– nm) or infrared (– nm) light source.

1 System Description
18 Analyst GT Operator's Manual – Rev. C
During operation, light from the continuous lamp or flash lamp first passes through an excitation filter. After passing through the filter wheel, the light enters a fiber optic cable, which can be positioned by the optical shuttle to direct the light to either the top or bottom optics head (depending on the assay).
For fluorescence modes, light is transmitted through and reflected by a dichroic mirror or beamsplitter that directs light into the assay well. The top and bottom optics are epifluorescent, with the excitation and emission light traveling the same path in the optics head. Light emitted from the assay well passes through the dichroic mirror and into a fiber optic cable that runs to another shuttle that positions the appropriate fiber optic cable in front of the detection system. The light may pass through one of two attenuators (neutral-density filters). The user has the option to specify which neutral-density filter, if any, is in the light path. The emitted light then passes through an emission filter. Finally, the light is detected by the fluorescence photomultiplier tube.
Note: For information about the absorbance and luminescence modes, see the explanations on each mode in the following section (1.8.2, ‘Measurement Modes’).
The focal height or ‘z-height’ of the top and bottom optics heads is controlled by a motor drive system and can be adjusted for optimum assay performance, a feature called Dynamic Z. Light from the top or bottom optics head is focused into the assay well. Using Dynamic Z, the sensed volume can be precisely moved within the assay volume, optimizing the signal-to-noise (S/N) and signal-to-background (S/B) ratios. For further information, see .., ‘Dynamic Z’.
Homogeneous Assays Cell-Based Assays
Focal height can be optimized for specific assays.
A microplate sensor is mounted on the top optics head to prevent the plate from contacting the optics head in case the plate is misaligned, not properly specified, or the z-height is set incorrectly. If this ‘top-of-plate’ sensor is tripped, an instrument fault occurs. This condition requires an instrument reset which will eject the plate and home all motors.

1.8 Theory of Operation
Analyst GT Operator's Manual – Rev. C 19
1.8.2 Measurement Modes (F, FP, TRF, L, A)
The following sections describe the five optical measurement modes:
• Fluorescence Intensity (F) • Fluorescence Polarization (FP) • Time-Resolved Fluorescence (TRF) • Luminescence (L) • Absorbance (A)
Fluorescence Intensity Mode
Fluorescence intensity (F) measurements typically use the continuous light source. Alternatively, the flash lamp can be used for faster read times when ) high sensitivity is not required, or ) additional ultraviolet light is required for excitation.
After passing through a fluorophore-specific excitation filter, the light is routed through a low-fluorescence fiber optic cable to the read head. A dichroic mirror reflects light into the assay well. The emitted light is transmitted through the dichroic mirror and through a fiber optic cable to an emission filter that conditions the light before detection by the photomultiplier tube.
The instrument uses focusing optics to direct the excitation light into the assay well and to detect the light emitted from the well. The actual sensed volume in the well is small compared to the overall volume of the well, especially for -well microplates. Because the sensed volume remains the same, performance in -, and -, and -well plates is similar.
For homogeneous assays in - or -well plates, the location of the sensed volume with the highest signal-to-noise ratio (S/N) and highest signal-to-background ratio (S/B) is in the middle of the solution in the well. For cell-based assays, better performance may be achieved by moving the sensed volume to the bottom of the well to increase signal collected from fluorophores in the cells while rejecting background fluorescence in the assay buffer. The z-height for optimal S/N and S/B should be determined empirically.
Fluorescence measurements can be made from either the top or bottom of the mi-croplate. Using bottom optics typically delivers a lower S/N because of increased autofluorescence from the plate plastic. The bottom optics may give better results in cell-based assays.
The user specifies parameters for F methods with the Define and Edit Methods screen (see .., ‘Defining a Fluorescence Intensity Method’). You can specify top or bottom optics, continuous, flash, or no lamp, plate format, excitation and emission filters, wells to be read (sample and background), z-height, detection units, attenuation factor, maximum integration (read) time, desired precision (target %CV), and (if the flash lamp is selected) number of flashes per well, flash interval, and delay after flash. Other variable parameters include the polarizer orientation (during top reads only), plate shaking and plate settling times, hold in darkness (delay before first read), wait between reads, number of plate reads, and (if the flash lamp is used) the flash lamp voltage.
The user can either manually install a fluorophore-specific dichroic mirror to maximize sensitivity or use the % beamsplitter, which is suitable for a broad range of fluorophores.

1 System Description
20 Analyst GT Operator's Manual – Rev. C
Fluorescence PMT
Emission Filter Wheel
Neutral Density Filters
Polarizers
Polarizers
Assay Well
Dichroic MirrorO
P
H M O
P S O
Light Transmission byNeutral Density Filters H = 0.01% M = 1.0% O = 100%
Polarizers S = Horizontal P = Vertical O = Out
ExcitationFilter Wheel
Continuous Lamp (with Hot Mirror)
or Flash Lamp
Fluorescence Intensity Mode, Top Optics
Fluorescence PMT
Neutral Density Filters
Assay Well
Dichroic Mirror
H M O
Light Transmission byNeutral Density Filters H = 0.01% M = 1.0% O = 100%
ExcitationFilter Wheel
Continuous Lamp (with Hot Mirror)
or Flash Lamp
Emission Filter Wheel
Fluorescence Intensity Mode, Bottom Optics

1.8 Theory of Operation
Analyst GT Operator's Manual – Rev. C 21
Fluorescence Polarization Mode
Fluorescence polarization (FP) measurements use the same optical configuration as fluorescence intensity measurements except for the addition of emission and excitation polarization filters. The instrument makes two measurements for each well. FP measurements typically use the continuous light source, but the flash lamp can be used for faster read times when high sensitivity is not required.
Light from the continuous or flash lamp light source passes through an excitation filter. A static (fixed) polarization filter polarizes the light in the P orientation.
A dichroic mirror or beamsplitter then splits the light, reflecting polarized light into the assay well. Epifluorescent light emitted from the assay well is transmitted through the dichroic mirror or beamsplitter and the dynamic (movable) polarization filter.
After passing through the emission filter, the polarized light is detected by the fluo-rescence photomultiplier tube. The instrument makes the second measurement after the dynamic polarization filter moves automatically into the alternate S or P position. In Analyst GT instruments, the P emission polarizer is parallel and the S emission polarizer is perpendicular to the excitation plane. The report lists the fluorescence intensity for the parallel and perpendicular orientations, and the calculated polarization is expressed in mP (millipolarization units).
As in the F and TRF modes, focusing optics direct the excitation light into a small sensed volume. The location of the sensed volume can be changed using the z-height parameter. For FP measurements, the best signal-to-noise ratio (S/N) is typically found when the sensed volume is in the middle of each well. This minimizes spurious polarization signals from fluorophores bound to the well surfaces. The z-height for optimal S/N and S/B can best be determined empirically.
FP measurements are read only from the top of the plate. The user has the option to manually install a fluorophore-specific dichroic mirror in the top optics to maximize sensitivity or use the % beamsplitter, which is suitable for a broad range of fluorophores.
The user specifies parameters for FP methods with the Define and Edit Methods screen (see .., ‘Defining a Fluorescence Polarization Method’). You can specify the continuous or flash lamp, plate format, excitation and emission filters, the wells to be read (sample and background), G (grating) factor, z-height, detection units, attenuator mode, maximum integration (read) time, desired precision (target mP standard deviation), and (if the flash lamp is selected) the number of flashes per well, flash interval and delay after flash. Other variable parameters include plate shaking and plate settling times, hold in darkness (delay before first read), wait between reads, number of plate reads, and (if the flash lamp is used) the flash lamp voltage.
1 System Description
22 Analyst GT Operator's Manual – Rev. C
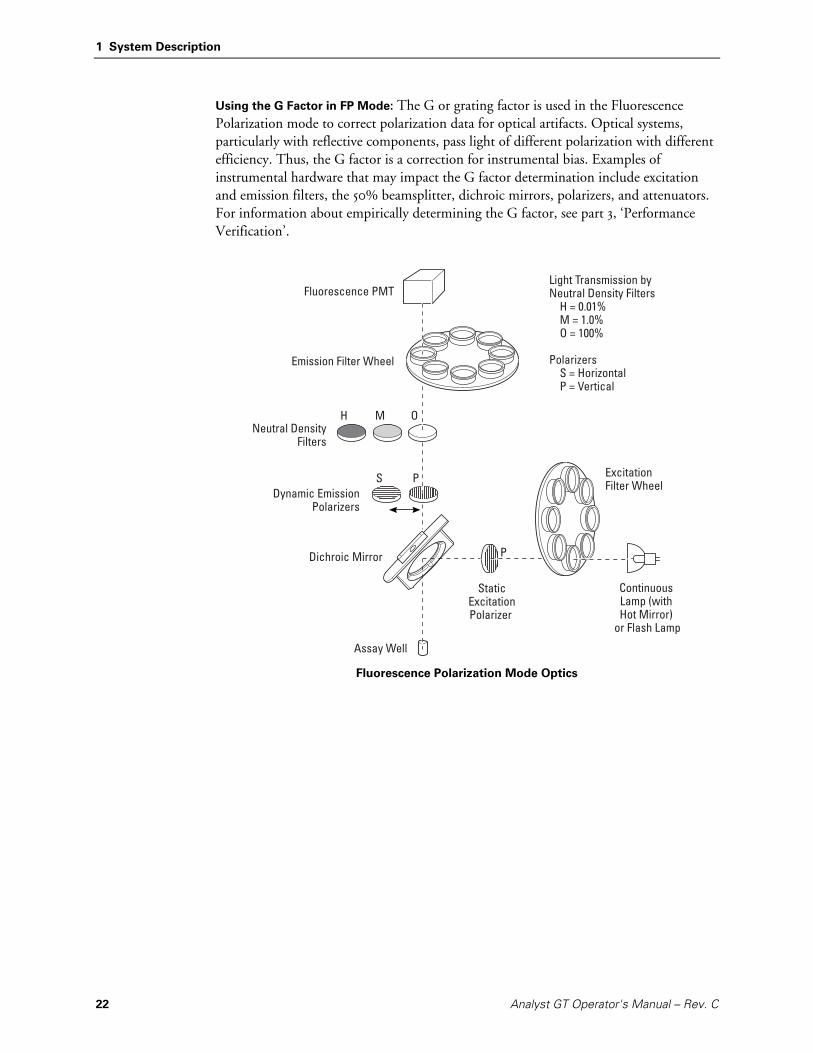
Using the G Factor in FP Mode: The G or grating factor is used in the Fluorescence Polarization mode to correct polarization data for optical artifacts. Optical systems, particularly with reflective components, pass light of different polarization with different efficiency. Thus, the G factor is a correction for instrumental bias. Examples of instrumental hardware that may impact the G factor determination include excitation and emission filters, the % beamsplitter, dichroic mirrors, polarizers, and attenuators. For information about empirically determining the G factor, see part , ‘Performance Verification’.
Fluorescence PMT
Emission Filter Wheel
Neutral DensityFilters
Assay Well
Dichroic Mirror P
H M O
StaticExcitationPolarizer
Light Transmission byNeutral Density Filters H = 0.01% M = 1.0% O = 100%
Polarizers S = Horizontal P = Vertical
ExcitationFilter Wheel
Dynamic Emission Polarizers
PS
ContinuousLamp (withHot Mirror)
or Flash Lamp
Fluorescence Polarization Mode Optics

1.8 Theory of Operation
Analyst GT Operator's Manual – Rev. C 23
Time-Resolved Fluorescence Mode
Time-resolved fluorescence (TRF) measurements use a xenon flash lamp as the light source. Since the flash lamp does not use a hot mirror, it transmits wavelengths from – nm.
After passing through an excitation filter, the light passes through a fiber optic cable to the read head where a dichroic mirror reflects light into the assay well. Epifluorescent light emitted from the assay well passes through the dichroic mirror and through a fiber optic cable to an emission filter before detection by the photomultiplier tube.
Interval Between Flashes
Prompt Fluorescence
FluorescenceFl
uore
scen
ce In
tens
ity
Integration TimeDelay After Flash
Time
TRF Decay
As in the F and FP modes, focusing optics direct the excitation light into a small sensed volume. The location of the sensed volume can be changed using the z-height parameter. The z-height for optimal S/N and S/B can best be determined empirically.
TRF measurements are made from either the top or bottom of the microplate.
The user has the option to manually install a fluorophore-specific dichroic mirror to maximize sensitivity or use the % beamsplitter, which is suitable for a broad range of fluorophores.
The user specifies parameters for TRF methods with the Define and Edit Methods screen (see .., ‘Defining a Time-Resolved Fluorescence Method’). You can specify top or bottom optics, plate format, excitation and emission filters, wells to be read (sample and background), z-height, detection units, attenuator mode, number of flashes per well, flash interval, delay time after flash, integration time per flash, and target %CV. Other variable parameters include plate shaking and plate settling times, hold in darkness (delay before first read), wait between reads, number of plate reads, and flash lamp voltage.
Note: Time Resolved Fluorescence Resonance Energy Transfer (TR-FRET) measurements, which require reading the emission of two different fluorophores, is supported using Multi-Method mode (see 2.5.10, Defining Multi-Methods’).

1 System Description
24 Analyst GT Operator's Manual – Rev. C
Fluorescence PMT
Emission Filter Wheel
Neutral Density Filters ExcitationFilter Wheel
Flash Lamp
Assay Well
Dichroic Mirror
H M O
Light Transmission byNeutral Density Filters H = 0.01% M = 1.0% O = 100%
TRF Mode Top Optics

1.8 Theory of Operation
Analyst GT Operator's Manual – Rev. C 25
Luminescence Mode
Luminescence (L) measurements use a luminescence read head with a dedicated fiber optic cable and photomultiplier tube separate from those used in fluorescence meas-urements. Light emitted from the assay well is directed through a low-fluorescence fiber optic cable to the luminescence photomultiplier tube. Luminescence measurements are made only from the top of the plate.
Analyst GT has an aperture that must be changed manually by the user when switching between / and -well microplate formats.
The user specifies parameters for L methods with the Define and Edit Methods screen (see .., ‘Defining a Luminescence Method’). You can specify plate format, wells to be read (sample and background), luminescence height (relative to the top of the plate), maximum integration (read) time, target %CV, detection units, and attenuator mode. Other variable parameters include plate shaking and plate settling times, hold in darkness (delay before first read), wait between reads, and number of plate reads.
Luminescence PMT
Neutral Density Filters
Aperture
M O
Light Transmission byNeutral Density Filters M = 1.0% O = 100%
Assay Well
Luminescence Mode Optics

1 System Description
26 Analyst GT Operator's Manual – Rev. C
Absorbance Mode
Absorbance (A) measurements can be made using either the continuous or flash lamp source. The continuous lamp has greater light output in the visible wavelength range (– nm) and may give better performance at those wavelengths. Conversely, the flash lamp has greater light output in the ultraviolet (– nm) and infrared (– nm) wavelength ranges and may give better performance in those wavelength ranges.
Light from the specified lamp passes through a bandpass filter in the excitation filter wheel, and the light passes through a low-fluorescence fiber optic cable to the read head. Only the top optics are used. A % beamsplitter directs light into the assay well. Light that passes through the bottom of the assay well is sensed by a photodiode positioned beneath the assay well. According to the Beer-Lambert law, the intensity of the light transmitted through the well is inversely proportional to the analyte concentration in the well.
The user specifies parameters for A methods with the Define and Edit Methods screen (see .., ‘Defining an Absorbance Method’). You can specify continuous or flash lamp, plate format, excitation filter (which should be a bandpass filter of the appropriate wavelength), wells to be read (sample and background), z-height, maximum integration (read) time, and (if the flash lamp is selected) the number of flashes per well and flash interval. Advanced parameters include plate shaking and plate settling times, hold in darkness (delay before first read), wait between reads, number of plate reads, and OD offset.
Important! Since measurements are made of light passing through the assay well, only clear bottom microplates may be used.
Continuous Lamp (with Hot Mirror)
or Flash Lamp
50% TransmittanceMirror
ExcitationFilter Wheel
Photodiode
Assay Well
Absorbance Mode Optics

1.8 Theory of Operation
Analyst GT Operator's Manual – Rev. C 27
1.8.3 Definitions of Counting Units
The relationship between the various unit choices is as follows:
• Counts = Number of raw counts acquired during the integration time. With the continuous light source, total counts equals CPS × integration time. With the flash lamp, total counts equals counts per flash × number of flashes.
• Counts/Second (CPS) = Counts ÷ Integration Time
• Intensity = Counts/Second × Attenuator Factor
• RFU (Relative Fluorescence Units) = Counts/Second × Attenuator Factor
• RLU (Relative Luminescence Units) = Counts/Second × Attenuator Factor
The attenuator factor depends on the attenuator (neutral-density filter) selected. When using RFUs or RLUs, the attenuator setting for each method determines the values of the attenuator factor (out = , medium = , high = ,).
1.8.4 Background Subtraction
In any measurement mode, the instrument can subtract readings in background wells from readings in sample wells. You specify background subtraction by clicking Select Wells in the Define and Edit Methods screen and selecting up to eight sets of sample and background wells. If you select multiple background wells, the system will average the background well readings.
During the plate read, only raw data are reported; in the final report, background-subtracted data will appear following the raw data. For multi-methods, you can specify whether the raw and background-subtracted data should appear in the final report and, if both, which should be reported first.
For FP methods, the instrument calculates the average background signal, subtracts it from each of the corresponding samples, and reports separate results for parallel and perpendicular measurements. The mP is calculated using background-subtracted signal, if possible.
For details about specifying background wells and sample wells on a plate, see .., ‘Selecting Wells for All Detection Methods’.
Example: An assay distinguishes between live and dead bacteria by utilizing SYTO green fluorescent nucleic acid stain and the red fluorescent nucleic acid stain propidium iodide, and determining the ratio of the fluorescence at nm (live) to the fluorescence at nm (dead). The assay can be performed in a single run using Multi-Method mode with two methods, SYTO Green and SYTO Red, which differ only in that SYTO Green uses the Fluorescein nm emission filter while SYTO Red uses the Europium nm emission filter.

1 System Description
28 Analyst GT Operator's Manual – Rev. C
The following illustration shows the basic parameters for the SYTO Green method:

1.8 Theory of Operation
Analyst GT Operator's Manual – Rev. C 29
To factor out the endogenous fluorescence of the cells, both methods read a column of background wells (A through H) that contain cells in buffer without stain:
The multi-method used to run the assay reads the fluorescence in each sample well, subtracts the average background readings from all sample wells, and calculates the ratio of the background-subtracted readings from the green-stained wells to the background-subtracted readings from the red-stained wells.

1 System Description
30 Analyst GT Operator's Manual – Rev. C
The following illustration shows an example parameter set for the multi-method:
The area marked ‘Reporting’ at the bottom of the screen allows you to specify which data will appear on the report and the order in which it will appear. For example, when you check the ‘Background Subtracted Data’ box, the system will include background-subtracted data in the report. You can use the Computed Value button to specify an operation (add/subtract/multiply/divide) to be done to the two sets of data, and, if so, Method to Method data or vice-versa. You can also specify a scalar to be applied to the calculated value above, select units for the raw data, and the order in which the results will appear.
When you run the assay, the multi-method parameters specified by Plate Format, Raw Data Units, Select Wells, and Advanced override the parameters specified in the individually selected methods; however, the original methods are not changed.

1.8 Theory of Operation
Analyst GT Operator's Manual – Rev. C 31
1.8.5 Dynamic Z
This section describes how Dynamic Z (also known as z-height) can be used to optimize the signal-to-noise and signal-to-background ratios (S/N and S/B). The system allows you to adjust focal height to accommodate a variety of different plate formats and sample types.
The following illustrates the instrument’s light beam as it illuminates a well. The portion of the light beam that coincides with the liquid in a partially filled well is the sensed volume. The light beam is shaped like an hourglass; its diameter is narrowest at its focal plane or waist and is wider both above and below this point. Furthermore, the instrument does not sample the liquid uniformly; it is more sensitive to liquid within the half-power band, which is the volume within approximately one waist-diameter of the focal plane. For fluorescence modes, z-height is the distance between the focal plane and the bottom of the well. For luminescence, the adjustable distance between the top of the microplate well and the read head is termed luminescence height.
Light Beam
Half-PowerBand
Z-Height
Bottom of Well
Focal Plane
Cross-Section of 96-Well Microplate
Z-Height Positioning
In homogeneous assays, as a general rule, the optimal S/N and S/B are achieved by setting the z-height in the middle of the liquid volume so the meniscus and the bottom of the well fall outside the half-power band.
In cell-based assays, and other assays where the fluorophores are near the bottom of the well, the optimal S/N and S/B are achieved by setting the z-height such that the bottom of the well falls within the half-power band.

1 System Description
32 Analyst GT Operator's Manual – Rev. C
Meniscus Effects
Because light is refracted as it crosses the boundary between air and sample (Snell’s law), the meniscus shape affects the geometry and shape of the light beam. This in turn affects optimization of z-height settings.
When the meniscus is bowl-shaped (concave), the half-power band elongates and moves to a lower-than-nominal position. With a less concave meniscus, the half-power band moves up and is less stretched. Even with a flat meniscus, there is still some stretching and lowering of the half-power band. With a slightly lens-shaped meniscus (convex), the focal plane moves further toward the nominal position. When the meniscus is sufficiently convex, the half-power band can be raised above the nominal position and can become compressed rather than stretched.
Changes in meniscus shape can occur due to changes in protein or detergent con-centration in the assay. The best results are typically achieved by setting the z-height such that the meniscus does not fall in the half-power band. This is best determined empirically.
Well Geometry Effects
A further consideration in setting z-height in a - or -well plate is the geometry of the microplate well. The instrument is capable of focusing at sufficiently low z-heights such that part of the excitation light beam impinges on the upper surface of the microplate, a condition that should generally be avoided. Setting the z-height too low can reduce sensitivity because of the following:
• Decrease in desired signal because less light enters the well.
• Increase in background (undesired signal) because the light beam illuminates the tops of wells. Many microplates are made from materials that are fluorescent, and the instrument will detect the fluorescence from materials at the tops of wells.
Despite these factors, a low z-height can still result in an optimal S/N, depending upon assay conditions.
Across-Plate Drift
Another manifestation of setting the z-height too low is across-plate drift. The system is configured with the dimensions (plate heights, interwell distances, etc.) for over twenty microplate formats. These plate parameters are nominal values and do not account for plate-to-plate or lot-to-lot variations in plate geometry. The following diagram illustrates the effect of a slight variation in interwell distance. When the z-height is set too low, the light beam can be perfectly centered on well A, but can be off-center on other wells. This is more critical in - and -well plates and can also occur if the improper plate dimensions are entered.

1.8 Theory of Operation
Analyst GT Operator's Manual – Rev. C 33
A1: Light beamaligned with well
H12: Light beammisaligned due to
plate geometry variation
G11: Misalignmentfixed by raising Z height to reducebeam diameterat top of well
Across-Plate Drift
Under these conditions, across-plate drift of fluorescence readings may be observed as the instrument scans across the plate, because as it moves farther from well A, misalignment generally increases, causing drift in the readings. The drift is often worst at well H, or at the well farthest from A. However, the user can minimize the effects of misalignment by setting the z-height correctly. Increasing the z-height, as shown for well G, accurately places the light beam back in the well, reducing drift.
Optimizing Z-Height
To optimize z-height for a particular plate and chemistry, first prepare a test plate with representative chemistry (blanks, positive and negative controls, dilution series, etc.). Read the plate multiple times at different z-heights to determine the z-height that gives the best signal-to-background ratio. If reading in FP mode, calculate signal-to-background ratio by dividing the average intensity of the parallel reads of wells containing fluorophore by the average intensity of the parallel reads of wells containing only buffer. In FP mode, you should also evaluate the effect of z-height on delta mP (difference between a high mP control and a low mP control) and choose a z-height that gives both a high delta mP and a high signal-to-background ratio. Some combinations of chemistry and plate are relatively insensitive to z-height, while others demonstrate a distinct optimum.

1 System Description
34 Analyst GT Operator's Manual – Rev. C

Analyst GT Operator's Manual – Rev. C 35
2 Operating Procedures
Part explains how to start up the system and how to use the AnalystHost application to set up the instrument; define microplate formats, detection methods, and protocols; and read microplates. The following procedures are detailed in part :
• .: Starting Up the System
• .: Setting Up the System
• .: Lamp and Plate Status
• .: Defining Microplates
• .: Defining Detection Methods
• .: Defining Protocols
• .: Running an Assay

2 Operating Procedures
36 Analyst GT Operator's Manual – Rev. C
2.1 Starting Up the System
Normally, it is not necessary to switch off power at the end of the day. If the reader will not be used for more than one day, it is best to turn it off. Use the following procedure only if the reader has been switched off.
2.1.1 Startup Procedure
1 Switch on instrument power.
When the instrument is turned on, the green POWER light should come on immediately. After about two minutes, the control panel should display:
Molecular Devices
10/01/2002 15:28:58
Caution: Never remove or attach the control panel while instrument power is on.
2 Switch on the host computer, log in as needed, and start the AnalystHost application.
Note: Always switch on the instrument first and allow it to complete the initialization process before starting the AnalystHost application. Otherwise, when you start the AnalystHost application, it will not detect the instrument.
Turn on the host computer and allow Windows to start up. Double-click on the AnalystHost icon to start the program.
3 View the Run screen.
The name of the user logged onto the Windows computer appears at the top of the screen. Depending upon how the AnalystHost application was left following the last usage, one of three views can appear (see next page).
• Plate View shows a graphical representation of the microplate readings.
• Report View shows a numeric representation of the microplate readings.
• Protocol View shows a list of the steps in the microplate read protocol.
To select another view, click on the View menu, and select the desired format.
4 Switch on continuous lamp (go to Status, Lamps).
For F, FP, and A methods that use the continuous lamp, the instrument performs best after the continuous lamp has warmed up for at least minutes. To warm up the lamp, select Lamps from the Status menu. Check the ‘Lamp On’ checkbox in the Continuous Lamp Status dialog box (see .., ‘Configuring the Continuous Lamp Settings’). The continuous lamp can also be toggled on and off by pressing the LAMP button on the control panel. If you fail to turn on the lamp before a read, then when you click Start the instrument will turn on the lamp and warm it up before it reads the plate.
Note: If the instrument was last used in a mode that did not require the continuous lamp (e.g., Luminescence or Time Resolved Fluorescence), the continuous lamp can not be controlled either via the control panel or AnalystHost software. To gain lamp control, choose a mode requiring the continuous lamp and click Start without a plate in the gripper. Bypass the lamp warm-up time and, once the first well is read, cancel the read without saving. The continuous lamp can now be controlled as described previously.

2.1 Starting Up the System
Analyst GT Operator's Manual – Rev. C 37
2.1.2 Run Screen
The Run screen is the starting point for all operations, whether you wish to configure the system, begin reading microplates, or run a protocol. An example of the Plate View screen for a -well microplate is shown below. You can change from Plate View, to Report View, or to Protocol View as follows:
• Click the appropriate icon on the shortcut toolbar, or
• Select Plate View, Report View, or Protocol View from the View menu.

2 Operating Procedures
38 Analyst GT Operator's Manual – Rev. C
Shortcut Toolbar
The shortcut toolbar provides quick access to commonly used functions. The summary below shows each icon name and the equivalent menu command for the icon.
Configure AutoSave (Setup, AutoSave…)
Edit Detection Methods (Methods, Detection, Edit)
Save (File, Save)
Edit Protocols (Methods, Protocols, Edit)
Restack (Operations, Restack)
Edit Plate Format (Plates, Edit)
Use Barcode Reader (Setup, Enable Barcode Reader)
Edit Filter/Beamsplitter List (Setup, Edit Filter Names…)
Plate View (View, Plate view)
Display Lamp Use (Status, Lamps)
Report View (View, Report view)
About (Help, About AnalystHost)
Protocol View (View, Protocol view)

2.1 Starting Up the System
Analyst GT Operator's Manual – Rev. C 39
Type and Name Drop-Down Lists
The current method type (or protocol) and name appear in the drop-down lists as shown below. You can use these lists to quickly switch to any method or protocol you have defined.
If you click on the question mark button next to the Name drop-down list, then the system displays a summary of the currently displayed method settings.

2 Operating Procedures
40 Analyst GT Operator's Manual – Rev. C
Status Bar
The status bar at the bottom of the screen provides information on the current status of the instrument.
Messages: Messages related to the current operation appear on the left side of the status bar. In the example shown above, the instrument is ‘Ready’ to read microplates or start a protocol.
State: The operational status, for example, ‘IDLE’, ‘READING’, etc. appears in the center of the status bar.
AutoSave: Indicates whether AutoSave is enabled (see .., ‘Configuring AutoSave’).
Status Indicator: The colored status indicator on the right edge of the status bar provides the following information:
Green Status is normal.
Yellow A service procedure is needed – for example, when nearing the end of the life of the lamp. Under these conditions, the SERVICE light on the control panel also comes on. A service condition does not prevent continued use of the instrument. However, the service condition will persist until it has been addressed.
Black There is no communication with the instrument.
Red A critical fault has occurred that requires operator intervention and resetting the instrument by pressing RESET on the instrument control panel to clear the condition (or within the software select File, Reset). When the Status Indicator is red, the FAULT light on the control panel comes on and an audible beep is heard. Any error message linked to the fault appears on the left side of the status bar.
Note: In the event of a fault condition, please record the exact error message prior to resetting the instrument. This information will be requested if technical support assistance is required.
To begin reading microplates or run a protocol, first use the Type drop-down list to select a method type (detection method, multi-method, or protocol). Then, from the Name drop-down list, select a specific method or protocol. After preparing reagents and microplates, load one or more microplates and click Start.

2.1 Starting Up the System
Analyst GT Operator's Manual – Rev. C 41
2.1.3 Importing and Exporting User Settings
The AnalystHost application allows you to save (export) your settings, including methods, protocols, and microplate formats you have defined, and use them again later by importing them back into the AnalystHost application. This feature allows you to edit your methods, protocols, and plate formats on a remote computer, save them to a file, and then use those settings later with the system.
Note: Files with the .mdc extension are encrypted to prevent unwanted modifications.
To save your settings to a file:
1 Select File, Export User Files. The system displays a screen similar to the following:
2 Enter a name for your file and click OK. The system saves the file to the selected folder.
Note: To transfer a user file from one computer to another, save the file to a diskette in the A: drive or copy the file to a network folder.
To import your settings from a file:
1 Select File, Import User Files. The system displays a screen similar to the following:
2 Select the file to import and click OK. The system imports the file and applies the
settings in the file to the AnalystHost application.

2 Operating Procedures
42 Analyst GT Operator's Manual – Rev. C
2.2 Setting Up the System
This section explains how to use the Setup menu to configure the system with parameters that are not specific to any mode or method. These include:
• Configuring AutoSave • Enabling or disabling the barcode reader • Selecting the report format • Entering names for filters and dichroic mirrors • Setting the instrument date and time • Selecting the number format used for showing results • Specifying the colorbar for AutoRange • Specifying the instrument serial number
2.2.1 Configuring AutoSave
The AutoSave feature allows you to automatically save results, either:
• Saving to a new file designated by the user,
• Appending the microplate report to an existing file,
• Assigning the microplate barcode as the file name, or
• Combining a specified file name with the microplate barcode or plate number.
The current AutoSave status appears in the status bar at the lower right corner of the Run Screen.
For further information on AutoSave, see .., ‘Saving Results Files’.
2.2.2 Setting Up the Barcode Reader
To configure the instrument to use the barcode reader, either:
• Click the Use Barcode Reader icon on the shortcut bar, or
• Select Enable Barcode Reader in the Setup menu.
When the barcode reader is enabled, the instrument will look for an identifying barcode on the side of each microplate. If you choose to include the barcode as part of the results file name, the barcode reader will be enabled automatically.
Note: Only Analyst instruments with a stacker contain a barcode reader. Check the location of the barcode reader installed in the stacker. It can be mounted to read barcodes in either the portrait (to the left of column 1) or landscape (below the last row) position on the microplate.

2.2 Setting Up the System
Analyst GT Operator's Manual – Rev. C 43
2.2.3 Selecting the Report Format
When you select Report Format from the Setup menu, you can select one of five formats:
No Header: Provides the following data:
• reading number of the total specified • well read list in the format specified • data description field in the format specified • units description field in the format specified • display format • well read values in a row/column matrix in units specified by read list
Kinetic read cycle completed: of
Well list: fr(a:h) = cps(f(a:h))
Data: RAW DATA
Units: cps
Display format: %.f
Columns: Provides the following data in four columns:
• reading number of the total specified • well read list in the format specified • data description field in the format specified • units description field in the format specified • display format • date/time stamp for each well read in the format specified • plate identification (plate number) • well identification • corresponding read value in units specified by read list with display format specified
Kinetic read cycle completed: of
Well list: fr(a:a,a:a) = cps(f(a:a,a:a))
Data: RAW DATA
Units: cps
Display format: %.f
// :: PM A
// :: PM A
// :: PM A
// :: PM A
// :: PM A
// :: PM A
Note: Columns format takes too long to download 1536-well microplate data. Instead, use Terse Column format.

2 Operating Procedures
44 Analyst GT Operator's Manual – Rev. C
Terse: Provides the following data:
• date/time stamp of start of read sequence in the format specified • plate identification (plate number) • barcode (if enabled and read) • number of read in the total specified • well read list • data description field • units description field in the format specified • display format • well read values in a row/column matrix in units specified by read list
// :: **
Kinetic read cycle completed: of
Well list: fr(a:h) = cps(f(a:h))
Data: RAW DATA
Units: cps
Display format: %.f
Terse Column: Data are reported as for the Terse format. However, well read values are reported in a single column.
// :: PM **
Kinetic read cycle completed: of
Well list: fr(a:h) = cps(f(a:h))
Data: RAW DATA
Units: cps
Display format: %.f
A .e+
A .e+
A .e+
A .e+
A .e+
A .e+
A .e+
A .e+
A .e+
A .e+
A .e+
A .e+
B .e+
B .e+

2.2 Setting Up the System
Analyst GT Operator's Manual – Rev. C 45
Verbose: Provides all data generated from the run. The full report format is dependent upon the selected detection method or protocol.
Load time: // ::
Read time: // ::
Kinetic read cycle completed: of
Read start delay time: s
Time delay between kinetic reads: <n/a>
Barcode: **
Method ID: Default Fluorescence Method,f
Plate ID:
Comment: Endpoint assay
Microplate format: Greiner PS
Shake time: s
Temperature: C
Top Dichroic: : Dichroic
Instrument tag: Apps Lab Analyst GT
Serial number: GT
Read sequence: row
Mode sequence: well
Detection mode: f
Excitation side: Top
Emission side: Top
Lamp: Continuous
Readings per well:
Time between readings: <n/a>
Integration time: us
TargetCV: Not Set
TargetSD: Not Set
Attenuator mode: m
Motion settling time: ms
Z Height: mm Numeric
Excitation filter: Fluorescein nm
Emission filter: Fluorescein nm
Excitation polarizer filter: o
Emission polarizer filter: o
Flash lamp voltage: <n/a>
Delay after flash: <n/a>
Max cps: cps
Min counts: counts
Baseline Source Intensity: cps
Well list: fr(a:b,a:b) = cps(f(a:b,a:b))
Data: RAW DATA
Units: cps
Display format: %.f
A
B
C
D
E
F
G
H

2 Operating Procedures
46 Analyst GT Operator's Manual – Rev. C
2.2.4 Entering Names for Filters and Dichroic Mirrors
The AnalystHost application allows you to enter a name for each filter and dichroic mirror installed in the instrument. Once entered, you can select the filters when you define a new method.
1 To enter a name for a new filter or dichroic mirror, either:
• Click the Edit Filter/Beamsplitter List icon on the shortcut bar, or
• Select Edit Filter Names from the Setup menu.
The dialog box shows the filter names for each of the eight positions in the excitation filter wheel.
• Select the Emission tab to view the filter names for the emission filter wheel.
• Select the Dichroic tab to view the names of the dichroic mirrors for the top and bottom optics.
2 Click on the filter or dichroic mirror position and enter a new name. When done, click Apply.
3 After entering or editing all the filter and dichroic mirror names, click OK.
Important! Be sure the name you enter corresponds correctly to the position of the filter in the instrument. The system has no way to verify the filter’s identity.
Note: Once a dichroic mirror has been identified to the AnalystHost application, then the instrument will automatically detect that mirror whenever it is installed in the future and will report the dichroic mirror name in the Filters dialog window. Each dichroic mirror is equipped with magnets that the instrument can detect and translate into a discrete data bit. Up to 32 dichroic mirrors can be entered and identified. Dichroic mirrors 1–15 are preassigned by Molecular Devices, but 16–32 are available for users to assign as needed.
For information on installing filters and dichroic mirrors, see ., ‘Filter Removal and Replacement’, and ., ‘Dichroic Mirror Removal and Replacement’.

2.2 Setting Up the System
Analyst GT Operator's Manual – Rev. C 47
2.2.5 Setting the Instrument Date and Time
Whenever the instrument generates results, it includes a date and time stamp. You must use the host computer to set the correct date and time for the instrument’s internal computer. Once set, reset the time only when daylight savings or standard time begins.
To set the date and time that appears with test results:
1 From the Setup menu, select Date and Time. The program displays:
2 Click on the field you want to reset and type the new date or time. You can also change the date and time formats. When done, click OK to confirm the new settings.
2.2.6 Selecting the Number Format
To select the number format used for results shown on the Run screen and in reports:
1 From the Setup menu, select Number Format. The program displays:
2 Click on one of the number formats shown in the table below. When done, click OK to confirm the new setting.
Number Format Example
Decimal integer 112793608
Floating point 112793608.00
Scientific 1.12793608e+008

2 Operating Procedures
48 Analyst GT Operator's Manual – Rev. C
2.2.7 Modifying the Colorbar
You can invert the colors that appear on the colorbar on the right side of the Run Screen (Plate View). Under Pseudo Coloring in the Setup menu, simply select Use Inverted Colorbar.
You can adjust the color bar so that the colors range according to log or linear scale parameters. Under Pseudo Coloring in the Setup menu, choose either log scale or linear scale.
2.2.8 Specifying the Instrument Serial Number
This field specifies the serial number of the instrument to be controlled by the AnalystHost application.
This feature allows you to connect to different instruments using the same host computer. (However, you can connect to only one instrument at a time.) To change the serial number setting:
1 Under Instrument Serial Number in the Setup menu, type the serial number for the instrument you want to connect to and click OK.
2 Close the AnalystHost application. Connect the host computer to the instrument with the specified serial number.
3 Relaunch the AnalystHost application.

2.3 Lamp and Plate Status
Analyst GT Operator's Manual – Rev. C 49
2.3 Lamp and Plate Status
With the Status Menu you can:
• Monitor the status of the continuous lamp • Review the total number of plates read by the instrument
2.3.1 Configuring the Continuous Lamp Settings
After replacing the continuous lamp, use the Continuous Lamp Status dialog box to:
• Enter the expected life of the new lamp. • Monitor hours remaining before the lamp must be replaced again. • Configure the lamp to shut off after a specified interval of inactivity. • Set a lamp warm-up time.
If you click the Display Lamp Use icon (or select Lamps from the Status menu), the system displays:
Estimated Life: Enter the expected life of the lamp in hours. The continuous lamp is rated for hours.
Hours Used, Time Remaining: After replacing the lamp, click the Reset button to restart the lamp monitor. For example, if you enter as the estimated lamp life and then click Reset, the Hours used will return to ‘’ and the Time remaining will return to ‘.’
Shutoff Interval: To prolong lamp life, you can have the continuous lamp automatically shut off after a specified interval. To enter a new shutoff interval, click in the window and type the number of minutes desired for lamp shutoff.
Important! In most situations, a 60-minute lamp shutoff interval is appropriate. However, be sure that the shutoff interval is always longer than the longest incubation time in order to avoid premature lamp shutoff during the current protocol or kinetic read. Also, never set the interval to less than 10 minutes – optimal system performance for F, FP, and A methods that use the continuous lamp requires a 10-minute lamp warm-up before the first read.
Warmup Interval: For best performance, the continuous lamp should be warmed up for at least minutes before reading plates. To enter a new warmup interval, click in the window and type the number of minutes desired for lamp warmup.

2 Operating Procedures
50 Analyst GT Operator's Manual – Rev. C
Lamp Service Message: The system reports a service message (‘Lamp life low’) when the continuous lamp has been on for a specified interval. The system is configured to post the message when there are hours of lamp life remaining.
2.3.2 Monitoring Plate Status
If you select Plates from the Status menu, you can review the total number of plates read by the instrument, as well as the number of plates read since the last reset (‘Plate Counter’). To reset ‘Plate Counter,’ click the Reset button.
Note: ‘Plate Counter’ and ‘Total Plates Read’ are incremented by 1 each time a plate is ejected.
The ‘Plate ID’ field in the Columns, Terse, Terse Columns, and Verbose report formats shows the number of plates processed since ‘Plate Counter’ was reset. The number that appears in the report for ‘Plate ID’ is the current value of the plate counter when the plate is done being read. When the plate is then ejected, the number shown for ‘Plate Counter’ is incremented by 1, but the number shown in the report for ‘Plate ID’ is not. Therefore, the number shown for ‘Plate Counter’ will always be at least 1 greater than the number shown for ‘Plate ID.’ Note that if a plate is loaded and ejected without being read, the difference between the numbers shown for ‘Plate Counter’ and ‘Plate ID’ increases by 1.

2.4 Defining Microplates
Analyst GT Operator's Manual – Rev. C 51
2.4 Defining Microplates
This section explains how to use the Plates menu to enter precise dimensions for any microplate. With the Plate menu, you can:
• Define a New microplate format.
• Edit, Copy, or Rename an existing microplate definition.
• Delete a microplate definition.
• Select Options to choose which plate formats to display when defining and editing detection methods.
Microplates are defined in terms of their plate height, plate width, plate length, number of wells, well depth, and spacing between wells. The AnalystHost application is shipped with predefined standard microplate formats for many common types of plates. However, some methods may utilize microplates that do not conform with any of the predefined formats.
The AnalystHost application allows you to define a complete range of plate formats. Accurate plate definitions are important, especially when optimizing performance for - and -well plates using the Dynamic Z feature, which allows precise specification of the vertical positioning of the optics head relative to the microplate.
Check the ClubHT web site at www.MolecularDevices.com for additional defined microplate formats.
2.4.1 Defining a New Microplate Format
To create a new microplate format, you enter a name for the plate; the plate length, width, and height; the number of rows and columns; precise dimensions for the alignment of the wells; and the maximum well volume.
1 From the Plates menu, select New… The program displays:
2 Enter a name for the new microplate format in the Name box. (This name will appear in the Plate Format drop-down list when you define or edit a method.)
3 Enter the number of wells for the new microplate format (, , , or other value).

2 Operating Procedures
52 Analyst GT Operator's Manual – Rev. C
4 When done, click OK. A schematic representation of the microplate appears:
5 Continue by entering the plate dimensions, number of rows and columns, well volume, etc., as indicated on the screen. All dimensions should be in millimeters.
6 When done, confirm your entries by clicking OK.
Note: New microplate formats are only added to the list of microplates available to the Analyst user who was logged onto the AnalystHost software at the time.
2.4.2 Modifying a Microplate Format
You may wish to start with a predefined plate format and create a new one using the Plates menu options:
• By clicking on the Edit Plate Format icon (or selecting Plates, Edit) you can select a previously defined plate format and modify any of the plate dimensions.
Note: Microplate formats predefined by Molecular Devices cannot be edited.
• The Copy command allows you to copy all parameters from an existing plate format to a new plate format.

2.4 Defining Microplates
Analyst GT Operator's Manual – Rev. C 53
2.4.3 Deleting a Microplate Format
To delete a microplate format:
1 From the Plates menu, select Delete. The program displays the current list of microplate formats.
2 Select the microplate format you want to delete. When the program prompts you to confirm the selection, click OK to delete.
Note: Microplate formats predefined by Molecular Devices cannot be deleted.
2.4.4 Choosing Microplate Formats to Display
You may choose which microplate formats to display instead of showing the entire list:
1 From the Plates menu, select Options. The program displays the current list of microplate formats.
2 Check the microplate formats you want to display.
Note: Unchecked microplate formats will still be retained in the software, not deleted.

2 Operating Procedures
54 Analyst GT Operator's Manual – Rev. C
2.5 Defining Detection Methods
The Methods, Detection menu allows you to define a wide variety of detection methods for use with the system. With the Methods, Detection menu, you can:
• Define a New detection method. See .., ‘Defining a New Detection Method’.
• Edit, Copy, or Rename an existing detection method. See .., ‘Modifying a Detection Method’.
• Delete a detection method. See .., ‘Deleting a Detection Method’.
This section of the manual also provides the following:
• ..: Overview of Detection Method Parameters
• ..: Defining a Fluorescence Intensity Method
• ..: Defining a Fluorescence Polarization Method
• ..: Defining a Time-Resolved Fluorescence Method
• ..: Defining a Luminescence Method
• ..: Defining an Absorbance Method
• ..: Defining Multi-Methods
• ..: Selecting Wells for All Detection Methods
When you define a new detection method, you will edit default parameter values that appear in the Define and Edit Methods screen. Each of the five types of detection methods has a set of predefined default parameters. For a complete listing of programmable method parameters, including parameter ranges and defaults for each of the five detection modes, see ., ‘Detection Method Parameter Cross-Reference’.

2.5 Defining Detection Methods
Analyst GT Operator's Manual – Rev. C 55
2.5.1 Overview of Detection Method Parameters
This section provides information on the parameters used to define detection methods.
Basic Detection Method Parameters
The following parameters are set using the Define and Edit Methods screens, which are accessible through the Methods menu.
Method Name: Specify a name for each new method by selecting New from the Method menu. The method name appears in the Method ID field on the verbose report format.
Optics: For F and TRF methods, select either the top or bottom optics. FP, L, and A methods use only the top optics.
Lamp: F, FP, and A methods use the continuous lamp by default, but the flash lamp option is also available for these modes. TRF methods use the flash lamp exclusively. L methods do not use either lamp.
Filters: For F, FP, and TRF methods, select one excitation and one emission filter from the drop-down menu. L methods do not use filters. For A methods, select one excitation filter (a bandpass filter of appropriate wavelength). To identify the installed filters, select Edit Filter Names from the Setup menu (see .., ‘Entering Names for Filters and Dichroic Mirrors’).
Dichroic Mirrors: Identify the installed dichroic mirrors by selecting Edit Filter Names from the Setup menu. The currently installed dichroic mirrors, as specified in the Filters dialog box (see .., ‘Entering Names for Filters and Dichroic Mirrors’), are included within the method definition. Note that L methods do not use a dichroic mirror.
Plate Format: For each method, select a plate format from the drop-down list. The system is provided with a number of predefined plate formats. In addition, you can define custom formats by using the options in the Plate menu.
Select Wells: The system allows the user to define up to eight sample regions and eight background regions. For details about how to specify the wells to be read, see .., ‘Selecting Wells for All Detection Methods’.
Z-Height: For F, FP, TRF, and A methods, the z-height is the height of the focal plane relative to the bottom of the well. The optimum height is dependent upon the plate dimensions and the height of the fluid in the well, and is typically – mm.
Luminescence Height: For L methods, the luminescence height is the distance from the bottom of the optics head to the top of the plate. The recommended range is .– mm. To decrease cross-talk, select a luminescence height as close to the top of the plate as possible (an initial setting of mm is suggested). If the luminescence height is too high, significant cross-talk may result.

2 Operating Procedures
56 Analyst GT Operator's Manual – Rev. C
Timing, Continuous Lamp: The system allows the following settings:
• Maximum Integration Time: Enter the desired maximum duration of the read time, which is the interval during which the PMT collects data (–,, microseconds).
Note: The length of time the read head stays at each well is equal to the plate settling time plus all or a portion of the integration time.
Timing, Flash Lamp: The system allows the following settings (parameter limits are shown in parentheses):
• Flash Interval: The maximum rate for the flash lamp is once every milliseconds. Enter the time between flashes in -millisecond increments. You can enter a value of – which corresponds to – milliseconds.
• Delay after Flash: Enter the time between the end of the flash and the beginning of the integration time in microseconds (–,).
• Integration Time per Flash: Enter the read time duration, which is the interval during which the PMT collects data (–,, microseconds).
• Flashes per Well: Enter the number of readings per well (–,).
Target CV per well: For F, TRF, and A methods, the desired precision for the readings taken on each well. You can select the desired statistical percent coefficient of variation (CV), and the system will adjust the integration time to achieve that precision.
Target SD per well: For FP methods, the desired mP standard deviation (SD) for the readings taken on each well. You can select the desired statistical SD, and the system will adjust the integration time to achieve that precision.
G Factor: For FP methods only, use the G factor to correct polarization data for optical artifacts. The G factor typically falls between . and ., though numbers outside this range may also be acceptable. For further information, see .., ‘Fluorescence Polarization Mode’ and part , ‘Performance Verification’.
Raw Data Units: RFUs (Relative Fluorescence Units) are used only with F, FP, and TRF methods, while RLUs (Relative Luminescence Units) are used only with L methods. All methods allow you to select ‘Counts’ or ‘Counts/sec’, except A, where there is no option to select raw data units. For a discussion of the different units, see, .., ‘Definitions of Counting Units’.
Attenuator Mode: For F, FP, and TRF methods, select High, Medium, or Out. For L methods, select either Medium or Out.

2.5 Defining Detection Methods
Analyst GT Operator's Manual – Rev. C 57
Advanced Detection Method Parameters
The following parameters are set using the Advanced Setup screens, which are accessible from the Define and Edit Methods screens by clicking the Advanced button.
Polarizers: Polarizing filters can be used to reduce background noise. For F methods, you can select none or crossed polarizing filters. When polarizers are crossed, the polarizer in the emission light path will be perpendicular to the polarizer in the excitation light path.
Note: You cannot use polarizers if you select ‘Bottom’ reading for a Fluorescence method. Polarizers are not physically present in the bottom read head.
Kinetic Timing: The system allows the following settings (parameter limits are shown in parentheses):
• Hold in Darkness: The time between the plate entering the read chamber and the beginning of plate read in seconds (–, seconds).
• Wait Between Reads: Used for multiple readings per plate, this parameter specifies the interval from the start of one read cycle to the start of the next read cycle (–, seconds or – hours). If you specify a delay between readings that is shorter than the actual read time for the entire plate, the instrument will just read the plate n times as fast as it can.
• Number of Reads: The number of times each plate is to be read before moving on to the next plate (–).
Flash Lamp Voltage: F, FP, and TRF methods allow you to adjust the voltage to the flash lamp (– volts). To decrease light intensity, lower the flash lamp voltage.
Caution: It is almost never necessary to lower the flash lamp voltage. Do not set flash lamp voltage to less than 400 volts or it may not flash reliably.

2 Operating Procedures
58 Analyst GT Operator's Manual – Rev. C
Shaking Time: The instrument can agitate the plate by moving it in a circular motion. You can specify the duration of plate agitation (– seconds).
Note: In general, plate agitation is not needed because diffusion provides adequate mixing.
Plate Settling Time: All methods allow you to define the duration of the interval that begins when the plate reaches the read position for the next well and ends when the next reading starts. This time allows movement of liquid in the well to subside (–, milliseconds).
PlateSettling
Time
PlateSettling
Time
PolarizerMoveTime
PlateSettling
Time
PlateSettling
Time
Move Plate
Move Plate
Fluorescence, TRF, Luminescence, and Absorbance modes
Fluorescence Polarization mode
Move Plate
Move Plate
IntegrationTime
S PolarizationIntegration
Time
P PolarizationIntegration
Time
Time
Well Processing Timelines
OD Offset: For Absorbance methods, the OD offset value serves as a reference allowing the calculation of absolute OD values from the collected relative transmission data. For further information, see .., ‘Defining an Absorbance Method’.

2.5 Defining Detection Methods
Analyst GT Operator's Manual – Rev. C 59
2.5.2 Defining a New Detection Method
When you select New from the Methods, Detection menu, the system displays the New Method dialog box:
First use the Method type drop-down list to select the method type (Fluorescence, Absorbance, … etc.). Then enter a name for the new method. When you click OK to confirm the new method name, the Define and Edit Methods screen appears. The new method is assigned the default parameters for the selected method type.
• For examples of the Define and Edit Methods screens, refer to the appropriate method type in the following pages.
• For a complete listing of programmable method parameters, including parameter ranges and defaults for each of the detection modes, see ., ‘Detection Method Parameter Cross-Reference’.
2.5.3 Modifying a Detection Method
You may wish to start with a pre-existing detection method or create a new one:
• By selecting the Edit Detection Methods icon (or Edit from the Methods, Detection menu), you can select a previously defined detection method and modify the parameters.
• The Copy command allows you to copy all parameters from an existing method to a new method.
• The Rename command allows you to assign a new name to a detection method.
2.5.4 Deleting a Detection Method
To delete a detection method definition:
1 Select Delete from the Methods, Detection menu. The program displays the current list of method types and names.
2 Select the method you want to delete. When the program prompts you confirm the selection, click Yes to delete.
Note: Default methods predefined by Molecular Devices cannot be deleted.

2 Operating Procedures
60 Analyst GT Operator's Manual – Rev. C
2.5.5 Defining a Fluorescence Intensity Method
The AnalystHost application allows you to specify the Fluorescence method parameters shown in the following example screens.
If you click on the Advanced button, the following screen appears:

2.5 Defining Detection Methods
Analyst GT Operator's Manual – Rev. C 61
2.5.6 Defining a Fluorescence Polarization Method
The AnalystHost application allows you to specify the Fluorescence Polarization method parameters shown in the following example screens.
If you click on the Advanced button, the following screen appears:

2 Operating Procedures
62 Analyst GT Operator's Manual – Rev. C
2.5.7 Defining a Time-Resolved Fluorescence Method
The AnalystHost application allows you to specify the Time-Resolved Fluorescence method parameters shown in the following example screens.
Note: If you click on the ? button (next to the Flashes per well field) the system displays the TRF timing diagram shown on page 23.
If you click on the Advanced button, the following screen appears:

2.5 Defining Detection Methods
Analyst GT Operator's Manual – Rev. C 63
2.5.8 Defining a Luminescence Method
The AnalystHost application allows you to specify the Luminescence method parameters shown in the following example screens.
If you click on the Advanced button, the following screen appears:

2 Operating Procedures
64 Analyst GT Operator's Manual – Rev. C
2.5.9 Defining an Absorbance Method
The AnalystHost application allows you to specify the Absorbance method parameters shown in the following example screens.
If you click on the Advanced button, the following screen appears:

2.5 Defining Detection Methods
Analyst GT Operator's Manual – Rev. C 65
Determining an OD Offset Value
The OD offset value serves as a reference allowing the calculation of absolute OD values from the collected relative transmission data. To determine the OD offset:
1 Define a method with all parameters to be used for reading.
a In the Select Wells screen, define all wells containing buffer as Sample .
b In the Advanced Absorbance Setup screen, verify that the OD Offset is set to ‘’.
2 Fill a representative plate with buffer (in the wells defined under Select Wells), using the same final volume that the assay plates will contain.
3 Read the plate with the method defined in step 1.
4 From the report, calculate the average OD for the buffer wells (defined as Sample ). This will be the value used for the OD Offset.
5 Return to the method, select the Advanced Absorbance Setup screen and enter in the calculated OD Offset value.
6 Return to the Edit and Define methods screen, click Select Wells, and modify the Sample selection in the Select Wells screen to include all wells of the plate that will contain the sample. There should be no wells defined as Background when the OD Offset is used.
7 When assay plates are read with this method, the OD Offset will be used as a blank to calculate absolute OD values.
Notes:
1. When an OD Offset value is entered and Background 1 wells have been defined in the Select Wells window, the OD Offset value is ignored and the average background from the Background 1 wells is used.
2. Prior to a read in which no background wells have been selected, a dialog appears: ‘No background wells have been selected. The stored OD Offset will be used in the absorbance calculations, OD Offset = ____, Last Saved _____.’

2 Operating Procedures
66 Analyst GT Operator's Manual – Rev. C
2.5.10 Defining Multi-Methods
The AnalystHost application allows you to specify the Multi-Method parameters shown in the following example screen.
Mode: Select the modes for the first and second detection methods.
Method: Select the first and second detection methods.
Plate Format: Select a plate format from the drop-down list.
Notes:
1. When you run the assay, the multi-method parameters specified by Plate Format, Raw Data Units, Select Wells, and Advanced override the parameters specified in the selected methods; however, the original methods do not change.
2. Multi-method switches between the two methods specified on a per-well basis. The two methods must use the same lamp and read head (top or bottom). If you want to read the entire plate first with one method and then with another method, or if you want to combine methods using different read heads and lamps, then create a protocol under Protocols in the Methods menu.
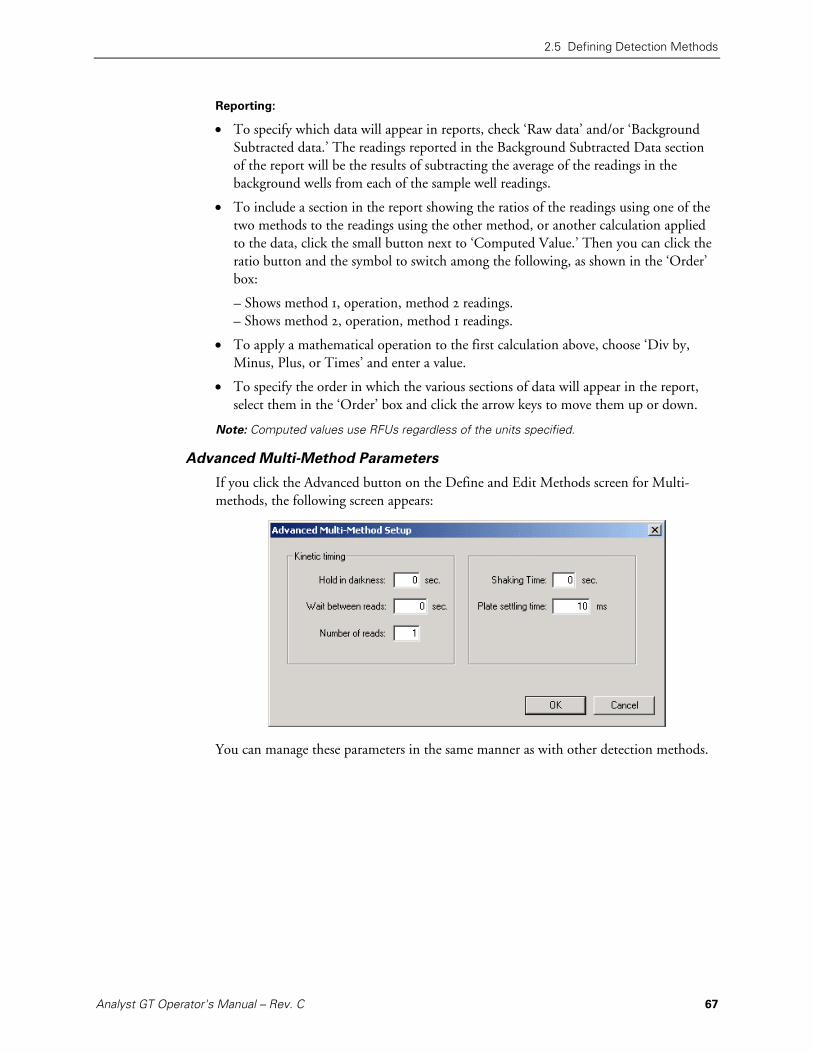
2.5 Defining Detection Methods
Analyst GT Operator's Manual – Rev. C 67
Reporting:
• To specify which data will appear in reports, check ‘Raw data’ and/or ‘Background Subtracted data.’ The readings reported in the Background Subtracted Data section of the report will be the results of subtracting the average of the readings in the background wells from each of the sample well readings.
• To include a section in the report showing the ratios of the readings using one of the two methods to the readings using the other method, or another calculation applied to the data, click the small button next to ‘Computed Value.’ Then you can click the ratio button and the symbol to switch among the following, as shown in the ‘Order’ box:
– Shows method , operation, method readings. – Shows method , operation, method readings.
• To apply a mathematical operation to the first calculation above, choose ‘Div by, Minus, Plus, or Times’ and enter a value.
• To specify the order in which the various sections of data will appear in the report, select them in the ‘Order’ box and click the arrow keys to move them up or down.
Note: Computed values use RFUs regardless of the units specified.
Advanced Multi-Method Parameters
If you click the Advanced button on the Define and Edit Methods screen for Multi-methods, the following screen appears:
You can manage these parameters in the same manner as with other detection methods.

2 Operating Procedures
68 Analyst GT Operator's Manual – Rev. C
2.5.11 Selecting Wells for All Detection Methods
The Select Wells option on the Define and Edit Methods screens can be used to specify how wells will be read for each detection method, as explained below:
1 Click the Select Wells button on any of the Define and Edit Methods screens.
2 Select from eight samples or backgrounds in the menu.
Note: If you do not specify sample and/or background areas, the system reads all wells in the plate. If you specify sample and/or background areas, then the system reads only the wells specified.
3 Specify the region to be defined by highlighting the wells on the grid (click and drag).
When you release the mouse button, the system displays the wells highlighted in the color corresponding to the region selected.

2.5 Defining Detection Methods
Analyst GT Operator's Manual – Rev. C 69
4 Repeat steps 2–3 for the other regions to be defined.
5 Select reading across rows or down columns in a snake-like pattern.
6 Click OK to accept the regions defined.

2 Operating Procedures
70 Analyst GT Operator's Manual – Rev. C
2.6 Defining Protocols
The Methods menu allows you to define protocols that specify a sequence of incubation and read steps that will be applied to each plate in a particular order. The steps in a protocol can include:
• Incubate (delay intervals) • Read (detection methods)
The Methods menu allows you to:
• Define a New protocol • Edit, Copy, or Rename an existing protocol • Delete a protocol
Developing a new protocol is a two-stage process. First you define the steps in the protocol, specifying the sequence of incubate and read operations (see .., ‘Defining a New Protocol’ below). Then, you must establish the timing of the batch by processing a preliminary microplate known as the ‘send-ahead’ plate (see .., ‘Batch Timing’).
2.6.1 Defining a New Protocol
Note: The process for copying, renaming, and deleting is the same as for detection methods. Consequently, this section emphasizes the steps needed to define and edit protocols.
Use the following steps to create a new protocol:
1 Select Protocols, New from the Methods menu. The program prompts you to enter a name for the new protocol.

2.6 Defining Protocols
Analyst GT Operator's Manual – Rev. C 71
2 Enter a name for the new protocol and click OK. The Edit Protocol screen appears.
3 Click Insert above or below (arrows) to add a step to the protocol. The program prompts you to select a Read or Incubate protocol action. (You may also check Use Measured Batch Size to have the program determine the maximum number of plates that can be run in one batch using the protocol you have designed.)

2 Operating Procedures
72 Analyst GT Operator's Manual – Rev. C
4 Select an action. When you select an action, the program displays a screen allowing you to specify the action to be taken. For example, if you select Read, the program displays a window for you to specify which Type of read mode and Name of a method to use for the read.

2.6 Defining Protocols
Analyst GT Operator's Manual – Rev. C 73
5 Click Finish to return to the Edit Protocol screen.

2 Operating Procedures
74 Analyst GT Operator's Manual – Rev. C
6 Continue inserting steps. When you finish defining the protocol, the Edit Protocol screen might look similar to the following:
7 Click OK when you finish to save the protocol.
Notes: • If you want to edit the detection method parameters, simply double-click on the method
name.
• All read actions within a protocol must specify the same plate format.

2.6 Defining Protocols
Analyst GT Operator's Manual – Rev. C 75
2.6.2 Batch Timing
If running several plates using the instrument stacker, the AnalystHost application will establish the timing requirements for a batch after you define the steps in a new protocol. This is done by processing a ‘send-ahead’ microplate. On the first run of each new protocol, the send-ahead plate must be run through the entire protocol. The send-ahead plate should be empty (or contain only buffer) so the wells emit low signal. When finished, the software indicates the maximum batch size and batch time. If a smaller batch size is desired, you can uncheck the Use Measured Batch Size box and manually set the desired batch size.
Any time you change a protocol (except for changing incubation times), the batch timing must be recalculated by processing another send-ahead plate. Once batch timing has been determined for a protocol, the system immediately begins processing any microplates present in the stacker. The system will process no more than the number of plates calculated for the maximum batch size. As a rule of thumb, you can estimate the maximum batch size by dividing the shortest incubation period by the duration of the longest task, usually a plate read.
2.6.3 Incubation Periods
A protocol can include an incubation period (delay) between any two steps. If multiple incubations are included, each incubation can have a different duration.
Typically, the instrument moves a plate to the stacker’s output position for each incubation. However, if the specified duration of an incubation is less than the time required to move the plate to the output position and return to the gripper, the instrument incubates the plate in the gripper, ready for the next action.
Note: Only Analyst instruments with a stacker can utilize incubations during protocols.

2 Operating Procedures
76 Analyst GT Operator's Manual – Rev. C
2.6.4 Using the Protocol View Screen
During a run, you can monitor the progress of a protocol by selecting the Protocol View screen (select View, Protocol View or use the shortcut button on the toolbar). Protocol View shows the current protocol step highlighted and the time remaining in the run.

2.7 Running an Assay
Analyst GT Operator's Manual – Rev. C 77
2.7 Running an Assay
This section explains how to select a detection method or protocol, read microplates, and review results.
2.7.1 Starting a Run
Use the following steps to start a run:
1 Configure AutoSave.
Specify how you want results to be reported by selecting AutoSave from the Setup menu and configuring the output file format (see .., ‘Saving Results Files’).
2 Select Detection Method or Protocol.
From the Run screen, use the drop-down Type and Name menus to select the detection method or protocol. An example of the Run screen is shown below.

2 Operating Procedures
78 Analyst GT Operator's Manual – Rev. C
3 Load microplate(s).
• In a non-stacker instrument, if the plate gripper arm is inside the instrument, click the Eject button on the Run screen to eject the gripper. Set a single microplate into the gripper.
• If the instrument includes a stacker, insert a single microplate into the stacker’s input position or load the input magazine with a stack of up to plates.
4 Start microplate reading.
Click the Start button on the Run screen. The instrument loads the microplate and either runs the protocol or simply reads the microplate, depending upon the operation(s) specified. When finished, the instrument ejects the plate automatically.
5 Monitor results during the run.
The following options are available while the run is in process:
• Plate View: Shows results of the plate currently being read (select View, Plate View).
• Report View: Shows data from the plate read previously (select View, Report View).
• Protocol View: Shows the current protocol step highlighted and the time remaining in the run (select View, Protocol View).
• Stop/Eject button: When the run begins, the Start button changes to ‘Stop/Eject’. To stop the run, click the Stop/Eject button.
• Pause button: While a protocol is running, the Pause button replaces the Load button above the Stop/Eject button. If you click the Pause button, the instrument pauses. To resume, click the Resume button.
• AutoRange button: If you click the AutoRange button on the Plate View screen during the reading (or when the reading is complete), the top and bottom numbers on the color scale change to match the highest and lowest readings, and the colors shown for the various results on the plate grid change accordingly.
• Update button: In Report View, you can view results already collected by clicking the Update button.
• View Data button: To view all data stored in the AutoSave file, click on the View Data button located at the bottom of the Run screen next to the Comment field. Select the file to be viewed.

2.7 Running an Assay
Analyst GT Operator's Manual – Rev. C 79
2.7.2 Reviewing Results
When reading is complete, the instrument reports the results to the host computer. The Report View screen shows the results.
Using the Auto Range Button
You can use the Plate View screen to quickly spot high and low values. The screen automatically assigns a color to each result on the plate grid. Low values are shown in red, while high values are shown in blue. (You can reverse the colors by selecting Use Inverted Color bar from the Setup menu.) Use the color scale at the right of the plate grid to determine the approximate reading. If you click the Auto Range button on the Plate View screen during the reading or when the reading is complete, the top and bottom numbers on the color scale change to match the highest and lowest readings, and the colors shown for the various results on the plate grid change accordingly. (For an example of the Plate View screen, see ., ‘Starting Up the System’.) To customize the color bar, you may manually enter minimum and maximum values and click the Update button.

2 Operating Procedures
80 Analyst GT Operator's Manual – Rev. C
Restacking the Microplates
When the system finishes a stack of plates, a dialog appears.
• If you click the Restack button, the system quickly restores the stack of plates to their original order in the input magazine.
• When you click the Continue button, the system will continue running the selected method or protocol if additional plates have been added to the input magazine.
• To exit the Stacker screen, click Cancel.

2.7 Running an Assay
Analyst GT Operator's Manual – Rev. C 81
2.7.3 Saving Results Files
The File menu provides the following options for saving files:
If you select… The AnalystHost application…
File, Save Saves current results using the current filename. If no filename is defined, then the system prompts for a new filename.
File, Save As… Prompts for a new filename for current results.
If you select Setup, AutoSave, the following dialog box appears.
If you select… The AnalystHost application…
AutoSave Results Save to separate files
Prompts for a new file name at beginning of next read.*
AutoSave Results Save to separate files
Filename: c:filename.txt
Automatically appends microplate report to the end of current file with name ‘filename.txt.’
AutoSave Results Save to separate files
Filename: c:filenamebarcode.txt
Saves one microplate report per file without prompting user. Concatenates (joins) filename and barcode string or plate ID.
*Note: Do not use this option if you are collecting kinetic data, as the plate will stop reading after the first read and wait for you to specify a new file name to save the data to. It is recommended to always select AutoSave Results with kinetic reads.
Note: If AutoSave Results is not checked but multiple reads are performed without saving, the data will still be visible in Report view and can all be saved by selecting Save or Save As.

2 Operating Procedures
82 Analyst GT Operator's Manual – Rev. C
If you select ‘Save to separate files’ the following dialog box appears.
Index using Barcode: Names each saved result file the barcode number read from the side of the plate. Only instruments with stackers contain a barcode reader.
Index using Plate Counter: Names each saved result file the number of the plate read (from the Plate Counter).
A unique file name can be given in each of the above circumstances and you may choose whether the filename will come before or after the barcode or plate number.
Example: Suppose a plate is barcoded with . You check AutoSave Results and Save to separate files, Index using: Barcode and Index position: Suffix. Then you enter ‘kinaseassay’ for the filename. The results will be saved under the filename ‘kinaseassay.txt’.

Analyst GT Operator's Manual – Rev. C 83
3 Performance Verification
Part provides the following procedures:
• .: Verifying Detector Performance
• ..: Method for Fluorescence Intensity Verification
• ..: Method for Fluorescence Polarization Verification
• ..: Method for TRF Verification
• .: Verifying Plate Formats
3.1 Verifying Detector Performance
The performance of the instrument can be compared to published specifications for the F and FP modes by determining the lower detection limits (LDL) for fluorescein and for TRF mode by determining the LDL of EuCl (europium chloride). This section provides two suggested protocols.
Filters and Dichroic Mirrors
F and FP Modes: For performance verification in the F and FP modes, the system includes an optimized set of fluorescein filters and a fluorescein dichroic mirror. When the instrument is shipped, the fluorescein filters are installed in the filter wheels and the fluorescein dichroic mirror is installed in the top optics head.
TRF Mode: For performance verification in the TRF mode, an optimized set of europium filters and a europium dichroic mirror can be purchased from Molecular Devices Corp.

3 Performance Verification
84 Analyst GT Operator's Manual – Rev. C
3.1.1 Method for Fluorescence Intensity Verification
Materials
• Any low fluorescence buffer, pH .–. (e.g., PBS or Tris) • Costar black -, -, or Greiner, black -well plates • Sodium fluorescein stock solution • Polypropylene tubes • Multichannel pipet • Multichannel basin(s), e.g., Monoblock
1 Prepare a 1:3 dilution series. Start at . nM and serially dilute to . pM. Prepare dilu-tions in polypropylene tubes, and then transfer them from multichannel basin(s) to the microplate using a multichannel pipet. Pipet replicates of at least at each concentration. The following is a suggested template:
1 2 3 4 5 6 7 8 9 10 11 12 A B C Buffer 0.5 1.5 4.5 13.5 40.5 121.5 364.5 1.09 3.28 9.84 29.5 D pM pM pM pM pM pM pM nM nM nM nM E F G H
200 µL/well for 96-well plate 80 µL/well for 384-well plate 10 µL/well for 1536-well plate
2 Read plate. Create a fluorescence intensity method using fluorescein excitation/emission filters with fluorescein dichroic mirror, continuous lamp, plate format selected as appropriate, z-height set to Middle, top read, maximum integration time set to , µsec, target CV at %, units set to CPS, and attenuator set to Out.
Note: If signal is >200,000,000 at 29.5 nM fluorescein, reread the plate with the attenuator set to Medium and use the new read data for analysis.
3 Analyze data. Use Microsoft Excel, SoftMax Pro, or equivalent spreadsheet program.
a Calculate the average, standard deviation, and coefficient of variation for each set of sample replicate readings.
b Subtract average background (buffer reading) from each sample value.
c Plot concentration versus averaged background-subtracted sample values on a log-log plot.
d For determination of the fluorescein lower detection limit (LDL), calculate a linear regression using non-saturated readings and forcing the origin through zero.

3.1 Verifying Detector Performance
Analyst GT Operator's Manual – Rev. C 85
e From the equation of the line, determine the LDL as the concentration that is three times the background standard deviation. Example equation used:
LDL = TREND($AF$:$AF$, AH:AH, AH, FALSE)
This equations returns LDL in pM where:
• $AF$:$AF$ = range of concentrations in pM • AH:AH = range of background-subtracted values • AH = value for three times the background standard deviation • FALSE forces line through zero
Note: The LDL for Fluorescence intensity mode should be less than or equal to 5 pM.
f The R^ value indicates the goodness of a linear fit. If the fit is poor, the R^ value will be far different from .. Calculate R^ for the curve fit using the following equation:
R^ = INDEX[LINEST($AF$:$AF$, AH:AH, FALSE, TRUE), , ]
• $AF$:$AF$ = the range of concentrations • AH:AH = range of background-subtracted values • FALSE forces line through zero • TRUE reports statistics • specifies the row for the R^ value in the statistics table • specifies the column for the R^ value in the statistics table

3 Performance Verification
86 Analyst GT Operator's Manual – Rev. C
3.1.2 Method for Fluorescence Polarization Verification
Materials
• Any low fluorescence buffer, pH .–. (e.g., PBS or Tris) • Costar or Greiner black -, -, or -well plate • Sodium fluorescein stock solution • Polypropylene tubes • Multichannel pipet • Multichannel basin(s), e.g., Monoblock
1 Prepare a 1:3 dilution series. Start at . nM and serially dilute to .. Prepare dilutions in polypropylene tubes and then transfer them from multichannel basin(s) to the microplate using a multichannel pipet. Pipet replicates of at least at each concentration. The following is a suggested template:
1 2 3 4 5 6 7 8 9 10 11 12 A B C Buffer 0.5 1.5 4.5 13.5 40.5 121.5 364.5 1.09 3.28 9.84 29.5 D pM pM pM pM pM pM pM nM nM nM nM E F G H
200 µL/well for 96-well plate 80 µL/well for 384-well plate 10 µL/well for 1536-well plate
2 Read plate. Create a Fluorescence Polarization method using fluorescein excitation/emission filters with fluorescein dichroic mirror, continuous lamp, top read, plate format set as appropriate, z-height set to Middle, maximum integration time set to , µsec, mP standard deviation set to , units set to CPS, and attenuator set to Out.
3 Analyze data to calculate G factor. Use Microsoft Excel, SoftMax Pro, or equivalent spreadsheet program. Assume free fluorescein has a value of mP (millipolarization units).
a Calculate the average buffer reading for both the parallel and perpendicular raw data.
b Subtract the respective average background from all parallel and perpendicular data.
c Choose the concentration of fluorescein (for example, . nM) that reports values approximately ten times the background signal for both parallel and perpendicular raw data (this will be the concentration used to calculate the G factor).
d Calculate the G factor using the following formula
G factor = S/P*(-/)/(+/)
where S and P are background-subtracted intensity measurements for the parallel and perpendicular components at a selected concentration, and is the assumed mP value for free fluorescein. The G factor is typically in the range of . to ..
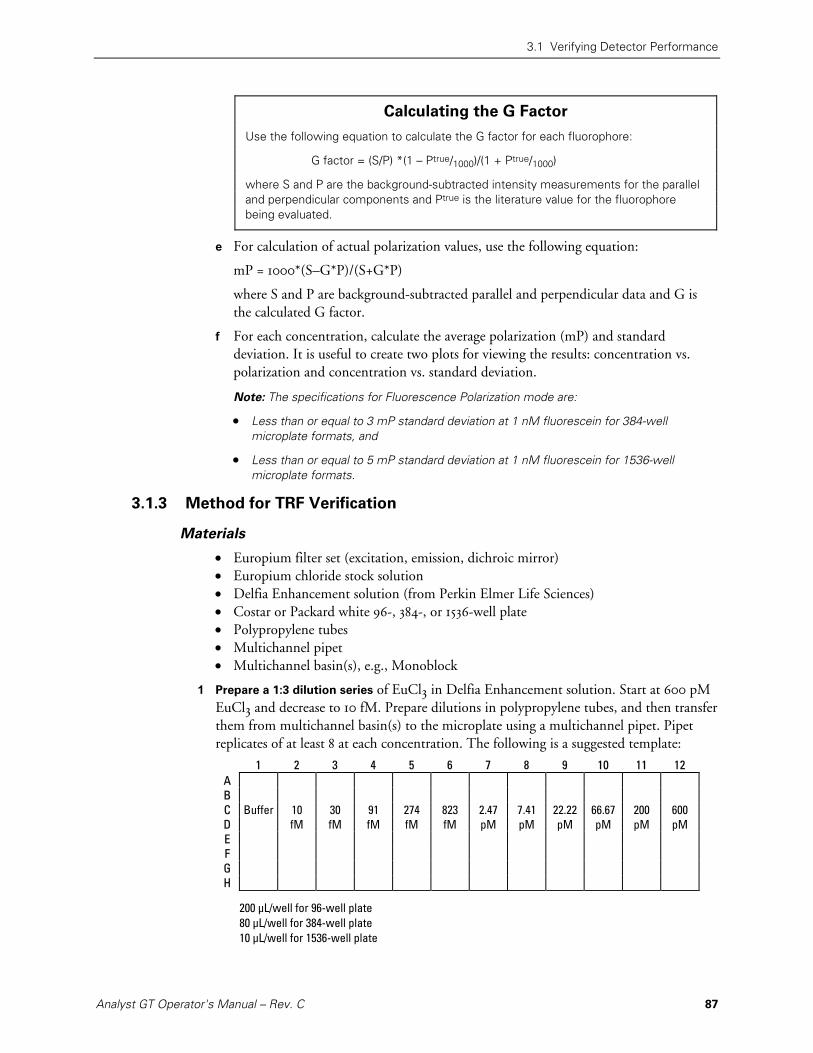
3.1 Verifying Detector Performance
Analyst GT Operator's Manual – Rev. C 87
Calculating the G Factor
Use the following equation to calculate the G factor for each fluorophore:
G factor = (S/P) *(1 – Ptrue/1000)/(1 + Ptrue/1000)
where S and P are the background-subtracted intensity measurements for the parallel and perpendicular components and Ptrue is the literature value for the fluorophore being evaluated.
e For calculation of actual polarization values, use the following equation:
mP = *(S–G*P)/(S+G*P)
where S and P are background-subtracted parallel and perpendicular data and G is the calculated G factor.
f For each concentration, calculate the average polarization (mP) and standard deviation. It is useful to create two plots for viewing the results: concentration vs. polarization and concentration vs. standard deviation.
Note: The specifications for Fluorescence Polarization mode are:
• Less than or equal to 3 mP standard deviation at 1 nM fluorescein for 384-well microplate formats, and
• Less than or equal to 5 mP standard deviation at 1 nM fluorescein for 1536-well microplate formats.
3.1.3 Method for TRF Verification
Materials
• Europium filter set (excitation, emission, dichroic mirror) • Europium chloride stock solution • Delfia Enhancement solution (from Perkin Elmer Life Sciences) • Costar or Packard white -, -, or -well plate • Polypropylene tubes • Multichannel pipet • Multichannel basin(s), e.g., Monoblock
1 Prepare a 1:3 dilution series of EuCl in Delfia Enhancement solution. Start at pM EuCl and decrease to fM. Prepare dilutions in polypropylene tubes, and then transfer them from multichannel basin(s) to the microplate using a multichannel pipet. Pipet replicates of at least at each concentration. The following is a suggested template:
1 2 3 4 5 6 7 8 9 10 11 12 A B C Buffer 10 30 91 274 823 2.47 7.41 22.22 66.67 200 600 D fM fM fM fM fM pM pM pM pM pM pM E F G H
200 µL/well for 96-well plate 80 µL/well for 384-well plate 10 µL/well for 1536-well plate

3 Performance Verification
88 Analyst GT Operator's Manual – Rev. C
2 Read plate. Create a TRF method using europium excitation/emission filters with europium dichroic mirror, top read, plate format selected as appropriate, z-height set to Middle, flashes, delay of µsec, integration time per flash µsec, flash interval set to × msec, flash lamp voltage set to , raw data units set to Counts, and attenuator set to Out.
3 Analyze data. Use Microsoft Excel, SoftMax Pro, or equivalent spreadsheet program.
a Calculate the average, standard deviation, and coefficient of variation for each set of sample replicate readings.
b Subtract average background (buffer reading) from each average sample value.
c Plot concentration versus averaged background-subtracted sample values on a log-log plot.
d For determination of the europium lower detection limit (LDL), calculate a linear regression using nonsaturated readings (signals < , counts) and forcing the line through zero.
e From the equation of the line, determine the LDL as the concentration that is three times the background standard deviation. Example equation used:
LDL = TREND($AF$:$AF$, AH:AH, AH, FALSE)
This equations returns LDL in pM where:
• $AF$:$AF$ = range of concentrations in pM • AH:AH = range of background-subtracted values • AH = value for three times the background standard deviation • FALSE forces line through zero
Note: The LDL (lower detection limit) for TRF mode should be:
• Less than or equal to 250 fM for 96- and 384-well microplate formats, and
• Less than or equal to 500 fM for 1536-well microplate formats.
f The R^ value indicates the goodness of a linear fit. If the fit is poor, the R^ value will be far different from .. Calculate R^ for the curve fit using the following equation:
R^ = INDEX[LINEST($AF$:$AF$, AH:AH, FALSE, TRUE), , ]
• $AF$:$AF$ = the range of concentrations • AH:AH = range of background-subtracted values • FALSE forces line through zero • TRUE reports statistics • specifies the row for the R^ value in the statistics table • specifies the column for the R^ value in the statistics table

3.2 Verifying Plate Formats
Analyst GT Operator's Manual – Rev. C 89
3.2 Verifying Plate Formats
Plate formats provided in the software or from plate manufacturers are often nominal values that may vary from lot to lot. This variation can impact assay performance, especially in high density formats such as -well microplates. The following is a visual procedure to check for plate alignment issues.
1 Remove the right-side instrument panel. See ., ‘Panel Removal and Replacement’.
2 Remove the light-tight hatch cover. This is the area in which you observe plate alignment. It may be necessary to rotate the instrument and have a step stool nearby to aid in visualizing the read chamber.
3 Switch the instrument on. Once the system has been initialized, launch the AnalystHost application.
4 Prepare a new fluorescence intensity detection method with the following parameters:
• Optics: Top, Continuous Lamp • Plate format: Matches the plate to be evaluated • Select wells: A and the other three corners of plate (e.g., A, AF, and AF) • Z-Height: Middle • Raw Data Units: Counts/Sec • Filters: Fluorescein excitation and emission (also use the fluorescein dichroic in the
top optics head) • Maximum Integration Time: ,, µsec • Target CV per well: blank • Attenuator mode: Out • Polarizers: None • Plate Agitation: None • Plate Settling Time: • Kinetic Timing: Hold in darkness ; Wait between reads , Number of reads .
5 Place a plate in the gripper or input stacker (if stacker is enabled).
Note: This alignment procedure works best with empty black or white plates.
6 On the Run screen, select the new fluorescence intensity detection method that was prepared above.
7 Click the Start button and look inside the reading chamber.
The system moves the plate into the instrument, positions the plate so that well A is under the light beam for two seconds, and then moves the plate so each of the other three plate corners is under the light beam.
What to look for:
• Good plate alignment: The blue light beam should almost disappear into the assay well and appear as a faint blue glow.
• Poor plate alignment: The appearance of a bright blue glow on the edge of well.
While you are observing the plate, for each of the corner wells, make a note of the well areas that have the bright blue glow.
8 Make modifications to the plate format. Plate formats preinstalled on the instrument are not editable by the user. Thus, you will have to make a copy of the plate format.

3 Performance Verification
90 Analyst GT Operator's Manual – Rev. C
a From the Plate menu, select Copy, select the appropriate plate format, then type in a name for the new plate format.
b In the newly created plate format, make minor changes to the row and column offsets as needed to center the light beam within well A.
c Go back and edit the detection method to contain this newly defined plate format.
9 Repeat observation process by clicking the Start button. It may require several iterations of modifying the plate format and repeating the visualization process.
10 Once you have the light beam centered in well A, verify that it is also centered on the other three corners. If it is not, you may need to modify the row or column spacing values and again repeat the visualization process.
11 Once you are satisfied with the alignment in the four corners, you may want to go back to the Select Wells section of the detection method and add a few additional wells around the plate. Check again to make sure alignment is satisfactory.
12 Replace the light-tight cover and right-hand side panel.

Analyst GT Operator's Manual – Rev. C 91
4 Maintenance Procedures
Part provides instructions for the following:
• .: Preventive Maintenance
• .: Cleaning the Instrument
• .: Panel Removal and Replacement
• .: Filter Removal and Replacement
• ..: Filter Wheel Removal and Replacement
• ..: Filter Cartridge Removal and Replacement
• ..: Installing Filters in Cartridges
• .: Dichroic Mirror Removal and Replacement
• .: Continuous Lamp Removal and Replacement
• .: Flash Lamp Removal and Replacement
• .: Setting the Luminescence Aperture

4 Maintenance Procedures
92 Analyst GT Operator's Manual – Rev. C
4.1 Preventive Maintenance
Analyst systems have been designed to provide high availability in high-throughput screening environments. High availability can be achieved only if preventive maintenance schedules are followed (to maximize uptime) and if service personnel and adequate spare parts inventories are available to minimize down time. Furthermore, proper preventive maintenance schedules and procedures must be followed or the lifetime of the mechanical systems will be reduced.
Recommended preventive maintenance service intervals are given below.
Usage per Week (hours) Service Interval
– year – months > months
The number of readings between services should never exceed , microplates.
To check the total number of load/eject cycles performed by the instrument, select Plates from the Status menu. Keep a log to help plan preventive maintenance. Call Molecular Devices customer support when it is necessary to schedule preventive maintenance.
4.2 Cleaning the Instrument
Periodically wipe down the exterior surfaces of the instrument with a soft, damp cloth. A soap solution such as Formula , plain water, alcohol, or a % bleach solution can be used to dampen the cloth.
Caution: Always turn instrument power off before cleaning. Do not spray cleaning solutions into vents or open mechanisms, and do not pour cleaning fluid directly onto the instrument.

4.3 Panel Removal and Replacement
Analyst GT Operator's Manual – Rev. C 93
4.3 Panel Removal and Replacement
One or more panels must be removed during certain maintenance and service procedures. If the top panel must be removed, it is easiest to remove one of the side panels first.
To Remove:
1 Switch off power and unplug instrument.
2 Remove side panel. Grip the top edge of the side panel and pull it down then away from the instrument.
FAULT
SERVICE
POWER
Start Reset LampLoad/Eject
Analyst GTMULTIMODE READER
Left Side Panel Removal
Note: Remove the right panel in the same manner as the left panel.
3 Remove control panel. With a Phillips screwdriver, loosen the captive screw that secures the control panel to the top panel. Lift control panel off of top panel.

4 Maintenance Procedures
94 Analyst GT Operator's Manual – Rev. C
4 Remove top panel. Push up on the edges of the top panel until it disengages from its fasteners.
Analyst GTMULTIMODE READER
Top Panel Removal
To Replace:
Reverse removal procedure.

4.4 Filter Removal and Replacement
Analyst GT Operator's Manual – Rev. C 95
4.4 Filter Removal and Replacement
The excitation and emission filters are housed in cartridges in two filter wheel assemblies. Mechanically, these assemblies are identical; however, they are not interchangeable. To remove a filter, you must first remove one or more outside panels and then remove the appropriate filter wheel.
4.4.1 Filter Wheel Removal and Replacement
To Remove:
1 Switch off power and unplug instrument.
2 Remove panels and control panel as needed. See ., ‘Panel Removal and Replacement’. The excitation filter wheel is accessible by removing the top panel of the instrument, the emission filter wheel by removing the left side panel.
3 Unplug the drive motor connector attached to the wheel assembly.
4
5
UnplugConnector
Captive Screws
Filter Wheel Assembly Removal
4 Loosen two captive screws on the top of the wheel assembly with a flat-head screwdriver.
5 Pull wheel assembly out of the instrument.
Caution: Do not touch the optical surfaces of the filters.
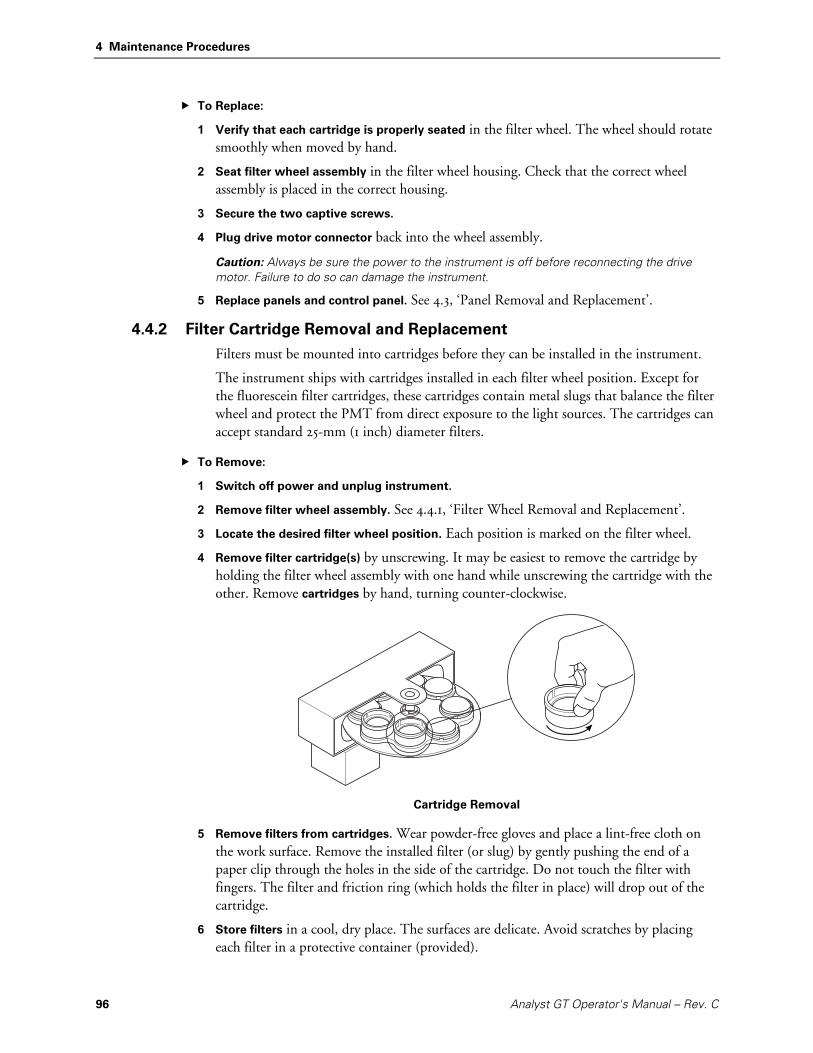
4 Maintenance Procedures
96 Analyst GT Operator's Manual – Rev. C
To Replace:
1 Verify that each cartridge is properly seated in the filter wheel. The wheel should rotate smoothly when moved by hand.
2 Seat filter wheel assembly in the filter wheel housing. Check that the correct wheel assembly is placed in the correct housing.
3 Secure the two captive screws.
4 Plug drive motor connector back into the wheel assembly.
Caution: Always be sure the power to the instrument is off before reconnecting the drive motor. Failure to do so can damage the instrument.
5 Replace panels and control panel. See ., ‘Panel Removal and Replacement’.
4.4.2 Filter Cartridge Removal and Replacement
Filters must be mounted into cartridges before they can be installed in the instrument.
The instrument ships with cartridges installed in each filter wheel position. Except for the fluorescein filter cartridges, these cartridges contain metal slugs that balance the filter wheel and protect the PMT from direct exposure to the light sources. The cartridges can accept standard -mm ( inch) diameter filters.
To Remove:
1 Switch off power and unplug instrument.
2 Remove filter wheel assembly. See .., ‘Filter Wheel Removal and Replacement’.
3 Locate the desired filter wheel position. Each position is marked on the filter wheel.
4 Remove filter cartridge(s) by unscrewing. It may be easiest to remove the cartridge by holding the filter wheel assembly with one hand while unscrewing the cartridge with the other. Remove cartridges by hand, turning counter-clockwise.
Cartridge Removal
5 Remove filters from cartridges. Wear powder-free gloves and place a lint-free cloth on the work surface. Remove the installed filter (or slug) by gently pushing the end of a paper clip through the holes in the side of the cartridge. Do not touch the filter with fingers. The filter and friction ring (which holds the filter in place) will drop out of the cartridge.
6 Store filters in a cool, dry place. The surfaces are delicate. Avoid scratches by placing each filter in a protective container (provided).

4.4 Filter Removal and Replacement
Analyst GT Operator's Manual – Rev. C 97
7 Update filter names. If a filter (or slug) has been removed from the filter wheel, select Edit Filter Names from the Setup menu in the AnalystHost application and update the filter names once the instrument and AnalystHost application are running.
To Replace:
1 Install filter in empty cartridge. See .., ‘Installing Filters in Cartridges’.
2 Locate the filter wheel position for the desired filter. Each position is marked on the filter wheel.
3 Install filter cartridge(s) by screwing in clockwise. It may be easiest to install the cartridge by holding the filter wheel assembly with one hand while screwing the cartridge with the other.
Caution: Do not leave open positions in the filter wheels. Each filter position should contain either a filter or a metal slug to balance the filter wheel and protect the PMT from direct exposure to the light sources.
4 Note changes in installed filters on the label on top of the assembly.
5 Install filter wheel assembly. See .., ‘Filter Wheel Removal and Replacement’.
6 Replace panels and control panel as needed. See ., ‘Panel Removal and Replacement’.
7 Reconnect power cord and switch on power.
8 Update filter names. Select Edit Filter Names from the Setup menu and update the filter names (see .., ‘Entering Names for Filters and Dichroic Mirrors’).
Important! To avoid errors, always update filter names immediately after changing filters.
4.4.3 Installing Filters in Cartridges
Use the following procedure when installing filters into cartridges.
1 Place filter in empty cartridge, noting filter orientation.
Note: Many filters have a specific orientation with respect to the light source. The mirrored surface should face the light source.
• If an arrow is present on the rim of the filter, be sure the arrow points away from the light source (in the direction of the light path).
• If there is no arrow, the top of the letters on the rim should be oriented away from the light source.
• If you have a question about orientation, phone the filter vendor for assistance.
2 Place funnel on top of cartridge. The funnel is used to compress the friction ring.
3 Place friction ring and then metal slug in funnel.

4 Maintenance Procedures
98 Analyst GT Operator's Manual – Rev. C
Friction Ring
Filter
Cartridge
SlugFrictionRing
Press Friction Ring with Slug Through Funnel
Funnel
Cartridge
Place Filter inCartridge
Filter
Cartridge
Filter Installation in Cartridge
4 Push metal slug down through the funnel to compress the friction ring. The friction ring should fit snugly against the filter.
5 Remove the funnel and slug.
6 Reinstall the cartridge. See .., ‘Filter Cartridge Removal and Replacement’.

4.5 Dichroic Mirror Removal and Replacement
Analyst GT Operator's Manual – Rev. C 99
4.5 Dichroic Mirror Removal and Replacement
Dichroic mirrors are installed in the instrument in the top and bottom optics heads. The dichroic mirror holder is identical for the top and bottom optics and can be used interchangeably.
To Remove:
1 Switch off power and unplug instrument.
2 Remove right side panel. See ., ‘Panel Removal and Replacement’.
3 Remove enclosure hatch. Loosen two knurled thumbscrews and then remove the light-tight enclosure hatch.
4 Locate the top or bottom dichroic mirror with a flashlight. The handles are at a -degree angle to each other. To view the bottom dichroic mirror, you may need to manually push the plate gripper out of the way (out of the instrument).
5 Remove dichroic mirror by grasping the handle and pulling it out of the instrument. Take care not to touch the surface of the mirror.
6 Store dichroic mirror in a cool, dry place. The surfaces are delicate. Avoid scratches and dust accumulation by placing each dichroic mirror in a protective container (provided).
Dichroic Mirror Removal

4 Maintenance Procedures
100 Analyst GT Operator's Manual – Rev. C
To Replace:
1 Insert new dichroic mirror. Note that the holder is asymmetrical and will only seat in the instrument one way. Push the dichroic mirror in as far as possible.
2 Replace the enclosure hatch and right side panel.
3 Reconnect power cord and switch on power.
4 Update dichroic mirror names as needed. If the installed dichroic mirror is new, then select Edit Filter Names from the Setup menu and enter the name of the new dichroic mirror (see .., ‘Entering Names for Filters and Dichroic Mirrors’).
Note: Once a dichroic mirror has been identified to the AnalystHost application, then the instrument will automatically detect that mirror whenever it is installed in the future and report the dichroic mirror name in the Filters dialog window. Each dichroic mirror is equipped with magnets that the instrument can detect and translate into a discrete data bit. Up to 32 dichroic mirrors can be entered and identified.

4.6 Continuous Lamp Removal and Replacement
Analyst GT Operator's Manual – Rev. C 101
4.6 Continuous Lamp Removal and Replacement
The continuous lamp has an expected life of hours. The lamp life threshold is hours. When the threshold is reached, the instrument alerts the user by issuing a service condition (the service light on the control panel comes on). Use the following procedure to replace the continuous lamp.
To Remove:
1 Switch off power and unplug instrument.
2 Remove control panel, right panel, and top panel. See ., ‘Panel Removal and Replacement’.
3 Loosen four captive screws on lamp housing cover. Remove metal cover.
4 Remove continuous lamp core from the lamp housing using the holding tabs.
Warning: Handle with care. If the lamp has been on recently, then there are metal parts that can be very hot.
Lamp CoreAlignment Notch FLASH LAMP
CONTINUOUS LAMP
Continuous Lamp Replacement
To Replace:
1 Insert new lamp core into housing. The arrows on the module indicate the direction of light travel. Make sure that the new lamp module is positioned properly.
Note: There is only one position for the lamp core that allows the lamp to be fully inserted into its housing.
2 Tighten four screws on lamp housing cover.
3 Replace top panel, side panel, and control panel.
4 Reconnect power cord and switch on power.
5 Update lamp status. Using the AnalystHost application, reset the lamp status by selecting Lamps from the Status menu. See ., ‘Lamp and Plate Status’.

4 Maintenance Procedures
102 Analyst GT Operator's Manual – Rev. C
4.7 Flash Lamp Removal and Replacement
If the flash lamp is not firing rhythmically, if it stops firing during a read, or has a quieter sound than usual, the lamp may require replacement. Use the following procedure to replace the flash lamp.
To Remove:
1 Switch off power and unplug instrument.
2 Remove control panel, right panel, and top panel. See ., ‘Panel Removal and Replacement’.
3 Loosen four captive screws on lamp housing cover and remove the metal cover.
4 Unscrew and completely remove the single large vertical thumbscrew retaining the flash lamp holder. A spring is attached to, and comes out with, the thumbscrew.
Caution: Do not touch the central alignment screw (which looks like a brass gear).
5 Slide flash lamp holder up and out. The Litepac and wiring are attached to the rear of the flash lamp holder and remain attached to the instrument.
6 Separate the Litepac and wiring from the flash lamp holder by loosening the two captive screws at the front of the lamp. The black cover comes free from the metal Litepac box.
7 Unplug the old flash lamp from the Litepac by pulling the bulb straight out
Warning! Handle with care. If the lamp has been on recently, then the bulb and metal parts can be very hot.
Bracket
Screws (2)
Bulb
Mount
Thumb Screw
Alignment Notch FLASH LAMP
CONTINUOUS LAMP
Captive Screws (4)

4.7 Flash Lamp Removal and Replacement
Analyst GT Operator's Manual – Rev. C 103
To Replace:
1 Plug the new flash lamp into the Litepac, taking care not to touch the glass surface of the bulb at any time. Latex gloves are recommended since oils from your hand on the glass surface will decrease the life of the lamp.
2 Reattach the black flash lamp holder to the metal Litepac box by tightening the two captive screws at the front of the lamp. Be sure the wiring comes out the top and rear of the assembly.
3 Slide the flash lamp holder back down into its space.
4 Replace the thumbscrew with spring attached. Tighten with hands until finger-tight.
5 Replace lamp housing cover. Screw four screws into lamp housing cover with hands until finger-tight.
6 Replace top panel, side panel, and control panel.
7 Reconnect power cord and switch on power.

4 Maintenance Procedures
104 Analyst GT Operator's Manual – Rev. C
4.8 Setting the Luminescence Aperture
The luminescence aperture must be set manually for either /-well or -well op-eration. A sensor automatically determines the aperture position and reports a message if the incorrect aperture is chosen for the plate format being read.
1 Switch off power and unplug instrument.
2 Remove right side panel. See section ., ‘Panel Removal and Replacement’.
3 Remove light-tight enclosure hatch.
4 Locate the top optics head with a flashlight. The aperture handle is to the left of the top optics dichroic mirror.
5 Set the aperture.
• For /-well operation, grasp the aperture handle and push it to the left.
• For -well operation, push it to the right.
6 Replace the hatch and panel.
7 Reconnect power cord and switch on power.
Move Aperture Lever Right for 1536-Well PlateMove Aperture
Lever Left for 96/384-Well Plate
Setting the Luminescence Aperture
Note: The position of the luminescence aperture has no effect on reads done in the other modes (absorbance, fluorescence intensity, fluorescence polarization, or time-resolved fluorescence).

Analyst GT Operator's Manual – Rev. C 105
5 Troubleshooting
Part provides information about error conditions and troubleshooting.
• .: Operation and Error Codes
• .: Service Conditions
• .: Fault Conditions
• .: Troubleshooting Guide
5.1 Operation and Error Codes
The AnalystHost application displays operation and error messages during run time. Transient operating status indicators appear only when the event occurs. Other status indicators appear when the event occurs and are reset when the operator reboots the system.
5.2 Service Conditions
An audible alarm and the control panel amber SERVICE light indicate a service condition. The instrument will continue to operate normally.
Display Comment
Optics module*Lamp module*continuous
Continuous lamp has exceeded threshold limit. A new lamp should be readily available for replacement.
5.3 Fault Conditions
All faults are announced with an audible alarm and the control panel red FAULT light. When a fault occurs, a message appears on the control panel with a short descriptor. In addition, a more complete error message appears on the monitor. To clear a fault condition, take corrective action, then reset the instrument. In all cases, if the problem persists, contact your Molecular Devices technical support representative.
Note: In the event of a fault condition, please record the exact error messages appearing on the monitor and control before resetting the instrument. This information will be requested if technical support assistance is required.

5 Troubleshooting
106 Analyst GT Operator's Manual – Rev. C
5.4 Troubleshooting Guide
This section provides guidelines for diagnosing and resolving problems that can occur while running assays.
5.4.1 Data Problems
High Background
Possible Causes Recommended Actions
Filter may be cracked or damaged.
Visually inspect filters for physical damage or discoloration.
Filter set is poorly chosen (incorrect wavelength, emission overlapping excitation).
Make sure filters in the filter wheel correspond to filter names in software. Obtain and study filter spectra to determine appropriateness.
Incorrect dichroic mirror inserted. Insert correct dichroic mirror in the read head being used. Install correct dichroic mirror.
High background plates used. Read an empty plate to determine its contribution to background.
Buffer is fluorescent. Try several different buffers to identify one with low background (<1/10 signal of positive wells).
Method settings are not optimized.
Check User’s Manual for suggested settings.
Reading plates with lid or plate sealer on.
Remove lid or sealing tape before reading plate from the top.
Same Signal in All Wells
Possible Causes Recommended Actions
PMT appears saturated because units displayed as counts.
Change units to counts/sec or to RFU.
PMT is saturated because signal is extremely high in wells.
Choose medium attenuator in Method set up or use less fluorophore in the wells so signal is below 200 million counts/sec.

5.4 Troubleshooting Guide
Analyst GT Operator's Manual – Rev. C 107
Low Signal
Possible Causes Recommended Actions
Not enough label is added. Use a titer of labeled molecule that yields signal of approximately 1 million counts/sec.
Fluorophore is sensitive to buffer pH.
Adjust pH of reaction mixture.
Quenching may occur with over-labeling.
Use a molecule labeled with fewer fluorophores.
Incorrect software settings. Check method to make sure that the attenuator is out, integration time is long enough, plate format matches plate being used, and correct filters are chosen. Check User’s Manual for suggested instrumental settings.
Incorrect hardware set-up. Check filter wheels to be certain correct filters are installed and they are not damaged. Check dichroic mirror.
Label bound to the walls of the plate.
Add ~0.1% of a carrier protein such as bovine gamma globulin (BGG) to the reaction buffers or use polypropylene plates.
Lamp off. Look into right side of instrument to see if continuous lamp is on when continuous lamp is selected in a fluorescence intensity or FP mode. Install a new lamp if it is burned out.
Old lamp. Install a new lamp if it is weak.
Using the continuous lamp to excite at a wavelength <400 nm or >700 nm.
The continuous lamp is brightest at wavelengths between 400 and 700 nm. Optimize assay and settings to compensate for the low signal or use flash lamp.
Using the flash lamp to excite at a wavelength between 400-700 nm.
The continuous lamp will give higher signal than the flash lamp with fluorophores that excite between 400-700 nm.
Misaligned flash lamp. Call MDC service department.
Zero Signal
Possible Causes Recommended Actions
Reading from the bottom of an opaque plate.
Use clear bottom plates if reading from the bottom, or read from the top if using opaque plates.
Signal is very weak. In Method set up, remove attenuator if in or increase maximum integration time.

5 Troubleshooting
108 Analyst GT Operator's Manual – Rev. C
Signals Different from Historical Values
Possible Causes Recommended Actions
Instrument Method has been altered.
Check all settings in Method (including plate format, integration time, units, etc.) Be sure correct Method is chosen when plate is read.
Deviated from experimental protocol.
Double-check experimental protocol.
Different plates used. Make sure plates are the same as used previously and that the plate format chosen in the Method matches the plate type used.
Lamp changed. Signals may be much different (higher) if a new lamp was installed.
Different instrument. Raw signals will vary between different instruments due to variations in lamp intensity, filters, dichroic mirrors, etc.
New lots of reagents. Different reagent lots may yield varying signals.
Incorrect hardware settings. Check to see if correct dichroic mirror and the same filters were used, and that attenuator was in same position as previously.
Drift Across a Plate
Possible Causes Recommended Actions
Wrong plate format. Make sure plate format in Method matches plate type being used.
Pipetting errors (especially cells). Use an automated liquid handling system or a multi-channel pipettor to pipet a simple precision plate to determine if drift is due to pipetting. Rotate plate 180 degrees and reread to see if trend follows plate.
Subtraction of wrong background.
Run background wells and subtract them from the correct positive wells.
Poor plate alignment. See 3.2, ‘Verifying Plate Formats’.
Plate not sitting flat in gripper. Reseat plate in gripper correctly.
Z-height set too low for 1536-well plates.
Set z-height no lower than middle of solution in homogeneous assays.

5.4 Troubleshooting Guide
Analyst GT Operator's Manual – Rev. C 109
High % CV/Noisy Data
Possible Causes Recommended Actions
Low signal (please refer to low signal).
Refer to suggestions for increasing signal.
Pipetting imprecision (pipettes and techniques).
Make certain all pipettes are properly calibrated. Determine if liquid handling systems are pipetting correctly or if hand-pipetting small volumes may be a problem.
Poor plate alignment. See 3.2, ‘Verifying Plate Formats’.
Reaction has not reached end-point.
Reread plate at various time intervals to determine if reaction (and signal) stabilizes over time.
Air bubbles present in some wells.
Scrutinize meniscus of all wells on plate for uniformity. Optimize liquid addition to wells to avoid introducing bubbles. Centrifuge plate before reading.
Poor mixing of reagents in well. Ensure reagents are mixed (use a plate shaker or centrifuge plate after adding all reagents).
Too short of an integration time. Increase maximum integration time and/or decrease desired mP standard deviation or signal %CV.
Dirty/reused plates. Use new plates.
Using adhesive plate covers. Stray pieces of the adhesive are fluorescent and may cause high signal in some wells. Choose different plate covers.
Fluorophore sticking to the sides of the well.
Make sure all wells contain a buffer with ~0.1% carrier protein (like BGG) or use polypropylene plates.
Sub-optimum z-height setting. Set z-height to middle of the solution in homogeneous assays. Try reading near the bottom of the well for cell-based assays.
Evaporation from outer wells. Study rate of evaporation in low volume wells. Use validated plate sealers if necessary.
Outliers
Possible Causes Recommended Actions
See High % CV/Noisy Data. See suggestions for High %CV/Noisy Data.

5 Troubleshooting
110 Analyst GT Operator's Manual – Rev. C
FP Data Not As Expected
Possible Causes Recommended Actions
Incorrect G Factor. Empirically determine the G factor for each fluorophore and enter it in the correct box of the Method.
Not appropriately background-subtracted.
Subtract S and P background signals from each well before calculating mP. Use buffer background for ‘tracer only’ wells and ‘all elements except tracer’ as the background for other wells.
Saturating PMT. Study raw data to determine if signals are saturating. Reread plate using attenuator and units of counts/sec.
Signals are too low. Use a concentration of labeled molecule that yields signal of at least 100,000 counts/sec or >5 times buffer background.
Reagents not performing correctly.
Optimize the FP assay. For example, use a carrier protein such as BGG to prevent tracer from coating out on wells, make sure there is adequate size difference between the tracer and binding molecule, determine the kinetics of the reaction so that the binding is at equilibrium.
Low signal:background ratio. Aim at using enough tracer so that tracer signal is at least 5 times higher than background signal in the parallel channel.
Using different plates than normally used.
Different plates have been shown to yield not only different signals, but also different mP values.
Too much free tracer is present. Choose a level of tracer that gives at least 5 times the signal:background but not much over 1 million counts/sec in the parallel polarizer channel.
Too much free fluorophore present in the labeled tracer.
Labeled tracer should be 99% pure (<1% free fluorophore). HPLC purify tracer and characterize stability.
Checkerboard Pattern Evident in mP Data
Possible Causes Recommended Actions
Liquid handling system is introducing signal bias.
Try a different liquid handling system or hand pipet a precision plate to test.
Saturating intensity signal next to wells with low signal.
If wells give parallel signal >100 million counts/sec, reduce amount of fluorophore. Read wells by columns if previously reading by rows (or vice versa).

5.4 Troubleshooting Guide
Analyst GT Operator's Manual – Rev. C 111
High Cross-Talk
Possible Causes Recommended Actions
Using a clear plate. Use a solid black plate for fluorescence intensity and a solid white plate for TRF, absorbance, or luminescence.
Luminescence height too high. Use the lowest possible luminescence height (usually 1 mm).
Wrong aperture in Luminescence mode.
Make sure the 1536-well aperture is chosen if reading a 1536-well plate.
Pipetting errors. Make sure no contamination can occur between wells.
Reading plate from the bottom. Read the plate from the top to avoid reading through the plastic. Set z-height to 0–1 mm if desired for cell-based assays.
Using thin plates in Luminescence.
Plates thinner than the standard will be positioned farther from the read head. Use a plate at least 7 mm tall.
Using clear-bottom plate in Luminescence mode.
Clear-bottom white plates show more cross-talk in luminescence mode than solid white plates.
Cell-Based Assays with Poor Signal-to-Noise Ratio
Possible Causes Recommended Actions
Phenol red interferes with the fluorescent detection.
Dilute out phenol red or use media and buffer free of phenol red. Read from the bottom of a clear-bottom plate
Assay problems. Optimize assay for acceptable signal-to-noise ratio (for example, pipetting precision or transfection efficiency).
Z-height not optimized. Analyze signal-to-noise ratio (or signal-to-background ratio) when reading at different z-heights.

5 Troubleshooting
112 Analyst GT Operator's Manual – Rev. C
5.4.2 Software Observations
Service Conditions (Yellow Status Light)
Possible Causes Recommended Actions
Continuous lamp life low. Check to see number of hours remaining on lamp through the GUI software. Replace lamp.
Fault Conditions (Red Status Light)
Possible Causes Recommended Actions
Plate stuck in the read chamber. Shut down software and turn off instrument. Open right side panel and retrieve plate from read chamber. Restart the instrument and the software.
Plate crash due to wrong z-height or luminescence height.
Reset instrument from software or from control panel. Increase z-height or luminescence height in Method.
Lamp does not come on. Reset instrument from software or from control panel. If lamp still does not start, replace lamp.
Shuttle jammed with the cable. Shut down software and turn off instrument. Open top or left side panel and clear cable from pathway of shuttle near filter wheels.
Instrument motors unable to home at start-up.
Reset instrument from software and/or restart instrument. If Fault persists, contact MDC Customer Service.
No Communication Between Host and Instrument (Black Status Light)
Possible Causes Recommended Actions
Cable not connected properly. Verify that all connectors are secure. See 6.1.1, ‘Moving the Reader Within the Lab’.
Started AnalystHost application before the instrument was fully booted.
Shut down software and reopen once instrument is fully booted (>90 sec).
More than one copy of AnalystHost application is open.
Close all but one application of the AnalystHost application.
The instrument is off. Close software. Turn on instrument and open software once instrument is fully booted.
The instrument serial number has not been correctly entered.
In the AnalystHost application, select Setup > Instrument Serial Number, and enter the correct serial number. (See 2.2.8, ‘Specifying the Instrument Serial Number’. Then restart the AnalystHost application.

5.4 Troubleshooting Guide
Analyst GT Operator's Manual – Rev. C 113
Software Will Not Accept Changes to the Method
Possible Causes Recommended Actions
Apply or OK not clicked after changes are made
Click Apply or OK after editing the Method.
Data Not Saved
Possible Causes Recommended Actions
AutoSave not checked. Under the Setup menu, check the AutoSave box. Specify a folder to save data into.
Data was saved (AutoSaved) under a different file.
Under the File menu, choose AutoSave and see which folder data was automatically saved to.
Data was AutoSaved to a full disk in the A drive.
Use a floppy disk that is not full.
AutoSave destination file was open during data transfer after read was completed.
Make sure destination file is closed before plate read is finished.
Data Saved in the Wrong Format
Possible Causes Recommended Actions
Desired Report Format was not chosen.
Select appropriate Report Format from Setup menu prior to reading plates.

5 Troubleshooting
114 Analyst GT Operator's Manual – Rev. C
5.4.3 Hardware Observations
Barcode Not Reading
Possible Causes Recommended Actions
Barcode type/density/color/size does not meet specifications.
Use black barcode on white background and try increasing the size or decreasing the density.
Location of barcodes/barcode reader.
Make sure barcode reader on the instrument is correctly mounted to read barcodes on the side of the plate containing the barcode.
Barcode function not enabled in the software.
Under the Setup menu, enable the barcode reader or click the shortcut button to enable the barcode reader.
Stacker/Magazines Not Working Properly
Possible Causes Recommended Actions
Polypropylene plates are dropping into the stacker incorrectly.
Polypropylene plates have a smaller footprint so may not be properly handled by the stacker.
Adhesive plate covers were used resulting in glue residue sticking plates together.
Discontinue the use of adhesive plate covers if using the plate stacker.
Total mass of the plate stack exceeds the capacity of the motor.
Decrease assay volume in the wells or decrease number of plates put into the stacker at one time.
Weight of last few plates in magazine is too light.
If using ultra-thin plates, stack 2-3 empty plates on the top to add weight so they will feed correctly.
Continuous Lamp Clicks Many Times Before Starting Up
Possible Causes Recommended Actions
Old lamp. Replace lamp.
Faulty power supply. Contact MDC service department.
Unusual Flash Lamp Noise
Possible Causes Recommended Actions
Flash lamp noise not rhythmic. In Method, make sure flash lamp voltage is at 865 volts. If noise is still unusual, contact MDC service department.
Quieter flash lamp noise than usual.
Voltage is low. In Method, increase flash lamp voltage (865 volts maximum).
Continuous Lamp Not Coming On
Possible Causes Recommended Actions
Instrument powered on in a mode that does not require the continuous lamp.
Instrument starts in the mode it was shut down in. Select a mode requiring the continuous lamp (Fluorescence Intensity or FP) and press ‘Read’.
Lamp has failed. Replace lamp.

Analyst GT Operator's Manual – Rev. C 115
6 Appendices
The appendices include the following sections:
• .: Relocating the System
• .: Detection Method Parameter Cross-Reference
• .: Technical Specifications
• .: Spare Parts
• .: Selecting Filters and Dichroic Mirrors
• .: Warranty Statement
• .: Index
6.1 Relocating the System
6.1.1 Moving the Reader Within the Lab
Ensure the new location has enough space to accommodate the instrument and the computer (see ., ‘Technical Specifications, Physical Dimensions’). Allow enough space to permit access to the dichroic mirror on the right hand side of the instrument. In addition, the location should be rated to hold the weight of the system (approximately pounds).
Power off the instrument and computer. Disconnect all instrument and computer cables.
With the assistance of several people (the instrument is very heavy), the system can now be carefully moved to another location (a cart with wheels is a convenient way to do it). Do not lift by the stacker.
At the new location, position the system as before and reconnect the computer cables and plug in power cords.
Power the instrument on, followed by the computer. Once the instrument has completely initialized, launch the AnalystHost application.
The instrument can be leveled by using the four feet. Allow enough space to permit access to the filter wheels, lamps, and dichroic mirrors.

6 Appendices
116 Analyst GT Operator's Manual – Rev. C
6.1.2 Changing the Control Panel Position
The control panel can be installed on either the front or rear of the instrument. To change the control panel’s position, first turn instrument power off. Remove the connector cover over the new location, loosen the captive screw in the control panel, lift control panel straight up, and then plug the control panel in the alternate location. Secure the control panel with the captive screw. Cover the unused connector with the connector cover.
Warning! Never remove or install the control panel when the power is on. Serious damage to the instrument will result. The instrument will not work properly with two control panels installed.
6.1.3 Shipping the Instrument
Please contact your Molecular Devices Technical Support representative for proper instructions on safely shipping the instrument. An instrument shipping crate may be purchased from Molecular Devices. Moving the instrument to another location without prior instructions may void instrument warranty.

6.2 Detection Method Parameter Cross-Reference
Analyst GT Operator's Manual – Rev. C 117
6.2 Detection Method Parameter Cross-Reference
The following tables list all parameters set using the Define and Edit Detection Methods screens. For each parameter, the range of possible values is listed as well as the default value for the given detection mode.
Fluorescence (F) Range or Option Default
Method Name User-defined Default Fluorescence Method
Use as default template Checked or Unchecked Unchecked
Optics Top or Bottom Top
Lamp Continuous , Flash, or None Continuous
Plate Format Select from list 384 MDC HE PS
Select Wells All or user-specified range All
Filters, Excitation Select from list of eight 1 Fluorescein 485 nm
Filters, Emission Select from list of eight 1 Fluorescein 530 nm
Z-Height Middle, Bottom, or Set 0–7 mm
Middle
Timing
Max. Integration Time 50–2,000,000 µsec 20,000
Target CV per well 0–99% 1.00
Flash Interval* 1–100 × 2 msec (2–200 msec)
1 (2 msec)
Integration Time per Flash* 50–199,874 µsec 50
Flashes per Well* 1–1,000 1
Raw Data Units RFU, Counts, Counts/sec Counts/sec
Attenuator Mode High, Medium, or Out Medium
Polarizers None, Crossed None
Shaking Time 0–30 sec 0
Plate Settling Time 0–1,000 msec 10
Kinetic Timing
Hold in Darkness 0–3,600 sec 0
Wait Between Reads 0–28,800 sec 0
Number of Reads 1–100 1
Flash Lamp Voltage* 31–865 volts 865
*Note: To specify this parameter, the flash lamp must be selected.

6 Appendices
118 Analyst GT Operator's Manual – Rev. C
Fluorescence Polarization
(FP)
Range or Option
Default
Method Name User-defined IMAP HEFP Method
Use as default template Checked or Unchecked Unchecked
Lamp Continuous or Flash Continuous
Plate Format Select from list 384 MDC HE PS
Select Wells All or user-specified range All
G Factor 0.1–10 1
Filters, Excitation Select from list of eight 1 Fluorescein 485 nm
Filters, Emission Select from list of eight 1 Fluorescein 530 nm
Z-Height Middle, Bottom, or Set 0–7 mm
Middle
Timing
Max. Integration Time 50–25,000,000 µsec 20,000
Target SD per well 0–50 mP 3.00
Flash Interval* 1–100 × 2 msec (2–200 msec)
1 (2 msec)
Integration Time per Flash* 50–199,874 µsec 50
Flashes per Well* 1–1,000 1
Raw Data Units RFU, Counts, Counts/sec Counts/sec
Attenuator Mode High, Medium, or Out Out
Shaking Time 0–30 sec 0
Plate Settling Time 0–1,000 msec 10
Kinetic Timing
Hold in Darkness 0–3,600 sec 0
Wait Between Reads 0–28,800 sec 0
Number of Reads 1–100 1
Flash Lamp Voltage* 31–865 volts 865
*Note: To specify this parameter, the flash lamp must be selected.

6.2 Detection Method Parameter Cross-Reference
Analyst GT Operator's Manual – Rev. C 119
Time-Resolved Fluorescence
(TRF)
Range or Option
Default
Method Name User-defined Default TRF Method
Use as default template Checked or Unchecked Unchecked
Optics Top or Bottom Top
Lamp Flash Flash
Plate Format Select from list 384 MDC HE PS
Select Wells All or user-specified range All
Filters, Excitation Select from list of eight 2
Filters, Emission Select from list of eight 2
Z-Height Middle, Bottom, or Set 0–7 mm
Middle
Timing
Max. Integration Time NA NA
Target CV per well 0–99% 1.00
Flash Interval 1–100 × 2 msec (2–200 msec)
1 (2 msec)
Delay After Flash 0–32,767 µsec 200 µsec
Integration Time per Flash 50–199,839 µsec 1,000
Flashes per Well 1–1,000 100
Raw Data Units RFU, Counts, Counts/sec Counts/sec
Attenuator Mode High, Medium, or Out Out
Shaking Time 0–30 sec 0
Plate Settling Time 0–1,000 msec 10
Kinetic Timing
Hold in Darkness 0–3600 sec 0
Wait Between Reads 0–28,800 sec 0
Number of Reads 1–100 1
Flash Lamp Voltage 31–865 volts 865

6 Appendices
120 Analyst GT Operator's Manual – Rev. C
Luminescence (L) Range or Option Default
Method Name User-defined Default Luminescence Method
Use as default template Checked or Unchecked Unchecked
Plate Format Select from list 384 Corning PS
Select Wells All or user-specified range All
Luminescence Height Set 0.5–7 mm 1
Timing
Max Integration Time 50–2,000,000 µsec 100,000
Target CV per well 0–99% 1.00
Raw Data Units RLU, Counts, Counts/sec Counts/sec
Attenuator Mode Medium or Out Out
Shaking Time 0–30 sec 0
Plate Settling Time 0–1,000 msec 10
Kinetic Timing
Hold in Darkness 0–3,600 sec 0
Wait Between Reads 0–28,800 sec 0
Number of Reads 1–100 1

6.2 Detection Method Parameter Cross-Reference
Analyst GT Operator's Manual – Rev. C 121
Absorbance (A) Range or Option Default
Method Name User-defined Default Absorbance Method
Use as default template Checked or Unchecked Unchecked
Lamp Continuous or Flash Continuous
Filters, Excitation Select from list of eight 1 Fluorescein 485 nm
Plate Format Select from list 384 Corning PS
Select Wells All or user-specified range All
Z-Height Middle, Bottom, or Set 0–7 mm
Middle
Timing
Max. Integration Time 50–2,000,000 µsec 10,000
Flash Interval* 1–100 × 2 msec (2–200 msec)
50 (100 msec)
Flashes per Well* 1–1,000 1
Shaking Time 0–30 sec 0
Plate Settling Time 0–1,000 msec 200
Kinetic Timing
Hold in Darkness 0–3,600 sec 0
Wait Between Reads 0–28,800 sec 0
Number of Reads 1–100 1
OD Offset 0-4 0
*Note: To specify this parameter, the flash lamp must be selected.

6 Appendices
122 Analyst GT Operator's Manual – Rev. C
Multi-Method Range or Option Default
Name User-defined Default MultiMethod
Use as default template Checked or Unchecked Unchecked
Type 1 FP, F, TRF, L ,or A TRF
Method 1 User-selected Default TRF Method
Type 2 FP, F, TRF, L, or A TRF
Method 2 User-selected Default TRF Method
Plate Format Select from list 384 MDC HE PS
Select Wells All or user-specified range All
Reporting
Raw Data Checked or unchecked Checked
Raw Data Units Counts, Counts/sec, or Intensity
Counts
Background-Subtracted Data
Checked or unchecked Unchecked
Computed Value [Method 2 (+, –, ×, or ÷) Method 1] (+, –, ×, or ÷) user-entered number, or
[Method 1 (+, –, ×, or ÷) Method 2] (+, –, ×, or ÷) user-entered number, or
Unchecked
(Method 2 ÷ Method 1) × 1
Report Order NA Raw Data
Shaking Time 0–30 sec 0
Plate Settling Time 0–1,000 msec 25
Kinetic Timing
Hold in Darkness 0–3,600 sec 0
Wait Between Reads 0–28,800 sec 0
Number of Reads 1–100 1

6.3 Technical Specifications
Analyst GT Operator's Manual – Rev. C 123
6.3 Technical Specifications
Read Times (for 384-well plates) Fluorescence Intensity 60 sec Fluorescence Polarization 120 sec Time-Resolved Fluorescence 150 sec Luminescence 105 sec Absorbance 60 sec
Integration Times User-selectable from 50 µsec to 2 seconds in 1-µsec increments
Maximum Plate Dimensions
Without Stacker 18 × 92.8 × 129 mm (H × W × L) With Stacker 15 × 92.8 × 129 mm
Maximum Plate Weight 100 g
Light Source, F, FP, A Methods Lamp Types Xenon arc and flash Wavelength Range 250–740 nm Expected Lamp Life 2,000 hours
Light Source, TRF Methods Lamp Type Xenon flash Wavelength Range 250–740 nm Expected Lamp Life 5 years
Detection Limits Fluorescence Intensity <5 pM fluorescein Fluorescence Polarization <3 mP SD for 1 nM fluorescein Time-Resolved Fluorescence <250 fM europium
Note: Lower detection limit determinations were made in 80 µL in a 384-well microplate.
Luminescence Detection Wavelength Range 450–600 nm Crosstalk, 384-well microplates <2.0%
Absorbance Detection Wavelength 250–740 nm Linear Range 3.0 ± 0.01 OD
Physical Dimensions Detector Weight 193 lb (87.7 kg) Height 24.7 in (62.8 cm) Width 21.6 in (55.0 cm) Depth 25.6 in (64.9 cm)
Detector with Stacker Weight 220 lb (100 kg) Height 24.7 in (62.8 cm) Width 21.6 in (55.0 cm) Depth 34.6 in (87.9 cm)
Environmental Specifications Operation Humidity Range 10 to 90% Noncondensing Operation Temperature Range 15 to 30 °C Storage Temperature Range 5 to 50 °C Noise Level 70 dB maximum at 2 meters

6 Appendices
124 Analyst GT Operator's Manual – Rev. C
Host Computer Requirements Recommended Manufacturer Dell Operating System Windows 2000 or XP Clock Speed 1.8 GHz or greater Display 1,024 x 768 Data Storage 10 GB Hard Drive Memory 128 MB or greater Mouse required Printer optional
Communication Interfaces Type 100Base T Number of Ethernet Ports 2 (instrument and network) Protocols TCP/IP Connectors RJ45
Power Requirements Voltage 90–250 VAC, 50–60 Hz Voltage Switching Automatic Power, Instrument <1 KW Fuses Littlefuse Series 215, rated T6.3AH, time lag, high ampacity (ceramic) type Various EN60127-2 Sheet V type, rated T6.3AH, AC250V, 5×20 mm, time-lag, high ampacity (ceramic) type

6.4 Spare Parts
Analyst GT Operator's Manual – Rev. C 125
6.4 Spare Parts
When ordering parts from Molecular Devices, please provide the following information:
• Purchase order number • Type and serial number of the instrument for which the part is intended • Quantity of each item ordered • Product part number and description • Shipping and billing address
Part Number Description 26-300-0002 Continuous Lamp Core 2100-0017 Flash Lamp 42-000-0040 Filter Cartridge Spare Parts Kit (8 cartridges) 42-000-0042 Excitation/Emission Filter Label 0200-6017 40-Plate Magazines (2 each) 0200-6016 20-Plate Magazines (2 each) 0200-6055 ActiveXsuite 3.0 Integrator’s Software
Check the ClubHT web site for updated listings of system accessories (www.moleculardevices.com).

6 Appendices
126 Analyst GT Operator's Manual – Rev. C
6.5 Selecting Filters and Dichroic Mirrors
6.5.1 Filters
Molecular Devices offers optimized filter sets for certain fluorophores. Typically, each fluorophore requires a specific excitation filter, emission filter, and dichroic mirror. The following table shows recommended wavelengths for six fluorophores.
Fluorophore
Excitation
Wavelength
Emission
Wavelength
Dichroic
Mirror
Fluorescein 485 530 505
Europium 360 620 400
Coumarin 360 425 400
Rhodamine/Cy3B 530 580 561
Texas Red 580 630 600
EDANS 360 485 400
Determine the wavelength and bandpass requirements for your fluorophore. You may already have an appropriate filter installed. For example, all Analyst systems are shipped with a fluorescein filter set installed. All filters purchased from Molecular Devices are supplied pre-tested and installed in cartridges. For each filter, the center wavelength (CW) is listed, then the ‘full width at half maximum’ (FWHM) is listed. The FWHM is the bandwidth at the point where percent of the light is transmitted.

6.5 Selecting Filters and Dichroic Mirrors
Analyst GT Operator's Manual – Rev. C 127
6.5.2 Dichroic Mirrors
All Analyst systems are equipped with a fluorescein dichroic mirror and a % beamsplitter. The % beamsplitter can be used with any fluorophore. However, use of the appropriate dichroic mirror instead of the % beamsplitter can increase assay sensitivity significantly (by factors of –).
The dichroic center cut-on wavelength falls between the excitation and emission wavelengths. The center cut-on wavelength is the wavelength at which percent of the light is both transmitted and reflected.
Dichroic mirrors are assembled in holders and are ready to install into either the top or bottom read heads.
Article Number Description Wavelength (nm) Bandpass (nm)
42-000-0059 Europium Chelate Ex 330 70
42-000-0132 Europium Cryptate Ex 330 80
42-000-0037 Europium Delfia Ex
Coumarin Ex
360 35
42-000-0138 β-lactamase Donor Ex 405 20
42-000-0045 Coumarin (AMC) Ex 425 35
42-000-0139 β-lactamase Donor Em 460 40
42-000-0031 Fluorescein Ex 485 20
42-000-0140 β-lactamase Acceptor Em 530 10
42-000-0032 Fluorescein Em,
Rhodamine Ex
530 25
42-000-0034 Rhodamine Em
Texas Red Ex
580 10
0200-6036 StopLight Red Em 590 20
42-000-0060 Europium Chelate Em 615 7.5
42-000-0038 Europium Delfia Em 620 35
42-000-0064 Europium Cryptate Em 620 7.5
42-000-0035 Texas Red Em 630 35
42-000-0061 APC Em 665 7.5
0200-6024 Dichroic 380 380 NA
0200-6023 Dichroic 400 400 NA
0200-6025 Dichroic 425 425 NA
0200-6026 Dichroic 490/550 490/550 NA
0200-6027 Dichroic 505 505 NA
0200-6028 Dichroic 505/600 505/600 NA
0200-6029 Dichroic 561 561 NA
0200-6048 50% Beamsplitter NA NA

6 Appendices
128 Analyst GT Operator's Manual – Rev. C
6.6 Warranty Statement
The Analyst GT Multimode Reader (the ‘Instrument’) is warranted against defects in materials or workmanship for one (1) year following the delivery date.
Molecular Devices Corporation (MDC) reserves the right to repair or replace a defective Instrument at its discretion, which shall be the sole liability of MDC under this warranty. During the warranty period, on-site service will be provided by MDC or its authorized agent. This warranty does not apply to damage resulting from misuse or operation in an environment or manner other than intended or recommended by MDC, modifications or repairs not made by MDC, accidents, or other improper maintenance, any of which will immediately void this warranty. Should service be required, please contact your local representative of MDC products.
DO NOT UNDER ANY CIRCUMSTANCES ATTEMPT TO OPERATE THIS INSTRUMENT WITH PANELS REMOVED OR ATTEMPT TO CHANGE ANY COMPONENTS OR PERFORM ANY MAINTENANCE WITH THE POWER ON.
Molecular Devices Corporation does not provide any other warranty, express or implied, and disclaims all other warranties, including without limitation any implied warranties for in-fringement, merchantability or the appropriateness of the Instrument or other products for a particular purpose, and MDC assumes no liability for the results derived from its products.

6.7 Index
Analyst GT Operator's Manual – Rev. C 129
6.7 Index
A A mode. See absorbance mode absorbance mode,
determining OD offset, parameters for, ,
accessory kit, alarm, audible, AnalystHost application,
interface with ICP, new features in version ., starting up,
aperture, luminescence. See luminescence aperture
appendices, – detection method parameter cross-
reference, – relocating the system, selecting filters and dichroic mirrors,
spare parts, – specifications, – warranty statement,
attenuator factor, attenuators,
on reports, parameters for, , , , selecting, , , , , ,
automation, AutoRange button, , AutoSave
configuring, configuring before a run, on status bar, settings for, –
B background subtraction, – barcode reader,
AutoSave settings for, – enabling and disabling, locations,
barcode string, on reports,
beamsplitters, , , , , , , replacing,
bottom optics. See optics
C cleaning the instrument, colorbar, comment field, , , ,
on reports, components, reader, –
locations, continuous lamp. See lamp, continuous Continuous Lamp Status screen, control panel,
changing position of, counter, microplate, counting units. See units counts units. See also units
defined, counts/second units. See also units
defined, Create a Protocol screen,
D date
on reports, setting,
Define and Edit Methods screens, , , –
Define Plate Format screen, delay after flash
parameters for, , , setting, , , ,
delay before first read. See hold in darkness
detection methods A mode parameters, , defining, – deleting, editing, F mode parameters, , FP mode parameters, , L mode parameters, , modifying, multi-method mode parameters, –
, overview of parameters, – parameter cross-reference, – selecting in multi-method mode, specifying name, ,

6 Appendices
130 Analyst GT Operator's Manual – Rev. C
switching in multi-method mode, TRF mode parameters, ,
dichroic mirrors, , , . See also beamsplitters entering names for, replacing, – selecting, selecting wavelengths,
display, drift, across-plate, – Dynamic Z parameter, –. See also z-
height
E Edit Protocol screen, , , ejecting microplates
incrementing plate counter, Stop/Eject button,
Enter New Plate Name screen, errors
error codes, fault conditions, service conditions,
Ethernet communication, Ethernet Communication,
F F mode. See fluorescence intensity mode fault conditions. See errors light, filter cartridge replacement, – filter wheels,
in optical system, replacement, –
filters, , entering names for, installing in tall cartridges, – neutral-density, on reports, parameters for, , , , polarizing. See polarizers replacing, – selecting, , , , , selecting wavelengths, – tall cartridges, , –
Filters screen, flash interval
parameters for, , , , setting, , , , ,
flash lamp. See lamp, flash flashes (readings) per well
on reports, parameters for, , , , setting, , , , setting flashes per well,
flashes, interval between. See flash interval
fluorescence intensity mode, – Dynamic Z parameter, – parameters for, ,
fluorescence polarization mode, – Dynamic Z parameter, – parameters for, ,
focal plane, format, microplate. See microplates. See
microplates
G grating (G) factor, ,
calculating, parameters for, setting, ,
gripper, microplate,
H half-power band, hold in darkness
defined, parameters for, – setting, –
host computer interfacing to,
hot mirror,
I icons on shortcut toolbar, incubation periods, indicator lights, , input/output panel, instrument control program (ICP), Instrument Serial Number screen, integration time
on reports, total, on reports,
integration time per flash parameters for, , , setting, , , ,
integration time, maximum

6.7 Index
Analyst GT Operator's Manual – Rev. C 131
parameters for, , , , , setting, , , , , ,
intensity units. See also units defined,
K keypad, kinetic timing,
L L mode. See luminescence mode LAMP key, lamp service message, lamp, continuous,
configuring, – on reports, parameters for, , , replacing, selecting, , , , warming up,
lamp, flash, on reports, parameters for, , , parameters for voltage, , , replacing, – selecting, , , , setting voltage, , , ,
lights, indicator, , LOAD/EJECT key, loading microplates, luminescence aperture,
setting, luminescence height
defined, parameters for, setting,
luminescence mode, parameters for, , PMT for,
M magazines, microplate, , maintenance procedures, –
cleaning the instrument, dichroic mirror replacement, – filter cartridge replacement, – filter installation in tall cartridges,
– filter replacement, –
filter wheel replacement, – lamp, continuous, replacement, lamp, flash, replacement, – luminescence aperture, setting, panel replacement, preventive maintenance schedule,
meniscus effects, method name
on reports, specifying,
Method Summary screen, method switching in multi-method
mode, microplate counter. See counter,
microplate microplate magazines. See magazines,
microplate microplate sensor. See sensor,
microplate microplates
defining formats for, – deleting a format, format on reports, loading. See loading microplates modifying a format, parameters for, – processing timelines, reading. See reading microplates selecting format, , – send-ahead, shaking,
modes, measurement, – absorbance, fluorescence intensity, – fluorescence polarization, – luminescence, on reports, selecting, selecting in multi-method mode, time-resolved fluorescence, –
moving the instrument, multi-method mode
defining, – example showing background
subtraction, – parameters for,
N New Method screen,

6 Appendices
132 Analyst GT Operator's Manual – Rev. C
number format, Number Format screen, number of reads
defined, parameters for, – setting, –
O OD offset
defined, determining, parameters for, setting,
operating procedures, – configuring continuous lamp, – defining detection methods, – defining microplates, – defining protocols, – entering dichroic mirror names, entering filter names, importing and exporting user
settings, inverting the colorbar, monitoring microplate status, performance verification, – reading microplates, – reviewing results, saving results, – selecting number format, selecting report format, – selecting wells, – setting date and time, setting up barcode reader, setting up stacker, setting up the system, – starting up the system, –
operation codes, operational status, optical components, – optical system, – optics, –
diagrammed, entering dichroic mirror names for,
parameters for, , selecting, selecting in F mode, selecting in TRF mode, top and bottom in F mode, –
top and bottom in TRF mode, –
top, for A mode, top, for FP mode, top, for L mode,
overview of operation, –
P panel replacement, parameters, detection methods. See also
specific parameter names A mode, , F mode, , FP mode, , L mode, , multi-method mode, –, overview, – TRF mode, ,
parameters, microplate. See microplates parts, spare, – Pause button, photomultiplier tubes
integration time, use in measurement modes, – use in optical system, –
plate gripper. See gripper, microplate plate ID
AutoSave settings for, – enabling the barcode reader, on reports, read by barcode reader,
Plate List screen, plate settling time
defined, parameters for, – setting, –
Plate Status screen, Plate View screen, , plates. See microplates polarizers, ,
in optical system, on reports, parameters for, selecting, , setting,
ports, serial, power entry module, light, power switch,

6.7 Index
Analyst GT Operator's Manual – Rev. C 133
preventive maintenance schedule, Protocol View screen, protocols
batch timing, defining, – incubation periods, send-ahead microplate, specifying name,
R reading microplates, –
processing timelines, read sequence on reports,
readings per well. See flashes (readings) per well
relocating the system, Report View screen, reports
AutoSave settings for, – examples of, – multi-method, Report View screen, selecting format for, –
resetting the instrument RESET key,
Restack button, results
monitoring during a run, reviewing, saving files, –
reversing microplates on the stacker, RFU units. See also units
defined, RLU units. See also units
defined, Run screen, ,
Plate View, , , Protocol View, Report View,
S safety information, –
conventions used in manual, electrical,
screens Continuous Lamp Status, Create a Protocol, Define and Edit Methods, , ,
–
Define Plate Format, Edit Protocol, , , Enter New Plate Name, Filters, Instrument Serial Number, Method Summary, New Method, Number Format, Plate List, Plate Status, Run – Plate View, , Run – Protocol View, Run – Report View, Select an action, Select Wells, , , Set Instrument Time, Setup AutoSave, , Stacker,
Select an action screen, Select Wells screen, , , selecting wells, send-ahead microplate, sensed volume, sensor, microplate, serial number
incorrectly set, on reports, setting,
service conditions. See errors light, Set Instrument Time screen, setting up the system, – Setup AutoSave screen, , shaking time
on reports, parameters for, – setting, , –
shipping the instrument, SmartOptics, – specifications, – stacker
enabling and disabling, illustration of, ,
Stacker screen, Start button, START key, startup, system, – status bar, status indicator,

6 Appendices
134 Analyst GT Operator's Manual – Rev. C
Stop/Eject button, system description
automation, components, – introduction, – overview of operation, – safety information, – system configuration with
AnalystHost application,
T target CV per well
parameters for, , , setting, , , ,
target SD per well parameters for, setting, ,
temperature, on reports, time
on reports, setting,
time between readings on reports,
time-resolved fluorescence mode, – Dynamic Z parameter, – parameters for, ,
toolbar, shortcut, top optics. See optics TRF mode. See time-resolved
fluorescence mode troubleshooting guide, –
U units
definitions of, on reports,
parameters for, , , , selecting, , , , , ,
Update button, user accounts, user settings,
importing and exporting,
V verifying system performance, – View Data button,
W wait between reads
defined, parameters for, – setting, –
warranty statement, wells, microplate
adjusting z-height for, – readings on reports, – selecting, , –
Windows , , starting, user accounts,
workflow, routine,
Z z-height, –. See also Dynamic Z
parameter defined, on reports, optimizing, , parameters for, , , , setting, , , ,