analysis renalfibrosis in rabbit model of crescentic ... · figure1. massontrichrome-stained...
TRANSCRIPT

Analysis of Renal Fibrosis in a Rabbit Model of Crescentic Nephritis
Greg Dvowner, SemH. Phan, andRoger C. WigginsDepartments of Internal Medicine and Pathology, University of Michigan Medical School, Ann Arbor, Michigan 48109-0602
Abstract
The pathogenesis of renal fibrosis in crescentic nephritis isincompletely understood. To improve our understanding of thisprocess, crescentic neiphritis was induced in New ZealundWhite rabbits by administration of guinea pig antiglomerularbasement membrane IgG after sensitization with guinea pigIgG; and their kidneys were analyzed for the development offibrosis. Collagensynthesis in renal cortical tissue was signifi-cantly. elevated by day 3, peaked at days 7-15, and returnedtowards baseline by day 21. Collagen content of both glomeruliand cortex were increased starting on days 14-16, and re-mained constant in cortex thereafter. Light microscopic analy-sis was Much less sensitive, revealing fibrosis only after day 21.Immunofluorescence. revealed that type IV collagen was dis-tributqd primarily in the glomerulus, while types I and III wereincreased in the, glomerulus and interstitium. Thus, in thismodel of crescentic nephritis, fibrosis, as assessed biochemi-cally, developed early at time points when. morphologic analy-sis failed to detect such a development. Hence early therapeu-tic intervention, before morphologic evidence of fibrosis is evi-dent, may be more successful in arresting the progression ofthis disease before it reaches irreversible terminal stages.
Introduction
Increased collagen accumulation with progressive renal scar-ring is the final common pathway to chronic renal failure inmany renal diseases. Much has been learned recently about thepathogenesis of glomerular and interstitial fibrosis from thestudy of animal models (1-5), human renal biopsies (6), andcell culture systems (7-9). However, less has been publishedregarding the time. course for development of renal fibrosis. Ithas been observed clinically. that therapy is less effective inpreventing or delaying chronic renal failure once significantfibrosis is present (10). Furthermore, the interaction betweenelements regulating fibrogenesis may be better understood bylooking at the net effect on collagen synthesis and accumula-tion. The principal aim of this study was to examine histologi-cally and biochemically the development of renal fibrosis in arabbit model of crescentic nephritis.
From previous reports it appears that both interstitial (Iand III) and basement membrane (IV and V) collagens consti-
Address all correspondence to Dr. SemH. Phan, Department of Pa-thology M0602, University of Michigan Medical School, Ann Arbor,MI 48109-0602.
Received for publication 30 November 1987 and in revisedform 7March 1988.
tute the fibrotic lesion in certain glomerular diseases (1, 5, 6).Their distribution between the glomerulus and interstitiummay be dependent on the integrity of Bowman's capsule (6).Another aim of this study was to examine the pattern of distri-bution of interstitial and type IV collagens in this animalmodel.
Methods
Model of antiglomerular basement membrane disease. The methodused to produce crescentic nephritis in rabbits has been previouslydescribed (1 1). Briefly, NewZealand White rabbits, weighing 2.0-3.0kg, were injected subcutaneously with 100 1Ag of guinea pig IgG in CFA(Sigma Chemical Co., St. Louis, MO)and 5 d later they were given anintravenous injection of guinea pig anti-rabbit glomerular basementmembrane (anti-GBM)' IgG. Control animals received no injections.Rabbits were kept in individual cages and were given water and regularrabbit chow ad lib.
At the indicated times, renal tissue samples were obtained for anal-ysis from these animals. Rabbits were sedated with 25-50 mg/kg, i.v.sodium pentobarbital. The kidneys were then perfused with normalsaline until blanched (100 to 200 cm3), and then with 180 cm3 of ironoxide (2.5 mg/ml) in 1% BSA. The kidneys were then harvested, thecapsule was removed, and the cortex was trimmed off with scissors. Apiece of cortex was homogenized in 0.5 Macetic acid by polytron(Brinkmann Instruments Co., Westbury, NY), divided into three ali-quots, dried in a speed vac concentrator (Savant Instruments, Inc.,Hicksville, NY), and stored at -70'C. Sections for light microscopywere placed in 10% formalin, and sections for immunofluorescentanalysis were frozen in liquid nitrogen and stored at -70'C. Theremaining cortex was homogenized in chilled PBS by a Polytron(Brinkmah Instruments) and then passed sequentially through a brassscreen, 25 openings per inch (Bel-Art Products, Pequannock, NJ), anylon screen, 90-,gm opening diam (Tetko Inc., Elmsford, NY), andinto a 250-ml beaker. The filtrate was then placed on a magnet and theiron-embolized glomeruli were purified by repeated washings withchilled PBS. Glomerular purity and yield were determined by low-power (X 10) examination of 10-ul samples. The glomeruli were thendivided into three aliquots, suspended in 0.5 Macetic acid, dried in aspeed vac concentrator and stored at -700C.
Histologic scoring. Al kidney sections were scored by one of theauthors (G. Downer) who was blinded to the time-point of disease. Thedegree of cortical fibrosis was assessed on Masson's trichrome-stainedsections and graded 0-3+ (none, mild, moderate, severe) based on thetotal amount of blue stain throughout the cortex (Sclerosis Score). Aminimum of 10 X 40 fields were examined per animal. The activity ofglomerular involvement was also assessed. Glomeruli were categorizedas normal, acutely inflamed (increased cellularity of the tuft, protein-aceous material in Bowman's space or cellular crescents) or chronicallydiseased (fibrosis involving the glomerular tuft or crescent). For eachrabbit, 50 glomeruli were examined and the percentage of glomeruli ineach category (normal, acute disease, chronic disease) was recorded.
Collagen content. This was measured as total hydroxyproline (OH-Pro) by the method of Huszar et al. (12) as modified by Phan et al. (13).
1. Abbreviations used in this paper: GBM,glomerular basement mem-brane; OH-Pro, hydroxyproline; TBM, tubular basement membrane.
998 G. Downer, S. H. Phan, and R. C. Wiggins
J. Clin. Invest.©The American Society for Clinical Investigation, Inc.0021-9738/88/09/0998/09 $2.00Volume 82, September 1988, 998-1006

Briefly, aliquots of glomeruli or cortex were suspended in 6 NHCl andhydrolyzed overnight at 1 10C in tightly capped tubes. The sampleswere then dried in a speed vac concentrator and resuspended in ci-trate-acetate buffer (pH 6.0). The sample was oxidized by chloramineT (Kodak Co., Rochester, NY), mixed with p-dimethylaminobenzal-dehyde, and absorbance at 550 nmwas measured. OH-Pro content wascalculated from a standard curve of purified OH-L-Pro (Sigma Chemi-cal Co.). Results were expressed as OH-Pro per glomerulus, per milli-gram dry weight (for cortex), per milligram protein or per micro-gram DNA.
DNAcontent. This was measured by the method of Burton (14) asmodified by Phan et al. (15). Briefly, DNAwas extracted from samplesof glomeruli or cortex by heating in 5%TCAat 90'C for 15 min. Theextract was then mixed with diphenylamine (Sigma Chemical Co.) at1000C for 10 min and absorbance at 600 nm was measured. DNAcontent was calculated from a standard curve of purified calf-thymusDNA(Sigma Chemical Co.).
Total protein. This was determined by the Lowry proteinassay (16).
Collagen synthesis. The method of Phan et al. for measuring therate of lung collagen synthesis was adapted to kidney tissue with minormodifications (17). Briefly, New Zealand White rabbits were immu-nized as described above, sedated with sodium pentobarbital at thetime of their death, and the kidneys were perfused with normal salineuntil blanched. Slices of fresh cortex (100-200 mg wet weight) werethen minced with scissors into 1-2-mm pieces and incubated in 2 ml ofmedia containing sodium ascorbate (50 ,g/ml), f3-aminopropionitrile(80 tg/ml), and 10 ,ACi [3H]proline (100 Ci/mmol) (ICN Radiochemi-cals, Inc., Irvine, CA) for 5-6 h at 370C, in 95% 02, 5% CO2. Afterwashing the tissue fragments with PBS to remove unincorporated[3H]proline, they were suspended in 10% TCAand homogenized witha Polytron. DNAcontent was determined on an aliquot of the homog-enate. The rest of the sample was washed twice with 10% TCA andresuspended in 0.1 MNaOH. The sample was then neutralized by theaddition of 1 MTris-HCI (pH 7.3) and titrated to pH 7.2-7.7 with 1 MHCG. The sample was then digested with purified bacterial collagenase(Worthington Biochemical Corp., Freehold, NJ) at 37°C for 2 h. Thedigestion was stopped with 20% TCA and 0.5% tannic acid and thesamples were counted in Safety-solve (Research Products InternationalCorp., Mount Prospect, IL) using a liquid scintillation counter (Beck-mann LS 5801; Beckmann Instruments Inc.). The collagenase-liber-ated counts (TCA soluble) represented collagenous proteins and thecollagenase-undigested precipitate represented noncollagenous pro-teins. The specific radioactivity of tissue proline pools was determinedon the pooled TCAwash supernates and were used to convert disinte-grations per minute to nanomoles of proline incorporated. Resultswere expressed as nanomoles proline incorporated per gram dry weight(% control) or per milligram DNA(% control).
Antiserum to types I and III collagen. Interstitial collagens (I andIII) were isolated from rabbit lungs using the method of Seyer et al.(18). Rabbit lungs (Pel-Freez Biologicals, Rogers, AR) were trimmed ofextraneous lung tissue and were washed twice with PBS. They werethen minced into - 2-mm pieces, resuspended in 0.5 Macetic acid,and homogenized with a Polytron. Pepsin was then added to a finalconcentration of 0.5 mg/ml (Sigma Chemical Co.) and the suspensionslowly stirred at 4°C for 24 h. Upon centrifugation, the supernate wasstored frozen, while the pellet was reextracted twice with the aceticacid/pepsin solution. All extracts were then pooled and neutralized topH 7.6 with 1 MTris. NaCl was added to a final concentration of 4.5Mto precipitate collagen, then the solution was centrifuged. The pelletwas resuspended in 0.5 Macetic acid and dialyzed against 0.5 Maceticacid containing 0.7 MNaCl. After centrifugation, the pellet containingtypes I and III collagen was dialyzed against 50 mMTris-HCl pH 7.5,and 1 MNaCl. The NaCl concentration was then raised to 1.7 M, andthe sample was centrifuged to separate the type I (pellet) from type IIIcollagen (supernate). This fractionation was repeated twice to mini-mize contamination by type III collagen in the type I collagen pellet.The final preparation was at least 95% type I collagen with < 5%
contamination by type III collagen as quantitated by SDS-PAGEwithinterrupted reduction (19). No other contaminant was apparent bySDS-PAGE.
A female goat was immunized subcutaneously with 10 mg (dryweight) of this collagen preparation in 1 cm3 CFAand was given threebooster injections biweekly of 2 mg collagen in 1 cm3 CFA subcutane-ously. 7 d after the final injection the goat was exsanguinated, and theserum was aliquoted and stored at -30'C. This immune serum ishereafter designated anti-I/III, and was absorbed with rabbit serumbefore use. Western blot analysis using the purified collagen and com-mercially available pure types I and III collagen (Sigma Chemical Co.)showed staining of predominantly type I collagen -bands, but also sometype III staining.
Antiserum to type IV collagen. A female goat was immunized with1 mg of purified human placenta type IV collagen (Sigma ChemicalCo.) in 1 cm3 CFA subcutaneously for a total of seven doses at bi-weekly intervals. 7 d after each of the last two immunizations, 100-200ml of blood was obtained by jugular vein puncture, the serum waspooled, aliquoted, and stored at -30'C. Western blot analysis ofplasma-absorbed antibody showed staining of type IV human collagen.
Affinity chromatography. In some studies anti-type I/III and anti-type IV antibodies were immunopurified by passage of immune IgGfractions over Sepharose 4B columns to which type I/III or type IVcollagen had been immobilized by cyanogen bromide activation (20).Briefly, purified rabbit type I/III or human placental type IV (SigmaChemical Co.) collagen were immobilized onto Sepharose 4B aftercyanogen bromide activation (20). After inactivation of unreactedsites, the beads were poured into a 1.0 X 10-cm column, and IgGfraction of anti-type I/III or anti-type IV antiserum were then applied.The columns were then eluted with at least two column volumes ofPBS until no more 280 nm absorbing material was detected in theeffluent. Specific antibodies were then eluted from the affinity columnby glycine-HCl buffer, pH 2.0. No differences were observed in theimmunofluorescent patterns using affinity-purified antibodies com-pared with unfractionated antiserum.
Immunofluorescence. Indirect fluorescence using goat anti-serumagainst interstitial (anti-I/III) or type IV collagens (anti-IV) diluted1:100, or affinity-purified IgG, was done using fluorescein-labeled rab-bit anti-goat IgG (Cappel Scientific Division, Cooper Biomedical, Inc.,Malvern, PA) as the second antibody. Normal goat serum was used asthe control. Fluorescence was viewed and photographed with a Zeissphotomicroscope (Morgan Instruments, Inc., Detroit, MI).
Statistics. All results in experimental groups were compared withcontrol values using the unpaired Student's t test to examine for signifi-cant differences (P < .05).
Results
Histologic changes. The changes in glomerular morphologypreviously described in this model were confirmed in thepresent study (Fig. 1) (I 1). There was increased cellularity ofthe tuft by days 3-5 and proteinaceous material in Bowman'sspace by day 7, which was followed by cellular crescents (days10-14), and diffuse glomerular and interstitial fibrosis (days21-35).
In Fig. 2 the percentage of involvement of glomeruli byacute or chronic changes in relation to time is shown. By days6-9, 90% of glomeruli have acute inflammatory changes. Atdays 51-55, however, only 3% of glomeruli are inflamed asdefined by increased numbers of cells or proteinaceous matrix,while 47% of glomeruli appear normal and 50% show fibrosis.
Isolation of glomeruli. Purity of the glomerular prepara-tions for the control, and in the days-6-9, and days- 14-16groups was 84±4%, 87±5%, and 79±3%, respectively. Theglomeruli isolation procedure resulted in our obtaining prepa-
Renal Fibrosis in Crescentic Nephritis 999

Figure 1. Masson trichrome-stained histologi-cal sections of kidney from rabbits. The darkhomogeneous areas within glomeruli and ves-sels are the iron oxide perfused into the kidneyto facilitate glomerular purification. Note theincrease in number of cells per glomerulus onday 5, the formation of fibrin-containing pro-teinaceous material in Bowman's space on day7, the cellular crescent and periglomerular in-terstitial mononuclear infiltrate on day 14, thehomogeneous appearance of some glomeruliindicating replacement by collagenous matrix(blue-stained), and the loss of tubules by day21, and the widespread fibrotic process by day30.
rations that were biased towards more normal-appearing glo-meruli. This is illustrated by the results from a separate study(Eldredge, Wiggins, and Kunkel, unpublished data), where themorphologic appearance of isolated glomeruli was comparedwith the morphologic appearance of glomeruli in histologicalsections from the same animals. Glomeruli in each case werescored as normal, increased number of cells, or crescentspresent. The values given as the percentages of total number ofnormal, increased cells or crescentric glomeruli for isolatedglomeruli/histological sections at day 4 were 16±4/8+2,84±8/92±6, and 0/0; for day 7 they were 30±7/4+2,42±8/46±7, and 28±3/50±9; for day 14 they were 59±10/14+5, 14±6/26±8, and 27±4/60±10. For day 21 > 95% ofisolated glomeruli appeared normal compared with - 50% inthe histological sections. Therefore, we were not able to isolaterepresentative glomeruli after day 14 of the disease modelusing the iron embolization technique, and even those glo-meruli isolated from before day 21 were significantly biasedtowards more normal glomeruli. Thus, the data for isolatedglomeruli must be interpreted with this bias in mind.
Collagen accumulation in glomeruli and cortex. Glomeru-lar OH-Pro content was increased significantly by days 14-16(Fig. 3) when expressed as OH-Pro per glomerulus (2.30±0.63
ng OH-Pro/glomerulus vs. control 0.77±0.12 ng OH-Pro/glo-merulus, P < .05), or as OH-Pro per unit DNA(0.19±0.04 AgOH-Pro/Ag DNA vs. control 0.078±0.013 utg OH-Pro/PgDNA, P < .05). DNAand total protein per glomerulus werealso increased although not significantly. This latter result isnot in accordance with the histological data and probably re-
0.CL
100
80
60
40
20
0N
DAY50
17 6 9 6 56-9 14-16 22-24 32-36 51-55
Figure 2. Time-course of glomerular histology in the model of anti-GBMdisease. Glomeruli are scored as normal (c), inflanied (con-taining increased number of cells or fibrin-containing proteinaceousmaterial) (D), or scarred (stained blue with Masson trichrome) (Eia).N, the number of animals used per group.
1000 G. Downer, S. H. Phan, and R. C. Wiggins
LI

OH-PRO(ng)/ 3 -
Glomerulus2-
1 -
OH-PRO(ug)/ 0.2
DNA (ug)0.1
0 -i
B
7
OH-PRO(ug)/ 20 1 C
Protein(mg)
10-I
Ik 1 51 1 6
DNA(ng)/
Glomerulus 15 D10
0
Protein(ug)/ 0.2 E
Glomerulus |0.1-
0 05 6-
DAY 0 6-9 14
Figure 3. Measure-ments of OH-PRO,DNA, and protein con-tent in glomeruli iso-lated from control, days
* 6-7, and days 14-16animals. Note that theDNAper glomerulusdid not rise significantly
5 by day 14, suggestingthat the isolated popula-
* tion of glomeruli wasskewed towards themore normal glomeruliand/or that cellular orproteinaceous castswere lost during the iso-
7 lation procedure. Thiswas confirmed by ex-amining 1-Am sectionsof methacrolate-embed-ded isolated glomeruli
I (data not shown). Inspite of this bias, glo-merular OH-PROin-creased by day 14. (*P< 0.05 compared with
T control or days 6-9 glo-meruli). The'number ofanimals (N) examined
l05- in each group is indi-4-16 cated inside the bars.
flects the failure to isolate representative glomeruli on day 14or the loss of cellular crescents from the isolated glomeruli. Inspite of this, the OH-Pro content per glomerulus was increasedby day 14.
OH-Pro content in the renal cortex (Fig. 4) was signifi-cantly increased by days 6-9 when expressed per unit DNA(0.141±0.013 gg OH-Pro/,Mg DNAvs. control 0.095±0.006 Mg
3 -
wail 2 -
.,)
0
0N
DnTn
Q) I
cn
0 -
N
DAY
I
T
10 11 7 9 f
0 6-9 14-16 22-24 32-37
.A-
I w
.,'400
z300 2?0
-3
- 200 00.I0
100 -C0
ap
51-55
Figure 5. Relationship between the cortical sclerosis score as assessedby Masson trichrome staining (glomerulus and interstitial scarring)(c), and the measured cortical OH-PROexpressed per dry weight(Ei). Note that Masson trichrome staining lags behind collagen accu-mulation until day 21. Therefore Masson trichrome staining is not agood index of early collagen synthesis in the kidney. N, the numberof animals used per group.
OH-Pro/Mg DNA, P < .05) and per unit protein (4.22±0.50 MgOH-Pro/mg protein vs. control 1.79±0.20 Mg OH-Pro/mgprotein, P < .01). It was increased by days 14 to 16 whenexpressed per dry weight (2.91±0.41 Mg OH-Pro/mg dryweight vs. control 1.18±0.11 Mig OH-Pro/mg dry weight, P< .01). Cortical OH-Pro increased insignificantly thereafter al-though it remained significantly higher than controls. DNAinthe cortex was significantly elevated at days 14-16 (21.8±2.4Mg DNA/mgdry weight vs. control 12.7±1.7 Ag DNA/mgdryweight, P < .05) and returned to baseline by days 32-37(14.6±0.9 gg DNA/mg dry weight, P < .05), paralleling theincreased cellularity seen histologically. The degree of cortical
OH-PRO(ug)/ 6 A TDry wt(mg) 1
596 15
OH-PRO(ug)/ 0.6 B
DNA(ug) 0.4 l
0.2l- *
11 X 4 5
OH-PRO(ug)/Protein(rng) 20-1 C
10 -
5 nr-. liii1
DNA(ug)/ 20 XDry wt(mg)
of 15 111
Protein(mg)/ 0.8 E
Dry wt(mg) i4- i*
DAY 0 6-9
Figure 4. Renal cortical** n measurement of OH-
PRO, DNA, protein,7 8 5 \ At and dry weight at var-
T1, * ious times during evolu-tion of crescents in rab-bit model of anti-GBM
171 19l 141 151 disease. (*P < 0.05; **P
< 0.01 when comparedwith control cortex).
7f18 5 The number of animals
used per group is shown14- 22- 32- 51-16 24 37 55 inside the bars.
.5E0
Cu-
oI-
c
cL
E 250-EIO z 200-
00150-0 cA o 1 50o -
E
I. 'g100-
0L 50
m 500-
- 400-
Z 300-E
X 200-
X 100-
COLLAGEN/DRY WEIGHT
*4 COLLAGEN/
NON-COLLAGENPRC.*arc DRY WI
3 8 15 21Days
1 Figure 6. Collagen syn-thetic rate as assessed
DNA by [3H]proline incorpo-ration into tissue slicesand expressed per dryweight and per DNA.Note that both collagen
-J and noncollagen pro-tein synthesis increasedby day 3, which shows
)TEIN I that collagen synthesisEIGHT was part of a general in-
crease in protein syn-thesis. Five animals per
j time point were used togenerate this graph. (*P< 0.05; **P < 0.001
35 when compared withcontrol synthetic rate).
Renal Fibrosis in Crescentic Nephritis 1001
5

400-
*a1 300_ ,---i
0 200 -dg /
3 8 15 22 35Time (days)
Figure 7. Time-course of collagen synthetic rate (expressed per dryweight) (-) in relation to collagen accumulation (expressed per dryweight) (-- -). The horizontal error bars represent the range of daysat which measurements were made. The vertical error bars representthe SE of the mean. Note the time lag between the increase in colla-gen synthetic rate and the accumulation of collagen in renal cortex.Five animals per time point were used to generate the collagen syn-thetic rate data. The number of animals used for the collagen accu-mulation data is as shown in Fig. 4 (A).
fibrosis on Masson's trichrome-stained sections underesti-mated the increase measured biochemically at early timepoints. At days 14-16 when cortical OH-Pro had increased by150%, there was only mild fibrosis histologically (Fig. 5).
Collagen synthesis. The rate of synthesis of collagen in thecortex (Fig. 6) was significantly elevated by day 3 when ex-pressed per dry weight (135±9 nmol proline/g dry weight, %control, P < .05), peaked around day 15 (255±24 nmol pro-
TYPE IV
C0NT
DAY
7
DAY1
14
I
line/g dry weight, %control, P< .001), and returned to controllevels by day 21 (127±9 nmol proline/g dry weight, %control,P < .05). Noncollagen protein synthesis followed a similarpattern. Collagen accumulation and rate of synthesis are di-rectly compared in Fig. 7. As expected, increased collagencontent lagged several days behind the increase in rate of syn-thesis and was maintained after the rate of synthesis returnedto baseline.
Patterns of accumulation of interstitial and type IV colla-gen. Control glomeruli had mesangial and capillary loopstaining with anti-type IV collagen antibody. When usinganti-type I/III collagen antibody some control glomeruli werenegative while others showed scattered mesangial staining (Fig.8). There was a progressive increase in glomerular fluorescenceat days 7 and 14 with both anti-type I/III and anti-type IV.However, the patterns of staining with the two antisera dif-fered. With anti-type IV, fluorescence was increased in the tuftby day 7 although the glomeruli architecture remained intact.By day 14 sheets of homogeneous staining were present inglomeruli and also involved the crescent and immediate peri-glomerular region (Figs. 8 and 9). Interstitial involvement waslimited to brighter and apparent thickening of the tubularbasement membrane (TBM). Fluorescence with anti-typeI/III, on the other hand, involved both the glomerulus andinterstitium. At day 7, tuft fluorescence was increased (Fig. 8).In many glomeruli at this time there was also interstitial stain-ing around glomeruli (not shown). At 2 wk, fluorescence inboth the glomerulus and the interstitium was further increased(Fig. 8). Interestingly, in some areas there was bright interstitial
TYPE 1/111
Figure 8. Time-course of type IV and typeI/111 collagen distribution as assessed by im-munofluorescence. Note that by day 7 immu-nofluorescence was obviously increased forboth type IV and type I/III although the basicglomerular structure appeared to remain rela-tively intact. By day 14 glomerular architec-ture was grossly distorted as assessed by bothtype IV and I/III staining. However, the typeI/III staining was much less within glomerulithan in the periglomerular and interstitialareas (see Fig. 10), while the type IV stainingwas predominantly intraglomerular.
1002 G. Downer, S. H. Phan, and R. C. Wiggins

Figure 9. Immunofluorescent sections stained for type IV collagen, in a control animal and animals at day 14 (A, B, and C). Note that by day14 there are plaques of type IV collagen that may involve parts of glomeruli (A), the whole glomerulus (B), or extend outwards into the intersti-
tial compartment from glomeruli (C).
fluorescence surrounding nonstaining glomeruli (Fig. 10),while in other areas the glomerulus was positive and the sur-rounding interstitium was negative (not shown).
In summary, anti-type IV staining is localized to the tuft,immediate periglomerular area, and crescent. Fluorescencewith anti-type I/III may involve primarily the glomerulus,interstitium, or both.
Discussion
The pathogenesis of renal fibrosis as a consequence of acuteglomerulonephritis is incompletely understood. Collagen-pro-ducing cells in the renal cortex include at least epithelial, endo-thelial, and mesangial cells of the glomerulus and interstitialfibroblasts. While epithelial and endothelial cells make base-ment membrane collagens (types IV and V) and fibroblastsmake interstitial collagens (types I and III), mesangial cells canproduce both classes of collagen (types I, III, IV, and V), atleast in tissue culture (8, 9, 21). An array of chemical media-tors produced by resident and infiltrating cells have been iden-tified that may influence the rate of collagen synthesis andbreakdown (2, 4, 7, 19, 22-26). To better understand the regu-lation of renal fibrosis we studied the time-course of collagenformation in a rabbit model of crescentic nephritis.
In this model, the outcome of the acute inflammatoryphase is not uniform among the glomeruli. While 90% of glo-
meruli are involved at day 7, 50%ultimately become histologi-cally normal again, and 50%develop fibrosis. The local factorsdetermining these different outcomes are not known.
Fibrogenesis as defined by increased renal cortical collagensynthesis appears to be switched on and then off in the first 2wk after anti-GBM administration. The rate of collagen syn-thesis is increased by day 3-4 and rises toward a maximumrate by day 7, at which time little collagen accumulation hasoccurred. By 14 d the synthetic rate is still high, and collagencontent has significantly increased in both the glomeruli andthe cortex. At 21 d, the rate of synthesis has returned towardsbaseline although collagen content continues to rise slowlythereafter. While such data are not available for other modelsof renal disease, a similar pattern was observed in a rat modelof pulmonary fibrosis (17). In both cases there is a promptincrease in collagen synthetic rate which lasts for a finite pe-riod, followed a few days later by increases in total collagendeposition. This suggests that if the new collagen being synthe-sized is associated with a rise in collagenolysis, the increase incollagenolysis must be of a smaller magnitude than the in-crease in synthetic rate. It is possible that the situation in thekidney may be similar to that seen in the fibrotic lung wherethere is a significant decrease in collagenolytic activity (downto undetectable levels) at time points greater than 1 wk (17). Inthe present study, although synthetic rate returned to close tonormal levels at time points greater than 14 d, there was still a
Renal Fibrosis in Crescentic Nephritis 1003
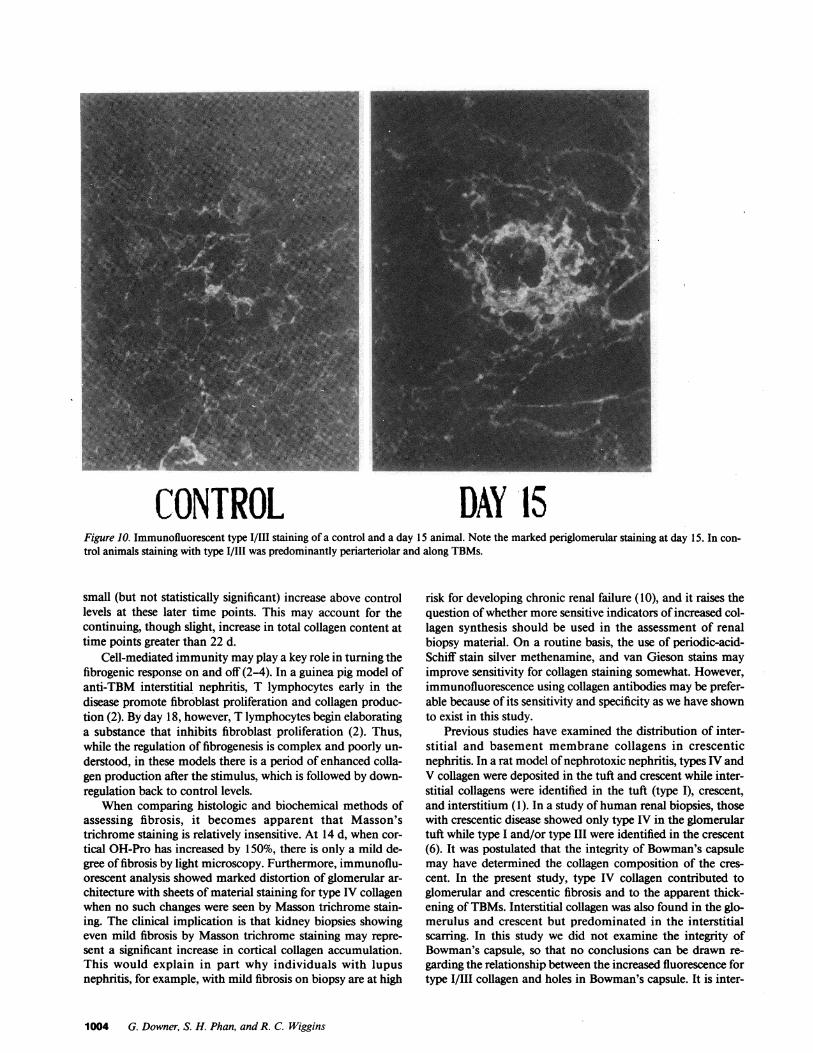
CONTROL DAY 15Figure 10. Immunofluorescent type I/IlI staining of a control and a day 15 animal. Note the marked periglomerular staining at day 15. In con-trol animals staining with type I/III was predominantly periarteriolar and along TBMs.
small (but not statistically significant) increase above controllevels at these later time points. This may account for thecontinuing, though slight, increase in total collagen content attime points greater than 22 d.
Cell-mediated immunity may play a key role in turning thefibrogenic response on and off (2-4). In a guinea pig model ofanti-TBM interstitial nephritis, T lymphocytes early in thedisease promote fibroblast proliferation and collagen produc-tion (2). By day 18, however, T lymphocytes begin elaboratinga substance that inhibits fibroblast proliferation (2). Thus,while the regulation of fibrogenesis is complex and poorly un-derstood, in these models there is a period of enhanced colla-gen production after the stimulus, which is followed by down-regulation back to control levels.
When comparing histologic and biochemical methods ofassessing fibrosis, it becomes apparent that Masson'strichrome staining is relatively insensitive. At 14 d, when cor-tical OH-Pro has increased by 150%, there is only a mild de-gree of fibrosis by light microscopy. Furthermore, immunoflu-orescent analysis showed marked distortion of glomerular ar-chitecture with sheets of material staining for type IV collagenwhen no such changes were seen by Masson trichrome stain-ing. The clinical implication is that kidney biopsies showingeven mild fibrosis by Masson trichrome staining may repre-sent a significant increase in cortical collagen accumulation.This would explain in part why individuals with lupusnephritis, for example, with mild fibrosis on biopsy are at high
risk for developing chronic renal failure (10), and it raises thequestion of whether more sensitive indicators of increased col-lagen synthesis should be used in the assessment of renalbiopsy material. On a routine basis, the use of periodic-acid-Schiff stain silver methenamine, and van Gieson stains mayimprove sensitivity for collagen staining somewhat. However,immunofluorescence using collagen antibodies may be prefer-able because of its sensitivity and specificity as we have shownto exist in this study.
Previous studies have examined the distribution of inter-stitial and basement membrane collagens in crescenticnephritis. In a rat model of nephrotoxic nephritis, types IV andV collagen were deposited in the tuft and crescent while inter-stitial collagens were identified in the tuft (type I), crescent,and interstitium (1). In a study of human renal biopsies, thosewith crescentic disease showed only type IV in the glomerulartuft while type I and/or type III were identified in the crescent(6). It was postulated that the integrity of Bowman's capsulemay have determined the collagen composition of the cres-cent. In the present study, type IV collagen contributed toglomerular and crescentic fibrosis and to the apparent thick-ening of TBMs. Interstitial collagen was also found in the glo-merulus and crescent but predominated in the interstitialscarring. In this study we did not examine the integrity ofBowman's capsule, so that no conclusions can be drawn re-garding the relationship between the increased fluorescence fortype I/III collagen and holes in Bowman's capsule. It is inter-
1004 G. Downer, S. H. Phan, and R. C. Wiggins

esting that trace amounts of interstitial collagen were seen insome glomeruli of control animals. Others have reported thattypes I and III collagen are not seen in the normal glomerulus(1, 5, 6). However, the results from the control glomerulusstained with monoclonal anti-type I antibody in one of thesestudies (1) appears to be very similar to our control anti-typeI/III results, raising the question of whether some glomeruli ofnormal animals contain small amounts of interstitial type col-lagen. While this trace positivity with anti-type I/III in controlglomeruli may be due to antiserum impurities or to artifact,the available data do not allow us to rule this out as a realobservation. Mesangial cells have been shown to produce typesI and III collagen in culture (8, 9). This area merits furtherinvestigation to establish whether interstitial collagen in glo-merular lesions results only from fibroblast infiltration or if itcan originate from resident glomerular cells as well.
The potential clinical relevance of these observations canbe seen by comparing these studies with our previous studiesusing the same model. They have shown that monocytes andactivated T cells are first seen within glomeruli by day 3 (27,28), proteinuria begins on day 4, the urine sediment becomesabnormal on days 5-6, oliguria occurs on days 6 and 7 (29,30), and the serum creatinine is raised by day 7 and continuesto rise through day 14 (unpublished observation). Thus in-creased collagen synthesis is seen within 24 h of influx ofmonocytes and T cells, as proteinuria begins, and before theelevation of serum creatinine. Collagen accumulation beginsas the serum creatinine first becomes elevated, and, in thismodel, is largely complete by day 14. By day 14, although theMasson trichrome stain is unimpressive for collagen, immuno-fluorescence shows what are likely to be irreversible structuralchanges in and around the glomeruli. By the time the Massontrichrome stain is obviously positive collagen synthesis hasswitched off and little more collagen accumulation occurs.
These findings cannot be directly compared with mostcases of human crescentic nephritis because this model is syn-chronous (all glomeruli moving through the "stages" (1 1) ofcrescent formation together), whereas many cases of crescenticnephritis in man are "asynchronous" (glomeruli are at differ-ent "stages" of crescent formation at any one point in time).However, for a single glomerulus the time-course described isprobably appropriate and is similar to that previously de-scribed in a rat model of crescentic glomerulonephritis (31).
The implications for therapy are therefore that there is awindow of opportunity for therapy, but that it is short. Startingtherapy must be an urgent matter where 24 h lost may counttowards permanent loss of renal function. Even a small changein renal function may indicate significant collagen synthesisand accumulation. Finally, in our efforts to improve the prog-nosis of individuals with rapidly progressive glomerulonephri-tis (and other forms of inflammatory renal disease) it may beas profitable to focus on reducing the time interval betweenpresentation and treatment (i.e., education) as it will be todevelop new forms of antiinflammatory therapy.
Acknowledgments
This work was supported by National Institutes of Health grantsDK-38149, DK-39255, HL-28737, AM-30673, and a grant-in-aidfrom the American Heart Association and its Michigan Affiliate. Dr.
Phan and Dr. Wiggins are Established Investigators of the AmericanHeart Association.
The authors gratefully acknowledge the expert technical assistanceof Bridget McGarry.
References
1. Foellmer, H. G., R. B. Sterzel, and M. Kashgarian. 1986. Pro-gressive glomerular sclerosis in experimental antiglomerular basementmembrane glomerulonephritis. Am. J. Kidney Dis. 7:5-11.
2. Neilson, E. G., S. A. Jimenez, and S. M. Phillips. 1980. Cell-me-diated immunity in interstitial nephritis. J. Immunol. 125:1708-1714.
3. McCluskey, R. T., and R. B. Colvin. 1978. Immunologic aspectsof renal tubular and interstitial diseases. Annu. Rev. Med. 29:191-203.
4. Neilson, E. G., and B. Zakheim. 1983. T cell regulation, anti-idiotypic immunity, and the nephritogenic immune response. KidneyInt. 24:289-302.
5. Adler, S., L. J. Striker, G. E. Striker, D. T. Perkinson, J. Hibbert,and W. G. Couser. 1986. Studies of progressive glomerular sclerosis inthe rat. Am. J. Pathol. 123:553-562.
6. Striker, L. J., P. D. Killen, E. Chi, and G. E. Striker. 1984. Thecomposition of glomerulosclerosis. Lab. Invest. 51:181-192.
7. Melcion, C., L. Lachman, P. D. Killen, L. Morel-Maroger, andG. E. Striker. 1982. Mesangial cells, effect of monocyte products onproliferation and matrix synthesis. Transplant. Proc. 14:559-564.
8. Striker, G. E., and L. J. Striker. 1985. Glomerular cells in cul-ture. Lab. Invest. 53:122-130.
9. Kreisberg, J. I., and M. J. Karnovsky. 1983. Glomerular cells inculture. Kidney Int. 23:439-447.
10. Austin, H. A., J. H. Klippel, J. E. Balow, N. G. H. LeRiche,A. D. Steinberg, P. H. Plotz, and J. L. Decker. 1986. Therapy of lupusnephritis. N. Engl. J. Med. 314:614-619.
11. Wiggins, R. C., A. Glatfelter, and J. Brukman. 1985. Procoagu-lant activity in glomeruli and urine of rabbits with nephrotoxicnephritis. Lab. Invest. 53:156-165.
12. Huszar, G., J. Maiocco, and F. Naftolin. 1980. Monitoring ofcollagen and collagen fragments in chromatography of protein mix-tures. Anal. Biochem. 105:424-429.
13. Phan, S. H., D. Schrier, B. McGarry, and R. E. Duque. 1983.Effect of the beige mutation on bleomycin-induced pulmonary fibrosisin mice. Am. Rev. Respir. Dis. 127:456-459.
14. Burton, K. 1956. A study of the conditions and mechanism ofthe diphenylamine reaction for the calorimetric estimation of deoxyri-bonucleic acid. Biochem. J. 62:315-323.
15. Phan, S. H., R. S. Thrall, and P. A. Ward. 1980. Bleomycin-in-duced pulmonary fibrosis in rats: biochemical demonstration of in-creased rate of collagen synthesis. Am. Rev. Respir. Dis. 121:501-506.
16. Lowry, 0. H., N. J. Rosebrough, A. L. Farr, and R. J. Randall.1951. Protein measurement with the folin phenol reagent. J. Biol.Chem. 193:265-270.
17. Phan, S. H., R. S. Thrall, and C. Williams. 1981. Bleomycin-induced pulmonary fibrosis. Am. Rev. Respir. Dis. 124:428-434.
18. Seyer, J. M., E. T. Hutcheson, and A. H. Kang. 1976. Collagenpolymorphism in idiopathic chronic pulmonary fibrosis. J. Clin. In-vest. 57:1498-1507.
19. Phan, S. H., J. Varani, and D. Smith. 1985. Rat lung fibroblastcollagen metabolism in bleomycin-induced pulmonary fibrosis. J.Clin. Invest. 76:241-247.
20. Furthmayr, H. 1982. Immunization procedures, isolation byaffinity chromatography, and Virological and immunochemical char-acterization of collagen specific antibodies. In Immuno-chemistry ofthe Extracellular Matrix. Vol I. Furthmayr, editor. CRCPress, BocaRaton, FL. 143-178.
21. Martinez-Hernandez, A., and P. S. Amenta. 1983. The base-ment membrane in pathology. Lab. Invest. 48:656-677.
22. Welgus, H. G., E. J. Campbell, Z. Bar-Shavit, R. M. Senior, and
Renal Fibrosis in Crescentic Nephritis 1005

S. L. Teitelbaum. 1985. Humanalveolar macrophages produce a fibro-blast-like collagenase and collagenase inhibitor. J. Clin. Invest.76:219-224.
23. Kovacs, E. J., and J. Kelley. 1984. Secretion of macrophage-de-rived growth factor during acute lung injury induced by bleomycin. J.Leukocyte BiW. 37:1-14.
24. Kovacs, E. J., and J. Kelley. 1985. Lymphokine regulation ofmacrophage-derived growth factor secretion following pulmonary in-jury. Am. J. Pathol. 121:261-268.
25. Phan, S. H., and R. S. Thrall. 1982. Inhibition of bleomycin-induced pulmonary fibrosis by cobra venom factor. Am. J. Pathol.107:25-28.
26. Fantone, J. C., S. L. Kunkel, and R. B. Zurier. 1985. Effects ofprostaglandins on in vivo immune and inflammatory reactions. InProstaglandins and Immunity. J. S. Goodwin, editor. Martinus Nij-hoff, Boston. 123-146.
27. Eldridge, C., and R. C. Wiggins. 1987. T cells in the glomerulus,periglomerular region and around venules early in crescentic nephritisin the rabbit. Evidence for glomerulo-interstitial signals. Kidney Int.31:318. (Abstr.)
28. Wiggins, R. C., and C. Eldridge. 1987. Monocyte/macrophageheterogeneity and migration into Bowman's space early in crescenticnephritis in the rabbit. Kidney Int. 31:333. (Abstr.)
29. Wiggins, R. C. 1985. Hageman factor in experimental nephro-toxic nephritis in the rabbit. Lab. Invest. 53:335-348.
30. Wiggins, R. C., A. Glatfelter, B. Kshirsagar, and T. Beals. 1987.Lipid microvesicles and their association with procoagulant activity inglomeruli of rabbits with nephrotoxic nephritis. Lab. Invest. 56:264-272.
31. Silva, F. G., J. R. Hoyer, and C. L. Pirani. 1984. Sequentialstudies of glomerular crescent formation in rats with antiglomerularbasement membrane-induced glomerulonephritis and the role of co-agulation factors. Lab. Invest. 51:404-415.
100$ G. Downer, S. H. Phan, and R. C. Wiggins