analysis of warm forging process a thesis submitted …
TRANSCRIPT

ANALYSIS OF WARM FORGING PROCESS
A THESIS SUBMITTED TO
THE GRADUATE SCHOOL OF NATURAL AND APPLIED SCIENCES
OF
MIDDLE EAST TECHNICAL UNIVERSITY
BY
GÜLGÜN AKTAKKA
IN PARTIAL FULFILLMENT OF THE REQUIREMENTS
FOR
THE DEGREE OF MASTER OF SCIENCE
IN
MECHANICAL ENGINEERING
JANUARY 2006

Approval of the Graduate School of Natural and Applied Sciences.
Prof. Dr. Canan ÖZGEN Director
I certify that this thesis satisfies all the requirements as a thesis for the degree of Master of Science.
Prof. Dr. Kemal İDER Head of the Department
This is to certify that we have read this thesis and that in our opinion it is fully adequate, in scope and quality, as a thesis for the degree of Master of Science.
Prof. Dr. Mustafa İlhan GÖKLER Prof. Dr. Haluk DARENDELİLER Co-Supervisor Supervisor
Examining Committee Members:
Prof. Dr. R. Orhan YILDIRIM (METU, ME)
Prof. Dr. Haluk DARENDELİLER (METU, ME)
Prof. Dr. Mustafa İlhan GÖKLER (METU, ME)
Prof. Dr. Suha ORAL (METU, ME)
Prof. Dr. Can ÇOĞUN (GAZI UN, ME)
ii

I hereby declare that all information in this document has been obtained and
presented in accordance with academic rules and ethical conduct. I also declare that,
as required by these rules and conduct, I have fully cited and referenced all material
and results that are not original to this work.
Gülgün AKTAKKA
Signature :
iii

ABSTRACT
ANALYSIS OF WARM FORGING PROCESS
AKTAKKA, Gülgün
M. Sc., Department of Mechanical Engineering
Supervisor: Prof. Dr. Haluk DARENDELİLER
Co-Supervisor: Prof. Dr. Mustafa İlhan GÖKLER
January 2006, 84 pages
Forging is a metal forming process commonly used in industry. Forging
process is strongly affected by the process temperature. In hot forging process, a
wide range of materials can be used and even complex geometries can be formed.
However in cold forging, only low carbon steels as ferrous material with simple
geometries can be forged and high capacity forging machinery is required.
Warm forging compromise the advantages and disadvantages of hot and cold
forging processes. In warm forging process, a product having better tolerances can be
produced compared to hot forging process and a large range of materials can be
forged compared to cold forging process.
In this study, forging of a particular part which is being produced by hot
forging at 1200°C for automotive industry and have been made of 1020 carbon steel,
iv

is analyzed by the finite volume analysis software for a temperature range of 850-
1200°C. Experimental study has been conducted for the same temperature range in a
forging company. A good agreement for the results has been observed.
Keywords: Warm Forging, Hot Forging, Metal Forming, Press Forging, Low
Carbon Steel, Finite Volume Analysis
v

ÖZ
ILIK DÖVME İŞLEM ANALİZİ
AKTAKKA, Gülgün
Yüksek Lisans, Makina Mühendisliği Bölümü
Tez Yöneticisi: Prof. Dr. Haluk DARENDELİLER
Ortak Tez Yöneticisi: Prof. Dr. Mustafa İlhan GÖKLER
Ocak 2006, 84 sayfa
Dövme endüstride sıklıkla tercih edilen bir metal şekilllendirme işlemidir.
Dövme işlemi, işlem sıcaklığından şiddetle etkilenir. Sıcak dövme işleminde çok
çeşitli malzemeler kullanılabilir ve karmaşık geometriler dahi işlenebilir. Ancak
soğuk dövme işleminde demir esaslı malzemelerden sadece düşük karbonlu ve basit
geometriye sahip çelik malzemeler dövülebilirler ve yüksek kapasiteli dövme
makineleri gereklidir.
Ilık dövme, sıcak ve soğuk dövmenin avantaj ve dezavantajlarını birleştirir.
Ilık dövme işleminde, sıcak dövme işlemine göre daha iyi toleranslara sahip bir ürün
üretilebilir ve soğuk dövme işlemine göre daha çeşitli malzemeler dövülebilir.
Bu çalışmada otomotiv sektöründe kullanılan, 1200°C’de sıcak dövme ile
üretilen ve 1020 karbon çeliğinden yapılan bir parçanın dövülmesi 850-1200°C
vi

sıcaklık aralığı için sonlu hacim analizi yazılımıyla incelenmiştir. Deneysel çalışma
bir dövme fabrikasında aynı sıcaklık aralığı için yapılmıştır. Sonuçlar birbirleri ile
uyumludur.
Anahtar Kelimeler: Ilık Dövme, Sıcak Dövme, Metal Şekillendirme, Pres Dövme,
Düşük Karbon Çeliği, Sonlu Hacim Analizi
vii

ACKNOWLEDGEMENTS
I express sincere appreciation to Prof. Dr. Haluk DARENDELİLER and Prof.
Dr. Mustafa İlhan GÖKLER for their guidance and insight during the study.
I wish to thank to Mrs. Tülay KÖMÜRCÜ, Mr. Cevat KÖMÜRCÜ, Mrs.
Tülin ÖZKAN and Mr. Yalçın ŞAHİN from AKSAN Steel Forging Company. The
technical assistance of them is gratefully acknowledged. I also would like to thank to
METU-BILTIR Center for the facilities provided for this study.
I also offer my thanks to Mr. Necati ÖZKAN and METU Central Laboratory
for their facilities provided for some tests, and also Mr. Tufan SEZENÖZ and Mr.
Zekai KALAYCIOĞLU from TAI for their great help during this study. I want to
thank to my colleagues in TAI, Mr. Ahmet ATASOY, Mr. Nevzat POLAT, Mr.
Özgür Uğur AYHAN and especially my leaders Mr. Serdar KUZUCU and Mrs.
Gülşen ÖNCÜL, for their great supports.
Special thanks go to my friends, Sevgi SARAÇ, Pelin SARI and İlker
DURUKAN for their valuable supports.
To my parents, Şükran and Zeki AKTAKKA, my brother Ethem Erkan
AKTAKKA, I offer sincere thanks for their encouragement.
I wish especially to thank to my dear friend Mustafa BAHTİYAR for his
significant supports and encouragement.
viii

TABLE OF CONTENTS
PLAGIARISM ............................................................................................................. iii
ABSTRACT................................................................................................................. iv
ÖZ ................................................................................................................................ vi
ACKNOWLEDGMENTS .........................................................................................viii
TABLE OF CONTENTS............................................................................................. ix
LIST OF FIGURES ..................................................................................................... xi
LIST OF TABLES .....................................................................................................xiii
CHAPTER
1. INTRODUCTION.............................................................................................. 1
1.1 Forging Process........................................................................................... 3
1.1.1 Forging wrt Die Type........................................................................ 3
1.1.2 Forging wrt Machine Type................................................................ 5
1.1.3 Forging wrt Working Temperature ................................................... 9
1.2 Forging Defects in Forging....................................................................... 11
1.3 Usage of CAD/CAM/CAE for Analysis of Forging Process ................... 12
1.4 Scope of the Thesis ................................................................................... 14
2. WARM FORGING .......................................................................................... 15
2.1 Industrial History of Warm Forging ......................................................... 15
2.2 Warm Forging Technology....................................................................... 15
2.2.1 Characteristics of Warm Forging .................................................... 16
2.2.2 Workpiece Material and Forgeability ............................................. 17
2.2.3 Tools and Tool Steels...................................................................... 18
2.2.4 Heat Treatment................................................................................ 20
ix

2.2.4.1 Overview of the Different Stages in Heat Treatment.............. 21
2.2.4.2 Preheating................................................................................ 22
2.2.4.3 Hardening and Quenching ...................................................... 22
2.2.5 Lubrication ...................................................................................... 24
2.2.5.1 Lubrication Types ................................................................... 26
3. CASE STUDY.................................................................................................. 29
3.1 Sample Part ............................................................................................... 29
3.2 First Series of Simulation of Forging ....................................................... 32
3.3 Experiment Results ................................................................................... 42
3.4 Second Series of Simulation of Forging ................................................... 47
4. CONCLUSION & FUTURE WORK .............................................................. 64
REFERENCES..................................................................................................... 66
APPENDICES...................................................................................................... 73
A. MATERIAL PROPERTIES OF STEEL AISI 1020 ................................. 73
B. MATERIAL PROPERTIES OF TOOL STEEL L6 .................................. 74
C. EXPERIMENTAL DATA ......................................................................... 75
x

LIST OF FIGURES
FIGURE
1.1 Open Die Forging................................................................................................. 4
1.2 Closed Die Forging Operation. ............................................................................ 4
1.3 Schematic Drawing of Closed Die Forging. ........................................................ 5
1.4 Schematic Drawings of Mechanical Press Samples............................................. 7
1.5 Schematic Drawing of Hydraulic Press. .............................................................. 8
1.6 Schematic Drawing of Screw Press. .................................................................... 8
3.1 Technical Drawing of “Ring” ............................................................................ 30
3.2 Model of Part “Ring” ......................................................................................... 30
3.3 Simulation of Forging Steps of Sample Part...................................................... 31
3.4 The input parameters of 10 MN mechanical press............................................. 32
3.5 Model of Lower Finish Die................................................................................ 33
3.6 Model of Upper Finish Die ................................................................................ 33
3.7 Effective Stress Distribution for Forging Process at 1200°C ............................ 34
3.8 Effective Stress Distribution for Forging Process at 1150°C ............................ 34
3.9 Effective Stress Distribution for Forging Process at 1100°C ............................ 35
3.10 Effective Stress Distribution for Forging Process at 1050°C .......................... 35
3.11 Effective Stress Distribution for Forging Process at 1000°C .......................... 36
3.12 Effective Stress Distribution for Forging Process at 950°C ............................ 36
3.13 Effective Stress Distribution for Forging Process at 900°C ............................ 37
3.14 Effective Stress Distribution for Forging Process at 850°C ............................ 37
3.15 Z-Force Diagram for Forging Process at 1200°C ............................................ 38
3.16 Z-Force Diagram for Forging Process at 1150°C ............................................ 38
3.17 Z-Force Diagram for Forging Process at 1100°C ............................................ 39
3.18 Z-Force Diagram for Forging Process at 1050°C ............................................ 39
xi

3.19 Z-Force Diagram for Forging Process at 1000°C ............................................ 40
3.20 Z-Force Diagram for Forging Process at 950°C .............................................. 40
3.21 Z-Force Diagram for Forging Process at 900°C .............................................. 41
3.22 Z-Force Diagram for Forging Process at 850°C .............................................. 41
3.23 1000 tonf Mechanical Press ............................................................................. 43
3.24 Preform and Finish Dies Fastened to the Press................................................ 43
3.25 Lower and Upper Finish Dies Used in Experiment ......................................... 44
3.26 Finished Parts in Tub Waiting for Cooling...................................................... 45
3.27 Model of Lower Finish Die.............................................................................. 47
3.28 Model of Upper Finish Die .............................................................................. 47
3.29 Effective Stress Distribution for Forging Process at 1191°C .......................... 48
3.30 Effective Stress Distribution for Forging Process at 1150°C .......................... 48
3.31 Effective Stress Distribution for Forging Process at 1096°C .......................... 49
3.32 Effective Stress Distribution for Forging Process at 1049°C .......................... 49
3.33 Effective Stress Distribution for Forging Process at 1015°C .......................... 50
3.34 Effective Stress Distribution for Forging Process at 957°C ............................ 50
3.35 Effective Stress Distribution for Forging Process at 908°C ............................ 51
3.36 Effective Stress Distribution for Forging Process at 853°C ............................ 51
3.37 Effective Stress Distribution for Forging Process at 903°C ............................ 52
3.38 Effective Stress Distribution for Forging Process at 868°C ............................ 52
3.39 Z-Force Diagram for Forging Process at 1191°C ............................................ 53
3.40 Z-Force Diagram for Forging Process at 1150°C ............................................ 53
3.41 Z-Force Diagram for Forging Process at 1096°C ............................................ 54
3.42 Z-Force Diagram for Forging Process at 1049°C ............................................ 54
3.43 Z-Force Diagram for Forging Process at 1015°C ............................................ 55
3.44 Z-Force Diagram for Forging Process at 957°C .............................................. 55
3.45 Z-Force Diagram for Forging Process at 908°C .............................................. 56
3.46 Z-Force Diagram for Forging Process at 853°C .............................................. 56
3.47 Z-Force Diagram for Forging Process at 903°C .............................................. 57
3.48 Z-Force Diagram for Forging Process at 868°C .............................................. 57
3.49 Experiment Result and Analysis Result at 1191°C.......................................... 59
3.50 Experiment Result and Analysis Result at 1150°C.......................................... 59
xii

3.51 Experiment Result and Analysis Result at 1096°C.......................................... 59
3.52 Experiment Result and Analysis Result at 1049°C.......................................... 60
3.53 Experiment Result and Analysis Result at 1015°C.......................................... 60
3.54 Experiment Result and Analysis Result at 957°C............................................ 60
3.55 Experiment Result and Analysis Result at 908°C............................................ 61
3.56 Experiment Result and Analysis Result at 853°C............................................ 61
3.57 Experiment Result and Analysis Result at 903°C............................................ 61
3.58 Experiment Result and Analysis Result at 868°C............................................ 62
3.59 Punch Force at 1200 °C with 2mm mid thickness ........................................... 63
xiii

LIST OF TABLES
TABLE
1.1 Typical Values of Velocity for Different Forging Equipment............................. 9
1.2 Possible Forging Defects ................................................................................... 11
2.1 A Comparison of Process Characteristics .......................................................... 18
3.1 Operation Instructions........................................................................................ 31
3.2 Max Values at Different Temperatures for First Series of Simulation .............. 42
3.3 Average Values for Each Temperature Group................................................... 46
3.4 Max Values at Different Temperatures for Second Series of Simulation.......... 58
C.1 Experimental Data: Billet Dimensions and Measured Temperatures .............. 75
C.2 Experimental Data: Measurements on the Finished Parts ................................ 80
xiv

CHAPTER 1
INTRODUCTION
The term “forging” is applied to processes in which a piece of metal is
worked in a machine to the desired shape by plastic deformation of the starting stock.
The energy that promotes deformation is applied by a hammer, press, upsetter or ring
roller, either alone or in combination. The shape is imparted by the tools that contact
the workpiece and by careful control of the deformation process. A forging is
produced in three distinct phases: stock preparation in the form of blooms, billets, bar
or ingots; plastic deformation of the metal component to rough, close tolerance or net
shape in one of the forging processes; and appropriate secondary operations [1].
The art of forging dates to at least 4000 BC and probably earlier. Metals such
as bronze and wrought iron were forged by early man to produce hand tools and
weapons of war. Forging of wrought iron and crucible steel continued until near the
end of the 19th century for similar purposes and weapons of war are still produced by
the forging process using more contemporary metals.
The forge-smiths of the 19th century were particularly skilled at hand or by
open die forging of wrought iron. Many large shaft forgings weighing 10 tones and
more were gradually built up by a process of forging. The invention of the Bessemer
steel making process in 1856 was a major breakthrough for the ferrous forging
industry. The forgers now had a plentiful supply of low cost steel for production of
volume quantities of forgings. It has been accepted that the first cavity steel forgings
using a closed die process commenced in the United States in 1862 for production of
components for the Colt revolver.
1

The further development of the Bessemer process with the invention of the
basic steel making technique meant that cheaper supplies of iron ore containing high
phosphorus and sulphur levels could be smelted to produce good quality steel. The
simultaneous development of the open hearth steel making process toward the end of
the 19th century meant that the forging industry now had a reliable, low cost, high
volume raw material.
With the introduction of motor vehicles, a considerable demand for forgings
developed in the early years of the 20th century. Up until 1930, when the first
forging press was introduced (Maxi press), all forgings were produced on hammers.
The advantage of the forging press was exemplified by higher production rates and a
lesser degree of skill in producing forgings as compared to hammer forging. The
introduction of the forging press did not obsolete the forging hammer but rather
challenged the manufacturers to improve their product and of course, there are many
forgings which are best made on hammers [2].
Today we have computer controlled hammers and presses capable of making
a wide range of components in a variety of materials for many applications including
aerospace, automobile, mining and agriculture, to mention a few. So it is clearly seen
that, since the dawn of mankind, metal working has assured strength, toughness,
reliability, and the highest quality in a variety of products. Today, these advantages
of forged components assume greater importance as operating temperatures loads
and stresses increase [3].
The products of forging may be tiny or massive and can be made of steel (e.g.
automobile axles), brass (e.g. water valves), tungsten (e.g. rocket nozzles),
aluminium (e.g. aircraft structural members), or any other metal.
Forging is preferred in industry that because of having some basic advantages
as reduced machining operations, ability of producing complex parts, refined grain
structure and optimum grain flow, desirable directional properties. And also
structural integrity of final product is an important advantage for the firms. There is
2

no voids and porosity, they have relatively uniform mechanical properties and also
the response to heat treatment is predictable.
1.1 Forging Process
Forging process can be classified according to; (i) die type as closed die and
open die, (ii) machine type as hammer, mechanical press, hydraulic press, screw
press and upsetter and (iii) working temperature as hot forging, cold forging and
warm forging.
1.1.1 Forging with respect to Die Type
Open die forging is carried out between flat dies or dies of very simple shape
(Figure 1.1). The process is used mostly for large objects or when the number of
parts produced is small. Often open die forging is used to prepare the workpiece for
closed die forging [3]. The finished product in open die forging is a rough
approximation of the die because there is no fully controlling of the geometry of the
forging.
The simplest open die forging operation is the upsetting of a cylindrical billet
between two flat dies. As the metal flows laterally between the advancing die
surfaces, there is a less deformation at the die interfaces because of the friction forces
than at the mid-height plane. Thus, the sides of the upset cylinder becomes barrelled
as a general rule, metal will flow most easily toward the nearest free surface because
this represents the lowest frictional path [4].
Figure 1.1 Open Die Forging
3

In closed die forging the workpiece is deformed between die halves which
carry the impressions of the desired final shape (Figure 1.2) [3]. Since the workpiece
is deformed under high pressure in a closed cavity, parts with more complex shapes
and closer tolerances can be produced than with open-die forgings.
Figure 1.2 Closed Die Forging Operation
4

Figure 1.3 Schematic Drawing of Closed Die Forging
It is important to use sufficient metal in the forging blank so that the die
cavity is completely filled. Because it is difficult to put just the right amount of metal
in the correct places during fullering and edging, it is customary to use a slight
excess of metal. When the dies come together for the finishing step, the excess metal
squirts out of the cavity as a thin ribbon of metal called flash. In order to prevent the
formation of a very wide flash, a ridge, known as a flash gutter, is usually provided
(Figure 1.3). The final step in making a closed die forging is the removal of the flash
with a trimming die. The ideal is to design for the minimum flash needed to do the
job [3].
1.1.2 Forging with respect to Machine Type
Hammers are energy-restricted machines since the deformation results from
dissipating the kinetic energy of the ram. Hammer forging is a preferred method for
individual forgings. It is the shaping of a metal or other material, by an instantaneous
application of pressure to a relatively small area. A hammer or ram, delivering
intermittent blows to the section to be forged, applies this pressure [5].
5

The two basic types of hammers are the board hammer and the power
hammer. In the board hammer the upper die and ram are raised by friction rolls
gripping the board. When the board is released, the ram falls under the influence of
gravity to produce the blow energy. The board is immediately raised again for
another blow. Greater forging capacity is achieved with the power hammer in which
the ram is accelerated on the down stroke by stream or air pressure in addition to
gravity. Steam or air also is used to raise the ram on the upstroke.
Hammers can strike between 60 and 150 blows per minute depending on size
and capacity [3]. Hammer forging can produce a wide variety of shapes and sizes
and, if sufficiently reduced, can create a high degree of grain refinement at the same
time. The disadvantage to this process is that finish machining is often required, as
close dimensional tolerances can not be obtained [5].
The forging hammer is the cheapest source of a high forging load. It also has
the shortest contact time under pressure, ranging from 1 to 10 ms however; hammers
generally do not provide the forging accuracy obtainable in presses. Also, because of
their inherent impact character, problems must be overcome with ground shock,
noise, and vibration. Some of these problems are minimized with the counterblow
hammer which uses two opposed rams which strike the workpiece at the same time
so that practically all of the energy is absorbed by the work and very little energy is
lost as vibration in the foundation and the environment.
Press forging is similar to kneading, where a slow continuous pressure is
applied to the area to be forged. The pressure will extend deep into the material and
can be completed either cold or hot. Press forging is more economical than hammer
forging (except when dealing with low production numbers), and closer tolerances
can be obtained. A greater proportion of the work done is transmitted to the
workpiece, differing from that of the hammer forging operation, where much of the
work is absorbed by the machine and foundation. This method can also be used to
produce larger forgings, as there is no limitation in the size of the machine [5].
6

Forging presses are of either mechanical or hydraulic design. Mechanical
presses are stroke-restricted machines. Most of them utilize an eccentric crank to
translate rotary motion into reciprocating linear motion of the press slide (Figure
1.4). The ram stroke is shorter than in a hammer or hydraulic press, so that
mechanical presses are best suited for low-profile forgings. The maximum load is
attained when the ram is about 1/8 in of the bottom dead centre position. The blow of
a press is more like a squeeze than like the impact of a hammer. However, the initial
cost of a press is much higher than with hammer, so that large production runs are
needed. The production rate is comparable to that of a hammer, but since each blow
is of equal force, a press may be less suitable for carrying out preliminary shaping
and finishing operations in the same piece of equipment [3].
Figure 1.4 Schematic Drawing of Mechanical Press
Hydraulic presses are load-restricted machines in which hydraulic pressure
moves a piston in a cylinder (Figure 1.5). A chief feature is that the full press load is
available at any point during the full stroke of the ram. This feature makes the
hydraulic press ideally suited for extrusion-type forging operation. The ram velocity
can be controlled and even varied during the stroke. The hydraulic press is a
relatively slow speed machine. This results in longer contact time, which may lead to
problems with heat loss from the workpiece and die deterioration. On the other hand,
the slow squeezing action of a hydraulic press results in close-tolerance forgings. The
7

initial cost of a hydraulic press is higher than that of a mechanical press of equal
capacity [3].
Figure 1.5 Schematic Drawing of Hydraulic Press
Screw presses (Figure 1.6) are widely used in Europe for both hot and cold
closed die forging. In a screw press, the ram is connected by a rotary joint to a
spindle, which is in effect a large screw. The rotary motion of a flywheel is
transformed into linear motion by the multiple threads on the spindle and its nut [3].
Figure 1.6 Schematic Drawing of Screw Press
8

Table 1.1 Typical Values of Velocity for Different Forging Equipment [6]
Forging Machine Velocity
(m/s)
Gravity drop hammer 3. 6-4.8
Power drop hammer 3.0-9.0
HERF machines 6.0-24.0
Mechanical press 0.06-1.5
Hydraulic press 0.06-0.30
More information about these machines can be found in several publications
[7-9].
1.1.3 Forging with respect to Working Temperature
Cold forging involves either impression die forging or true closed die forging
with lubricant and circular dies at or near room temperature. Small range of parts and
materials can be utilized at cold forging. Carbon and standard alloy steels are most
commonly cold-forged. Parts are generally symmetrical. Parts with higher precision
with a high surface quality and close tolerances can be produced. No shrinkage
occurs. Production rates are very high with exceptional die life. High forces are
required and intermediate treatments are needed. While cold forging usually
improves mechanical properties, the improvement is not useful in many common
applications and economic advantages remain the primary interest. Tool design and
manufacture are critical.
Hot forging is the plastic deformation of metal at a temperature and strain rate
such that recrystallization occurs simultaneously with deformation, thus avoiding
strain hardening. For this to occur, high workpiece temperature (matching the metal's
recrystallization temperature) must be attained throughout the process, so energy
needed for this preheating. By hot forging, it can be produced a great variety of
9

shapes with virtually any steel. The extensive scale formation occurs on the surface
of the workpiece. Larger tolerances and allowances are needed for further machining.
A form of hot forging is isothermal forging, where materials and dies are heated to
the same temperature. In nearly all cases, isothermal forging is conducted on super
alloys in a vacuum or highly controlled atmosphere to prevent oxidation.
Warm forging combines the advantages of both cold and hot forging; surface
quality, precision and material utilization from cold forging and, processable range of
materials and shapes from hot forging side. However, the implementation of warm
forging is limited by high investment costs for the rearrangement of machines and
expenses for tools and development. Temperature range is usually between 600ºC
and 900ºC. Ferrite brittleness and scaling factor is limiting for this working
temperature range.
Warm forging is a relatively new process that became known in early 70s.
While it is more established in the industry of East-Asian countries and Japan, warm
forging is not used widespread in Europe. It is mainly applied to rotationally
symmetric parts and often combined with cold forging in the production of bevel
gears, journals, etc. Warm forging will be discussed in Chapter 2 in detail.
1.2 Forging Defects in Forging
A defect is a flaw in a component that is typical of a process, but not
inevitable. Good forging practice can eliminate most of them. They can be
summarized in a table as below.
10

Table 1.2 Possible Forging Defects [10]
Possible Forging Defects
Defect Description Problem
Segregation Non-uniform distribution of
elements in metal
Non-uniform hardness
High-hydrogen
content
Forms of hydrogen fissures
(flakes)
Embrittlement
Inclusions Nonmetallic particles in metal Act as stress-raisers; make
machining difficult (tool
breakage)
Bursts Internal tears (effect of forging
operations on inclusions, etc.)
Cracking
Poor grain structure Overheating, improper billet
size, poor die design, etc.
Poor properties in crucial
directions; fatigue failure
Laps (folds) Hot metal folded over and
forged into surface, creating
discontinuity
Stress-raisers; may cause
machining or heat treat
cracking problems
Seams Hot surface tears in original
ingot; embedded scale, etc.
Stress-raisers
Cold shuts Defective metal flow Low strength
Cracks, tears Internal discontinuity (poor
design; poor practice – metal
too cold, etc.)
Cracking
1.3 Usage of CAD/CAM/CAE for Analysis of Forging Process
With the development of Computer-Aided-Design (CAD), Computer-Aided-
Manufacturing (CAM) and Computer-Aided-Engineering (CAE) techniques, it
become possible to reduce time and effort on design and manufacturing stages.
11

By using CAD/CAM softwares, the designer can create the 3-D model of the
forgings, preform geometries, and the necessary dies. Modelling in detail gives the
opportunity to change the parameters such as dimensions, taper angles, fillet radii,
shrinking factor, etc. easily and to optimize the process by that trialling study form.
FEM - Finite Element Method or FEA - Finite Element Analysis is a
numerical method for calculating stresses and deformations in complex geometrical
structures. The structure is divided into so called "finite elements" connected through
nodes. The physical facts are described on the basis of initial or boundary conditions
for each of the elements concerned. The definitions of all elements are summarised
in the global system of equations, which can be solved. Some programs used as
simulation packages which use this algorithm are ANSYS, MARK, DEFORM,
FORM etc. [11-14]. By using these programs, metal flow, stress, strain and
temperature distributions can be predicted.
Development of FE simulation technology in forging area started in the late
1960s. During 1970s and early 1980s two-dimensional (2D here after) steady state
simulation such as drawing/extrusion of round bar and plane strain sheet rolling,
which do not require remesh, were available [15-17]. 2D non-steady state metal flow
with manual remeshing, which required much time to complete a simulation, were
applied in limited forging areas especially in hot forging of aero-space part
development [18,19]. Since automatic meshing and remeshing technology was
developed in the late 1980s and early 1990s [20] capability of practical use of FE
simulation has been drastically increased and accompanied by the wide spread high
cost-performance workstations. The automatic remeshing technology as well as the
high cost-performance computer made the FE simulation softwares as a practical
development tool in large size forging companies. From the middle of 1990s, 2D FE
simulations were used widely as a practical tool even in small and medium size
forging industries.
3D FE simulations have been used since softwares equipped with automatic
remeshing capability were commercialized from the middle of 1990s. Recently, 2D
12

FE simulation softwares which run on PCs, with user friendly interface and short
simulation lead times are being commercialized. On top of these backgrounds,
various success stories on practical use of FE simulations encourage even small size
forging companies to use FE simulation as a daily work tool [21].
Finite Volume Method (FVM) [22] is a method utilized in forging
simulations. Unlike a traditional FE mesh, which distorts while attempting to follow
the deformation material, the mesh is a fixed frame of reference and material simply
flows through the finite volume mesh. Forging typically involves large material flow
as well.
The finite volume method is a numerical method for solving partial
differential equations that calculates the values of the conserved variables averaged
across the volume. One advantage of the finite volume method over finite difference
methods is that it does not require a structured mesh (although a structured mesh can
also be used). Furthermore, the finite volume method is preferable to other methods
as a result of the fact that boundary conditions can be applied noninvasively. This is
true because the values of the conserved variables are located within the volume
element, and not at nodes or surfaces. Finite volume methods are especially powerful
on coarse nonuniform grids and in calculations where the mesh moves to track
interfaces or shocks [23].
Hyman [24] have derived local, accurate, reliable, and efficient finite volume
methods that mimic symmetry, conservation, stability, and the duality relationships
between the gradient, curl, and divergence operators on nonuniform rectangular and
cuboid grids.
MSC.SuperForge is a software package for the computer simulation of
industrial forging processes. It combines a robust finite volume solver with an easy-
to-use graphical interface specifically designed for the simulation of 3D bulk forming
operations. MSC.SuperForge is being effectively utilized by forging companies and
suppliers worldwide to successfully simulate the forging of a variety of practical
industrial parts [25]. In the software, the advantages of the finite element and the
13

finite volume approach are combined; it employs a finite volume mesh for tracking
material deformation and an automatically refined facet surface to accurately track
the free surface of the deforming material. This approach is both fast and accurate
since flow calculations are performed on a fixed finite volume mesh and material
simply flows through it. It is also robust since re-meshing techniques are completely
eliminated [26]. This provides a unique advantage in the simulation of three-
dimensional parts; where finite element based solutions typically break down.
Some previous studies have been conducted on different types of forgings.
As a Ph.D. study at University of Birmingham, Gökler [27] developed a computer
program for the design of the operational sequences and the dies for horizontal
forging machines. Upset forging has also been studied by Kazancı [28]. He
developed a program named as Pro/UPSETTER for the sequence and die design of
solid hot upset forgings having circular shanks and upset regions with non-circular
cross-sections. In another study, Moğulkoç [29] rationalized the design rules for
upsetting and piercing on horizontal forging machines and suggested a new
methodology for the geometry of the profiles by using the finite element analysis
technique.
Ceran [30] studied on hot upset forging process by using a commercial finite
element code coupled with thermal analysis in order to determine effects of the
process on the header die for the taper preform stages. A study on upset forging
process and the design limits for tapered preforms had been conducted by Elmaskaya
[31] by using the elastic-plastic finite element method. İsbir [32] studied on the finite
element simulation of shearing using the element elimination method to examine
trimming operation on forged parts. In the study of Doğan [33], the effects of the
tapered preform shapes on the final product in cold upset forging had been
investigated by using the elastic-plastic finite element method.
Alper [34] developed a computer program for axisymmetric press forgings,
which designs the forging geometry and the die cavity for preforms and finishing
operation.
14

Kutlu [35] studied on the design and analysis of preforms in hot forging for
non-axisymmetric press forgings. Karagözler [36] studied on the analysis and
preform design for long press forgings with non-planar parting surfaces. Gülbahar
[37] studied on the preform design and analysis of hot forging process for a heavy
vehicle steering joint. Civelekoğlu [38] studied on analysis of hot forging for three
different alloy steels.
Also in warm forging studies, computer aided programs have been used to
analyses. Shivpuri [39] has studied on advances of process modelling techniques in
cold and warm forging by using DEFORM, ANSYS and ABAQUS. Just [40] were
interested in the verifications of the damage model of effective stresses in cold and
warm forging operations and used FE Software MSC.Superform 2002. He used
model of effective stresses (MES) in the FE evaluation of the experiments.
Kim [41] made studies on effects of surface treatments and lubricants for
warm forging die life and used DEFORM. Another study on die life and lubrication
in warm forging belongs to Iwama [42]. Sheljaskow [43] has also studies on tool
lubricating systems in warm forging.
Xinbo [44] studied on the flow stress characteristics of some specific
materials in the temperature range of warm forging. Just [45] made a FE based
fracture analysis in order to extend the forming limits in cold and warm forging by
using MSC.Superform 2002. Kim [21] researched practical and effective use of FE
simulation in cold and warm forging process and tool design. Xinbo [46] discussed
the flow stresses of carbon steel 08F in temperature range of warm forging in his
study. Lee [47] studied on application of numerical simulation for wear analysis of
warm forging by using DEFORM as a FEM code.
15

1.4 Scope of the Thesis
The advantages and disadvantages of hot, cold and warm forging have been
discussed in the previous section and it has been decided that it would be worth to
study on analysis of forging at different temperatures.
In this study hot and warm forging processes of a part which is used in
automotive industry, have been examined. The processes in different temperatures of
the part, in which 1020 carbon steel has been used, have been analyzed by the finite
volume analysis software, MSC. Superforge. The sample part and dies are modeled
by using CatiaV5. The results of these analyses will be compared with the results of
the experimental tests that have been performed in a forging company.
In Chapter 2, warm forging process is examined in detail. In Chapter 3, case
study for an industrial forging is presented. Finally, conclusions and suggestions for
future works are given in Chapter 4.
16

CHAPTER 2
WARM FORGING
2.1 Industrial History of Warm Forging
Warm forging is a relatively new process that became known in early 70s.
The growth in the automotive industry brought the cold forging application in serial
mass production of a wide range of component types. This caused that some cold
forging techniques have been developed to be able to get near-net and net-shape
components in large batch quantities. However; the limitations in economic
production of parts with complex geometry, large size and in certain alloys caused
the developments and commercial usage of warm forging process.
2.2 Warm Forging Technology
Warm forging can be applied to the steel parts within the temperature range
of 600ºC and 900ºC except the austenitic stainless steels, since they are forged at
200-300ºC [48]. It has some advantages compared to both hot forging and cold
forging. Warm forging offers better utilization of material, improve a surface finish,
and dimensional accuracy when compared with hot forging and reduced press loads
when compared with cold forgings.
Independent of the fact that the temperature interval of warm forging is close
to hot die forging temperatures, this forming process, with regard to the used design
concepts for the tool and the achievable quality of the manufactures components, is
often considered an expansion of cold forging to such workpiece materials that
cannot be forged at room temperature or only with difficulty [49].
17

2.2.1 Basic Characteristics of Warm Forging
A comparison of the typical characteristics of hot, warm and cold forging
processes is given in Table 2.1.
Table 2.1 A Comparison of Process Characteristics [49]
Hot Warm Cold
Weight of the Workpiece <60 kg <10 kg <2 kg
Steel Grade Any
C desirable
Other alloying
elements < 10 %
Low alloyed steels
(C<0.45%, other
<3%)
Shape
Any
without
undercut
Rotationally-
symmetrical
without undercut
Rotationally-
symmetrical
without undercut
Surface Quality Low Medium High
Intermediate Treatments Not
necessary
Normally no
surface treatment
Annealing and
bonderizing
Deformation Pressure Low Medium High
Energy Costs High Medium Low
Tolerances Generous Close Closest
Tooling Costs Lowest High High
2.2.2 Workpiece Material for Warm Forging
Warm forging can be applied to a larger variety of metal alloys, in particular
to various grades of steels and to numerous non-ferrous metal alloys. Most
engineering steels may be warm forged but there are limitations to deformation,
18

depending on chemical composition and forging temperature. For forging at
temperatures of 600ºC and above, metal should be used in the as-received hot rolled
or drawn condition. For lower temperatures a spheroidize annealing treatment is
often helpful. Different classes of steels have different characteristics which basically
determine the working temperature [48].
• Carbon Steels: Since they may be brittle at 200-500ºC, forging above 600ºC
is good to have reduction in flow stress and high ductility.
• Alloy Steels: The flow stress decreases while temperature increases.
Generally they can be forged at any temperatures depending on
circumstances.
• Austenitic Stainless Steels: Flow stress decreases greatly while temperature
increases in small amounts, although they may strain harden. These kind of
steels are usually forged at 200-300ºC.
S. Sheljaskov [49] classifies the workpiece materials that used in warm
forging as unalloyed or low alloy cementation steels, heat-treatable steels, steels for
superficial hardening, ball-bearing steels and stainless steels. Some examples for
these materials are given below;
• Cementation steels: Ck10 (AISI 1010), Ck15 (AISI 1015), 15CrNi 6
(AISI4320), 16MnCr5 (AISI 5117), 20 MnCr5 (AISI 5120).
• Heat-treatable steels: Ck35 (AISI 1035), Ck45 (AISI 1045), Ck60 (AISI
1060), 34Cr4 (AISI 5132), 34CrMo4 (AISI 4137), 42CrMo4 (AISI 4140),
50Crv4 (AISI 6150).
• Steels for superficial hardening: Cf53 (AISI 1053).
• Ball-bearing steels: 100Cr6 (AISI E52100).
• Stainless steels: X5CrNi 18 9 (AISI 304L), X10CrNiMo 17 12 (AISI 316).
19

2.2.3 Tools and Tool Steels in Warm Forging
The tools for warm forging and predominantly the active elements of these
tools such as dies and punches are exposed to a high, mostly penetrating, cyclical
mechanic stress that in the area close to the surface is superimposed by thermal,
tribological and even chemical stresses. The combination between rather high
forming temperatures and the still relatively high forming forces make the selection
of suitable tool material as well as the design of the entire tool construction for warm
forging more difficult than for cold or hot forging [49].
Conditional on the considerably higher forming forces in comparison to hot
forming, the tool design and the tool structure must be orientated towards the ones of
cold forging tools. On account of the still high flow stress, the tools must be
prestressed. For this reason, forming of mainly rotationally symmetrical or axially
symmetrical components is a prerequisite for the use of this process.
In warm forging, as with any forming operation, the choice of tool material
can be critical both technically and economically. Technical failures of tooling due
to excessive wear, deformation, cracking or heat checking occur because either the
wrong steel has been selected or because the heat treatment, coating or machining
procedures have not been optimized. All technical failures lead to financial loss due
to lower tool life and therefore increased tool material costs, repair costs,
maintenance costs and increased stand still time leading to lower productivity.
The stresses the tool experiences during warm forging lead to requirements that
can be summarized in three basic properties and the tool material must comply with
them, namely dimensional stability, security against fracture and resistance to wear.
A general classification for tool steels may be done as followings [48]:
• High Speed Steel: Longest tool life is achieved with high speed steel such as
M2 or its equivalents in powder metallurgy form. High speed steels have low
20

temperature shock resistance. They must be preheated and can be cooled
during production only by air. The use of water cooling or water based
lubricants will cause rapid fracture. This characteristic of high speed steels
may limit productivity if a high rate of forging would result in a significant
heat build up in the tools.
• Hot Work Steels: Steels of the chromium, molybdenum, vanadium family
such as, X40CrMoV51 and H13 do not possess the strength or hardness of
high speed steels but are tougher with greater resistance to thermal shock.
Therefore they can be rapidly cooled in service. A variety of these steels is
available enabling hardness’s between 50 and 60 HRC to be achieved
appropriate to various process conditions.
• High Nickel Alloys: Nickel alloys can be used to achieve excellent service
lives under extreme conditions. These alloys have: high fatigue strength,
high thermal shock resistance and high toughness over a range of
temperatures. The use of Inconel 718 has been reported in [50]. The
successful use of an 18% nickel maraging steel extrusion punch was reported
in [51]. This was solution treated at 820°C and aged for 3 hours at 500°C to
give a proof stress of 1850 MPa. The use of these alloys is usually prohibited
by their high cost which can be an order of magnitude greater than that of
conventional steels.
• Tungsten Carbide: This material can be used as inserts for warm forging tools
[49]. However it has been reported that failure of carbide tools may occur
when forging ceases and cooling takes place [50].
• Cobalt Alloys: Cobalt based alloys, available under the trade name Stellite,
may be used in regions of tools which deform and erode due to overheating.
These alloys are usually welded to the surface of the tools. A known example
of the use of Stellite is as a welded ring around the periphery of a hot work
steel counterpunch which could not be adequately cooled.
21

2.2.4 Heat Treatment for Warm Forging
Materials can be improved before or after manufacturing by different heat
treatment processes. Forging is usually performed to hot metals, allowing for
smoother flow and easier deformation. Steel is heated to varying temperatures,
usually between 930°C to 1100°C but can reach as high as 1315°C for hot forming,
depending on the carbon content. Depending on the amount of work required to the
piece, it may be necessary to reheat the piece one or more times. The temperature of
the metal when completely forged is called the finishing temperature. After forging,
the material must be cooled uniformly and protected from moisture or cold air. This
is done by placing the material into dry ashes, lime or mica dust in order to retard the
rate of cooling [5].
Preheating: Preheating of materials is done to help prevent cracking or
distortion of the material. This is done by placing the metal in a series of furnaces of
increasing temperatures instead of throwing it directly into the furnace used to heat
the metal for forging, annealing, normalizing or hardening. Another way to achieve
this is to start in a cold furnace and slowly bring it to temperature.
Annealing: Annealing should follow forging as soon as possible whenever
machining is required. Annealing is the heating and then cooling of metal to make
the metal less brittle, or more malleable and ductile. This will soften the steel that
was previously hardened and reduce internal stresses. Annealing is done by heating
the metal to a temperature beyond the critical temperature and holding it there for a
period of time. The metal is then cooled in the furnace and not removed until the
furnace is cold. It can also be cooled to a temperature within the furnace that is
known to be below the lower critical temperature, at which the annealing is
complete. Slower cooling rates are required as carbon content increases in the metal.
Normalizing: Normalizing is done to improve the crystalline structure of the
steel, thus obtaining superior properties. Heating the forged part just beyond the
critical temperature and then allowing it to air-cool completes normalizing. This
22

allows the grain-size to be refined and, if not held at that temperature too long, will
result in a newly formed crystalline structure. The internal stresses, if any, will be
relieved, hardened steels will be softened, overheated steels will have a more
favourable, normal fine-grained structure, and structural distortion will be removed.
Hardening: Hardening of steels can also be done after forging. The workpiece
is heated slowly, to obtain the finest grain-sizes, to its hardening temperature – much
higher than annealing temperatures. The metal is kept at this temperature only until
uniform heat distribution and completion of the thermal transformation. Prolonged
exposure at these elevated temperatures will result in increased grain growth and
surface decarbonization, if no protection from oxidation is provided. Oxidation can
be avoided by surrounding the metal with some material that will use up the oxygen
that is present in the furnace. Once the metal has been uniformly heated to
temperature, it is removed from the furnace and placed directly into a quenching
tank. This rapidly cools the metal and the metal retains its new qualities.
Surface treatment operations may be performed on forgings to remove scale
formed during forging and heat treatment, improve corrosion resistance, enhance
appearance and improve surface properties. Surface treatment requirements are based
on the alloy and forging process employed [1]. For example:
• Cold and warm forging operations are performed on steel alloys below the
temperature range at which scale forms and do not require the removal of
scale.
• Scale formation of stainless steel alloys is not generally a problem.
• Aluminum alloys can be given a hard anodized surface to improve abrasion
and corrosion resistance.
• Forgings made from copper based alloys generally exhibit good surface
quality and high corrosion resistance that eliminates the need for most surface
treatment operations.
23

2.2.5 Lubrication for Warm Forging
The service life of the die is restricted by wear, thermal cracking and fatigue,
and plastic deformation, etc. there have been many research projects to investigate
the influence of these factors on tool life [52-55]. In general, however, the surface
hardness of die increases during repeated operations, which induces thermal
softening in warm forging processes. The thermal softening accelerates the wear,
thermal cracking and fatigue, and the plastic deformation of the die [56,57].
In order to increase the die life, heat treatments have been performed for the
die to increase the surface hardness, and surface treatments are also applied to the die
to reduce the friction and to increase the thermal insulation. The thermal properties
of the die are changed due to the surface treatments.
The roles of lubricants are to reduce friction between the die and the
workpiece and to reduce heat-transfer from the billet to the die during the forming
processes. Graphite, a solid lubricant, is sprayed onto the die or workpiece before the
warm forming process. The heat- transfer coefficient, from the billet to the die, has
different values according to the kind of graphite [58]. In addition, the selection of
suitable lubricant for the extending die life leads to reduce heat transfer from the
workpiece to the die life.
Spraying is almost always used to apply tool lubrication and automatic
lubricating systems synchronized to the stroking of the forging machine are essential
in high productivity mass production lines. In some cases tools are flooded with
lubricant.
Some lubrication systems sequentially blast air into the cavities to clear
debris, blow air/water mist mixture for cooling and then spray a lubricant.
Depending on the tool materials and the lubricant one or all three of these operations
can be used in a sequence of forging operations.
24

An important rule to observe is that the quantity of lubricant to be applied
should be sufficient only to maintain an interfacial barrier between workpiece and
tools during forging. If this is inadequate to cool the tools sufficiently two
possibilities exist to remedy the situation:
1. If the lubricant is water-based, dilute it and increase the spray time. By this
means a greater quantity of water will be applied to the tools for a given
quantity of lubricant.
2. Apply an air, water or air/water spray before applying the lubricant. Such a
measure depends on sufficient time being available in a forging stroke, for two
different spraying operations.
The study on die life and lubrication in warm forging, by Iwama and Morimoto
[42], is resulted as die life of the punch is affected by heat cracks and softening of the
surface layer. To improve die life, it is essential that there is dry lubrication adhesion
layer which binds strongly to the die. The die temperature range which provides the
appropriate lubrication adhesion layer thickness is between 200 and 300°C. The most
favorable die surface temperature at the start of the lubricant spraying is 300°C. The
lubricant adhesion layer can be created in the shortest time by making the lubricant
spray granules small.
Also there is a study made by S. Sheljaskow [43] on tool lubricating in warm
forging which focuses on the environmental effects of these systems. In order to
secure healthier working conditions for the operators and the other workers in the
forging shop as well as a minimal environmental impact in combination with an
optimal tool life, the European Community has funded a Brite-Euram industrial
research project on the development of environmentally friendly tool lubricating
systems. The result of the experiments made by this community is showed that slug
coating and die lubricant selection should be treated as a package. The best results
concerning environmental impact and tool life are achieved by the application of tool
25

lubricating systems consisting of a graphite-based slug coating and an oil-graphite-
free die lubricant.
2.2.5.1 Lubricant Types
Lubricants may be grouped into the following types [48]:
• Colloidal Graphite-Oil:
These lubricant types have a lower latent heat of evaporation than the water
based ones and are suitable for use with high-speed steel tools for which rapid
cooling is detrimental. In many cases flooding of the tools is employed (the tools
are designed with drains and vents to allow its escape) and if extra cooling is
required an air blast is used also. A disadvantage of this type of lubricant is the
smoke and fumes which are formed on contact with a heated workpiece as well
as the high cost of disposal in conformation with environmental control.
• Colloidal Graphite-Water:
These lubricants are essentially pollution free and non toxic, with the
qualification that graphite forms carbon monoxide and carbon dioxide. Also
small amounts of organic compounds added to improve adhesive properties and
increase temperature stability, decompose on contact with the workpiece to form
traces of noxious gas but with no known significant health hazard. The
lubricants are corrosive however largely due to the presence of ammonia as a
bactericide and fungicide, so that pipes and fittings should be of stainless steel.
Water based graphite lubricants used under the correct conditions form a solid
coating on the tools. This is an advantage in situations when an oil based
lubricant would run off the tool surface or be squeezed out of the workpiece/tool
interface. To perform properly a water based lubricant must adhere to the tools
as the carrier evaporates. The durability of graphite coatings is enhanced by the
26

presence of binding agents which also raise the wetting temperature of the
lubricants. Current products are commonly used to coat tool surfaces at
temperatures of 400°C and above and using special spraying techniques have
been used to coat tools at temperatures up to 800°C. Because of their good
coating and friction reducing properties water based graphite lubricants are
probably the most popular at present. However; although they are
environmentally, virtually harmless the fact that they cause plant and equipment
to be covered in a black film has brought them into disfavour and attempts are
underway to develop white or colourless lubricants. Another disadvantage of
colloidal graphite is that unless continuously agitated it tends to flocculate,
forming a sediment in the holding tanks and clogging up pipes and spray nozzles.
• White Mineral in Water:
The compositions of these lubricants are largely known only to the
manufacturers. The substances used have a molecular structure which allows the
relative sliding of lamellae. Boron nitride and aluminium silicate are minerals
known to have been used and although they form robust interfacial boundaries to
obviate pick-up they are not very effective at reducing friction.
• Colourless Solutions in Water:
(a) Synthetic or vegetable based emulsions with additives usually
comprise about 40% of the lubricant. They may be sprayed or flooded and are
recyclable but have a wetting temperature of only 300°C.
(b) Solutions of up to 18% salts or soaps in water have wetting
temperatures of about 400°C. They can be used as the sole lubricant in a process
but with pregraphited billets the lubricity of the system is improved significantly
[59].
27

The development of white/colourless lubricants has been underway for
several years and noticeable performance improvements have been achieved.
The question of tool life vis a vis graphited lubricants has yet to be answered.
One distinct advantage of these lubricants is that being water soluble the plant
and workshop environment is readily washed clean. Also as the lubricating
substances remain in solution pipework does not become clogged.
28

CHAPTER 3
CASE STUDY
As case study, forging of a particular part which is used in automotive
industry and have been made of 1020 carbon steel, is analyzed for a temperature
range of 850-1200°C. Firstly, the forging process is simulated by a finite volume
program. The effective stress values obtained on the part, considering the ultimate
strength of the die material, showed that the currently used die set is applicable for
the same temperature range. Then, experimental studies are conducted for the same
temperature range in a forging company. When it is observed that, the results of the
first series of simulation and experimental studies do not correspond, finite volume
analyses are repeated by using the values determined from experiment. In the
following sections, results of the case study are presented.
3.1 Sample Part
The “Ring”, which has been analyzed as the case study, is being produced in
AKSAN Forging Company, Ankara for automotive industry. The technical drawing
and the model of the part are shown in Figure 3.1 and Figure 3.2, respectively. The
material of the part is designated as AISI 1020 (DIN 1.1151) and its properties are
given in Appendix A. The operation instructions of this part followed by AKSAN
[60] are provided in Table 3.1. Forging steps are given in Figure 3.3. The billet is
heated initially. Then, in the first stage, it is upset by open die forging. Subsequently
the preform is forged in closed dies to obtain the forged part. Finally, the forged part
is trimmed to obtain the finished part. Trimming is not analyzed in this study.
Intermediate shapes of the part are shown in finish forging stage, in Figure 3.3.
29

Figure 3.1 Technical Drawing of “Ring” [60] (Dimensions are in millimetres.)
Figure 3.2 Model of Part “Ring”
30

Table 3.1 Operation Instructions [60]
Op # Operation Equipment
1 Saw the bar to length of 34 mm with billet
diameter 32 mm Sawing Machine
2 Heat the billet up to 1200°C 970 KW Induction Heater
3 Check the temperature with optical
pyrometer Optical Pyrometer
4 Upset the billet to clean scale 1000 tonf Mech. Press
5 Place the billet on the blocker and preform
the billet 1000 tonf Mech. Press
6 Place the preform on the finisher die and
forge the final shape 1000 tonf Mech. Press
7 Place the finished part on the punch die and
punch out the hole 320 tonf Mech. Press
8 Place the finished part on the trimmer and
trim the flash 320 tonf Mech. Press
(a)
(b)
Figure 3.3 Simulation of Forging Steps of Sample Part
(a) First stage (b) Second stage of forging
31

3.2 First Series of Simulation of Forging
The forging process is modelled by Superforge Program [25,26], which is a
commercially available finite volume code. Parameters of 1000 tonf (10 MN)
mechanical press used in the particular forging company are entered in the numerical
analysis software. In the program, the press is represented as given in Figure 3.4 with
crank radius (R) of 125 mm, rod length (L) of 665 mm and rotational speed (ω) of 90
rpm.
Figure 3.4 The input parameters of 10 MN mechanical press
Plastic shear friction model is used with 0.3 as the interface friction factor
[61]. The element size used in the modelling of the workpiece is taken as 1 mm. The
preform dies are composed of flat cylindrical blocks. The finish dies are modelled in
Catia V5. The models of the finish dies can be seen in Figures 3.5 and 3.6. The dies
are assumed as rigid surfaces in the analysis. The die temperature is taken as 250°C
during the analysis. The die material is DIN 1.2714 or L6 and its properties are given
in Appendix B. In the simulation, a facial clearance of 1.5 mm is maintained. The
numerical results are taken at the temperatures between 870-1200°C with the
increments of 50°C.
32

Figure 3.5 Model of Lower Finish Die
Figure 3.6 Model of Upper Finish Die
When stress distribution values given in Figures 3.7 - 3.14 are examined, it
can be seen that warm forging process results in higher stress values than hot forging.
33

Figure 3.7 Effective Stress Distributions for Forging Process at 1200°C
Figure 3.8 Effective Stress Distributions for Forging Process at 1150°C
34

Figure 3.9 Effective Stress Distributions for Forging Process at 1100°C
Figure 3.10 Effective Stress Distributions for Forging Process at 1050°C
35

Figure 3.11 Effective Stress Distributions for Forging Process at 1000°C
Figure 3.12 Effective Stress Distributions for Forging Process at 950°C
36

Figure 3.13 Effective Stress Distributions for Forging Process at 900°C
Figure 3.14 Effective Stress Distributions for Forging Process at 870°C
37

The punch force diagrams are given in Figures 3.15 - 3.22. The die forces
obtained in warm forging process are higher than hot forging process. Therefore, at
lower temperatures higher capacity presses are needed to deform the material.
Figure 3.15 Punch Force Diagram for Forging Process at 1200°C
38

Figure 3.16 Punch Force Diagram for Forging Process at 1150°C
Figure 3.17 Punch Force Diagram for Forging Process at 1100°C
Figure 3.18 Punch Force Diagram for Forging Process at 1050°C
39

Figure 3.19 Punch Force Diagram for Forging Process at 1000°C
Figure 3.20 Punch Force Diagram for Forging Process at 950°C
40

Figure 3.21 Punch Force Diagram for Forging Process at 900°C
Figure 3.22 Punch Force Diagram for Forging Process at 870°C
41

The maximum values of effective stresses and punch forces are given at
different temperatures for the first series of simulation in Table 3.2. As shown in
Table 3.2, successful die fillings have been observed for the temperature range of
870-1200ºC.
Table 3.2 Max Values at Different Temperatures for First Series of Simulation
Workpiece Temperature
Max. Effective Stress
Max. Punch Force
Die Filling Success
1200 ºC 190.3 MPa 1.200 MN Filled
1150 ºC 182.0 MPa 1.162 MN Filled
1100 ºC 192.7 MPa 1.179 MN Filled
1050 ºC 209.3 MPa 1.252 MN Filled
1000 ºC 215.3 MPa 1.258 MN Filled
950 ºC 233.4 MPa 1.354 MN Filled
900 ºC 242.8 MPa 1.369 MN Filled
870 ºC 243.2 MPa 1.418 MN Filled
3.3 Experiment Results
The finite volume analyses results showed that, since the stress values
obtained on the parts are smaller than the ultimate tensile strength value of die
material, and maximum punch force needed to forge the raw material in these
temperatures are smaller than forging press capacity (1000tonf), it has been decided
that the available die set can also be used for lower temperatures. Therefore,
experiments have been conducted for different temperatures in Aksan Forging
Company. For this purpose 10000 kN (1000 tonf) mechanical press is used. The
1000 tonf mechanical press, and the preform and finish dies fastened on the press can
be seen in Figures 3.23 and 3.24, respectively.
42

Figure 3.23 1000 tonf Mechanical Press
Figure 3.24 Preform and Finish Dies Fastened to the Press
According to TS 2756 Standard, at least five samples of products should be
taken to obtain reliable results for the experiments. Therefore, for each temperature,
1 heated billet, 5 preformed and 5 finished parts have been taken. During the
43

experiment, the temperatures of the billet and dies are measured by two different
pyrometers.
Figure 3.25 Lower and Upper Finish Dies Used in Experiment
The finish dies are shown in Figure 3.25. The two different pyrometers were
used to measure workpiece and dies temperatures. The pyrometer used to measure
the workpiece temperature has the range of 600 – 1400ºC whereas the pyrometer
used to measure the die temperature has the range of -32 – 600 ºC. In the Figure 3.26
the forged parts in experiment can be seen.
After completing the experiments measurements are taken on the finished
part. The diameters and flash thicknesses are measured by compass, plug thicknesses
(central region) are measured by comparameter, the heights are measured by CMM
and the roughness values are measured by roughness measurement device. The
experimental data is presented in Appendix C in detail. Finally, for each temperature
group, averages of these values have been calculated and given in Table 3.3.
44

45
The finish dies are also measured in CMM and it has been seen that they have
larger sizes compared to the dies, which are applied in the first series of simulations
by using the values given by AKSAN Forging Company. The difference may be
attributed wear due to the usage.
Since the material did not fill the die cavity completely for the temperatures
1015°C, 957°C, 908°C and 853°C, the lower finish die is raised by 1 mm in the last
two experiment groups.
Figure 3.26 The parts in box waiting for cooling

46
Billet Temp.
Billet Diameter
(mm)
Billet Height (mm)
Calculated Billet Mass
(g)
Min Required
Mass (g)
Finish Die
Temp. (Lower)
Finish Die
Temp. (Upper)
Part Diameter
(mm)
Part Height (mm)
Measured Part Mass
(g)
Flash Thickness
(mm)
Roughness (Ra)
mm*10-3
Plug Thickness
(mm)
1191 32.48 34.04 222.01 217.22 221 222 54.45 16.096 213.6 2.648 4.496 3.486
1150 32.23 34.17 219.49 217.73 152 164 54.26 16.270 216.0 2.730 3.898 3.542
1096 32.26 34.10 219.34 217.71 166 164 54.29 16.288 214.8 2.738 3.324 3.558
1049 34.02 34.02 217.99 217.65 162 165 54.16 16.326 215.6 2.756 2.892 3.498
1015 32.16 34.11 218.08 217.88 239 248 54.16 16.273 215.6 2.858 2.682 3.658
957 32.23 34.22 219.73 217.85 161 161 54.46 16.345 216.8 2.904 2.272 3.700
908 32.19 34.17 218.86 217.96 238 208 54.32 16.314 216.4 2.926 1.966 3.728
853 32.29 34.26 220.83 218.18 275 269 54.24 16.352 216.0 3.016 1.796 3.882Experiments by using the die set with raised lower die at amount of 1mm
903 32.22 34.05 218.47 217.70 151 151 54.52 16.192 215.2 2.734 1.568 3.528
868 32.21 34.08 218.55 217.71 143 140 54.39 16.271 216.0 2.732 1.588 3.532
Table 3.3 Average Values For Each Temperature Group

3.4 Second Series of Simulation of Forging
When the results of the experiments have been compared with the results of
the first series of the simulation of forging, it is observed that there are significant
differences. The analyses are repeated by using the actaul die geometries and actual
clearances for the determined material mass and temperatures.
The finish dies that used in the experiment, have been measured in CMM and
then remodelled in Pro Engineer. The models can be seen in Figure 3.27 and Figure
3.28.
Figure 3.27 Model of Lower Finish Die
Figure 3.28 Model of Upper Finish Die
47

The effective stress distributions obtained in the second series of forging
simulations are given in Figures 3.29-3.38. The maximum effective stress values
obtained on part at different temperatures can be seen in Table 3.4.
Figure 3.29 Effective Stress Diagram for Forging Process at 1191°C
Figure 3.30 Effective Stress Diagram for Forging Process at 1150°C
48

Figure 3.31 Effective Stress Diagram for Forging Process at 1096°C
Figure 3.32 Effective Stress Diagram for Forging Process at 1049°C
49

Figure 3.33 Effective Stress Diagram for Forging Process at 1015°C
Figure 3.34 Effective Stress Diagram for Forging Process at 957°C
50

Figure 3.35 Effective Stress Diagram for Forging Process at 908°C
Figure 3.36 Effective Stress Diagram for Forging Process at 853°C
51

Figure 3.37 Effective Stress Diagram for Forging Process at 903°C with 1mm raised
lower finish die
Figure 3.38 Effective Stress Diagram for Forging Process at 868°C with 1mm raised
lower finish die
52

The punch force diagrams for the second series of simulation of forging are
given in Figures 3.39-3.48. In the diagrams the net punch force is given as a function
of time. The maximum values of effective stress and punch forces are given for the
second series of simulation of forging in Table 3.4.
Figure 3.39 Z-Force Diagram for Forging Process at 1191°C
Figure 3.40 Punch Force Diagram for Forging Process at 1150°C
53

Figure 3.41 Punch Force Diagram for Forging Process at 1096°C
Figure 3.42 Punch Force Diagram for Forging Process at 1049°C
54

Figure 3.43 Punch Force Diagram for Forging Process at 1015°C
Figure 3.44 Punch Force Diagram for Forging Process at 957°C
55

Figure 3.45 Punch Force Diagram for Forging Process at 908°C
Figure 3.46 Punch Force Diagram for Forging Process at 853°C
56
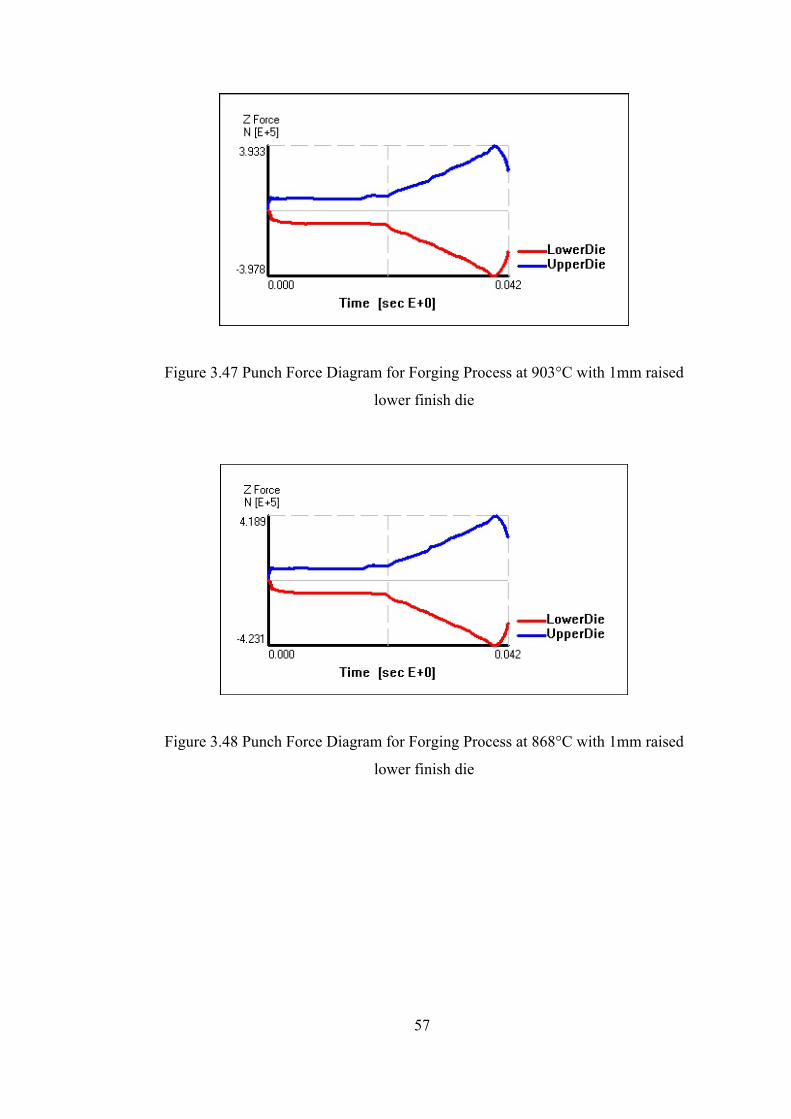
Figure 3.47 Punch Force Diagram for Forging Process at 903°C with 1mm raised
lower finish die
Figure 3.48 Punch Force Diagram for Forging Process at 868°C with 1mm raised
lower finish die
57

Table 3.4 Max Values at Different Temperatures for Second Series of Simulation
Workpiece
Temperature
Max. Effective
Stress Max. Punch Force
Die Filling
Success
1191 ºC 160.2 MPa 0.399 MN Filled
1150 ºC 169.0 MPa 0.308 MN Filled
1096 ºC 178.2 MPa 0.306 MN Filled
1049 ºC 190.6 MPa 0.322 MN Filled
1015 ºC 191.8 MPa 0.217 MN Not Filled
957 ºC 206.7 MPa 0.259 MN Not Filled
908 ºC 220.1 MPa 0.267 MN Not Filled
853 ºC 226.6 MPa 0.287 MN Not Filled
Experiments by using the die set with raised lower die at amount of 1mm
903 ºC 221.9 MPa 0.393 MN Filled
868ºC 226.7 MPa 0.418 MN Filled
Comparison of experimental results and the second series of simulation of
forging are given in Figures 3.49-3.58. On the left side, figures of the parts that are
obtained from experiment and on the right side figures from the simulation are given
for different temperatures. A good agreement in the results of simulation and
experiment has been observed. The white circles in Figures 3.53-3.56 indicate that
the material could not fill the die completely.
58

Figure 3.49 Experiment Result and Analysis Result at 1191°C
Figure 3.50 Experiment Result and Analysis Result at 1150°C
Figure 3.51 Experiment Result and Analysis Result at 1096°C
59

Figure 3.52 Experiment Result and Analysis Result at 1049°C
Figure 3.53 Experiment Result and Analysis Result at 1015°C
Figure 3.54 Experiment Result and Analysis Result at 957°C
60

Figure 3.55 Experiment Result and Analysis Result at 908°C
Figure 3.56 Experiment Result and Analysis Result at 853°C
Figure 3.57 Experiment Result and Analysis Result at 903°C with 1mm raised lower
finish die
61

Figure 3.58 Experiment Result and Analysis Result at 868°C with 1mm raised lower
finish die
For the simulations done at workpiece temperatures 1191ºC, 1150ºC, 1096ºC
and 1049ºC, the preforms filled the die cavities properly. The variation at the punch
forces may be explained by the differences in the facial clearance values which were
determined from the experiments. As seen from Table 3.3, for the workpiece
temperature of 1191ºC, the plug thickness is the minimum and the workpiece mass is
the maximum. However, at workpiece temperatures 1015ºC, 957ºC, 908ºC and
803ºC, at the end of the finite volume analyses it was found that preforms could not
fill the die cavity completely as in the experiments. Hence, a sudden drop occurred at
the punch force values at these temperatures compared to the forces determined at
higher temperatures. The finite volume analyze results showed that the performs
filled the die cavities completely in the last two experiments which were conducted
at workpiece temperatures 903ºC and 868ºC and where the lower finish die was
raised by 1mm. Hence, the maximum punch force values were obtained higher in
these processes, and it was observed that punch force increased as the process
temperature decreased.
The punch forces in the second series of simulation have lower values
compared to the punch forces in the first series of simulation. This is attributed to the
facial clearance differences. In the second series of simulation of forging, the plug
thicknesses which have been measured from the forged parts obtained by
experiments are input to finite volume analysis software as facial clearance values.
62

The facial clearance values are approximately 3.5 mm, while in the first series of
simulation it is taken as 2 mm. It is expected that if the facial clearance were kept at
2 mm in the second series of simulations, the punch forces would increase as in the
first series of simulations. For this purpose, with the data of the second series of
simulation of 1200ºC workpiece temperature, a new analyse has been done for a
facial clearance of 2 mm. While the punch force is about 1.200 MN at the first series
of simulation, it is obtained as 1.692 MN as seen in the Figure 3.59. This increase is
attributed to lower ambient and dies temperatures used in the experiments.
Figure 3.59 Punch Force at 1200 °C with 2mm mid thickness
It is known that, as the temperature decreases the surface finish quality
increases. To verify this result, the surface roughness values of the experimental
parts are measured and given in Table 3.3.
63

CHAPTER 4
CONCLUSION AND FUTURE WORK
4.1. Conclusion
In this study, hot and warm forging processes of a sample part, which is being
produced by hot forging process in a company, made of low carbon steel, AISI 1020,
have been investigated. The analyses of this product is initially performed in a
temperature scale from 850°C to 1200°C with increments of 50°C by a finite volume
analysis program, MSC Superforge, to verify the use of same die set for lower
temperatures of warm forging. After it is determined that the die set can be used for
warm forging numerically the experiments have been performed in AKSAN Forging
Company. However, the finite volume and experimental results have not shown a
good agreement. Hence, the simulations have been renewed with the inputs obtained
from the experiments. The following results are conducted:
1. The results in the first series of simulation show that, as temperature
decreases the maximum effective stress and the required punch force values
increase and it becomes difficult to deform the material.
2. For the workpiece temperatures of 1191ºC, 1150ºC, 1096ºC and 1049ºC,
proper forged parts are obtained in the second series of simulations. The
variation in the punch force is due to different material amounts and facial
clearance values used in the experiments.
64

3. For the workpiece temperatures 1015ºC, 957ºC, 908ºC and 803ºC the
preforms did not fill the die cavities completely in the second series of
simulations. Also the punch force values decreased as a result of non-
complete filling of dies.
4. Proper forged parts are obtained for the workpiece temperatures of 903ºC and
868ºC in the last two analyses of the second series of simulations. For this
purpose, the facial clearance is decreased by raising the lower die 1 mm to
ensure die filing. Also, higher punch forces are obtained compared to the
other simulations with higher workpiece temperatures.
5. It is observed, that the numerical results obtained in the second series of
simulations are in good agreement with the experiment results.
6. It is shown that, the part can be forged at lower temperatures as 850ºC by
using the same die sets. So it will be possible for the company to save from
the energy as a result of lower initial heating of billets and to obtain better
quality products.
4.2. Future Work
As a future work, different die and workpiece materials can be utilized;
preform geometries and forging of the part at lower temperatures can be analyzed.
By using the results of this study, finish dies can be redesigned. Numerical analyses
may be performed by different finite element programs.
65

REFERENCES
[1] forging.org [On-Line], 2005, Available at
http://www.forging.org/Design
[2] azom.com [On-Line], 2005, Available at
http://www.azom.com/details.asp?ArticleID=2195
[3] George E. Dieter, Mechanical Metallurgy, McGraw Hill Kogakusha, Ltd., Tokyo,
1976.
[4] K.M. Kulkarn, and S.Kalpakjian, Trans. ASME, Ser. B: J. Eng. Ind., vol. 91, pp.
743-754, 1969.
[5] ohiou.edu [On-Line], 2005, Available at
http://www.ent.ohiou.edu/~raub/manufacturing/forging.htm
[6] T. Altan, „Forging Equipment, Materials, and Practices, Metals and Ceramics
Information Center, MCIC-HB-03, 1973.
[7] Altan, T., Boulger, F, W., Becker, J, R., Akgerman, N., Henning, H, J., Forging
Equipment, Materials and Practices, Batelle Columbus Laboratories Metalworking
Division, Ohio, 1973.
[8] Sabroff, A, M., Boulger, F, W., Henning, H, J., Forging Materials and Practices,
Batelle Memorial Institute Columbus, Ohio, 1968.
66

[9] Metals Handbook – Forging and Casting, Vol. 5, 8th Edition, ASM Handbook
Committee, USA, 1971.
[10] moderncasting.com [On-Line], 2005,Available at
http://www.moderncasting.com/MoreInfo/1104/MoreInfo1104.pdf
[11] Mehta, Bhavin V., “Evaluation of MSC.SuperForge for 3D Simulation of
Streamlined and Shear Extrusion Dies”, Ohio University, Ohio, USA, 2000.
[12] Zuo, X., Wei, Y., Chen, J., Zeng, L., Ruan X., “3D FEM Simulation of Multi-
stage Forging Process Using Solid Modeling of Forging Tools”, Journal Materials
Processing Technology, vol. 91, pp. 191-195, 1999.
[13] Weronski, W. S., Gontarz, A., Pater Z., “Analysis of the Drop Forging of a
Piston Using Slip-Line Fields and FEM”, International Journal of Mechanical
Sciences, vol. 39, No. 2, pp. 211-220, 1997.
[14] MacCormack, C., Monaghan, J., “Failure Analysis of Cold Forging Dies Using
FEA”, Journal Materials Processing Technology, vol. 117, pp. 209-215, 2001.
[15] C.H. Lee, S. Kobayashi, Trans. ASME, J. Eng. Ind. 95 (1973) 865-873
[16] S. Kobayashi, ASME, PVP-PB025, pp 49-68, 1997.
[17] S.I. Oh, C.C. Chen, S. Kobayashi, Trans. ASME, J. Eng. Ind. vol 101, pp 36-44,
1979.
[18] S.I. Oh, G.D. Lahoti, T. Altan, Proceedings of the NAMRC-X, May 1981, State
Coolge, PA, p.83.
[19] S.I. Oh, G.D. Lahoti, T. Altan, Proceedings of the ASME International
Computer Engineering Conference, Chicago, 1983.
67

[20] S.I. Oh, W.T. Wu, J.P. Tang, A. Vedhanayagam, J. Mater. Process. Technol. 27
(1991) 25-42.
[21] H. Kim, T. Yagi, M. Yamanak, FE Simulation as a Must Tool in Cold/Warm
Forging process and Tool Design, Journal of Materials Processing Technology 98
(2000) 143-149.
[22] Slagter, W., “Forging Simulation Tool Based on Breakthrough Technology”, 2nd
International Conference on Design and Production of Dies and Moulds, Conference
Proceedings, Kuşadası, Turkey, 2001.
[23] wolfram.com [On-Line], 2005,Available at
http://mthworld.wolfram.com/FiniteVolumeMethod.html
[24] Hyman, J.M., Scovel, J.C., High Order Finite Volume Approximations of
Differential Operators on Nonuniform Grids, Phsica D, vol, 60, pp 112-138, 1992.
[25] MSC. Superforge
[26] Vries, E., Ding P., “Simulation of 3D Forging and Extrusion Problems
a Finite Volume Method”, MSC Taiwan User Conference, Taipai, 2000.
[27] Gökler, M.I., “Computer Aided Sequence and Die Design for Hot Upset
Forgings”, Ph.D. Thesis, University of Birmingham, England, 1983.
[28] Kazancı, B., “Design and Analysis of Hot Upset Forgings with Non-Circular
Cross-Sections”, M. Sc. Thesis, Middle East Technical University, Ankara, Turkey,
2002.
[29] Moğulkoç, T., “Finite Element Analysis of Piercing Operation on Forging
Machines”, M. S. Thesis, Middle East Technical University, Ankara, Turkey, 1999.
68

[30] Ceren, M., “Finite Element Analysis of Cold Upset Forging Dies”, M. Sc.
Thesis, Middle East Technical University, Ankara, Turkey, 2002.
[31] Elmaskaya, D., “Finite Element Analysis of Effects of Tapered Preforms in
Cold Upsetting”, M. Sc. Thesis, Middle East Technical University, Ankara, Turkey,
1997.
[32] İsbir, S. Ş., “Finite Element Analysis of Trimming Process”, M. Sc. Thesis,
Middle East Technical University, Ankara, Turkey, 2002.
[33] Doğan, Ö., “Finite Element Analysis of Effects of Tapered Preforms on Final
Product in Cold Upsetting”, M. Sc. Thesis, Middle East Technical University,
Ankara, Turkey, 2000.
[34] Alper, E., “Computer Aided Design of Axi-Symmetric Press Forgings”, M. Sc.
Thesis, Middle East Technical University, Ankara, Turkey, 1989.
[35] Kutlu, A, E., “Analysis and Design of Preforms for Non-Axisymmetric Press”,
M. Sc. Thesis, Middle East Technical University, Ankara, Turkey, 2001.
[36] Karagözler, A, B., “Analysis and Preform Design for Long Press Forgings with
Non-Planar Parting Surfaces”, M. Sc. Thesis, Middle East Technical University,
Ankara, Turkey, 2003.
[37] Gülbahar S., “Preform Design for Heavy Vehicle Steering Joint”, M. Sc. Thesis,
Middle East Technical University, Ankara, Turkey, 2004.
[38] Civelekoğlu B., “Analysis of Forging for Three Different Alloy Steels”, M. Sc.
Thesis, Middle East Technical University, Ankara, Turkey, 2003.
69

[39] Shivpuri, R., Babu, S., Kin, S., Pauskar, P., Deshpande, A., Recent Advances in
Cold and Warm Forging Process Modelling Techniques: Selected Examples, Journal
of Materials Processing Technology, vol 46, pp 253-274, 1996.
[40] Behrens, A., Just, H., Verification of the damage model of effective stresses in
cold and warm forging operaqtions by experimental testing and FE simulations,
Journal of Materials Processing Technology, vol 125-126, pp 295-301, 2002.
[41] Jeong, D.J., Kim, D.J., Kim, J.H., Kim, B.M., Dean, T.A, Effects of Surface
Treatments and Lubricants for Warm Forging Die Life, Journal of Materials
Processing Technology, vol 113, pp 544-550, 2001.
[42] Tatsuro Iwama, Yasuhiro Morimoto,, Die Life and Lubrication in Warm
Forging, Journal of Materials Processing Technology, vol. 71, pp 43-48, 1997.
[43] S. Sheljaskow, Tool Lubricating Systems in Warm Forging, Journal of Materials
Processing Technology, vol. 113, pp 16-21, 2001.
[44] Xinbo, L., Fubao, Z., Jianhua, F., Zhiliang, Z., Research on the Flow Stress
Characteristics of AISI 1006 and AISI 5140 in the Temperature Range of Warm
Forging by Means of Thermo-Mechanical Experiments, Journal of Materials
Processing Technology, vol 112, pp 38-44, 2002.
[45] Behrens, A., Just, H., Extension of the forming Limits in Cold and Warm
Forging by the FE Based Fracture Analysis with the Integrated Damage Model of
Effective Stresses, Journal of Materials Processing Technology, vol 125-126, pp 235-
241, 2002.
[46] Xinbo, L., Hongsheng, X., Zhiliang, Z., Flow Stress of Carbon Steel 08F in
Temperature Range of Warm-Forging, Journal of Materials Processing Technology,
vol 139, pp 543-546, 2003.
70

[47] Lee, R.S., Jou, J.L., Application of Numerical Simulation for Wear Analysis of
Warm Forging Die, Journal of Materials Processing Technology, vol 140, pp 43-48,
2003.
[48] The Warm Forging Practical Hand Book, WAFAM, 2002
[49] S. Sheljaskov, Current Level of Development of Warm Forging Technology,
Journal of Materials Processing Technology, vol.46, pp. 3-18, 1994
[50] Shubert R., Warm Forming Principles, Applications, Case Study, Forging
Industry Association’s Forge Fair, April 8-10 1997, Columbus, Ohio, USA
[51] Dean, T.A., Sturgess, C.E.N., Warm Forging Practice, J. Mech Working Tech,
1978.
[52] U, Engel, Journal of Materials Processing Technology, vol 42, pp 1, 1994.
[53] M. Knoerr,, Journal of Materials Processing Technology, vol 46, pp 57, 1996.
[54] M.J. Liou, HiSi Hsiano, Prediction of die wear in high speed hot upset forging,
ERC/NSM Rep., vol 99, pp 39, 1989.
[55] T. Sobis, U. Engel, Journal of Materials Processing Technology, vol 34, pp 233,
1992.
[56] X. Song, Journal of Engineering Materials Technology, vol 117, pp 28, 1995.
[57] J.H ,Kang, I.W. Park, J.S. Jae, S.S. Kang, Journal of Materials Processing
Technology, vol 96, pp 53, 1996.
[58] T. Nakaramura, in: Proceedings of the 32nd Plenary Meeting of the
International Cold Forging Group ICFG, Ljublijana, September 1999.
71

[59] General Recommendations for Design, Manufacture and Operational Aspects of
Cold Extrusion Tools for Steel Components, ICFG Document No. 6/82.
[60] Personal Communications with AKSAN Forging Company.
[61] Snape, G., Clift, S., Bramley, A., Parametric sensitivity analyses for FEA of hot
steel forging, Journal of Materials Processing Technology, 5930, pp 1–8, 2002
72

APPENDIX A
MATERIAL PROPERTIES OF STEEL AISI 1020
Subcategory: Carbon Steel; AISI 1000 Series Steel; Low Carbon Steel
Close Analog: DIN 1.1151, Ck22
Composition (%):
C Fe P Mn S
0.17 - 0.23 99.08 – 99.53 Max 0.04 0.3 – 0.6 Max 0.05
Physical Properties:
Density : 7.87 g/cm3
Hardness : 137 HBr, 75 HRc-B, 10 HRc-C
Mechanical Properties (at room temperature):
Tensile Strength (Ultimate) : 472 MPa
Tensile Strength (Yield) : 384 MPa
Modulus of Elasticity : 200 GPa
Bulk Modulus : 140 GPa
Shear Modulus : 80 GPa
Thermal Properties :
Thermal Conductivity : 51.9 W/m2-K
Coefficient of Thermal Expansion : 11.7 µm/m-oC
73

74
APPENDIX B
MATERIAL PROPERTIES OF TOOL STEEL L6
Subcategory: Alloy Steel; Hot Work Steel; Metal; Tool Steel
Close Analog: DIN 1.2714
Composition (%):
C Fe Cr Mn Mo Ni Si V
0.5 94.85 1.3 0.85 0.5 1.65 0.25 0.1
Physical Properties:
Critical Temperature : 732°C
Mechanical Properties (at room temperature):
Tensile Strength (Ultimate) : 700 MPa
Hardness : HRC 55
Machinability : 75-80%
Thermal Properties :
Thermal Conductivity : 35 W/m2-K
Coefficient of Thermal Expansion : 14.2 µm/m-oC

Billet
No
Sample No
Billet Diameter
(mm)
Billet Height (mm)
Calculated Billet Mass
(g)
Total Stroke
Number
Workpiece Temp.
0 (ºC)
Workpiece Temp.
1 (ºC)
Workpiece Temp.
2 (ºC)
Preform Die Temp.0 (Lower)
(ºC)
Preform Die Temp.0 (Upper)
(ºC)
Finished Die Temp.0 (Lower)
(ºC)
Finished Die Temp.0 (Upper)
(ºC)
15 13 32.10 34.05 0 1225
8 7 32.18 34.40 1 1210 1250 - 140 145 260 170
9 8 32.30 34.10 1 1202 1235 - 145 145 200 150
11 9 32.15 34.15 1 1210 1200 - 130 100 260 170
12 10 32.25 34.10 1 1210 1220 - 145 120 280 160
13 11 32.10 34.15 1 1215 1220 - 130 110 260 140
3 2 32.30 33.90 218.63 2 1200 1210 1150 150 160 220 225
4 3 33.31 34.10 233.89 2 1200 1210 1110 150 160 220 225
5 4 32.28 33.90 218.31 2 1205 1215 1080 140 150 215 220
6 5 32.28 34.25 220.59 2 1180 1185 1085 145 170 225 220
7 6 32.25 34.05 218.86 2 1172 1206 1185 145 170 225 220
14 12 32.15 34.10 0 1156
22 20 32.30 34.50 1 1170 1153 - 105 105 160 140
23 21 32.05 34.35 1 1140 1102 - 105 100 125 130
24 22 32.20 34.35 1 1140 1175 - 100 95 110 105
25 23 32.15 34.00 1 1135 1060 - 95 100 175 130
26 24 32.25 34.15 1 1135 1145 - 95 105 105 110
16 14 32.30 34.20 218.08 2 1150 1020 1956 135 130 170 180
17 15 32.20 34.00 217.92 2 1150 1180 1085 100 120 150 160
18 16 32.20 34.30 219.81 2 1170 1210 1050 120 125 160 170
APPE
ND
IX C
EX
PER
IME
NT
AL
DA
TA
Table C.1 – Experim
ental Data: B
illet Dim
ensions and Measured Tem
peratures
75
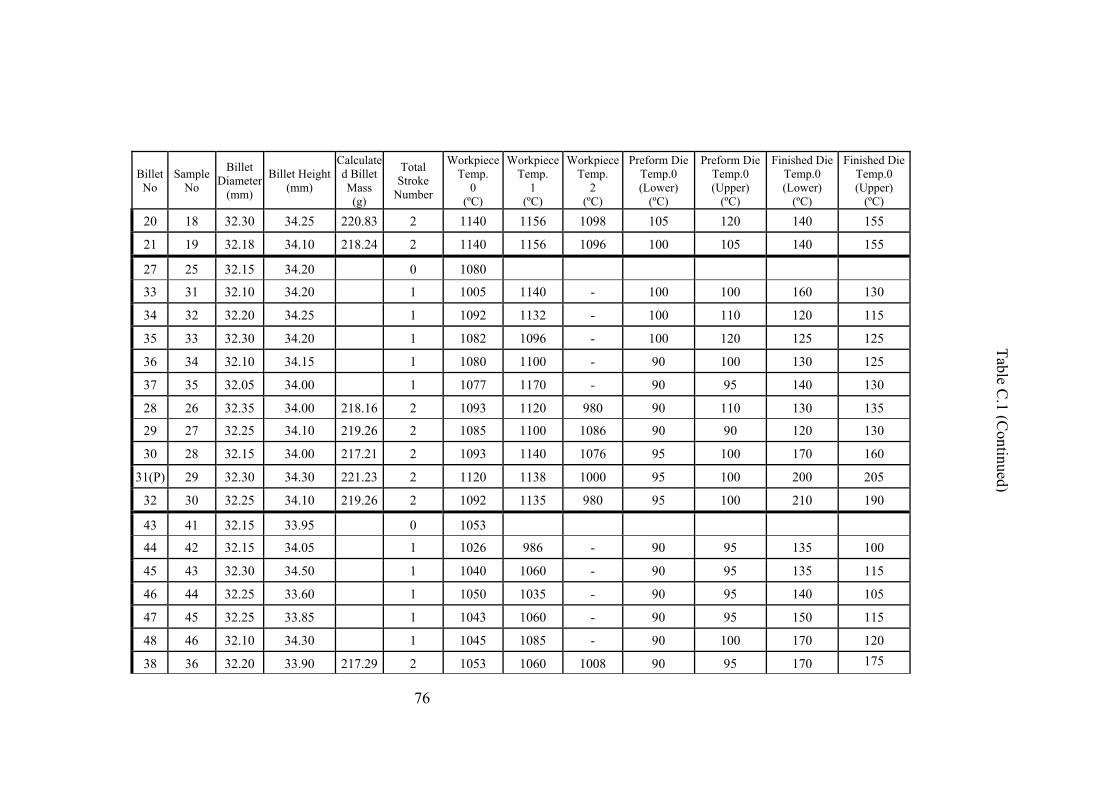
Billet No
Sample No
Billet Diameter
(mm)
Billet Height(mm)
Calculated Billet Mass (g)
Total Stroke
Number
Workpiece Temp.
0 (ºC)
Workpiece Temp.
1 (ºC)
Workpiece Temp.
2 (ºC)
Preform Die Temp.0 (Lower)
(ºC)
Preform Die Temp.0 (Upper)
(ºC)
Finished Die Temp.0 (Lower)
(ºC)
Finished Die Temp.0 (Upper)
(ºC)
20 18 32.30 34.25 220.83 2 1140 1156 1098 105 120 140 155
21 19 32.18 34.10 218.24 2 1140 1156 1096 100 105 140 155
27 25 32.15 34.20 0 1080
33 31 32.10 34.20 1 1005 1140 - 100 100 160 130
34 32 32.20 34.25 1 1092 1132 - 100 110 120 115
35 33 32.30 34.20 1 1082 1096 - 100 120 125 125
36 34 32.10 34.15 1 1080 1100 - 90 100 130 125
37 35 32.05 34.00 1 1077 1170 - 90 95 140 130
28 26 32.35 34.00 218.16 2 1093 1120 980 90 110 130 135
29 27 32.25 34.10 219.26 2 1085 1100 1086 90 90 120 130
30 28 32.15 34.00 217.21 2 1093 1140 1076 95 100 170 160
31(P) 29 32.30 34.30 221.23 2 1120 1138 1000 95 100 200 205
32 30 32.25 34.10 219.26 2 1092 1135 980 95 100 210 190
43 41 32.15 33.95 0 1053
44 42 32.15 34.05 1 1026 986 - 90 95 135 100
45 43 32.30 34.50 1 1040 1060 - 90 95 135 115
46 44 32.25 33.60 1 1050 1035 - 90 95 140 105
47 45 32.25 33.85 1 1043 1060 - 90 95 150 115
48 46 32.10 34.30 1 1045 1085 - 90 100 170 120
38 36 32.20 33.90 217.29 2 1053 1060 1008 90 95 170 175
76
Table C.1 (C
ontinued)

Billet No
Sample No
Billet Diameter
(mm)
Billet Height (mm)
Calculated Billet Mass
(g)
Total Stroke
Number
Workpiece Temp.
0 (ºC)
Workpiece Temp.
1 (ºC)
Workpiece Temp.
2 (ºC)
Preform Die Temp.0 (Lower)
(ºC)
Preform Die Temp.0 (Upper)
(ºC)
Finished Die Temp.0 (Lower)
(ºC)
Finished Die Temp.0 (Upper)
(ºC)
39 37 32.05 34.00 215.87 2 1043 1110 932 90 100 165 160
40 38 32.20 33.95 217.61 2 1041 1072 982 90 100 165 160
41 39 32.30 34.30 221.23 2 1054 1015 986 90 105 155 165
42 40 32.25 33.95 218.24 2 1055 1063 1000 90 95 155 165
60 57 32.35 34.20 0 1010
49 47 32.15 34.40 1 1000 1015 - 102 103 175 130
56 53 32.30 34.30 1 1012 1025 - 110 113 160 130
57 54 32.15 34.02 1 1006 1015 - 102 103 175 130
58 55 32.15 34.05 1 1000 1035 - 105 115 125 115
59 56 32.25 34.20 1 1000 1018 - 110 110 145 110
50 48 32.20 34.05 218.24 2 1005 1000 900 110 114 263 270
51 49 32.20 34.15 218.86 2 1008 1005 1009 110 105 240 255
53 50 32.30 34.30 221.23 2 998 1007 945 105 120 250 260
54 51 32.05 33.80 214.61 2 996 1015 945 110 115 220 240
55 52 32.05 34.25 217.45 2 1072 1036 986 105 110 225 215
73 70 32.15 33.85 0 954
66 63 32.25 33.60 1 948 972 - 105 100 160 110
67 64 32.20 33.60 1 925 896 - 95 105 155 110
68 65 32.20 33.60 1 953 903 - 100 110 150 110
70 67 32.20 34.00 1 956 942 - 100 103 150 110
Table C.1 (C
ontinued)
77

Billet No
Sample No
Billet Diameter
(mm)
Billet Height(mm)
Calculated Billet Mass (g)
Total Stroke
Number
Workpiece Temp.
0 (ºC)
Workpiece Temp.
1 (ºC)
Workpiece Temp.
2 (ºC)
Preform Die Temp.0 (Lower)
(ºC)
Preform Die Temp.0 (Upper)
(ºC)
Finished Die Temp.0 (Lower)
(ºC)
Finished Die Temp.0 (Upper)
(ºC)
71 68 32.10 34.20 1 952 970 - 100 104 150 105
61 58 32.25 34.25 220.20 2 965 965 870 100 110 170 175
62 59 32.20 34.35 220.12 2 957 958 923 100 105 165 155
63 60 32.20 34.10 218.55 2 951 975 918 95 110 160 170
64 61 32.20 34.17 219.02 2 955 958 860 105 110 150 145
65 62 32.30 34.25 220.83 2 960 986 938 105 100 160 160
72 69 32.25 34.30 0 905
69 66 32.15 33.65 1 903 876 - 105 115 155 115
79 78 32.20 34.35 1 906 912 - 100 110 150 120
80 79 32.15 34.10 1 905 913 - 110 105 150 120
81 80 32.20 34.40 1 901 945 - 105 105 130 125
82 81 32.30 34.10 1 900 910 - 100 110 135 115
84 83 32.35 34.40 1 905 912 - 96 94 125 120
74(P) 71 32.20 34.40 220.44 2 917 886 878 110 120 200 160
75 72 32.15 34.10 217.84 2 905 908 840 110 120 250 200
76 73 32.25 33.95 218.24 2 915 923 876 110 120 200 190
77 76 32.20 34.30 219.81 2 905 906 902 110 120 260 23078 77 32.15 34.10 217.84 2 902 908 876 110 120 280 26083 82 32.25 34.10 0 85090 89 32.30 34.30 1 848 833 - 105 110 150 120
78
“Table C.1 (C
ontinued)

79
Billet No
Sample No
Billet Diamete
r (mm)
Billet Height(mm)
Calculated Billet
Mass (g)
Total Stroke
Number
WorkpieceTemp.
Workpiece Temp.
0 (ºC)
1 (ºC)
Workpiece Temp.
2 (ºC)
Preform Die Temp.0 (Lower)
(ºC)
Preform Die Temp.0 (Upper)
(ºC)
Finished Die Temp.0 (Lower)
(ºC)
Finished Die Temp.0 (Upper)
(ºC) 91 90 32.15 33.90 1 858 876 - 105 110 140 125
92 91 32.25 33.40 1 852 880 - 108 106 150 131
93 92 32.20 34.20 1 853 875 - 112 114 154 142
94 93 32.15 34.00 1 848 872 - 108 103 154 125
95 94 32.20 34.30 1 849 874 - 110 105 155 130
85 84 32.25 34.30 220.52 2 856 860 848 110 115 300 300
86 85 32.30 34.35 221.54 2 854 896 876 110 115 265 245
87 86 32.30 34.40 221.86 2 855 876 858 122 140 280 280
88 87 32.30 34.25 220.83 2 856 836 879 130 140 270 260
89 88 32.30 34.00 219.26 2 846 855 865 150 110 260 260
Experiments by using the die set with raised lower die at amount of 1mm
96 95 32.25 34.00 218.55 2 905 925 892 105 100 170 165
97 96 32.20 33.80 216.58 2 903 920 880 105 100 150 147
98 97 32.15 34.40 219.81 2 907 930 895 100 115 150 155
99 98 32.25 34.10 219.26 2 901 918 875 100 115 142 146
100 99 32.25 33.95 218.24 2 903 930 889 100 95 147 142
101 100 32.25 34.35 220.83 2 855 878 828 95 100 147 135
102 101 32.20 34.20 219.18 2 851 853 836 95 100 145 149103 102 32.25 33.95 218.24 2 855 880 856 95 100 144 147104 103 32.20 33.75 216.27 2 853 880 836 95 100 142 140105 104 32.15 34.15 218.16 2 848 851 807 95 100 137 130
Table C.1 (C
ontinued) Table C
.2

Billet No
Sample No
Total Stroke
Number
Workpiece Temp.
0 (ºC)
Preform Die Temp.1
(Lower) (ºC)
Preform Die Temp.1
(Upper) (ºC)
Finished Die Temp.2
(Lower) (ºC)
Finished Die Temp.2
(Upper) (ºC)
Part Diameter
(mm)
Part Height (mm)
Measured Part Mass
(g)
Flash Thickness
(mm)
Roughness(Ra)
(mm*10-3)
Plug Thickness
(mm)
15 13 0 1225 216
8 7 1 1210
9 8 1 1202
11 9 1 1210
12 10 1 1210
13 11 1 1215
3 2 2 1200 150 160 220 225 54.56 15.99 214 2.67 3.37 3.54
4 3 2 1200 250 160 240 240 54.52 16.056 212 2.57 4.63 3.42
5 4 2 1205 152 160 235 240 54.52 16.13 214 2.63 4.09 3.41
6 5 2 1180 250 160 230 200 54.23 16.056 212 2.64 6.79 3.47
7 6 2 1172 225 160 220 215 54.42 16.25 216 2.73 3.60 3.59
14 12 0 1156 214
22 20 1 1170
23 21 1 1140
24 22 1 1140
25 23 1 1135
26 24 1 1135
16 14 2 1150 170 130 180 190 54.28 16.238 216 2.67 2.92 3.48
17 15 2 1150 180 140 180 190 54.14 16.258 216 2.80 5.45 3.60
18 16 2 1170 150 120 170 160 54.20 16.257 216 2.67 3.25 3.55
Table C.2 – Experim
ental Data: M
easurements on the Finished Parts
80

Billet No
Sample No
Total Stroke
Number
Workpiece Temp.
0 (ºC)
Preform Die Temp.1
(Lower) (ºC)
Preform Die Temp.1
(Upper) (ºC)
Finished Die Temp.2
(Lower) (ºC)
Finished Die Temp.2
(Upper) (ºC)
Part Diameter
(mm)
Part Height (mm)
Measured Part Mass
(g)
Flash Thickness
(mm)
Roughness(Ra)
(mm*10-3)
Plug Thickness
(mm)
20 18 2 1140 180 120 160 155 54.42 16.294 216 2.63 4.43 3.50
21 19 2 1140 160 120 170 165 54.24 16.306 216 2.88 3.44 3.58
27 25 0 1080 216
33 31 1 1005
34 32 1 1092
35 33 1 1082
36 34 1 1080
37 35 1 1077
28 26 2 1093 100 98 135 145 54.29 16.331 214 2.62 2.90 3.59
29 27 2 1085 103 100 130 135 54.37 16.354 216 2.88 3.24 3.53
30 28 2 1093 110 110 170 160 54.27 16.202 214 2.58 3.34 3.52
31(P) 29 2 1120 110 110 200 210 54.26 16.275 216 2.71 3.68 3.65
32 30 2 1092 110 110 220 200 54.30 16.276 214 2.90 3.46 3.50
43 41 0 1053 216
44 42 1 1026
45 43 1 1040
46 44 1 1050
47 45 1 1043
48 46 1 1045
38 36 2 1053 140 130 177 180 54.11 16.181 214 2.82 2.63 3.37
81
Table C.2 (C
ontinued)

Billet No
Sample No
Total Stroke
Number
Workpiece Temp.
0 (ºC)
Preform Die Temp.1
(Lower) (ºC)
Preform Die Temp.1
(Upper) (ºC)
Finished Die Temp.2
(Lower) (ºC)
Finished Die Temp.2
(Upper) (ºC)
Part Diameter
(mm)
Part Height (mm)
Measured Part Mass
(g)
Flash Thickness
(mm)
Roughness(Ra)
(mm*10-3)
Plug Thickness
(mm)
39 37 2 1043 140 130 170 175 54.18 16.464 216 2.95 3.27 3.47
40 38 2 1041 130 125 168 155 54.15 16.293 214 2.89 2.60 3.40
41 39 2 1054 150 110 160 165 54.19 16.395 218 2.48 3.36 3.65
42 40 2 1055 120 100 155 165 54.18 16.296 216 2.64 2.60 3.60
60 57 0 1010 218
49 47 1 1000
56 53 1 1012
57 54 1 1006
58 55 1 1000
59 56 1 1000
50 48 2 1005 107 118 280 266 54.17 16.368 216 2.82 3.36 3.83
51 49 2 1008 125 110 255 260 54.20 16.26 216 2.97 1.90 3.70
53 50 2 998 125 135 255 265 54.11 16.297 216 2.87 3.20 3.65
54 51 2 996 115 110 235 243 54.20 16.118 214 2.61 2.64 3.55
55 52 2 1072 140 115 225 220 54.12 16.323 216 3.02 2.31 3.56
73 70 0 954 214
66 63 1 948
67 64 1 925
68 65 1 953
70 67 1 956
82
Table C.2 (C
ontinued)

Billet No
Sample No
Total Stroke
Number
Workpiece Temp.
0 (ºC)
Preform Die Temp.1
(Lower) (ºC)
Preform Die Temp.1
(Upper) (ºC)
Finished Die Temp.2
(Lower) (ºC)
Finished Die Temp.2
(Upper) (ºC)
Part Diameter
(mm)
Part Height (mm)
Measured Part Mass
(g)
Flash Thickness
(mm)
Roughness(Ra)
(mm*10-3)
Plug Thickness
(mm)
71 68 1 952
61 58 2 965 110 125 170 175 54.39 16.327 216 2.77 2.08 3.69
62 59 2 957 130 110 165 162 54.49 16.451 218 2.93 2.23 3.72
63 60 2 951 130 100 165 170 54.43 16.229 216 2.81 2.14 3.65
64 61 2 955 115 110 160 170 54.49 16.299 216 2.95 2.44 3.72
65 62 2 960 170 110 160 165 54.51 16.42 218 3.06 2.47 3.72
72 69 0 905 216
69 66 1 903
79 78 1 906
80 79 1 905
81 80 1 901
82 81 1 900
84 83 1 905 218
74(P) 71 2 917 160 120 210 175 54.22 16.398 218 2.92 1.93 3.77
75 72 2 905 140 120 260 200 54.40 16.272 216 2.55 2.01 3.83
76 73 2 915 150 120 200 160 54.37 16.247 214 2.98 2.28 3.69
77 76 2 905 160 125 260 240 54.33 16.392 218 3.10 1.89 3.72
78 77 2 902 165 125 310 320 54.30 16.261 216 3.08 1.72 3.63
83 82 0 850
90 89 1 848
83
Table C.2 (C
ontinued)

Billet No
Sample No
Total Stroke
Number
Workpiece Temp.
0 (ºC)
Preform Die Temp.1
(Lower) (ºC)
Preform Die Temp.1
(Upper) (ºC)
Finished Die Temp.2
(Lower) (ºC)
Finished Die Temp.2
(Upper) (ºC)
Part Diameter
(mm)
Part Height (mm)
Measured Part Mass
(g)
Flash Thickness
(mm)
Roughness(Ra)
(mm*10-3)
Plug Thickness
(mm)
91 90 1 858
92 91 1 852
93 92 1 853
94 93 1 848
95 94 1 849
85 84 2 856 145 120 300 320 54.26 16.408 218 3.09 3.09 3.76
86 85 2 854 145 130 265 250 54.19 16.383 216 2.91 2.91 3.91
87 86 2 855 150 140 278 280 54.27 16.297 216 2.94 2.94 3.99
88 87 2 856 130 140 270 265 54.15 16.422 216 3.11 3.11 3.90
89 88 2 846 160 130 265 260 54.33 16.252 214 3.03 3.03 3.85
Experiments by using the die set with raised lower die at amount of 1mm
96 95 2 905 150 125 168 170 54.43 16.100 214 1.95 2.71 3.48
97 96 2 903 158 120 156 165 54.74 16.078 214 2.05 2.58 3.53
98 97 2 907 135 120 160 157 54.22 16.236 218 1.98 2.79 3.60
99 98 2 901 135 120 140 150 54.46 16.240 216 2.27 2.66 3.55
100 99 2 903 140 125 147 155 54.76 16.308 214 2.33 2.93 3.48
101 100 2 855 145 120 145 144 54.42 16.258 218 2.30 2.79 3.55
102 101 2 851 147 115 148 148 54.39 16.485 216 2.43 2.57 3.55103 102 2 855 115 110 146 148 54.36 16.209 216 2.61 2.63 3.58104 103 2 853 150 110 141 142 54.32 16.132 214 2.36 2.88 3.53105 104 2 848 150 110 138 143 54.47 16.243 216 2.39 2.79 3.45
84
Table C.2 (C
ontinued)

85