analysis of usp residual solvents of class 1, class ... · pharmacopeia (usp) method .1 • class...
TRANSCRIPT
Application Note
Pharma & Biopharma
AuthorsYoujuan Zhang, Shun Na Agilent Technologies (Shanghai) Co. Ltd. Shanghai 200131 P. R. China
AbstractAn Agilent 8890 Gas Chromatograph (GC) configured with a flame ionization detector (FID) and a mass spectrometric detector (MSD) was used for the analysis of USP <467> residual solvents of Class 1, Class 2, and Class 3. There were 52 compounds with low boiling points introduced by an Agilent 7697A headspace sampler onto a DB-624 column, while 10 compounds with relatively high boiling points were introduced by the automatic liquid sampler onto a DB-WAX column. A purged two-way capillary flow technology (CFT) device was used to split the sample 1:1 onto FID and MSD.
This Application Note demonstrates excellent peak shape, resolution and great repeatability, which shows this FID and MSD dual-channel system is a powerful tool for qualitative and quantitative analysis of residual solvents.
Analysis of USP <467> Residual Solvents of Class 1, Class 2, and Class 3 using the Agilent 8890 GC/ FID /5977B MSD System
2
IntroductionAnalysis of residual solvents is a critical application in the pharmaceutical industry. Residual solvents have been classified into three main classes based on risk assessment by United States Pharmacopeia (USP) Method <467>.1
• Class 1 solvents, containing five compounds, should be avoided in manufacturing processes.
• Class 2 solvents contain 30 compounds, and should be limited.
• Class 3 solvents, containing 27 compounds, are considered lower risk.
In total, there are more than 60 compounds in the three classes. The compounds list of Pharmacopoeia of China (2015 edition)2 is almost the same as USP <467> method.
Labs in the pharmaceutical industry normally use gas chromatography for residual solvents analysis. When unknown components appear in their routine job, MSD is a good choice for identification of volatile organic solvents. Usually GC and GC/MSD are two separate systems in the labs, and it may take a long time for users to transfer the method between the two systems that may use different carrier gas or columns. This Application Note used a single 8890 GC configured with both FID and MSD for the three classes of residual solvents analysis. Samples introduced by headspace or automatic liquid sampler were split 1:1 onto FID and MSD. FID or MSD can be used as the tools for quantitative analysis, while MSD also can be used for qualitative analysis of unknown components.
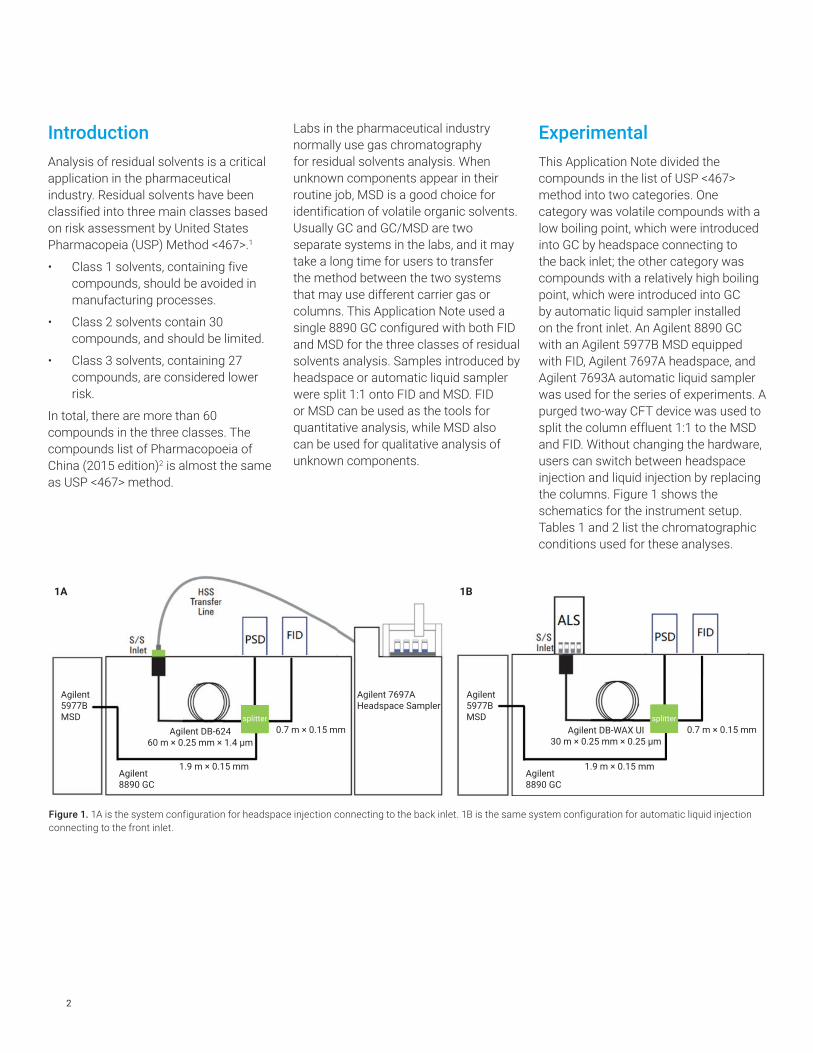
ExperimentalThis Application Note divided the compounds in the list of USP <467> method into two categories. One category was volatile compounds with a low boiling point, which were introduced into GC by headspace connecting to the back inlet; the other category was compounds with a relatively high boiling point, which were introduced into GC by automatic liquid sampler installed on the front inlet. An Agilent 8890 GC with an Agilent 5977B MSD equipped with FID, Agilent 7697A headspace, and Agilent 7693A automatic liquid sampler was used for the series of experiments. A purged two-way CFT device was used to split the column effluent 1:1 to the MSD and FID. Without changing the hardware, users can switch between headspace injection and liquid injection by replacing the columns. Figure 1 shows the schematics for the instrument setup. Tables 1 and 2 list the chromatographic conditions used for these analyses.
Figure 1. 1A is the system configuration for headspace injection connecting to the back inlet. 1B is the same system configuration for automatic liquid injection connecting to the front inlet.
1A 1B
splitter splitter
Agilent
5977B
MSD
Agilent
5977B
MSD
Agilent
8890 GC
Agilent
8890 GC
Agilent DB-624
60 m × 0.25 mm × 1.4 µm
Agilent DB-WAX UI
30 m × 0.25 mm × 0.25 µm
0.7 m × 0.15 mm 0.7 m × 0.15 mm
1.9 m × 0.15 mm 1.9 m × 0.15 mm
Agilent 7697A
Headspace Sampler
3
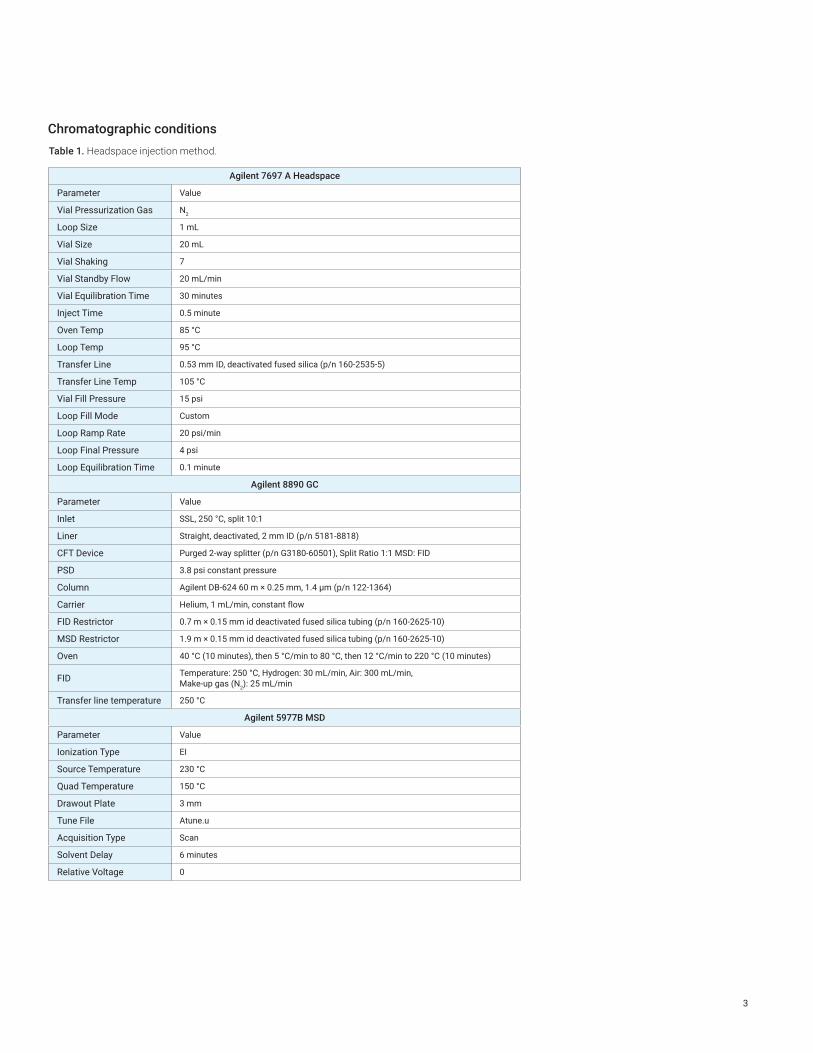
Chromatographic conditionsTable 1. Headspace injection method.
Agilent 7697 A Headspace
Parameter Value
Vial Pressurization Gas N2
Loop Size 1 mL
Vial Size 20 mL
Vial Shaking 7
Vial Standby Flow 20 mL/min
Vial Equilibration Time 30 minutes
Inject Time 0.5 minute
Oven Temp 85 °C
Loop Temp 95 °C
Transfer Line 0.53 mm ID, deactivated fused silica (p/n 160-2535-5)
Transfer Line Temp 105 °C
Vial Fill Pressure 15 psi
Loop Fill Mode Custom
Loop Ramp Rate 20 psi/min
Loop Final Pressure 4 psi
Loop Equilibration Time 0.1 minute
Agilent 8890 GC
Parameter Value
Inlet SSL, 250 °C, split 10:1
Liner Straight, deactivated, 2 mm ID (p/n 5181-8818)
CFT Device Purged 2-way splitter (p/n G3180-60501), Split Ratio 1:1 MSD: FID
PSD 3.8 psi constant pressure
Column Agilent DB-624 60 m × 0.25 mm, 1.4 µm (p/n 122-1364)
Carrier Helium, 1 mL/min, constant flow
FID Restrictor 0.7 m × 0.15 mm id deactivated fused silica tubing (p/n 160-2625-10)
MSD Restrictor 1.9 m × 0.15 mm id deactivated fused silica tubing (p/n 160-2625-10)
Oven 40 °C (10 minutes), then 5 °C/min to 80 °C, then 12 °C/min to 220 °C (10 minutes)
FID Temperature: 250 °C, Hydrogen: 30 mL/min, Air: 300 mL/min, Make-up gas (N2): 25 mL/min
Transfer line temperature 250 °C
Agilent 5977B MSD
Parameter Value
Ionization Type EI
Source Temperature 230 °C
Quad Temperature 150 °C
Drawout Plate 3 mm
Tune File Atune.u
Acquisition Type Scan
Solvent Delay 6 minutes
Relative Voltage 0
4
Chemicals and standardsThree stock solutions of residual solvents in dimethyl sulfoxide (DMSO) were from Agilent Technologies:
• Class 1: p/n 5190-0490
• Class 2A: p/n 5190-0492
• Class 2C: p/n 5190-0493
The single standards of Class 2B and Class 3 compounds were purchased from ANPEL Scientific Instrument Co. Ltd. (Shanghai, China) and J&K Scientific Ltd.
Compounds in Table 3 were diluted in DMSO and water solution (v/v=50:50). The headspace vials were made at each calibration level by filling each vial with 5 mL of DMSO and water solution (v/v=50:50) and spiking varying amounts of stock solution to achieve the required levels. Compounds in Table 4 were diluted in water. Table A1 in Appendix A shows the concentrations of different levels for each compound.
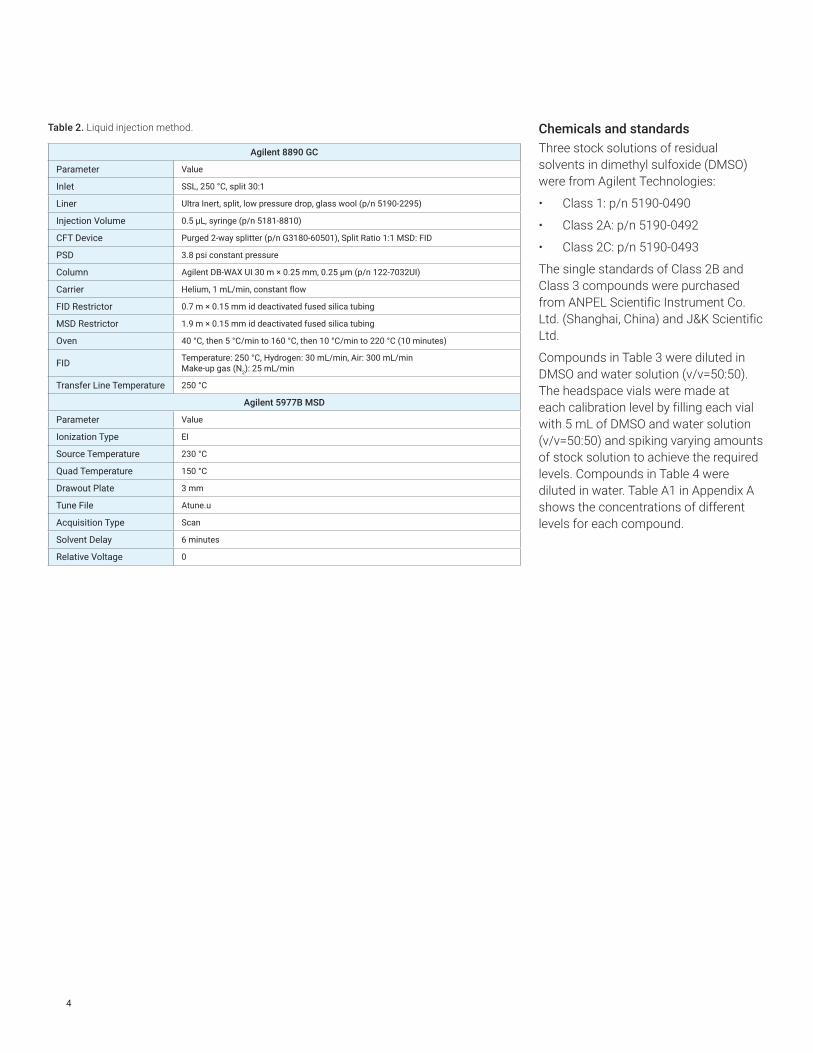
Table 2. Liquid injection method.
Agilent 8890 GC
Parameter Value
Inlet SSL, 250 °C, split 30:1
Liner Ultra Inert, split, low pressure drop, glass wool (p/n 5190-2295)
Injection Volume 0.5 µL, syringe (p/n 5181-8810)
CFT Device Purged 2-way splitter (p/n G3180-60501), Split Ratio 1:1 MSD: FID
PSD 3.8 psi constant pressure
Column Agilent DB-WAX UI 30 m × 0.25 mm, 0.25 µm (p/n 122-7032UI)
Carrier Helium, 1 mL/min, constant flow
FID Restrictor 0.7 m × 0.15 mm id deactivated fused silica tubing
MSD Restrictor 1.9 m × 0.15 mm id deactivated fused silica tubing
Oven 40 °C, then 5 °C/min to 160 °C, then 10 °C/min to 220 °C (10 minutes)
FID Temperature: 250 °C, Hydrogen: 30 mL/min, Air: 300 mL/min Make-up gas (N2): 25 mL/min
Transfer Line Temperature 250 °C
Agilent 5977B MSD
Parameter Value
Ionization Type EI
Source Temperature 230 °C
Quad Temperature 150 °C
Drawout Plate 3 mm
Tune File Atune.u
Acquisition Type Scan
Solvent Delay 6 minutes
Relative Voltage 0
5
No. Name RT m/z Linearity Range
(μg/mL)
R2Area RSD%
L4 (n=8)MDL (MSD)
μg/mLMSD FID
1 Methanol 8.818 31 0.75 to 150 0.9998 0.9994 2.2 0.194
2 Pentane 11.251 43 0.5 to 100 0.9944 0.9997 2 0.143
3 Ethanol 11.73 31 2 to 100 0.9999 0.9998 1.2 0.514
4 Ethyl ether 12.142 74.1 0.5 to 100 0.9911 0.9998 4.3 0.147
5 1,1-Dichloroethene 13.083 61 0.004 to 0.8 0.9997 0.9986 1.7 0.003
6 Acetone 13.283 43 0.5 to 100 0.9999 0.9996 2.1 0.227
7 Isopropanol 13.854 45 1 to 200 0.9997 0.9979 4.3 0.245
8 Ethyl formate 13.873 45 1 to 200 0.9997 0.9979 4.3 0.245
9 Acetonitrile 14.39 41 0.1 to 20 0.9996 0.9984 4.2 0.032
10 Methyl acetate 14.564 43 0.5 to 100 0.9998 0.9998 2.7 0.424
11 Methylene chloride 14.947 84 0.15 to 30 0.9997 0.9997 2.1 0.033
12 tert-Butylmethyl ether 15.938 73 0.1 to 20 0.9988 0.9998 2.1 0.035
13 trans-1,2-Dichloroethene 15.979 95.9 0.236 to 47 0.9969 0.9998 1.7 0.065
14 Hexane 16.899 57 0.1 to 20 0.9995 0.9998 2.2 0.074
15 1-Propanol 17.712 31 0.5 to 100 0.9995 0.9996 2 0.180
16 Nitromethane 19 46 0.5 to 100 0.9999 0.9991 1.9 0.252
17 cis-1,2-Dichloroethene 19.21 96 0.236 to 47 0.9988 0.9999 2.5 0.045
18 2-Butanone 19.225 43 0.5 to 100 0.998 0.9999 2.3 0.147
19 Ethyl acetate 19.375 43 0.5 to 100 0.9986 0.9997 1.4 0.305
20 2-Butanol 19.688 45 0.5 to 100 0.9998 0.9999 2.4 0.237
21 Tetrahydrofuran 19.985 42 0.18 to 36 0.9998 0.9998 2.1 0.053
22 Chloroform 20.054 83 0.015 to 3 0.9997 0.9998 1.6 0.006
23 1,1,1-Trichloroethane 20.546 97 0.005 to 1 0.9999 0.9998 1.3 0.003
24 Cyclohexane 20.707 84 1.0 to 49 (195)* 0.9908 0.9997 1.8 0.188
25 Carbon tetrachloride 20.962 117 0.002 to 0.4 0.9998 0.9992 2.8 0.002
26 2-Methyl-1-propanol 21.119 43 0.5 to 100 0.9999 0.9999 2.1 0.494
27 1,2-Dimethoxyethane 21.265 45 0.5 to 100 0.9999 0.9995 1 0.256
28 Benzene 21.442 78 0.001 to 0.2 0.9995 0.9998 5.8 0.001
29 1,2-Dichloroethane 21.442 62 0.01 to 0.5 0.9989 0.9998 1.5 0.002
30 Isopropyl acetate 21.496 61 0.5 to 100 0.9985 0.9998 0.8 0.164
31 Heptane 21.956 71 0.1 to 20 0.9974 0.9996 2.4 0.034
32 1-Butanol 22.547 56 0.5 to 100 0.9994 0.9998 2.4 0.172
33 Trichloroethylene 22.791 130 0.015 to 3 0.9999 0.9999 1.8 0.007
34 Methylcyclohexane 23.208 83 0.3 to 15 (59)* 0.9989 0.9997 2.3 0.072
35 1,4-Dioxane 23.489 88 0.095 to 19 0.9999 0.9999 3.3 0.055
36 Propyl acetate 23.491 43 0.5 to 100 0.9966 0.9999 3 0.268
37 4-Methyl-2-pentanone 24.815 43 0.5 to 100 0.9985 0.9996 2.2 0.143
38 Isoamyl alcohol 24.879 55.1 0.5 to 100 0.9991 0.9996 2.4 0.256
39 Pyridine 25.024 79 2 to 100 0.9992 0.9997 2.1 0.502
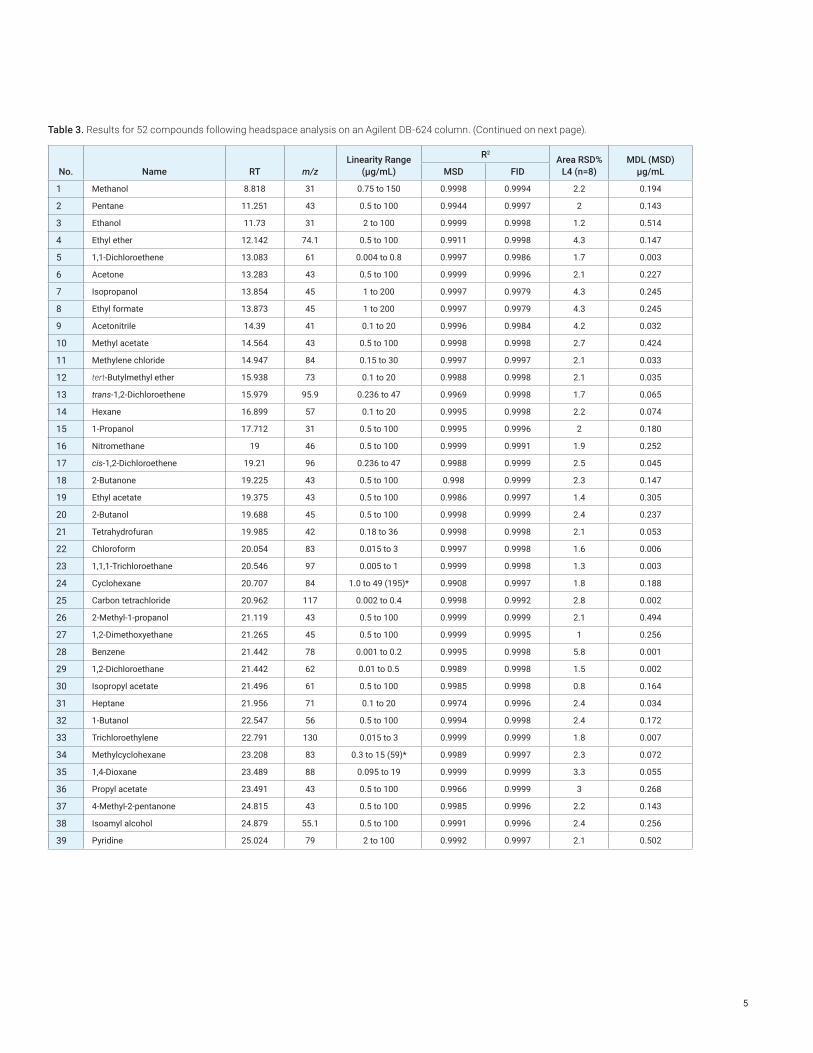
Table 3. Results for 52 compounds following headspace analysis on an Agilent DB-624 column. (Continued on next page).
6
Results and discussion
1. Headspace injection analysisThe 52 compounds from the USP <467> list were introduced by headspace and resolved on an Agilent DB-624 analysis column in approximately 40 minutes. Splitting the column effluent to both an MSD and FID facilitated selectivity, identification, and confirmation of the 52 compounds from a single injection, thereby increasing laboratory productivity. Using GC/MS in full scan mode enabled identification of unknown residual solvents in drug products. The pharmaceutical industry usually uses
No. Name RT m/z Linearity Range
(μg/mL)
R2Area RSD%
L4 (n=8)MDL (MSD)
μg/mLMSD FID
40 Toluene 25.196 91 0.22 to 22 (44)* 0.9964 0.9998 2.1 0.065
41 Isobutyl acetate 25.322 56 0.5 to 100 0.9958 0.9999 2.1 0.178
42 1-Pentanol 25.735 42 0.5 to 100 0.9996 0.9998 2.1 0.332
43 2-Hexanone 26.201 58 0.06 to 3 0.9995 0.9998 2.1 0.011
44 Butyl acetate 26.351 43 0.5 to 100 0.9957 0.9999 2.3 0.250
45 Tetrahydrothiophene 26.571 88 0.5 to 100 0.9996 0.9999 1.4 0.180
46 Chlorobenzene 27.503 112 0.09 to 18 0.9999 0.9997 2.5 0.022
47 Ethylbenzene 27.618 91 0.09 to 18 0.9986 0.9997 4.1 0.029
48 m,p-Xylene 27.782 106 0.4 to 40 (80)* 0.9963 0.9997 3.3 0.107
49 o-Xylene 28.393 91 0.05 to 10 0.9999 0.9996 2.6 0.017
50 Isopropylbenzene 28.904 105 0.1 to 20 0.9983 0.9996 2.4 0.039
51 Anisole 29.011 108 0.5 to 100 0.9999 0.9997 2.8 0.189
52 1,2,3,4-Tetrahydronaphthalene 33.814 104 0.015 to 3 0.9998 0.9993 2 0.005
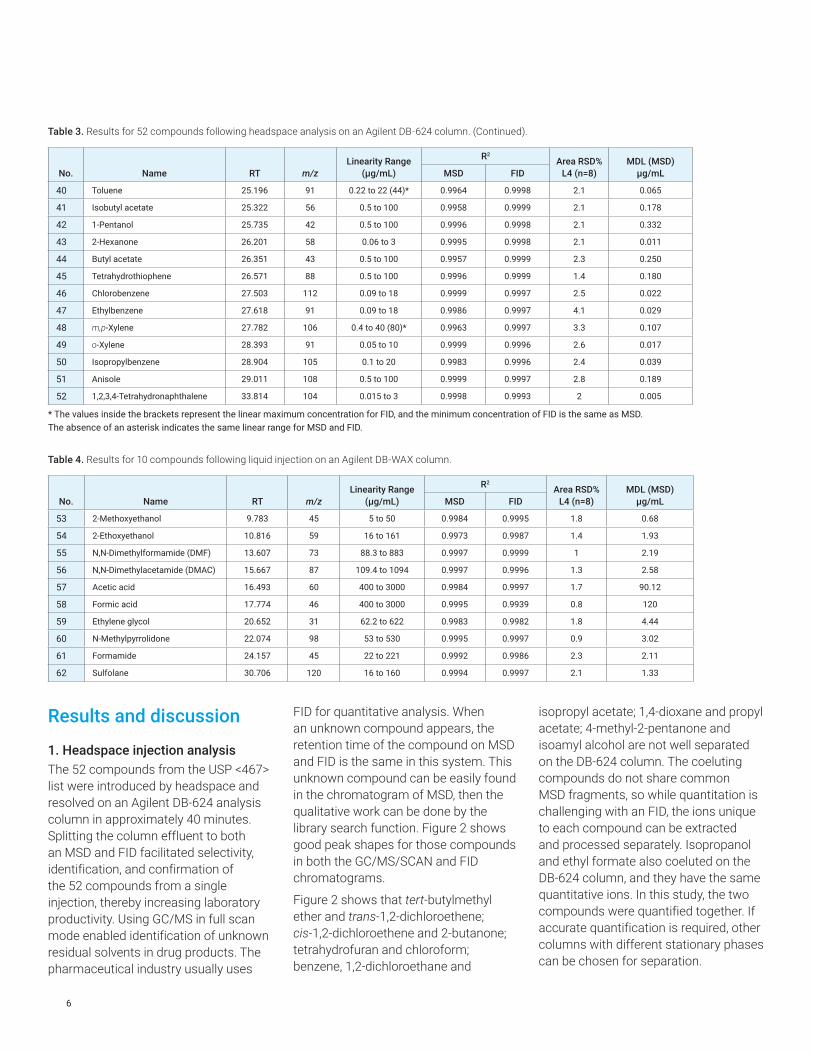
* The values inside the brackets represent the linear maximum concentration for FID, and the minimum concentration of FID is the same as MSD.The absence of an asterisk indicates the same linear range for MSD and FID.
Table 4. Results for 10 compounds following liquid injection on an Agilent DB-WAX column.
No. Name RT m/zLinearity Range
(μg/mL)
R2Area RSD%
L4 (n=8)MDL (MSD)
μg/mLMSD FID
53 2-Methoxyethanol 9.783 45 5 to 50 0.9984 0.9995 1.8 0.68
54 2-Ethoxyethanol 10.816 59 16 to 161 0.9973 0.9987 1.4 1.93
55 N,N-Dimethylformamide (DMF) 13.607 73 88.3 to 883 0.9997 0.9999 1 2.19
56 N,N-Dimethylacetamide (DMAC) 15.667 87 109.4 to 1094 0.9997 0.9996 1.3 2.58
57 Acetic acid 16.493 60 400 to 3000 0.9984 0.9997 1.7 90.12
58 Formic acid 17.774 46 400 to 3000 0.9995 0.9939 0.8 120
59 Ethylene glycol 20.652 31 62.2 to 622 0.9983 0.9982 1.8 4.44
60 N-Methylpyrrolidone 22.074 98 53 to 530 0.9995 0.9997 0.9 3.02
61 Formamide 24.157 45 22 to 221 0.9992 0.9986 2.3 2.11
62 Sulfolane 30.706 120 16 to 160 0.9994 0.9997 2.1 1.33
FID for quantitative analysis. When an unknown compound appears, the retention time of the compound on MSD and FID is the same in this system. This unknown compound can be easily found in the chromatogram of MSD, then the qualitative work can be done by the library search function. Figure 2 shows good peak shapes for those compounds in both the GC/MS/SCAN and FID chromatograms.
Figure 2 shows that tert-butylmethyl ether and trans-1,2-dichloroethene; cis-1,2-dichloroethene and 2-butanone; tetrahydrofuran and chloroform; benzene, 1,2-dichloroethane and
isopropyl acetate; 1,4-dioxane and propyl acetate; 4-methyl-2-pentanone and isoamyl alcohol are not well separated on the DB-624 column. The coeluting compounds do not share common MSD fragments, so while quantitation is challenging with an FID, the ions unique to each compound can be extracted and processed separately. Isopropanol and ethyl formate also coeluted on the DB-624 column, and they have the same quantitative ions. In this study, the two compounds were quantified together. If accurate quantification is required, other columns with different stationary phases can be chosen for separation.
Table 3. Results for 52 compounds following headspace analysis on an Agilent DB-624 column. (Continued).

7
0
0.1
0.2
0.3
0.4
0.5
0.6
0.7
0.8
0.9
1.0
1.1
1.2
1.3
1.4
1.5
1.6
1.7
7 8 9 10 11 12 13 14 15 16 17 18 19 20 21 22 23 24 25 26 27 28 29 30 31 32 33 34
×107
Acquisition time (min)
Co
un
ts
MSD
0
1.0
0.5
1.5
2.0
2.5
3.0
3.5
4.0
4.5
5.0
5.5
6.0
6.5
7.0
7.5
8.0
8.5
9.0
7 8 9 10 11 12 13 14 15 16 17 18 19 20 21 22 23 24 25 26 27 28 29 30 31 32 33 34
×106
Acquisition time (min)
Re
sp
on
se
un
its
FID
Figure 2. GC/MS-SCAN and FID Chromatogram of 52 compounds of standard solution (Level 7) on an Agilent DB-624 column. The effluent split ration is MSD: FID= 1:1.
8
Selection of dilution solvent for the headspace injectionMethanol, acetone, N,N-dimethylformamide (DMF), and DMSO are commonly used as diluted solvents of volatile organic solvents. In this study, methanol, acetone, and DMF were not used because they are the target compounds. The solvent of Class 1 and Class 2 stock solutions is DMSO, and DMSO is mutually soluble with most of the residual solvents, thus DMSO was chosen as the base solvent. When headspace injection was used, higher sensitivity could be obtained for the less polar organic compounds dissolving in the more polar solvent, such as water. However, factors such as solubility should be noted. The volume ratio of DMSO to water 50:50 was adopted as the final dilution solvent.
Table 3 shows the results for the 52 compounds. Because of the concentration limit of the purchased standards mixtures, the linearity range of each compound is different, as shown in Table 3. Table A1 in Appendix A specifies the concentrations of each compound in the different levels analyzed. Linearity across the range studied gave R2 values of greater than 0.99 for the 52 compounds on both MSD and FID, with most having R2 values greater than 0.999. Repeatability was evaluated by eight consecutive injections at the concentration of a midlevel calibration standard (Level 4). Table 3 illustrates that for most compounds, the area %RSD by MSD was well below 5.8%. MDL values were calculated from the standard deviation of eight replicate runs of a low-level calibration standard (Level 2). The details are also shown in Table 3.
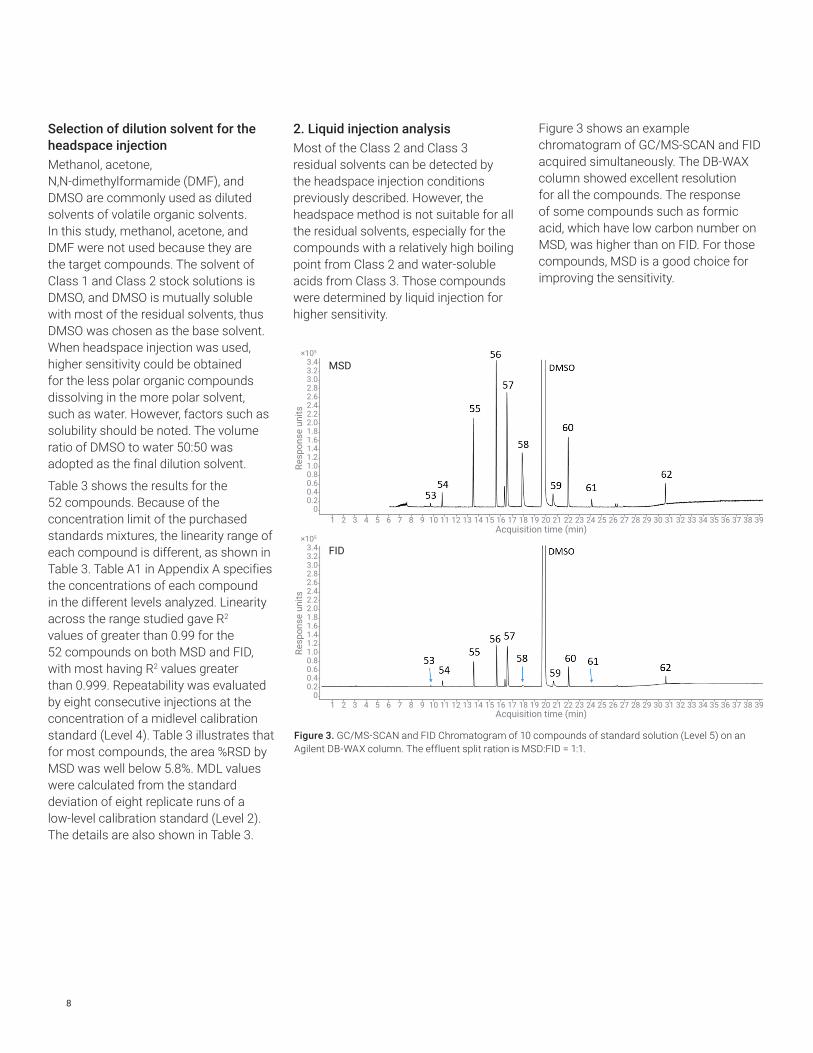
2. Liquid injection analysisMost of the Class 2 and Class 3 residual solvents can be detected by the headspace injection conditions previously described. However, the headspace method is not suitable for all the residual solvents, especially for the compounds with a relatively high boiling point from Class 2 and water-soluble acids from Class 3. Those compounds were determined by liquid injection for higher sensitivity.
Figure 3 shows an example chromatogram of GC/MS-SCAN and FID acquired simultaneously. The DB-WAX column showed excellent resolution for all the compounds. The response of some compounds such as formic acid, which have low carbon number on MSD, was higher than on FID. For those compounds, MSD is a good choice for improving the sensitivity.
00.20.40.60.81.01.21.41.61.82.02.22.42.62.83.03.23.4
7 8 9 10 11 121 2 3 4 5 6 13 14 15 16 17 18 19 20 21 22 23 24 25 26 27 28 29 30 31 32 33 34 35 36 37 38 39Acquisition time (min)
FID×105
Re
sp
on
se
un
its
×105
00.20.40.60.81.01.21.41.61.82.02.22.42.62.83.03.23.4
7 8 9 10 11 121 2 3 4 5 6 13 14 15 16 17 18 19 20 21 22 23 24 25 26 27 28 29 30 31 32 33 34 35 36 37 38 39
MSD
Re
sp
on
se
un
its
Acquisition time (min)
Figure 3. GC/MS-SCAN and FID Chromatogram of 10 compounds of standard solution (Level 5) on an Agilent DB-WAX column. The effluent split ration is MSD:FID = 1:1.

9
Influence of DMSO on retention time of acids for liquid injectionIn this study, 10 compound mixtures were made from Class 2C standard, formic acid, and acetic acid single standards. The solvent of Class 2C was DMSO, and the two acids were pure solvent. To achieve the required levels, six vials were made at each calibration level by spiking varying amounts of Class 2C and acids in water. This means that the higher the concentration of the sample, the higher the amount of DMSO. As Figure 4 shows, the retention time (RT) of formic acid and acetic acid shifted back with the increase of the concentration of the sample, while the RT of Class 2C compounds such as N,N-Dimethylacetamide (DMAC) and ethylene glycol remained the same in different levels. If the same RT of acids in different levels is needed, it is necessary to keep the amount of DMSO the same in different levels, as shown in Figure 5.
16.0 16.515.5 17.0 17.5 18.0 18.5 19.0 19.5 20.0 20.5
Acquisition time (min)C
ou
nts
Acetic acid
Formic acid
Ethylene glycol
DMAC
DMSO
Figure 4. The overlaid chromatogram of calibration levels of Level 1, Level 4, and Level 5 with different amounts of DMSO in the solutions.
16.0 16.515.515.0 17.0 17.5 18.0 18.5 19.0 19.5 20.0 20.5 21.0 21.5
Acquisition time (min)
Co
un
ts Acetic acid
Formic acid Ethylene glycol
DMAC DMSO
Figure 5. The overlaid chromatogram of calibration levels of Level 1, Level 4, and Level 5 with the same amount of DMSO in the solutions.
tert-
Bu
tylm
eth
yl e
the
r
trans
-1,2
-Dic
hlo
roe
the
ne
m,p
-xyl
em
e
o-x
yle
me
Figure 6. Area %RSD results for all the compounds.
10
Table 4 shows the correlation coefficients for the 10 compounds. R2 values were better than 0.9939 on both MSD and FID. Repeatability was tested using eight injections of the standard mixture at the concentration of Level 4. For all compounds, the area %RSD was well below 2.3%. MDL values were calculated from the standard deviation of eight replicate runs of the Level 1 calibration standard. These details are also shown in Table 4.
ConclusionResidual solvents of Class 1, 2, and 3 were tested using the Agilent 8890 GC/FID/MSD system. For new drug development and quality control, FID and MSD dual-channel configurations can be powerful tools for solvent residue analysis. MSD analysis can avoid the uncertainty of more than 60 solvents involved in drug production. When unknown peaks or unknown solvents appear, this system is the best solution for solvent identification and quantification.
References1. USP 32-NF 27, General Chapter USP
<467> Organic volatile impurities, United States Pharmacopeia. Pharmacopoeia Convention Inc., Rockville, MD, 8/2009.
2. Chinese Pharmacopeia (2015). Appendix ⅥⅥSolvent residue determination, China.
11
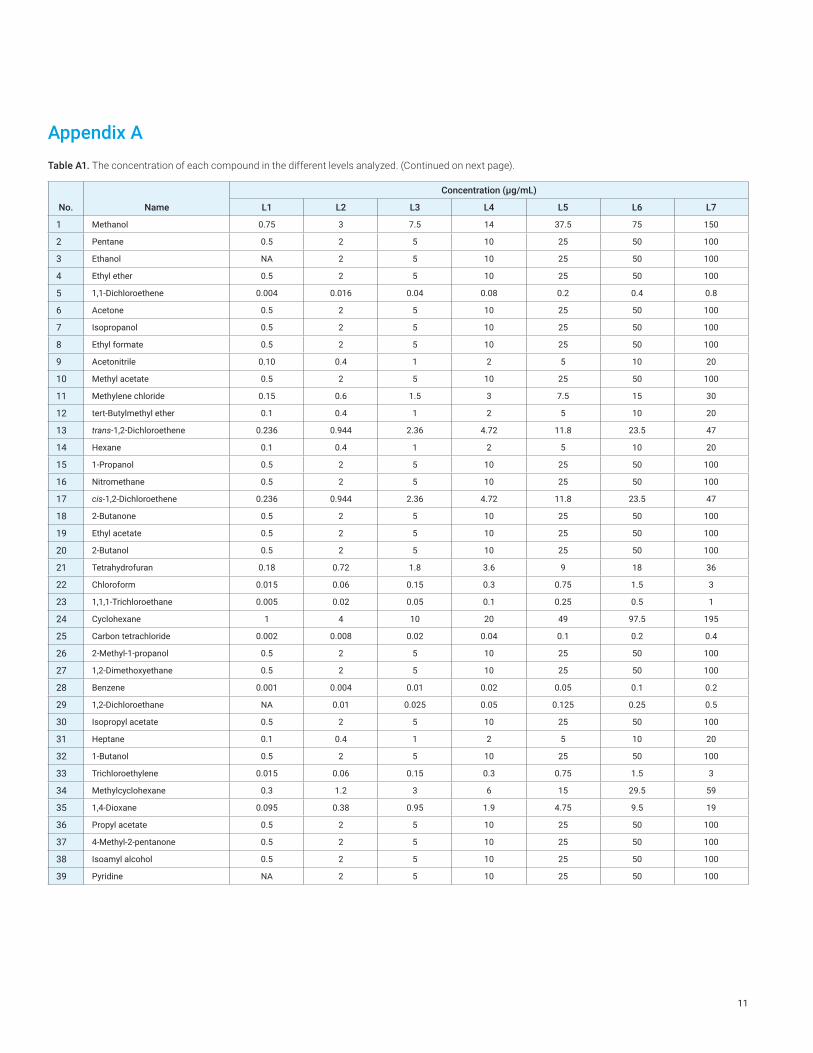
Appendix ATable A1. The concentration of each compound in the different levels analyzed. (Continued on next page).
No. Name
Concentration (μg/mL)
L1 L2 L3 L4 L5 L6 L7
1 Methanol 0.75 3 7.5 14 37.5 75 150
2 Pentane 0.5 2 5 10 25 50 100
3 Ethanol NA 2 5 10 25 50 100
4 Ethyl ether 0.5 2 5 10 25 50 100
5 1,1-Dichloroethene 0.004 0.016 0.04 0.08 0.2 0.4 0.8
6 Acetone 0.5 2 5 10 25 50 100
7 Isopropanol 0.5 2 5 10 25 50 100
8 Ethyl formate 0.5 2 5 10 25 50 100
9 Acetonitrile 0.10 0.4 1 2 5 10 20
10 Methyl acetate 0.5 2 5 10 25 50 100
11 Methylene chloride 0.15 0.6 1.5 3 7.5 15 30
12 tert-Butylmethyl ether 0.1 0.4 1 2 5 10 20
13 trans-1,2-Dichloroethene 0.236 0.944 2.36 4.72 11.8 23.5 47
14 Hexane 0.1 0.4 1 2 5 10 20
15 1-Propanol 0.5 2 5 10 25 50 100
16 Nitromethane 0.5 2 5 10 25 50 100
17 cis-1,2-Dichloroethene 0.236 0.944 2.36 4.72 11.8 23.5 47
18 2-Butanone 0.5 2 5 10 25 50 100
19 Ethyl acetate 0.5 2 5 10 25 50 100
20 2-Butanol 0.5 2 5 10 25 50 100
21 Tetrahydrofuran 0.18 0.72 1.8 3.6 9 18 36
22 Chloroform 0.015 0.06 0.15 0.3 0.75 1.5 3
23 1,1,1-Trichloroethane 0.005 0.02 0.05 0.1 0.25 0.5 1
24 Cyclohexane 1 4 10 20 49 97.5 195
25 Carbon tetrachloride 0.002 0.008 0.02 0.04 0.1 0.2 0.4
26 2-Methyl-1-propanol 0.5 2 5 10 25 50 100
27 1,2-Dimethoxyethane 0.5 2 5 10 25 50 100
28 Benzene 0.001 0.004 0.01 0.02 0.05 0.1 0.2
29 1,2-Dichloroethane NA 0.01 0.025 0.05 0.125 0.25 0.5
30 Isopropyl acetate 0.5 2 5 10 25 50 100
31 Heptane 0.1 0.4 1 2 5 10 20
32 1-Butanol 0.5 2 5 10 25 50 100
33 Trichloroethylene 0.015 0.06 0.15 0.3 0.75 1.5 3
34 Methylcyclohexane 0.3 1.2 3 6 15 29.5 59
35 1,4-Dioxane 0.095 0.38 0.95 1.9 4.75 9.5 19
36 Propyl acetate 0.5 2 5 10 25 50 100
37 4-Methyl-2-pentanone 0.5 2 5 10 25 50 100
38 Isoamyl alcohol 0.5 2 5 10 25 50 100
39 Pyridine NA 2 5 10 25 50 100
www.agilent.com/chem
For Research Use Only. Not for use in diagnostic procedures.
This information is subject to change without notice.
© Agilent Technologies, Inc. 2019 Printed in the USA, November 15, 2019 5994-1488EN DE.4496875
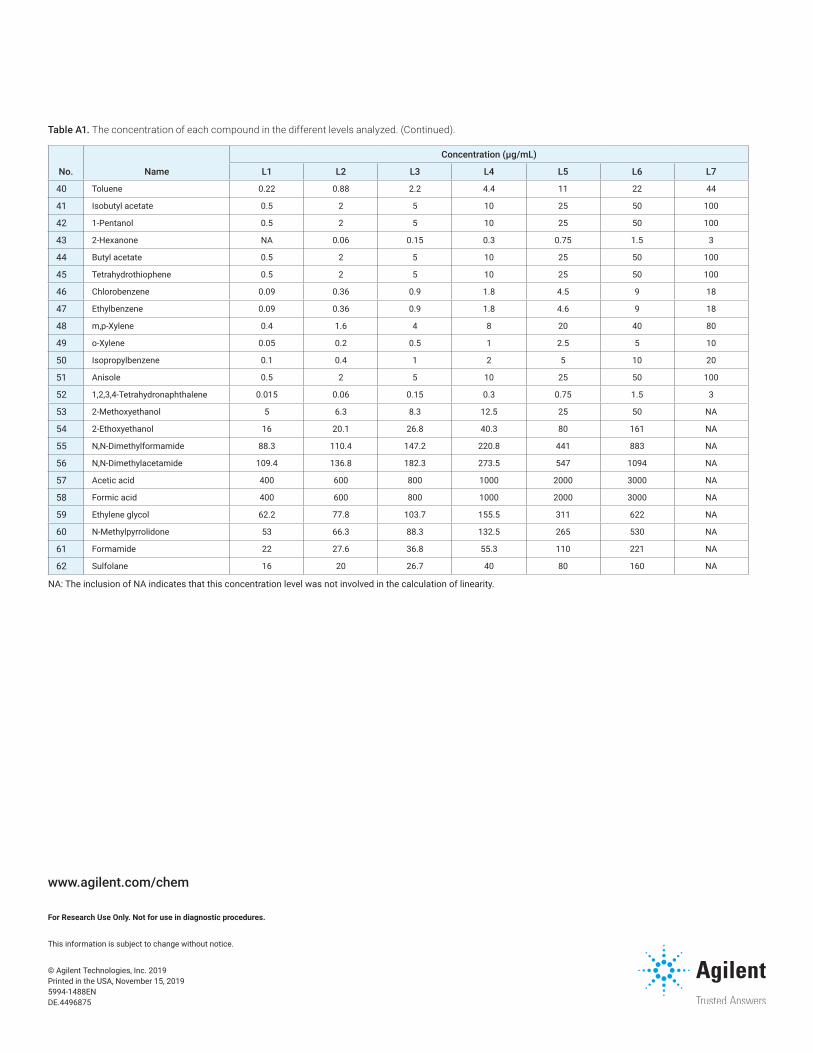
No. Name
Concentration (μg/mL)
L1 L2 L3 L4 L5 L6 L7
40 Toluene 0.22 0.88 2.2 4.4 11 22 44
41 Isobutyl acetate 0.5 2 5 10 25 50 100
42 1-Pentanol 0.5 2 5 10 25 50 100
43 2-Hexanone NA 0.06 0.15 0.3 0.75 1.5 3
44 Butyl acetate 0.5 2 5 10 25 50 100
45 Tetrahydrothiophene 0.5 2 5 10 25 50 100
46 Chlorobenzene 0.09 0.36 0.9 1.8 4.5 9 18
47 Ethylbenzene 0.09 0.36 0.9 1.8 4.6 9 18
48 m,p-Xylene 0.4 1.6 4 8 20 40 80
49 o-Xylene 0.05 0.2 0.5 1 2.5 5 10
50 Isopropylbenzene 0.1 0.4 1 2 5 10 20
51 Anisole 0.5 2 5 10 25 50 100
52 1,2,3,4-Tetrahydronaphthalene 0.015 0.06 0.15 0.3 0.75 1.5 3
53 2-Methoxyethanol 5 6.3 8.3 12.5 25 50 NA
54 2-Ethoxyethanol 16 20.1 26.8 40.3 80 161 NA
55 N,N-Dimethylformamide 88.3 110.4 147.2 220.8 441 883 NA
56 N,N-Dimethylacetamide 109.4 136.8 182.3 273.5 547 1094 NA
57 Acetic acid 400 600 800 1000 2000 3000 NA
58 Formic acid 400 600 800 1000 2000 3000 NA
59 Ethylene glycol 62.2 77.8 103.7 155.5 311 622 NA
60 N-Methylpyrrolidone 53 66.3 88.3 132.5 265 530 NA
61 Formamide 22 27.6 36.8 55.3 110 221 NA
62 Sulfolane 16 20 26.7 40 80 160 NA
NA: The inclusion of NA indicates that this concentration level was not involved in the calculation of linearity.
Table A1. The concentration of each compound in the different levels analyzed. (Continued).