analysis of undergraduate grade trends at brigham young
TRANSCRIPT
Brigham Young University Brigham Young University
BYU ScholarsArchive BYU ScholarsArchive
Theses and Dissertations
2015-05-01
Analysis of Undergraduate Grade Trends at Brigham Young Analysis of Undergraduate Grade Trends at Brigham Young
University Across a 20-Year Period University Across a 20-Year Period
Kirsten Rose Thompson Brigham Young University - Provo
Follow this and additional works at: https://scholarsarchive.byu.edu/etd
Part of the Educational Psychology Commons
BYU ScholarsArchive Citation BYU ScholarsArchive Citation Thompson, Kirsten Rose, "Analysis of Undergraduate Grade Trends at Brigham Young University Across a 20-Year Period" (2015). Theses and Dissertations. 5591. https://scholarsarchive.byu.edu/etd/5591
This Dissertation is brought to you for free and open access by BYU ScholarsArchive. It has been accepted for inclusion in Theses and Dissertations by an authorized administrator of BYU ScholarsArchive. For more information, please contact [email protected], [email protected].

Analysis of Undergraduate Grade Trends at Brigham Young University
Across a 20-Year Period
Kirsten Rose Thompson
A dissertation submitted to the faculty of Brigham Young University
in partial fulfillment of the requirements for the degree of
Doctor of Philosophy
Richard R Sudweeks, Chair Scott D. Grimshaw
Jeffrey D. Keith Ross Larsen
Danny R. Olsen
Department of Instructional Psychology and Technology
Brigham Young University
May 2015
Copyright © 2015 Kirsten Rose Thompson
All Rights Reserved

ABSTRACT
Analysis of Undergraduate Grade Trends at Brigham Young University Across a 20-Year Period
Kirsten Rose Thompson Department of Instructional Psychology and Technology, BYU
Doctor of Philosophy
Grades awarded to undergraduate students at Brigham Young University over a 20-year period were analyzed to determine to what extent the mean GPA may have increased. Study variables included enrolled freshman mean ACT, enrolled freshman mean AP credits, faculty research productivity, student evaluations of teaching (SET), and a university policy change regarding course withdrawal dates and calculating students’ mean GPA. Other study variables included the overall grading philosophy of the college or school (normative, mastery, or other) and the course level (upper division, lower division). The study employed a regression model with splines for the residual, or yearly trend.
Upper division courses have higher mean GPA than lower division courses, and mean GPA in mastery-based grading colleges are higher than in normative-based grading colleges. Mean GPA in upper division courses are consistently higher than mean GPA of lower courses, regardless of college grouping, but the difference between the upper and lower division mean GPA scores of the normative-grading classification is significantly larger than the difference between upper and lower division mean GPA of the other two grading classifications. Faculty research productivity had no impact on mean GPA. SET scores are highly correlated with college grading philosophy and course level and did not further predict mean GPA. The university policy change had no statistically significant effect on most mean GPA, but there is a marginally significant negative local effect on mean GPA of the lower division normative courses, as well as a marginally significant positive effect on mean GPA of lower division mastery courses.
Grade trends vary between colleges with differing grading philosophies. They also likely vary across departments within colleges and from course to course within departments. Trends also differ between course level. Except for the non-significant effect of the policy change, mean GPA trends across most categories at the university have leveled off for more than a decade and are likely to remain so. Study results indicate there is no reason for alarm and that no systemic, rampant pattern of grade inflation is evident.
Keywords: grade inflation, grade increase, trend analysis

ACKNOWLEDGEMENTS
I am indebted to so many colleagues and friends who helped with this study. Many
thanks to Eric Meyers and Tom Mallory for digging through dark, dusty passageways in the
databases to scrape up most of the data used in this analysis. Thanks also to Larry Seawright for
helping with my projects and giving great advice. I’m ever grateful to the faculty in the
department of Instructional Psychology and Technology for their teaching examples and for their
untiring support.
I am fortunate that some very amazing people agreed to be on my dissertation committee.
They have been patient, thoughtful advisors and have helped make this study the best it could be.
I thank Danny Olsen for the brainstorming sessions and his suggestion for a follow-up study to
his dissertation 20 years ago. And Dr. Grimshaw spent many hours working with me on the
splines and helping write code for the analysis. I owe a substantial debt of gratitude to my
committee chair, Dr. Sudweeks, for years of patient mentoring and encouragement. I could not
have done this without him.
Finally, I’m grateful for the support of my family and friends who have encouraged me to
pursue this and to finish it, even when it seemed impossible to do. Special thanks to my family
for picking up the slack when mom was busy writing — Tim, Allie, Daniel, Zach, and Emma. I
love you to pieces.

iv
TABLE OF CONTENTS
ABSTRACT .................................................................................................................................... ii
ACKNOWLEDGEMENTS ........................................................................................................... iii
TABLE OF CONTENTS ............................................................................................................... iv
LIST OF TABLES ......................................................................................................................... vi
LIST OF FIGURES ...................................................................................................................... vii
CHAPTER 1: INTRODUCTION ................................................................................................... 1
Grades at BYU ............................................................................................................................. 3
Factors Influencing Grades .................................................................................................... 3
Faculty influences. ........................................................................................................... 4
Student influences. ........................................................................................................... 7
Parental influences. .......................................................................................................... 8
Institutional influences. .................................................................................................... 9
Previous Study of Grade Trends at BYU ............................................................................. 13
Purpose of Study ........................................................................................................................ 14
Research Questions .............................................................................................................. 14
Rationale .............................................................................................................................. 15
Delimitations ........................................................................................................................ 15
Definition of Terms.............................................................................................................. 16
Grade. ............................................................................................................................. 16
Grade inflation. .............................................................................................................. 16
Grade increase. ............................................................................................................... 16
Baseline GPA. ................................................................................................................ 16
Adjusted GPA. ............................................................................................................... 16
Mastery-based grading. .................................................................................................. 16
Normative grading. ........................................................................................................ 16
Other grading philosophies. ........................................................................................... 16
CHAPTER 2: LITERATURE REVIEW ...................................................................................... 17
Databases Searched ................................................................................................................... 17
Search Strategy Used ................................................................................................................ 17
Procedure ................................................................................................................................... 17

v
Summary of Previous Research ................................................................................................ 18
Nationwide grade inflation evidence. ................................................................................... 18
Counterarguments. ................................................................................................................ 18
Possible causes of grade increase. ........................................................................................ 19
Data Limitations in Previous Studies ........................................................................................ 22
Conclusions ............................................................................................................................... 26
CHAPTER 3: METHOD .............................................................................................................. 27
Population and Dependent Variable .......................................................................................... 27
Variables Included in Analysis ................................................................................................. 28
Student variables. .................................................................................................................. 28
Faculty variables. .................................................................................................................. 30
University variables. ............................................................................................................. 32
Additional Study Variables ....................................................................................................... 33
Grading philosophies. ........................................................................................................... 33
Course level. ......................................................................................................................... 34
Student credit hours. .................................................................................................................... 35
Statistical Model Exploration and Specification .......................................................................... 36
CHAPTER 4: RESULTS .............................................................................................................. 40
Model ........................................................................................................................................ 40
Research Question 1 .................................................................................................................. 41
Research Question 2 .................................................................................................................. 42
Research Question 3 .................................................................................................................. 44
Research Question 4 .................................................................................................................. 46
Prediction .................................................................................................................................. 50
CHAPTER 5: DISCUSSION ........................................................................................................ 53
Future Research Recommendations .......................................................................................... 55
Recommendations for Practice.................................................................................................. 56
References ..................................................................................................................................... 58
Appendix A ................................................................................................................................... 64

vi
LIST OF TABLES
Table 1. GPA by Academic Year ................................................................................................. 29
Table 2. Summary Statistics for ACT, AP Credits, and Faculty Activity Index .......................... 30
Table 3. Summary Statistics for Student Evaluations of Teaching .............................................. 30
Table 4. Grading Philosophy Classifications ................................................................................ 35
Table 5. Number and Percent of Student Credit Hours Graded by Lower and Upper Division
Courses from 1994-2014 by College or School ............................................................. 36
Table 6. Number and Percent of Student Credit Hours Graded by Lower and Upper Division
Courses from 1994-2014 by College Grading Classification ........................................ 37
Table 7. Estimates of Mean GPA of Observational Units (αij) Holding all other Variables
Constant ......................................................................................................................... 41
Table 8. Estimates of AP, Faculty Activity Index, and SETs (βs) Holding all other Variables
Constant ......................................................................................................................... 42
Table 9. Estimates of Semester (γij) Holding all other Variables Constant .................................. 43
Table 10. Estimates of Policy Change (θij) Holding all other Variables Constant ....................... 44
Table 11. Estimates of Policy Interim Period (φij) Holding all other Variables Constant ............ 45
Table 12. Location of Internal Knots ............................................................................................ 48
Table 13. Forecast Values Used to Predict Mean GPA ................................................................ 50
vii
LIST OF FIGURES
Figure 1. Plot of mean GPA for normative lower division courses over the 20-year period with
possible linear, quadratic, cubic, and quartic models. .................................................. 46
Figure 2. Year trend using B-splines ............................................................................................ 47
Figure 3. Grade trends by observational unit. .............................................................................. 48
Figure 4. Forecasted mean GPA trends 2015-2020...................................................................... 52

1
CHAPTER 1: INTRODUCTION
Hand-wringing and angst about average grades in higher education is not a modern issue.
The controversy goes back farther than most people realize. In 1894, a committee at Harvard
University complained that “Grades A and B are sometimes given too readily — Grade A for
work of no very high merit, and Grade B for work not far above mediocrity” (Report of the
Committee on Raising the Standard, 1894, as cited in Kohn, 2008, p. 1). Recognizing the
longevity of the issue, commonly referred to as grade inflation, can help frame the debate
currently taking place in academic journals and in the popular press, where researchers dispute
and point fingers over its causes, its solutions, and — perhaps surprisingly — whether or not
grade inflation even exists. The factors that may have caused grades to be higher than expected
in the 1890s are not necessarily the same factors to which current researchers are attributing the
modern increase in average grades. Historical factors blamed for causing grade inflation range
from the Vietnam War to Affirmative Action to popular psychology and concerns about
students’ self-esteem. While some of these factors may have influenced average grades at some
institutions at a particular point in the past, it seems unlikely that the effect these events may
have had would be pervasive through all institutions and persist across decades.
Reports in the media and academic journals over the last two decades have presented data
that indicate the number of As and Bs given to college students is increasing in relation to the
number of lower grades given (Levine & Cureton, 1998; Rojstaczer & Healy, 2012).
Additionally, research has shown evidence that college GPAs of recent students are higher than
college GPAs of previous generations and that GPAs continue to increase each year at a steady
rate (Kuh & Hu, 1999; Rojstaczer & Healy, 2012). Nationwide, SAT scores have remained

2
relatively stable during the same period of time (College Board, 2013). Critics argue that rising
GPAs and stable SAT scores are evidence of a nationwide crisis regarding inflated grades.
Research has contradicted this claim that there is a nationwide crisis regarding grades
(Adelman, 2008; Pattison, Grodsky, & Muller, 2013). “Most of the increase in college grades
appears to be the result of factors other than grade inflation. In fact, no systematic evidence
supports the assertion that grade inflation is widespread” (Hu, 2005, p. 42).
‘Inflation’ is a term used to describe an economic condition in which products or services
increase in cost, while the quality or type of product remains the same. Grade inflation has
become the term used to describe student grades that increase over time without a corresponding
increase in quality or achievement on the part of the student during that same time period —
although it should be noted that in addition to the debate over the existence of grade inflation,
there is also discussion surrounding its very definition (Hu, 2005; Kamber, 2008; Ku & Hu,
1999; McSpirit, Jones, & Chapman, 2000). Inflation is a word with negative connotations, and
its use in the context of grades implies that the high grades given to current students are not
earned or are not based upon the same criteria that grades were based on in previous decades. To
counter this negative connotation, some researchers have proposed the phrase grade increase or
grade improvement as a more accurate term for the phenomenon of rising grades (Hu, 2005;
Kamber, 2008; Mostrum & Blumberg, 2012). Kohn (2008) points out that one should not
automatically assume that a high grade is inappropriate simply because it is high.
Grades are one of the most visible and influential currencies in higher education. They
are one of the ways in which higher education is evaluated. Students are not the only
stakeholders whose worth and success are measured by grades; faculty and institutions are also
measured and compared using those same grades. There is great diversity among colleges and

3
universities. It is widely understood that an A at one institution is not necessarily the same as an
A at another institution. Also, a C in a particular course does not always represent the same level
of achievement as a C in a different course, even if it is taught at the same college or even the
same department. An attempt to clarify these disparities is not within the scope of this study, and
perhaps nothing can or should be done to implement a nationwide, systematic standard that
would prescribe a unified grading methodology. Higher education is a free market to some
extent, one in which the professor is trusted as an expert in his or her field and it is up to the
professor to decide how well the student has mastered the content. Students have the opportunity
to choose between classes, professors, majors, and even institutions. Institutions evaluate their
faculty and tenure those who are successful according to the values and principles of the
institution.
Grades at BYU
Brigham Young University (BYU) is sponsored by The Church of Jesus Christ of Latter-
day Saints and is the one of the largest private universities in the United States. It is part of a
larger Church Education System (CES) that includes BYU satellite campuses in Jerusalem and
Salt Lake City, sister universities in Idaho and Hawaii, and a business college in Utah. With ten
colleges, BYU offers degrees in more than 180 academic programs, master's degrees in more
than 60 programs, and doctorates in 25 programs. More than 1,600 full-time faculty and 500
adjunct faculty instruct over 30,000 students in over 7,000 classes each semester.
Factors Influencing Grades
Grades are awarded to students by the instructor as a measure of the students’ success in
demonstrating that they have learned, understood, and can apply the knowledge acquired in the
course. By its nature, a grade is a judgment call by the professor. The grade a student receives is,

4
theoretically, evidence of their learning. In addition to the personal judgment of the instructor
and the level of student performance and achievement, other factors influence grades, whether
the professor (or student) realizes this or not. These factors likely impact grades differently
across students, courses, departments, and institutions. Some factors impact grades in individual
courses, while others influence total grade point average (GPA). In this paper, mean semester
GPA and mean semester course grades will be used interchangeably, unless noted.
Faculty influences. Faculty bear the main responsibility for teaching students in higher
education. Faculty choose the content, the course organization, the method of instruction, and the
method of assessment used in their courses. Generally, faculty want their students to learn the
material and perform well on assessments. However, there is a philosophical conflict because
faculty are both advocates for students and judges of student performance. On one hand, it is
their role to make a final ruling on how well the student has achieved the goals of learning the
course material, but they have also just spent a semester as an advocate for and mentor to that
student, helping him or her to remember and understand the course content. This contradictory
role is not a comfortable position for many educators and can make them vulnerable to subtle
external influences on their grading practices.
Departmental grading policies and influences. For many faculty, there is pressure —
spoken or implied — from peers and administrators to maintain a normal distribution for the
grades awarded in their classes. Mean grades can vary across departments, depending on the type
of discipline.
Some subjects lend themselves to objective assessment measures, such as math,
chemistry, physics, and economics. These disciplines appear to be less affected by individual
faculty grading tendencies or pressure from students because the grade awarded is not dependent

5
on the personal judgment of the instructor. Some departments have predetermined ideal mean
scores for the grades in their courses and adjust their exam questions to facilitate a normal bell
curve distribution for grades, with only top performers being awarded high grades. Nationwide,
grades in courses taught in these fields tend to fit a normal distribution, and mean grades are
among the lowest of all subjects (Grove & Wasserman, 2004; Jewell, McPherson, & Tieslau,
2013; Johnson, 2003; Sabot & Wakeman-Linn, 1991). Of interest, however, are recent reports
that even these objectively graded courses can experience grade inflation (Lowe, Borstorff, &
Landry III, 2008; McAllister, 2008).
Grading in subjects such as English, philosophy, nursing, education, and political science
is more subjective by nature and is more vulnerable to outside influences on the instructor’s
judgment. Grade distributions in these courses tend to be negatively skewed and have lower
standard deviations.
Another influence on course grade distributions is the grading philosophy of the
department or content area. Some disciplines use a mastery-based or criterion-referenced
approach to grading. A mastery-based course is one in which the students are mentored and
assistance is given to each student until they reach a determined level of achievement. Students
are given multiple chances to master one level before moving ahead to a more advanced level.
Students in the same course may be at different achievement levels during the semester, but all
have the opportunity for a high grade. Brighouse (2008) argues that the average grades awarded
by quantitative disciplines should not be compared to the average grades awarded by qualitative
disciplines.
Department policies can impact the mean GPAs of students. One direct impact on student
GPA is the requirement in some departments that all courses taken for that major must be

6
completed with a C or higher grade. Some majors will not accept credit for a course that a
student passes with a D. By not accepting a D grade, the GPA mean will increase because
students who may normally have earned a D grade will work harder to acquire the C- or will not
be allowed to major in that field. Faculty may also feel pressure to raise D+ grades up a half-
grade to allow the course to be counted.
Student evaluation of teaching (SET). Research shows that there are correlations
between scores on student evaluations of faculty and the expected grades of the students in the
course they are teaching. Generally, higher SET scores correlate to higher average grades for the
course. Whether there is a causal relationship or other variables are also in play, the evidence of
a relationship of some kind appears to be conclusive (Eiszler, 2002; Ellis, Burke, Lomire, &
McCormack, 2003; Griffin, 2004; Johnson, 2003; McPherson, 2006; McSpirit, Jones, &
Chapman, 2000; Sonner, 2000).
Course characteristics. Research shows that there is a negative correlation between the
size of the course and the average grade of the course (Jewell & McPherson, 2012; Sonner,
2000). Likewise, there is also a negative correlation between the number of lower-level students
(e.g., freshmen and sophomore) in a course and the average course grade: Courses that have a
higher percentage of upperclassmen (e.g., juniors and seniors) have higher average grades
(Creech & Sweeder, 2012; Jewell, McPherson, & Tieslau, 2013). Service courses at BYU are
generally 100-level, large introductory courses taught by a department for students who are
usually not majoring in that content area. For example, Chem 105 is a beginning chemistry
course that fulfills a General Education requirement for non-chemistry majors. Major courses are
generally 300- or 400-level courses with smaller class sizes and more upperclassmen (although
there are some lower division courses for majors, most of the major courses are upper division).
7
When calculating average grades on a departmental level, both the service courses and major
courses that the department teaches are included in the overall average grade for the department.
These two types of courses are different enough that they could be analyzed separately when
grade trends are being investigated. The lower grade averages of the service courses could be
hiding grade increases in the upper level major courses.
Student influences. Because the demographics of the students being studied are
important, factors based on student influences should be included in the study. Over the past 20
years, the student body at BYU has changed across various metrics, and many of these
differences can affect today’s grade trends.
Qualifications of admitted students. Applicants to BYU are more prepared for higher
education than ever before. Many students have taken a preparation course, practice exams, and
even retaken the ACT or SAT multiple times to achieve their highest score possible (E. Meyers,
personal communication, June, 2014). Some schools are incorporating ACT/SAT prep courses
into their traditional curricula.
The number of Advanced Placement (AP) credit hours BYU freshman have taken has
increased over the last 20 years. Freshmen in 2013 came to their first day of college with an
average of 20.4 AP credits under their belt, up from 14.9 in 1995. AP courses are generally more
challenging than regular high school courses and better prepare students for the rigor of higher
education. Additionally, sometimes, AP credit is counted toward higher education course
requirements. High school students who intend to go to college are counseled to take these
courses to improve their chances of being accepted at a selective university.
Student achievement and performance. It is assumed that the most prominent factor
influencing student grades is the performance of the student on assessments given by the

8
instructor. Student performance in itself is multi-faceted because individual students will perform
differently on different types of assessments in different contexts. Students are also unique in
their learning styles, and if a course is predominantly lecture-based, those students who are
efficient at audial learning will succeed. Those who would learn better by reading the text or
experiencing the content in an interactive way likely will not fare as well.
Student motivation. Not all students come to higher education with the same level of
motivation. Raw intelligence is certainly crucial, but even extremely brilliant individuals can fail
to earn high grades if they cannot discipline themselves to work hard or are not interested in the
task of learning. On the other hand, students with high motivation have the potential to perform
better than their ACT scores predicted if they are determined to succeed.
Student choice. One factor closely tied to student motivation is choice. Students choose
which school to apply for, what field they want to major in, and what courses they want to take.
Students generally choose majors in which they do well. If they perform poorly in a class, they
often do not persist in taking courses within that discipline (Creech & Sweeder, 2012; Sabot &
Wakeman-Linn, 1991). Savvy students will also take courses with a lighter workload in
semesters in which they are taking courses they expect to be more difficult or time-consuming
(Grove & Wasserman, 2004). However, Rojstaczer and Healy (2012) provide evidence that
students are not flocking to majors that are considered easy.
Parental influences. Anecdotal reports across campus offices indicate that the volume of
contact between parents and students is increasing. Today’s BYU students are more likely than
those in the past to have parents with at least some college experience (E. Meyers, personal
communication, June, 2014). College-educated parents tend to make more money, live in better
school districts, and be savvier in preparing their children for higher education (Jones & Jackson,
9
1990; Wise, 1975). Alumni understand the system of higher education and can better advise their
children on what courses to take, what majors to enroll in, and how to navigate college life in
general.
Institutional influences. University policies and practices can impact grades directly and
indirectly, but these policies and practices are often overlooked when researchers are
investigating grade increase causes.
Enrollment cap. As has been discussed, the qualifications of BYU’s admitted students
are increasing each year. A key factor impacting these qualifications is the cap on the number of
enrolled students set by BYU’s Board of Trustees. Historically, this cap was a straight head
count of full-time students and was increased over the years as resources were made available to
accommodate increasing demand. In 2008, the calculation for the cap was standardized across all
CES schools using a full-time equivalent (FTE) student as the unit of measure. To calculate total
student FTE, the total number of credit hours taken by enrolled day students during the fall
semester is divided by 15, which is the number set by the Board as an FTE. The current
enrollment cap is set at 30,500 FTE students.
As the applicant pool grows larger, the number of highly qualified students increases
proportionally. However, the number of students BYU can admit each year does not change with
increasing demand, so more students each year are denied admissions, and the percentage of
highly qualified students that are admitted increases. The result is that as demand increases, the
ACT scores, high school GPAs, and other qualifications of admitted applicants also increase.
Increasing numbers of applicants. BYU is sponsored by The Church of Jesus Christ of
Latter-day Saints (LDS Church). Many LDS Church members hope to attend BYU, where they
can earn a higher education degree in an atmosphere that supports their values because 98% of

10
BYU students are members of the LDS Church. With a total Church membership of over 15
million, the interest in attending BYU is high. Currently, there are 402,871 living BYU alumni.
Most of these alumni would like their children and grandchildren to attend their alma mater.
BYU also has one of the highest claim rates for universities in the nation. The claim rate
is the percentage of applicants who accept an offer of admission. For the past decade, BYU has
had a claim rate of around 79%. In other words, out of every ten students who are offered
admission to BYU, eight students will accept and enroll in classes. This high claim rate is
evidence that BYU is the top choice for the majority of its applicants.
Academic Standards Policy. Students at BYU must maintain a minimum cumulative
GPA of 2.0 at all times. Students who have below a 2.5 GPA for a semester are flagged. They
are contacted and encouraged by academic counselors to seek remedial help. Any semester in
which a student’s GPA falls below a 2.0 earns the student the WARN (warning) status, and their
future registration for classes is blocked. A student then must meet with an advisor or faculty
mentor, complete an academic success plan, and continue to earn semester GPAs above 2.0 in
order to register for classes. If the student is able to raise their next semester’s GPA above a 2.0,
they return to GOOD status and are able to register as any other day student. However, if the
student continues to perform below a 2.0 GPA the subsequent semester, they are moved to
PROB (probation) status. The registration block continues, and the student must again meet with
a faculty mentor or advisor and revisit his or her academic plan. Any future semesters with a
GPA above a 2.0 are named PREV (previous), and the student can register without restrictions.
However, the PREV status means that if a semester GPA drops below a 2.0 at any point, the
student is immediately assigned PROB status, skipping the WARN semester. If a student has
received PROB status and continues to have a semester GPA below 2.0, they are then suspended

11
and their status is SUSP. A suspended student is asked to step away from the university for at
least one year and apply for readmission after that year has passed. In brief, three strikes and you
are out. BYU dismisses approximately 250 students each year due to this policy, or less than 1%
of the student body.
At BYU, a GPA of 2.0 represents a grade of C, which is mathematically considered to be
the average. It should come as no surprise that the average GPA at BYU is above 2.0 because the
university does not allow students who continue to perform below average to stay at BYU. Most
students who find themselves close to the lower limit work hard to improve their grades so they
can continue their schooling at BYU. However, in essence, BYU is much like Lake Woebegon,
where all of the continuing students are above average because students with a GPA less than 2.0
are systematically excluded. Because the number of students who apply for admission far
exceeds the enrollment cap, it is understandable that the university would want only students
who perform adequately to continue. Nevertheless, the policy of dismissing students who have a
GPA less than a C average must then be considered when faculty or administrators discuss the
reasons the average GPA seems high.
As stated before, faculty in some courses feel pressure to maintain a specific distribution
and have been heard to tell students that, since the average grade on the test was higher than
expected, the next test will need to be to rewritten to bring the class average down. Considered in
the light of the Academic Standards Policy and taken to the extreme, half of the students every
class could be potentially be dismissed from the university each semester. Without the influx of
new freshmen students each year and ignoring the likely possibility that a student could improve
a below-average grade in one class with a higher grade in another, BYU would end up
eliminating their entire current student body, except one student, within half a decade. A simple

12
illustration of this is a class of 24 students. According to the definition of average, approximately
12 students will perform below average and be dismissed. Then, with 12 remaining students,
another class is taken. Half of those students will perform below average, so the total remaining
is six, then three, and then one or two. This is an extreme example, but it illustrates the point that
demanding a normal distribution of grades in all classes is not very sustainable for a university
over time.
Change in Withdrawal Policy. Due to a change in policy that began in the fall semester
of 2011, students at BYU can withdraw from a course up until the tenth week of a semester, at
which time a W (withdrawal) will be placed on their transcript, regardless of the grade the
student earned up to that point. A grade of W indicates that the student did not complete the
course they registered for, but it is not counted as a grade or credits and has no impact on GPA.
Prior to this change in policy, students had only five weeks to withdraw from a course without
penalty. Lengthening the time allowed for a no-penalty withdrawal could theoretically raise the
university GPA average because students who are failing or performing below average are more
likely to withdraw from a course than a student who has above-average grades at the time of
withdrawal.
Change in the policy regarding grades in repeated courses. Another university policy
change that can impact BYU grades is the change in policy regarding counting grades in
repeated courses. Prior to the fall 2011 semester, students could repeat a course, and the
subsequent grade for that same course would replace the initial grade in the BYU GPA
calculation. For example, if a student took Math 112 and earned a D, they could retake Math 112
a later semester, earn a C or higher, and the D would no longer be included in BYU GPA
calculations. As of fall 2011, all course grades are counted and BYU GPA calculations include

13
all courses — regardless of whether or not the course has been taken previously. This policy
change was implemented to comply with federal guidelines regarding federal financial aid to
students. This change in the calculation of GPA has the theoretical effect of lowering university
GPA averages because the lower grade is no longer replaced by a subsequent score in the
adjusted BYU GPA calculation.
Previous Study of Grade Trends at BYU
Twenty years ago, Dr. Danny Olsen studied grade inflation and deflation at BYU (Olsen,
1995). He created a grade prediction model based on a model created by Rowe, Higley, Larsen,
and Bills (1985), which predicted the first semester of college grades earned by new freshmen. It
utilized high school GPA and ACT scores as predictors. To predict beyond the first semester,
Olsen added three other factors to the regression model: year in school, gender, and number of
semester credit hours carried. Each college was analyzed separately, along with an analysis of
the university as a whole. He utilized a time series analysis of the ratio of actual grades divided
by the expected or predicted grades.
The result of his research showed that when the above variables were accounted for, students
in some colleges at BYU performed better than would have been expected, while others performed
worse than predicted. He termed these phenomena structural grade inflation and structural grade
deflation, respectively. A similar study of the last 20 years of grade distributions at BYU could
investigate recent data and see if the trends have continued. Furthermore, some variables could be
added or removed to improve the model and better predict college GPA. In one sense, this study is a
follow-up to Olsen’s (1995), but additional questions will help us further understand the data.

14
Purpose of Study
The purpose of this research is to describe the trend in the average grades awarded at
Brigham Young University over the past 20 years and to determine what factors may have
influenced this trend.
Research Questions
1. How does mean GPA differ between
a. Lower-division and upper-division courses
b. Categories of colleges/schools on campus that differ in their grading philosophies
and practices
2. What measurable factors, other than changes in university policies, appear to be
associated with the variability in the grade trend at BYU over the last 20 years?
a. Changes in the qualifications of incoming students (including AP classes taken
and average ACT scores)
b. Change in the qualifications of faculty (including mean Activity Index scores and
mean ratings of teachers by students in their courses)
3. To what extent do changes in the average grades awarded at BYU during 1995-2014
appear to be influenced by changes in the university policies on course withdrawal dates
and calculating students’ mean GPA?
a. Changes in the policy regarding course withdrawal dates (fall 2011)
b. Changes in the practice of calculating GPA using courses that were retaken (fall 2011)
4. To what extent have average BYU grades, both baseline GPA and adjusted GPA,
increased or decreased during the past 20 years (1994-2014), and how does the trend of
each compare with the trend previously reported by Olsen (1995)?
15
Rationale
It is not likely that the debate on nationwide rising grade trends can ever truly be put to
rest, because the topic has reached mythic proportions. However, by examining grades on a
smaller scale, the data can be better controlled for consistency and accuracy. Conflicting
opinions as to the extent or even existence of grade inflation are due largely to the poor quality
and consistency of the data being analyzed.
Before jumping to the seemingly foregone conclusion that students at BYU are being
awarded inflated grades, faculty and administrators need to know what is and is not occurring.
Some researchers claim that grades are increasing at U.S. universities at higher rates than SAT or
ACT scores would predict. Twenty years ago, research revealed evidence that grades in some
colleges at BYU appeared to be inflated (Olsen, 1995), but recent data indicate that some
conditions influencing BYU grades have changed in the last two decades. Furthermore,
departmental and university policies have been implemented in the last two decades that may
also impact average grades.
Delimitations
This study will include grade data from undergraduate courses taught at BYU during the
fall and winter semesters from winter 1994 through and including winter 2014 in which a student
received a grade. Prior research has shown that grades given at BYU during the spring and
summer terms follow a different pattern and are statistically higher than grades awarded in
similar courses during the fall and winter semesters (Olsen, 1995), so grades from spring and
summer terms will not be included. A number of courses taught at BYU involve experiential
learning or other teaching methodologies that do not follow a traditional classroom model of

16
grading. Grades in these courses will be excluded from the data and are outside the scope of this
study. Excluded courses will include internships, private lessons, practicums, and seminars.
Definition of Terms
Grade. A judgment by an instructor about the adequacy of an individual student’s
achievement or performance in a college course.
Grade inflation. A similar quality of academic performance in a given course being
awarded higher grades at the present time than before. It refers to a mean upward shift in student
grades in the given coursework over time, without a corresponding increase in achievement.
Grade increase. Average grade increase over time.
Baseline GPA. A GPA score that includes grades earned in repeated classes and the
original classes in its calculation. All grades from all classes are included.
Adjusted GPA. A GPA score in which grades earned in repeated courses replace the
grades earned in the courses taken previously. Grades earned in the original classes are not
included.
Mastery-based grading. A grading philosophy in which the student is given multiple
opportunities to attain a level of achievement pre-determined by the instructor. All students have
the potential to be awarded a high score.
Normative grading. A grading philosophy also known as grading on a curve. Grades are
assigned based on the distribution of grades among students in the course. Students are graded
according to their relative standing in the class.
Other grading philosophies. Grading philosophies that are neither mastery nor
normative. Examples include criterion-referenced, pass-fail, and grading based on clumping or
natural breaks in student scores.

17
CHAPTER 2: LITERATURE REVIEW
Databases Searched
The databases searched included (a) Electronic Theses and Dissertations, (b) Education
Resources Information Center, (c) Education Full Text, (d) Dissertations and Theses (ProQuest),
(d) ACT website, (e) College Board website, and (f) National Center for Education Statistics.
The five search terms used were (a) higher education, (b) grade inflation, (c) grade increase, (d)
time series, and (e) grade deflation.
Search Strategy Used
The literature search was limited to higher education because the number of results was
too large to sort through if the search included all educational levels. Consequently, research
related to grade inflation in high school or other educational institutions was intentionally
disregarded. Additional search terms were included one at a time. ‘Grade inflation’ was the best
term to search for, even if the paper referred to the term as ‘grade increase,’ because the use of
the term ‘grade inflation’ is so widespread.
Procedure
All of the abstracts were carefully scrutinized, and papers were chosen based on
relevance to the study issue. The papers were sorted into two main categories: those that included
primary research and those that did not but still addressed an important point regarding the topic.
The references section of each paper was analyzed to identify possible additional papers
that might fit within the scope of this topic. This method helped discover several papers that
were published in discipline-specific journals not included in the initial search. Only completed
research studies that focused on undergraduate-level courses and students were included.
18
Papers not published in peer-reviewed journals were excluded, as well as most studies
older than 25 years. News articles and conference papers were excluded. Unpublished studies
conducted by individual colleges and universities or university systems are also not included.
Non-published studies specific to an individual institution were not in the databases, and as a
result, were not included in this study.
Summary of Previous Research
Nationwide grade inflation evidence. Some research appears to present data that
convincingly show a clear upward trend in college GPAs. Data also seem to indicate that the
proportion of As is increasing, while the proportion of Cs and Ds is shrinking (Jewel &
McPherson, 2012; Kamber, 2008; Lawler, 2001; Rojstaczer & Healy 2012; Wilson, 1999).
Grade inflation may not be prevalent at every institution of higher education, however. A study
comparing over 22,000 student GPAs in the mid-1980s with comparable student GPAs in the
mid-1990s reported that evidence of grade inflation was found at some research institutions and
those with selective admission standards and that grade deflation occurred at general liberal arts
colleges, comprehensive colleges and universities, and in the humanities and social sciences
(Kuh & Hu, 1999). However, this report also found evidence supporting the claim that “students’
academic effort was rewarded consistently across time at all institutions and major fields, with
students who invested more time and effort in their studies reporting higher grades” (Kuh & Hu,
1999, p. 297).
Counterarguments. While most academicians, researchers, and politicians may assume
that the preponderance of evidence points to rampant, consistent grade inflation at all universities
in the United States over the last 40 years, some researchers counter that the data used as
evidence of systemic grade inflation is misinterpreted. Clifford Adelman, a senior associate at
19
the Institute for Higher Education Policy, recently left the U.S. Department of Education (DoE)
after 27 years as a senior research analyst. While at the DoE, he analyzed transcripts from over
3,000 higher education institutions in 1995 and reported that grades had actually declined
slightly in the previous two decades (Kohn, 2008). A 2002 report from the National Center for
Education Statistics stated 33.4 percent of American undergraduates had GPAs of C or lower for
the 1999-2000 academic year (Kohn, 2008). Adelman points out that the research, which claims
a nationwide trend, is not standardized and that the unit of measurement is not always clear.
Additionally, the data used by these reports is often self-reported by students or appears in
newspapers, instead of from official university registrars (Adelman, 2008).
Possible causes of grade increase. A grade is a judgment made by the professor — a
rating, essentially — of the adequacy of the individual student’s achievement or performance.
Because human judgment is involved, errors in rating can creep into the process. Rater biases
and idiosyncrasies can affect the grade that is awarded. There are four types of rater error:
generosity error, severity error, central tendency error, and halo error (Worthen, White, Fan, &
Sudweeks, 1999). Generosity error is the tendency of some raters to methodically overrate all
persons being rated, while severity error is the opposite — the tendency of some raters to
systematically underrate all persons they are rating. Central tendency error is the propensity of
some raters to avoid extremes and generally only award rates in the middle of the range. Halo
error occurs when a rater fails to rate an individual trait separately from an overall trait or
impression. A halo error occurs when, for example, a professor overrates a student’s writing
because the professor feels the student participates fully in class, is friendly to work with, and is
good at math — although none of those traits are specific to the written assignments being
graded. Halo effects can be positive or negative. Most research on grade inflation attributes

20
rising average GPA scores to faculty judgment errors, such as these rater errors, even though the
research does not specifically list these rating errors by name.
A solid body of research examines the relationships between instructor characteristics
and average grades awarded (Jewell, McPherson, & Tieslau, 2013; Sonner, 2000). Jewel and
McPherson (2012) found that female instructors inflated grades more than their male
counterparts, and that ethnicity did not significantly affect rates of inflation, irrespective of
gender. Studies of grades and tenure status or professorial rank (Kezim, Pariseau, & Quinn,
2005; Moore & Trahan, 1998) report that adjunct faculty have the highest rates of grade
inflation, lower ranking tenure track faculty have moderate rates of inflation, and full professors
have the lowest rates of inflation. Many research studies focusing on instructor effects report a
positive correlation between grades and student evaluations of teaching (SET) (Compton &
Metheny, 2000; Eiszler, 2002; Greenwald & Gilmore, 1997; Johnson, 2003; McPherson, 2006).
Course-level grade inflation has also been investigated, and a negative correlation has
been reported between average grades and class size (Jewell & McPherson, 2012; Sonner, 2000).
Students also tend to receive lower grades in courses that are lower-division than students in
upper-division courses (Compton & Metheny, 2000; Creech & Sweeder, 2012; Grove &
Wasserman, 2004; Jewell & McPherson, 2012; Sonner, 2000).
Very little research has investigated the impact of departmental or institutional policies
on average grades. Adelman points out that the slight upward movement of grades from the
1980s to 1990s coincides with a change in higher education grading trends, in which no-credit
Ws were introduced and as much as 5.5% of the nation’s courses changed from an A-F grading
scheme to a pass/fail scheme (Adelman, 2008).

21
Addy and Herring (1996) concentrated on four accounting courses and the impact of a
policy change in which the school implemented a minimum GPA requirement for upper-division
students. The authors found that GPAs for high-achieving students remained constant after the
policy change. However, lower-achieving students, or those who were predicted to score
between the original cutoff (2.0) and the new limit (2.5), were receiving higher grades than
predicted. The authors found that these students had been awarded average grades above the 2.5
cutoff line, even though they had been predicted to be below that threshold. The causes of the
grade increase were not investigated, but the authors theorized that the increase resulted from
instructors inflating the grades of the lower-achieving students.
Jewell and McPherson (2013) attempted to isolate and measure the impact of some of the
sources of grade inflation. They studied over 1,600 courses in 28 departments and found that
departments do impact grade inflation differentially. Departments that offered PhD degrees were
more likely to award lower grades to undergraduate students than those departments without
PhD programs. However, department differences accounted for less than 5% of the difference in
grades. The largest impact on grades appeared to be unspecified institutional influences (52%) —
even ahead of instructor differences (40%).
Marx and Meeler (2013) also investigated the impact of university practices on average
grades. They analyzed transcripts from eight public institutions in one Southern state. They
illustrate the claim that because schools are changing policies toward grading practices, such as
allowing no-credit withdrawals or counting a repeated course for a higher grade, grades are
inflated and cannot be adequately compared between institutions.
Sloop (1992) also compared grades between institutions in one state and found that
average grades were stable before a HOPE Scholarship was introduced by the state. The HOPE

22
Scholarship requires students to maintain a minimum GPA, among other requirements. In post-
HOPE years, average grades of college students in the state increased each year.
Data Limitations in Previous Studies
As noted previously, much of the information used to support the claim of widespread,
uncontrolled grade inflation is based on anecdotal information, such as self-reported student data.
Kuncel (2005) showed that student-reported grades were systematically higher than actual
grades, particularly for students with lower ability. When institutionally-reported data are used,
the authors often do not know or report the unit of measure and the delimitations of their data.
This lack of adequate data is true of many nationwide and local studies and is an often an
overlooked factor impacting the analysis of grade inflation (Adelman, 2008; Hu, 2005). The
strength of a study is directly dependent upon the length of the study period, the number of
courses or departments, and the number and type of students included in the data. Frequently,
conclusions are overgeneralized from limited samples that are unrepresentative of higher
education in the United States. News reports and journal articles have placed a strong emphasis
on conclusions drawn from thin supporting data.
In an oft-cited opinion article, Harvey Mansfield, a professor of government at Harvard,
blasts Harvard and other elite universities regarding the extreme volume of As and the inflated
distribution of “outlandishly high grades” awarded to contemporary students (Mansfield, 2001,
p. B24). He blames the changes in faculty grading practices on the Vietnam War, Affirmative
Action, and modern child-psychology concerns about students’ self-esteem (Mansfield, 2001).
However, for all of his accusations, he has no data other than the grades he awards in his own
courses. By his own admission, “Because I have no access to the figures, I have to rely on what I
saw and heard at the time” (Mansfield, 2001, p. B24). This statement is a clear admission on the

23
author’s part that the data are anecdotal. However, many subsequent researchers and reporters
have cited his claim without acknowledging its limitations because it furthers their arguments
about rampant grade inflation in the academy.
Another paper frequently cited in grade inflation articles is that of Rojstaczer and Healy (2012),
who describe how they acquired the data used for their research to support their claim that the majority
of US higher education has a “broken grading system” (Rojstaczer & Healy, p. 18) as follows:
We assembled our data on four-year school grades…from a variety of sources: books,
research articles, random World Wide Web searching of college and university registrar
and institutional research office Web sites, personal contacts with school administrators
and leaders, and cold solicitations for data from 100 registrar and institutional research
offices selected randomly (20 of the institutions solicited agreed to participate…)
(Rojstaczer & Healy, 2012, p. 3).
Rojstaczer and Healy go on to describe the fact that historical data were very difficult to
acquire, so their grade data prior to 2000 were averaged across schools from year to year, with as
few as 13 and as many as 37 schools, depending on the decade. At best, a sample of 37 is a very
small proportion of the institutions in the United States and is unlikely to be representative. They
also point out that because their time series “[does] not include the same schools every year, we
smooth our annual estimates with a moving centered three-year average” (Rojstaczer & Healy,
2012, p. 3). Not only were the data in the aforementioned research not from the same schools
each year, but the authors have no way of accounting for institutional differences in how the
reported grades were calculated. Adelman’s 2008 research was assembled from almost 3,000
institutions since 1972 and found wide variety in the methods used by the schools to indicate
grades. In addition to the traditional A-F grades, they found grades such as “X, M, Z, CR, NC,

24
RP, WP, WF, IP, DE, EI, NW” (Adelman, 2008, p. 18). Adelman also notes that data reported
prior to 1972 would not be from a consistent national source, because no official government
database existed until that year (Adelman, 2008).
McSpirit, Jones, and Chapman, (2000) used a regression model, controlling for gender,
ACT score, and age at an open-enrollment public university. Results indicated a .02 annual rise
in average GPA. Grades from students who received a 17 or lower on the ACT were excluded
from the data, and the period of time studied was limited to the eight years from 1983 to 1991.
Apple (2002) compared grades in all nursing schools in Tennessee in 1995 to those in
2000. She found that a majority of the colleges did not have a significant grade increase between
those years and that percentage of As and Bs did not appear to change. However, the analysis
included only Tennessee-Board-of-Regents-certified nursing programs and compared grades
between only two individual years that were only 5 years apart.
Zellner (2008) also compared grades in the nursing field at one institution. She compared
grades from 1994 and 1996 to grades in 1998, 2000, and 2002, which followed a curriculum
change in 1998. The institution wanted to know whether the curriculum change had had an effect
on student grades. No attempt was made to control for ACT score, which the author admits could
have accounted for the slight grade increase the data showed.
Kwon, Kendig, and Bae (1997) studied one academic division for two years at a small
private college. They compared the average GPAs of 99 accounting majors in 1983-1984 with
the average GPAs of 205 accounting majors in 1993-1994. Their analysis found that average
grades had increased between the two time periods, but the grade increase correlated with an
increase in the average age of the students (31 to 34) and average ACT score (19.8 to 22.3)
during the same time period. When the correlating variables were taken into account, there was
25
no statistical increase in student GPAs between these two periods. Nonetheless, the authors are
reluctant to give up the idea of grade inflation as the explanation for the GPA increase: “This
study suggests that grade inflation has continued throughout the 1980s and early 1990s.
However, if other pertinent and statistically significant variables such as age and ACT scores are
taken into account, then the rise in grades between the two periods seems to be, to some extent,
disproven” (Kwon, Kendig, & Bae, 1997, p. 53).
Clusky, Griffin, and Ehlin (1997) compared ACT scores of seniors to overall GPAs for
all university courses, all business college courses, and four individual senior accounting courses
over 15 years. Only four senior-level courses were included in the study, but results regarding
the four courses were generalized to the entire department. The authors assume that while grade
inflation existed at the university and college level, it “was not pervasive within accounting
courses” (Clusky, Griffin, & Ehlin, 1997, p. 273).
Kezim, Pariseau, and Quinn (2005) studied a business school in a small private college,
comparing grades awarded by full-time, part-time, and adjunct faculty. However, the sample sizes were
small — in one analysis, there were only seven individuals. Their results showed that adjunct faculty
had the highest rates of grade inflation and tenured faculty had the lowest rates of grade inflation.
Grove and Wasserman (2004) studied the GPA patterns in individual students as they
progressed from semester to semester. They found that when they excluded grades from students
who had failed and dropped out of school, the average GPA increased. They acknowledged that
for overall GPA trends, “Attrition played a much greater role in the rise of academic
achievement after the second semester of college coursework, accounting for over 40 percent of
the total” (Grove & Wasserman, 2004, p. 167). It makes sense that if grades that are below
average are not included in the calculations, then the average grade will be higher than expected.

26
Conclusions
With grade inflation apparently a foregone conclusion, much of the research focuses on
the causes of inflation and the division of blame. Faculty are generally the object of this finger-
pointing, and researchers assume that faculty generosity is the main cause of increased GPA
averages. Other factors, such as institutional policies and student qualification levels (e.g., ACT
scores), are sometimes believed to increase average GPAs. Some researchers attempt to point out
that rising average GPAs do not necessarily indicate a negative factor at work or that the
increased grades are unjustified, but these opinions appear to be in the minority.
Because faculty and administrators rely on what most newspapers and journal articles report,
they assume it is a fact that grades are steadily increasing nationwide without a complimentary
increase in student achievement. In article after article, statistics are cited that purport to prove grade
inflation, but this is done without a clear explanation of the limitations of the anecdotal data used to
support the authors’ conclusions or of the small or unrepresentative sample that the author’s
generalizable inference is based upon. Subsequent authors cite the previous research, again without
explaining the limitations of the data, and the assumptions are perpetuated.
The data used in prior studies are often not well described. For example, when
researchers compare ACT data with GPA, rarely does the researcher specify if the ACT data for
that year is for all students included in the GPA group or if it only represents incoming students
for that year. Also, when GPA or ACT scores are included, it is not often reported whether those
data include data from transfer students or concurrent enrollment students, in addition to
traditional students, for instance. Researchers studying grade inflation must be more explicit in
describing the data used in their analyses, especially when they are extrapolating conclusions for
larger populations based on sample data.

27
CHAPTER 3: METHOD
Population and Dependent Variable
The population of interest in this study is letter grades earned by all undergraduate
students enrolled at BYU for at least one class during day school on the Provo campus during
any fall or winter semester in the 20-year period from September 1994 through and including
April 2014. Grades earned in pass/fail graded courses are not included. Grades earned by
undergraduate students taking graduate-level courses were included, but grades earned by
graduate students were not included, regardless of the courses in which they were awarded.
Credit awarded for AP courses is not graded and therefore not included in the GPA data. Grades
earned in concurrent enrollment courses by high school students are not included. Only grades
earned during fall and winter semesters were included; grades earned in spring and summer
terms were excluded. Study data included grades for independent study courses earned by
enrolled undergraduates if these were awarded during a fall or winter semester. Grades earned at
the BYU Salt Lake Center or in evening classes are included in the GPA data only if the student
was also enrolled in at least one class during day school on the main campus during the same
semester. Transfer grades from courses earned at other institutions were excluded.
A number of courses taught at BYU involve experiential learning or other teaching
methodologies that do not follow a traditional classroom model for grading. Grades in these
courses were excluded from the data and are outside the scope of this study. Excluded courses
include (a) internships, (b) study abroad courses, (c) private lessons, (d) student development
courses, (e) practicums, and (f) seminars. The GPA data used in this model are the reported
GPAs that appear on students’ official transcripts. Reported GPA is equal to the adjusted GPA
prior to fall 2011 and the baseline GPA from fall 2011 until the present.
28
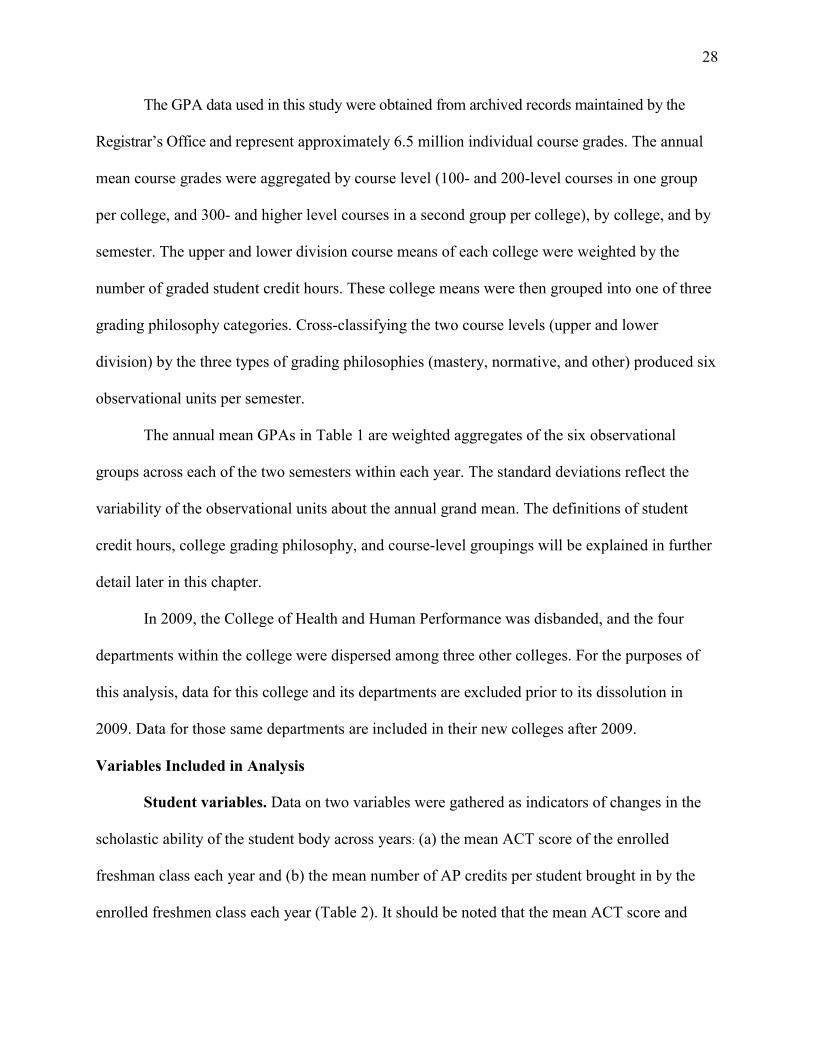
The GPA data used in this study were obtained from archived records maintained by the
Registrar’s Office and represent approximately 6.5 million individual course grades. The annual
mean course grades were aggregated by course level (100- and 200-level courses in one group
per college, and 300- and higher level courses in a second group per college), by college, and by
semester. The upper and lower division course means of each college were weighted by the
number of graded student credit hours. These college means were then grouped into one of three
grading philosophy categories. Cross-classifying the two course levels (upper and lower
division) by the three types of grading philosophies (mastery, normative, and other) produced six
observational units per semester.
The annual mean GPAs in Table 1 are weighted aggregates of the six observational
groups across each of the two semesters within each year. The standard deviations reflect the
variability of the observational units about the annual grand mean. The definitions of student
credit hours, college grading philosophy, and course-level groupings will be explained in further
detail later in this chapter.
In 2009, the College of Health and Human Performance was disbanded, and the four
departments within the college were dispersed among three other colleges. For the purposes of
this analysis, data for this college and its departments are excluded prior to its dissolution in
2009. Data for those same departments are included in their new colleges after 2009.
Variables Included in Analysis
Student variables. Data on two variables were gathered as indicators of changes in the
scholastic ability of the student body across years: (a) the mean ACT score of the enrolled
freshman class each year and (b) the mean number of AP credits per student brought in by the
enrolled freshmen class each year (Table 2). It should be noted that the mean ACT score and

29
mean AP credits for each year are based only on enrolled freshman during the corresponding
year, while the mean GPA data include all undergraduate students taking classes in a given
college group, course level, or semester. The ACT and AP data represent scores from
approximately 20-25% of the corresponding GPA population each year. Table 2 displays the
mean, standard deviation, and minimum and maximum year values for ACT and AP credits for
enrolled freshmen over all the years in the study period.
Table 1
GPA by Academic Year
Year M SD
1994 3.269 0.140
1995 3.265 0.147
1996 3.271 0.150
1997 3.296 0.150
1998 3.304 0.159
1999 3.318 0.153
2000 3.343 0.142
2001 3.346 0.145
2002 3.348 0.133
2003 3.328 0.152
2004 3.324 0.147
2005 3.334 0.147
2006 3.330 0.149
2007 3.331 0.140
2008 3.337 0.149
2009 3.346 0.146
2010 3.338 0.149
2011 3.324 0.169
2012 3.334 0.165
2013 3.337 0.164
30
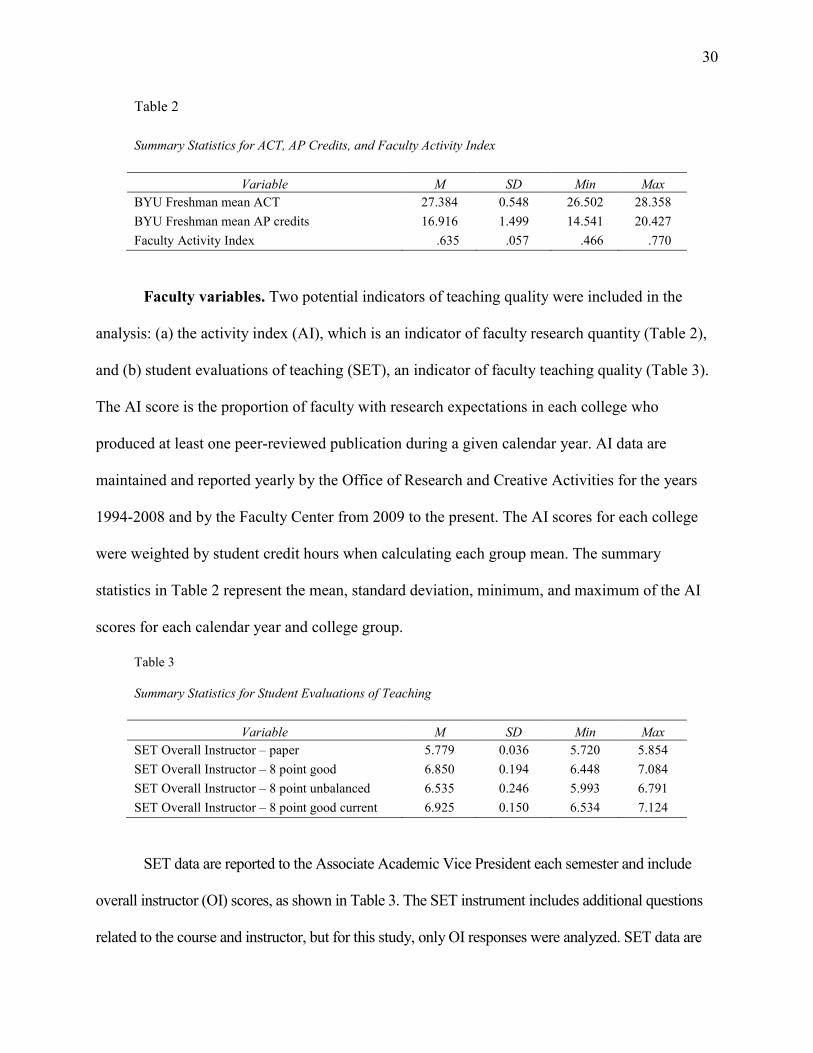
Table 2
Summary Statistics for ACT, AP Credits, and Faculty Activity Index
Variable M SD Min Max
BYU Freshman mean ACT 27.384 0.548 26.502 28.358
BYU Freshman mean AP credits 16.916 1.499 14.541 20.427
Faculty Activity Index .635 .057 .466 .770
Faculty variables. Two potential indicators of teaching quality were included in the
analysis: (a) the activity index (AI), which is an indicator of faculty research quantity (Table 2),
and (b) student evaluations of teaching (SET), an indicator of faculty teaching quality (Table 3).
The AI score is the proportion of faculty with research expectations in each college who
produced at least one peer-reviewed publication during a given calendar year. AI data are
maintained and reported yearly by the Office of Research and Creative Activities for the years
1994-2008 and by the Faculty Center from 2009 to the present. The AI scores for each college
were weighted by student credit hours when calculating each group mean. The summary
statistics in Table 2 represent the mean, standard deviation, minimum, and maximum of the AI
scores for each calendar year and college group.
Table 3
Summary Statistics for Student Evaluations of Teaching
Variable M SD Min Max
SET Overall Instructor – paper 5.779 0.036 5.720 5.854
SET Overall Instructor – 8 point good 6.850 0.194 6.448 7.084
SET Overall Instructor – 8 point unbalanced 6.535 0.246 5.993 6.791
SET Overall Instructor – 8 point good current 6.925 0.150 6.534 7.124
SET data are reported to the Associate Academic Vice President each semester and include
overall instructor (OI) scores, as shown in Table 3. The SET instrument includes additional questions
related to the course and instructor, but for this study, only OI responses were analyzed. SET data are
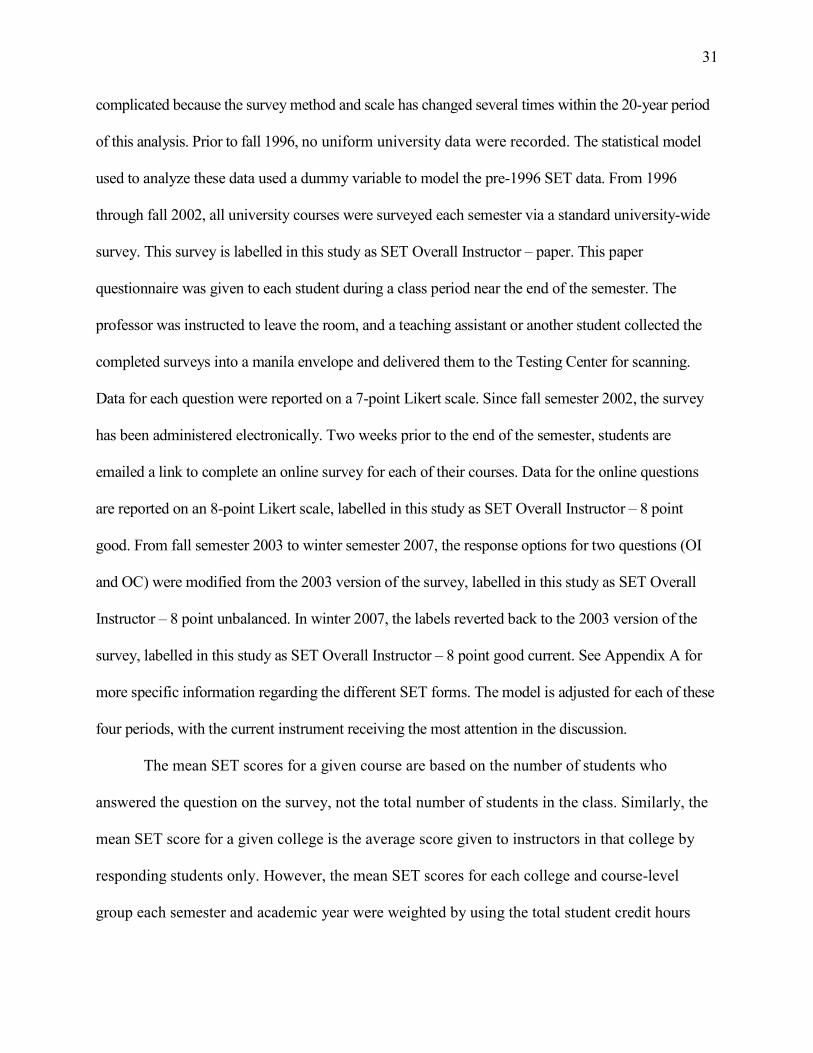
31
complicated because the survey method and scale has changed several times within the 20-year period
of this analysis. Prior to fall 1996, no uniform university data were recorded. The statistical model
used to analyze these data used a dummy variable to model the pre-1996 SET data. From 1996
through fall 2002, all university courses were surveyed each semester via a standard university-wide
survey. This survey is labelled in this study as SET Overall Instructor – paper. This paper
questionnaire was given to each student during a class period near the end of the semester. The
professor was instructed to leave the room, and a teaching assistant or another student collected the
completed surveys into a manila envelope and delivered them to the Testing Center for scanning.
Data for each question were reported on a 7-point Likert scale. Since fall semester 2002, the survey
has been administered electronically. Two weeks prior to the end of the semester, students are
emailed a link to complete an online survey for each of their courses. Data for the online questions
are reported on an 8-point Likert scale, labelled in this study as SET Overall Instructor – 8 point
good. From fall semester 2003 to winter semester 2007, the response options for two questions (OI
and OC) were modified from the 2003 version of the survey, labelled in this study as SET Overall
Instructor – 8 point unbalanced. In winter 2007, the labels reverted back to the 2003 version of the
survey, labelled in this study as SET Overall Instructor – 8 point good current. See Appendix A for
more specific information regarding the different SET forms. The model is adjusted for each of these
four periods, with the current instrument receiving the most attention in the discussion.
The mean SET scores for a given course are based on the number of students who
answered the question on the survey, not the total number of students in the class. Similarly, the
mean SET score for a given college is the average score given to instructors in that college by
responding students only. However, the mean SET scores for each college and course-level
group each semester and academic year were weighted by using the total student credit hours

32
when the group means were calculated. SET data include only responding students; student
credit hour data include all graded students. The summary statistics in Table 3 represent the
mean, standard deviation, minimum, and maximum of the SET scores of the observational units
for each instrument used. To review, an observational unit is the college grading philosophy
group, course level, semester, and year, weighted by student credit hours graded. The definitions
of student credit hours, college grading philosophy, and course-level groupings will be explained
in further detail later in this chapter.
University variables. As explained in greater detail in Chapter 1, the university
administration announced a policy change in mid-2009 regarding the calculation of GPA and
repeated courses, which was intended to take effect the following year. Students would no longer
be able to retake a course and have the subsequent grade replace the prior grade in the
calculation of their GPA. The policy change also extended the course withdrawal deadline to
approximately halfway through the semester. Due to confusion over the changes, the policy was
not enforced until the fall 2011 semester. For the semesters between fall 2009 and winter 2011,
the policy was not enforced, even though it had been announced. For decades prior to fall 2009,
the difference between the university mean adjusted GPA (GPA that includes the replaced
grades) and the mean baseline GPA (GPA that includes all courses and does not replace grades)
had been fairly constant, with a difference of about .10. However, for the two policy change
interim years, the difference was smaller. For statistical and practical purposes, the policy interim
period is defined as the period between fall semester 2009 and fall semester 2011, and the policy
implementation date is marked as the end of the fall 2011 semester. Consequently, the reported
GPA is identical to the adjusted GPA prior to fall 2011 and to the baseline GPA from fall 2011
to the present.

33
Additional Study Variables
For the purposes of this study, the various colleges and schools at BYU that offer
undergraduate courses were classified into three categories based on the most prevalent grading
philosophy used by faculty within each college or school. Brookhart (2004) explains that grading
is a comparison of a student’s performance to something else. The comparison can be made
against a pre-determined level of achievement, or it could be a comparison of the students’
achievement in relation to the performance of other students.
Grading philosophies. Mastery-based grading is a grading philosophy in which students
are given multiple opportunities to demonstrate that they have attained a level of proficiency that
is specified in advance by the course instructor. This type of grading is also referred to as
standards-based grading. Students who achieve the specified level of achievement would receive
the highest grades, while those students who do not meet the pre-determined standard would
receive lower grades, depending on their achievement in comparison with the standard. In the
context of this study, the colleges included in this category are those in which the instructor sets
a level of achievement and students are given assistance and repeated opportunities to reach that
level of achievement. An example would be an advanced writing course in which the goal is for
all of the students in the course to be skilled writers at the end of the course, instead of only a
specific percentage of the students. A teacher in these courses is seen as successful if most
students in the course are able to achieve the expected level of accomplishment.
Normative grading is a philosophy in which students are graded primarily based on their
relative standing in the class. These courses are graded on the assumption that students’ level of
achievement in a course can usually be expected to vary considerably, with most students at or
near average, a relatively small proportion who reach achievement levels well above average,

34
and some who demonstrate very poor levels of achievement. For instance, a class may have a
mean score of 80, with most students earning a B and only the top percentage of students earning
an A grade. An instructor in these courses is expected to maintain approximately the same
distribution from year to year. Hence, grades above the mean department GPA standard can be
construed as evidence of grade inflation.
I interviewed an associate dean and several faculty members in each college or school to
determine how the courses in the college should be classified in terms of the three grading
categories. While it is clear that no college or department has unanimity in terms of grading
philosophies and practices, for the purpose of this study, we considered the overall majority
opinions and practices of the departments within the colleges and the evaluation practices of each
college dean’s office. The classification assignment for each college was made in conjunction
with the associate dean and faculty who were interviewed. Colleges with general grading
philosophies that do not clearly fit into either the mastery-based category or the normative
category were grouped into a category classified as Other. Table 4 shows the college grading
philosophy classifications. Future researchers may develop different classifications than the ones
assigned in this study.
Course level. Lower-division courses are those listed at the 100 or 200 level and are
generally taken by freshmen and sophomore students. These classes tend to be large (over 50
students) introductory courses. Many of the lower-division courses serve majors in multiple
departments and colleges so students in these courses can come from all areas of campus.
Upper-division courses are those designated as 300-level or higher and are predominately
taken by juniors and seniors. These classes tend to be smaller (fewer than 50 students) and cover
more advanced topics. Upper-division courses are generally taken by students within the major

35
of the department offering the course. The upper-division category may also include some 500-
level courses if these courses were taken by a student who was an undergraduate at the time.
Generally, a 500-level course is a graduate-level course but undergraduate students are
occasionally allowed to take a graduate course with this level designation.
Table 4
Grading Philosophy Classifications
College or School
Type of Grading Used
College of Fine Arts and Communications Mastery
College of Humanities Mastery
College of Nursing Mastery
David O. McKay School of Education Mastery
College of Life Sciences Normative
College of Physical and Mathematical Sciences Normative
Marriott School of Management Normative
College of Family, Home, and Social Sciences Other
College of Religious Education Other
Ira A. Fulton College of Engineering and Technology Other
Student credit hours. Most university courses are 3 credit hours, but range from a low of
.5 credit hours to a high of 4 credit hours. A student credit hour represents one credit hour per
grade per student. For example, ten students receiving grades for a 3-credit class is equal to 30
student credit hours. Classes were sorted into college categories based upon the college in which
the course was taught.
The distribution of lower- and upper-division courses that were offered during the 20-year
period from September 1994 to April 2014 is shown in Table 5. Because the proportion of upper-
division courses, lower-division courses, and the total number of student credit hours taught varies
from one college to another, each college or school has a different impact on GPA calculations for
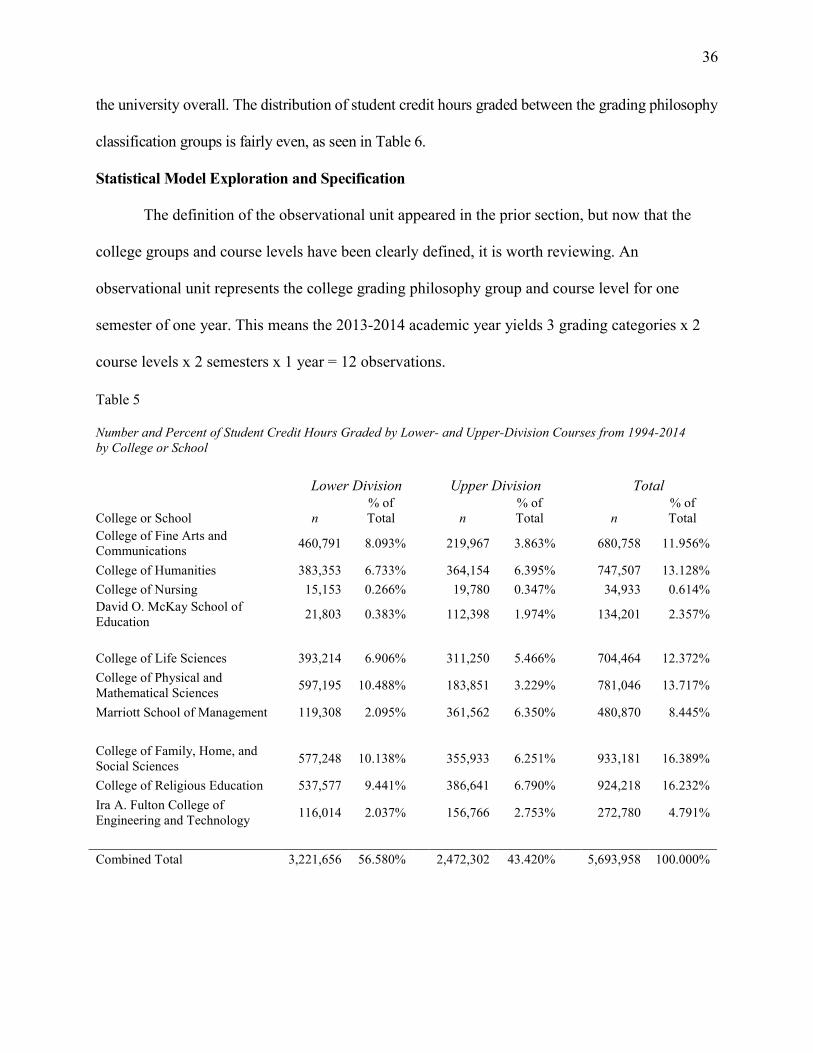
36
the university overall. The distribution of student credit hours graded between the grading philosophy
classification groups is fairly even, as seen in Table 6.
Statistical Model Exploration and Specification
The definition of the observational unit appeared in the prior section, but now that the
college groups and course levels have been clearly defined, it is worth reviewing. An
observational unit represents the college grading philosophy group and course level for one
semester of one year. This means the 2013-2014 academic year yields 3 grading categories x 2
course levels x 2 semesters x 1 year = 12 observations.
Table 5
Number and Percent of Student Credit Hours Graded by Lower- and Upper-Division Courses from 1994-2014 by College or School
Lower Division
Upper Division
Total
College or School n % of Total n
% of Total n
% of Total
College of Fine Arts and Communications
460,791 8.093%
219,967 3.863%
680,758 11.956%
College of Humanities 383,353 6.733%
364,154 6.395%
747,507 13.128%
College of Nursing 15,153 0.266%
19,780 0.347%
34,933 0.614%
David O. McKay School of Education
21,803 0.383%
112,398 1.974%
134,201 2.357%
College of Life Sciences 393,214 6.906%
311,250 5.466%
704,464 12.372%
College of Physical and Mathematical Sciences
597,195 10.488%
183,851 3.229%
781,046 13.717%
Marriott School of Management 119,308 2.095%
361,562 6.350%
480,870 8.445%
College of Family, Home, and Social Sciences
577,248 10.138%
355,933 6.251%
933,181 16.389%
College of Religious Education 537,577 9.441%
386,641 6.790%
924,218 16.232%
Ira A. Fulton College of Engineering and Technology
116,014 2.037%
156,766 2.753%
272,780 4.791%
Combined Total 3,221,656 56.580%
2,472,302 43.420%
5,693,958 100.000%

37
A regression analysis with covariates and potential interaction terms was used to explain
how changes in grades in these observational groups over time have been influenced by changes
in (a) the scholastic ability of the student body, (b) the faculty scholarly activity level, and (c) the
grading policies at the university. In this study, mean GPA is the dependent variable. Mean ACT
score, type of college grading philosophy, course level (upper versus lower division courses),
semester, year, faculty AI, and SET were used as potential explanatory variables.
A two-factor interaction occurs when the mean difference in the levels of one factor is
not the same across the levels of a second factor. For example, the mean GPAs in mastery-
graded courses may be higher than the mean GPAs of normative graded courses, and mean
GPAs of upper-division courses may be higher than mean GPAs in lower-division courses.
However, the difference between the mean GPA scores of upper- and lower-division mastery-
graded courses might not be the same as the difference between the mean GPA scores of upper-
and lower-division normative-graded courses.
The effect of faculty research (AI) on mean GPA is passionately debated by scholars.
From one point of view, teaching responsibilities and research responsibilities are viewed as
competing demands for faculty time, with the implication being that “teaching” faculty have
Table 6
Number and Percent of Student Credit Hours Graded by Lower- and Upper-Division Courses from 1994 to 2014 by College Grading Classification
Lower Division
Upper Division
Total
College Classification n % of Total n
% of Total n
% of Total
Mastery 881,100 15.474% 716,299 12.580% 1,597,399 28.054%
Normative 1,109,717 19.489% 856,663 15.045% 1,966,380 34.535%
Other 1,230,839 21.617% 899,340 15.795% 2,130,179 37.411%
Combined Total 3,221,656 56.580% 2,472,302 43.420% 5,693,958 100.000%

38
greater concerns for student success than “researching” faculty. Others argue that research
supports teaching, enables faculty to be current in their field, and adds significant value to a well-
prepared student’s learning.
Sometimes, adding additional explanatory variables to the model reduces the degree of
residual or error because they explain a part of the change that was not explained by the
explanatory variables already in the model. However, when the explanatory variables are highly
correlated, we can choose between the two explanatory variables. Because mean ACT scores and
mean AP credits are highly correlated, the model uses mean AP credits because this results in a
smaller residual mean square.
A 3-factor interaction occurs when a 2-factor interaction between two variables is not the
same across the levels of a third variable. The policy change may affect the interaction between
lower- and upper-division courses and college grading philosophies differently. The policy
change included two parts: (a) students would not be able to replace a lower grade with a higher
grade from the same course taken subsequently (potentially lowering GPAs in normative lower-
division courses), but (b) students could now withdraw from a course much later in the semester
(potentially raising GPAs in upper-division mastery courses). If the differences between the
mean GPAs of the six observational units before the policy change are different than the
differences between the mean GPAs after the policy change, this would be evidence of a 3-factor
interaction.
The period of time between the announcement of the policy change and its
implementation lasted two years. Informed students knew they had only the next few semesters
to retake a course and have it replace a lower grade on their GPA calculation. It is very likely

39
that this interim policy change period will also have an effect on the mean GPA that is different
than the effect on mean GPA caused by the policy change.
The 2-factor interaction of college grading philosophy and course level may also be
affected by SET scores differently. Faculty SET includes both overall course (OC) and overall
instructor (OI) scores. Because OC and OI are highly correlated, we include only OC to keep the
model simple. We will explore a three-factor interaction between college classification, course
level, and SET OC scores in the model.
The yearly mean GPA data provided to us included both fall and winter semester mean
GPAs. We will explore the potential effect of semester on the mean GPA scores of each of the
observational groups, although we do not anticipate that the semesters will impact mean GPA
differently.
Adjusting for student quality, faculty quality, college group, course level, and semester,
the effect of all other factors that affect GPA will be modeled using a yearly trend. This will be
modeled as a nonlinear effect, allowing for the flexibility to capture the degree of the effect and
provide meaningful extrapolation that will be used to forecast future mean GPAs. This effect is
not the underlying grade trend, because other explanatory variables are time-varying.
Because the mean GPA scores constitute time series data, we also expect the mean GPA
data to be serially correlated across years. In other words, the average for a given year is likely to
have been influenced by the average of most recent past years. This analysis will ignore the
serial correlation. The estimates will be unbiased, but the standard errors may be smaller than if
the serial correlation had been modeled.

40
CHAPTER 4: RESULTS
Model
The weighted mean GPA for the ith college group, jth course level, kth semester, in year t
is denoted by gpaijk(t) and modeled by
gpaijk(t) = αij + bsij (t) + β1AP + β2facultyresearchi(t) + β3SETij(t)
+ effect of previous SET instrumentsij + γijk + θij + φij + �ijk(t)
where:
αij denotes the mean GPA for courses in college group i and course level j
bsij (t) denotes the nonlinear yearly trend as modeled by separate B-splines for each
college group i and course level j
AP is the mean AP credits of entering freshmen in academic year t
facultyresearch is the Faculty Research Activity Index in year t
γij denotes the effect of semester k on mean GPA for courses in college group i and
course level j
θij denotes the difference in mean GPA due to the change in university GPA policy for
courses in college group i and course level j
φij denotes the difference in mean GPA that occurred in the interim period before the
change in university GPA policy for courses in college group i and course level j
�ijk(t) ∼ N(0, σ).
Estimation and inference are based on multiple regression.

41
Research Question 1
How does mean GPA differ between the following:
a. Lower-division and upper-division courses.
b. Categories of colleges/schools on campus that differ in their grading philosophies
and practices.
College grading philosophy and the course level variable have an interactive effect on
mean GPA. After adjusting for all other factors in the model, the mean GPA of normative lower-
level courses is 3.090, which is the lowest mean of the six groups (Table 7). Normative upper-
division courses are 0.200 higher, with a mean GPA of 3.290. Mastery upper-division courses
have the highest mean GPA, at 3.530; mastery lower-division courses are 0.135 lower, with a
mean GPA of 3.395. The mean GPA of upper-division courses is consistently higher than their
lower-division counterparts. However, there is an interaction between college group and course
level because the difference between the upper- and lower-course means of the normative
colleges (0.200) is larger than the difference between the upper- and lower-course means of the
mastery colleges (0.135). While not a focus of the discussion, the difference between the upper-
and lower-course mean GPAs of the other group (0.131) is closest to that of the mastery group.
Table 7
Estimates of Mean GPA of Observational Units (αij) Holding all other Variables Constant
College Group and Course Level Estimate SE t value p
Mastery Lower-Division 3.395 0.278 12.230 < .001
Mastery Upper-Division 3.530 0.278 12.699 < .001
Normative Lower-Division 3.090 0.277 11.162 < .001
Normative Upper-Division 3.290 0.277 11.875 < .001
Other Lower-Division 3.215 0.278 11.585 < .001
Other Upper-Division 3.346 0.278 12.055 < .001

42
Research Question 2
What measurable factors other than changes in university policies appear to be associated
with variability in the grade trend at BYU over the last 20 years?
a. Changes in the qualifications of incoming students (including AP classes taken
and average ACT scores)
b. Changes in the qualifications of faculty (including mean Activity Index scores
and mean ratings of teachers by students in their courses)
The mean AP credits of enrolled freshmen are significantly correlated (p = 0.001) with
mean GPA (Table 8). When the number of AP credits brought in by enrolled freshmen increased
by one credit, mean GPA increased by 0.008, holding all other variables constant.
Table 8
Estimates of AP, Faculty Activity Index, and SETs (βs), Holding all other Variables Constant
Variable Estimate SE t value p
Mean AP credits 0.008 0.003 3.296 .001
Faculty Activity Index -0.034 0.019 -1.745 .083
SET Overall Instructor – 8 pt good current -0.027 0.040 -0.666 .506
unbalanced8 -0.249 0.197 -1.267 .207
SET Overall Instructor – 8 pt unbalanced 0.009 0.019 0.493 .623
old8 0.244 0.265 0.918 .360
SET Overall Instructor – 8 pt good -0.058 0.020 -2.986 .003
Paper -1.531 0.414 -3.694 <.001
SET Overall Instructor - paper 0.237 0.058 4.101 <.001
Pre-university-wide SET -0.159 0.276 -0.578 .564
Most faculty have research expectations while also teaching a full load of classes. Faculty
research activity is marginally significantly correlated (p = .083) with mean GPA (Table 8).
While not significant at the .05 level, increasing faculty research appears to result in a slight
decrease in mean GPA, holding all else equal.

43
College group and course level capture the effect of SET on GPA, and there is no further
statistically significant relationship (Table 8). This was a surprising finding. It appears that
grading philosophy could be the driving factor in student evaluations of teaching — not mean
GPA, as most research suggests (Compton & Metheny, 2000; Eiszler, 2002; Greenwald &
Gilmore, 1997; Johnson, 2003; McPherson, 2006). As explained in the previous chapter, there
were multiple versions of the SET instrument that were utilized over the study period, and data
from each of these instruments are modeled as individual variables. The paper version of the
SET is the only one that is significantly different from the current SET. We hypothesize that this
is due to selection bias (instructors could choose to participate), not the questions or
measurement scale.
The mean GPA data were reported by semester and included fall and winter semesters
each year, allowing a comparison between semesters (Table 9). Winter semester mean GPA is
significantly lower (p = .042) for normative lower-level courses. This finding was not expected
and could be investigated further. Two possible explanations are differences in faculty grading
practices between semesters and differences in the types of courses in the students’ schedules
between semesters.
Table 9
Mean Difference Between Winter and Fall Semester (γij) GPA Averaged Across Years Adjusting for all other Variables
College Group and Course Level Estimate SE t value p
Mastery Lower-Division -0.001 0.004 -0.289 .773
Mastery Upper-Division 0.003 0.004 0.663 .508
Normative Lower-Division -0.009 0.004 -2.048 .042
Normative Upper-Division 0.004 0.004 0.978 .329
Other Lower-Division 0.006 0.004 1.361 .175
Other Upper-Division 0.001 0.004 0.175 .861

44
Research Question 3
To what extent do changes in the average grades awarded at BYU from 1995 to 2014
appear to be influenced by changes in the university policies on course withdrawal dates and
calculating students’ mean GPA?
a. Changes in the policy regarding course withdrawal dates (fall 2011)
b. Changes in the practice of calculating GPA using courses that were retaken (fall
2011)
The policy change had no significant effect on mean GPA (Table 10). However, while
not significant at the .05 level, it is interesting that mastery lower-division courses were
positively impacted by the policy change and normative lower-division courses were negatively
impacted by the policy change. Lower-division mastery courses comprise 15.474% of all
university student credit hours, while lower-division normative courses comprise 19.489% of all
university student credit hours (Table 5). These groups impact university mean GPA
comparatively and, essentially, each cancels out the effect of the other from the point of view of
a main effect. However, it should be noted that in Table 1, the standard deviation of the mean
GPA increased after the policy change. This increase may be further evidence that the policy
change impacted the GPAs of the observational groups differently.
Table 10
Estimates of Policy Change (θij) Holding all other Variables Constant
College Group and Course Level Estimate SE t value p
Mastery Lower-Division 0.004 0.025 1.784 .076
Mastery Upper-Division -0.016 0.022 -0.743 .458
Normative Lower-Division -0.046 0.026 -1.780 .077
Normative Upper-Division -0.016 0.022 -0.722 .471
Other Lower-Division 0.004 0.023 0.174 .862
Other Upper-Division -0.023 0.022 -1.038 .301

45
As described in Chapter 1, the policy change was announced in the fall 2009 semester,
with a planned implementation date of the following year, in the fall 2010 semester. Students
would have one year to retake a course and replace a previous grade with the new grade. Due to
confusion over the date and concerns from students who were away from school serving two-
year missions for the Church of Jesus Christ of Latter-day Saints, the deadline for the policy
change was set back another year, to the fall 2011 semester. The results show that this interim
period did not have an effect on the mean GPAs of most courses (Table 11). However, for
mastery-based lower-division courses, there is a statistically significant (p = .040) local effect, a
.028 increase in mean GPA. It is possible that more lower-division mastery courses were retaken
during the interim period than other types of courses. Because many of the lower-division
normative courses are sequential in that students must pass the course before taking the next
course in succession, those courses had already been retaken before this interim period. If
courses were retaken at similar rates, it is probable that the retaken courses in lower-division
mastery courses received higher replacement grades than the courses retaken in other college
categories. The initial grade would be replaced with the repeated grade, whether it was higher or
lower than the original grade.
Table 11
Estimates of Policy Interim Period (φij) Holding all other Variables Constant
Variable Estimate Std. Error t value p
Mastery Lower-Division 0.028 0.014 2.064 .040
Mastery Upper-Division 0.001 0.013 0.091 .927
Normative Lower-Division 0.004 0.014 0.258 .797
Normative Upper-Division 0.000 0.013 0.010 .992
Other Lower-Division 0.022 0.013 1.641 .102
Other Upper-Division -0.009 0.013 -0.705 .482

46
Research Question 4
To what extent have average BYU grades, both baseline GPA and adjusted GPA,
increased or decreased during the past 20 years (1994-2014), and how does the trend of each
compare with the trend previously reported by Olsen (1995)?
This research question was investigated by looking at the effect of year before and after fall
2011 after adjusting for all other explanatory variables. Models often use a linear or quadratic effect
for their trends. We investigated (a) linear, (b) quadratic, (c) cubic, and (d) quartic models for year.
While there are different qualities of fit among the four models, the extrapolation used to predict
future grades as a consequence of model specification was very poor. Figure 1 displays the various
polynomial models. Various polynomial models are overlaid on the plot of mean GPA for normative
lower-division courses over the 20-year period. If the purpose of the model was only to explain
existing data, a polynomial model could be considered sufficient.
Figure 1. Plot of mean GPA for normative lower-division courses over the 20-year period with possible linear, quadratic, cubic, and quartic models.

47
To model the existing data and provide satisfactory forecasting, B-splines with knots
were chosen for each college group and course level (Figure 2). These splines allow a flexible fit
to the observed data. Boundary knots were set at 1994 (the beginning of the study period) and at
2009 (the date of the policy change announcement). Interior knots were chosen for each college
group and course level based on graphical fit (Table 12). For example, the internal knot for lower
division courses in the other grading category was 2002.5, or halfway through 2002. B-splines
constrain extrapolation beyond the boundary knot so that it is linear and represents the belief that
recent grade trends will continue.
Figure 2. Year trend using B-splines
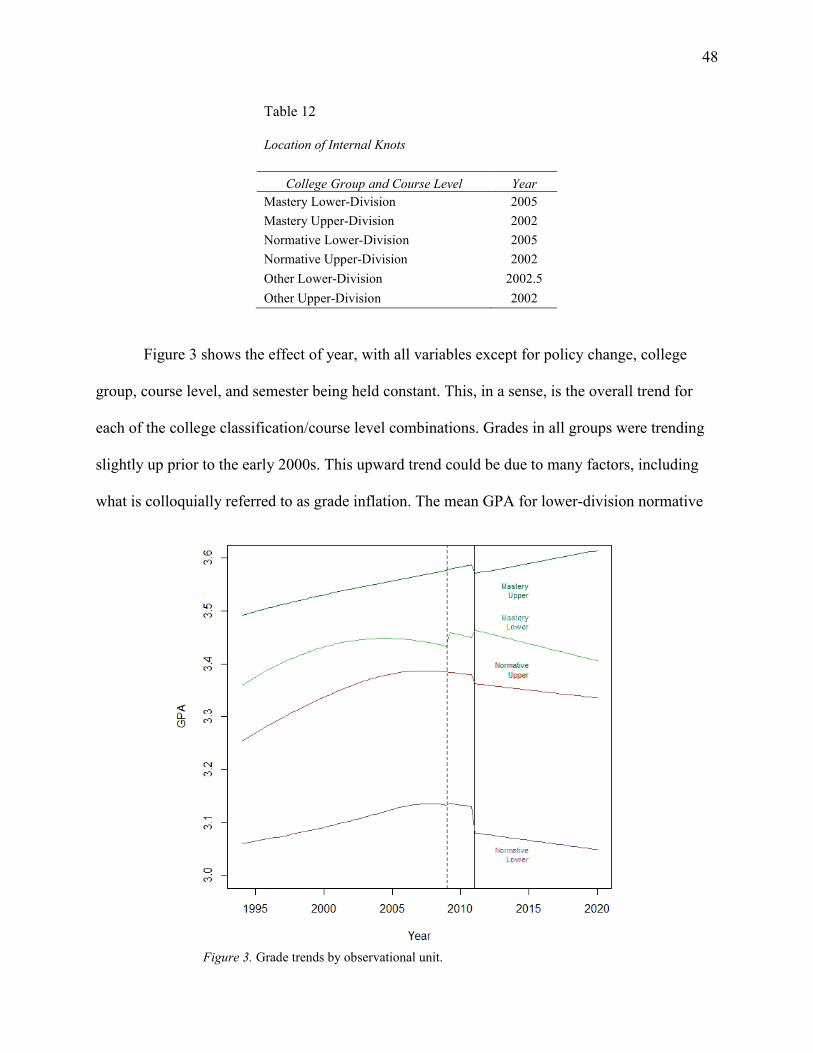
48
Table 12
Location of Internal Knots
College Group and Course Level Year
Mastery Lower-Division 2005
Mastery Upper-Division 2002
Normative Lower-Division 2005
Normative Upper-Division 2002
Other Lower-Division 2002.5
Other Upper-Division 2002
Figure 3 shows the effect of year, with all variables except for policy change, college
group, course level, and semester being held constant. This, in a sense, is the overall trend for
each of the college classification/course level combinations. Grades in all groups were trending
slightly up prior to the early 2000s. This upward trend could be due to many factors, including
what is colloquially referred to as grade inflation. The mean GPA for lower-division normative
Figure 3. Grade trends by observational unit.

49
courses continued this upward trend until 2006 or 2007, but it then plateaued and began to
decrease. If this downward trend occurs, it may be evidence of grade deflation. Mean GPAs in
this group were significantly reduced due to the policy change, as discussed previously. Upper-
division normative GPAs leveled out around 2005, with a possible small downward trend being
extrapolated for the future. Both upper- and lower-division normative GPAs appear to have
generally similar trends, although the intercepts are different.
Lower-division mastery courses had the same upward trend as the other courses. GPAs in
lower-division mastery courses leveled off a little earlier (early 2000) and stayed generally
constant until the date of the policy interim period. GPAs increased slightly during and just after
the interim period and have a generally flat or slightly downward trend since that time. In
contrast, the upper-division mastery courses continue to have an upward, linear trend through the
change to baseline GPA.
Olsen (1995) used a different method to evaluate grade inflation for the years 1974-1994
than was used in this study. He created a regression model to predict the expected GPA of
students. The expected GPA and actual (historical) GPA were compared over time as a ratio. If
the expected GPA was lower than the actual GPA, this was labeled as structural grade inflation,
and if the expected GPA was higher than the actual GPA, this was labeled structural grade
deflation. Each college or school was studied separately. Olsen reported that although some
colleges experienced structural grade inflation or structural grade deflation, the mean GPA in
most colleges was increasing at slightly higher rates than would be predicted. He estimated that
the mean university GPA would increase at the rate of 2% in the following 10 years. The results
of this study show that mean GPA did increase as predicted during that time period.

50
Prediction
Predicting mean GPA using the model is complicated due to the time-varying
explanatory variables. The model used to predict GPA for just one year into the future includes
AP(t + 1), faculty researchij(t + 1), and SETij(t + 1). While a more sophisticated model could be
used, a simple approach is an ARIMA time series model that extrapolates the historical trend.
Table 13 contains the forecast values used to predict mean GPA, but different values could be
used to represent administrative expectations, which would result in somewhat different
predictions. ARIMA(1,1,1) was used for these terms, except AP(t), which used ARIMA(1,1,0).
Table 13
Forecast Values Used to Predict Mean GPA for the Next Seven Years
Normative Group Mastery Group
lower upper lower upper
Year AP(t) AI(t) SET(t) SET(t) AI(t) SET(t) SET(t)
2014 20.555 .708 6.717 6.911
.633 7.070 7.105 2015 20.673 .717 6.762 6.924
.637 7.078 7.109
2016 20.792 .724 6.752 6.938
.639 7.087 7.113 2017 20.911 .729 6.784 6.952
.641 7.095 7.116
2018 21.030 .733 6.784 6.966
.642 7.103 7.120 2019 21.149 .736 6.808 6.980
.643 7.112 7.124
2020 21.268 .740 6.813 6.994 .643 7.120 7.128
In the context of the variables already in the model, SET scores did not contribute
significantly to predicting mean GPA. However, because the university administration has
already made a decision to replace the current SET instrument, these predictions would not have
been useful in the future.

51
The model to predict the mean GPA for the ith college group, jth course level, kth semester,
for 2014 to 2020 is given by the following:
gpa� ���(����) = ��� + bs���(����) + ���AP� (����)
+ ���facultyresearch��(����) + ���SET�
��(����) + ��� + ����I
where the current GPA policy and the effect of year continue because the B-splines are linear for
this period and the ‘hats’ on the parameters denote the estimated regression coefficients.
As previously reported in Table 8, the faculty activity index has a slightly negative effect
on mean GPA, although it is not statistically significant. This negative relationship indicates that
as faculty research activity increases, the mean GPA tends to decrease.
In contrast, the regression coefficient for mean AP credits is positive but smaller in
magnitude, and it is statistically significant because it has a much smaller standard error. This
indicates that as the average number of AP credits brought in by entering freshmen increases, the
mean GPA will likely increase slightly.
Figure 4 displays the extrapolated trend for upper- and lower-division courses in colleges
that use mastery grading and in colleges that use a normative approach. Predicted values show
that the mean GPA of most categories will likely remain stable, with a continued upward trend of
mean GPA in upper division mastery courses. The predicted downward trend in lower division
mastery courses must be interpreted with caution. The model shows that prior to the policy
change and interim period, these grades had a slightly downward trend. Whether that downward
trend will continue or whether the policy change will have a permanent affect remains to be seen.

52
Figure 4. Forecasted mean GPA trends 2015-2020.

53
CHAPTER 5: DISCUSSION
Much of the published research on grade inflation focuses on the presumed causes of the
inflation and the assertion of blame. Faculty are assumed to have buckled under societal and student
pressures to award higher grades than students deserve. Sometimes, other factors, such as
institutional policies and changes in the quality of students across years (e.g., ACT scores), are
considered as possible contributing variables, but the results of those studies do not appear to be
newsworthy enough to contribute significantly to the discussion of grade inflation in the media.
Researchers who claim that rising grades could be the result of actual student learning are rarely
given any airtime at all with the public press. The widely accepted opinion seems to be that average
grades are steadily increasing nationwide without a corresponding increase in student achievement.
Prior studies rarely give a thorough description of the study data, as was pointed out in
Chapter 2. Researchers studying grade inflation must be more explicit in describing the
characteristics of the data used in their analyses, especially when they are drawing conclusions
from sample data to larger populations. In this study, by contrast, we attempted to clearly define
each of the variables used in the analysis, including the course and academic units included and
excluded and the time period studied. We also explicitly described the method used to analyze
the grade trends. This study is not intended to be a statement about nationwide grading trends,
but administrators at other universities may wish to use similar analytical procedures to
investigate grade trends at their own institutions.
Prior research has demonstrated that students in lower-division courses tend to receive
lower mean grades than students in upper-division courses (Compton & Metheny, 2000; Creech
& Sweeder, 2012; Grove & Wasserman, 2004; Jewell & McPherson, 2012; Sonner, 2000). The
results from this study confirmed this prior research and showed evidence of this difference in

54
every college grading classification. Additionally, we found that the difference in mean GPA
between upper- and lower-division courses differs between college grading categories and is
greatest within those colleges that tend to use a normative grading philosophy.
The literature directs public attention to certain types of colleges and either implies or
explicitly states that those few colleges tend to impact the overall GPA for the rest of the university
or even for the nation. In particular, nursing, education, and humanities colleges have often been
blamed by researchers for increasing grades. However, our data show that at BYU, the nursing and
education colleges combined account for less than 3% of all grades awarded in the last 20 years
(Table 5). Humanities adds only another 13%. The colleges with the greatest impact on mean GPA at
BYU are Family and Home and Social Sciences (16.39%) and Religious Education (16.23%).
Only a small number of studies have investigated the impact of university policy on mean
GPA scores (Adelman, 2008; Addy & Herring, 1996; Jewell & McPherson, 2013; Marx & Meeler,
2013; Sloop, 1992). This study found evidence that university policy changes affect mean GPAs in
some courses. It appears that extending withdrawal deadlines may have slightly increased mean GPA
in lower-division mastery courses and that removing the ability to replace a previous grade with a later
grade earned by retaking a course slightly decreased mean GPA in lower-division normative courses,
although neither of these effects were statistically significant (p = .076 and .077, respectively). Upper-
division courses were not significantly impacted by the university policy change.
This study may be the largest publically available study of longitudinal trends in grades at
a single university. Over 6.5 million grades given by thousands of faculty in ten colleges and
schools over 20 years were analyzed. Unique to this study is a new model that includes variables
not typically considered in previous studies. Also, the use of splines to model yearly trends has
not been reported in previously published studies of grade inflation.

55
Future Research Recommendations
This study found that the fall 2011 grading policy change at BYU impacted lower-
division courses differently depending on the college grading philosophy. The interaction of the
policy change and grading practices within each of these colleges may have differing impacts on
student GPAs. For example, some students and faculty have reported that some instructors in
normative-grading colleges withhold grade information from the students until the withdrawal
deadline has passed. If practices like this are occurring, how many students in these types of
courses have not withdrawn from the course, but have given up, stopped coming to class, and
consigned themselves to failing? It would be interesting to see what the mean grades in these
courses would look like if the failing grades from this type of student were not included in the
class grading distribution. Future studies should investigate this question.
Along the same lines, future research could investigate advising practices in lower-level
mastery classes to determine whether students who are struggling to learn the material are being
advised to withdraw from the course, instead of persisting and earning less than an A. This
investigation might also show why courses in this category experienced a small increase in mean
GPA during the two-year interim period.
One surprising finding of this study was that SET scores were highly positively correlated
with college grading philosophy and course level, regardless of the mean GPA of each group.
Grading philosophy may be a driving factor in student evaluations of teaching, and this interaction
should be studied in further detail. However, Brigham Young University is in the process of
moving to a new SET instrument, which may provide different effect results in future studies.
This study found that differences between the mean GPAs of lower-division courses and
upper-division courses are not uniform between colleges that rely on different grading
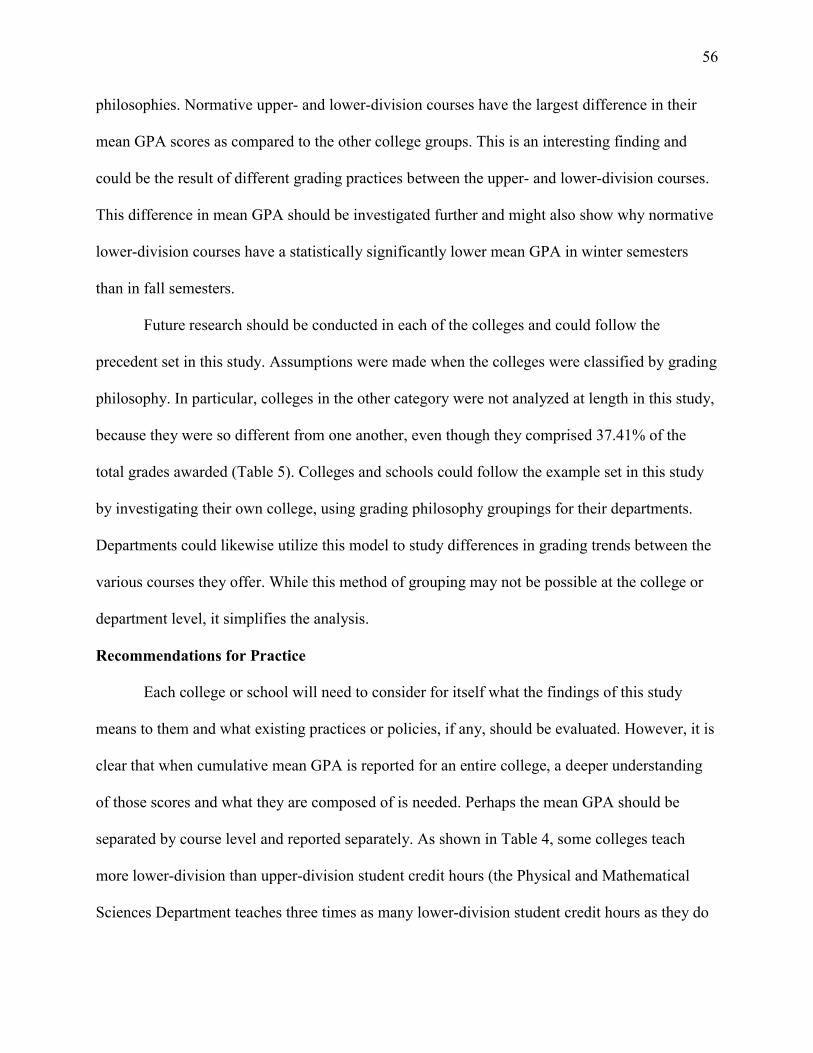
56
philosophies. Normative upper- and lower-division courses have the largest difference in their
mean GPA scores as compared to the other college groups. This is an interesting finding and
could be the result of different grading practices between the upper- and lower-division courses.
This difference in mean GPA should be investigated further and might also show why normative
lower-division courses have a statistically significantly lower mean GPA in winter semesters
than in fall semesters.
Future research should be conducted in each of the colleges and could follow the
precedent set in this study. Assumptions were made when the colleges were classified by grading
philosophy. In particular, colleges in the other category were not analyzed at length in this study,
because they were so different from one another, even though they comprised 37.41% of the
total grades awarded (Table 5). Colleges and schools could follow the example set in this study
by investigating their own college, using grading philosophy groupings for their departments.
Departments could likewise utilize this model to study differences in grading trends between the
various courses they offer. While this method of grouping may not be possible at the college or
department level, it simplifies the analysis.
Recommendations for Practice
Each college or school will need to consider for itself what the findings of this study
means to them and what existing practices or policies, if any, should be evaluated. However, it is
clear that when cumulative mean GPA is reported for an entire college, a deeper understanding
of those scores and what they are composed of is needed. Perhaps the mean GPA should be
separated by course level and reported separately. As shown in Table 4, some colleges teach
more lower-division than upper-division student credit hours (the Physical and Mathematical
Sciences Department teaches three times as many lower-division student credit hours as they do

57
upper-division student credit hours), while others teach mainly upper-division student credit
hours (the School of Education teaches over five times as many upper-division student credit
hours as they do lower-division student credit hours). These colleges represent the extremes, but
if a college teaches mainly lower-division student credit hours, its reported mean GPA will be
comprised of mainly student credit hours that generally have low mean GPA. Conversely, if a
college teaches mainly upper division student credit hours, the mean GPA reported will be
comprised of upper-division student credit hours, which tend to have high mean GPA.
This study is not intended to promote one type of grading philosophy over another. Each
discipline must utilize the grading philosophy that its practitioners believe is the most
appropriate for their courses. However, the impact of that grading philosophy on individual
students should be considered. If the goal is to help as many students as possible to achieve a
specific level of accomplishment, some grading practices may become a hindrance to learning. It
is difficult for students to engage in learning activities collaboratively while also competing for
grades — those two goals conflict with one another. Also, instructors who feel pressured to
follow a certain standard for grading may display behavior that is counterproductive to student
learning. Student learning should be the primary goal of any university.
So, does grade inflation exist at BYU? The results of this study show that there is not a
simple answer to that question. Grade trends vary between colleges with differing grading
philosophies. They also likely vary across departments within colleges and from course to course
within departments. Trends also differ between course level. Except for the effect of the policy
change, mean GPA trends across most categories at the university have levelled off for more
than a decade and are likely to remain so. Study results indicate there is no reason for alarm and
that no systemic, rampant pattern of grade inflation is evident.

58
References
Addy, N., & Herring, C. (1996). Grade inflation effects of administrative policies. Issues in
Accounting Education, 11, 1-13.
Adelman, C. (2008). Undergraduate grades: A more complex story than “inflation.” In L. H.
Hunt (Ed.), Grade inflation: Academic standards in higher education (pp. 13-44).
Albany, NY: State University of New York Press.
Apple, M. R. (2002). A study of grade distribution and grade-point averages of the Tennessee
board of regents associate-degree nursing programs (Order No. 3042410). Available
from ProQuest Central; ProQuest Dissertations & Theses Full Text; ProQuest
Dissertations & Theses Global. (304799794). Retrieved from
http://search.proquest.com/docview/304799794?accountid=4488
Brighouse, H. (2008). Grade inflation and grade variation: What’s all the fuss about? In L. H.
Hunt (Ed.), Grade inflation: Academic standards in higher education (pp. 73-91).
Albany, NY: State University of New York Press.
Brookhart, S. M. (2004). Grading. Upper Saddle River, NJ: Pearson Education, Inc.
Cluskey Jr., G. R., Griffin, N., & Ehlen, C. (1997). Accounting grade inflation. Journal of
Education for Business, 72, 273-277.
Compton, D. M., & Metheny, B. (2000). An assessment of grade inflation in higher education.
Perceptual and Motor Skills, 90, 527-536.
Creech, L. R., & Sweeder, R. D. (2012). Analysis of student performance in large-enrollment life
science courses. CBE-Life Sciences Education, 11, 386-391.
Eiszler, C. F. (2002). College students’ evaluations of teaching and grade inflation. Research in
Higher Education, 43, 483-501.

59
Ellis, L., Burke, D. M., Lomire, P., & McCormack, D. R. (2003). Student grades and average
ratings of instructional quality: The need for adjustment. Journal of Educational
Research, 97, 35-40.
Fox, J. (1995). Applied regression analysis, linear models, and related methods. Thousand Oaks,
CA: SAGE Publications, Inc.
Greenwald, A. G., & Gilmore, G. M. (1997). Grading leniency is a removable contaminant of
student ratings. American Psychologist, 52, 1209-1217.
Griffin, B. W. (2004). Grading leniency, grade discrepancy, and student ratings of instruction.
Contemporary Educational Psychology, 19, 410-442.
Grove, W. A., & Wasserman, T. (2004). The life-cycle pattern of collegiate GPA: Longitudinal
cohort analysis and grade inflation. Journal of Economic Education, 35, 162-174.
Hu, S. (2005). Beyond grade inflation: Grading problems in higher education. ASHE Higher
Education Report, 30(6), 1-90.
Jewell, R. T., & McPherson, M. A. (2012). Instructor-specific grade inflation: Incentives, gender,
and ethnicity. Social Science Quarterly, 93, 95-109. doi: 10.1111/j.1540-
6237.2011.00827.x
Jewell, R. T., McPherson, M. A., & Tieslau, M. A. (2013). Whose fault is it? Assigning blame
for grade inflation in higher education. Applied Economics, 45, 1185-1200. doi:
10.1080/0036846.2011.621884
Johnson, V. (2003). Grade inflation: A crisis in college education. New York, NY: Springer.
Jones, E. B., & Jackson, J. D. (1990). College grades and labor market rewards. Journal of
Human Resources, 25, 253-266.

60
Kamber, R. (2008). Understanding grade inflation. In L. H. Hunt (Ed.), Grade inflation:
Academic standards in higher education (pp. 45-71). Albany, NY: State University of
New York Press.
Kezim, B., Pariseau, S. E., & Quinn, F. (2005). Is grade inflation related to faculty status?
Journal of Education for Business, 80, 358-363.
Kohn, A. (2008). The dangerous myth of grade inflation. In L. H. Hunt (Ed.), Grade inflation:
Academic standards in higher education (pp. 1-12). Albany, NY: State University of
New York Press.
Kuh, G. D., & Hu, S. (1999). Unraveling the complexity of the increase in college grades from
the mid-1980s to the mid-1990s. Educational Evaluation and Policy Analysis, 21, 297-
320.
Kuncel, N., Crede, M., & Thomas, L. L. (2005). The validity of self-reported grade point
averages, class ranks, and test scores: A meta-analysis and review of the literature.
Review of Educational Research, 75, 63-82.
Kwon, I. G., Kendig, N. L., & Bae, M. (1997). Grade inflation from a career counselor’s
perspective. Journal of Employment Counseling, 34, 50-54.
Lawler, P. A. (2001). Grade inflation, democracy, and the Ivy League. Perspectives on Political
Science, 30, 133-136.
Levine, A., & Cureton, J. S. (1998). When hope and fear collide: A portrait of today’s college
student. San Francisco, CA: Jossey-Bass.

61
Lowe, S. K., Borstorff, P. C., & Landry III, R. J. (2008). An empirical examination of the
phenomenon of grade inflation in higher education: A focus of grade divergence between
business and other fields of study. Academy of Educational Leadership Journal, 12, 15-
33.
Mansfield, H. C. (2001). Grade inflation: It’s time to face the facts. The Chronicle Review, 6
April 2001, B24.
Marx, J., & Meeler, D. (2013). Strike four! Do-over policies institutionalize GPA distortion?
Quality Assurance in Education, 21, 39-53.
McPherson, M. A. (2006). Determinants of how students evaluate teachers. Journal of Economic
Education, 37, 3-20.
McSpirit, S., Jones, K., & Chapman, A. D. (2000). Identifying grade inflation at an open-
admissions institution. College Student Journal, 34, 228-235.
Moore, M., & Trahan, R. (1998). Tenure status and grading practices. Sociological Perspectives,
41, 775-781.
Mostrum, A. M., & Blumberg, P. (2012). Does learning-centered teaching promote grade
improvement? Innovations in Higher Education, 37, 397-405. doi: 10.1007/s10755-12-
9216-1
Olsen, D. R. (1995). Reality or myth? Student preparation level vs. grades at Brigham Young
University 1975-1994. ProQuest, UMI 9608616.
Pattison, E., Grodsky, E., & Muller, C., (2013). Is the sky falling? Grade inflation and the
signaling power of grades. Educational Researcher, 42, 259-265. doi:
10.3102/0013189X13481382

62
Rojstaczer, S., & Healy, C. (2012). Where A is ordinary: The evolution of American college and
university grading, 1940-2009. Teachers College Record, 114(7), 1-23.
Rowe, F. A., Higley, H. B., Larsen, W., & Bills, D. (1985). Developing a predictive equation for
admission at Brigham Young University based on high school preparation. College and
University, 60, 132-141.
Sabot, R., & Wakeman-Linn, J., (1991). Grade inflation and course choice. Journal of Economic
Perspectives, 5, 159-170.
Sloop, S. L. (1992). Keep a "B" and go to college free: An examination of grade inflation (Order
No. 9984210). Available from ProQuest Dissertations & Theses Full Text; ProQuest
Dissertations & Theses Global. (304620051). Retrieved from
http://search.proquest.com/docview/304620051?accountid=4488
Smith, D. L. (1992). Validity of faculty judgments of student performance: Relationship between
grades and credits earned and external criterion measures. Journal of Higher Education,
63, 329-340.
Sonner, B. S. (2000). A is for “adjunct”: Examining grade inflation in higher education. Journal
of Education for Business, 76, 5-8.
Wilson, B. P. (1999). The phenomenon of grade inflation in higher education. National Forum,
79, 38-49.
Wise, D. A. (1975). Academic achievement and job performance. American Economic Review,
65, 350-366.
Worthen, B. R., White, K. R, Fan, X., & Sudweeks, R. R. (1999). Measurement and assessment
in schools (2nd ed.). New York, NY: Addison Wesley Longman.

63
Zellner, K. M., (2008). An examination of grade distribution patterns and grade inflation at a
baccalaureate nursing program (Order No. 3304475). Available from ProQuest Central;
ProQuest Dissertations & Theses Full Text; ProQuest Dissertations & Theses Global.
(193633633). Retrieved from
http://search.proquest.com/docview/193633633?accountid=4488

64
Appendix A
The form used to collect Student evaluations of teaching (SET) at BYU has changed four
times over the last 20 years. For the purposes of this study, only the response data to the overall
instructor question were utilized, although the SET instruments included additional questions
related to the course and instructor. Prior to fall 1996, no uniform university data were recorded.
From fall semester 1996 through fall semester 2002, all university courses were surveyed each
semester via a standard university-wide survey. That survey is labelled in this study as SET
Overall Instructor – paper. This paper questionnaire was given to each student during a class
period near the end of the semester. The professor was instructed to leave the room, and a
teaching assistant or another student collected the completed surveys into a manila envelope and
delivered them to the Testing Center for scanning. Data for each question were reported on a 7-
point Likert scale.
Since fall semester 2002, the survey has been administered electronically. Two weeks
prior to the end of the semester, students are emailed a link to complete an online survey for each
of their courses. Data for the online questions are reported on an 8-point Likert scale, labelled in
this study as SET Overall Instructor – 8 point good. During the period of fall semester 2003 to
winter semester 2007, the response options for two questions (OI and OC) were modified from
the 2003 version of the survey, labelled in this study as SET Overall Instructor – 8 point
unbalanced. In winter 2007, the labels reverted back to the 2003 version of the survey, labelled
in this study as SET Overall Instructor – 8 point good current.
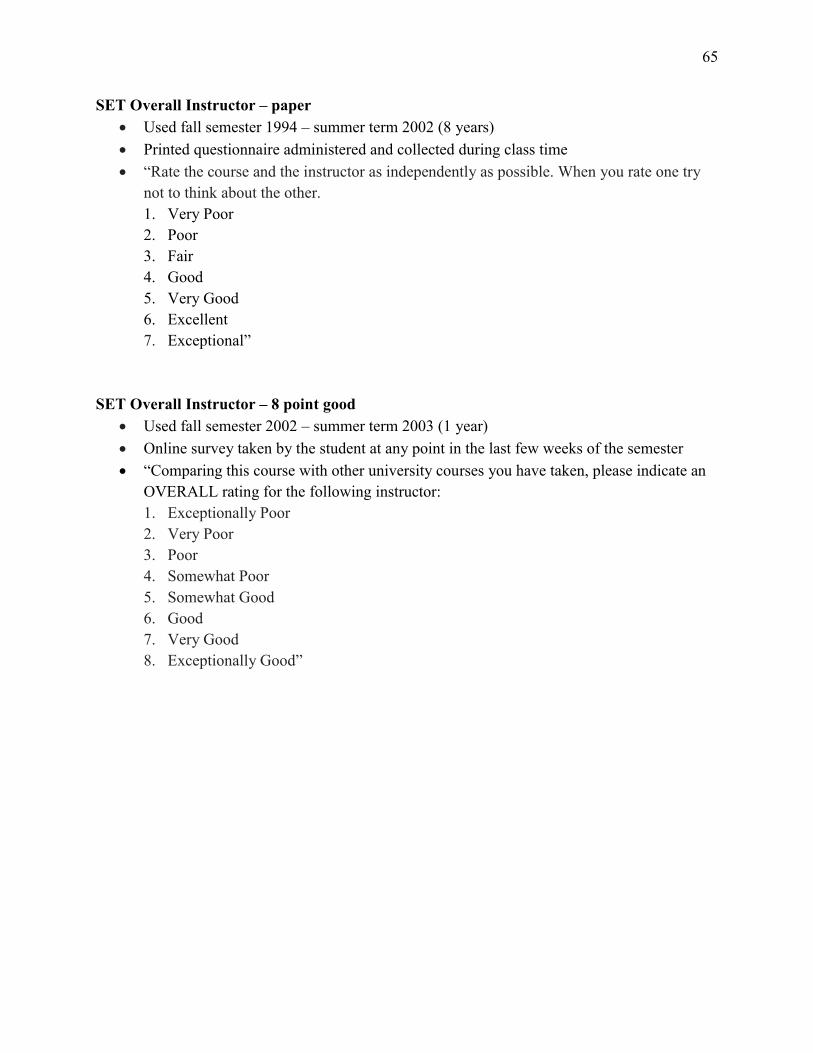
65
SET Overall Instructor – paper
Used fall semester 1994 – summer term 2002 (8 years)
Printed questionnaire administered and collected during class time
“Rate the course and the instructor as independently as possible. When you rate one try
not to think about the other.
1. Very Poor
2. Poor
3. Fair
4. Good
5. Very Good
6. Excellent
7. Exceptional”
SET Overall Instructor – 8 point good
Used fall semester 2002 – summer term 2003 (1 year)
Online survey taken by the student at any point in the last few weeks of the semester
“Comparing this course with other university courses you have taken, please indicate an
OVERALL rating for the following instructor:
1. Exceptionally Poor
2. Very Poor
3. Poor
4. Somewhat Poor
5. Somewhat Good
6. Good
7. Very Good
8. Exceptionally Good”
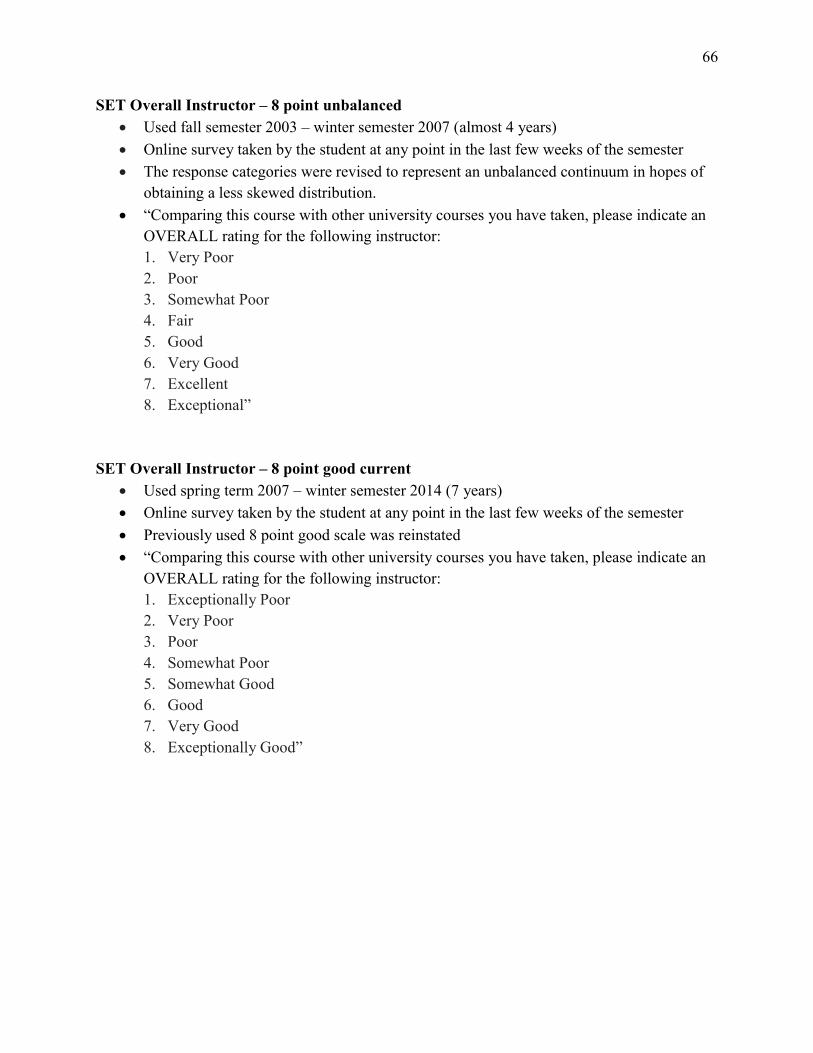
66
SET Overall Instructor – 8 point unbalanced
Used fall semester 2003 – winter semester 2007 (almost 4 years)
Online survey taken by the student at any point in the last few weeks of the semester
The response categories were revised to represent an unbalanced continuum in hopes of
obtaining a less skewed distribution.
“Comparing this course with other university courses you have taken, please indicate an
OVERALL rating for the following instructor:
1. Very Poor
2. Poor
3. Somewhat Poor
4. Fair
5. Good
6. Very Good
7. Excellent
8. Exceptional”
SET Overall Instructor – 8 point good current
Used spring term 2007 – winter semester 2014 (7 years)
Online survey taken by the student at any point in the last few weeks of the semester
Previously used 8 point good scale was reinstated
“Comparing this course with other university courses you have taken, please indicate an
OVERALL rating for the following instructor:
1. Exceptionally Poor
2. Very Poor
3. Poor
4. Somewhat Poor
5. Somewhat Good
6. Good
7. Very Good
8. Exceptionally Good”