analysis of trinidad and - sta.uwi.edu · analysis of trinidad and tobago’s petroleum fiscal...
TRANSCRIPT

+
ANALYSIS OF
TRINIDAD AND
TOBAGO’s
PETROLEUM FISCAL
REGIME
ARDEN RODRIGUEZ and CARLTON THOMAS
Arthur Lok Jack Graduate School of Business
Presented at the
Revenue Management in Hydrocarbon Economies Conference
21st June 2012

+
Arden Rodriguez
June 2012 Analysis of Fiscal Packages - Arden Rodriguez & Carlton Thomas
2
+ Fiscal Agreements in the Energy
Sector
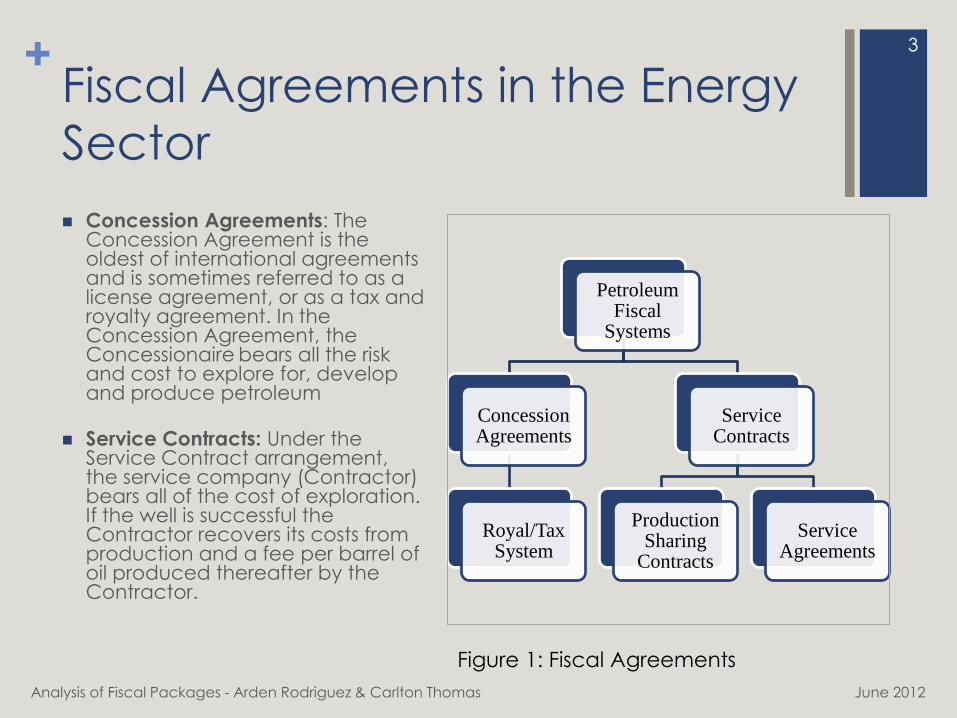
Concession Agreements: The Concession Agreement is the oldest of international agreements and is sometimes referred to as a license agreement, or as a tax and royalty agreement. In the Concession Agreement, the Concessionaire bears all the risk and cost to explore for, develop and produce petroleum
Service Contracts: Under the Service Contract arrangement, the service company (Contractor) bears all of the cost of exploration. If the well is successful the Contractor recovers its costs from production and a fee per barrel of oil produced thereafter by the Contractor.
June 2012 Analysis of Fiscal Packages - Arden Rodriguez & Carlton Thomas
3
Petroleum Fiscal
Systems
Concession Agreements
Royal/Tax System
Service Contracts
Production Sharing
Contracts
Service Agreements
Figure 1: Fiscal Agreements

+ Fiscal Agreements
The advantage of the PSCs, as follows:
The State remains the owner of the petroleum and gas produced;
The Contractor pays a royalty, recovers the cost of operations, and then shares the remaining production with the Government.
Remuneration of the Contractor is made in kind, i.e. by the allocation of a “production-share” of the oil produced after the recovery of costs.
The Contractors provide all the equipment and technology, and bears the cost of operations and risks.
Usually, a joint committee (where both parties are represented) is established to monitor the operations, approve the working programme and authorize the necessary budgets
June 2012
4
Greater
Gov’t
Control
Greater
IOC
Control
Figure 2: Hierarchy of Fiscal Regime
Analysis of Fiscal Packages - Arden Rodriguez & Carlton Thomas

+ Foreign Direct Investment In
Trinidad and Tobago YEAR FDI Reinvested
Earnings
Petro FDI Private
Sector
Investment
Income
Petroleum Investment Income
Total Remittances Retained
Profits
1996 356.3 - 284.2 249.2 97.3 151.9
1997 999.6 125.1 954.2 289.0 201.9 119.5 82.4
1998 731.9 85.7 599.7 270.2 173.3 104.7 68.6
1999 643.3 151.5 467.7 338.9 243.2 129.0 114.2
2000 679.5 145.8 613.7 533.3 437.9 270.7 167.2
2001 834.9 167.6 816.3 467.8 412.5 209.7 202.8
2002 790.7 164.6 738.2 393.7 295.3 142.6 152.7
2003 808.3 365.9 738.5 614.5 536.6 195.4 341.2
2004 998.1 152.9 913.4 327.3 256.3 123.7 132.6
2005 939.7 292.2 857.2 741.6 613.9 333.7 280.2
2006 882.7 406.4 794.9 1,005.5 740.5 385.4 355.1
2007 830.0 296.6 763.4 1,000.7 704.9 467.5 237.4
2008 2,800.8 494.5 588.8 1,272.5 1,055.5 601.2 454.3
2009 709.1 295.9 646.9 1,054.9 700.3 503.8 196.5
Source: Trinidad and Tobago Balance of Payments (Various Years)
5
Table 1: Foreign Direct Investment in Trinidad and Tobago
Analysis of Fiscal Packages - Arden Rodriguez & Carlton Thomas June 2012

+ Remittance Versus Retained
Income
6
0%
10%
20%
30%
40%
50%
60%
70%
80%
90%
100%
Remitted versus Retained Income
REMITTANCES AS A % OF INCOME RETAINED
Chart 1: Trinidad and Tobago’s Remittance versus Retained Income
Source: Trinidad and Tobago Balance of Payments (Various Years) Analysis of Fiscal Packages - Arden Rodriguez & Carlton Thomas June 2012

+ Trinidad and Tobago’s Energy
Sector Fiscal Regime
The Petroleum Act and Regulations, Chap 62:01
The Petroleum Production Levy And Subsidy Act, Chap
62:02.
The Income Tax Act, Chap 75:01
The Petroleum Taxes Act, Chap 75:04
The Income Tax (In Aid of Industry) Act Chap. 85:04
The Unemployment Levy Act Chap 75:03
The Green Fund Levy
7
Analysis of Fiscal Packages - Arden Rodriguez & Carlton Thomas June 2012

+ Transitions of PSC’s in Trinidad
and Tobago
1973 - First PSC’s Signed
• No cost recovery
• Government share based on production levels
• Ring-fenced
1995/1996 - World Bank Model PSC introduced
• Provisions for cost recovery, relinquishment, abandonment, minimum work programmes
• Profit Petroleum to the government based on both price and production levels
• Signature bonus, research and development, training of nationals and technical equipment bonus
2005 - Taxable PSC
introduced
• Contractors were required to pay Petroleum Profits Tax, Unemployment Levy, Green Fund Levy and Withholding Tax.
• A windfall profits feature was introduced
2010 – revised World Bank
PSC introduced
•Withholding Taxes and Stamp Duty to be paid by Contractor.
June 2012 Analysis of Fiscal Packages - Arden Rodriguez & Carlton Thomas
8

+ Recent changes to Trinidad and
Tobago’s PSCs
•A Carried Participation for the State of not more than 20% for the shallow water-depth
Carried Participation
•Many of the financial obligations of the PSC are no longer biddable items and clearly fixed and stated in the contract. However for the deep water acreage, signature bonuses will only be required in the event that two or more companies achieve equal points at the end of the bid process.
Financial Obligations
•Cost recovery limits are fixed at 50%, 55% & 60% for shallow, average and deep water-depth acreages, respectively. In earlier production sharing contracts, these limits were biddable items
Cost Recovery
•A Petroleum Profit Tax rate of 35% was introduced specifically for the deep water acreage
Additional Incentives
•SPT is regarded as a windfall tax that is charged on gross income from the disposal of crude oil less royalty and over-riding royalty.
Supplemental Petroleum Tax
9
Analysis of Fiscal Packages - Arden Rodriguez & Carlton Thomas June 2012

+
Carlton Thomas
June 2012 Analysis of Fiscal Packages - Arden Rodriguez & Carlton Thomas
10

+ Province Comparison
11
COUNTRY Ghana Indonesia Brazil Nigeria Suriname Trinidad
OIL RESERVES
(billion bbls) 0.8 - 1.80 4.20 14.20 37.20 0.08 0.80
OIL PRODUCTION
(bbl/d) 80,000
bbl/d
986,000
bbl/d
2.1m
bbl/d
2.4m
bbl/d
16,000
bbl/d
92,000
bbl/d
Proven GAS RESERVES
(tcf) N/A 108.40 14.70 186.90 0.00 12.90
Table 2: Summary of Provinces
Source: Bp Statistical Review of World
Energy 2011
Analysis of Fiscal Packages - Arden Rodriguez & Carlton Thomas June 2012

+ Methodology and Assumptions
Field Size, (mmbbl) 50
Peak production rate, (bopd) 21,636
Field life, (years) 20
Initial Oil price, ($/bbl) 80
Capital investment, ($million) 150
Operating costs, ($/bbl) 5
A series of cash flow models were developed based on typical fields with the same production volumes, prices and cost structures. The simple cases were built based on the general model of the fiscal regime.
In addition, the factors that will be focused upon in the cash flows are royalty, profit sharing ratio, the cost recovery limit and the petroleum tax rates representing the various fiscal regime.
Detailed economic modeling using cash flow analysis was computed to compare the fiscal terms for each country. This approach enables an “apples to apples” comparison of fiscal systems. The cash flows for the countries in this comparison were done and the relevant economic indicators were computed and compared in order to determine which regimes appeared more competitive than the others.
12
Table 3: Sample Field Data
Analysis of Fiscal Packages - Arden Rodriguez & Carlton Thomas June 2012

+ Summary of Fiscal Regimes 13
Table 4: Summary of Fiscal Regimes
Analysis of Fiscal Packages - Arden Rodriguez & Carlton Thomas June 2012
Type Brazil Ghana Indonesia Nigeria Suriname Trinidad &
Tobago
Fiscal
Arrangement
Tax/Royalty P A PSC PSC PSC 2012 PSC
Royalty
10% 5 – 10% (85/15 split)
20% FTP
20%
onshore
16.7%
deep
6.25% 0 %
Cost Recovery
Limit 80% (under
review) 100% 70%
50%
Shallow
(80% deep)
State Share of
Profit
Petroleum
Avg 65%
(negotiable)
20 – 60%
(avg. 50%) 50%
Negotiable–
(avg. 60%)
Petroleum Tax
Rate 34% 35 –
50%
40%
(combined
C&D rate)
50% 36% 50%, 35%
for deep
Source: The Ernest and Young Oil and Tax Guide 2011
Oil and Gas Indonesia – Investment and Taxation Guide 2010

+ Summary of Results
14
COUNTRIES
TAKE Brazil** Ghana Indonesia Nigeria Suriname T & T
COMPANY
TAKE
58% 41% 17% 20% 30% 20%
(26% -deep)
GOVERNMEN
T TAKE
42% 59% 83% 80% 70% 80%
(74% -deep)
Source: Computed from Cash flow tables
Table 5: Company and Government Take Summary
Analysis of Fiscal Packages - Arden Rodriguez & Carlton Thomas June 2012

+ Summary of Results
15
Table 6: Summary of Net Present Value and Internal Rate Return Results
Analysis of Fiscal Packages - Arden Rodriguez & Carlton Thomas June 2012
COUNTRIES Net Present Value ($M)
@ 10%
Internal
Rate of Return
Ghana TT$571,473.75 63%
Brazil TT$1024,368.73 55%
Suriname TT$498,080.19 36%
Trinidad (deep) TT$422,049.18 34%
Trinidad (Shallow) TT$300,470.89 28%
Nigeria TT$299,894.63 28%
Indonesia TT$243,200.42 25%
Source : Author’s computations

+ Recommendations
The timing of government take:
Can either be front-end or back-end loaded. Front-end loaded
regimes may reduce the project’s NPV and tilt the burden of
the project risks towards the investor. Back-end loaded
taxation, on account of neutrality, targets the project’s profits
and is consequently mindful of the project’s NPV. At an
extreme, the use of back-end loaded form of taxation places
the project risks with the host government.
In marginal development projects, equity considerations with
respect to government take and the division of the profits.
A higher cost recovery limit or the lower the royalty rate will
result in a higher NPV value. Therefore Trinidad should seek to
remove the limits on cost recovery.
16
Analysis of Fiscal Packages - Arden Rodriguez & Carlton Thomas June 2012

+ Recommendations
Geology, field potential and resource type:
Resources that are unproven or difficult to access may require
lower levels of government take in order to induce
exploration, while easy-to-access and proven reserves may
warrant higher levels of government take.
Costs:
Developers that face a high degree of risk must be
compensated with a higher private return. Risk include
political, geological, regulatory, fiscal and/or environmental
risks Therefore, in higher risk jurisdictions, governments may
need to leave more divisible income in the hands of the
developer to induce exploration and development.
17
Analysis of Fiscal Packages - Arden Rodriguez & Carlton Thomas June 2012
+
March 2012 Analysis of Fiscal Packages - Arden
Rodriguez & Carlton Thomas
Thank You!
18