analysis of total-pressure loss and airflow distribution ... loss and airflow distribution were...
TRANSCRIPT

NASA TECHNICAL NOTE
ANALYSIS OF TOTAL-PRESSURE LOSS AND AIRFLOW DISTRIBUTION FOR ANNULAR GAS TURBINE COMBUSTORS
by Robert R. Tacina and Jack Grobman
Lewis Research Center CZeveZand, Ohio
N A T I O N A L AERONAUTICS AND SPACE A D M I N I S T R A T I O N W A S H I N G T O N , D. C. A U G U S T 1 9 6 9
https://ntrs.nasa.gov/search.jsp?R=19690023936 2018-05-16T23:14:24+00:00Z

TECH LIBRARY KAFB, NM
ANALYSIS OF TOTAL-PRESSURE LOSS AND AIRFLOW DISTRIBUTION
FOR ANNULAR GAS TURBINE COMBUSTORS
By Robert R. Tacina and Jack Grobman
Lewis Research Center Cleveland, Ohio
NATIONAL AERONAUTICS AND SPACE ADMINISTRATION
For sole by the Cleoringhouse for Federal Scientific and Technicol Information Springfield, Virginia 22151 - CFSTI price $3.00

ABSTRACT
Using a previously developed computer program for the analysis of the annular gas turbine combustor, the effects of a number of geometric and flow variables on the total pressure loss and airflow distribution were calculated. The results, where comparable, agree very well with previously calculated tubular combustor data. The following a r e significant extensions to the previously available data: (1)an increased range of open hole a rea in the dome, (2) combined effect of reference Mach number and heat release, (3) the use of a l iner hole with a scoop, (4) the use of a l iner in which the cross-sectional a rea varies with length.
ii

ANALYSIS OF TOTAL-PRESSURE LOSS AND AIRFLOW DlSTRlBUTlON
FOR ANNULAR GAS TURBINE COMBUSTORS
by Robert R. Tacina and Jack Grobman
Lewis Research Center
SUMMARY
A previously developed computer program permits the calculation of flow conditions along the l iner and annulus of gas turbine combustors. It does this by solving the equations of momentum, energy, continuity, and state. In this report the effect of a number of geometric and flow variables on the total pressure loss and airflow distribution were calculated using the computer program. The combustor total p ressure loss coefficient and l iner airflow distribution are presented graphically in t e rms of the following dimensionless parameters: (1) ratio of hole area in l iner to reference cross-sectional area, (2) ratio of the l iner cross-sectional area to reference cross-sectional area, (3) ratio of hole area in combustor dome to hole a r e a in l iner, (4) combustor reference Mach number , and (5) ratio of combustor exit to inlet total temperature. The results that w e r e compared agreed well with previously calculated tubular combustor data.
The following are significant extensions to the previously available data: (1) an increased range of open hole a rea in the dome, (2) combined effect of reference Mach numbe r and heat release, (3) the use of a l iner hole with a scoop, (4) the use of a l iner in which the cross-sectional a r ea varies with length.
Other variables that were studied include l iner length, the number of hole rows, axial hole distribution, ratio of l iner open a r e a on outer l iner wall to total l iner open area, combustor outer diameter, and the dilution jet mixing model.
INTRODUCTION
A computer program for the analysis of annular gas turbine combustors w a s developed and reported in references 1 and 2. This computer program can calculate the efficiency of the diffuser, the static and total pressures along the length of the combustor, the airflow distribution, and flame and wall temperatures of the combustor. The purpose

of this report is to use the computer program to obtain the total p ressure loss and fractional l iner airflow distribution for annular combustors and where comparison is valid compare this data with the tubular combustor data f rom reference 3.
Generalized curves are presented from which preliminary estimates of the total p re s su re loss and airflow distribution can be made from the combustor geometry and operating conditions. These calculations do not include the diffuser pressure loss . These curves a r e s imilar to those found in reference 3, with the exception that the range of some of the variables has been extended while other variables have been added.
The total p ressure loss coefficient and fractional l iner airflow distribution are obtained as functions of the following dimensionless parameters: (1)ratio of hole a r e a in l iner to reference cross-sectional area, (2) ratio of the l iner cross-sectional a r e a to reference cross-sectional area, (3) ratio of open hole area in dome to open area in l iner, (4) combustor reference Mach number, and (5) ratio of combustor-exit to inlet total temperature.
Other variables studied for their effect on the total p ressure loss coefficient and fractional l iner airflow distribution were: l iner air entry geometry, l iner length, the number of hole rows, axial hole distribution, hole proportion on inner and outer l iner wall, varying l iner cross-sectional a r ea along the combustor length, film cooling slot area, and the combustor diameter. In addition the effects of various calculation options available in the computer program were studied.
METHOD OF ANALYSIS
The overall total p ressure loss in the gas turbine combustor results mainly from: (1)losses in the diffuser, (2) losses in the mixing of the dilution jets with the l iner gas s t ream, (3) losses from heat addition, (4) losses due to wall friction, and (5) losses in diffusion of annulus air. Only the la t ter four sources of pressure loss a r e considered herein. Data on diffuser losses for annular combustors can be found in references such as reference 4.
The results to be presented pertain to a typical annular gas turbine combustor such as shown schematically in figure 1. The effects of the inlet diffuser and combustor snout are ignored. The inlet airflow is split between flow entering the l iner through holes in the inner and outer annuli and flow entering the l iner through openings in the combustor dome.
The total p ressure loss is defined as the reduction in total p ressure f rom station 3 to station 4 neglecting any effect of the diffuser. The combustor total p ressure loss coefficient is defined as the ratio of this total p ressure loss to the reference dynamic pressure , AP/qref. The symbols a r e defined in appendix A . The total p ressure loss is obtained from a solution of the equations of momentum, energy, continuity, and state for
2

each air entry port along the length of the combustor. Data are also obtained on the l iner airflow distribution, and the static and total pressures in the annuli and l iner along the length of the combustor.
The data were obtained for assigned values of combustor geometry and operating conditions by using the computer program developed in references 1and 2 .
The major assumptions made in the development of the computer program were that the flow is steady-state and one-dimensional and that the primary zone is a s t i r red reactor. A discussion of the assumptions and the methods of calculation is presented in appendix B. A detailed description of the computer program is given in references 1and 2 .
SCOPE OF CALCULATIONS
Combustor Geometry
Combustor total p ressure loss and airflow distribution were obtained as a function of the following dimensionless geometric variables:
(1)Ratio of open a r e a in liner to reference area, AHYliner/Aref (2) Ratio of cross-sectional a r ea of l iner to reference area, AL/Aref (3) Ratio of open a rea in dome to open area in l iner, AH, dome/AH, liner
These calculations were performed for a representative combustor geometry (fig. 1)with the following design assumptions:
(1)The outer casing diameter is 40 inches (1.016 m) and the inner casing diameter is 20 inches (0.508 m) along the entire length of the combustor.
(2) The combustor l iner is 20 inches (0.508 m) long. (3) Liner cross-sectional area is constant along the length of the combustor. (4) The inner and outer annulus a reas are constant and equal along the length of the
combustor. (5) The air entry ports i n the l iner consist of 3/4-inch (0.019-m) diameter flush
holes. (6) The air entry a reas of each hole row a r e equal and the rows a r e spaced equally. (7) There a r e equal air entry areas on the inner and outer l iner wall. (8) There a r e 19 hole rows along the axis of the combustor. (9) Al l airflow enters the combustor liner (zero bypass cooling air at combustor exit). In addition, calculations were performed to study the independent influence on the fol
lowing geometric variables on the results fo r the representative combustor geometry: (1)Liner air-entry-port configuration (2) Liner length (3) Number of hole rows (4) Axial hole distribution
3

--
(5) Proportion of air entry ports on inner and outer l iner wall (6) Varying l iner cross-sectional area along the combustor length (7) Combustor outer diameter
Combustor Flow Variables
The effect of the following flow variables on the total p ressure loss coefficient and airflow distribution were obtained:
(1)Reference Mach number, Mref (2) Ratio of exit to inlet temperature, T4/T3
These calculations were performed on the previously described representative combustor geometry with the following flow assumptions:
(1)The combustor inlet velocity profile is flat. (2) Combustor inlet total temperature is 600' F (588 K). (3) Combustor inlet total p ressure is 150 psia (10,atm).
RESULTS AND DISCUSSION
Combustor Total Pressure Loss Coeff icient
- - . _ -Effect of l iner open hole a r e a and l iner cross-sectional a rea . - Figure 2 shows the variation of AP/qref with the ratio of l iner open hole area to combustor reference area, AH,liner/Aref, fo r values of the ratio of the l iner cross-sectional area to combustor reference a rea , AL/Aref of 0.5, 0.6, 0.7, and 0.85. Figure 2(a) shows that for any given value of AL/Aref, the total p ressure loss coefficient, AP/qref asymptotically approaches a minimum value as AH, liner/Aref increases over a value of about 1 .0 and AP/qref increases rapidly as AH,liner/Aref decreases to values below about 1.0.
Figure 3 shows the variation of AP/qref with AL/Aref for various values of ratio of open a rea in dome to open area in l iner AH, dome/AH, liner. For any given value of
*H, domdAH, l iner the minimum value for the total p ressure loss coefficient, AP/qref shifts to higher values of AL/Aref as the ratio of exit to inlet temperature T4/T3 increases. Figure 3 also shows that f o r a given value of T4/T3, the minimum value of AP/qref shifts to higher values of AL/Aref as AH, dome/AH,Liner is increased. This effect is more pronounced at higher values of T4/T3. Most of the trends described herein were also obtained in the analysis for the tubular combustor in reference 3.
In figures 2, 3, and many of the la ter figures in this report , the curves often end abruptly because the computer program had failed to converge. Failure of the program to converge f o r a given s e t of variables was attributed to a reversal of flow from the
4

l iner to the annulus. The computer program is not capable of handling the case of reverse flow. No attempt was made to find the exact point where the program failed to converge for the following reasons: (1)the data that did converge covered what was felt to be the range of interest and (2) due to limitations in the program the exact point at which the program failes to converge is not very meaningful.
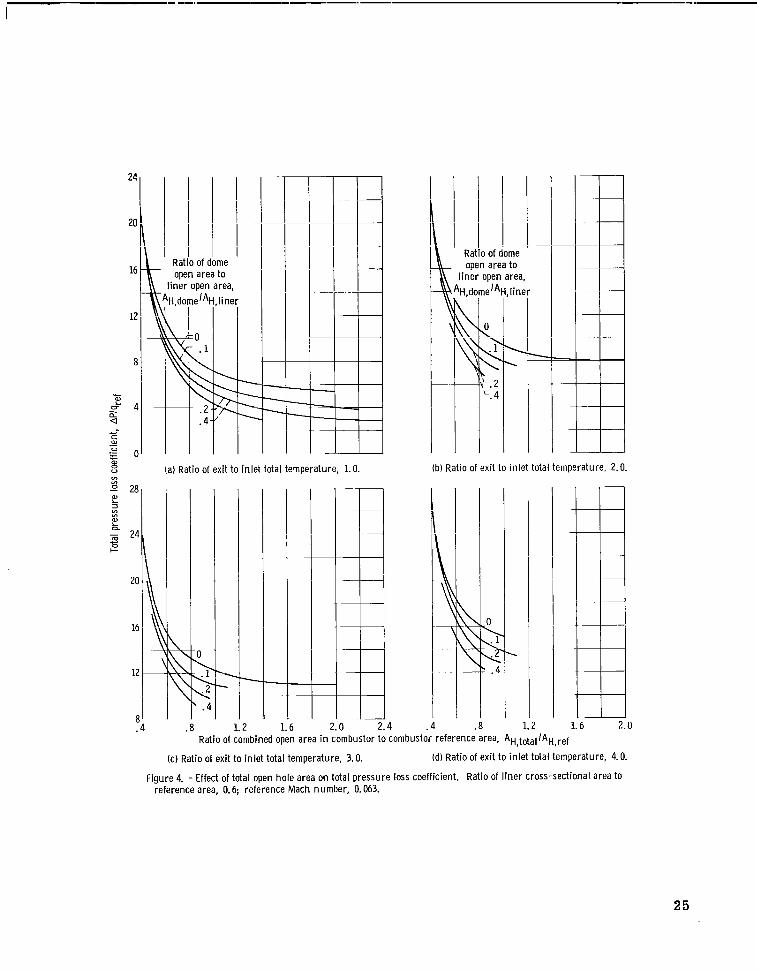
Effect of combustor total open hole a rea and open hole a r e a in combustor dome. . -
The ratio of the combined open hole a r e a in the combustion chamber to the combustor ref
total/A ref including the air entry ports in both the l iner and dome mayerence area A ~ , be expressed by AH,liner/Aref (1 + AH, dome/AH,liner). In figure 4 AP/qref is plotted against A ~ , t o t a l/A ref for various values of AH,dome/AH,liner. For a fixed value of
A ~ ,total/Aref, the total p ressure loss coefficient, AP/qref is reduced as AH, dome/ AH, liner is increased. This effect is partly explained by the fact that in the calculations, the discharge coefficients of air entry ports in the dome are always greater than those for flush air entry ports in the l iner wall. A s indicated in appendix B, the discharge coefficients of air entry ports in the dome were assumed to be 0.6, while the discharge coefficients of air entry ports in the l iner varied over a range from about 0 .1 at the front end of the l iner to about 0.6 at the r e a r of a e l iner.
Effect of combustor reference Mach number. - The effect of reference Mach number,~~
Mref on the total p ressure loss coefficient AP/qref is shown in figure 5. The increase in AP/qref with Mref is shown to be more pronounced at the higher value of the combustor exit to inlet total temperature ratio, T4/T3. For a value of T4/T3 of 1.0, the increase in AP/qref is shown to be negligible for values of AL/Aref of 0. 5 and 0.6 and is shown to be small for a value of AL/Aref of 0.7. For a value of T4/T3 of 3 . 0 , the ra te of increase of AP/qref with Mref is shown to be significant for values of Mref greater than about 0.08 especially at a value of AL/Aref of 0. 5, and the rate of increase of AP/qref with Mref is shown to be least fo r a value of AL/Aref of 0.7.
Effect of heat release. - Figure 6 shows the effect of heat release on the total pressu re loss coefficient AP/qref. AP/qref is plotted against the ratio of exit to inlet total temperature, T ~ / T ~for various ratios of liner cross-sectional a r e a to reference a rea
A d A r e f . The total p ressure loss coefficient increases with T4/T3 at a more rapid rate as AL/Aref decreases. The dependence of the rate of increase of AP/qref with T4/T3 on AL/Aref is shown more clearly in figure 7. Figure 7 shows that the minimum value AP/qref for a given value of T4/T3 shifts to higher values of AL/Aref as the values of T4/T3 a r e increased. These effects are s imilar to those noted previously for the tubular combustor in reference 3.
Effect of l iner air entry geometry. - The results presented in the previous sections of this report w e r e computed using l iner air entry port discharge coefficient data for a 3/4-inch (0.019-m) diameter hole obtained from reference 5. Reference 5 concluded that f o r circular holes, the effects of hole size, and wall thickness on discharge coefficient were small compared to the effect of a correlating flow parameter (Pan- p,)/(Pan - pan).
5

Other factors such as annulus height, boundary-layer thickness, and pressure ' level had a negligible effect on discharge coefficient. Similarly, reference 6 found that the effects of s ize o r shape of flush rectangular holes on discharge coefficient were small . Consequently, the discharge coefficient data for the 3/4-inch (0.019-m) diameter hole used in these computations should be representative for all flush-air-entry ports in the liner. Reference 6 showed that the effect of adding a scoop to a flush hole was to extend the flow range to lower values of the correlating flow parameter (Pan- pL)/(Pan - pan) as seen in figure 8. In figure 8 the discharge coefficient, CP' corrected to a static pressure ratio of unity is plotted against the correlating flow parameter (Pan - pL)/(Pan - pan). The ratio c d / c is plotted against the static pressure ratio, pan/pL (Pan/pL for the holes with scoopsrin figure 9. The discharge coefficient is obtained from Cd = Cp(Cd/Cp).
Figure 10 shows the variation of AP/qref with AH,liner/Aref for two different l iner air-entry geometries. Data for a typical scoop with a value of Af/Ah of 1.378 is compared to the previously shown data for the flush hole. The scoop has the lower value of AP/qref as would be expected from the influence of the discharge coefficient data of figure 8 on the effective a rea of each air-entry geometry.
.Effect of film-cooling slots. - The results described in the previous sections were f o r combustors with air-entry ports for penetrating jets only. Since practical considerations for the cooling of the l iner wa l l require the inclusion of some type of wall jet for film cooling, the effect on AP/qref of adding a typical film cooling slot to the combustor is shown in figure 11. The discharge coefficient data for the cooling slot geometry used in these computations shown in figure 8 was again obtained from reference 6 for a step louver with a height of 0.104 inch (0.0026 m). Reference 6 indicates that the effect of height is small for values of the correlating flow parameter above 1 .0 and that the data used for a height of 0.104 inch (0.0026 m) should be fairly representative of practically sized continuous step louvers.
The cooling slots were assumed to be continuous step louvers with evenly proportioned a rea along the length of the combustor at values of th r fractional length x/L of 0.05, 0.25, 0.50, 0.75, and 0.95. The value for AH,liner includes the face a rea of the cooling slot. The observed decrease in AP/qref as Ac/AH,liner is increased is to be expected due to the higher values for the discharge coefficient of step louvers compared to flush holes.
Effect of l iner length.~ _ _ _- In the preceding results, the l iner length w a s assumed to be 20 inches (0.508 m). The variation of AP/qref with l iner length w a s investigated for values of AL/Aref of 0.6, AH,liner/Aref Of 87 AH, dome/AH, l iner of 0.1, Mref of 0.094, and T4/T3 of 1.0 and 2.5. The values of AP/qref for l iner lengths of 10, 20, and 40 inches (0.254, 0.508, and 1.016 m) a r e 6.86, 6.90, and 6.98, respectively, for exit to inlet total temperature ratio T4/T3 of 1.0, and 10.38, 10.42, and 10.50, respectively, f o r T4/T3 of 2.5. This increase in AP/qref with l iner length is considered to be negligible for the range of variables investigated.
6

Effect of number of hole rows. - The preceding results were all obtained fo r 19 air-entry locations evenly distributed along the length of the combustor. The variation of AP/qref with the number of hole rows for values of exit to inlet total temperature ratio T4/T3 of 1 .0 and 2.5 is shown in figure 12. The effect on AP/qref is negligible f o r about eight or more hole rows. For a lesser number of hole rows, AP/qref increases as the number of hole rows is decreased, because fo r a fewer number of hole rows the expansion loss in the annuli is greater. However, the effect is relatively small.
Effect of axial hole distribution. - The preceding results were obtained for an even distribution of l iner hole area along the length of the combustor. The effect of changing the axial hole distribution from an even distribution to a distribution in which the accumulated open area increased parabolically with the square of the fractional length x/L was investigated for values of AL/Aref of 0.6, AH,iiner/Aref of 0.8, AH, dome/AH,liner of 0.1, Mref of 0.094, and T4/T3 of 1 . 0 and 2.5. The calculated values for AP/qref are slightly higher fo r the parabolic hole distribution. For a value of T4/T3 of 1.0, the values of AP/qref are 6.90 for the even hole distribution and 7.19 for the parabolic hole distribution. For a value of T4/T3 of 2.5, the values of AP/qref are 10.42 for the even hole distribution and 10.59 for the parabolic hole distribution. This variation in AP/qref is attributed to (1)an increase in expansion loss in the annuli and (2) an increase in the annulus wall friction due to higher velocities in the annulus fo r the parabolic hole distribution. In any event, the variation in AP/qref with axial hole distribution is relatively small.
Effect of proportionment of open hole area on inner and outer l iner wall. - In the previous results, the open hole areas on the inner and outer l iner wall were equal and the cross-sectional areas of the inner and outer annuli were equal. Figure 13 shows the variation of AP/qref with the ratio of the open hole area on the outer l iner wall to the l iner open hole area of both walls, AH,liner,outer / A ~ ,l iner fo r values of T4/T3 of 1 .0 and 2.5. The calculations were made for equal inner and outer annuli cross-sectional
l iner above about 0 .5 causes an in-areas. Increasing the value of AH, liner, outer / A ~ , c rease in AP/qref. The effect of shifting the proportion of airflow to the outer annulus without adjusting the cross-sectional area of the outer annulus is s imilar to the effect of increasing AL/Aref. The computation was then repeated by making the ratios of the cross-sectional areas of the outer and inner annuli equal to the ratios of the open hole
areas. For this case, AP/qref was constant for all values of AH, liner, outer lAH, l iner and equal to the minimum value at AH,liner, outer/AH,liner of 0.5.
~ ~ _ _ ~Effect of varying l iner cross-sectional area along length of combustor. - The results discussed thus far in this report have been for combustors with constant l iner cross-sectional area along the length of the combustor. The effect of varying the ratio of l iner cross-sectional area to combustor reference area, AL/Aref, along the length of the combustor on the total p ressure loss coefficient is shown in figure 14. The value fo r AL/Aref was varied stepwise in three axial sections of equal length. Each of the three sections was
7
I

assigned a value of AL/Aref of 0 . 5 , 0.6, o r 0.7 , while holding the average value of AL/Aref for the overall length at 0.6. The c.ross-sectional areas of the inner and outer annuli are equal at any given axial location. These data are compared with the previous data presented for the combustor with constant l iner cross-sectional area. For the combinations of AL/Aref investigated, the total p re s su re loss coefficient is minimized by assigning the lowest values of AL/Aref at the front end of the combustor (AL, l/Aref = 0.5 , AL, 2/Aref = 0.6, AL, 3/Aref = 0.7), while the maximum value of AP/qref was obtained by assigning the highest values of AL/Aref at the front end of the combustor (AL, l/Aref = 0.7, AL, 2/Aref = 0.6, AL, 3/Aref = 0.5). This trend is apparent for all of the cases shown even though the average value of AL/Aref for the overall length of the combustor was held at a constant value of AL/Aref = 0.6. It is interesting to note that the total p ressure loss coefficient is lower for the case with (AL, l/Aref = 0. 5, AL, 2/Aref = 0.6, AL, 3/Aref = 0.7) than that for the constant values of AL/Aref = 0.5 or 0 .6 and that the total p ressure loss is higher fo r the case with (AL, l/Aref = 0.7, AL, 2/Aref = 0.6, AL, 3/Aref = 0 . 5 ) than that for the constant value of AL/Aref = 0.7. These effects are attributed to the increase in the effective area of the air entry holes in the front portion of the l iner as a result of an increase in the correlating flow parameter (fig. 8) as AL, l/Aref is reduced. This is a direct result of the lowering of the velocities in the front portion of the annulus.
An extension of the results shown in the previous section was obtained fo r an annular combustor with conical inner and outer l iner walls as shown in the schematic drawing in figure 15. The cross-sectional a reas of the inner and outer annuli a r e equal at any given axial location. The cross-sectional a r e a of the l iner at the leading edge of the first hole row is designated as AL, 1. The air entry area is evenly spaced along the axis of the l iner with the last hole row positioned at x/L = 0.95. The variation of AP/qref with
l/Aref for various values of T4/T3 is shown in figure 15 for conical l iner wallsA ~ ,compared with cylindrical l iner walls. For the cylindrical case, the value of AL/Aref is constant along the length of the combustor and equal to AL, l/Aref however, fo r the conical case, the value of AL/Aref increases along the length of the combustor from a minimum value of AL, l/Aref at the first hole row to a maximum value of about 0.95 at the last hole row where x/L = 0.95. The effect of wall inclination of the discharge coefficient of l iner air-entry holes was ignored; however, this effect was shown to be small in reference 6. For conical l iner wal ls , the value of AP/qref approaches a minimum as the value of AL, l/Aref approaches zero f o r T4/T3 of 1 . 0 and the value of AP/qref is a minimum at a value of AL, l/Aref of about 0 . 3 for T4/T3 of 3.0 . The value of AP/qref for the conical geometry is lower than that for the cylindrical geometry when
AL, 1IAref is below a value of about 0.5 f o r T4/T3 of 1.0. Similar trends were shown previously in reference 7 for a tubular combustor with a conical l iner. Practical considerations in the designs of the primary zone, and secondary mixing zone usually p rechde the use of conical l iner walls despite the apparently lower value of AP/qref.
8

Effect of combustor outer diameter. - In the preceding results, the combustor outer diameter was assumed to be 40 inches (1.016 m) and the inner diameter was assumed to be 20 inches (0.508 m). Limited calculations were performed for outer diameters of 30 inches (0.762 m) and 60 inches (1.524 m) with the inner diameter held at 20 inches (0.508 m) and combustor length held at 20 inches (0.508 m) for values of AL/Aref of
6, AH liner/Aref Of 8, AH, dome/AH, l iner of 0.1, Mref of 0.904, and T4/T3 of 1 .0 and 8.5. It is to be expected that the only significant effect of increasing the combustor outer diameter is to reduce the total p ressure loss f rom wall friction in the annulus due to the increased values fo r the hydraulic radius of the inner and outer annuli. The calculated values of AP/qref fo r outer diameters of 30, 40, and 60 inches (0.762, 1.016, and 1.524 m) were 6.98, 6.90, and 6.86, respectively, for T4/T3 of 1.0, and 10.49, ’
10.40, and 10.40, respectively, fo r T4/T3 of 2.5. The expected trend is apparent from the results but the change is small .
Combustor A i r f low D is t r ibu t ion
Effect of l iner open hole area. - In figure 16 the combustor airflow distribution is~~
shown as the variation of the fraction of the total airflow passing through the l iner at any given axial location, WL/WT with the fraction of l iner open hole area up to that location, A H / ~ H ,l iner for various values of AH, liner/Aref at a value of AH, dome/AH, liner = 0. At a value of AH,liner/Aref of 0.4, WL/WT is approximately l inear with AH/AH, liner at all positions along the length of the combustor; however, as AH, liner/Aref increases the fraction of air entering the upstream air entry holes in the l iner decreases. The decrease in WL/WT for air entry holes in the upstream portion of the l iner is a result of a proportionately la rger reduction in pressure drop and discharge coefficients for these holes. These trends are similar to those shown previously for the tubular combustor in reference 3.
In figure 17, airflow distribution curves a r e presented for a value of AH, dome/ AH, l iner of 0.1. The combustor dome is located at a value of AH/AH,liner = 0. The fraction of airflow through the combustor dome increases as the value for AH, liner/Aref increases; the increase in flow through the dome is relatively small for values of AL/Aref of 0.5 and 0.6, but becomes greater at values of AL/Aref of 0.7 and 0.85.
Effect of combustor reference Mach number. - The effect of reference Mach number on airflow distribution is shown in figure 18. Increasing the reference Mach number decreases the proportion of flow through the front end of the combustor; however, for the range of Mref studied the effect is shown to be small for a T4/T3 of 3.0 and is shown to be negligible for a T4/T3 of 1.0.
Effect of heat release. - The effect of exit to inlet total temperature ratio T4/T3 on combustor airflow distribution is shown in figure 19 for values of AH, liner/Aref of 0.4
9

--
and 1.0. The decrease in the fraction of airflow entering the l iner through upstream holes
with increasing values of T4/T3 is more pronounced fo r the l a rge r value of AH, liner / Aref. The reduction i n upstream l iner airflow is substantial fo r increases in T4/T3 up to about 3.0 but fur ther increases in T4/T3 f rom 3 . 0 to 4 . 0 result in only small reductions in upstream l iner airflow. The effect of T4/T3 on the airflow distribution decreases as AL/Aref increases f rom 0 .5 to 0.85.
Effect of l iner cross-sectional area. - The effect of AL/Aref on combustor airflow distribution is shown in figure 20 fo r values of AH,liner/Aref of 0.4 and 1.0. At a value of T4/T3 of 1 .0 increasing A
L/Aref f rom 0 .5 to 0 .7 results in a small reduction in
airflow through the upstream l iner holes and a small increase in airflow through the combustor dome; further increases in ALIAref f rom 0 .7 to 0.85 results in a more substantial reduction in airflow through the upstream l iner holes and a l a rge r increase in airflow through the combustor dome. These effects are more pronounced at the l a rge r value of
AH, l ineriAref . At a value of T4/T3 of 3 . 0 , the effect of AL/Aref on airflow distribution is s imilar to that shown for a T4/T3 of 1.0. The effects are more pronounced however, at a T ~ / T ~= 3 . 0 .
Effect of open area in the combustor dome. - The effect of AH,dome/AH,liner on the combustor airflow distribution is shown in figure 21. The values presented for
AH, dome/A H, l iner of 0, 0.1, 0.2, and 0.4 correspond to values of AH, dome/AH, total, (ratio of open area in dome to total open area in dome and l iner) of 0, 0.091, 0.167, and 0.286, respectively. Increasing AH, dome/AH, l iner results in a proportionately la rger increase in airflow through the combustor dome and decrease in airflow through the ups t ream holes. This occurs because as AH,dome /AH, l iner increases, the discharge coefficients become relatively lower for the air entry holes in the upstream portion of the l iner.
Effect of l iner air entry geometry. - The effect of l iner hole geometry on combustor airflow distribution is shown in figure 22 in which data for a 3/4-inch (0.019-m) diameter flush hole are compared with data for a scoop over a flush hole with a value of face a rea to flush hole area of 1.378. As expected from the higher discharge coefficient for the scoop, the fractional airflow through the upstream holes in the l iner increases with the u s e of the scoop; however, this effect is accompanied by a proportional decrease in flow through the dome.
- - ~- _ - length _ - -Effect of a varying l iner cross-sectional area along _ - _ - _of combustor. - The effect of varying the ratio of l iner cross-sectional area to combustor reference area, AL/Aref, along the length of the combustor on the l iner airflow distribution is shown in figure 23. The value for AL/Aref was varied stepwise in three axial sections of equal length. Each of the three sections had a value of AL/Aref of 0. 5, 0.6, o r 0. 7 while holding the average value of AL/Aref for the overall length at 0.6. Liner airflow distribution curves are presented f o r the varying l iner cross-sectional areas that had the highest and lowest total p ressure loss coefficients in figure 8 and are compared with the l iner airflow distri
10

bution of the combustor with a constant l iner cross-sectional area ratio of 0.6. The l iner that had the lowest total p ressure loss coefficient (AL, l/Aref = 0.5, AL, 2/Aref = 0.6, and AL, 3/Aref = 0.7) also had the most nearly l inear airflow distribution. And the l iner with the highest total p ressure loss coefficient (AL, l/Aref = 0.7, A L , 2/Aref = 0.6, and AL, 3/Aref = 0.5) had a l iner airflow distribution deviating most from linearity. The sudden change in slopes in the curves correspond to where the l iner cross-sectional area changes.
The effect of conical inner and outer walls on l iner airflow distribution is shown in figure 24 in which conical l iner walls with values of AL, l/Aref of 0.1, 0.4, and 0.5 are compared with cylindrical l iner walls with an AL/Aref of 0.6. The airflow through the upstream portion of the l iner is higher fo r the conical l iner than the cylindrical l iner and increases slightly with increases in AL, l/Aref. Similar results were reported fo r tubular combustors with conical l iners in reference 7.
Effect of other variables. - The effect of other variables including l iner length, number of hole rows, axial hole distribution, proportionment of hole a rea on inner and outer l iner wall, combustor diameter, and film cooling slots on combustor airflow distribution were analyzed f o r values of AL/Aref of 0.6, AH, liner/Aref of 0.8, AH, dome/AH, liner of 0.1, Mref of 0.094 and T4/T3 of 1 . 0 and 2.5. None of these variables significantly effect airflow distribution.
COMPARISON OF CALCULATED RESULTS FOR ANNULAR
COMBUSTOR WITH TUBULAR COMBUSTOR
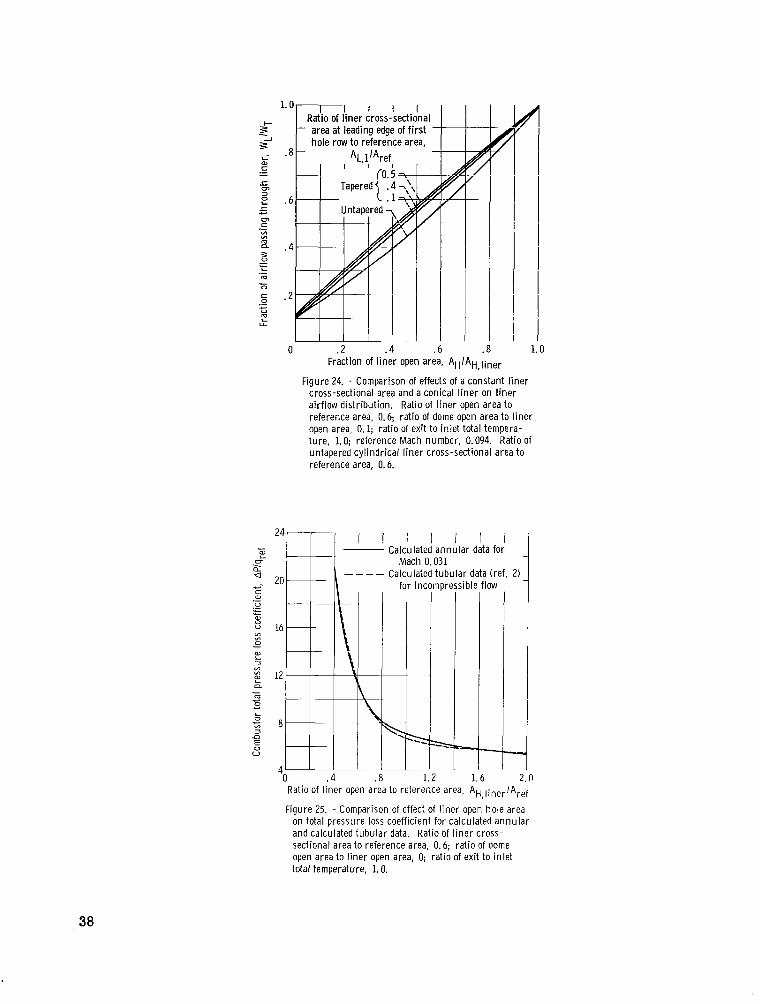
The analytical results obtained for the tubular combustor in reference 3 should be applicable to the annular combustor with parallel walls and flush l iner hole openings if the velocities in the inner and outer annuli are equal at any axial location along the length of the combustor. Slight differences arise from the differences in hydraulic radius and the calculation of expansion losses in the annulus. Selected results from this report are compared in this section with the results of reference 3. The variation of the total press u r e loss coefficient with AH, liner /Aref obtained from analytical data for the annular combustor and tabular combustor (ref. 3) is compared in figure 25. These data are compared for values of AL/Aref of 0.6, no dome flow and isothermal conditions. The calculated annular combustor data were obtained for a value of Mref of 0.031 while the calculated tabular combustor data were obtained for incompressible flow; however, the effect of Mach number at this level is negligible. The data in figure 25 agree quite well.
In figure 26 a comparison is made of the variation of AP/qref with reference Mach number for the two sets of data. The data are compared for an AH,liner/Aref = 0.8, no dome flow and isothermal conditions and AL/Aref of 0.5, 0.6, and 0.7. Figure 26
11

shows that Mref has a grea te r influence on AP/qref f o r the tubular data than for the annular data; however, the agreement between the two sets of data is satisfactory.
In figure 27 a comparison is made of the variation of AP/qref with T4/T3. The data are compared for an AL/Aref of 0.6, AH,lineJAref of 0.8, AH,dome/AH,liner of 0, and for Mref of 0.031 and 0.094 in the annular data and for Mref = 0 (incompressible flow) in the tubular data. Figure 27 shows that the agreement between the two sets of data is satisfactory if the effects of Mref is accounted for.
In figure 28, the airflow distributions are compared for the two se t s of data for AL/Aref of 0.6, no dome flow and isothermal conditions with a value of Mref of 0.063 for the annular data and with a value of Mref of 0.05 for the tubular data. Figure 28 shows satisfactory agreement between the airflow distribution curves for the two se t s of data.
APPLICATION TO COMBUSTOR DESIGN
The combustor total p ressure loss coefficient and airflow distribution for a given annular combustor design may be estimated from the curves provided in the report by determining the dimensionless parameters AH, liner/Aref, AL/Aref, AH, dome/AH, liner,
Mref, and T4/T3. In general, the effects of other variables such as combustor length, number of hole rows, axial hole distribution, and combustor outer diameter, may be ignored without introducing any significant e r r o r s in these estimates. Most of the curves presented pertain to flush air entry ports in the liner. A rough estimate of the total press u r e loss coefficient for l iners with scoops may be obtained from figure 10. The actual total p ressure for a l iner with a given scoop geometry may be obtained by multiplying the ratio of AP/qref for the scoop to AP/qref for the flush hole obtained from figure 10 fo r given values of AH,liner /Aref and T4/T3 by the AP/qref data for flush air entry holes. The influence of film cooling slots on AP/qref may be estimated from figure 11.
The results associated with figure 13 would indicate that the data presented with equal cross-sectional areas for inner and outer annuli should be representative for combustors with unequal cross-sectional areas for inner and outer annuli as long as the hole a r e a in the inner and outer l iner wall is proportional to the respective cross-sectional a r eas of the annuli. For combustors in which l iner cross-sectional area varies along the combustor length the results from figures 14 o r 15 may be used to estimate the total p ressure loss. For annular combustors with greatly varying values of AL/Aref along the length of the combustor, specific computations using the program of reference 1 may be necessary to obtain satisfactory estimates.
12

CONCLUDlNG REMARKS
The calculated total p re s su re loss and airflow distribution data presented in this report for the annular combustor agreed quite well with comparable calculated data from a previous report on the tubular combustor. Some significant extensions to the previously available data are as follows: an increased range of open hole a r e a in the dome, the combined effect of combustor reference Mach number and heat release, the u s e of a l iner hole with a scoop, and the u s e of a l iner in which the cross-sectional area varies with combustor length. The curves presented in this report may be used to make preliminary combustor design estimates. The report has shown that the computer program is a useful tool for making preliminary combustor design estimates, and may be used to obtain more detailed data for specific combustor designs that are not covered by the generalized curves of this report.
Lewis Research Center, National Aeronautics and Space Administration,
Cleveland, Ohio, June 2, 1969, 120-03-00-89-22.
13

APPENDIX A
SYMBOLS
A
AC
Af
AH
AH, dome
AH, l iner
AH, l iner , outer
AH, total
Ah
AL
AL, 1
Aref
AW
‘d
cP CP F
g0 h
Ksw L
M
mfb P
P A P
Ap1-2
14
area
cross- ectional area of annulus
total face area of cooling slots
face area of scoops
l iner open hole a r e a from dome to x
open area in l iner dome including openings in l iner dome and swir ler
open hole area in l iner walls (excluding l iner dome openings)
open hole a r e a in outer l iner wall
total open hole a r e a in both dome and l iner wall
flush area of hole
cross-sectional area of l iner
cross-sectional area of l iner at first hole row
reference area; total combustor cross-sectional area between combustor inner and outer diameter
wetted wall area pe r unit length
orifice discharge coefficient, ratio of measured to theoretical flow through hole
orifice discharge coefficient, corrected for pressure ratio effect
specific heat at constant pressure
Fanning friction factor
gravitational constant, 32.2 ft/sec 2
enthalpy
constant, swir ler equation
length of combustor
Mach number
mass flow rate of fuel burned
total p ressure
static pressure
total p ressure loss across combustor, P4 - P3
change in total p ressure due to heat addition in primary zone

- . ...
*P/qr ef i
qref
Re
T
U
W
wh
wL
wT X
psw
Y a
P
Pst, 3
rp
combustor total p ressure loss coefficient
heat transfer rate
2 ya 2reference dynamic pressure; w2T *ref; 7 ~ 3 ~ r e f
2gpst, 3 Reynolds number
total temperature
velocity
mass flow rate passing through any given passage
mass flow ra te passing through l iner holes
mass flow rate passing through combustor l iner
total mass flow rate passing through combustor
distance along combustor axis measured from dome
angle of swir ler blades
specific heat ratio of air
density
density at station 3 based on static pressure and static temperature
jet angle
Subscripts :
an annulus
dome liner dome
h liner hole
j air jet from liner hole
L liner
sw swirler
ref reference
1 conditions at current axial station just before l iner wall hole
1' conditions at current axial station just after l iner wall hole
2 conditions at axial location downstream of l iner wall hole
3 combustor inlet
4 combustor exit
15

APPENDIX B
CALCULATION PROCEDURES
The combustor total p ressure loss coefficient and l iner airflow distribution are obtained from assigned values of combustor geometry and operating conditions. The static pressure, total pressure, total temperature, and velocity along the inner and outer annuli and along the l iner are also obtained from the calculations. The required input information on combustor geometry includes the coordinates of the inner and outer annuli and the l iner along the combustor length and the size, shape, and location of all air entry ports. The required operating data includes the combustor inlet airflow, inlet total pressure , inlet total temperature, and the fuel-air ratio.
The computation begins with an initial estimate of the fraction of the inlet airflow that passes through the inner and outer annuli and the combustor dome. The static pressure in the primary zone of the l iner is then calculated from the inlet total p ressure and the estimated flow through the combustor dome from the relation
where P, and pan are at the combustor inlet conditions since the diffuser and snout have not been included in these calculations. The discharge coefficient, Cd, for all openings in the combustor dome was assumed to be 0.6. A comparison calculation was made f o r one case using the following relation for flow through a swir ler from reference 8:
. sw q ref sw A;
The constants K,, and psw were assumed to be 1 .3 and 50 degrees, respectively. Equations (1)and (2)were in reasonable agreement on the calculated value for static pressure in the primary zone. In the absence of more precise experimental data for discharge coefficients of combustor dome air entry ports such as swirlers, the use of equation (1)with a c d value of 0.6 was considered to be a reasonable assumption.
The air entry ports in the inner and outer annuli are assigned axial station numbers as shown in figure 29. The airflow, static and total pressures , total temperature, and velocity are obtained at each station from a solution of the equations of momentum, energy, continuity, and state for the inner and outer annuli and the l iner using as the input, conditions from the previous station. Experimental values of discharge coefficients
16

are used from references 5 and 6. The computation of airflow through each air entry port station in the l iner is repeated
stepwise from the front to the rear of the combustor. If the accumulated airflow through the l iner differs f rom the combustor inlet airflow rate, the entire computation is repeated until convergence is obtained using reassigned values for the fraction of inlet airflow that passes through the inner and outer annuli and the combustor dome.
Primary Zo ne Cal cuI ations
The primary zone is assumed to be a s t i r red reactor with a uniform pressure, temperature, and fuel-air ratio, where mixing and burning occur instantaneously. F o r the data presented in RESULTS AND DISCUSSION, the pr imary zone was arbitrari ly defined as ending at the first hole row in the l iner wall. The effect of altering the position of the end of the primary zone was investigated for a representative geometry with fixed operating conditions and hole pattern. These results are presented in figure 30 which shows the variation of the combustor total p ressure loss coefficient with fractional length of primary zone. The total p ressure loss is fairly insensitive for pr imary zone lengths up to one-half the combustor length beyond which the total p ressure loss is greatly reduced. From a consideration of AP/qref only, the choice of pr imary zone length used for the calculations herein appears to be satisfactory.
Part of the airflow entering the first hole row in the l iner is assumed to recirculate into the primary zone. The amount of air that recirculates was calculated from the following empirical expression based on experimental data for a tubular combustor from reference 9.
Fraction of air that recirculates = 0. 5 s in cp (3)
q is the jet angle which is calculated from data correlations and local conditions in the annulus and liner. Recirculation of airflow into the pr imary zone from other l iner air entry stations is assumed to be zero. A limited number of calculations were made in which the fraction of air from the first hole row that recirculates into the primary zone was arbitrari ly chosen instead of using equation (3). Fractions from 0 to 1 . 0 resulted in a negligible change in the total p ressure loss coefficient.
The energy equation for combustion in the pr imary zone has the following form:
Wair,lhair,T1 i-4= (wair,1 + mfb)hprod, T2 (4)
17
1

The subscripts 1 and 2 used here re fer to conditions before and after combustion. Velocity te rms were neglected because the velocity in the primary zone is assumed to be low. The enthalpies of air and combustion products were calculated from the expression:
h = f c p d T
The specific heat of combustion products were corrected for dissociation effects. A fuel lower heating value of 18 540 Btu per pound (4.311X10⁷ J/kg) and a fuel hydrogen-carbon ratio of 0.17 were used.
The total p ressure loss due to heat addition in the pr imary zone is obtained from
Annulus Calculations
The equations of momentum, energy, continuity, and s ta te a r e solved for stepwise increments along the length of both the inner and outer annuli. The calculated total p ressure loss in each annulus includes the effects of the following:
(1)Sudden expansion losses in the annulus occurring downstream of each air entry port in the l iner
(2) Annulus wall friction The total p ressure loss due to sudden expansion is obtained from the following empirical expression :
This expression was obtained from references 1and 2 by fitting the curves from reference 11. The total p ressure loss due to wall friction is obtained from the momentum equation for the annulus using the following:
18

I---- -
where F = 0.0035 + 0. 264Rean, (ref. 11).
Liner Calculations
The momentum equation for the l iner can be written as follows:
wL, 2'L, j , l U j , 1 'Os 50j , l = p ~ , Z A ~ , 2+
g0 Residual
jets
All jets
where cp.J
equals local angle between jet axis and l iner centerline and WL equals mass flow of hot gases (excludes unmixed air in residual jets but includes mass of fuel burned between stations 1and 2).
19
2

Jet M i x i n g
The computer program contains four different jet mixing models to predict the rate at which the penetration o r wall jets mix into the l iner gas s t ream. They are referred to as the mass loss , the equivalent entrainment, the profile substitution, and the instantaneous mixing models. Each of the mixing models is briefly described below; however, a more detailed discussion is contained in references 1and 2.
In the mass loss model a specified fraction of the initial mass flow in the jet is assumed to mix wi th the main gas s t ream for each unit of distance along the jet. The equivalent entrainment model starts with the actual mass flow across the jet at a location downstream of the jet hole. This mass flow minus the initial mass flow through the hole is the mass flow of gases that have been entrained into the jet from the main s t ream. A fraction of this entrained gas is then assumed to mix with the main s t ream. The profile substitution model uses the t ransverse temperature profile of the jet to determine the jet boundary. The boundary is defined to be the points where the temperature of the gases in the jet s t ream is a specified fraction of the temperature at the jet inlet. Air outside the boundary is assumed to have mixed with the main s t ream. The instantaneous mixing model simply has the jets mix instantaneously with the main s t ream.
The use of each of the mixing models requires the use of an assumed constant. The rate of mixing increases as the value of the constant increases . In figure 31, the effect of the various mixing models and the constants on the total p ressure loss coefficient is shown f o r a typical combustor. It is seen that except at the very low values of the constants the effect of the constant and the mixing method has little effect on AP/qref. Instantaneous mixing was assumed to calculate the results presented in this report.
Static and Total P r e s s u r e Var ia t ion Along t h e Length of the Combustor
Figure 32 shows the calculated variation of the static and total pressures in the annulus and l iner along the length of a typical annular combustor. The pressures are expressed as a fraction of the inlet total pressure. The value of the correlation flow parameter for l iner air entry ports as a function of combustor length was calculated from the data of figure 32 and is shown in figure 33. The variation of the flow parameter results in lower discharge coefficients at the upstream end of the combustor liner. Similar trends were found for the tubular combustor in reference 3.
20

REFERENCES
1. Anon. : Computer Program for the Analysis of Annular Combustors. Vol. 1: Calculation Procedures. Rep. 1111-1, vol. l, Northern Research and Engineering Corp. (NASA CR-72374), Jan. 29, 1968.
2. Anon. : Computer Program for the Analysis of Annular Combustors. Vol. 2: Operating Manual. Rep. 1111-2, vol. 2, Northern Research and Engineering Corp. (NASA CR-72375), Jan. 29, 1968.
3. Graves, Charles C. ; and Grobman, Jack S. : Theoretical Analysis of Total-Pressure Loss and Airflow Distribution for Tubular Turbojet Combustors with Constant An&lus and Liner Cross-Sectional Areas. NACA Rep. 1373, 1958.
4. Sovran, Gino; and Klomp, Edward D. : Experimentally-Determined Optimum Geometries for Rectilinear Diffusers with Rectangular, Conical or Annular- Cross-Section. Fluid Mechanics of Internal Flow. Gin0 Sovran, ed., Elsevier Publ. CO., 1967, pp. 270-319.
5. Dittrich, Ralph T. ; and Graves, Charles C. : Discharge Coefficients for Combustor-Liner Air-Entry Holes. I-Circular Holes with Parallel Flow. NACA TN 3663, 1956.
6. Dittrich, Ralph T.: Discharge Coefficients for Combustor-Liner Air-Entry Holes. II-Flush Rectangular Holes, Step Louvers, and Scoops. NACA T N 3924, 1958.
7. Grobman, Jack S. : Comparison of Calculated and Experimental Total-Pressure Loss and Airflow Distribution in Tubular Turbojet Combustors with Tapered Liners. NASA Memo 11-26-583,1959.
8. Knight, H. A. ; and Walker, R. B. : The Component P r e s s u r e Losses in Combustion Chambers. ARC R&M 2987, 1957.
9. Rosenthal, J. : Exploratory Methods for the Determination of Gas Flow and Temperature Patterns in Gas Turbine Combustors. Mech. Eng. Note 235, Aeronautical Research Lab . , Dept. of Supply, Australia, July 1959.
10. Anon. : Flow Through a Sudden Enlargement in a Pipe. Aerodynamics Data Sheet 00.03.29, Royal Aeronautical SOC., London, Jan. 1964.
11. Wilson, Robert E. ; McAdams, W. H. ; and Seltzer, M. : The Flow of Fluids through Commercial Pipe Lines. Ind. Eng. Chem., vol. 14, no. 2, Feb. 1922, pp. 105-119.
21

, Fi rs t hole row of secondary holes -’
Engine cen te r l i ne -~ ~.~ .__
Figure 1. - A n n u l a r combustor cross-section.
22

Ratio iline; .cross-sectional area
cross-sectional area to reference area, to reference area, . AL’Aref
I 1
bI I 1.6 2.0 . 4 .6 .8 1.0.- er open area to reference area, AH,l iner‘Aref
(a) Ratio of exit to in le t total temperature, 1.0. (b) Ratio of exit to in le t total temperature, 2.0.
IYeII 8 II . 4 .8 1.2 . 4 .6 .8””..6
Ratio of l i n e r open 0
area to reference area, A ~ , l i ~ ~ ~ l A ~ ~ f 1.0
(c) Ratio of exit to in le t total temperature, 3.0. (d) Ratio of exit to in le t total temperature, 4.0.
Figure 2. - Effect of l i n e r open area on total pressure loss coefficient. Ratio of open area in dome to open area in l iner , 0.1; reference Mach number, 0.063.
23
c

0) 0 u (a) Ratio of exit t o i n l e t total temperature, 1.0. (b)Ratio of exit t o i n l e t total temperature, 2.0. u?
.50 .60 .70 .80 .90 I
Ratio of l i nea r cross-sectional area to reference area, ALIAref
(c) Ratio of exit to i n le t total temperature, 3.0. ( d ) Ratio of exit to i n le t total temperature, 4.0.
Figure 3. - Effect of l i n e r cross-sectional area on total pressure loss coefficient. Ratio of l i n e r open hole area io reference area, 0.8; reference Mach number, 0.063.
24
........
VI
VI
0
I I I I - -I l l ! !Ratio of dome
(a) Ratio of exit to i n l e t total temperature. 1.0. (b) Ratio of exit to i n le t total temperature, 2.0. VI
2 28 E 3VI
E a. m 24 ‘ Ic c
20
016 \4
0 4\
12 i1 i . 4
2 q.
e . 4 - 1 -
hI\‘1
1.6 2 01.2 2.0 2.4 . 4 . 8 1.2 Ratio of combined open area in combustor to combustor reference area, AH,total/AH,ref
(c) Ratio of exit to i n l e t total temperature, 3.0. (d) Ratio of exit to i n l e t total temperature, 4.0.
Figure 4. - Effect of total open hole area o n total pressure loss coefficient. Ratio of l i n e r cross-sectional area to reference area, 0.6; reference Mach number, 0.063.
25

Figure 5. - Effect of reference Mach number o n total pressure loss coefficient. Ratio of dome open area to l i n e r open area, 0.1; ra t i o of l i n e r open area t o reference area, 0.8.
Ratio of l i n e r open area t o
reference area, AH,liner'Aref
0.4 _ _ _ _ 1.0
1 2 3 4 Ratio of exit to i n le t total
temperature, T4/T3
Figure 6. - Effect of heat release o n total pressure loss coefficient. Ratio of dome open area t o l i n e r open area, 0.1; reference Mach number, 0.063.
26
I

Y)
a
c
3
36
L
3 Y)
i? -g 3c L0VI
r) s 26 0
22
18
14
10
6 5
32
28
24 Ratio of it
- t o i n l e t 1 a l
16 5I
/ 12
f//
5 ..
(a) Ratio of l i n e r open area to reference (b) Ratio of l i n e r open area to reference area, 0.4. area, 0.6.
28
24
16
.6 .8 . 9 . 7 .8 . 9 Ratio of l i n e r cross-sect ional area to reference area, ALIAref
(c) Ratio of l i n e r open area to reference (d) Ratio of l i n e r open area to reference area, 0.8. area, 1.0.
Figure 7. - Effect of heat release o n var iat ion of total pressure loss coeff ic ient w i t h ra t i o of l i n e r cross-sectional area to reference area. Ratio of dome open area to l i n e r open area, 0.1; reference Mach number, 0.063.
27

0.891 JCO. 023)
(0.019) diam
A B
I
04 .06.08 .1 .2
(0.0026) C
I 1
FI1 1 LO 20 j0 80 100
Figure 8. - Effect of flow parameter o n discharge coefficient (corrected t o a static pressure of un i t y ) for var ious hole geometries (figs. f rom refs. 5 and 6). (Sketch dimensions a re in inches (m).)
II
I . O O c
1.04
7
1.08
I
1. 12 1. 16 1.20 1.24 1.28 1.32 1.36 Static pressure ratio, PA/PL
Figure 9. - Pressure-rat io correct ion factor for hole discharge coefficients (fig. f rom ref. 5).
28

----
-- 2 . 5 [
Ratio of exit 20
A I I I to in le t total temperature,
16 T4lT3 _- :: {
12
-1.0 8
4. 4 . 6 . 8 1.0 Ratio of l i n e r open area to
reference area, AH,liner/Aref
Hole geometry
F lush hole 0.75 in. (0.019 m) diam Flush hole 0.75 in. (0.019 m) diam wi th scoop 0.753 in. (0.019 m) wide and 0.891 in. (0.023 m) high; A f / A h = 1.378
Figure 10. - Effect of l i n e r hole geometry on total pressure loss coefficient. L iner cross-sectional area to reference area, 0.6; ra t io of dome open area to l i n e r open area, 0.1; reference Mach number, 0.004.
Ratio of l i ne r Ratio of exit open area to to in let total
reference area, temperature, AH, l i ne r /A re f T4/T3
o.6 } 1.0. 8 -_ .8
0 .1 . 3 Ratio of f i lm cool ing slot area to
l i n e r open area, A C I A ~ , l i n e r
F igure 11. - Effect of f i lm cool ing slct area on total pressure loss coefficient. Ratio of l i n e r cross-sectional area to reference area, 0.6; ra t i o of dome open area t o l i n e r open area, 0.1; reference Mach number, 0.063.
29

W
c
...-
VI
W
0
k a t i o bf exit' t o total i n l e t
20 Number of hole rows
Figure 12. - Effect of number of hole rows o n total pressure loss coefficient. Ratio of l i n e r cross-sectional area to reference area, 0.6; ra t i o of l i n e r open area to reference area, 0.8; ra t i o of dome open area to l i n e r open area, 0.1; re f erence Mach number, 0.094.
16 --L CT'-14 c W." ....-a,
12 v,0-L
39 10 L n-mc c
L2 8
V
. 5 .6 . 7 .8 . 9 1.0 Ratio of open area o n outer l i n e r wal l to open
area of both l i n e r walls, AH,liner,outer/AH,liner
Figure 13. - Effect of increasing fract ion of l i n e r total open ho le area o n outer wal l o n total pressure loss coefficient. Ratio of l i n e r cross-sectional area to reference area, 0.6; ra t i o of l i n e r open area t o reference area, 0.8; ra t i o of dome open area to l i n e r open area, 0.1; reference Mach number, 0.094.
30

c
I
VI
L
0
0
3
24 I
2 0-... a p 2c I
W.-V.-I
W I r 0 . 7 0.6 0.516 . 7 .5
v)0- .5 .7 E .7 .6 v)3 .6 .72 12 .6 .6 -a - . 5 .5 mc 7 c . I L c I - 8 n E 0 V
4 . 6 .8 1.0
Ratio of l i n e r open area to reference area, AH,liner/Aref
la) Ratio of exit to i n le t total temperature, 1.0. (b ) Ratio of exit to i n l e t total temperature, 2.5.
Figure 14. - Comparison of effects of constant and varying l i n e r cross-sectional area on total pressure loss coefficient. Ratio of dome open area to l i n e r open area, 0.1; reference Mach number , 0.094.
A i rA A L , 1
_L
i-..
.2
Ratio of l i n e r cross-sectional area at leading edge of f i r s t hole row to reference area, AL1/Aref
Figure 15. - Comparison of effects of constant l i n e r cross-sectional area and conical l i n e r o n total pressure loss coefficient. Ratio of l i n e r open area to reference area, 0.6; ra t i o of dome open area to l i n e r open area, 0.1; reference Mach number, 0.094.
31

! ! I Ratio of l i n e r I open area to
reference area, AH,liner'Aref
. 4 .6 Fract ion of l i n e r open area, A H I A H , ~ ~ ~ ~ , .
Figure 16. - Effect of l i n e r open ho le area o n l i n e r air f low d i s t r i bu t i on w i t h n o dome flow. Ratio of l i n e r cross-sectional area to reference area, 0.6; ra t i o of dome open area to l i n e r open area, 0; ra t i o of exit to i n le t total temperature, 1.0; reference Mach number, 0.063.
32

m Y)
-- 5 0 I 1a L
5 (a) Ratio of l i n e r cross-sectional area to reference .-c area, 0.5. VI
1.01
I I t(b) Ratio of l i n e r cross-sectional area to reference
area, 0.6.
0 . 4 .6 . a 1.0 I0 .2 . 4 .6 .8 1.0 Fract ion of l i n e r open area, A H I A H , ~ ~ ~ ~ ~
( c ) Ratio of 1 i . d cross-sectional area to reference (d) Ratio of l i n e r cross-sectional area to reference area, 0.7. area, 0.85.
Figure 17. - Effect of l i n e r open ho le area o n l i n e r air f low distr ibut ion w i t h dome flow. Ratio of dome open area to l i n e r open area, 0.1; ra t i o of exit to i n le t total temperature, 1.0; reference Mach number, 0.063.
33

Ratio of l i n e r open area to
.eference area,
0 . 2 .4 .6 1.0 0 . 2 .4 .6 .8 Fraction of l i n e r open area, AHIAH,,~, ,~~
(a1 Ratio of exit to i n l e t total temperature, 1.0. (b) Ratio of exit to i n l e t total temperature, 3.0.
Figure 18. - Effect of reference Mach number on l i n e r air f low distr ibut ion. Ratio of l i n e r cross-sectional area to reference area, 0.6; ra t i o of dome open area to l i n e r open area, 0.1.
34
1.0

----
(a) Ratio of l i n e r cross-sectional area to reference area, 0.5.
.*#I I
0 . 6 1.0 0 Fraction of l i n e r open area,
(c) Ratio of l i n e r cross-sectional area to reference area, 0.7.
Ratio of l i n e r open area to
reference area, AH, l i n e r l A r e f
0.4 1.0
k a t i o bt e x i i -to in le t total
temperature,
(b l Ratio of l i n e r cross-sectional area to reference area, 0.6.
I
. 2 . 4 .6 .a 1.0 A H I A H , , ~ ~ ~ ~
(d) Ratio of l i n e r cross-sectional area to reference area, 0.85.
Figure 19. - Effect of heat release on l i n e r air f low distr ibut ion. Ratio of dome open area to l i n e r open area, 0.1; reference Mach number, 0.063.
35

Ratio of l i n e r open area to
reference area, AH,liner'Aref
0.4_ _ - _ 1.0
0 . 2 . 4 . 6 . 8 0 . 2 .4 . 6 .8 Fraction of l i n e r open area, A H I A H , ~ ~ ~ ~ ~
(a) Ratio of exit t o i n l e t total temperature, 1.0. (b) Ratio of exit to i n l e t total temperature, 3.0.
Fiqure 20. - Effect of l i n e r cross-sectional area o n l i n e r air f low distr ibut ion. Ratio of dome open area t o l i n e r open area, 0.1; reference Mach number, 0.063.
0 .4 .6 .8 1 Fraction of l i n e r open area, AH/AH,liner
Figure 21. - Effect of open area in dome o n l i n e r air f low distr ibut ion. Ratio of l i n e r cross-sectional area t o reference area, 0.6; ra t i o of l i n e r open area to reference area, 0.8; ra t i o of exit t o i n l e t total temperature, 1.0; reference Mach number, 0.063.
36
1.0

----
3
m
v)
f ~
4 -
Ratio of exit to i n le t total temperature,
T4lT3 2.5 1.0 {
Hole geometry
F lush hole 0.75 in. (0.019 m) diam F lush hole 0.75 in. (0.019 m) diam w i t h scoop 0.753 in.
0.891 in. (0.023 m) high; $ / A h = 1.378 '
. 2 . 4 .6 8 1.0 Fract ion of l i n e r open area, AH/AH,iiner
Figure 22. - Effect of l i n e r hole geometry on l i ne r air f low d is t r ibu t ion . Ratio of l i ne r cross-sectional area to reference area, 0.6; ra t io of dome open area to l i n e r open area, 0.1; ra t io of liner open area to reference area, 0.8; reference Mach number, 0.094.
cor0
L . 6 S c
.-c v)m
.2.cV
0 . 2 . 4 .6 .8 1.0 Fract ion of l i n e r open area, A H / A H , I ~ ~ ~ ~
Figure 23. - Comparison of effect of a vary ing l i ne r cross-sectional area and a constant l i n e r cross-sect ional area on l i n e r air f low distr ibut ion. Ratio l i n e r open area to reference area, 0.8; ra t io of dome open area to l i n e r open area, 0.1; rat io of exit to i n le t total temperature, 1.0; reference Mach number, 0.094.
37
0
[r
c
v) 0
al
3
a
. o
.8
6
4
2
0
24
-W L
CT--.
G- 20-W." ._ L
W
16 v) -L
v)2 12 --m 0 c L 0z 8 3n
E V
n
. 2 .4 . 6 .8 Fraction of l i n e r open area, A H I A H , ~ ~ ~ ~ ~
Figure 24. - Comparison of effects of a constant l i n e r cross-sectional area and a conical l i n e r o n l i n e r air f low distr ibut ion. Ratio of l i n e r open area t o reference area, 0.6; ra t i o of dome open area to l i n e r open area, 0.1; ra t i o of exit to i n le t total temperatu re , 1.0; reference Mach number, 0.094. Ratio of untapered cy l i nd r i ca l l i n e r cross-sectional area to reference area, 0.6.
I I I I I Calculated a n n u l a r data for
Mach 0.031 Calculated t u b u l a r data (ref. 2)
for incomoressible flow
I
. 4 .8 1.2 1.6 2. n Ratio of l i n e r open area to reference area, AH,liner/Aref
Figure 25. - Comparison of effect of l i n e r open ho le area o n total pressure loss coefficient for calculated a n n u l a r and calculated tubu la r data. Ratio of l i n e r cross-sectional area to reference area, 0.6; ra t i o of dome open area to l i n e r open area, 0; ra t i o of exit to i n l e t total temperature, 1.0.
38
1.0

Ratio of l i n e r cross-sectiona I area,
to reference area,
Calculated data
A n n u l a r - _ - - Tubu la r (ref. 3)
Reference Mach number, Mref
Figure 26. - Comparison of effect of reference Mach number on total pressure loss coefficient for calculated a n n u l a r and calculated t u b u l a r data. Ratio of l i n e r open area to reference area, 0.8; ra t i o of dome open area to l i n e r open area, 0; ra t i o of exit to i n le t total temperature, 1.0.
1 2 3 4 Ratio of exit to i n le t total
temperature, T4/T3
Figure 27. - Comparison of effect of heat release o n total p ressu re loss coefficient for calculated a n n u l a r and calculated t u b u l a r data. Ratio of l i n e r cross-sectional area to reference area, 0.6; ra t i o of l i n e r open area t o reference area, 0.8; ra t i o of dome open area t o l i n e r open area, 0.
39

0 .2 . 4 .6 . 8 1.0 Fract ion of l i n e r open area, AH/AH,liner
Figure 28. - Comparison of effect of l i n e r open ho le area o n l i n e r air f low d i s t r i bu t i on for calculated a n n u l a r and calculated t u b u l a r data. Ratio of l i n e r cross-sectional area to reference area, 0.6; ra t i o of dome open area to l i n e r open area, 0; ra t i o of exit to i n le t total temperatu re , 1.0; a n n u l a r reference Mach number, 0.063; t u b u l a r reference Mach number, 0.05.
A n n u l u s
A i r f l ow $ L ine r
A n n u l u s ! ! II i I
Axial station 1 1' 2
F igu re 29. - A i r e n t r y ports. (Axial stations are located at f r o n t edge of hole rows: 1refers to c u r r e n t axial station; t h e p r ime refers to a station immediately downstream of holes where a i r i s assumed to undergo sudden expansion; 2 i s f ron t edge of next ho le row. 1
40

In
----
I
10 , .
Ratio of exit \ to in let total - I-A I I
temperature, \ - 9 -Ap-C T4'T3 \
Ratio of exit -t o in le t total 0 temperature,- -0) 9- T4'T3 3 v) 1.0 : r - 2.5
lent entrainment
5 \
I I I I \ I . 2 . 4 .6 .8 1.0 M ix ing model constant
Figure 31. - Effect of mixing model and mixing model Fractional distance along l iner, x l L constant on total pressure loss coefficient. Ratio
Figure 30. - Effect of defined pr imary zone length on total of l i ne r cross-sectional area to reference area, 0.6;
pressure loss coefficient. Ratio of l i ne r cross-sectional rat io of l i ne r open area to reference area, 0.8; rat io
area to reference area, 0.6; rat io of l i n e r open area to of dome open area to l i ne r open area, 0.1; reference
reference area, 0.8; rat io of dome open area to l i ne r Mach number, 0.094.
open area, 0.1; reference Mach number, 0.094.

-----
0 c
Fractional distance along l i ne r , xll
Figure 33. - Variat ion in flow parameter along combustor Ratio of l i n e r cross-sectional area to reference area, 0.6; ra t i o of l i n e r open area t o reference area, 1.0; ra t i o of l i n e r open area to reference area, 0.1; ra t i o of dome open area to l i n e r open area, 0.1; reference Mach number, 0.094.
1.00
.96
.92
.88
- 3.0
Figure 32. - Var iat ion in total and static pressures in a n n u l u s and l i n e r along combustor axis, (Static and total pressures along length of combustor referenced to i n le t total pressure.) Ratio of l i n e r cross-sectional area to reference area, 0.6; ra t i o of l i n e r open area to i e fe rence area, 1.0; ra t i o of dome open area to l i n e r open area, 0.1; reference Mach number, 0.094.
NASA-Langley, 1969 - 33 E-4904

AERONAUTICSNATIONAL AND SPACE ADMINISTRATION
WASHINGTON,D. C. 20546
OFFICIAL BUSINESS FIRST CLASS MAIL
POSTAGE A N D FEES PAID NATIONAL AERONAUTICS A N D
SPACE ADhIINISTRATION
POSTMASTER:
“The aerotaniitical and space activities of the United States ~hnllbe coizdiicted so as t o ‘ con t~ ibu te. , , t o the expansiofa of h?inia?zknoivledge of pheaonieian in. the afniosphere a d space. T h e Ad t ih i s t ra t ion shall p r f vide for the widest practicable aizd appropriate disseniiaalioii of information cosceruhg its actizjjties nizd the ? . e S 2 4 h thereof.”
I . ’ -NATIONALAERONAUTICSAND SPACE ACT OF 1958
If Undeliverdble (Section 15s Postal Manual) Do Not Return
NASA SCIENTIFIC AND TECHNICAL PUBLICATIONS
TECHNICAL REPORTS: ‘Scientific and technical information considered important, complete, and a lasting contribution to existing knowledge.
TECHNICAL NOTES: Information less broad in scope but nevertheless of importance as a contribution to existing knowledge.
TECHNICAL MEMORANDUMS: Information receiving limitqd distribution because of preliminary data, security classification, or other reasons.
CONTRACTOR REPORTS: Scientific and technical information generated under a NASA contract or grant and considered an important contribution to existing knowledge.
TECHNICAL TRANSLATIONS: Information published in a foreign language considered to merit NASA distribution in English.
SPECIAL PUBLICATIONS: Information derived from or of value to NASA activities. Publications include conference proceedings, monographs, data compilations, handbooks, sourcebooks, and special bibliographies.
TECHNOLOGY UTILIZATION PUBLICATIONS: Information on technology used by NASA that may be of particular interest in coinmercial and other non-aerospace npplication7. Publications include Tech Briefs, Tec~lnologyUtilization R~~~~~~and N ~ ~ ~ ~ , and Technology Surveys.
Details on the availability of ihese publications may be obtained from:
SCIENTIFIC AND TECHNICAL INFORMATION DIVISION
NATIONAL AERONAUTICS AND SPACE ADMINISTRATION Washington, D.C. 20546