analysis of the effectiveness of passive item-level rfid
TRANSCRIPT

Analysis of the Effectiveness of Passive Item-level RFID tags Utilized in
Inventory Counts
By: Josh Gilbert
Advisor: Tali Freed
Cal Poly San Luis Obispo
Spring 2011

Spring 2011 Senior Project Josh Gilbert
2
Executive Summary
In an effort to reduce the amount of manual labor associated with physical inventory
counts of large warehouse type environments, a study was performed analyzing the
effectiveness of item-level RFID to automate counts. Products were selected based off of
certain characteristics and tagged with passive RFID tags. A design of experiment was
developed specific to each product that best related to actual in store environments.
Experiments were conducted in the Poly GAIT lab. Certain levels of analysis were performed
and conclusions made specific to each product under question.

Spring 2011 Senior Project Josh Gilbert
3
Table of Contents
Section Page Executive Summary 2 Introduction 5 Problem Statement 9 Background 10 Literature Review 17 Design 28 Methods 39 Results 44 Economics 49 Discussion 52 Conclusion 54 Bibliography 56 Appendix 60

Spring 2011 Senior Project Josh Gilbert
4
Table of Figures
Title Page Table 1.1 – Bi-annual Inventory Count Total
Costs ($/yr)
7
Picture 2.1 – RFID system diagram 10
Equation 2.1 – Read Reliability for current
projects application
11
Figure 2.1 – Shadowing Effect 12
Figure 2.2 – Liquid RF Absorption 12
Figure 2.3 – Metal RF Reflection 12
Figure 2.4 – Examples of Case and Item level
tagging
13
Picture 3.1 – Circular Polarized Antenna 25
Picture 3.4 – Shampoo sales floor display state 32
Picture 3.5 – Jeans display state on sales floor 33
Picture 3.6 – DVDs display method on sales
floor
34
Figure 3.1 – Common display method of
uniformly repeated segments
35
Figure 3.2 – Uniformly repeated display
segment acting as testing model
35
Figure 3.3 – Stationary antenna representation 36
Figure 3.4 – Hovering Antenna representation 36
Table 3.1 – Summary of factors and levels
presented in study
37
Picture 4.1 – Tag location for jeans 39
Picture 4.2 - Testing model for jeans 39
Picture 4.3 – Selected location for tags for
DVDs
40
Picture 4.4 – Testing Model for DVDs 40
Picture 4.5- Selected tag location for Shampoo 41
Picture 4.6 – Testing model for shampoo 41
Picture 4.7 – Picture of testing setup and
equipment
42
Table 5.1 – Summary Data 44
Table 6.1 – System Cost Breakdown 49
Table 6.2 – Complied direct auditing labor
costs
50
Table 6.3 – Total yearly costs associated with
inventory audits
50
Table 6.4 – Savings calculation 51

Spring 2011 Senior Project Josh Gilbert
5
Introduction
Radio Frequency Identification (RFID) is a constantly growing technology that continues to
gain more and more attention from potential industry applications. Currently many
organizations are pushing for implementation of RFID, the leader being Wal-Mart. Wal-Mart is
scheduled to start its second stage of RFID implementation by switching their focus from pallet
based tagging to item-level tagging. [1] Their hopes are to increase the inventory control of high
density products. Another major organization attempting to utilize RFID’s capabilities is the
Department of Defense. The Department of Defense contains one of the largest operational
data-bases to date. Their hope is RFID implementation can increase their control over the
transport of assets. Despite all the potential application of RFID technology there remains one
constant, no matter what the application of RFID; RFID is a business decision. If the benefits
don’t outweigh the costs, then implementation is not justified.
As identified by Lee and Dozer 2007, there lies a ‘credibility gap’ of the value of RFID thus
calling for further application modeling. [12] In order for potential users to justify the
implementation of RFID, there must be a proven case that the presented need can be satisfied
by an RFID system. Many of the applications that fall in the realm of RFID lie in inventory
management.
Inventory management is a driving force for all product based companies and it continues
to plague many. Its purpose is simple; cost effectively storing product on hand to fulfill a future
customer demand. Inventory management policies vary depending on product type and
desired customer service levels, but one factor is universal, its impact on operating costs; the

Spring 2011 Senior Project Josh Gilbert
6
more inventory the higher the cost. The following are some associated inventory costs: cost of
holding inventory, cost of placing an order and cost of shortage. [24]
Inventory management systems are comprised of managing and/or locating products and
their goal is to do this cost effectively. Many companies struggle with this philosophy and
experience high levels of inventory record inaccuracies (IRI), leading to a substantial loss of
sales, missed service level targets and suboptimal retail performance [2]. One of the many
functions with in inventory control systems is the act of inventory count. This is done
periodically throughout an inventory lifecycle and its frequency depends on a company’s policy.
Its purpose is supervision of supply, storage and accessibility of items in order to ensure an
adequate supply without excessive oversupply. [3] Companies will use this data in forecasting,
product assortments and to replenish store shelves. For most companies this is an extensive
manual task comprising of an employee workforce physically counting individual SKUs.[4]
Given this, for large warehouse/retail type environments with variety of products, this task can
be very costly in terms of hourly wages and in costs of human error. In a study performed at a
large retail corporation. It was found 65% of store locations experienced IRIs of 35% per SKU.
[4] Thus it is imperative that inventory counts are efficient and accurate. One way to move
towards improvement is through RFID technology.
Founded in 1983 in Seattle Washington, Costco is an organization that focuses on selling a
variety of products at low cost and high volume. Costco retail locations offer a diverse product
environment supplied by a select few suppliers. Their large batch orders require managers’
ordering amounts to be accurate in order to ensure a profit in the low margins of a retail

Spring 2011 Senior Project Josh Gilbert
7
environment. The ability to do this is centered on the ability to operate an efficient and
accurate inventory management system.
Twice a year Costco performs a physical inventory count of the warehouse sales floor.
This process comprises of approximately 200 employees walking the warehouse floor manually
counting items in a 4 hour period. Having participated in this operation I came up with two
observations:
1. This process is extremely manual
2. Counts are often a best guess
Being so manually intensive, this process also comes with a price. The yearly cost for the
inventory count is roughly $30,000. (Reference Table 1.1)
Table 1.1 – Bi-annual Inventory Count Total Costs ($/yr)
In the context of Costco’s inventory management system, item-level RFID implementation
would be viable solution to assist inventory counts if every SKU tagged with RFID could be
accurately accounted for on a consistent basis. Given the sheer number of SKUs on the sales
floor and the requirement for universal RIFD tagging, thousands of tags would be required.
Given this fact passive tags are the most cost effective choice. But there are numerous
limitations to the effectiveness of item-level passive RFID that greatly affects a tag’s readability:
Source Cost ($)
Direct Labor 14,000
Indirect Labor 1,000
Total ($) 15,000
Total Yrly Costs ($) 30,000
Inventory Count Cost Analysis

Spring 2011 Senior Project Josh Gilbert
8
shadowing, RF wave absorption/reflection, and tag durability, all levels of which vary from
product to product. In order to justify RFID implementation extensive application modeling is
required. The following report outlines a specific application for RIFD.

Spring 2011 Senior Project Josh Gilbert
9
Problem Statement
In order to reduce the amount of manual labor associated with inventory auditing, I will
determine if passive item level RFID tagging is a viable tool for taking physical inventory counts.
Two different scanning procedures are considered and their ability to perform in
environments that incorporate a factorial design. At completion of data collection, analysis is
performed and recommendations are made for the use of passive RIFD in item-level tagging
and its ability to provide accurate sales floor inventory counts. With results analyzed and
recommendations stated, an economic analysis is performed
In order to perform previously mentioned analysis, I will define a design of experiment
that will introduce two to three factors to my testing that will help conclude the effectiveness
of item-level RFID. Once I obtain my results I will determine if item level RFID tagging in a
Costco like environment is accurate enough to justify implementing a similar system.
The scope of this project is to test the capability of item level RFID implementation to
assist inventory count into a sales floor environment based off of Costco for a select few
product categories. I will not develop an operating RFID system to be implemented or any
prototype of the sort.
Spring 2011
Background
The following section summarizes some basic background of RFID technology and applications
for Costco.
RFID
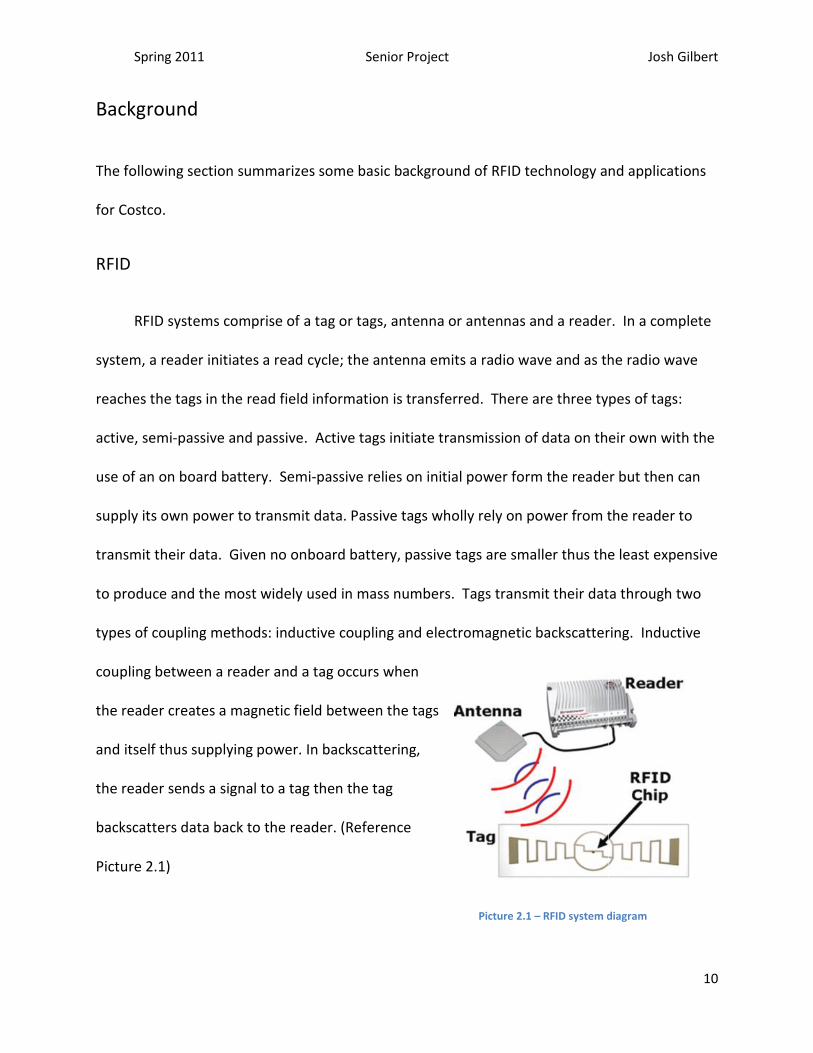
RFID systems comprise of a tag
system, a reader initiates a read cycle; the antenna emits a radio wave and as the radio wave
reaches the tags in the read field information is transferred. There are three types of tags:
active, semi-passive and passive. Active tags initiate transmissi
use of an on board battery. Semi
supply its own power to transmit data. Passive tags wholly rely on power from the reader to
transmit their data. Given no onboa
to produce and the most widely used in mass numbers. Tags transmit their data through two
types of coupling methods: inductive coupling and electromagnetic backscattering. Inductive
coupling between a reader and a tag occurs when
the reader creates a magnetic field between the tags
and itself thus supplying power. In backscattering,
the reader sends a signal to a tag then the tag
backscatters data back to the reader. (Reference
Picture 2.1)
Senior Project
The following section summarizes some basic background of RFID technology and applications
of a tag or tags, antenna or antennas and a reader. In a complete
system, a reader initiates a read cycle; the antenna emits a radio wave and as the radio wave
reaches the tags in the read field information is transferred. There are three types of tags:
passive and passive. Active tags initiate transmission of data on their own with the
use of an on board battery. Semi-passive relies on initial power form the reader but then can
supply its own power to transmit data. Passive tags wholly rely on power from the reader to
transmit their data. Given no onboard battery, passive tags are smaller thus the least expensive
to produce and the most widely used in mass numbers. Tags transmit their data through two
types of coupling methods: inductive coupling and electromagnetic backscattering. Inductive
etween a reader and a tag occurs when
the reader creates a magnetic field between the tags
and itself thus supplying power. In backscattering,
the reader sends a signal to a tag then the tag
reader. (Reference
Picture 2.1 – RFID system diagram
Josh Gilbert
10
The following section summarizes some basic background of RFID technology and applications
reader. In a complete
system, a reader initiates a read cycle; the antenna emits a radio wave and as the radio wave
reaches the tags in the read field information is transferred. There are three types of tags:
on of data on their own with the
passive relies on initial power form the reader but then can
supply its own power to transmit data. Passive tags wholly rely on power from the reader to
rd battery, passive tags are smaller thus the least expensive
to produce and the most widely used in mass numbers. Tags transmit their data through two
types of coupling methods: inductive coupling and electromagnetic backscattering. Inductive
RFID system diagram

Spring 2011
A big determinant to the success of an RFID is the environment in which it operates.
Environments that contain metal,
as metals and liquids reflect and absorb RF waves and multiple tags create a shadowing effect
all limiting the readability of RFID tags. [5]
RFID technology is a constantly growing field with e
of industries. Studies have been performed proving RFID performance in numerous
environments and applications as well as potential benefits to reducing costs after
implementation. Furthermore, studies performed explor
of tag types and orientations in conjunction with the RFID system’s read rate’s abilities and
accuracies. Read reliability is defined as the number of tags that can be read in a given time
period. [6] For this projects application read reliability will be defined as: (Reference Equation
2.1)
Equation 2.1 – Read Reliability for current projects application
The application of RFID could give the ability for large retailers, like Costco, to automate
many of the inventory control processes
Senior Project
A big determinant to the success of an RFID is the environment in which it operates.
Environments that contain metal, liquid and multiple tags are suboptimal for RFID applications
as metals and liquids reflect and absorb RF waves and multiple tags create a shadowing effect
all limiting the readability of RFID tags. [5]
RFID technology is a constantly growing field with endless applications with in a number
of industries. Studies have been performed proving RFID performance in numerous
environments and applications as well as potential benefits to reducing costs after
implementation. Furthermore, studies performed explore multiple items tagged with a variety
of tag types and orientations in conjunction with the RFID system’s read rate’s abilities and
is defined as the number of tags that can be read in a given time
ts application read reliability will be defined as: (Reference Equation
Read Reliability for current projects application
The application of RFID could give the ability for large retailers, like Costco, to automate
ry control processes.
Josh Gilbert
11
A big determinant to the success of an RFID is the environment in which it operates.
liquid and multiple tags are suboptimal for RFID applications
as metals and liquids reflect and absorb RF waves and multiple tags create a shadowing effect
ndless applications with in a number
of industries. Studies have been performed proving RFID performance in numerous
environments and applications as well as potential benefits to reducing costs after
e multiple items tagged with a variety
of tag types and orientations in conjunction with the RFID system’s read rate’s abilities and
is defined as the number of tags that can be read in a given time
ts application read reliability will be defined as: (Reference Equation
The application of RFID could give the ability for large retailers, like Costco, to automate

Spring 2011
Environment Limitations
Due to the physics of RFID, there are many limitations to readability when there are
multiple tags in a system. Shadowing is an effect caused by one tag directly in the path of the
RF wave of another tag. Subsequently the tag fal
being accounted for. (Reference Figure 2
occurring when there are liquids or metals present in the read field. RF waves cannot pass
through metal thus they are reflected off into the environment and liquids absorb RF waves.
This poses a major problem for any retail type environment as many products contain both
metal and liquid in the product itself as well as the
waves generally have no problem passing through other materials. As a result RFID systems
must be designed specifically for its applications and environments.
Figure 2.1 – Shadowing Effect Figure
Senior Project
Due to the physics of RFID, there are many limitations to readability when there are
multiple tags in a system. Shadowing is an effect caused by one tag directly in the path of the
Subsequently the tag falls in the shadow of the previous
. (Reference Figure 2.1) Reflection and absorption is a phenomenon
occurring when there are liquids or metals present in the read field. RF waves cannot pass
metal thus they are reflected off into the environment and liquids absorb RF waves.
This poses a major problem for any retail type environment as many products contain both
metal and liquid in the product itself as well as the packaging. (Reference Figure 2.2 and 2
waves generally have no problem passing through other materials. As a result RFID systems
must be designed specifically for its applications and environments.
wing Effect Figure 2.2 – Liquid RF Absorption Figure 2.3 – Metal RF Reflection
Josh Gilbert
12
Due to the physics of RFID, there are many limitations to readability when there are
multiple tags in a system. Shadowing is an effect caused by one tag directly in the path of the
ls in the shadow of the previous tag thus not
.1) Reflection and absorption is a phenomenon
occurring when there are liquids or metals present in the read field. RF waves cannot pass
metal thus they are reflected off into the environment and liquids absorb RF waves.
This poses a major problem for any retail type environment as many products contain both
re 2.2 and 2.3) RF
waves generally have no problem passing through other materials. As a result RFID systems
Metal RF Reflection

Spring 2011
EPC
The major enabler of RFID applications is the Electronic Product Code (EPC). This gives a
unique identifier to any and every
SKUs of the same product category and type is essential for the benefits that RFID can offer.
Item Level vs. Case Level
Wal-Mart is currently in the process of implementing their second stage of R
implementation. [1] They are switching their focus from case level RFID tagging used for
control throughout the supply chain, to item level tagging. Their hopes are to increase the
inventory control of products with high product variety like clothing
actions based off a study done at the University of Arkansas that found item
increased product categories with high product variety by 30%, to 95% from 65%. [8] An
example of case level and item level tagging ca
Figure 2.4 – Examples of Case and Item level tagging
Case Level
Senior Project
The major enabler of RFID applications is the Electronic Product Code (EPC). This gives a
unique identifier to any and every object in the world. [7] The ability to distinguish between
SKUs of the same product category and type is essential for the benefits that RFID can offer.
Mart is currently in the process of implementing their second stage of R
implementation. [1] They are switching their focus from case level RFID tagging used for
control throughout the supply chain, to item level tagging. Their hopes are to increase the
inventory control of products with high product variety like clothing. They are taking these
actions based off a study done at the University of Arkansas that found item-level RFID tagging
increased product categories with high product variety by 30%, to 95% from 65%. [8] An
example of case level and item level tagging can be seen in figure 2.4. (Reference Figure 2
Examples of Case and Item level tagging
Case Level Item Level
Josh Gilbert
13
The major enabler of RFID applications is the Electronic Product Code (EPC). This gives a
object in the world. [7] The ability to distinguish between
SKUs of the same product category and type is essential for the benefits that RFID can offer.
Mart is currently in the process of implementing their second stage of RFID
implementation. [1] They are switching their focus from case level RFID tagging used for
control throughout the supply chain, to item level tagging. Their hopes are to increase the
. They are taking these
level RFID tagging
increased product categories with high product variety by 30%, to 95% from 65%. [8] An
figure 2.4. (Reference Figure 2.4)
Item Level

Spring 2011 Senior Project Josh Gilbert
14
Economics
Currently one of the major impediments of RFID systems is implementation costs. In an
RFID system it is necessary to have a reader and a computer. The reader used in this
experiment costs $1,800 [9] and netbook computers starting from $399. [10] Another major
impact cost is tags. The total cost of tags is heavily dependent on the amount of tags bought.
Currently tag prices are based off of economy of scale. The tags used, UHF passive Sirit 674,
costs $.10 per tag. Antenna’s price ranges given the type.
Inventory Application
Applications for RFID at Costco are endless. As RFID technology and systems advance,
Costco will potentially be able to track every single item in and out of the store solely via RFID.
But current RFID systems do not support this extent of application and Costco cannot afford to
be leaders in RFID implementation because of the low margin nature of the retail industry. For
this reason, Costco sees itself on a 10 year plan for RFID implementation. [23] They are waiting
for the price of active tags to fall and for other companies to pave the way in warehouse/retail
applications. Their System Integration team has a supply chain RFID system in the works. Their
goal is to obtain the ability to track product from warehouse to shelf utilizing both RFID and GPS
pallets, increasing their visibility of their supply chain. Many companies have taken the same
‘wait and see’ stance as Costco. This is primarily due to the lack of concrete RFID business cases
related to the technological obstacles that affect RFID system reliability and the privacy issues
involved.

Spring 2011 Senior Project Josh Gilbert
15
Accurate and efficient inventory management is essential to Costco’s ability to supply a
customer’s demand without incurring costs of saturated inventories or incurring costs of
shortages. Twice a year Costco’s across the country perform manually intensive inventory
counts. This process comprises of roughly 200 employees traveling the sales floor counting and
recording individual SKUs. This process is extremely inefficient and costly. (Reference Table 1.1
of Introduction) The use of item-level RFID in this process can greatly reduce the amount of
labor thus reducing costs as well as increasing product visibility on the sales floor.
Previous Successes
A number of studies have been performed analyzing the impact of IRI on the cost of
operations. Inventory record inaccuracy: An Empirical Analysis studied the effects of IRI on a
large well run Retail Company. [23] It was discovered that even small discrepancies of IRI led to
large losses of potential capital. As a result of this study, the team called management to search
for innovative techniques to combat IRI and the problems that cause it. Some of the proposed
solutions included changes in the design of the store operating environment to make it difficult
for such discrepancies to arise also to create an error free system for tracking such inventory. A
proposed technology to combat these problems is that of RFID.
Numerous studies have been performed determining the benefits realized after an
increased level inventory control data that an RFID system provides. A study done by the
University of Arkansas set out to determine if RFID tags can be equally effective in reducing
stock outs across all product categories and for what product categories is RFID tagging most
effective in reducing stock outs. [15]

Spring 2011 Senior Project Josh Gilbert
16
Despite the proven benefits of RFID implementation, many managers still believe that for
RFID to be accepted in a retail environment the system must provide 100% accuracy; that is
read every item every time. But according to an editorial by Mark Robertti of RFID Journal this
is a common ‘myth’. He states that companies are already experiencing up to 45% inventory
inaccuracies and in 2007 the National Retail Security Survey, conducted by the University of
Florida, found retailers lost $34.3 billion in sales, 1.4% of overall sales, due to unaccounted for
inventory. The sources of the inaccuracy were found to be: employee theft, shoplifting,
administrative error, and vendor fraud. In a typical barcode system these losses are not
accounted for resulting in lost sales. What many managers don’t realize is that although RFID
may not account for every item every time, it will still give improvements and it is much faster
to double count tagged items using RFID as opposed to multiple manual counts. Furthermore,
at the baseline for every business decision is ROI. So if RFID tagged items result in improved,
not perfect, accuracies that results in a reduction in lost sales that is to some degree greater
than the cost of an RFID system, then the decision is clear. [11]

Spring 2011 Senior Project Josh Gilbert
17
Literature Review
The following section is a review of the research performed before start of the design of
experiments and methods.
“Lee and Dozer (2007) argue that there currently exists a “credibility gap” of the value of
RFID, since most assessments of the value of RFID fail to disclose how the estimated values of
RFID were determined and how those values can be realized by companies implementing RFID.
The authors draw attention to this gap in the literature, and identify this as an area that needs
to be strengthened through further modeling.”[12]
I. Intro
Much has been discovered regarding RFID technology in the past 10 years. Prices for tags
have fallen and applications have arisen. Specifically for my senior project I will be testing
passive tag implementation for inventory control purposes at Costco Wholesale. Currently
Costco is waiting for prices of active tags to fall and also waiting for other companies to pave
the path to RFID implementation. I will run tests to analyze how passive tag technology
performs in a Costco like environment to hopefully encourage passive tag applications for
inventory tracking purposes. Ultimately RFID implementation will assist Costco in their efforts
of inventory control both throughout their supply chain and sales floor.
Inventory control is a large chunk of the operating cost of a company. Thus it is essential to
manage inventory efficiently and accurately. Current inventory systems utilize barcode
technology for inventory data collecting purposes. But potential benefits of RFID technology

Spring 2011 Senior Project Josh Gilbert
18
are driving companies to look at possible applications, thus pushing RFID producers to develop
new levels of performance.
I. Importance of inventory control
As a result of high customer service levels, an emphasis on control of material flow has been
placed on production and retail environments. Companies have countered this demand with
investments in Information Technology to more efficiently supply greater amounts of data in
order to track and manage levels of product with in retail locations and throughout the supply
chain. But one problem is still inherent, the validity of the subsequent data. Companies rely
on data such as sales history and production rates in order to make key market and production
decisions, if this data is inaccurate, then the decisions are not optimal. Thus it is important to
implement IT systems that provide data both efficiently and accurately.
The article out of International Journal of Production Economies titled, “Analysis of simple
inventory control systems with execution errors: Economic impact under correction
opportunities” analyzes potential inventory control errors based on inaccurate data and
correction opportunities do reduce the negative economic impact in turn underlining the need
for an accurate inventory control system. Many stock monitoring and replenishment systems
are becoming automated in companies. These systems use both barcode and RFID
identification methods that include a dynamic database to manage product information. In
combination with automated stock systems, many companies are pushing towards an ERP
management that virtually connects all aspects of a company’s operations. These systems rely
on data supplied through IT systems. Yet no level of automation will totally eliminate possible

Spring 2011 Senior Project Josh Gilbert
19
inaccuracies of data, as discrepancies between inventory records in information systems and
physical inventory are quite common. [13] But strides can be taken to greatly improve validity
of data. In a study performed, inventory records of two leading retailers were analyzed and it
was discovered inventory records of almost 65% of SKU’s were inaccurate and the magnitude of
errors on average was found to be 35% of target stock levels. [13] It is also very common for the
majority of excess inventory that has no demand to be a result of inaccurate reporting of stock
levels. To reduce the errors of inventory reporting, companies often respond by focusing on
prevention, correction and integration techniques. Associated costs with these efforts to
reduce errors can be high thus it is important for companies to determine the correct economic
impact of inaccurate data.
The most common way companies determine levels of inventory is by conducting periodic
cycle counts. In most cases these counts entail an employee work force physically counting
every item on the sales/manufacturing floor. This process, being human based is thus exposed
to some level of inevitable human error. The effects of this small human error, without being
accounted for, can have the bull whip effect on the entire supply chain resulting in greatly
increased costs. RFID technology offers the potential to eliminate a majority of the human
error occurred in conducting inventory counts. [13] State the visibility that RFID can bring to the
supply chain has been cited to have significant potential to save labor costs, improve supply
chain coordination, reduce inventory, and increase product availability and customer service.
But it is still believed that a large gap exists between the costs of implementation of RFID and
the potential benefits that a company will realize thus calling for a further modeling.

Spring 2011 Senior Project Josh Gilbert
20
Two causes of inaccuracies of inventory control data are a result of shrinkage and execution
errors. Shrinkage is termed to represent the items of inventory that are “lost” and not
accounted for. There are two types of shrinkage, malicious and non-malicious. For example
theft would be considered a form of malicious shrinkage and a product that simply slips
between the cracks of shelves is an incidence of non-malicious shrinkage. This discrepancy of
stock levels between the system and the sales floor will increase the occurrences of stock outs
increasing costs.
The second mentioned cause of inaccuracy is execution error. These represent a number of
procedures in which employees do not execute correctly including counting errors of shipments
and execution errors at cash registers. Having worked at Costco I have experienced these types
of errors. When a large flat with packs of soda stacked 4 high come through the cash register
the cashier will simply count the total number of packs of soda and ring that barcode x amount
of times, thus not capturing the sales of individual soda brands. Ultimately execution errors will
result in increased stock outs and increased operating costs.
After creating their model and running tests they identified some key managerial aspects of
inventory control. For companies who have small safety stock and small order quantities,
inaccurate data affects them the most as orders do not get out in time thus resulting in higher
frequency of stock outs. When inaccuracies are left uncorrected, cost performance
deteriorates with time, suggesting a high frequency of inventory audits. These conclusions
point companies to reduce errors of inventory count through training and also implement new
tracking systems that account for individual products instead of generalized product categories.

Spring 2011 Senior Project Josh Gilbert
21
Inventory record inaccuracy is consistently providing a large hurdle for retail organizations.
Functions such as forecasting, ordering, and in-store replenishment all depend on inventory
counts. Thus it is essential that the inventory systems are accurate and efficient. A study
performed identified inventory record inaccuracy (IRI) as one of the top issues for retailers.
[13] As a result of IRI retailers order product that is unnecessary or fail to order product that is
needed furthermore, it was found IRI resulted in a reduction of profit up to 10%. There are
many ways to combat or reduce the levels of IRI. One the more intuitive approaches is
increasing the frequency of cycle inventory counts. Although this seems like a viable solution,
cycle inventory counts for companies are often very manually intensive thus leading to
increased labor costs. As a result the option of technology is another popular route. Bolstering
the internal informational system will allow retailers to have more control over the items
coming in and out of the retail locations. But again this requires a substantial initial investment
that many companies are just not willing to take. Given this fact many companies will focus on
improving the manual processes, but human error will always be present factor.
II. Barcodes
Inventory tracking and control for retail and warehouse type environments is a constantly
progressing environment. Currently the majority of retailers are using barcode technology. The
following summary of a 2009 Patent titled “Identification, for tracking individual items on
display or in a warehouse to enable inventory control and product replenishment” specifies a
process to more efficiently control inventory using barcoding technology. [14]
Spring 2011 Senior Project Josh Gilbert
22
The standard product movement tracking system in a retail environment encompasses
assigning a UPC, Universal Product Code, to a certain model and size of a product category; it
aggregates products in small groups for identification. This product code is communicated from
a barcode on a product to a barcode scanner. This system supplies general information through
code 128 language about sales by model but it fails to track information pertaining to individual
objects or products. For purposes of identification of items on display say at a retail location,
this process is highly labor intensive. It requires an employee to travel through the sales floor
and scan individual bar codes of desired products. The patent product in question aims to
reduce this time to account for products by providing a unique bar code- encoded identification
that may be read by a scanner without moving the object to which the unique bar code-
encoded identification is affixed. [14] Essentially it is a system to place barcode labels on
products that can be “read without removing or manipulating the sunglasses (object) into
position for the scanner”. The system calls for Gentag IDs that uses Code 128 for unique
identification of individual products, this type of ID is preferred over UPC as it allows for
dynamic identification of individual products. Furthermore the system calls for a continuous
scanner that an operator can wave over the desired products, eliminating individual scans of
products. To accommodate a continuous scan, a compatible hardware system must be
implemented.
This patent inventory control process identifies an approach to enhance inventory control
by using current barcode technology with an improved aspect of labeling and scanning.
Although its system claims to achieve “productivity gains (of over 500%) for inventory tracking

Spring 2011 Senior Project Josh Gilbert
23
activities”, it does not provide reduction of a labor intensive operation or a solution to real time
inventory that RFID tags can provide. [14]
III. RFID Application
Business Case
Numerous studies have been performed determining the effects of pallet and case level
RFID tagging on the reduction of out of stocks and improving inventory count accuracy. A study
performed at the University of Arkansas went even further and explored the effects of item
level RFID tagging. [13] Two studies looked at Bloomingdale’s and JCPenny, two large clothing
retailers, to determine if item level RFID tagging improved inventory accuracy and or lowered
the occurrences of out of stocks. The study looked at two different store types; control and
treatment locations. They implemented RFID into the treatment location and measured the
differences in the actual physical inventory and the results of the inventory cycle count
delivered by the RFID system. In the case of Bloomingdale’s it was found that after RFID
implementation overall inventory accuracy improved by over 27% with a corresponding
decrease in under stock of 21%. As opposed to the findings at JCPenny of only an overall 5.33%
increase in inventory accuracy, it is believed that this is due to the fact that JCPenny already had
inventory accuracy high above the national average of 65%. [13] It was also noticed that
inventory inaccuracy deteriorated over time and it is suggested this is due to the low frequency
of physical inventory counts. Another benefit RFID provides is a reduction of the deterioration
of inventory accuracy over time because inventory count performed by RFID is much faster. It
was determined that to account for 10,489 items on the sales floor the mean barcode cycle

Spring 2011 Senior Project Josh Gilbert
24
count time was 53 hours compared to that of the mean RFID cycle count time of 2 hours. This
is a 95% reduction in cycle time resulting in a reduction of operating costs. [13]
A study performed at the University of Arkansas analyzed how to improve inventory
management in the retail store: The effectiveness of RFID tagging across product categories.
[15] This experiment set out to determine the influences of RFID tagging on stock outs for
different product categories. The goal was to identify if RFID tagging is equally effective in
reducing stock outs across all product categories and for what product category is RFID most
effective. The experiment consisted of comparing inventory counts of pre-RFID and post-RFID
inventory of 1268 products from 5 product categories to actual hand counted amounts. If
either of these counts differed from actual inventory present, then a stock out was recorded. It
was discovered that RFID did in fact improve their inventory management but it was not
consistent across all product categories. It was determined categories most likely to benefit
from RFID have high turnover, high sales volume, high product variety, low cost and high
inventory density. These findings justify implementation of RFDI technology as well as giving
this project selection criterion for the products that will be select to perform the effectiveness
of RFID counts upon.
A paper titled RFID Research and Testing for packages of Apparel, Consumer Goods and
Fresh Produce in the Retail Distribution Environment, composed by professors and industry
professional’s outlines RFID technology and its potential to facilitate a real-time, end to end
supply chain visibility system. [16] It outlines the benefits that can be realized throughout a
supply chain in terms of reduced costs of material movement, inventory planning and shipping.
This paper gives companies the ability to make an educated and informed decision of whether

Spring 2011 Senior Project Josh Gilbert
25
or not an RFID implementation effort would be a correct strategic decision. For my purposes it
will help me understand the effects that an RFID would have for Costco.
Focusing on Consumer Goods Testing and Evaluation section, I will summarize Proctor and
Gamble (P&G) applications of RFID systems. One of P&Gs pilots of RFID application involved its
four major categories of products and RFID’s ability to be read through different physical
constitutes of storage and transportation. They placed nine cases of product per tier three tiers
high on pallets, which is very similar to the way Costco stores their products on the sales floor.
P&G used Alien tag technology and tested the readability of the tagged product as pallets
passed by readers on a conveyor belt.
As a result of the study, key characteristics were determined that affected the RFID tag
readability and accuracy. The most critical variable that affected tag readability was product
type, specifically product type package material. It was concluded product that was packaged
in polymer film had nearly 100% read percentage and the worst performing product was
product that was packaged in aluminum foil paperboard. The metal characteristics of
aluminum most likely affected the RF waves.
The second characteristic mentioned is the distance away
the tags were placed from the read range of the circular
antenna. (Reference Picture 3.1) Tags that passed directly in
front of the reader read more accurately than tags placed
further away from the reader.
The third characteristic that affected read rate was the Picture 3.1 – Circular Polarized Antenna

Spring 2011 Senior Project Josh Gilbert
26
speed at which the pallet passed by the reader. The slower the speed of the reader the more
time the reader had to identify tags thus leading to a higher read rate.
Lastly they determined that technology is not capable of reading mixed pallets of multiple
pallets passing by a reader. This test is very applicable to my project as it will assist me in
determining the method at which to tag products on a pallet that will yield the highest read
rate percentage.
The article also outlines tests preformed on tag readability from tags placed on produce.
Tags were place on the plastic containers and corrugated shipping boxes that carry the fresh
produce. They tested the tags readability passing through a truck door fitted with readers.
They concluded the following factors that affected the tag readability: Presence of external
melectromagnetic fields, material handeling equpiment, speed of case transfer, orientation of
tags, packaging method, and case configuration.
An inherent characteristic to produce is moisture. After tests determining the affects of
moisture present in produce aswell as other physical characteristics of corrugated shipping
boxes they concluded the following factors affecting tag readability: Proximity of produce to
the packaging container sidewall, moisture content in packaging materials, presence of air-gaps
ion packaging materials, effects of temperature, humidity and water, and effects of existing
radio frequencies.
An obvious design factor that would increase the readability of an RFID system is the
number of tags used per unit. A study performed at the Department of Computer Science at
the University of Virginia, studied the gains in readability of multiple tags per product. The
experiment design was created to analyze the optimal multi-tag positioning for various

Spring 2011 Senior Project Josh Gilbert
27
numbers of multi-tags, quantify the expected power increase on one of multi-tags and the
corresponding communication range improvement, and analyze the effects of multi-tags on
different interrogation algorithms. The experiment was performed by placing different number
of tags on different shapes and then determining the power received by the tags. The results
determined that multiple tags considerably improved object detection probabilities for linear
antennas, more specifically, switching from 1 to 2 tags per object produces a high-double-digit
increase in object detection probability. When stacking tagged objects on top of each other, it
was determined that the detection probabilities decreased. In comparing the benefit of
introducing another reader versus adding more tags to increase the detection probabilities, it
was found that adding multiple tags is on par with simply adding another reader, except when
it came to metallic and liquid products. In this case it was found that adding more tags has
more of a positive effect on the readability of multiple objects versus simply adding another
reader. An important conclusion made from the study for this project’s application was the
increased detection probabilities found for product with two tags placed on perpendicular
surfaces. In relation to my project these results will help me in several designs of experiment
factors. Because there is no standard set for number of tags per product to be used at the
retail location, as a result the study I will use two tags per SKU and orient them on
perpendicular planes to help increase the probability of detection.
A major deterrent seen by potential customers of RFID is its lack of readability when
multiple tags are present in a field range. In the case of case level and item level tagging this
becomes a major issue. Many retailers believe that for RFID implementation into a supply chain
read rates must be 100%, even though currently the national average for inventory accuracy is

Spring 2011 Senior Project Josh Gilbert
28
only 65%. Systems must be developed to address the issue of readability. A study done by
researchers of the Department of Industrial Technology at the California Polytechnic State
University of San Luis Obispo studied the effects of several factors on the readability of
palletized products. [16] The factors tested were product content, pallet pattern, and speed of
the pallet on which it passes through a portal of antennas. It was observed that readability
greatly varies for different product-package systems as well as speed of which the product is
traveling. [16] A similar study performed by researchers from Michigan State University found
only 25% of tags on water bottles were read, 80.6% of rice filled jars were read. They also
determined that orientation of the tag made a considerable difference in the read rate. It was
determined that tags facing outwards towards the reader antenna had the highest readability.
[16]
IV. Passive tag testing
It is still a question whether passive tags or active tags are more effective in application of
RFID systems. Active tags have a larger read distance as they have their own power source but
their shelf life is short. Passive tags read at a shorter distance but shelf life is considerably
longer. For ideal applications active tags would be optimal for companies but the cost of active
tags range from $15 to $50 per tag and up while passive tags range around $.10 to $4 per tag
tag. Given these prices companies considering RFID integration would have to take a deep look
in cost of RFID impelentation and its potential cost reducitons.[21]
The article titled Performance Analysis of Short Range UHF Propogation as Applicable to
Passive RFID details an assesment technique for vicualizaiton of short range propogartion

Spring 2011 Senior Project Josh Gilbert
29
effects specifically for a commercial UHF RFID system. [18] This test include RF characteristisc in
a cluttered and non-cluttered enviornment which will cause RF waves to be backscattered,
blocked, reflected, diffracted and or attenuated.
The tests were performed in a large auditorium where a reader was placed on a table at
one end of the room and tags placed at the other end. The reader used was a Symbol XR400
bistaics UHF passive reader that emitted circularly polarized RF waves. Results showed that the
passive tage read at a max distance of 9.14 meters in an unhcluttered room. Further analysis of
tag readability ranging from 900 MHz to 930 MHz focused on the ability for enough power
(dBm) to reach the tag in order for it to respond. After completing the test in both a cluttered
and uncluttered configuration they found in a cluttered enviornment only 30.8 percent of the
frequencies suplied enough to power the passive tags and in an uncluttered room 61.2 percent
of frequencies met the power threshold power criteria.
These test results are important for me to consider. I consider Costco to be a very cluttered
environment. Given these test results, this will result in a lot of RF wave intereference. Given
this fact, I will have to analyze different configurations of antennas and palcemnt of tags to
maximize readablility of passive tags. I must be able to prove the ability of passive tags to
perform in such an enviornment for RFID implementaiton to be cost effective at this point.
Spring 2011 Senior Project Josh Gilbert
30
Design
In order to determine if RFID can be used to supply accurate inventory counts products
were chosen based on criteria established in the previous study, The Case for Multi-tag RFID
Systems, identifying product characteristics where RFID technology increased inventory control.
[12] Each product selected represents some aspect of the defined characteristics. For each
defined product, analysis of display method is conducted to determine if the identified display
state will affect the readability of RFID wave propagation. Based off these observations a
design of experiment will be produced that best represents the actual display state of the sales
floor. Next, the experiments will be performed for three different types of scanning
procedures, stationary antenna and hovering antenna.
Product Selection Criteria
Product category was based off of the following objective criteria: high throughput, low
cost, high inventory density, and high product variety.
• Throughput is defined as a measure of the rate of product movement from inventory to
point of sale
• Inventory density is defined as the total number of units found in a store’s selling area
per SKU
• Product variety is defined as the number of different merchandise categories within a
product category.

Spring 2011 Senior Project Josh Gilbert
31
Individual product selection was also influenced based off difficulty of manual inventory
count. This is something that was subjectively decided from my experience of performing
manual physical inventory counts.
Selected products
• DVDS
• Shampoo
• Jeans
Display Method Analysis
The physical display method of the selected products will have a big impact on the
readability of passive RFID tags. Factors such as stacking product, display box material and
physical characteristics of the products may affect the propagation of RF waves. Stacking
products could result in a shadowing effect and any metal or liquid present in the environment
could result in reflection or absorption of RF waves, all leading to poor read accuracies.
Therefore it will have to be determined how to strategically locate the passive RFID tags on
each of the product categories based on the varying degrees of RF limiting physical
characteristics as well as keeping in mind tag placement in relation to product packaging.

Spring 2011 Senior Project Josh Gilbert
32
Shampoo
The display nature of the shampoo bottles presents the potential for both RF wave
shadowing and absorption. Shampoo bottles are displayed on the sales floor in card board
boxes, often with individual SKUs and or boxes stacked on each other. (Reference Picture 3.4)
This method introduces the possibility of shadowing. As the RF wave propagates through a
cluster of bottles, it is possible that the tags on bottles behind other units will be ‘shadowed’
from the RF wave, thus not being read. Another, even larger expected effect is that of liquid
absorption.
Picture 3.4 – Shampoo sales floor display state

Spring 2011 Senior Project Josh Gilbert
33
Jeans
As in most clothing stores clothes at Costco are stacked, sometimes up to 430 SKUs high,
on display tables with several different product codes per table. (Reference Picture 3.5) Given
this display state, shadowing of tags is a very prevalent issue. In most cases, clothes are
uniformly folded with the majority of tags located in the same region of the garment, near the
collar. With up to 30 SKUs stacked high, this creates a large shadowing effect for any tags any
number deep in the pile of folded garments. There is no easy solution to get around this issue.
Even if I decided to place two tags per unit, still I would have to create a uniform and
repeatable tagging process thus simply adding another shadowing effect to another universal
tag location.
Picture 3.5 – Jeans display state on sales floor
Spring 2011 Senior Project Josh Gilbert
34
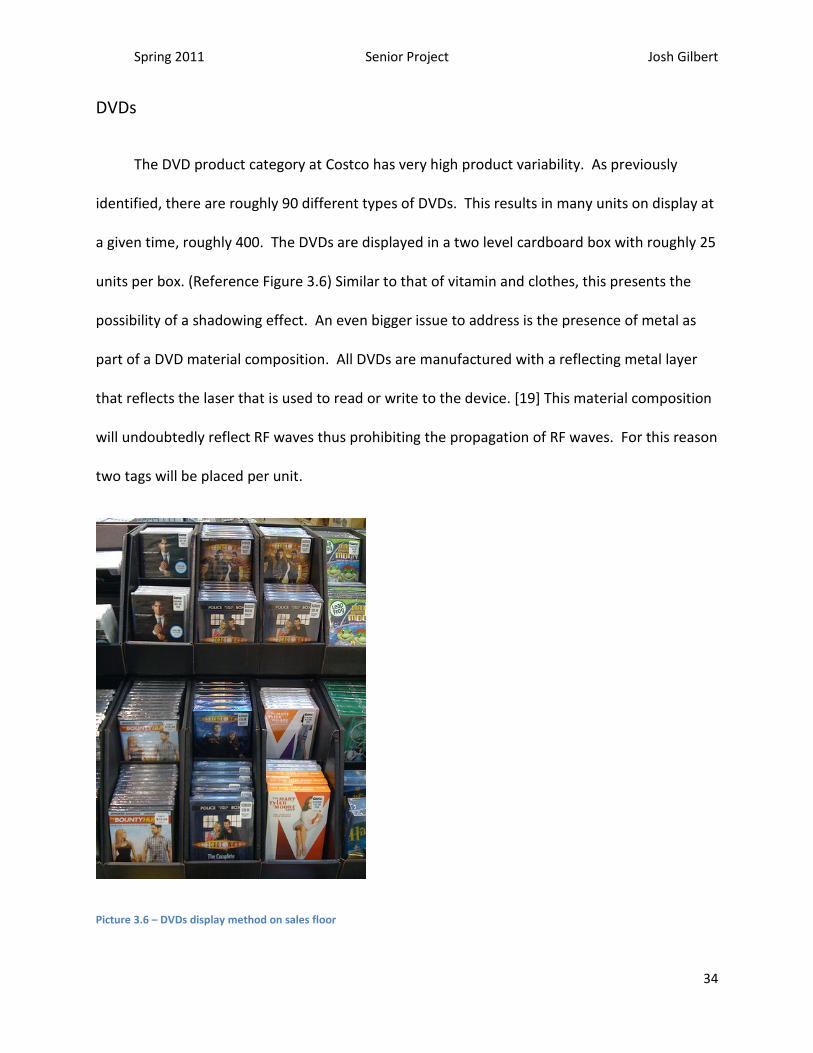
DVDs
The DVD product category at Costco has very high product variability. As previously
identified, there are roughly 90 different types of DVDs. This results in many units on display at
a given time, roughly 400. The DVDs are displayed in a two level cardboard box with roughly 25
units per box. (Reference Figure 3.6) Similar to that of vitamin and clothes, this presents the
possibility of a shadowing effect. An even bigger issue to address is the presence of metal as
part of a DVD material composition. All DVDs are manufactured with a reflecting metal layer
that reflects the laser that is used to read or write to the device. [19] This material composition
will undoubtedly reflect RF waves thus prohibiting the propagation of RF waves. For this reason
two tags will be placed per unit.
Picture 3.6 – DVDs display method on sales floor

Spring 2011 Senior Project Josh Gilbert
35
Experimental Model Identification
An obvious limitation to test this system was how to create an environment that mimics
that of the sales floor. As many of you may have seen at Costco, the figure on the left
represents how clothes are generally displayed. I was not given the ability to perform in store
testing, so I had to somehow create a testing model that does not stray too far from actuality.
So what done was identification of individual product display methods and identification of a
section that is uniformly repeated to generate an entire display stand. (Reference Figure 3.1) A
design of experiment for the testing model was created that most accurately relates to the in
store state. (Reference 3.2) Elements took into consideration were: tag location, antenna
location, and amount of SKUs.
Figure 3.1 – Common display method of uniformly Figure 3.2 – Uniformly repeated display segment acting
repeated segments as testing model

Spring 2011 Senior Project Josh Gilbert
36
Scan Procedures
In this section I will identify the different methods of scanning product.
Stationary Antenna
This antenna position represents an antenna fixed to a display stand that will be able to
scan tags from one location whenever initiated by a user. During the experiments the antenna
location will remain a constant 1 foot above the product in question. (Reference Figure 3.3)
Hovering Antenna
This antenna location represents an operator walking the floor with a cart equipped with
the appropriate equipment. The operation consumes of scanning the product in a circular
fashion focusing on one product stack at a time. During the experiment the antenna will be
held over the product and moved in a circular fashion. (Reference Figure 3.4)
Figure 3.3 – Stationary Antenna
representation Figure 3.4 – Hovering Antenna
representation
Spring 2011 Senior Project Josh Gilbert
37
Design of Experiment
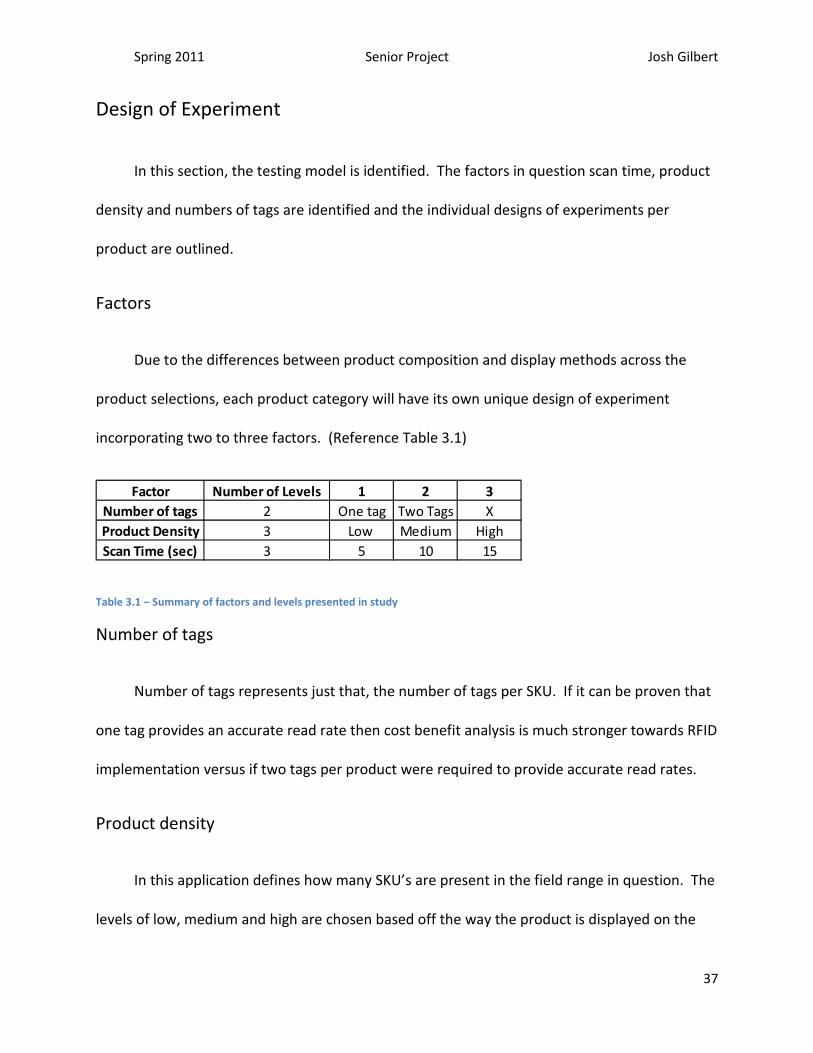
In this section, the testing model is identified. The factors in question scan time, product
density and numbers of tags are identified and the individual designs of experiments per
product are outlined.
Factors
Due to the differences between product composition and display methods across the
product selections, each product category will have its own unique design of experiment
incorporating two to three factors. (Reference Table 3.1)
Table 3.1 – Summary of factors and levels presented in study
Number of tags
Number of tags represents just that, the number of tags per SKU. If it can be proven that
one tag provides an accurate read rate then cost benefit analysis is much stronger towards RFID
implementation versus if two tags per product were required to provide accurate read rates.
Product density
In this application defines how many SKU’s are present in the field range in question. The
levels of low, medium and high are chosen based off the way the product is displayed on the
Factor Number of Levels 1 2 3
Number of tags 2 One tag Two Tags X
Product Density 3 Low Medium High
Scan Time (sec) 3 5 10 15

Spring 2011 Senior Project Josh Gilbert
38
sales floor. With the experiment models selected, the product densities were chosen based off
of low, medium and high levels observed on the sales floor.
Scan Time
This represents the amount of time in seconds that the reader sends signals into the field
range. The three chosen durations are 5 seconds, 10 seconds and 15 seconds. The more time
the reader sends signals into the field range, the more time it has to combat tag collisions
resulting in a larger read accuracies. The goal of a RFID inventory count system is to perform
inventory counts fast and accurately, so the shortest duration of scan time is optimal yet it still
must result in high read rates. Comparisons of the three scan durations will allow a time
standard to be set ensuring accurate read rates.

Spring 2011 Senior Project Josh Gilbert
39
Method
The following section describes the specific designs of experiment per product. For
summarized design of experiments reference DOE tables of Appendix. (Reference Table 4.1 to
4.3 of Appendix)
Jeans
Based on limitations of tag locations for jeans, the design of experiment in question
comprised of 2 factors: product density and scan time. Tag location was determined to be on
the outside of the back pocket, as this is a common location for a removable product
description display tag. The tag was placed at a 45 degree angle based off of initial testing.
(Reference Picture 4.1) Low, medium, and high product density are represented by 30, 25, and
20 units stacked on top of each other, respectively. (Reference Picture 4.2) Scan times are 5
seconds, 10 seconds, and 15 seconds. The antenna will scan from the top of the product as it
would be done in an actual application.
Picture 4.1 – Tag location for jeans Picture 4.2 - Testing model for jeans

Spring 2011 Senior Project Josh Gilbert
40
DVDs

Spring 2011 Senior Project Josh Gilbert
41
The factors included in DVDs are number of tags, product density and scan time. One tag
will be positioned on the top edge of the plastic DVD case where the theft prevention adhesive
sticker is placed. A tag can be incorporated into the adhesive sticker further upstream of the
supply chain. In order to determine the effects of multiple tags for DVDs, another tag will be
placed on the bind of the DVD case, perpendicular surface to the primary tag. This tag
placement can also be readily incorporated into the packaging operation. (Reference Picture
4.3) High, medium, and low product densities represented are 50, 38, and 26. The product is
placed in 2 of the exact same cardboard stands utilized on the sales floor. (Reference Picture
4.4) Scan times are 5 seconds, 10 seconds, and 15 seconds. The antenna will scan from the top

Spring 2011 Senior Project Josh Gilbert
42
of the product as it would be done in an actual application.
Picture 4.3 – Selected location for tags for DVDs Picture 4.4 – Testing Model for DVDs
Shampoo Bottles

Spring 2011 Senior Project Josh Gilbert
43
Shampoo bottles will prove to be the most difficult product to obtain accurate read rates
due to the amount of liquid in the system. The factors I will test for this product type are
product density and scan time. I will not consider number of tags due to 0% read rate of initial
testing with tags on the face of the bottle. Due to this fact only one tag will be placed on the
top of the cap. (Reference Picture 4.5) High, medium and low product densities represented are
18, 15 and 12, respectively. Scan times are 5 seconds, 10 seconds and 15 seconds. The
antenna will scan from the top of the product as it would be done in an actual application.
(Reference Picture 4.6)
Picture 4.5- Selected tag location for Shampoo Picture 4.6 – Testing model for shampoo
Conducting Experiment

Spring 2011 Senior Project Josh Gilbert
44
In the following section the location and equipment and controls of the experiment will
be covered.
Location and Equipment
The tests were performed in the conference room of the Poly Gait lab on the campus of
the State University of San Luis Obispo. A portable RFID cart that houses a reader and antenna
was used. It was made certain that product not part of experimental runs were far enough
away from the set-up that they were sure not to interfere. Sirit UHF passive 674 tags were
utilized. A Sirit Infinity 510 UHF Long-Range 510 reader with one Poynting Patch-A0025
antenna was used. The user interface used in this experiment was a program developed in
Microsoft Access 2007. (Referenced Picture 4.7 and Picture 4.8 of Appendix) This program
communicated with the reader so that read tags were directly imported into the Access
program. The program was constructed so that only unique tags were identified. The tag
identification numbers in the field were already
known and programmed into the database to
ensure only those tags were the tags identified
by the reader. A second computer was utilized
to view the randomized experimental runs
developed in Minitab.
Picture 4.7 – Picture of testing setup and equipment
Analysis technique

Spring 2011 Senior Project Josh Gilbert
45
Once data was collected it was compiled into Minitab. The first output recorded is the
general read reliability results for the different factors and levels. Once these are reported
further factorial analysis is performed. In order to perform factorial analysis, first the three
assumptions of ANOVA must be verified. First it can be said the experimental runs are
independent because each experimental run was done as separate procedures. Second it can
be said the variances are equal as is the output of a randomized experimental run as these test
were randomized through the DOE of Minitab as seen in figure 4.1 of Appendix. (Reference
Figure 4.1 of Appendix) Lastly normality is verified by utilizing part of the Analyze Factorial
Design in the Minitab section of design of experiment, normality plot of the residuals. If the
residuals fall on the straight line, then the data is assumed to be normal. If the plot is
inconclusive, the residuals are then put to normality test which returns a p-value and if that p-
value is above .05 then the data is assumed to be normal. If the data passes this assumption,
then the next step is to look at the analysis of variance table. First it is necessary to address the
interactions and then based off of those results, main treatment effects or otherwise known as
factors can be analyzed. If it is found that a main effect has a significant influence on the data
then a Tukey test is performed to further analyze the different levels of the factor or main
effect. It is also important to identify that each experiment based on product type is
independent of each other. Thus the conclusions based off of the statistical analysis are also
independent regarding interaction and main effects.
Results

Spring 2011 Senior Project Josh Gilbert
46
The following section outlines the results for each product outlined by scanning
procedure. (Reference Data Sets 5.1 to 5.5 of Appendix for Summary Data)
Table 5.1 – Summary Data
Stationary Antenna
Jeans
Overall the jeans had an average read reliability of 86%. (Reference Table 5.1)
From the output of analyze factorial design, the data was determined to be normal based
on the normality plot. (Reference Plot 5.1 of Appendix) The data fell close to the straight line, if
anything the data appears to be skewed left. With the normality assumption verified, the
interaction effects were analyzed. There is no significant interaction effect based on the data,
the p-value for product density and scan time interaction is .799. With no interactions, the
main effects of scan time and product density can be analyzed. The p-value for scan time is not
significant with a p-value of .234. On the other hand product density is very significant with a p-
value of 0. (Reference Table 5.2 of Appendix) The interactions plot for product density further
supports a significant interaction of product density as opposed to scan time. It can clearly be
seen that low density returns a much higher read rate. To further analyze the main effects a
Tukey test was performed. (Reference Table 5.3 of Appendix) From the results it can be
determined that all levels of density returned 3 different significant read rates.
Jeans CDs Shampoo Jeans CDs Shampoo
Read Reliability 86% 90% 74% 100% 100% 85%
Stationary Antenna Circular Antena

Spring 2011 Senior Project Josh Gilbert
47
DVDs
It was discovered the total average read rate for DVDs was 90%. (Reference Table 5.1)
The normality assumption of this data is proved true by referencing the factorial design
normality plot outputs. (Reference Plot 5.2 of Appendix) The residuals again fall relatively close
to the line of normality, with a slight deviation from the tails. Furthermore, no interactions
were discovered leading for main effects analysis. The only significant main effect proved to be
product density with a p-value of .003. (Reference 5.3 of Appendix) It is important to point out
that adding another tag did not significantly increase the read reliability. I presume this is due
to the fact the second tag was located on a perpendicular surface to the antenna leading to
poor read reliability. Further analysis utilizing the Tukey comparison test results in an
interesting discovery. The higher read rate came from the medium product density level.
(Reference Table 5.4 of Appendix) This is not expected as the greater the amount of tags in the
field the lower the estimated read reliability. This can be a result of a couple of factors but one
that stands out to me is the orientation of the DVDs in the display box. When the display box is
at capacity, all of the CDs are upright tightly compressed but when the product density is lower
the DVDs tend to rest at an angle. This angle all along with the metal in the DVD themselves
could have led to a reflection effect that allowed the propagation of RF waves to increase.
Shampoo

Spring 2011 Senior Project Josh Gilbert
48
The total read reliability average for shampoo bottles was 74%. For complete summary
table reference table 5.1 (Reference Table 5.1)
Further analysis will not be performed because there was too much interference
experienced as a result of the liquid. Rarely did a SKU get accounted for when another SKU was
stacked directly on top of it. Given the environment of so much liquid, RF waves did not
propagate through the product display resulting in very poor read rates. For this reason
further analysis to identify significant factors would not be beneficial.
Hovering Antenna
Jeans
The average read reliability for jeans utilizing the hovering antenna was 100%. This was a
very surprising result. The increase is read reliability dramatically increased and this increase is
proved significant by the two sample t test. With the following hypothesis:
• Ho = Means equal
• Ha = Means not equal
The test resulted in a p-value of 0, indicating that there is a significant difference. (Reference
Table 5.5 of Appendix)
DVDs

Spring 2011 Senior Project Josh Gilbert
49
The average read reliability for DVDs utilizing the hovering antenna was 100%. This was a
very surprising result. The increase is read reliability dramatically increased and this increase is
proved significant by the two sample t test. With the following hypothesis:
• Ho = Means equal
• Ha = Means not equal
The test resulted in a p-value of 0, indicating that there is a significant difference.
(Reference Table 5.6 of Appendix)
Findings
As a result of the above analysis, several conclusions can be drawn for significant factors
per product category as well as general scanning procedure recommendations. When
considering the interaction effects of the factors, only one instance occurred. When looking at
jeans, there was a significant interaction effect of scan time and product density. Based off of
this finding, it can be determined that for some product categories, it may be beneficial to
develop a standard procedure of scan time based on product density. It is believed that this
occurred for this product and not others based on the fact that jeans were the highest single
product density resulting in a large shadowing effect. All other product category testing
resulted in identification of only one significant factor, that of product density. This would make
sense because as the number of tags increases in the field, so does the interferences of an RF
wave. The most important finding to come of these series of experiments is the improvement
of read reliability when there is a dynamic system.

Spring 2011 Senior Project Josh Gilbert
50
Concerning Costco and the possibility of implementing RFID for inventory count purposes,
the results of this study identifies that read reliability ranges from product to product. As a
direct result of the experiments, this variance can be attributed to product density. Also it is
speculated that the variance of read reliability from product to product can be attributed to
both product and package composition along with display method. Based off these results, it
would be necessary for Costco to develop scanning procedures specific to product category or
product. Most importantly Costco would have to implement a dynamic system of inventory
count. Meaning that either the antenna is portable handled by an operator

Spring 2011 Senior Project Josh Gilbert
51
Economic Analysis
In the following section an economic analysis is performed that incorporates a proposed
RFID system, current labor cost associated with inventory audits, and potential cost savings of
an implemented RFID system.
System Costs
For the proposed system, I will assume a mass purchase of RFID tags of over a million that
will bring the price to $.10 / tag. I will assume that Costco will share the costs of these tags with
their suppliers, 50 – 50. It will also be assumed that Costco will pay its costs of tags over a 5
year period bring the yearly costs of tags to $10,000. The actual RFID system itself
recommended is the portable system with a hand held antenna. The antenna utilized in the
experiment is $90 per unit. (Reference) The reader used is $1,200 per unit. [9] The computer is
$399 per unit and the audio video cart is $124 per unit. [10] Only one each of the previously
mentioned items is required per portable system. The total cost is $12,313 per portable
system. (Reference Table 6.1)
Table 6.1 – System Cost Breakdown
System Costs
Source Quantity Cost/Unit ($) Total ($)
Tags 1,000,000 $0.10 $10,000.00
Antennas 1 $90.00 $90.00
Reader 1 $1,800.00 $1,800.00
Computer 1 $299.00 $299.00
Cart 1 $124.00 $124.00
System Total $12,313.00

Spring 2011 Senior Project Josh Gilbert
52
Labor Costs
Labor costs only directly associated with inventory auditing are considered. Costco
typically employs one dedicated inventory auditor, average total labor costs being $60,000 per
year and from interview it was concluded 5 hrs a day was dedicated to auditing sales floor
product. Through converses with Costco warehouse staff, it was identified that each floor
manager, there are 5, was responsible for taking daily inventory count estimates for their
specific area. It was determined that it typically takes half an hour for floor managers to
perform this task. Floor managers average salary is $65,000 per year. [23] Complied yearly
labor costs directly related to inventory auditing is $58,000. (Reference table 6.2) Also taking
into account the bi-annual inventory count costs, reference table 1.1, this brings the overall
yearly labor costs to $88,000. (Reference Table 6.3)
Table 6.2 – Complied direct auditing labor costs
Table 6.3 – Total yearly costs associated with inventory audits
Labor Costs
Cost Source Current Count Hrs/day Auditing Labor Costs / yr ($) Total Costs/yr ($)
Inventory Auditor 1 5 60,000 37,500
Department Manager 5 0.5 65,000 20,313
Total Costs ($) 57,813
Cost
Bi-Annual Audit $30,000.00
Daily Auditing Labor $57,812.50
Total Auditing Cost/ yr $87,812.50

Spring 2011 Senior Project Josh Gilbert
53
Savings
It was determined in a case study performed by the University of Arkansas,
Bloomingdale’s Tests Item-Level RFID, discovered a 95% reduction in inventory count cycle
time. [13] This is in comparison to the traditional method of scanning individual bar codes.
Although Costco’s policy is to simply touch each item as an operator performs counts, Costco
could still potentially realize these same results. Given this same savings factor, it was
determined that Costco could reduce its labor costs by $75,000 per year. (Reference 6.4) This
gives a ROI of less than one year.
Table 6.4 – Savings calculation
Savings
Cost Source Yearly Cost Savings Factor [2] Savings ($)
Inventory Count 30,000.00 95.00% 28,500.00
Labor 57,812.50 95.00% 54,921.88
Total Savings/yr $71,108.88

Spring 2011 Senior Project Josh Gilbert
54
Discussion
The following section outlines the pros and cons of RFID systems.
Pros
Given the difficulty to accurately quantify the benefits of Costco’s theoretical proposed
RFID inventory count system, it is therefore beneficial to specifically identify further benefits
that this type of application presents. Relating the labor costs, RFID implementation would
greatly increase employee productivity. Potentially, as previously identified, labor costs
incurred with inventory audits could be reduced by 95% giving the ability for employees to
allocate more time to improving the customer experience, a cornerstone of Costco’s business
model. Automation of processes is another potential benefit. Processes such as receiving dock
logging, inventory count, checkout and product locating all can be potentially automated via
RFID. Given the automation of processes this presents the opportunity to reduce labor costs
even more by reduction of workforce. Not only will this reduce direct labor costs but also
reduce the costs of inaccuracies by supplying the increase in accurate and valuable information
lessoning the effect of human error. Lastly, directly referencing an inventory count application,
RFID will go as far as to improve ergonomics. Costco inventory count procedure requires each
and every item to be touched by a hand when it is counted. This requires product display stands
to be broken down. Some of the products are displayed in boxes comprising of multiple SKUs
and in many instances this requires heavy lifting. With the use of RFID, the most that would be
required is a waving of a light antenna over product.

Spring 2011 Senior Project Josh Gilbert
55
Cons
Despite the many potential benefits of RFID implementation, there lie a couple of cons as
well. As identified by this modeling, environmental factors and how they interact with the
operation of an RFID system can greatly affect the effectiveness of such a system. For this
reason each and every application must be modeled and proven to perform in terms of the
goal. This process can be very expensive and if done too hastily or incorrectly, can result in
huge potential losses for a company. An obvious deterrent to RFID is the high initial
investment. Yes the price of tags is relatively high and yes RFID systems components are
expensive. But as the demand for these types of systems increases this will encourage
suppliers to provide innovative technology and enter the market at competitive prices.
Probably the biggest logistics nightmare faced with item-level RFID implementation is who in
the supply chain will take on the job of applying the RF tags and who will incur those costs.
Obviously companies try to reduce costs at every level of operation. A packager or supplier will
not be jumping out of their seats to apply RF tags to products and incur those costs for an entity
further down the supply chain to reap the benefits. Determining who will incur these costs will
have to be a give and take relationship between supply chain entities. Possibly shared costs
and shared benefits contract.

Spring 2011 Senior Project Josh Gilbert
56
Conclusion
There is no question that RFID technology has many applications across many industries
resulting in many potential benefits. Despite this fact, there still lies many questions of RFID
effectiveness that many companies view as major impediments for wide spread deployment.
As a driving factor of this study, application modeling remains an essential part of RFID
implementation.
The application represented in this model was a passive item level RFID assisted physical
inventory count of the Costco sales floor. Products were selected, testing models developed
along with design of experiments that best represented actual in store display environments.
Two different types of product scanning methods were considered; one representing a
stationary system and the other a dynamic system. With results obtained from a controlled
experiment utilizing the Poly GAIT lab and its technology several levels of statistical analysis was
performed to accurately draw conclusions from.
The results of conducted tests clearly identifies that a dynamic system, movement of
antenna around or over product, led to significantly higher read reliability rates as compared to
stationary systems. A hovering antenna resulted in 100% read reliabilities. This makes sense as
RF wave’s propagation follows that of figure 6.1. (Reference Figure 6.1) Given this propagation
of RF wave, if a tag is positioned in a dead spot, the tag will remain if not movement is present
in the system, thus not resulting is a successful read. But
when dynamic movement is introduced, the RF wave covers
more of an area resulting in a higher probability of successful tag identification.
Figure 8.1 – Circler Polarized Antenna

Spring 2011 Senior Project Josh Gilbert
57
Addressing the objective of this senior project, is passive item level tagging a viable
solution for physical inventory counts? Yes it is, but the system design must be specifically
design to adapt to environmental settings. A direct outcome of this type of product modeling
can go to developing standard operating procedures for how to scan product based on product
type and display method to result in accurate counts of on hand inventory.
From a more general view, this study has identified the importance of modeling RFID
systems to its specific application. Due to environmental dynamics, RFID systems will respond
differently in many different configurations. Thus in order to obtain a successful
implementation, the specific intention must be clearly identified and then the system must be
appropriately designed to meet a goal.
Most importantly, an extensive economic justification must be applied. Based on the
level of RFID deployment, implementation efforts could cost millions. Thus is imperative that
ROI is carefully and accurately determined in terms of operational savings that RFID would give.
In my opinion for companies to take full advantage of the potential of RFID technology
the application must be: clear, realistic, specifically modeled to fit the need and economically
justified. As the large corporations such as Wal-Mart and the Department of Defense continue
the push the market for RFID implementation, technology will be driven to develop and
applications developed. It is important for large companies to keep an eye on this movement
as many would greatly benefit from the gains of the strategic position that RFID technology can
supply.

Spring 2011 Senior Project Josh Gilbert
58
Bibliography
[1] Bustillo, Miguel. "Wal-Mart to Put Radio Tags on Clothes - WSJ.com." Business News & Financial
News - The Wall Street Journal - Wsj.com. WSJ, 23 July 2010. Web. 01 June 2011.
[2] DeHoratius et al. 2005, Kang and Gershwin 2005, Fleisch and Telkamp 2005
[3] "Stock Control and Inventory | Business Link." Business Support, Information and Advice | Business
Link. Business Link. Web. 02 June 2011.
[4] (DeHoratius, et al. 2004)
[5] Nikitin, Pavel K. Theory and Measurement of Backscattering from RFID Tags. Intermac Technologies
Corporation. University of Washington.Web. 3 Mar. 2011.
[6] "Glossary of RFID Terms." RFID Journal - RFID (Radio Frequency Identification) Technology News &
Features. Web. 15 Mar. 2011.
[7] "Electronic Product Code." Wikipedia, the Free Encyclopedia. Web. 02 June 2011.
<http://en.wikipedia.org/wiki/Electronic_Product_Code>.
[8] O'Connor, Mary C. "Bloomingdale's Tests Item-Level RFID - RFID Journal." RFID Journal - RFID
(Radio Frequency Identification) Technology News & Features. RFID Journal, 26 Aug. 2009. Web.
18 May 2011. <http://www.rfidjournal.com/article/view/5160/2>.
[9] Buying RFID Products Online with Atlas RFID Product Solutions. Web. 02 Apr. 2011.
<http://www.atlasrfidstore.com/Sirit_INfinity_510_UHF_RFID_Reader_p/in510wd001.htm>.
Spring 2011 Senior Project Josh Gilbert
59
[10]
http://www.google.com/products/catalog?rlz=1C1GGGE_enUS419US420&q=netbook&um=1&i
e=UTF-8&tbm=shop&cid=9929046502733625179&sa=X&ei=jlvdTfL-
L8rjiALyhODwDw&ved=0CJcBEPMCMAI&biw=1366&bih=667#
[11] Roberti, Mark. "The Myth of Perfect Read Accuracy." RFID Journal The World's RFID Authority: 1-2.
Print. [12] Bolotnyy, L, Robins, G, “The Case for Multi-Tag RFID Systems", Wireless Algorithms,
2007 IEEE International Symposium on, On page(s): 174 - 186, August 2007
[13] O'Connor, Mary C. "Bloomingdale's Tests Item-Level RFID - RFID Journal." RFID Journal -
RFID (Radio Frequency Identification) Technology News & Features. RFID Journal, 26 Aug. 2009.
Web. 18 May 2011. <http://www.rfidjournal.com/article/view/5160/2>.
[14]United States. Commerce. Patent Publication. Patent Publication. By Mark Philbrick. 14.
Oct. 2010.
[15] Hardgrave, Bill C., Sandeep Goyal, and John Aloysius. Improving Inventory Management in the
Retail Store: The Effectiveness of RFID Tagging Across Product Categories.Improving Inventory
Management in the Retail Store: The Effectiveness of RFID Tagging Across Product Categories. University
of Arkansas, 2010. Web. 2011.
[16] Singh, S. P., and M. McCartney. RFID Research and Testing for Packages of Apparel,
Consumer Goods and Fresh Produce in the Retail Distribution Environment. RFID Research and

Spring 2011 Senior Project Josh Gilbert
60
Testing for Packages of Apparel, Consumer Goods and Fresh Produce in the Retail Distribution
Environment. Cal Poly San Luis Obispo, 2008. Web. 1 Feb. 2010.
[17] Bolotnyy, Leonid C., and Gabriel Robins. The Case for Multi-Tag RFID Systems. The Case for Muti-
Tag RFID Systems. University of Arkansas. Web. 24 Apr. 2011.
[18] Banerjee, S. Riki. "Performance Analysis of Short Range UHF Propagation as Applicable to
Passive RFID." IEEExplore. Proc. of IEEE International Conference on RFID, Gaylord Texan Resort,
Grapevine, TX, USA. 28 Mar. 2007. Web.
[19] Vogt, Harald. Efficient Object Identification with Passive RFID Tags. Efficient Object
Identification with Passive RFID Tags. Swiss Federal Institute of Technology, 2002. Web. 10 Jan.
2010.
[20] Nikitin, Pavel V. Performance Limitations of Passive UHF RFID Systems. Intermec
Technologies Corporation, 2006. Web. 10 Feb. 2010.
[21] "Passive vs Active RFID." RFID Asset Tracking Solutions. InLogic. Web. 02 June 2011.
<http://www.inlogic.com/rfid/passive_vs_active.aspx>.

Spring 2011 Senior Project Josh Gilbert
61
[22] Helmenstine, Ann M. "What Are CDs Made Of? - CD or Compact Disc Composition." Chemistry -
Periodic Table, Chemistry Projects, and Chemistry Homework Help. About.com Chemistry. Web. 02 June
2011.
[23] "Costco's RFID Initiative." Personal interview. 23 Apr. 2011.
[24] Gel, Emma S. "Analysis of Simple Inventory Control Systems with Execution Errors:
Economic Impact under Correction Opportunities." ScienceDIrect. SciVerse, May 2010. Web. 10
Jan. 2011.

Spring 2011 Senior Project Josh Gilbert
62
Appendix
Table 4.1 – DVDs design of experiment matrix
Table 4.2 – Jeans design of experiment matrix
Table 4.3 – Shampoo design of experiment matrix
Scan Time
Prod Density High Medium Low High Medium Low High Medium Low
One
Two
Number of
Tags
15 secs 10 secs 5 secs
High Medium Low
15 sec
10 sec
5 sec
Scan Time
Product Density
High Medium Low
15 sec
10 sec
5 sec
Scan Time
Product Density

Spring 2011 Senior Project Josh Gilbert
63
Picture 4.8 – Experimental setup

Spring 2011 Senior Project Josh Gilbert
64
Figure 4.1 – Example of randomized experimental run as developed in Minitab

Spring 2011 Senior Project Josh Gilbert
65
1.11.00.90.80.70.6
99
95
90
80
70
60
50
40
30
20
10
5
1
Read Rate
Percent
Mean 0.8604
StDev 0.09705
N 54
AD 0.665
P-Value 0.078
Anderson Darling TestNormal
Plot 5.1 – Normality Plot of residuals for Jeans data
Reference Table 5.2 – ANOVA Table for Jeans Data
Table 5.3 – Multiple comparison Tukey test result table

Spring 2011 Senior Project Josh Gilbert
66
0.100.050.00-0.05
99
95
90
80
70
60
50
40
30
20
10
5
1
RESI1
Percent
Mean -4.31753E-17
StDev 0.03032
N 54
AD 0.367
P-Value 0.420
Probability Plot of RESI1Normal
Plot 2.2 Normality Plot of the residuals
Table 5.3 – ANOVA Output

Spring 2011 Senior Project Josh Gilbert
67
Tab le 5.4 – Tukey Multiple Comparison
Table 5.5 – Two-Sample T-test
Table 5.3 – Two-Sample T test
Product
Density
Scan
Time
Read
Reliability RESI1
1 15 0.9 -0.04231
2 5 1 0.131019
2 15 0.88 0.028241
3 10 0.77 0.000185

Spring 2011 Senior Project Josh Gilbert
68
1 15 0.9 -0.04231
2 15 0.88 0.028241
2 15 0.84 -0.01176
3 15 0.77 0.008796
1 15 0.9 -0.04231
2 10 1 0.13963
2 10 1 0.13963
1 5 1 0.040463
3 5 0.73 -0.04843
1 10 0.95 -0.00093
3 10 0.6 -0.16981
3 10 0.77 0.000185
1 10 1 0.049074
2 15 0.84 -0.01176
1 5 0.9 -0.05954
2 5 0.96 0.091019
1 10 0.95 -0.00093
2 10 0.92 0.05963
3 5 0.77 -0.00843
1 5 0.95 -0.00954
3 15 0.73 -0.0312
1 15 0.95 0.007685
2 5 0.88 0.011019
1 15 0.9 -0.04231
3 15 0.63 -0.1312
3 5 0.73 -0.04843
3 10 0.8 0.030185
1 5 0.95 -0.00954
2 5 0.8 -0.06898
1 5 0.95 -0.00954
3 5 0.7 -0.07843
1 5 0.95 -0.00954
2 5 0.84 -0.02898
3 5 0.77 -0.00843
3 15 0.8 0.038796
3 5 0.8 0.021574
2 10 0.8 -0.06037
3 15 0.77 0.008796
3 10 0.87 0.100185
3 10 0.83 0.060185
1 10 1 0.049074

Spring 2011 Senior Project Josh Gilbert
69
2 10 0.92 0.05963
2 15 0.8 -0.05176
3 15 0.8 0.038796
2 5 0.8 -0.06898
1 15 1 0.057685
1 10 0.85 -0.10093
2 15 0.88 0.028241
1 10 0.9 -0.05093
2 10 0.88 0.01963
Data Set 5.1
Tag
Number
Product
Density
Sca
n Time
Read
Reliability RESI1
2 2 5 0.94 0.006667
1 3 5 0.84 -0.03333
1 1 10 0.92 0.013333
1 2 10 0.89 -0.05
2 2 10 0.94 -0.01
1 3 5 0.94 0.066667
2 1 5 0.88 -0.01333
1 1 15 0.84 -0.06667
1 3 10 0.84 -0.02
1 1 5 0.84 -0.01333
1 3 5 0.84 -0.03333
1 2 5 0.89 -0.01
1 2 15 0.89 -0.03333
2 3 5 0.88 -0.01333
1 1 10 0.88 -0.02667
2 2 5 0.94 0.006667
1 1 15 0.96 0.053333
2 1 5 0.88 -0.01333
1 2 10 0.94 0
2 1 5 0.92 0.026667
2 2 15 0.89 -0.03667
1 1 10 0.92 0.013333
2 1 10 0.88 -1.1E-16
1 2 5 0.89 -0.01
1 2 15 0.94 0.016667
2 3 10 0.84 -0.02667
1 1 5 0.84 -0.01333
1 3 15 0.94 0.02

Spring 2011 Senior Project Josh Gilbert
70
1 2 15 0.94 0.016667
1 1 15 0.92 0.013333
2 1 15 0.9 1.11E-16
2 3 15 0.88 -0.03333
2 1 10 0.88 -1.1E-16
1 3 10 0.94 0.08
1 3 15 0.96 0.04
2 2 5 0.92 -0.01333
1 2 5 0.92 0.02
2 2 15 0.97 0.043333
1 3 10 0.8 -0.06
2 3 5 0.9 0.006667
2 1 15 0.92 0.02
2 2 10 0.97 0.02
2 1 10 0.88 -1.1E-16
2 3 15 0.92 0.006667
2 3 5 0.9 0.006667
2 3 10 0.88 0.013333
2 3 15 0.94 0.026667
1 1 5 0.88 0.026667
2 2 15 0.92 -0.00667
2 2 10 0.94 -0.01
2 1 15 0.88 -0.02
1 2 10 0.99 0.05
2 3 10 0.88 0.013333
1 3 15 0.86 -0.06
Data Set 5.2
Product
Density
Scan
Time Read Reliability RESI1
1 10 0.83 0.08
1 15 0.83 0.02
1 15 0.75 -0.06
1 5 0.83 -0.0225
3 15 0.67 0.015
2 15 0.67 -0.08
3 10 0.67 0.015
2 15 0.8 0.05
1 10 0.75 0
2 15 0.73 -0.02
3 15 0.61 -0.045

Spring 2011 Senior Project Josh Gilbert
71
2 10 0.67 -0.0975
3 5 0.67 1.11E-16
2 10 0.8 0.0325
1 10 0.67 -0.08
3 5 0.67 1.11E-16
2 15 0.8 0.05
1 10 0.75 0
1 5 1 0.1475
3 5 0.67 1.11E-16
2 5 0.8 0.0175
3 15 0.67 0.015
3 10 0.67 0.015
2 10 0.8 0.0325
1 5 0.75 -0.1025
1 15 0.75 -0.06
2 10 0.8 0.0325
2 5 0.73 -0.0525
1 5 0.83 -0.0225
3 10 0.61 -0.045
2 5 0.8 0.0175
3 5 0.67 1.11E-16
3 10 0.67 0.015
3 15 0.67 0.015
2 5 0.8 0.0175
1 15 0.91 0.1
Data Set 5.3
Product
Density
Scan
Time
Read
Reliability
1 15 1
2 5 1
2 15 1
3 10 1
1 15 1
2 15 1
2 15 1
3 15 1
1 15 1
2 10 1
2 10 1
1 5 1

Spring 2011 Senior Project Josh Gilbert
72
3 5 1
1 10 1
3 10 1
3 10 1
1 10 1
2 15 1
1 5 1
2 5 1
1 10 1
2 10 1
3 5 1
1 5 1
3 15 1
1 15 1
2 5 1
1 15 1
3 15 1
3 5 1
3 10 1
1 5 1
2 5 1
1 5 1
3 5 1
1 5 1
2 5 1
3 5 1
3 15 1
3 5 1
2 10 1
3 15 1
3 10 0.9
3 10 1
1 10 1
2 10 1
2 15 1
3 15 1
2 5 1
1 15 1
1 10 1
2 15 1
1 10 1
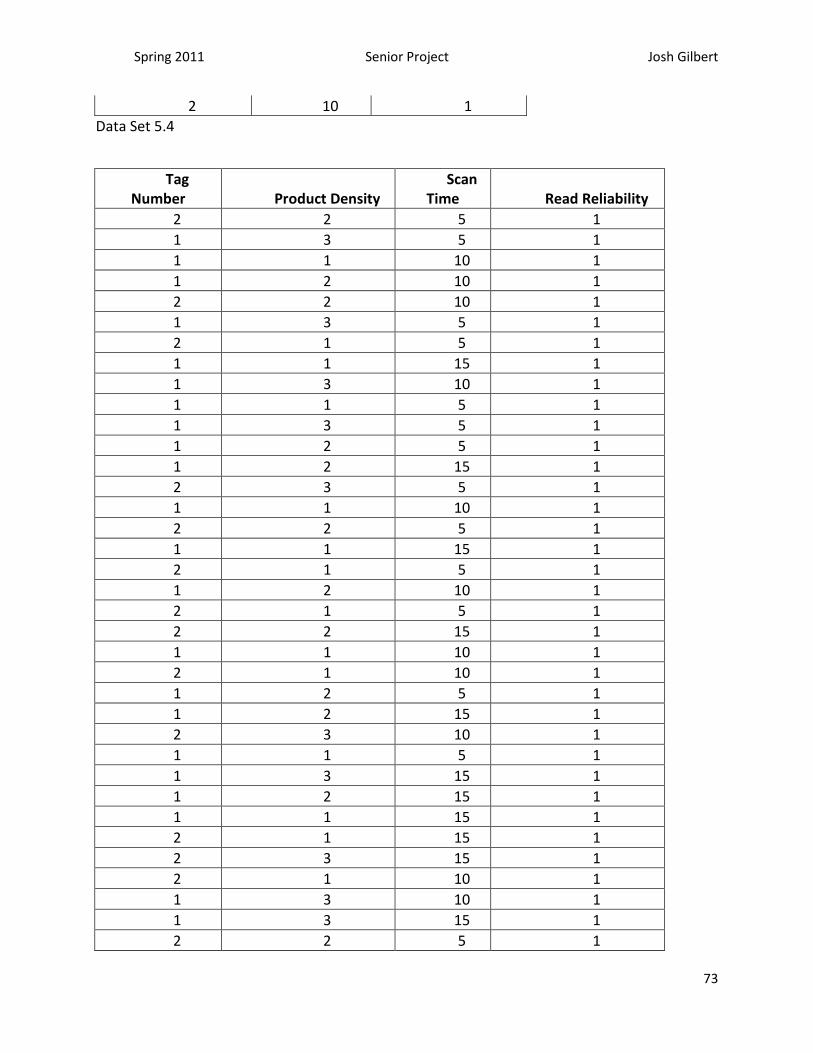
Spring 2011 Senior Project Josh Gilbert
73
2 10 1
Data Set 5.4
Tag
Number Product Density
Scan
Time Read Reliability
2 2 5 1
1 3 5 1
1 1 10 1
1 2 10 1
2 2 10 1
1 3 5 1
2 1 5 1
1 1 15 1
1 3 10 1
1 1 5 1
1 3 5 1
1 2 5 1
1 2 15 1
2 3 5 1
1 1 10 1
2 2 5 1
1 1 15 1
2 1 5 1
1 2 10 1
2 1 5 1
2 2 15 1
1 1 10 1
2 1 10 1
1 2 5 1
1 2 15 1
2 3 10 1
1 1 5 1
1 3 15 1
1 2 15 1
1 1 15 1
2 1 15 1
2 3 15 1
2 1 10 1
1 3 10 1
1 3 15 1
2 2 5 1

Spring 2011 Senior Project Josh Gilbert
74
1 2 5 1
2 2 15 1
1 3 10 1
2 3 5 1
2 1 15 1
2 2 10 1
2 1 10 1
2 3 15 1
2 3 5 1
2 3 10 1
2 3 15 1
1 1 5 1
2 2 15 1
2 2 10 1
2 1 15 1
1 2 10 1
2 3 10 1
1 3 15 1
Data Set 5.5

Spring 2011 Senior Project Josh Gilbert
75