analysis of the dividend policy of the leading firms in
TRANSCRIPT
Master’s Degree
in Management
Final Thesis
Analysis of the dividend policy of the leading
firms in the sportswear industry
Supervisor Ch. Prof. Guido Massimiliano Mantovani
Assistant supervisor Ch. Prof. Federico Beltrame
Graduand Giorgia Callegari Matriculation number 859398
Academic Year
2019 / 2020

I
Abstract
In the field of corporate finance, besides the investment and financing decisions, it is now
common to speak about a third fundamental decision: the one concerning the distribution
of dividends. The objective of this dissertation is to compare the dividend policy of the
leading firms in the sportswear industry namely Nike, Adidas and Asics, highlighting their
similarities and discrepancies.
In the first chapter, we will provide a general introduction regarding the dividend policy
and its main indicators as well as a brief description of stock buybacks as an alternative
mechanism to remunerate shareholders. In the second chapter we will move from theory
to practice and, after an overall presentation of the sportswear industry, we will discuss
about the criteria of selection as well as the methodology used to analyze the chosen firms.
From chapter 3 to chapter 5, we will investigate the current dividend policy of each picked
firm and understand whether (and why) they returned too much or too little, by
comparing the main indexes with respect to industry standards. Then, we will use the
cash flow approach in order to assess the appropriateness of the current dividend policy
of each firm and then, we will discuss about some alternatives. Finally, the results
obtained through the analysis are compared and conclusions drawn.
II
Table of contents
Introduction ....................................................................................................................................................... 1
Chapter 1 – How do firms return cash to shareholders: dividends or stock buybacks? ..... 4
1.1. Dividends .......................................................................................................................................... 4
1.1.1. Classification of dividends ................................................................................................. 5
1.1.2. Indexes & Measures ............................................................................................................. 6
1.1.3. Types of dividend policies ................................................................................................. 7
1.1.4. Dividend payment procedure: key dates .................................................................. 12
1.1.5. Empirical evidences on the dividend policy and the Lintner’s model ........... 13
1.1.6. How dividends affect firms’ value: different schools of thought ..................... 16
1.2. Stock buybacks............................................................................................................................. 22
1.2.1. Types ....................................................................................................................................... 23
1.2.2. Causes and consequences ............................................................................................... 24
Chapter 2 – Analysis of the dividend policy of firms in the sportswear industry ............... 29
2.1. Industry overview ...................................................................................................................... 29
2.2. Criteria of selection and methodology of the analysis ................................................. 32
2.1.1. A cash flow approach to study a firm’s dividend policy ...................................... 35
Chapter 3 – Case history: Nike ................................................................................................................ 40
3.1. Introduction to the company .................................................................................................. 40
3.2. Analysis of the dividend policy of Nike .............................................................................. 44
3.2.1. An overview of the Nike’s dividend policy strategy and of the main indicators
and a comparison with industry standards .............................................................................. 44
3.2.2. A cash flow approach to assess the appropriateness of Nike’s current
dividend policy ..................................................................................................................................... 49
3.2.3. Alternative ............................................................................................................................ 56
III
Chapter 4 – Case history: Adidas ............................................................................................................ 58
4.1. Introduction to the company .................................................................................................. 58
4.2. Analysis of the dividend policy of Adidas .......................................................................... 61
4.2.1. An overview of the Adidas’s dividend policy strategy and of the main
indicators and a comparison with industry standards ........................................................ 61
4.2.2. A cash flow approach to assess the appropriateness of Adidas AG’s current
dividend policy ..................................................................................................................................... 66
4.2.3. Alternative ............................................................................................................................ 72
Chapter 5 – Case history: Asics ............................................................................................................... 74
5.1. Introduction to the company .................................................................................................. 74
5.2. Analysis of the dividend policy of Asics ............................................................................. 77
5.2.1. An overview of the Asics dividend policy strategy and of the main indicators
and a comparison with industry standards .............................................................................. 77
5.2.2. A cash flow approach to assess the appropriateness of Asics’s current
dividend policy ..................................................................................................................................... 81
5.2.3. Alternative ............................................................................................................................ 87
Conclusions ..................................................................................................................................................... 89
Appendix A ...................................................................................................................................................... 97
Appendix B ....................................................................................................................................................105
Appendix C ....................................................................................................................................................111
List of Figures ...............................................................................................................................................117
List of Tables ................................................................................................................................................120
Bibliography .................................................................................................................................................123
Sitography .....................................................................................................................................................128
1
Introduction
In the field of corporate finance, besides the investment and financing decisions, it is now
common to speak about a third fundamental decision: the one concerning the distribution
of dividends. Indeed, a special characteristic of corporations is that they have shares of
equity on which they are authorized by law to pay dividends to their investors as a form
of remuneration for the capital that they had directly or indirectly contributed. The
payment of dividends is not compulsory, it is not something that a corporation must do in
order not to default. This represents a choice that the Board of Directors makes (even
though the final dividend typically requires the approval of the investors at the company’s
Annual General Meeting) by evaluating many different aspects: they cannot be considered
solely as a short-term objective of investors but they should be examined by taking into
consideration the context in which they fall.
Therefore, to quote Black (1976), “Why do corporations pay dividends? Why do investors
pay attention to dividends? Perhaps the answers to these questions are obvious. Perhaps
dividends represent the return to the investor who put his money at risk in the corporation.
Perhaps corporations pay dividends to reward existing shareholders and to encourage
others to buy new issues of common stock at high prices. Perhaps investors pay attention to
dividends because only through dividends or the prospect of dividends do they receive a
return on their investment or the chance to sell their shares at a higher price in the future.
Or perhaps the answers are not so obvious1” (Black F., 1976). The questions through which
Black (1976) started its famous paper “The dividend puzzle” represent some of the most
intriguing problems of financial economics. Still, we do not know how to answer them as
the empirical evidence and the theoretical models regarding the reasons why some firms
distribute dividends and other do not, as well as the effects that dividend policy has on
the value of the firms, are controversial and contradictory. The controversies embedded
by dividends can be symbolized by quoting again Black (1976): “The harder we look at the
dividend picture, the more it seems like a puzzle, with pieces that just don’t fit together”.
The work aims to investigate the dividend policy of three firms competing into the
sportswear industry, namely Nike, Adidas, and Asics. By selecting three companies
1 Black F. (1976), “The dividend puzzle”, Journal of Portfolio Management, 2
2
pertaining to three distinct geographical areas (America, Europe, and Asia) and listed in
some of the most important Stock Exchanges in the world (New York Stock Exchange,
Frankfurt Stock Exchange, and Tokyo Stock Exchange), we will be able to understand and
highlight their similarities and discrepancies. Moreover, we will move further and we will
employ the cash flow approach in order to assess the appropriateness of every firm’s
current dividend policy, by investigating how much of the FCFE (the cash that remained
after new profitable investment opportunities have been financed, also taking into
account the net debt issued) have been distributed and the situation of firms’ current
project portfolios.
The paper is divided into three blocks:
The first block includes the first chapter, in which the focus is dedicated to building some
theoretical knowledge about dividends and their alternative, i.e. stock repurchases.
Regarding dividends, we are going to discuss about:
1- How to classify them (cash/stock dividends, regular/special/liquidating
dividends);
2- The indexes and measures (dividend per share, dividend yield, and the dividend
payout ratio);
3- The different dividend payout strategies (stable, constant, residual, steadily
increasing, low regular and special, irregular or zero dividend policy);
4- The key dates of the dividend procedure and their effects on the price of the stock;
5- The empirical observations on dividend and payout policy;
6- Finally, we are going to investigate the main theoretical models discussing
whether dividends affect the firm’s value or not.
Then, we are going to discuss about the stock buyback option, since it is considered the
main alternative to dividends:
- first, we are going to explore the different approaches through which a firm could
repurchase equity (the modalities of open market share repurchase, tender offer,
direct negotiation, and Dutch action are examined);
- second, we will study the causes and consequences of this choice as a form to
remunerate investors.

3
The second block includes the second chapter which serves as a bridge for us for moving
from theory to practice. In the first half of the chapter, we will introduce the sportswear
industry, the industry in which our chosen firms compete, by investigating the current
trends and changes, and future challenges. In the second half, we will provide the criteria
of selection according to which we came out with the chosen three companies and we will
talk about the methodology through which the analysis is conducted, having an insight on
the cash flow approach.
The final block includes Chapters 3, 4, 5, in which we will perform the analysis of Nike,
Adidas, and Asics, respectively. After providing a general introduction of each company,
we will move into the analysis of the current dividend policy of each chosen firm and we
will try to associate to them one best dividend payout strategy among the ones we will
discuss in Chapter 1. We will understand whether (and why) they returned too much or
too little, by comparing the main indexes (DPS, dividend payout ratio, and dividend yield)
with respect to industry standards. Then, in order to assess the appropriateness of the
current dividend policy of each firm, we will use the cash flow approach which involves
four different steps:
1- Measurement of the cash available to the firm to be distributed to the investors
and what has been actually paid (dividends vs FCFE);
2- Assessment of the quality of the projects that each company has;
3- Evaluation of the dividend policy;
4- Investigation of the interactions between the dividend policy and the financing
policy and forecasts for the next five years.
In the final sections of Chapters 3, 4, 5, we will discuss about some alternatives to the
current dividend policy and we will include forecasts under these new alternatives.
Finally, we will draw the conclusions by comparing the results obtained through the
analysis, highlighting similarities and discrepancies, and identifying from a practical point
of view what the theory states.
4
Chapter 1 – How do firms return cash to shareholders:
dividends or stock buybacks?
A stockholder is an investor who decides to deposit his money in a listed company in
exchange for shares of it. When he decides to do so and therefore, he puts his wealth at
risk, it is because he expects to get returns from the company. These lasts usually can take
two different forms: dividends and capital gains, which occur through share repurchases.
Dividends are paid by firms from their after-tax earnings as a form of reward to those
investors that have decided to retain the shares of a company. Even if historically they
have been the primary format of distributing cash back to shareholders, from the mid-
1980s, an increasing attention has been given to stocks buybacks as the main alternative
(or better complementary) to dividends. Through equity repurchases programs, the firm
uses part of its assets to acquire back equity from those shareholders that are willing to
exit from their investments. Investors beneficiate from this since they should have a
capital gain, which represents a rise in the value of a capital asset (investment or real
estate) that gives them a higher worth than the purchasing price. In other words, capital
gains occur thanks to the stockholders’ choice to sell their stocks and it is the premium
received from the difference between the purchasing price and the selling price.
In the first half of this chapter we are going to talk about dividends or, to be more precise,
we will discuss about how they can be classified, their main indexes and measures, the
different types of dividend policies, the key dates, the main empirical observations and
the different theories on how they affect the firm’s value.
In the second half, we will analyze the stock buybacks and we will discuss about the
different mechanisms in which they can be performed and the reasons behind this
remuneration strategy.
1.1. Dividends
Before going in deep into the topic, it is worth mentioning the definition of dividends:
according to the dictionary, dividends are “the payment by a company of a part of its profit
to the people who own shares in the company”. Hence, when we say dividends, we mean
that part of the firm’s net profit of the period that the Board of Directors, the body which
represents shareholders’ interests and ensures that the management act on their behalf,
5
has chosen to distribute to compensate its stockholders. It is clear from this that the
dividends paid are positively related to the number of shares an investor holds: this
means that the greater the stake in the company, the higher will be the amount received
as dividends. Moreover, since the payments of dividends are a choice that the BoD makes,
they are not compulsory and they do not represent a business expense, meaning that they
are not deductible (indeed, they are paid out of the corporation’s after-tax earnings).
On the other hand, the remaining portion of the after-tax earnings which has not being
distributed is retained into the company and it is employed to finance investments in new
projects or put as reserves. Therefore, as suggested, the dividend policy entails a trade-
off between earnings retained inside the company and cash distributed to investors. This
trade-off has been the heart of many debates and for this reason some general rules
governing the minimum amount of profits that must be retained in order to reinforce the
equity requirements have been developed. Without going in any further detail regarding
these rules, we will now move the focus of our attention on the different ways according
to which dividends could be classified.
1.1.1. Classification of dividends
When we talk about dividends, we can distinguish between two methods through which
a company could pay them: cash dividends and stock dividends. The formers are the most
common and they require a cash outflow (check or electronic transfer) which transfers
economic value from the company to the shareholders directly. On the other hand, the
latter occur when the company, instead of paying out cash, prefers to issue new additional
stocks, increasing the number of shares that each shareholder holds. As a result of this,
the value of each share is diluted, and the price reduced. Stock dividends are usually stated
as a percentage: for instance, when a company announces a 10% stock dividend, this
implies that an investor obtains one new share for every ten currently owned (rising the
number of shares outstanding, each of which worth a 10% less than before). Since stock
dividends do not involve the outflow of cash, they are a common practice when the
company has a lack of liquidity.
Cash and stock dividends partitioning is not the only one: indeed, by considering the time
framework of the payments, dividends could be classified also as regular, special, or
liquidating. Regular dividends are paid at regular interim (annually, semi-annually, or
quarterly). American companies typically distribute dividends quarterly (every three

6
months), while the annual basis is preferred by European companies. On the other hand,
dividends could be paid in addition to the regular ones, at irregular intervals, as one-time
payment that most likely will not be repeated in the future. These are named special
dividends (also called extra dividends). They are generally larger if compared to the regular
ones as they usually aim at conveying a positive signal to the market: they are typically
declared after exceptionally strong company earnings results, as a way to distribute the
realized profits directly to shareholders. Finally, “liquidating dividends” design the
payment that a corporation makes to its investors during the liquidation (sold off) of the
business. They represent the return of the investors' original capital, plus (or minus) any
residual retained earnings (or retained losses, respectively) of the business.
1.1.2. Indexes & Measures
In order to assess a firm’s dividend policy, it is common to look at three main indexes,
namely the dividends per share, the dividend yield, and the dividend payout ratio (and its
opposite, that is the retention ratio).
The dividends per share (DPS) represent the amount of cash dividend described in terms
of dollars per share and they are defined as the sum of the cash dividends announced by
a firm for every ordinary share outstanding:
𝐷𝑃𝑆 =𝐷𝑖𝑣𝑖𝑑𝑒𝑛𝑑𝑠 𝑓𝑜𝑟 𝑡ℎ𝑒 𝑝𝑒𝑟𝑖𝑜𝑑 − 𝑆𝑝𝑒𝑐𝑖𝑎𝑙 𝑑𝑖𝑣𝑖𝑑𝑒𝑛𝑑𝑠
𝑁𝑢𝑚𝑏𝑒𝑟 𝑜𝑓 𝑠ℎ𝑎𝑟𝑒𝑠 𝑜𝑢𝑡𝑠𝑡𝑎𝑛𝑑𝑖𝑛𝑔
This ratio is the most straightforward indicator used by investors to calculate the return,
in the form of dividends, from owning a share over time: an increase in this index reflects
the management perception that earnings are going to grow as well.
The dividend yield is the ratio between the annual dividend per share paid by a company
and the price per share, displayed as a percentage:
𝐷𝑖𝑣𝑖𝑑𝑒𝑛𝑑 𝑦𝑖𝑒𝑙𝑑 =𝐴𝑛𝑛𝑢𝑎𝑙 𝑑𝑖𝑣𝑖𝑑𝑒𝑛𝑑 𝑝𝑒𝑟 𝑠ℎ𝑎𝑟𝑒
𝑃𝑟𝑖𝑐𝑒 𝑝𝑒𝑟 𝑠ℎ𝑎𝑟𝑒
Sometimes, this indicator is used to judge the investment risk of the enterprise, as
shareholders may decide to opt for investments in stocks with a high dividend yield: some
researches proved that, on average, elevated dividend yields provide greater returns from
the stock. Nevertheless, the significance of this measure is related to the fact that it
embodies an indicator of that component of the total return, which is originated from
dividends, with the balance coming from price appreciation:
𝐸𝑥𝑝𝑒𝑐𝑡𝑒𝑑 𝑟𝑒𝑡𝑢𝑟𝑛 𝑜𝑛 𝑠𝑡𝑜𝑐𝑘 = 𝑑𝑖𝑣𝑖𝑑𝑒𝑛𝑑 𝑦𝑖𝑒𝑙𝑑 + 𝑝𝑟𝑖𝑐𝑒 𝑎𝑝𝑝𝑟𝑒𝑐𝑖𝑎𝑡𝑖𝑜𝑛
7
The last measure when it comes to a dividend policy is the dividend payout ratio,
representing the percentage of the earnings paid to investors as dividends:
𝐷𝑖𝑣𝑖𝑑𝑒𝑛𝑑 𝑝𝑎𝑦𝑜𝑢𝑡 𝑟𝑎𝑡𝑖𝑜 =𝐴𝑛𝑛𝑢𝑎𝑙 𝑑𝑖𝑣𝑖𝑑𝑒𝑛𝑑𝑠 𝑝𝑎𝑖𝑑
𝐸𝑎𝑟𝑛𝑖𝑛𝑔𝑠 (𝑛𝑒𝑡 𝑖𝑛𝑐𝑜𝑚𝑒)
Since this index mirrors the amount of the profit which can be distributed as dividend, it
is widely used to estimate dividends in the future period, as most analysts estimate
growth in earnings rather than growth in dividends. Sometimes, this percentage is greater
than 100% even though it seems anomalous, as by doing this, dividends would be greater
than earnings, creating an unsustainable situation and therefore some problems for the
financial health of a firm which would be forced to cut them in the future.
The corresponding indicator to the dividend payout is called retention ratio and it relates
that part of the earnings which the company has decided to reinvest, over the net income
of the firm:
𝑅𝑒𝑡𝑒𝑛𝑡𝑖𝑜𝑛 𝑟𝑎𝑡𝑖𝑜 =𝑅𝑒𝑡𝑎𝑖𝑛𝑒𝑑 𝑒𝑎𝑟𝑛𝑖𝑛𝑔𝑠
𝐸𝑎𝑟𝑛𝑖𝑛𝑔𝑠 (𝑁𝑒𝑡 𝐼𝑛𝑐𝑜𝑚𝑒)
In other words, a retention ratio represents the remaining percentage of the profit that
the company has decided not to distribute:
𝑅𝑒𝑡𝑒𝑛𝑡𝑖𝑜𝑛 𝑟𝑎𝑡𝑖𝑜 = 1 − 𝑑𝑖𝑣𝑖𝑑𝑒𝑛𝑑 𝑝𝑎𝑦𝑜𝑢𝑡 𝑟𝑎𝑡𝑖𝑜
This measure enables shareholders to determine the level of re-investment of the
company; an elevated rate of retention (and a low payout ratio) is regarded as a symptom
of a high rate of growth of earnings and the vice versa is true, a lower retention rate (and
high-level payout ratio) is associated with lower growth in earnings.
1.1.3. Types of dividend policies
Having understood that with the words “dividend policy” we mean the policy that a
company employs in order to structure its dividend payout strategy, it is now important
to address the following question: how do companies actually determine the level of
dividends that should be distributed in a specific period?
Based on the value of the payments, their growth trends, and the timeframe in which they
occur, we can distinguish between several dividend payout strategies.
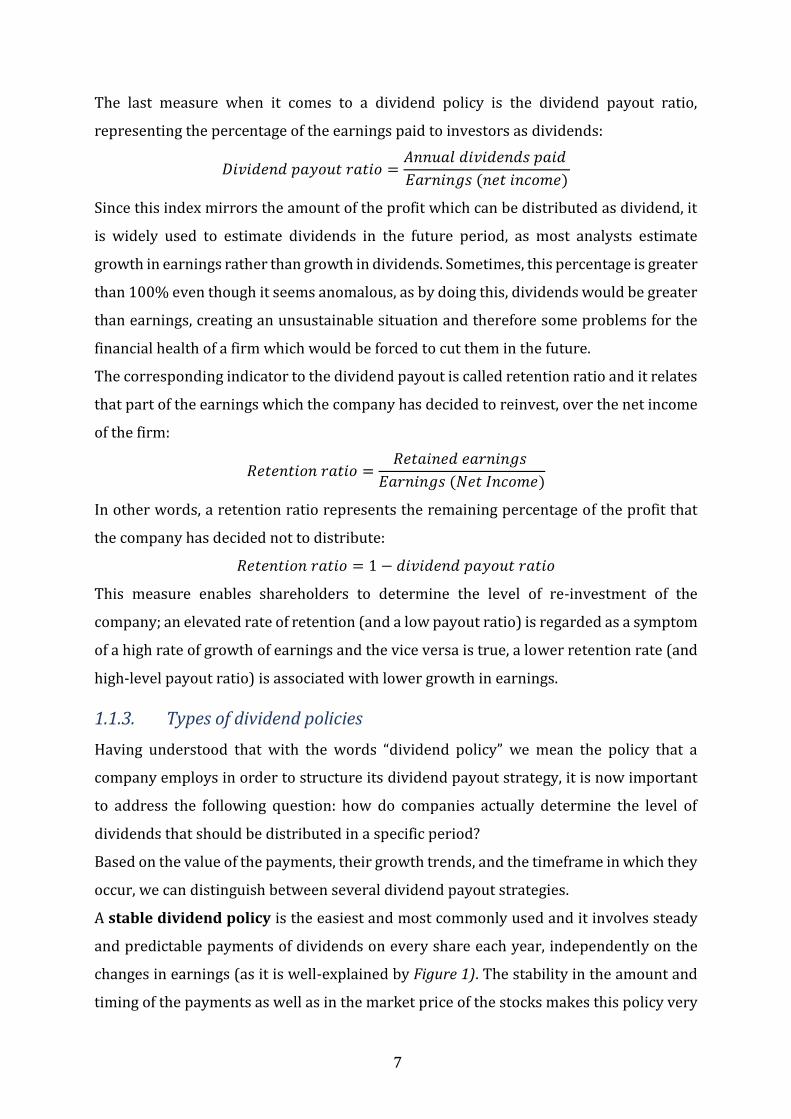
A stable dividend policy is the easiest and most commonly used and it involves steady
and predictable payments of dividends on every share each year, independently on the
changes in earnings (as it is well-explained by Figure 1). The stability in the amount and
timing of the payments as well as in the market price of the stocks makes this policy very
8
attractive to shareholders. On the other hand, this also causes its major weakness: since
investors expect dividends to follow the payout trend without a stated limited, they do
not experience hikes in dividends in the boom years or drops in the bad years, or in
periods in which new investment opportunities require more funds. Moreover, the
independence from earnings may increase the pressure on the financial health of the
company in its dark periods: that’s why this policy is employed mostly by companies at
the mature stage.
Figure 1 – Stable dividend policy: a graphical representation. EPS = earnings per share; DPS = dividends per share. Source:
www.accountingnotes.net
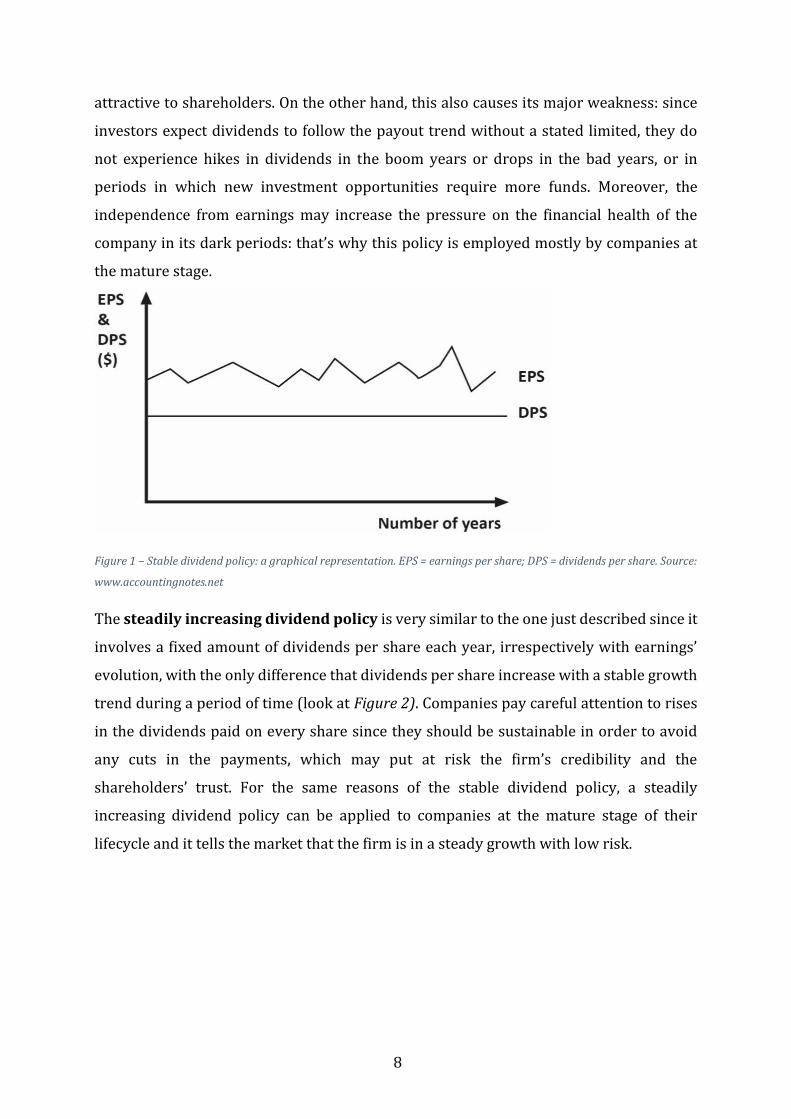
The steadily increasing dividend policy is very similar to the one just described since it
involves a fixed amount of dividends per share each year, irrespectively with earnings’
evolution, with the only difference that dividends per share increase with a stable growth
trend during a period of time (look at Figure 2). Companies pay careful attention to rises
in the dividends paid on every share since they should be sustainable in order to avoid
any cuts in the payments, which may put at risk the firm’s credibility and the
shareholders’ trust. For the same reasons of the stable dividend policy, a steadily
increasing dividend policy can be applied to companies at the mature stage of their
lifecycle and it tells the market that the firm is in a steady growth with low risk.
9
Figure 2 – Steadily increasing dividend policy: a graphical representation. Source: www.accountingnotes.net
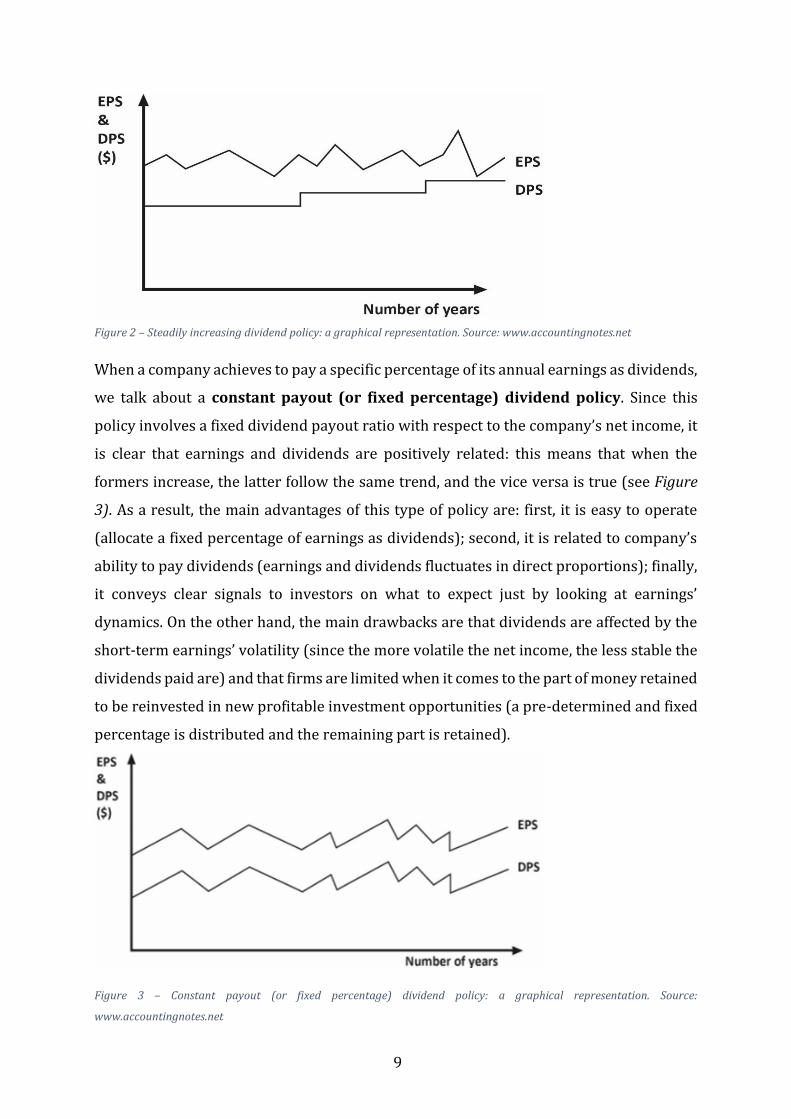
When a company achieves to pay a specific percentage of its annual earnings as dividends,
we talk about a constant payout (or fixed percentage) dividend policy. Since this
policy involves a fixed dividend payout ratio with respect to the company’s net income, it
is clear that earnings and dividends are positively related: this means that when the
formers increase, the latter follow the same trend, and the vice versa is true (see Figure
3). As a result, the main advantages of this type of policy are: first, it is easy to operate
(allocate a fixed percentage of earnings as dividends); second, it is related to company’s
ability to pay dividends (earnings and dividends fluctuates in direct proportions); finally,
it conveys clear signals to investors on what to expect just by looking at earnings’
dynamics. On the other hand, the main drawbacks are that dividends are affected by the
short-term earnings’ volatility (since the more volatile the net income, the less stable the
dividends paid are) and that firms are limited when it comes to the part of money retained
to be reinvested in new profitable investment opportunities (a pre-determined and fixed
percentage is distributed and the remaining part is retained).
Figure 3 – Constant payout (or fixed percentage) dividend policy: a graphical representation. Source:
www.accountingnotes.net
10
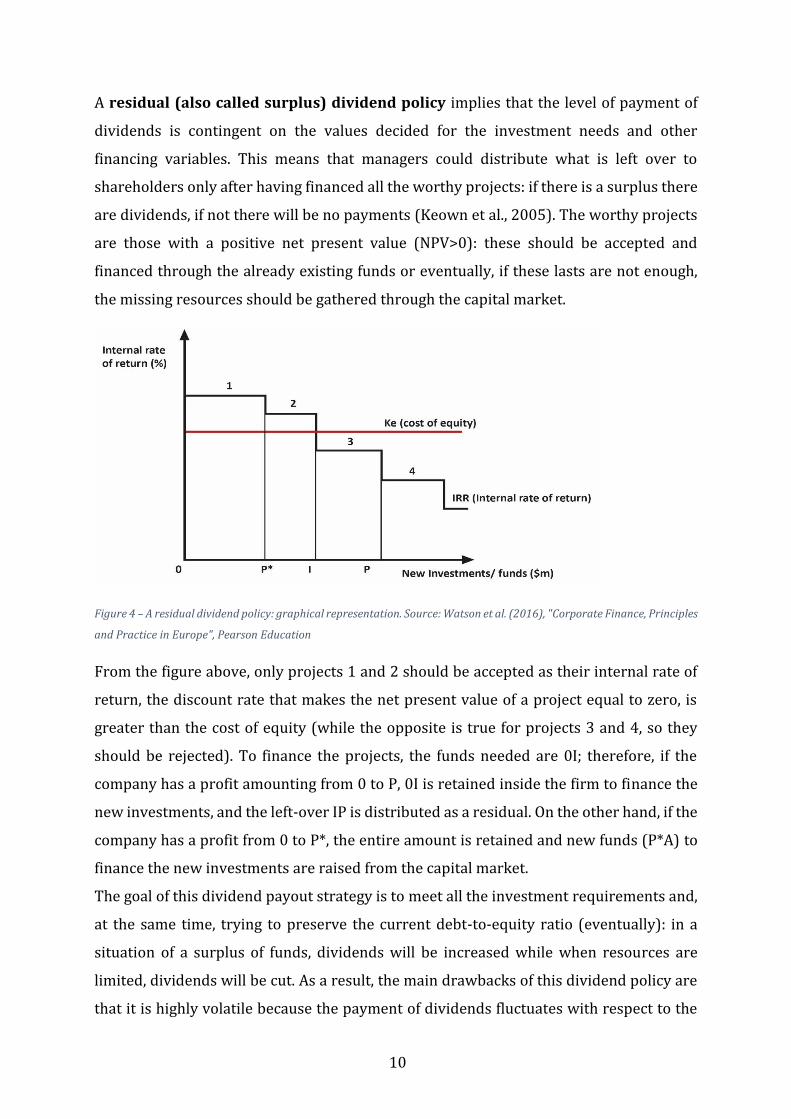
A residual (also called surplus) dividend policy implies that the level of payment of
dividends is contingent on the values decided for the investment needs and other
financing variables. This means that managers could distribute what is left over to
shareholders only after having financed all the worthy projects: if there is a surplus there
are dividends, if not there will be no payments (Keown et al., 2005). The worthy projects
are those with a positive net present value (NPV>0): these should be accepted and
financed through the already existing funds or eventually, if these lasts are not enough,
the missing resources should be gathered through the capital market.
Figure 4 – A residual dividend policy: graphical representation. Source: Watson et al. (2016), "Corporate Finance, Principles
and Practice in Europe", Pearson Education
From the figure above, only projects 1 and 2 should be accepted as their internal rate of
return, the discount rate that makes the net present value of a project equal to zero, is
greater than the cost of equity (while the opposite is true for projects 3 and 4, so they
should be rejected). To finance the projects, the funds needed are 0I; therefore, if the
company has a profit amounting from 0 to P, 0I is retained inside the firm to finance the
new investments, and the left-over IP is distributed as a residual. On the other hand, if the
company has a profit from 0 to P*, the entire amount is retained and new funds (P*A) to
finance the new investments are raised from the capital market.
The goal of this dividend payout strategy is to meet all the investment requirements and,
at the same time, trying to preserve the current debt-to-equity ratio (eventually): in a
situation of a surplus of funds, dividends will be increased while when resources are
limited, dividends will be cut. As a result, the main drawbacks of this dividend policy are
that it is highly volatile because the payment of dividends fluctuates with respect to the
11
available investment opportunities and that it might not be sustainable in the long run.
On the other hand, by adopting this kind of policy, the company could convey a feeling of
trust in the investment projects to the shareholders. In addition to the information
content, the other advantage of this payout strategy is that the management is free to
pursue every profitable opportunity without worrying about the dividend constraints:
this is convenient in terms of business operations.
A low regular dividend and special dividend policy (constant rupee dividend plus
extra dividend) allows companies to keep the level of the fixed dividends very low every
year (and, therefore, decreasing the possibilities of not distributing any) and add to them
the appropriate special dividends by taking into account the operating profit, the capital
expenditure, and the working capital. This kind of policy entails a large degree of
flexibility since not only it permits to distribute special dividends in the boom years, but
also it helps to protect the enterprise from the risk of financial distress which could occur
by implementing a stable dividend policy. In addition, it solves problems, arising from the
constant dividend policy.
When a company is not able to commit to paying dividends in regular intervals as it does
not have long standing and stable earnings, it employs an irregular dividend policy, in
which dividends do not follow any pattern or trend. The main advantage of this kind of
dividend policy is that it entails a large degree of flexibility. On the other side, its main
disadvantage is that it has no regularity both in the amount of the payments and their
timing, which might not please investors.
Finally, when a firm decides not to distribute any dividends to its shareholders, we say it
employs a zero-dividend policy (no dividend payout). The entire profit earned is
retained because firms (especially those companies that are new and growing) need funds
to be reinvested into the business in the hope for future growth and better profits in the
times to come. Indeed, these companies are constantly improving and expanding, so they
are attractive because the value of their stocks should appreciate. Moreover, the firm
beneficiate since it does not create any transaction costs related to the distribution of
dividends. On the other hand, it may happen that firms select not to pay any dividends
because they have a lack of liquidity which may be due to unfavorable working capital
position or simply to the poor operating results. This kind of policy is suitable for those
investors who are not in the need for a fixed stream of resources and for those who prefer
capital gains to dividends, maybe because they have a tax benefit in choosing the formers.
12
1.1.4. Dividend payment procedure: key dates
For what concerns the payment procedure of cash dividends, some key dates should be
remembered since they are fundamental to identify those investors who meet the
requirements for receiving the compensations and those who do not. Hence, in this
section, we are going to have an insight into the chronological order of events which
brings about the dividends’ payments.
The choice to pay dividends rests on the hands of the Board of Directors of the firm which
issues a declaration stating how much will be distributed and the timeframe of the
payments. As a result, on the declaration date (announcement date), the first of four
key dates in the dividend payment process, the company commits itself to a short-term
obligation: from the moment in which dividends are declared, a kind of debt for the
corporation arises, which cannot be rescinded easily. In turn, by announcing an increase,
a reduction, or a preservation with respect to the previous dividend payout, a company
conveys some useful information to the market which reacts respectively in a positive,
negative, or in a neutral way.
In order to be sure that the dividend checks are received by the right people, brokerage
firms and Stock Exchanges set up an ex-dividend date (ex-date) which represents the
first day on which the stock trades without the right to obtain the payment of the
dividends declared. This means that the stock will trade cum dividends until then (2-3
weeks after the announcement date) and therefore that investors must have purchased
the stock before this date in order to receive any compensation. Since dividends are
valuable to investors and on the ex-date dividend eligibility expires, the price of the stock
is affected negatively to reflect that loss (it falls by the value of the dividends to be paid).
Hence, dividends affect negatively the market value of equity, but the number of shares
outstanding remains preserved.
A few days after the ex-date (usually two business days later), the record date takes
place. In this event, the company officially displays the list of those shareholders (the so-
called holders of records) entitled to receive the dividends announced; it should be
mentioned that the price of the stock is not affected.
Finally, the closing step occurs on the (dividend) payment date in which the dividend
checks are mailed to shareholders. Again, the price of the stock is not affected.

13
Figure 5 – The dividend payment procedure & its effect on stock price: a graphical representation. Source: Damodaran A.
(2004), “Applied Corporate Finance”, John Wiley & Sons, Inc., 4th Edition
1.1.5. Empirical evidences on the dividend policy and the Lintner’s model
So far, we have understood that each firm has its own approach when it comes to setting
a specific dividend payout strategy. Nevertheless, some empirical researches and their
consequent findings highlighted some common characteristics.
Among the most important studies, we would like to have an insight into the one
performed by John Lintner in 1956, in which he surveyed top managers to assess how
they formulated dividend policy decisions. By reviewing the available information of over
600 listed firms, Lintner not only managed to develop a dividend model explaining the
85% of the variations in the dividends of the companies investigated but also he was able
to come out with some general “rules” that seem to remain true even today.
The first of these is that dividends tend to lag behind earnings, i.e. increases in earnings
are followed by increases in dividends and vice versa, as demonstrated by Figure 6:
Figure 6 – A graphical representation of the fluctuations of the earnings and dividends for companies in the S&P 500 from
1960 to 2012. Source: Damodaran A. (2004), “Applied Corporate Finance”, John Wiley & Sons, Inc., 4th Edition
14
To be more precise, Lintner argued that companies set a long-term target payout ratio
and that they align dividends towards it gradually (and cautiously), by setting a specific
speed of adjustment, “only after management had satisfied itself that a change in the
existing rate would be positively desirable” (Lintner, 1956). This implies that the
management of the company pays attention to the alteration of the existing dividend rate
rather than on absolute levels. As a result, Lintner arrived at the second main outcome of
its research: he founded evidence of the fact that dividends are “sticky” as companies are
very reluctant to cut them, especially those that have paid them for the longest. Indeed,
companies prefer stability and avoid any cuts in dividends in order to prevent adverse
reactions from investors (he argued that the market reacts positively to the
announcement of an increase in the dividends payout and negatively to a reduction of it).
Since dividends are sticky and “most managements sought not to making changes in their
dividend rates that might have to be reversed within a year or so” (Lintner, 1956), he
reached its third conclusion according to which dividends follow a much smoother path
than do earnings. This means that dividends are not as volatile as earnings on a year-to-
year basis since, by adopting a “policy of progressive, continuing ‘partial adaptation’”, the
payout tends to stabilize and fluctuations from one period to another are reduced.
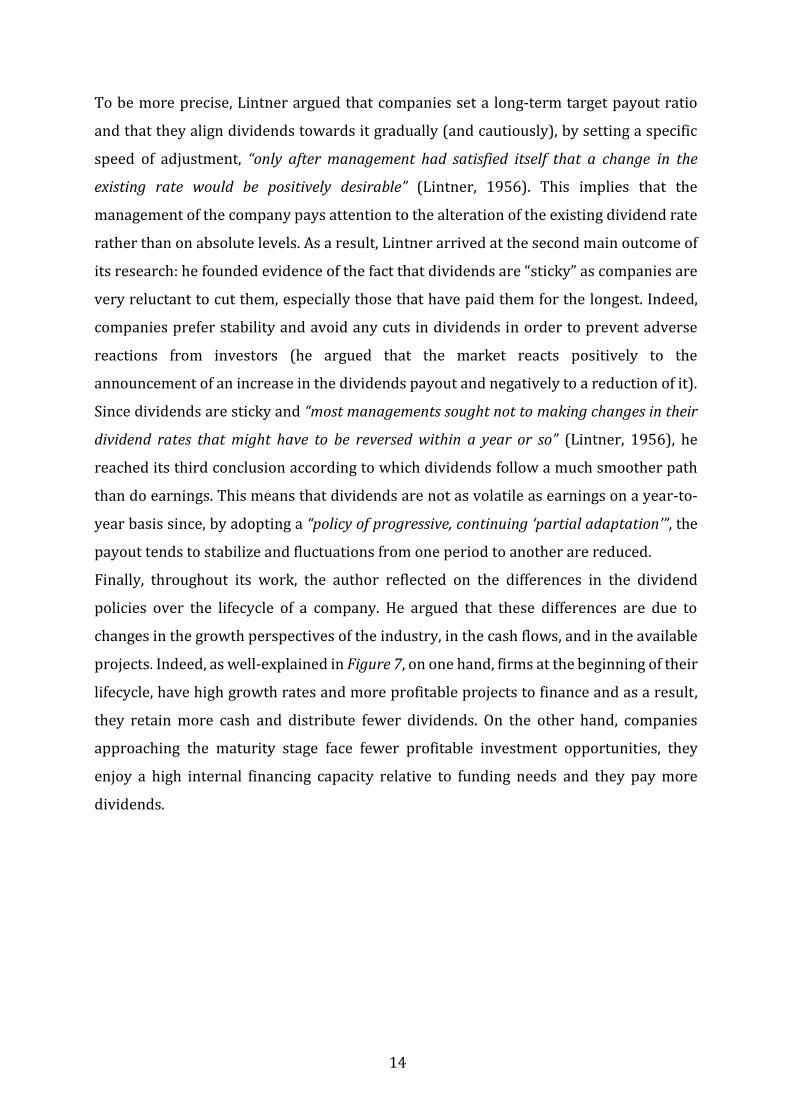
Finally, throughout its work, the author reflected on the differences in the dividend
policies over the lifecycle of a company. He argued that these differences are due to
changes in the growth perspectives of the industry, in the cash flows, and in the available
projects. Indeed, as well-explained in Figure 7, on one hand, firms at the beginning of their
lifecycle, have high growth rates and more profitable projects to finance and as a result,
they retain more cash and distribute fewer dividends. On the other hand, companies
approaching the maturity stage face fewer profitable investment opportunities, they
enjoy a high internal financing capacity relative to funding needs and they pay more
dividends.
15
Figure 7 – The lifecycle of a firm and the dividend payout. Source: Damodaran A. (2004), “Applied Corporate Finance”, John
Wiley & Sons, Inc., 4th Edition
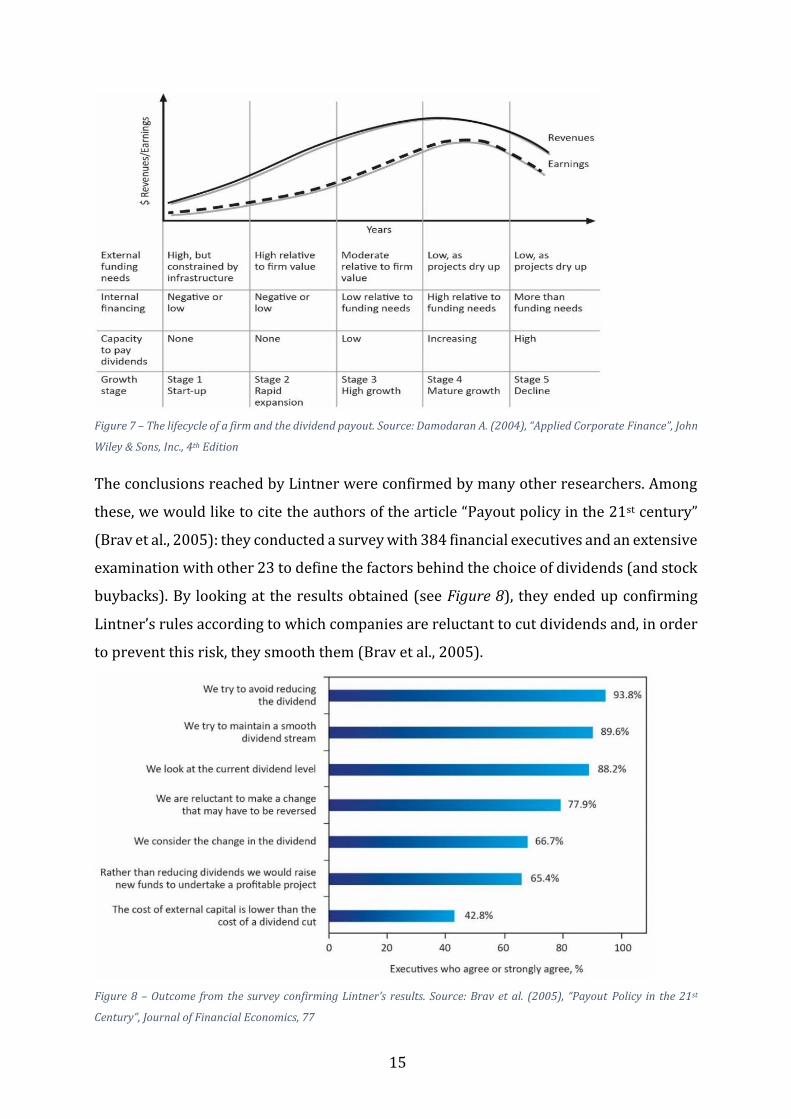
The conclusions reached by Lintner were confirmed by many other researchers. Among
these, we would like to cite the authors of the article “Payout policy in the 21st century”
(Brav et al., 2005): they conducted a survey with 384 financial executives and an extensive
examination with other 23 to define the factors behind the choice of dividends (and stock
buybacks). By looking at the results obtained (see Figure 8), they ended up confirming
Lintner’s rules according to which companies are reluctant to cut dividends and, in order
to prevent this risk, they smooth them (Brav et al., 2005).
Figure 8 – Outcome from the survey confirming Lintner’s results. Source: Brav et al. (2005), “Payout Policy in the 21st
Century”, Journal of Financial Economics, 77
16
Fama and Babiak (1968) in their article “Dividend policy: an empirical analysis”, applied
Lintner’s model in order to study the dividend policy of 392 firms and they ended up
confirming its validity. By regressing changes in dividends against changes in earnings,
they recognized a lag between the two, proving Linter’s argument that alterations in net
earnings are the single most important factor influencing the dividend payout rate.
Among other researchers confirming the conclusions reached by Lintner, we could also
name De Angelo and De Angelo (1990), supporting the argument that cuts in dividends
are avoided especially for those firms that had distributed dividends for a long period. Or
Grullon et al. (2002), through the article “Are Dividend Changes a Sign of Firm Maturity?”,
confirmed the thesis that the optimal dividend payout rate is influenced by the lifecycle
stage in which a firm position itself. In their “maturity hypothesis”, they argued that firms
moving from the growth phase to the maturity phase, face fewer profitable projects: as a
result, the need for resources is reduced and the increased available free cash is
distributed to shareholders (either in the form of dividends or by repurchasing equity).
Cyert and March (1993) laid down that the explanation of Lintner’s results is founded in
what it has been called “uncertainty avoidance”. Since the market is uncertain, managers
deal with this “issue” by establishing some simple and evergreen rules of thumb, such as
setting the level of dividend payout by looking at the industry standards, determine
changes in dividends when changes in earnings occur and so on. Despite this effort, still
the “dividend puzzle” described by Fisher remains unsolved.
1.1.6. How dividends affect firms’ value: different schools of thought
As the main goal of companies is to maximize the value for shareholders, a central
question regarding dividend policy is whether or not it changes the firms’ value. The
objective of this paragraph is to provide a literature review that aims at providing a
comprehensive understanding of the different theories explaining how a dividend policy
might affect shareholders’ wealth. On a macrolevel, there are two different perspectives:
- on one side, a group supports the idea that dividends are irrelevant, with no effects
on share prices and the value of the firms;
- on the other hand, another group believes that dividends do affect the value of the
firm and the price of the stocks. Inside this last group, we can distinguish between:
o those who perceive dividends as an attractive and positive influence and
17
o those who consider dividends as something bad which is negatively
correlated with the price of stocks.
Dividend Irrelevance Theory
The most important exponents of the first perspective have been Modigliani and Miller
(1961): through the publication of their essay “Dividend Policy, Growth, and the Valuation
of Shares”, they proposed the so-called ‘Dividend Irrelevance Theory’, a financial theory
which is considered as a pillar in corporate finance. Supposing a state of ideal economy
(perfect capital market, rational behavior of investors, and perfect certainty), they argued
that the dividend policy adopted by a company per se is not capable neither to create nor
to destroy value. This means that it has no effects on the price of the shares of the firm: by
quoting Modigliani and Miller, “the dividend payout [a company] chooses to follow will
affect neither the current price of its shares nor the total return to its shareholders2”. The
only determinant of the future profitability and the market value of the company is the
investment policy whose success relies on management capacities: as a result, the net
payout (dividends and share buybacks), is the residual of the difference between earnings
and the optimal level of investments. Besides the irrelevance on the firm’s value,
irrelevance extends also on the choice of dividends or capital gains: indeed, in a world
with no taxes, or different tax treatments of the two, investors should be neutral between
receiving their returns as dividends or as price appreciation. The essence of their
argument rests on the idea that investors will not pay a premium price for higher payout
firms since they do not need dividends to transform their shares into liquidity. The same
result can be achieved by simply selling their shares and have a capital gain equivalent to
the cash that they would have obtained if the company had decided to pay out dividends.
Among the other researchers who performed some studies consistent with Modigliani
and Miller theorems, we can mention Miller and Scholes (1982) or Black and Scholes
(1974) who concluded their work by saying that they “have found that a corporation that
increases its dividend can expect that this will have no definite effect on its stock price3”.
2 Modigliani F., Miller M. H. (1961), “Dividend Policy, Growth, and the Valuation of Shares”, Journal of
Business, 34(4)
3 Black F., Scholes M. S. (1974), “The effects of dividend yield and dividend policy on common stock prices
and return”, Journal of Financial Economics, 1(1)
18
Dividends relevance theory
The arguments brought ahead by Modigliani and Miller are generally believed as valid
when we do not abandon their very strict assumptions. Nevertheless, these do not hold in
the real world, since the capital market is not perfect. As a result of these imperfections, a
school of thought claiming that dividends are relevant and they have in impact both on
the value of firms and investors, either in a positive or negative way, has emerged.
Within those supporting the idea that “dividends are good”, we could mention Walter J. E.
(1956). He was among the firsts that tried “to fabricate a theoretical model which depicts
the relationship between dividend policies and common stock prices4”; he argued that a
dividend policy is relevant and it has its bearing on the share prices of the firm. Even
though its model was criticized for its unrealistic assumptions, he demonstrated that the
efficiency of a dividend policy is represented by the relationship between the internal rate
of return and the cost of capital:
• When the rate of return on an additional investment is bigger than the cost of capital
(IRR > K), the company should retain the entire amount of earnings and reinvest it in
new profitable projects (growth firms have 100% retention ratio);
• When the rate of return on an additional investment is smaller than the cost of capital
(IRR < K), the company should distribute the entire amount to investors as it lacks
new profitable projects (0% retention ratio);
• When the rate of return on an additional investment is equal to the cost of capital
(IRR = K), the company should be indifferent to the amount to retain or to reinvest
(retention ratio oscillates between 0% and 100%).
The same hypothesis related to the positive influence of dividends on the prices of the
stocks and hence on the value of the firms was supported empirically by other researchers
like Harkavy (1953) or Graham & Dodd (1934), that moved forward by remarking the
overreaction of the stock markets to the announcement of a dividend change.
Another argument on why dividends matter is the “Bird in the Hand Theory” which has
its roots on the famous expression “a bird in the hand is worth two in the bush”. Supported
by Lintner (1956) and Gordon (1959), this theory argues that shareholders are more
leaned towards dividends rather than capital gains since the formers are perceived to be
more certain. As a result, the investors’ required rate of return decreases as long as
4 Walter J. E. (1956), “Dividend Policies and common stock prices”, The Journal of Finance, 11(1)
19
dividends increase, confirming the idea that dividend policy is relevant. Nevertheless, this
argument has demonstrated to be a fail since it should not be a choice between certain
dividends today and doubtful share price increases tomorrow, but between dividends
today and an equivalent capital gain today.
The supporter of the “Bird in the Hand Theory”, Gordon M. J. (1959, 1962) moved ahead
and developed a version of the dividend discount model (the dividend growth model)
according to which the value of the shares of a company is given by the sum of all future
dividends discounted back to their present value. Therefore, by enlarging dividends, firms
will be able to increase the value of their shares and their overall worth as well.
Among the advocates of the relevancy of dividends, some claimed that they can be
conceived as a control mechanism tool to reduce the conflict of interests between
managers and investors. Even though the aim of for-profit firms is the profit indeed and
managers’ goal is to maximize the shareholders’ wealth and the value of the firm, it may
happen that the interests between the two are not aligned. The theory describing the
issues between the principal (investors) and the agent (the management which is
supposed to act on behalf of the former) was originally formalized by Jensen and Meckling
(1976) and it has been referred since then to “agency theory”. On this premise, dividends’
payments are used as a strategic and planning device to reduce the agency problem and
to check that the interests between the insiders and the outsiders are aligned. First,
dividends are employed as an instrument to decrease free cash flow available in the hands
of the managers (which represents the remaining cash flow available after all the
investment opportunities with a positive NPV were financed) as well as the potential
overinvestment in those projects with a doubtful return (Jensen, 1986; Black, 1976).
Second, since firms need money to operate and funds are raised mostly through credit
institutions, the capital market could be employed as a sort of monitoring device
scrutinizing the business operations performed by the management. As a result,
managers are almost obliged to produce positive cash flows (and profits) as well as to face
their own risk-aversion (Easterbrook, 1984). Finally, since investors’ revenues are
contingent on the payment of dividends, managers use the dividend policy in order to
demonstrate that shareholders’ interests and priorities have been taken into account.
Opponents to this argument sustain that not only there are cheaper mechanisms to show
the company’s profitability (for instance, through the reports of the auditors), but also
20
that dividends are often distributed by well-established firms that are already trusted by
investors.
Besides to the mitigation of the agency problem, it is believed that dividends convey
information or signals regarding a company’s expected future cash flows and business
prospects. By quoting Black (1976), “dividend changes, or the fact that the dividend doesn’t
change, may tell investors more about what the managers really think than they can find
out from other sources. Assuming that the managers’ forecasts are somewhat reliable,
dividend policy conveys information5”. Starting from the idea that information
asymmetries exist since the insiders possess more information regarding the firm and its
projects, managers can convey their implicit feelings on the firm’s expected value through
their dividends’ choices. Indeed, even though from a short-term perspective companies
could cheat by blowing up profits and by distributing more dividends, from a long-term
perspective this is not sustainable. As a result, according to the signaling theory of
dividends, high dividends convey good news because they indicate the firm’s ability to
generate profit in the future, resulting in an increase in the price of the stocks (and in the
value of the company). On the other hand, lower dividends convey bad news because they
signal a deterioration of the company’s prospects, resulting in a drop in the price of the
stocks (and in the value of the company) (Bhattacharyya, 1979). Even though empirical
evidence have demonstrated the existence of the signaling theory, there is still a lot of
skepticism around it.
In addition to what we have said so far, dividends are claimed to be relevant since they
reflect the strength of a company to meet its obligations, leading rating agencies to
increase firms’ current ratings. As a result, companies will be able to accumulate funds
from capital markets without any trouble or even to negotiate loans at advantageous
rates. Nevertheless, dividends can be increased by issuing new debt and credit
institutions should pay attention to the finance mix of the firm and evaluate whether it is
under or over levered.
Moreover, it has been claimed that “dividends are good “simply because shareholders like
them and to support this statement three possible explanations that have their roots in
the field of behavioral finance have been provided. First, investors lack self-control and
they use dividends as a limit for their periodic consumptions; second, investors’ utility
5 Black F. (1976), “The dividend puzzle”, Journal of Portfolio Management, 2
21
earned from capital gain plus dividend is greater than an equal utility obtained from
capital gains only; finally, investors are more concerned with error of commissions than
with error of omission (Shefrin and Statman, 1984).
A further theory explaining the reason why dividends matter is the so-called catering
hypothesis, according to which managers give investors what they currently demand.
Since the distribution of dividends follows investors’ desires, companies are inclined to
pay out dividends when shareholders need them, while they simply omit them when they
are not wanted (Baker and Wurgler, 2004).
This conducts us to the clientele effect: since dividends provide a constant and fixed
source of money, a natural clientele exists for those shares that pay money. What happens
on the firm’s lifecycle, occurs on a shareholder’s lifecycle: when investors get older and
retire, they exit from the saving stage and they enter into the dissaving stag. As a result,
they rather prefer shares that pay dividends in order to keep their purchasing power
unaltered (Shefrin and Statman, 1984). Since each investor selects the option that
maximizes its after-tax wealth, different types of shareholders are attracted by different
payout policies, and hence a variation in the dividend policy would create a change of the
ownership structure. For instance, on one side, some investors may prefer dividends with
respect to capital gains because these lasts entail high transaction costs. On the opposite
side, others may prefer capital gains since they have historically been taxed at a lighter
rate with respect to dividends. This leads us to the “dividends are bad” school of thought,
which suggests that dividends are a bad influence, negatively impacting the value of the
firm and of shareholders. They are bad for the company because a higher dividend payout
strategy is followed by a higher required rate of returns, adversely influencing the price
of the shares (Blume,1980); they are bad for the investors since the heavier tax rate of
dividends produces a lower after-tax return, even though this argument has proved to be
flawed since in the recent years many countries have implemented some actions to match
the two rates.
Having summarized the major theories and findings regarding the dividend policy and its
effects on the value of the firm, it has emerged that no unanimous agreement has been
achieved so far. Although the studies have been useful to understand the deep complexity
of the “dividend puzzle”, none of the schools of thought can be considered as the ultimate
Bible: the empirical evidences are mixed and the results contradictory and inconclusive.
22
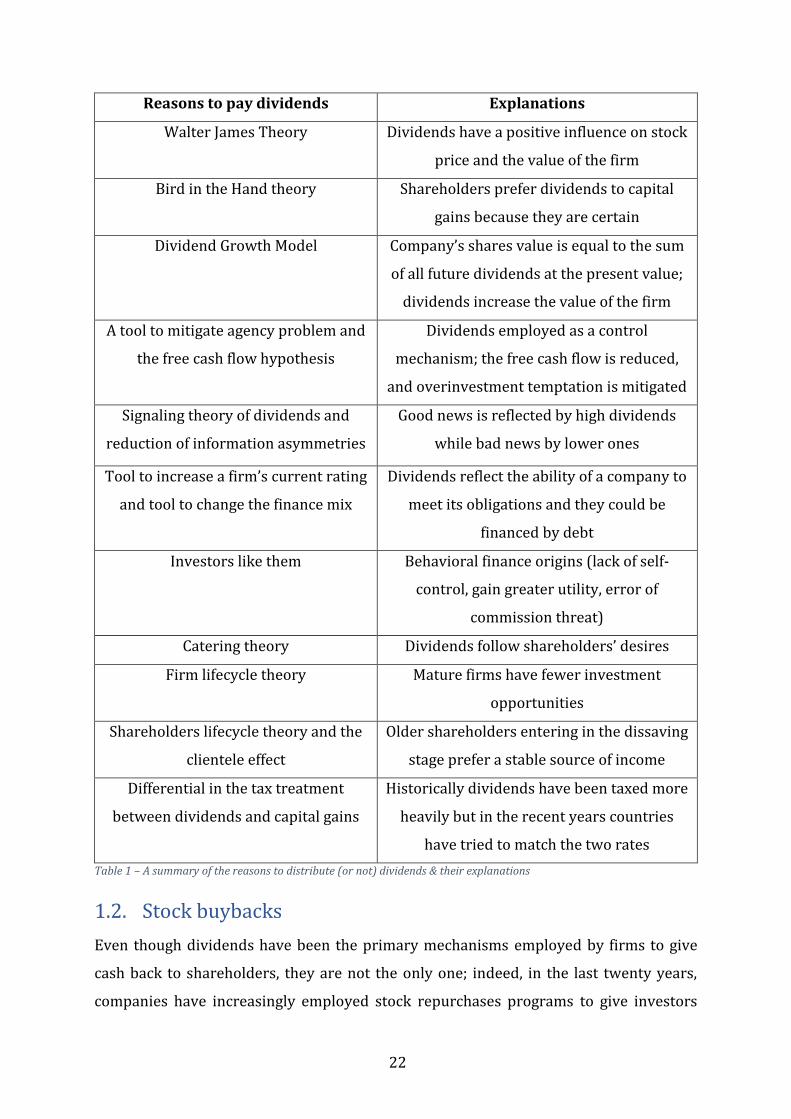
Reasons to pay dividends Explanations
Walter James Theory Dividends have a positive influence on stock
price and the value of the firm
Bird in the Hand theory Shareholders prefer dividends to capital
gains because they are certain
Dividend Growth Model Company’s shares value is equal to the sum
of all future dividends at the present value;
dividends increase the value of the firm
A tool to mitigate agency problem and
the free cash flow hypothesis
Dividends employed as a control
mechanism; the free cash flow is reduced,
and overinvestment temptation is mitigated
Signaling theory of dividends and
reduction of information asymmetries
Good news is reflected by high dividends
while bad news by lower ones
Tool to increase a firm’s current rating
and tool to change the finance mix
Dividends reflect the ability of a company to
meet its obligations and they could be
financed by debt
Investors like them Behavioral finance origins (lack of self-
control, gain greater utility, error of
commission threat)
Catering theory Dividends follow shareholders’ desires
Firm lifecycle theory Mature firms have fewer investment
opportunities
Shareholders lifecycle theory and the
clientele effect
Older shareholders entering in the dissaving
stage prefer a stable source of income
Differential in the tax treatment
between dividends and capital gains
Historically dividends have been taxed more
heavily but in the recent years countries
have tried to match the two rates
Table 1 – A summary of the reasons to distribute (or not) dividends & their explanations
1.2. Stock buybacks
Even though dividends have been the primary mechanisms employed by firms to give
cash back to shareholders, they are not the only one; indeed, in the last twenty years,
companies have increasingly employed stock repurchases programs to give investors
23
money in the form of capital gains (the premium between the purchase and the selling
price of the share).
Stock buybacks were banned throughout most of the 20th century, because they were
perceived to manipulate the stock market but, in 1982, the Securities and Exchange
Commission (SEC) approved the Rule 10b-18, which established a legal procedure for
executing an equity repurchase. From the mid-80s, moment in which some companies
started to adopt this redistribution mechanism and it demonstrated to be successful as it
led to a growth in the price of the stocks and in the value of companies, other firms opted
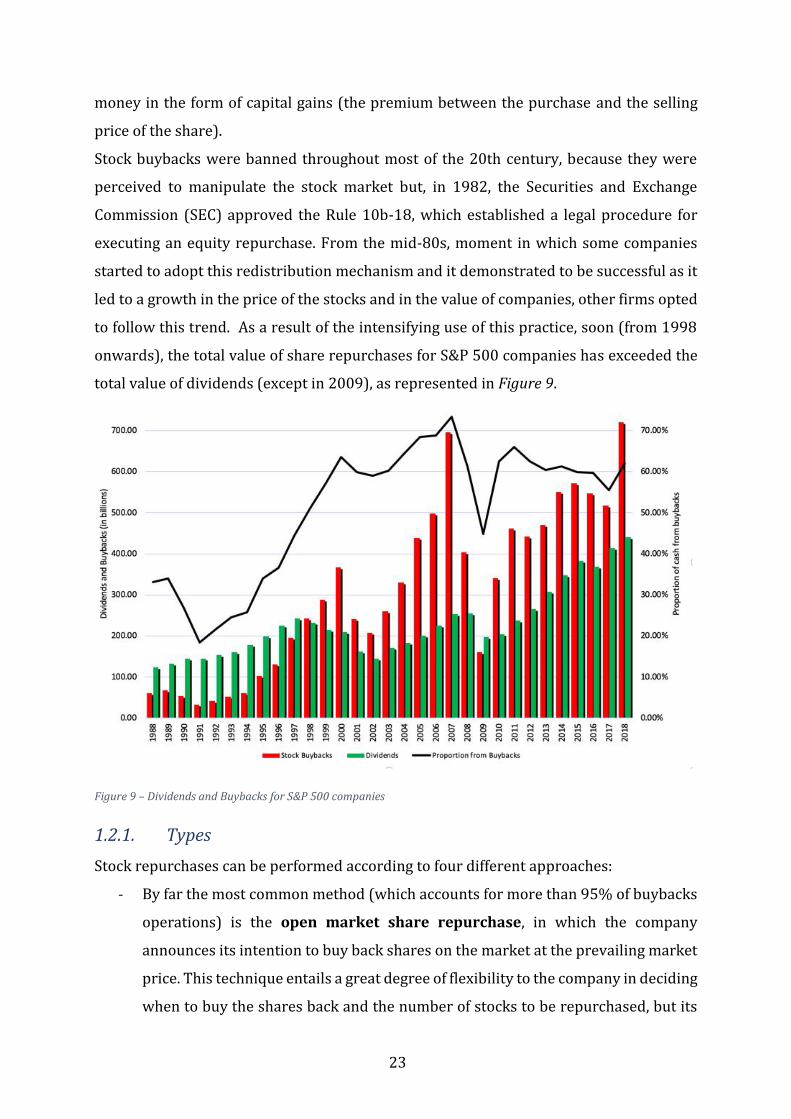
to follow this trend. As a result of the intensifying use of this practice, soon (from 1998
onwards), the total value of share repurchases for S&P 500 companies has exceeded the
total value of dividends (except in 2009), as represented in Figure 9.
Figure 9 – Dividends and Buybacks for S&P 500 companies
1.2.1. Types
Stock repurchases can be performed according to four different approaches:
- By far the most common method (which accounts for more than 95% of buybacks
operations) is the open market share repurchase, in which the company
announces its intention to buy back shares on the market at the prevailing market
price. This technique entails a great degree of flexibility to the company in deciding
when to buy the shares back and the number of stocks to be repurchased, but its
24
main drawback is that it entails huge transaction costs. In addition, when the
announcement to buy back equity is made, the market reacts by increasing the
price of the stocks, forcing the firm to pay out more. This technique is especially
employed for smaller repurchases.
- The second approach is called tender offer, in which the company makes an offer
to repurchase a stated number of shares back from stockholders at a fixed price
(usually premium price, 10% - 20% above the current market price) for a specific
time period. This mechanism allows the firm to maintain the elasticity to withdraw
the offer if the number of shares submitted is not large enough or to lengthen the
tender beyond the originally specified period. Tender offers are used mainly for
large equity repurchases.
- The third strategy is through a direct negotiation, in which the company
undertakes a private negotiation with a large investor or with a group of
shareholders (usually the major ones) and buys back shares at the negotiated
price. Despite not being so popular, the significance of this mechanism rests on the
fact that it allows stockholders to exit from their investment, managers or owners
to consolidate their control power, and eventually to cut out those stockholders
considered as a threat to the firm (especially the major ones with a huge degree of
control at their disposal). Not all countries authorize this stock repurchase
procedure.
- The last mechanism is called Dutch auction, in which shareholders offer their
stocks within a selected price range and then the company repurchases the desired
number of shares at the lowest price (Bagwell, 1992).
1.2.2. Causes and consequences
Since the method a firm decides to use usually reflects the purpose for which it has
implemented this kind of remuneration, let’s investigate what are the reasons behind
stock buybacks and the consequences they have.
Companies decide to repurchase equity back when they have a surplus of unwanted cash.
More precisely, equity repurchase is preferred to dividends when the company feels that
investing the liquidity in the stock is a good use for the money. This may happen, for
instance, when all the projects with a positive NPV have already been financed and the
company lacks new profitable investment opportunities (Purmessur, Boodhoo, 2009), or
25
alternatively when the management of the company perceives that the stock price is
undervalued. Since information asymmetries exist between the inside world (the
management of the firm) and the outside world (all stakeholders), with the former having
a complete view of the company at their disposal, equity repurchase can be used to re-
establish a correct evaluation of the shares. By feeding the demand for stocks from
investors, the price of the shares can be pushed up.
Differently from dividends which constitute a bond from which the firm cannot easily
rescind (cuts are generally avoided), stock buybacks are more flexible (and more volatile)
since companies are free to spread the repurchase over a longer period or eventually to
withdraw the original offer. They are a one-time outflow of cash and investors are aware
that this probably will not occur again in the near future. As a result of this elasticity, firms
at the initial stage of their lifecycle prefer this option as it allows them to deal with the
uncertainty about the capacity of generating excess cash in the future while pursuing the
different profitable investment opportunities at the same time.
Another difference with respect to dividends is that while with these lasts cash is given to
all investors in a company, through the option of buying stocks back, money is paid only
to those who opted for selling their shares back to the firm. On the other hand, even
though the remaining ones get no cash, they gain indirectly from equity repurchase as
stock price raises. Moreover, as a result of this increase in the stock price, hypothetical
acquirers will be disincentivized: equity buybacks create a defensive mechanism against
hostile takeovers.
Linked to this, another argument put forward by those in favor of repurchasing equity, is
that not only it allows the stock price to increase but also the earnings per share to follow
this same trend. Since when a company buys back shares it reduces the book value of
equity, the variation in the number of shares outstanding, coinciding with no changes in
the total earnings (or better, as long as the percentage decrease in the earnings is lower
than the percentage decrease in the shares outstanding), induces an accounting
adjustment producing a bump in the EPS. As a result, investors’ reaction is positive since
this index is employed by shareholders to assess their investments (Grullon, 2000).
In addition, due to the reduction in the book value of equity, the capital structure of the
company can be modified, and it gets worse when the stock buyback is financed through
debt, which increases the leverage and eventually, leads the company to a situation of
financial distress.
26
Moving further, when the stock buyback operation is concluded, not only the number of
shares outstanding is reduced but also the power of the insiders that did not tender their
shares back is consolidated. As a result (especially through private negotiations), the
shareholders’ composition is modified, and the power of those investors considered as a
threat for the company is limited.
Shareholders’ composition is another element influencing the choice between dividends
and equity repurchases. By quoting Bartov et al. (1998) “The likelihood of distributing cash
through an open market stock repurchase rather than a dividend increase is an increasing
function of the number of institutional investors holding a firm’s stock6”. This is especially
due to the favorable tax consequences that this choice has for institutional investors.
This brings us back to the point that in the real world, some accounting differences exist,
especially when it comes to the different tax treatments between dividends and capital
gains. On one hand, cash dividends, on which shareholders have no power about whether
to receive them or not, are fully taxed as ordinary income; on the other hand, with equity
repurchases, investors are subjected to tax payment if they actually decide to sell the
stock, obtaining a capital gain. Hence, when a fiscal advantage exists, as when the tax on
dividends is higher with respect to the tax on capital gains (as it has historically been),
shareholders would rather prefer stock buybacks since the net return would be greater.
This arbitrage opportunity (especially in the US) led several states to alter the current tax
system and to tax both dividends and capital gains at the same rate.
In addition to what we have said so far, stock repurchases have a bearing value in the
information content they provide. Like dividends, the decision to buy back shares convey
a positive signal both to the market and to shareholders: indeed, it is a common belief that
managers choose stock buybacks to express their confidence in the future earnings and
cash flows of the company (Grullon, 2000). This is why equity repurchase can be
conceived as a tactic to mitigate the agency problem and to reduce the free cash flow
problem as it allows firms to distribute the excess cash that cannot be invested in new
profitable projects.
The agency problem is also created by management compensation which ix considered as
a factor influencing the choice between dividends and stock buybacks. Indeed, by citing
6 Bartov et al. (1998), “Evidence on how companies choose between dividends and open-market stock
repurchases, Journal of Applied Corporate Finance, 11(1)
27
again Bartov et al (1998) “The more stock options or stock appreciation rights managers
own, the more likely they are to distribute cash to stockholders through open-market stock
repurchase rather than through an increase in cash dividends7”. Therefore, since when
companies pick dividends, the stock price (as well as the value of the company) is reduced,
while the opposite is true when it comes to stock buybacks, managers with more options
positions are more likely to prefer the latter to the former. As a result, by rising the
relative ownership of the management, the interests between the insiders and the
outsiders could be aligned and the agency problem mitigated (Jensen, Meckling, 1976).
Finally, behind the choice between dividends and stock buybacks, there are some
psychological factors: according to the self-control theory, for the purpose of avoiding any
remorse for selling the stock at a cheap price (and therefore prevent any capital loss to
occur), shareholders would prefer dividends. The general idea of regret aversion and its
effect on individuals’ behavior is described well by Kahneman and Tversky (1982):
“Regret is felt if one can readily imagine having taken an action that would have led to a
more desirable outcome. This interpretation explains the close link between the experience
of regret and the availability of choice: actions taken under duress generate little regret. The
reluctance to violate standard procedures and to act innovatively can also be an effective
defense against subsequent regret because it is easy to imagine doing the conventional thing
and more difficult to imagine doing the unconventional one8”.
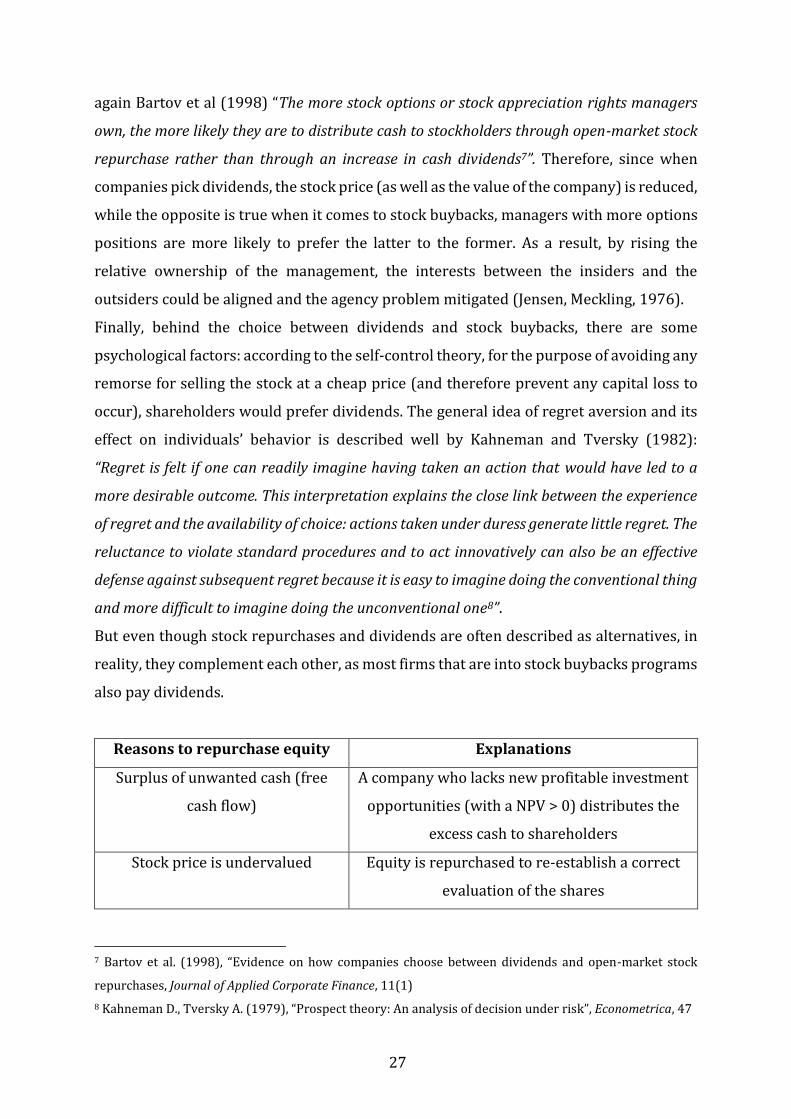
But even though stock repurchases and dividends are often described as alternatives, in
reality, they complement each other, as most firms that are into stock buybacks programs
also pay dividends.
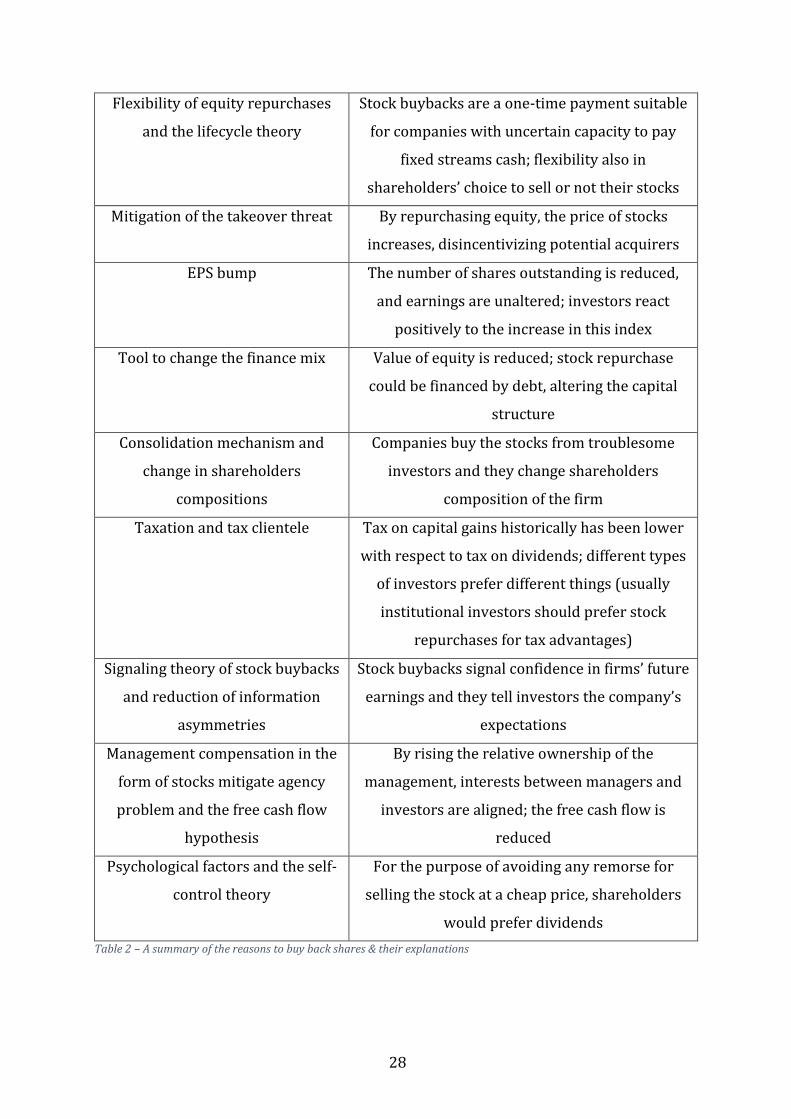
Reasons to repurchase equity Explanations
Surplus of unwanted cash (free
cash flow)
A company who lacks new profitable investment
opportunities (with a NPV > 0) distributes the
excess cash to shareholders
Stock price is undervalued Equity is repurchased to re-establish a correct
evaluation of the shares
7 Bartov et al. (1998), “Evidence on how companies choose between dividends and open-market stock
repurchases, Journal of Applied Corporate Finance, 11(1)
8 Kahneman D., Tversky A. (1979), “Prospect theory: An analysis of decision under risk”, Econometrica, 47
28
Flexibility of equity repurchases
and the lifecycle theory
Stock buybacks are a one-time payment suitable
for companies with uncertain capacity to pay
fixed streams cash; flexibility also in
shareholders’ choice to sell or not their stocks
Mitigation of the takeover threat By repurchasing equity, the price of stocks
increases, disincentivizing potential acquirers
EPS bump The number of shares outstanding is reduced,
and earnings are unaltered; investors react
positively to the increase in this index
Tool to change the finance mix Value of equity is reduced; stock repurchase
could be financed by debt, altering the capital
structure
Consolidation mechanism and
change in shareholders
compositions
Companies buy the stocks from troublesome
investors and they change shareholders
composition of the firm
Taxation and tax clientele Tax on capital gains historically has been lower
with respect to tax on dividends; different types
of investors prefer different things (usually
institutional investors should prefer stock
repurchases for tax advantages)
Signaling theory of stock buybacks
and reduction of information
asymmetries
Stock buybacks signal confidence in firms’ future
earnings and they tell investors the company’s
expectations
Management compensation in the
form of stocks mitigate agency
problem and the free cash flow
hypothesis
By rising the relative ownership of the
management, interests between managers and
investors are aligned; the free cash flow is
reduced
Psychological factors and the self-
control theory
For the purpose of avoiding any remorse for
selling the stock at a cheap price, shareholders
would prefer dividends
Table 2 – A summary of the reasons to buy back shares & their explanations
29
Chapter 2 – Analysis of the dividend policy of firms in
the sportswear industry
So far, we have discussed under a theoretical point of view about dividends and their
complementary mechanism to return cash to investors, through equity repurchases. In
this dissertation we would like to go further by moving from theory to practice: in the
next chapters we will examine the dividend policy of Nike, Adidas and Asics, three firms
competing in the sportswear industry and belonging to three distinct geographical areas
(America, Europe and Asia).
Before going in deep into the analysis, we believe it is worth building some insights about
the sportwear industry, investigating what are the current trends and which will be the
future challenges. To do so and to get a complete overview of how companies in this
industry put in place a business strategy to outperform their rivals, gaining a competitive
advantage over them, in the first half of the chapter we will perform a PESTEL analysis
and another according to the Porter 5 forces. In the second half, we will move the focus of
the attention to criteria of selection that allowed us to come up with the chosen three
companies and then we will talk about the methodology used to carry out the study,
having an insight of the cashflow approach.
2.1. Industry overview
With sportswear we mean all those clothes, footwear, accessories and equipment,
designed to provide comfort while doing physical activities and playing sports. They are
highly skin-friendly, and they are produced using especially microfiber, polyester, calico,
and spandex, in a way that permits sweat to be absorbed and evaporated quickly, and to
remain fresh for longer. At first, these products were bought mainly by athletes to help
them to perform better but then they became popular among gym-attendants, fitness-
addicted, and other non-athletes.
The sportswear industry is highly competitive and in the recent years, it has been
subjected to some alterations in customers’ trends and tastes which have pushed the
expansion of the market.
In order to understand which are the macro forces that companies operating in this highly
competitive industry face, we have performed a PESTEL analysis.
30
- Political: since companies conduct their business on a worldwide scale, they are
influenced by international trade agreements, labor laws, product safety laws, and
consumer regulations. In particular, firms must deal with the recent imposition of
the Chinese tariff established by the Trump Administration which affects them
since China is one of the main suppliers for labor of the companies.
- Economic: since counterfeit products are spreading on online selling platforms
like Amazon or eBay at a very competitive price, they could threaten the profits of
the firms and eventually damage the brand’s image if people aren’t able to discern
the real from the fake. Another economic factor which may influence the industry
but in a positive way is the general increase in the minimum wage rate over the
last few years which allows consumers to enjoy from a greater disposable income
to be spent on sportswear items.
- Social: this factor influences the industry in a very strong way. Obesity is a major
health issue in developed countries, especially in the US, and sports is conceived
as a mechanism to defeat it and to push people to embrace a healthier lifestyle. As
a matter of facts, new trends are especially driven by this growing awareness and
consciousness among modern consumers of a healthier wellbeing, which have
boosted fitness activities and hence the request for comfortable but trendy clothes.
This allowed sportswear brands to go further into their research for novel
products, by complementing the functionality to the outlook. Another important
social influence from which the sportswear market is enjoying is the growing
inclusion of women in sports activities like yoga, running or swimming, and the
recent recognition of professional status to a lot of women previously considered
as amateurs athletes. This pushed not only sportswear sales but also the brands to
include professional female athletes in their marketing campaigns. The best
example of this inclusion is embodied by Nike’s “Dream crazier” campaign
narrated by the tennis star Serena Williams who calls out the double standards and
challenges female athletes to break cultural barriers and fight for equal
opportunities “to show them what crazy can do”. Among some further social forces
challenging the industry we can mention the growing demand for ethically made
products asked by socially aware consumers, the rising use of social media as a
marketing medium, and finally the increase wealth in developing countries which
pushed companies to expand their business horizons. North America is the largest
31
market, chased by Europe, but companies are also trying to reach the emerging
market like China, Brazil, and India as they represent a big opportunity to be
exploited by sports gear producers.
- Technological: thank to the proliferation of the internet of things (IoT) in sports
gear, companies face new smart sportswear opportunities. New technologies
include the use of wearable items, like smartwatches, tacking track of the
performance of athlete, and studying their movements.
- Environmental: the increasing concerns on climatic topics have led most of the
firms to adapt their operations to these new requests, expanding their effort to
reduce the environmental impact of their business. In order to include
sustainability to the ways in which business is conducted, the majority of the
companies are supporting the UN’s Sustainable Development Goals (SDGs) and
among other actions, they try to reduce CO2 emissions, to limit wastes of water, to
use more sustainable materials for their products and so on.
- Legal: since companies operating in this industry conduct their business
worldwide, they must deal with national and local laws, labor and tax laws, and
new international trade protection law. Moreover, they protect their products
(especially from imitators) through the use of patents and intellectual properties.
In order to have a further and complete perspective of how attractive the sportswear
industry is and of how companies compete to be the best firm from an economical and
sportive point of view, we have decided to perform an analysis according to the Porter 5
forces.
One of the strongest forces in this industry is the rivalry among existing players. This
high level of competition makes it important for companies conducting businesses in this
industry to have strategic set points and to gain a competitive advantage, especially
through brand identity as it gives customers loyalty and trust. The companies strive to
continuously ameliorate their products through innovative design and features with the
aim of attracting new clients.
Since customers benefit from the low switching costs, the several leading players engage
in price competition and offer novel products in order to differentiate their brands from
that of competitors and to gain market share. The low switching costs are the result of the
growing use of online shopping which makes the bargaining power of customers a
strong force. The perpetration of the e-commerce not only allows clients to easily

32
compare the costs of the different offerings but also it enables them to customize their
products according to their tastes: companies offer the possibility to select the desired
color, to personalize the items with the name or with the favorite number and so on.
The threat of substitutes is low to moderate. Even though customers can choose their
products among several different brands, most of them want to have their athletic
apparel, footwear or equipment designed for a particular sport in mind and as a result,
they do not address the general industry for these specific apparel needs. Hence, despite
the option of acquiring products from the general apparel area at a cheaper price, these
are not real substitutes: for instance, even though the possible substitutes for footwear
could be boots, sandals, bare feet or dress shoes, these do not really replace goods for
sporting purposes.
On the other hand, although the sportswear industry is attractive since the global sports
apparel market is expected to increase from $180,63 billion in 2019 to a projected $207,9
billion in 2025 (source: Statista), the threat of new entrants is low because there are
high entry barriers. In order to compete with the already established companies, new
entrants should be able to develop their own successful brand and the costs related to this
are high. The economy of scale, the huge research and development expenses as well as
the extremely large capital investments on innovation, factories and stores make it
difficult for new entrants to compete with the established firms. Among the most recent
entrants, Under Armour (founded in 1996) and Lululemon Athletica (founded in 1998)
are the ones that stand out for their capacity to gain market share and to increase their
presence as a major threat for mature companies.
Finally, the bargaining power of suppliers is low. The low concentration of suppliers as
well as the little differentiation of the raw materials they provide, make this force weak:
indeed, the inputs like leather, rubber, cotton and plastic are available in large quantities
and companies select the supplier with the best term conditions.
To sum up, the six strategic pillars of the sportswear industry include brand portfolio,
innovation, markets, team, supply chain and sustainability.
2.2. Criteria of selection and methodology of the analysis
Having understood how companies compete, it is now time to move back the focus of our
attention to the main topic of this dissertation, which is the dividend policy. We performed
a literature review in order to understand whether there are some rules on how
33
companies operating in this specific industry, the sportswear one, set their dividend
policy. We took advantage of the major academic search engines like Google Scholar,
Business Source Ultimate, Emerald Insight, Jstor and Scopus but despite the effort, no
evidences have been obtained and this specific field results to be new.
Nevertheless, even though each company might set its own different approach, if we take
into consideration what we have said so far about the industry, we believe that, in order
to succeed, companies playing in this sector retain a big portion of their profits. We expect
that the high research and development costs, the high investments in innovation and the
high competition force companies to search for new projects as well as to employ different
marketing campaigns to make their brands the most attractive and hence to retain a lot
of their profit. In order to test this hypothesis, we decided to investigate the dividend
policy of some firms in this industry.
In order to decide exactly which companies to examine, the first thing I’ve done was a
brainstorming as I am confident with this industry because I play basketball since I was
5. As a result, I was able to come out with an initial list of about 10 firms operating in the
sportswear industry.
Then, by taking advantage of the “peer group” provided by Orbis, I extended the list
further, reaching approximately 30 companies. From this, I started to eliminate those
firms that are not publicly quoted as well as those operating in what we could say are
specific sectors of the industry. For instance, I removed those companies making
equipment and furniture for a specific sport like only for golf players (e.g. Callaway Golf
Company), only for surfers (e.g. Billabong) or for skiers (e.g. Goldwin) and so on.
In the end, among the remaining ones, I’ve picked the main players in the market, the ones
having the biggest market share, namely Nike and Adidas. In addition, we included Asics
in the analysis because it is the most important player in Asia and we believed it was
interesting to be able to compare three distinct geographical areas as well as the three
most important Stock Exchanges in the world. Indeed, Nike is listed on the New York Stock
Exchange and it represents American companies; Adidas on Frankfurt Stock Exchange
and it represents European companies; Asics on Tokyo Stock Exchange and it represents
Asian companies.
Over the past decades, Nike and Adidas have fought using their history and core values as
weapons in order to conquer the biggest market share. Nike is the leader in North
American market and it dominates American football equipment, while Adidas is the
34
number one in the European market and it spends a lot of its marketing resources into
football sponsorship and endorsements. Finally, Asics is the main player in Asia. Although
in this country cricket is the religion, Asics opted for a different sport for its associations
and for its brand’s strategy, that is running.
For what concerns the methodology of the analysis, we have decided to perform it on a
ten-years time horizon, that is from 2010 to 2019. This dynamic evaluation of the
dividend policy’s strategies allowed us to understand the developments and
metamorphosis of our chosen firms and to have a little insight into the complexity entailed
in the “dividend puzzle”.
After a general introduction to each company, we started to carry out the analysis. To do
that, we have gathered data and information from several different sources, like
companies’ annual reports and websites, Ycharts, Orbis, Yahoo Finance, Reuters, Zacks,
MarketWatch, Morningstar, and Macrotrends, among the most important.
The primary things we looked at were the companies’ statements regarding their
dividend policies. By taking into consideration these as well as the dynamics of the
dividends per share index with respect to the movements of the earnings per share
(displayed on a graph), we have tried to associate to each firm its best-fitting policy among
the ones we have discussed in Chapter 1 (e.g. stable, steadily increasing, constant, residual
dividend policy and so on). Moreover, we attempted to understand which were the
reasons why each company opted for that specific policy and to do that, we highlighted
the pros and the cons that they entailed.
Subsequently, we have moved the focus of our attention to the evolutions of the other two
indexes when it comes to a firm’s dividend policy, that is the dividend payout, the ratio
relating cash dividend to earnings, and the dividend yield, the index representing the
investor’s return coming from dividends. For each index, we have attempted to explain
the fluctuations for the period under investigation and we have studied the motives why
in some years they have been more volatile than in others. The reasons for these
deviations from normal conditions act as a confirmation (from a practical point of view)
of the theoretical knowledge built in Chapter 1. For instance, as we will see throughout
the analysis, dividends are sticky and cuts are avoided, they tend to follow a much
smoother path than earnings, the information content of dividends’ dynamics is valuable
for investors and so on.

35
In addition, we have decided to compare both the average dividend payout ratio and
dividend yield for the period with respect to industry standards9, in order to understand
whether they were under or above them and to get a clear profile of how strong each
company is. To do that, we searched in which industry category each company has been
classified from the Damodaran’s database10 and then the comparison was made.
2.1.1. A cash flow approach to study a firm’s dividend policy
We moved forward the analysis and we evaluated the appropriateness of each firm’s
dividend policy by employing a cash flow approach. With the aim of understanding
whether they returned too much or too little and whether managers are good guardians
of firm’s resources, we have compared how much cash a company has available to return
as dividends, relative to what it actually has distributed to its investors and we evaluated
the firm’s project portfolio.
In order to understand when how much cash is too much, let’s see in-depth the four steps
according to which the analysis is carried out:
Step 1 – Measuring the FCFE available and compare it with the amount actually
distributed
The FCFEAfterNetDebt represents cash flow available that remains to be distributed to
investors after all the investment opportunities with a positive net present value (NPV)
and new net debt issued have been taken into consideration. In other words, it is the
residual cash flow left after non-equity claimholders as well as investment necessities to
support asset’s growth have been compensated. It is calculated as follows:
𝐹𝐶𝐹𝐸𝐴𝑓𝑡𝑒𝑟𝑁𝑒𝑡𝐷𝑒𝑏𝑡
= 𝑛𝑒𝑡 𝑖𝑛𝑐𝑜𝑚𝑒 − (𝑐𝑎𝑝𝑖𝑡𝑎𝑙 𝑒𝑥𝑝𝑒𝑛𝑑𝑖𝑡𝑢𝑟𝑒𝑠 − 𝑑𝑒𝑝𝑟𝑒𝑐𝑖𝑎𝑡𝑖𝑜𝑛)
− 𝑐ℎ𝑎𝑛𝑔𝑒 𝑖𝑛 𝑛𝑒𝑡 𝑤𝑜𝑟𝑘𝑖𝑛𝑔 𝑐𝑎𝑝𝑖𝑡𝑎𝑙 + 𝑛𝑒𝑡 𝑑𝑒𝑏𝑡 𝑖𝑠𝑠𝑢𝑒𝑑
Where:
- Depreciation includes also amortization and other non-cash charges;
9 Damodaran A., Divfund.xls, DivfundEurope.xls, DivfundJapan.xls
10 Damodaran A., indname.xls (http://www.stern.nyu.edu/~adamodar/pc/datasets/indname.xls)
36
- Changes in net working capital have a cash flow effect: when the change is positive,
the cash flow is reduced while the opposite is true, meaning that when the
alteration is negation, the cash flow is dragged down;
- Net debt issued indicates the change in interest-bearing debt from the previous
year.
Since we were interested in measuring how much of the FCFEAfterNetDebt the firm have
been paying out as dividends, we related dividends with FCFEAfterNetDebt. This allowed
us to determine the devotion of the companies to distribute what was left-over as
dividends and to compare it with the amount paid with respect to the earnings, in
order to understand whether the two ratios matched or not. Moreover, as companies
have increasingly employed stock repurchases programs as a complementary
mechanism to return money, we have measured the total cash paid out (that is the
sum of cash dividends and the stock buybacks net of proceeds from option exercise)
over the FCFEAfterNetDebt, especially with the goal of understanding the sustainability of
each firm’s actions. Indeed, a percentage above a 100% might not be sustainable in the
future, but sometimes it makes sense since strong and mature firms have been able to
collect huge cash balance throughout the years (as we will actually see throughout the
study). As a result, we examined more carefully the programs put in place by the firms
to buy back shares from investors, the mechanisms through which these have
occurred and the reasons why they have been implemented.
Step 2 – Assessing project quality
Since the alternative to pay out dividends is to plow back money inside the company to
finance future projects, in the second step of the cashflow approach we tried to assess
each firm’s project portfolio with the purpose of determining whether managers should
be trusted with the excess cash or not. As it is almost impossible for us to estimate the
expected cash flow of every future project, we have used two different techniques to
assess the current project portfolio of a company.
The first technique answers the investor’s question “how good were the investments
made by the managers throughout this specific period?”. To be more precise, it involves
the use of some accounting figures in which we compared the accounting return on equity
(ROE) with the cost of equity, where:
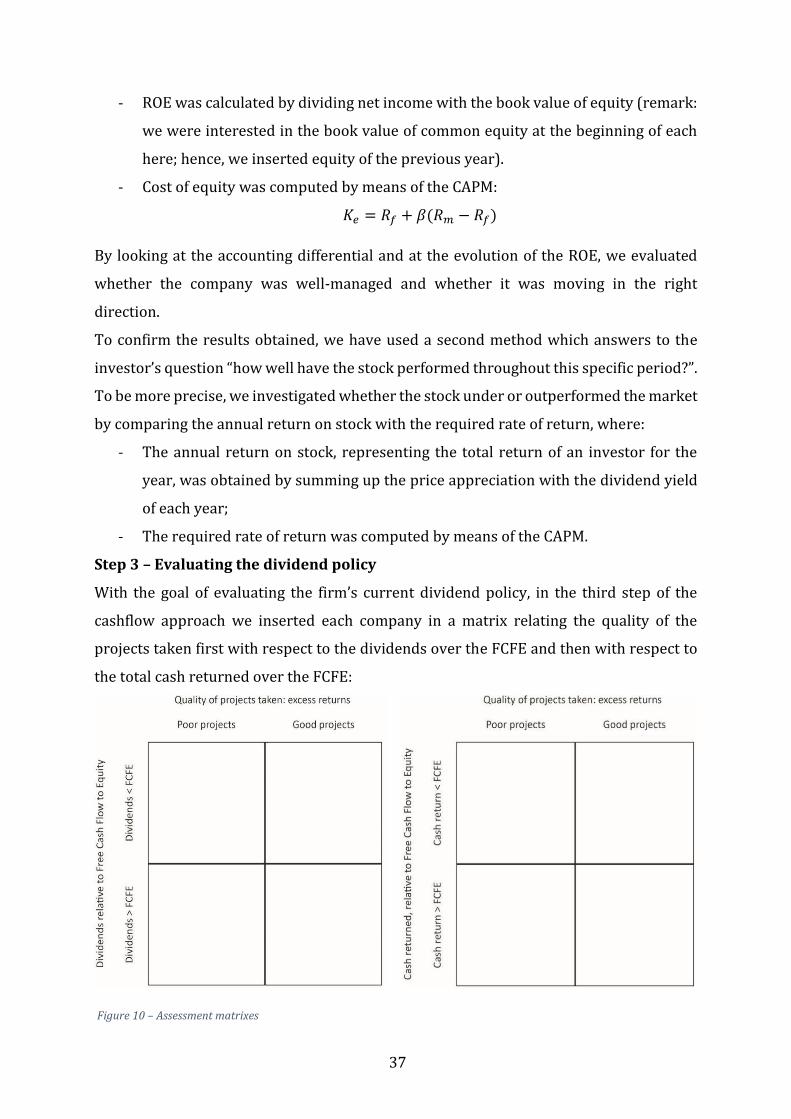
37
- ROE was calculated by dividing net income with the book value of equity (remark:
we were interested in the book value of common equity at the beginning of each
here; hence, we inserted equity of the previous year).
- Cost of equity was computed by means of the CAPM:
𝐾𝑒 = 𝑅𝑓 + 𝛽(𝑅𝑚 − 𝑅𝑓)
By looking at the accounting differential and at the evolution of the ROE, we evaluated
whether the company was well-managed and whether it was moving in the right
direction.
To confirm the results obtained, we have used a second method which answers to the
investor’s question “how well have the stock performed throughout this specific period?”.
To be more precise, we investigated whether the stock under or outperformed the market
by comparing the annual return on stock with the required rate of return, where:
- The annual return on stock, representing the total return of an investor for the
year, was obtained by summing up the price appreciation with the dividend yield
of each year;
- The required rate of return was computed by means of the CAPM.
Step 3 – Evaluating the dividend policy
With the goal of evaluating the firm’s current dividend policy, in the third step of the
cashflow approach we inserted each company in a matrix relating the quality of the
projects taken first with respect to the dividends over the FCFE and then with respect to
the total cash returned over the FCFE:
Figure 10 – Assessment matrixes

38
With this step we were able to understand whether the firms returned too much or too
little both with respect to dividends first and then with respect to total cash returned
(dividends plus stock buybacks), allowing us to have a judgement on their overall
appropriateness.
When the FCFE is greater than the dividends paid (or the total cash returned) and the firm
has a past of good projects, managers enjoy a great flexibility in deciding how much cash
to retain and how much to distribute. When the FCFE is greater than the dividends paid
(or the total cash returned) but the firm has a history of poor projects, investors demand
managers a justification for holding cash and eventually pressure them to give more cash
back.
When on the other hand the FCFE is lower than the dividends paid (or the total cash
returned) and the firm has good projects, the company should cut dividends (even though
this might not be liked by investors) and reinvest more. Finally, if there are poor projects,
the company should pay out less and it should be concerned to fix the investment policy.
Step 4 – Relationship between dividend policy and financing policy and forecasts
As a final fourth step, we have explored the relationship between the dividend policy and
the financing policy since the two cannot be disentangled: indeed, when examining the
amount of cash distributed back to investors, we should take also into account whether
the firm is under or over levered and whether or not it intends to close its leverage gap.
An under levered firm, indeed, may be able to pay more than its FCFE as dividend and may
do so intentionally to increase its debt ratio while the opposite is true, an over levered
firm may choose to pay less in dividends in order to retain cash in the business and to
reduce its debt.
Even though all the three companies are under levered with respect to industry standards
as provided by Damodaran11, we decided to assume that the current debt to capital ratio
remained fixed and we forecasted the FCFE for the next 5 years (the time-period from
2020 to 2024) in order to understand how the future will look like. Moreover, besides the
future FCFE for the next 5 years, we forecasted also future dividends and the cash
available each year to repurchase equity. This allowed us to understand whether the
11 Damodaran A., we looked at the average book debt to capital ratio of each industry from dbfund.xls,
dbfundEurope.xls, dbfundJapan
39
dividend policy and the overall cash distributed back to investors will be sustainable for
the company or whether there might be troubles.
For forecasts, we needed the expected growth rates in net income, depreciation, capital
expenditures and revenues, and the working capital as a percent of revenues.
𝐹𝑜𝑟𝑒𝑐𝑎𝑠𝑡𝑒𝑑 𝐹𝐶𝐹𝐸
= 𝑛𝑒𝑡 𝑖𝑛𝑐𝑜𝑚𝑒 − (𝑐𝑎𝑝𝑖𝑡𝑎𝑙 𝑒𝑥𝑝𝑒𝑛𝑑𝑖𝑡𝑢𝑟𝑒𝑠 − 𝑑𝑒𝑝𝑟𝑒𝑐𝑖𝑎𝑡𝑖𝑜𝑛)(1 − 𝑑𝑒𝑏𝑡 𝑟𝑎𝑡𝑖𝑜)
− 𝑐ℎ𝑎𝑛𝑔𝑒 𝑖𝑛 𝑛𝑒𝑡 𝑤𝑜𝑟𝑘𝑖𝑛𝑔 𝑐𝑎𝑝𝑖𝑡𝑎𝑙(1 − 𝑑𝑒𝑏𝑡 𝑟𝑎𝑡𝑖𝑜)
Based on the results obtained in this last fourth step, in the final section, we discussed
about alternative scenarios. For Nike and Asics, we imagined a change in their historical
DPS rates while for Adidas we imagined an increased use of stock repurchase programs;
based on these alterations, we saw how the payout ratios would be affected as a
consequence.
Since as we mentioned before there are no “rules” from literature regarding how
companies in the sportswear industry set a dividend policy, we hope the approach we
used could be considered as appropriate and that we can learn something more about the
relationship between sportswear world and the dividend policy. Let’s now start the
analysis by studying Nike.
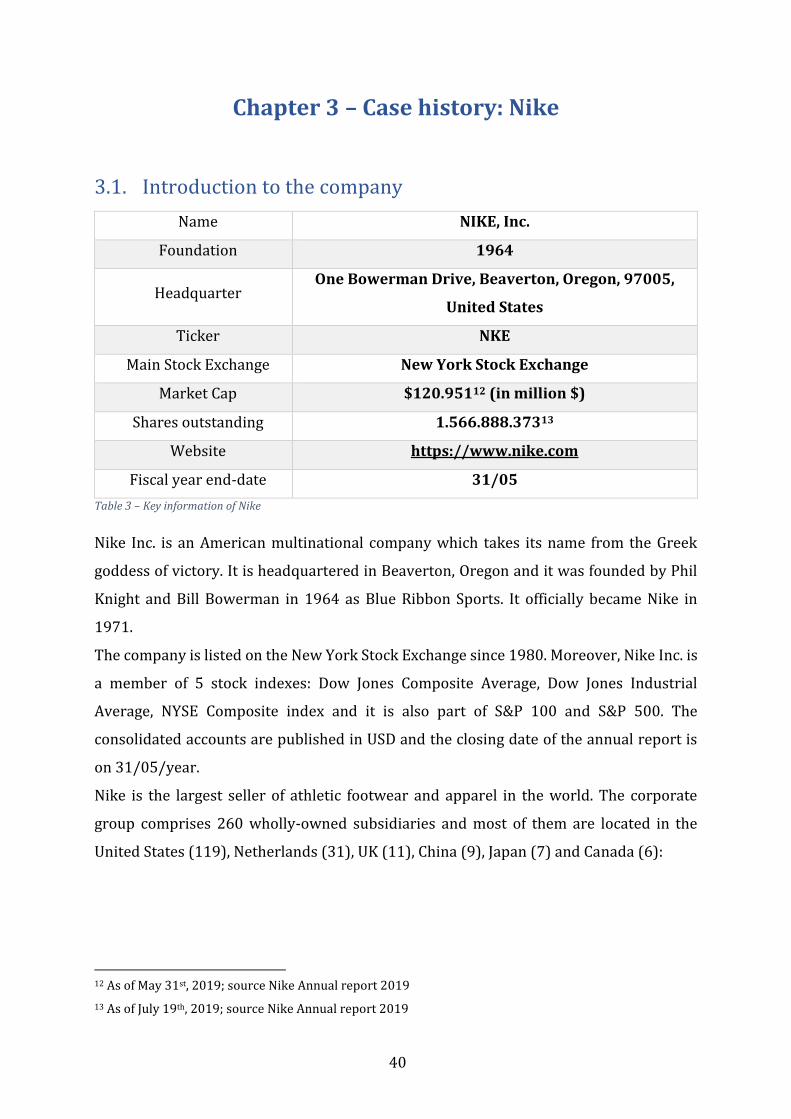
40
Chapter 3 – Case history: Nike
3.1. Introduction to the company
Name NIKE, Inc.
Foundation 1964
Headquarter One Bowerman Drive, Beaverton, Oregon, 97005,
United States
Ticker NKE
Main Stock Exchange New York Stock Exchange
Market Cap $120.95112 (in million $)
Shares outstanding 1.566.888.37313
Website https://www.nike.com
Fiscal year end-date 31/05
Table 3 – Key information of Nike
Nike Inc. is an American multinational company which takes its name from the Greek
goddess of victory. It is headquartered in Beaverton, Oregon and it was founded by Phil
Knight and Bill Bowerman in 1964 as Blue Ribbon Sports. It officially became Nike in
1971.
The company is listed on the New York Stock Exchange since 1980. Moreover, Nike Inc. is
a member of 5 stock indexes: Dow Jones Composite Average, Dow Jones Industrial
Average, NYSE Composite index and it is also part of S&P 100 and S&P 500. The
consolidated accounts are published in USD and the closing date of the annual report is
on 31/05/year.
Nike is the largest seller of athletic footwear and apparel in the world. The corporate
group comprises 260 wholly-owned subsidiaries and most of them are located in the
United States (119), Netherlands (31), UK (11), China (9), Japan (7) and Canada (6):
12 As of May 31st, 2019; source Nike Annual report 2019
13 As of July 19th, 2019; source Nike Annual report 2019
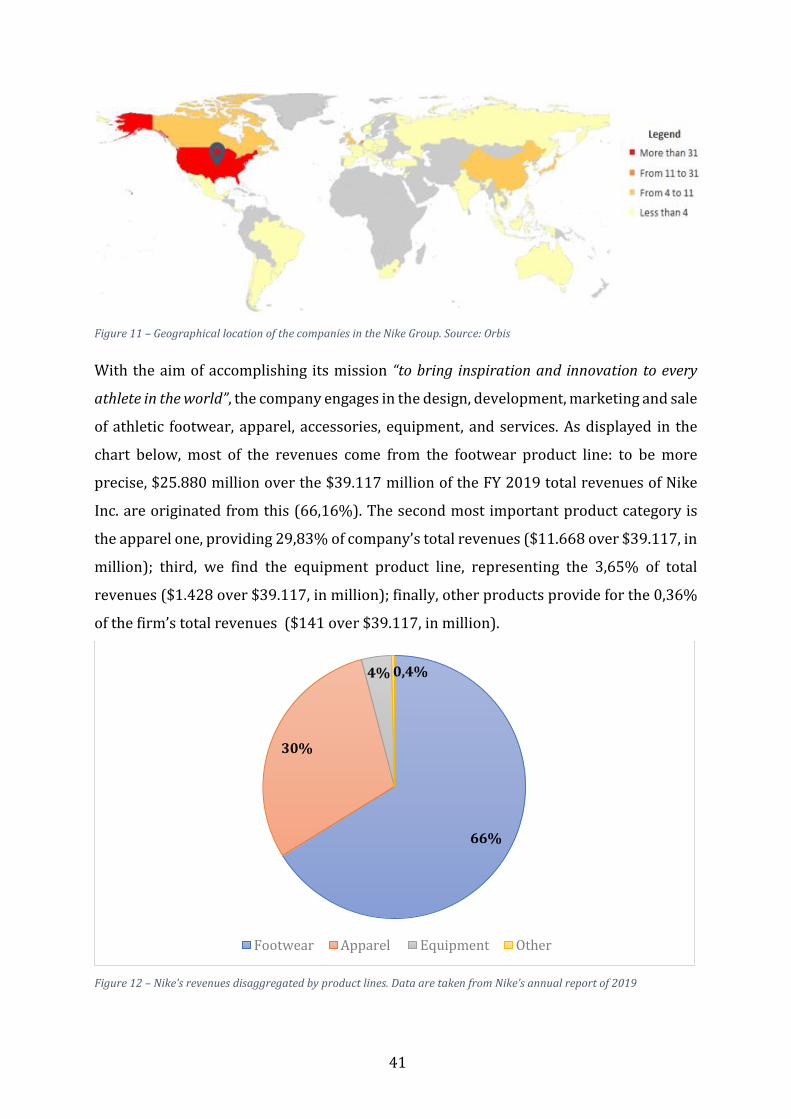
41
Figure 11 – Geographical location of the companies in the Nike Group. Source: Orbis
With the aim of accomplishing its mission “to bring inspiration and innovation to every
athlete in the world”, the company engages in the design, development, marketing and sale
of athletic footwear, apparel, accessories, equipment, and services. As displayed in the
chart below, most of the revenues come from the footwear product line: to be more
precise, $25.880 million over the $39.117 million of the FY 2019 total revenues of Nike
Inc. are originated from this (66,16%). The second most important product category is
the apparel one, providing 29,83% of company’s total revenues ($11.668 over $39.117, in
million); third, we find the equipment product line, representing the 3,65% of total
revenues ($1.428 over $39.117, in million); finally, other products provide for the 0,36%
of the firm’s total revenues ($141 over $39.117, in million).
Figure 12 – Nike’s revenues disaggregated by product lines. Data are taken from Nike’s annual report of 2019
66%
30%
4% 0,4%
Footwear Apparel Equipment Other
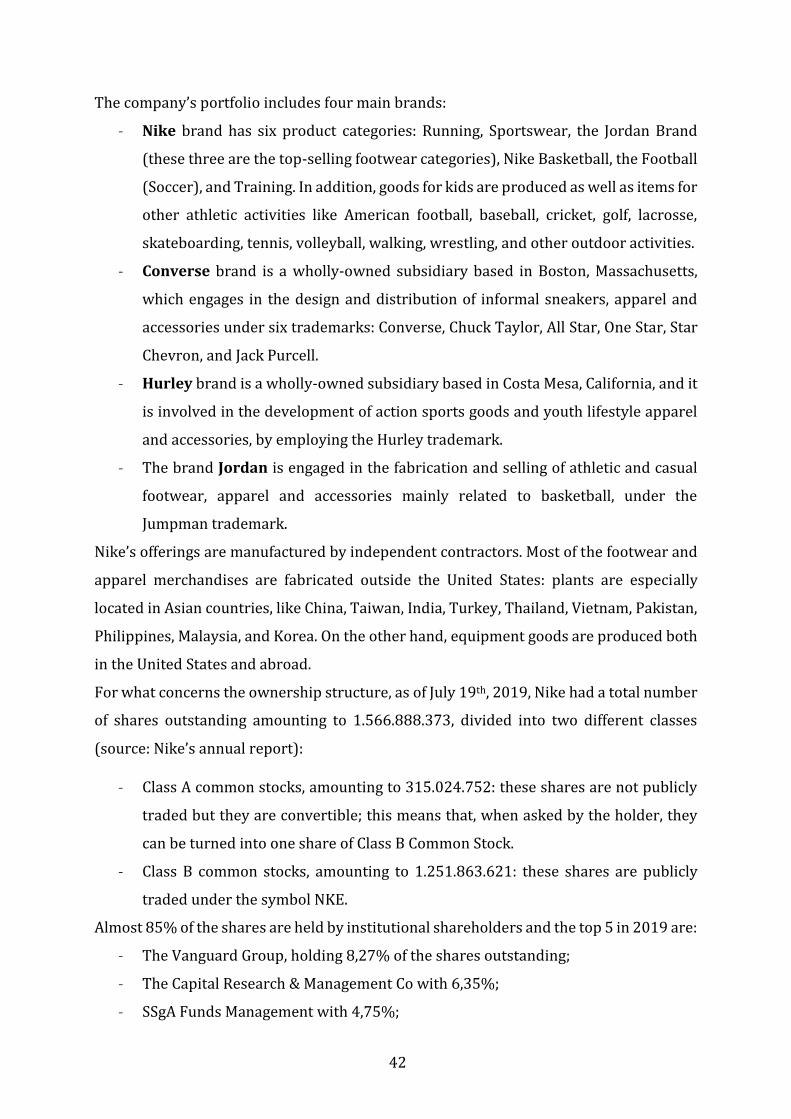
42
The company’s portfolio includes four main brands:
- Nike brand has six product categories: Running, Sportswear, the Jordan Brand
(these three are the top-selling footwear categories), Nike Basketball, the Football
(Soccer), and Training. In addition, goods for kids are produced as well as items for
other athletic activities like American football, baseball, cricket, golf, lacrosse,
skateboarding, tennis, volleyball, walking, wrestling, and other outdoor activities.
- Converse brand is a wholly-owned subsidiary based in Boston, Massachusetts,
which engages in the design and distribution of informal sneakers, apparel and
accessories under six trademarks: Converse, Chuck Taylor, All Star, One Star, Star
Chevron, and Jack Purcell.
- Hurley brand is a wholly-owned subsidiary based in Costa Mesa, California, and it
is involved in the development of action sports goods and youth lifestyle apparel
and accessories, by employing the Hurley trademark.
- The brand Jordan is engaged in the fabrication and selling of athletic and casual
footwear, apparel and accessories mainly related to basketball, under the
Jumpman trademark.
Nike’s offerings are manufactured by independent contractors. Most of the footwear and
apparel merchandises are fabricated outside the United States: plants are especially
located in Asian countries, like China, Taiwan, India, Turkey, Thailand, Vietnam, Pakistan,
Philippines, Malaysia, and Korea. On the other hand, equipment goods are produced both
in the United States and abroad.
For what concerns the ownership structure, as of July 19th, 2019, Nike had a total number
of shares outstanding amounting to 1.566.888.373, divided into two different classes
(source: Nike’s annual report):
- Class A common stocks, amounting to 315.024.752: these shares are not publicly
traded but they are convertible; this means that, when asked by the holder, they
can be turned into one share of Class B Common Stock.
- Class B common stocks, amounting to 1.251.863.621: these shares are publicly
traded under the symbol NKE.
Almost 85% of the shares are held by institutional shareholders and the top 5 in 2019 are:
- The Vanguard Group, holding 8,27% of the shares outstanding;
- The Capital Research & Management Co with 6,35%;
- SSgA Funds Management with 4,75%;
43
- Blackrock Advisors with 4,7%;
- Wellington Mgmty with 2,24%.
In addition, 2,56% of the shares outstanding are held by individual stakeholders (source:
CNN Business14).
The Board of Directors, the body which aims at representing the interests of the investors,
is elected by these lasts and, among other duties, it elects the Chairman of the Board and
the CEO of the Company. In the recent years, the Board has had between 10 and 14
directors, which are illustrated as follows (source: Nike’s official website):
- Philip H. Knight, the co-founder of the company and one of the major
shareholders, is Chairman Emeritus of the Board of Directors of Nike and he
attends meetings of the Board as a non-voting observer;
- Since 2016, Mark G. Parker serves the role of Chairman of the Board of Directors;
in addition, from January 2006 to 2020, he was President and CEO of Nike;
- John J. Donahoe II who, in January 2020, replaced Mr. Parker with the role of CEO
and President of Nike Inc.;
- Cathleen Benko, member of the Board since July 2018;
- Elizabeth J. Comstock, was appointed as a director in 2011;
- John G. Connors, member of the Board since 2005;
- Timothy D. Cook, is a director since 2005 and it is Nike’s Lead Independent
Director (as well as the CEO of Apple, Inc.);
- Thasunda B. Ducket, member of the Board since 2019;
- Alan B. Graph Jr., a director since 2002;
- Peter B. Henry, appointed as a director in 2018;
- The shareholder and the son of Philip H. Knight, co-founder of Nike, Travis A.
Knight is a member Board of Directors since 2015;
- Michelle A. Peluso since 2014 belongs to the BoD;
- John W. Rogers Jr., serves as director since 2018;
- John R. Thompson Jr. is a member of the Board since 1991.
As of July 23rd, 2019, Nike’s Executive officers are the following ones (source: Nike’s
annual report):
14 https://money.cnn.com/quote/shareholders/shareholders.html?symb=NKE&subView=institutional
44
- Mark G. Parker: from January 2006 to 2020 he has covered the roles of President
and CEO of Nike; in 2016 he has been appointed as Chairman of the Board of
Directors;
- John J. Donahoe II: in January 2020, he replaced Mr. Parker with the role of CEO
and President of Nike Inc;
- Andrew Campion: since 2015, he serves CFO and Executive Vice President;
- Elliott Hill: he assumed the role of President, Consumer and Marketplace in 2018;
- Hilary K. Krane: since 2013, she covers the roles of Executive Vice President, Chief
Administrative Officer and General Counsel;
- Monique S. Matheso: in 2017, she was named Executive Vice President, Global
Human Resources;
- John F. Slusher: in 2007, he was appointed as Executive Vice President, Global
Sports Marketing;
- Eric D. Sprunk: since 2013, he serves the role of Chief Operating Officer.
3.2. Analysis of the dividend policy of Nike
The company has a history as a dividend payer going back to 1985 and since then cash
dividends on Nike’s common stocks are paid quarterly at the beginning of January, April,
July and October approximately. Nike’s Board of Directors usually reviews its dividend
policy in November and the policy is applied for the whole next year.
3.2.1. An overview of the Nike’s dividend policy strategy and of the main
indicators and a comparison with industry standards
The firm’s cash dividends declared per common share ranged from $0,5 per share in 1985
to $0,86 per share in 2019 (as reported in Nike’s annual reports). The company has been
able to increment its annual dividends per share for 17 consecutive years, since 2002:
hence, it is clear the aim of Nike to become a S&P 500 dividend aristocrat, an honorary
award designated for those companies in the S&P 500 that achieved to increase
dividends for a minimum period of 25 years in a row. As explained in chapter 1,
companies that pay consistent or increasing dividends per share are perceived by
investors as financially stable and, therefore, as good investments. As more investors buy
in to take advantage of the dividends’ payments derived from stock ownership, the share
price naturally grows, reinforcing the belief that the stock is strong.
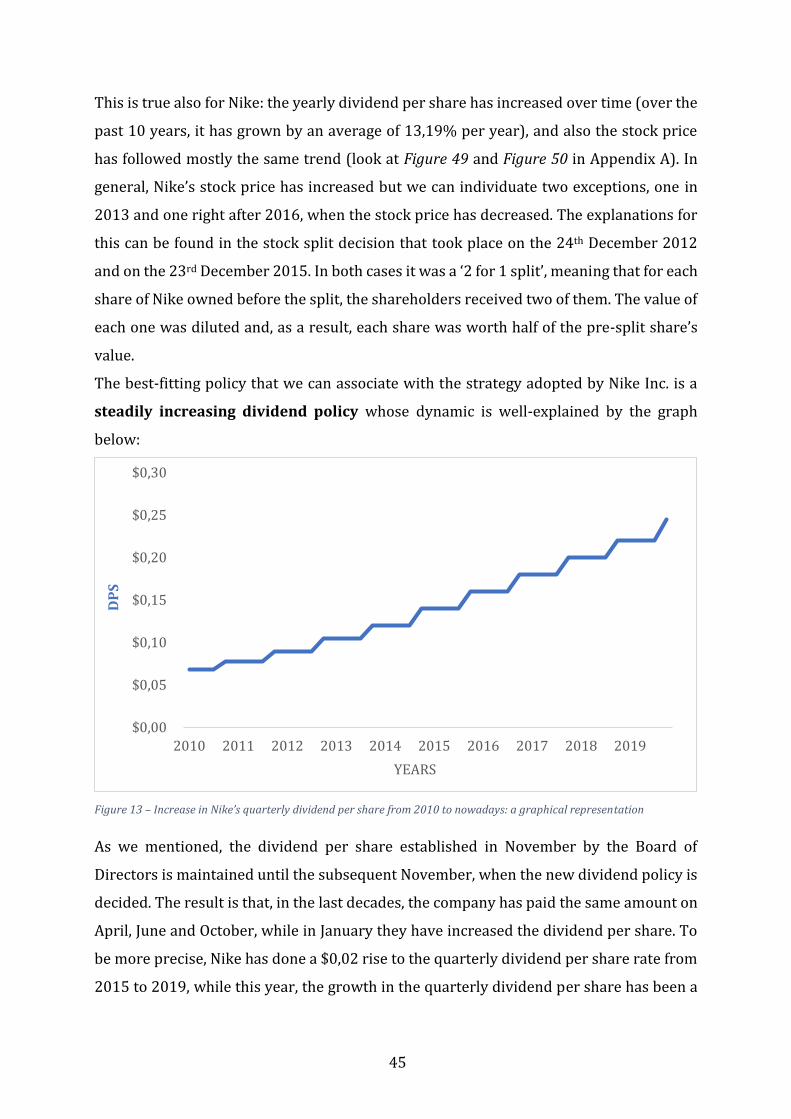
45
This is true also for Nike: the yearly dividend per share has increased over time (over the
past 10 years, it has grown by an average of 13,19% per year), and also the stock price
has followed mostly the same trend (look at Figure 49 and Figure 50 in Appendix A). In
general, Nike’s stock price has increased but we can individuate two exceptions, one in
2013 and one right after 2016, when the stock price has decreased. The explanations for
this can be found in the stock split decision that took place on the 24th December 2012
and on the 23rd December 2015. In both cases it was a ‘2 for 1 split’, meaning that for each
share of Nike owned before the split, the shareholders received two of them. The value of
each one was diluted and, as a result, each share was worth half of the pre-split share’s
value.
The best-fitting policy that we can associate with the strategy adopted by Nike Inc. is a
steadily increasing dividend policy whose dynamic is well-explained by the graph
below:
Figure 13 – Increase in Nike’s quarterly dividend per share from 2010 to nowadays: a graphical representation
As we mentioned, the dividend per share established in November by the Board of
Directors is maintained until the subsequent November, when the new dividend policy is
decided. The result is that, in the last decades, the company has paid the same amount on
April, June and October, while in January they have increased the dividend per share. To
be more precise, Nike has done a $0,02 rise to the quarterly dividend per share rate from
2015 to 2019, while this year, the growth in the quarterly dividend per share has been a
$0,00
$0,05
$0,10
$0,15
$0,20
$0,25
$0,30
2010 2011 2012 2013 2014 2015 2016 2017 2018 2019
DP
S
YEARS
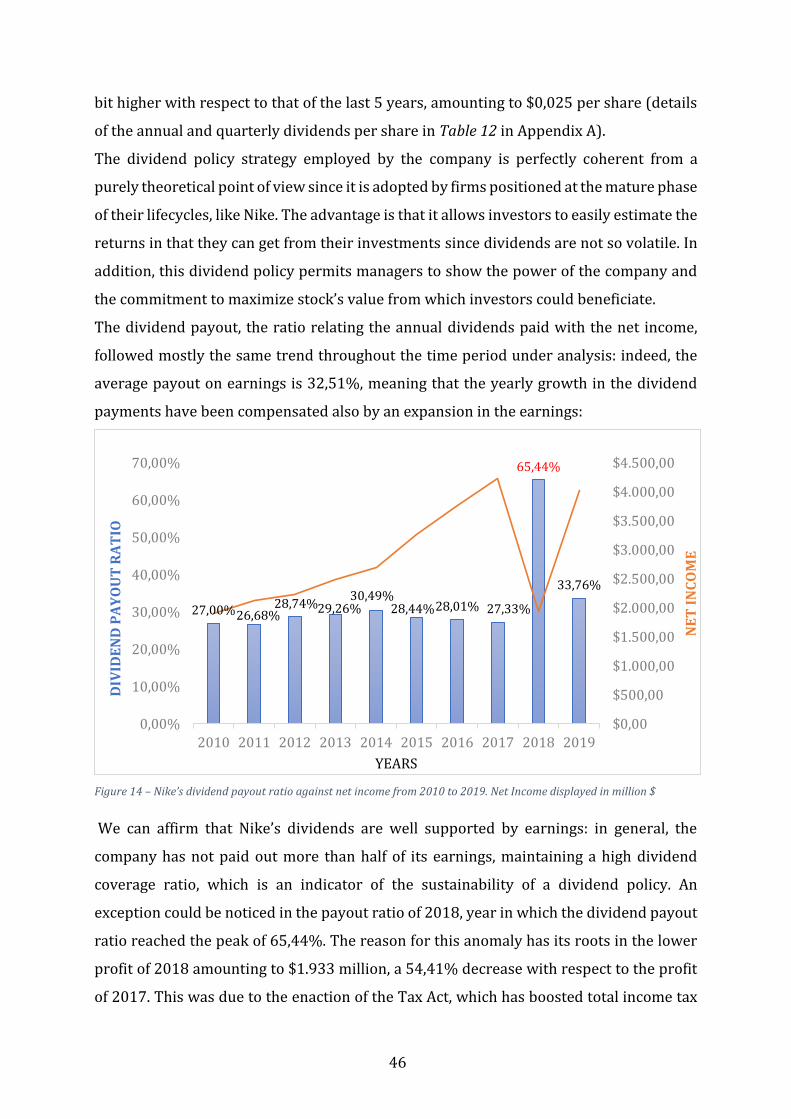
46
bit higher with respect to that of the last 5 years, amounting to $0,025 per share (details
of the annual and quarterly dividends per share in Table 12 in Appendix A).
The dividend policy strategy employed by the company is perfectly coherent from a
purely theoretical point of view since it is adopted by firms positioned at the mature phase
of their lifecycles, like Nike. The advantage is that it allows investors to easily estimate the
returns in that they can get from their investments since dividends are not so volatile. In
addition, this dividend policy permits managers to show the power of the company and
the commitment to maximize stock’s value from which investors could beneficiate.
The dividend payout, the ratio relating the annual dividends paid with the net income,
followed mostly the same trend throughout the time period under analysis: indeed, the
average payout on earnings is 32,51%, meaning that the yearly growth in the dividend
payments have been compensated also by an expansion in the earnings:
Figure 14 – Nike’s dividend payout ratio against net income from 2010 to 2019. Net Income displayed in million $
We can affirm that Nike’s dividends are well supported by earnings: in general, the
company has not paid out more than half of its earnings, maintaining a high dividend
coverage ratio, which is an indicator of the sustainability of a dividend policy. An
exception could be noticed in the payout ratio of 2018, year in which the dividend payout
ratio reached the peak of 65,44%. The reason for this anomaly has its roots in the lower
profit of 2018 amounting to $1.933 million, a 54,41% decrease with respect to the profit
of 2017. This was due to the enaction of the Tax Act, which has boosted total income tax
27,00%26,68%28,74%29,26%
30,49%28,44%28,01% 27,33%
65,44%
33,76%
0,00%
10,00%
20,00%
30,00%
40,00%
50,00%
60,00%
70,00%
2010 2011 2012 2013 2014 2015 2016 2017 2018 2019
$0,00
$500,00
$1.000,00
$1.500,00
$2.000,00
$2.500,00
$3.000,00
$3.500,00
$4.000,00
$4.500,00
DIV
IDE
ND
PA
YO
UT
RA
TIO
YEARS
NE
T I
NC
OM
E
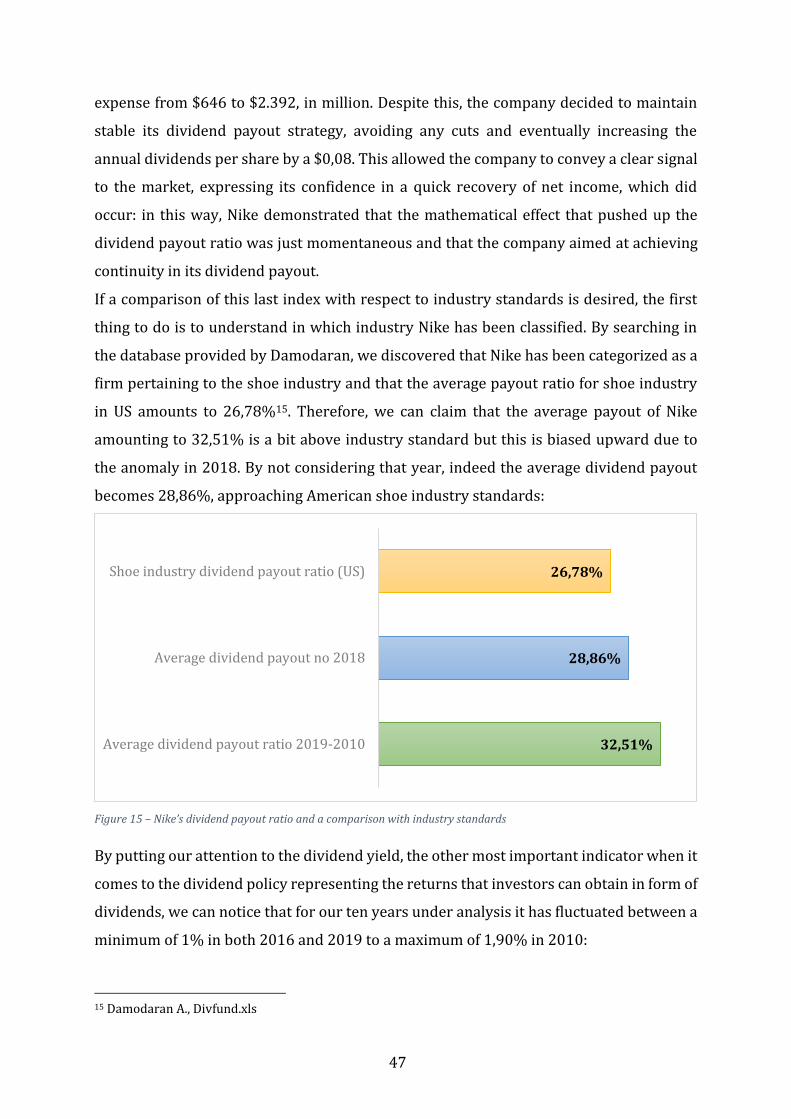
47
expense from $646 to $2.392, in million. Despite this, the company decided to maintain
stable its dividend payout strategy, avoiding any cuts and eventually increasing the
annual dividends per share by a $0,08. This allowed the company to convey a clear signal
to the market, expressing its confidence in a quick recovery of net income, which did
occur: in this way, Nike demonstrated that the mathematical effect that pushed up the
dividend payout ratio was just momentaneous and that the company aimed at achieving
continuity in its dividend payout.
If a comparison of this last index with respect to industry standards is desired, the first
thing to do is to understand in which industry Nike has been classified. By searching in
the database provided by Damodaran, we discovered that Nike has been categorized as a
firm pertaining to the shoe industry and that the average payout ratio for shoe industry
in US amounts to 26,78%15. Therefore, we can claim that the average payout of Nike
amounting to 32,51% is a bit above industry standard but this is biased upward due to
the anomaly in 2018. By not considering that year, indeed the average dividend payout
becomes 28,86%, approaching American shoe industry standards:
Figure 15 – Nike’s dividend payout ratio and a comparison with industry standards
By putting our attention to the dividend yield, the other most important indicator when it
comes to the dividend policy representing the returns that investors can obtain in form of
dividends, we can notice that for our ten years under analysis it has fluctuated between a
minimum of 1% in both 2016 and 2019 to a maximum of 1,90% in 2010:
15 Damodaran A., Divfund.xls
32,51%
28,86%
26,78%
Average dividend payout ratio 2019-2010
Average dividend payout no 2018
Shoe industry dividend payout ratio (US)
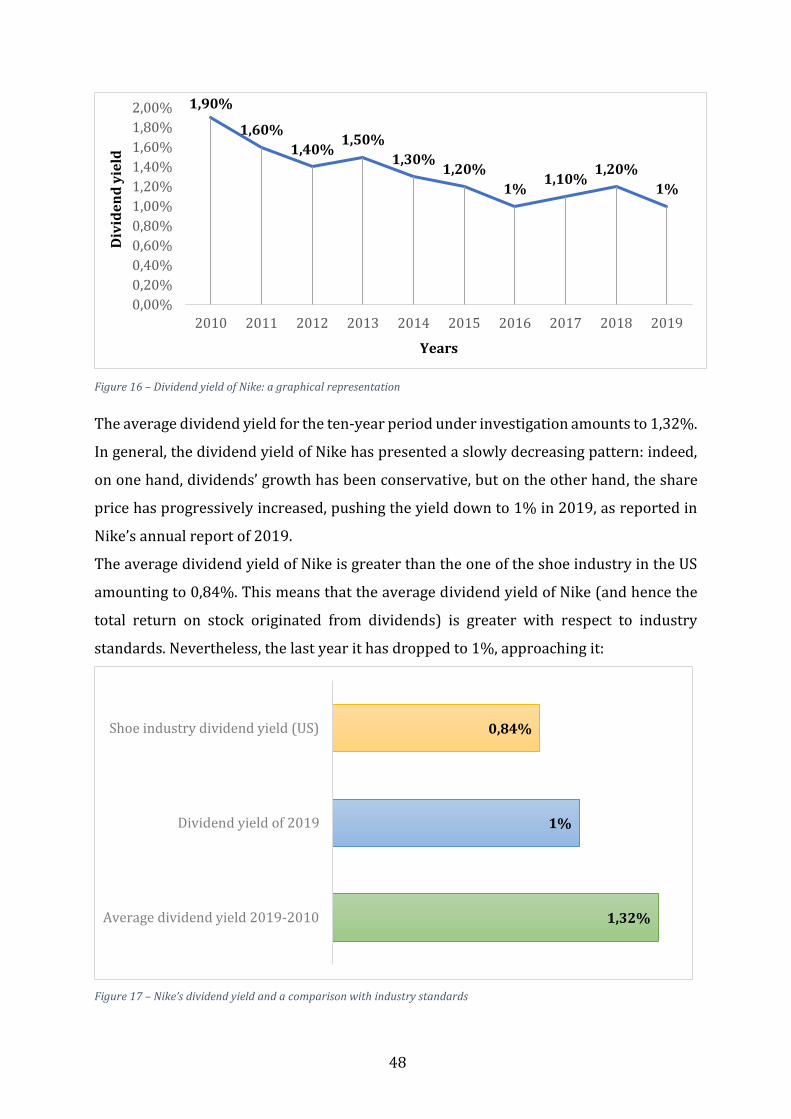
48
Figure 16 – Dividend yield of Nike: a graphical representation
The average dividend yield for the ten-year period under investigation amounts to 1,32%.
In general, the dividend yield of Nike has presented a slowly decreasing pattern: indeed,
on one hand, dividends’ growth has been conservative, but on the other hand, the share
price has progressively increased, pushing the yield down to 1% in 2019, as reported in
Nike’s annual report of 2019.
The average dividend yield of Nike is greater than the one of the shoe industry in the US
amounting to 0,84%. This means that the average dividend yield of Nike (and hence the
total return on stock originated from dividends) is greater with respect to industry
standards. Nevertheless, the last year it has dropped to 1%, approaching it:
Figure 17 – Nike’s dividend yield and a comparison with industry standards
1,90%
1,60%
1,40%1,50%
1,30%1,20%
1%1,10%
1,20%
1%
0,00%
0,20%
0,40%
0,60%
0,80%
1,00%
1,20%
1,40%
1,60%
1,80%
2,00%
2010 2011 2012 2013 2014 2015 2016 2017 2018 2019
Div
ide
nd
yie
ld
Years
1,32%
1%
0,84%
Average dividend yield 2019-2010
Dividend yield of 2019
Shoe industry dividend yield (US)

49
3.2.2. A cash flow approach to assess the appropriateness of Nike’s current
dividend policy
In order to assess the appropriateness of the dividend policy adopted by Nike, we have
used a cashflow approach which ensures that the company has enough cash to sustain
both its dividends and its investment opportunities. This approach involves different
steps that we have illustrated in the previous chapter.
Step 1 – Measuring the FCFE available and compare it with the amount actually
distributed
With the first step, we computed the FCFE for our ten-year period (2010-2019). In order
to do that we needed the following set of inputs:
- Net income: as reported in the consolidated income statement published inside
Nike’s official annual reports.
- Depreciation & amortization: this information was obtained through Orbis
platform by looking at the voice “depreciation, amortization and depletion”. We
double-checked by examining the consolidated cash-flow statement and we
summed up the voices “depreciation” with “amortization and other”: results were
consistent.
- Capex: this figure was acquired through the official annual report of Nike,
according to which “additions to long-lived assets” represented capital
expenditures.
- Change in net working capital: this information was already provided by Ycharts
platform. To confirm it, we performed a double-check: in the consolidated
statement of cash flow, we summed up the “changes in certain working capital
components and other assets and liabilities”. The results were coherent (details in
Table 13 in Appendix A).
- Net Debt Issued: this element was available in Orbis as “Issuance (retirement) of
debt, net” and double-checked in Ycharts platform.
By inserting these inputs in our excel file, we were able to estimate the FCFE which
actually was positive both before and after debt payments for all the ten years under
analysis. In aggregate terms, the company accumulated $24.277,90 million as FCFEPre-tDebt
and $26.854,30 million as FCFEAfterNetDebt, representing the cash that remained to be
redistributed to stockholders after having taken into account both the resources for new
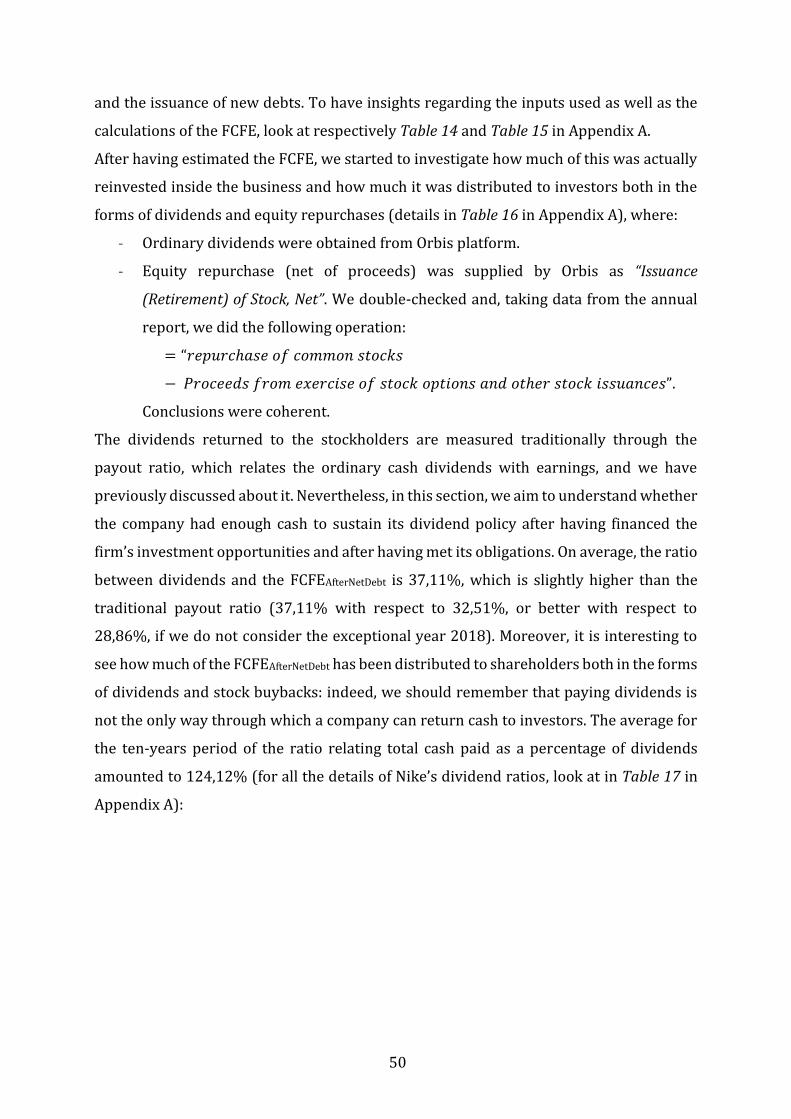
50
and the issuance of new debts. To have insights regarding the inputs used as well as the
calculations of the FCFE, look at respectively Table 14 and Table 15 in Appendix A.
After having estimated the FCFE, we started to investigate how much of this was actually
reinvested inside the business and how much it was distributed to investors both in the
forms of dividends and equity repurchases (details in Table 16 in Appendix A), where:
- Ordinary dividends were obtained from Orbis platform.
- Equity repurchase (net of proceeds) was supplied by Orbis as “Issuance
(Retirement) of Stock, Net”. We double-checked and, taking data from the annual
report, we did the following operation:
= “𝑟𝑒𝑝𝑢𝑟𝑐ℎ𝑎𝑠𝑒 𝑜𝑓 𝑐𝑜𝑚𝑚𝑜𝑛 𝑠𝑡𝑜𝑐𝑘𝑠
− 𝑃𝑟𝑜𝑐𝑒𝑒𝑑𝑠 𝑓𝑟𝑜𝑚 𝑒𝑥𝑒𝑟𝑐𝑖𝑠𝑒 𝑜𝑓 𝑠𝑡𝑜𝑐𝑘 𝑜𝑝𝑡𝑖𝑜𝑛𝑠 𝑎𝑛𝑑 𝑜𝑡ℎ𝑒𝑟 𝑠𝑡𝑜𝑐𝑘 𝑖𝑠𝑠𝑢𝑎𝑛𝑐𝑒𝑠”.
Conclusions were coherent.
The dividends returned to the stockholders are measured traditionally through the
payout ratio, which relates the ordinary cash dividends with earnings, and we have
previously discussed about it. Nevertheless, in this section, we aim to understand whether
the company had enough cash to sustain its dividend policy after having financed the
firm’s investment opportunities and after having met its obligations. On average, the ratio
between dividends and the FCFEAfterNetDebt is 37,11%, which is slightly higher than the
traditional payout ratio (37,11% with respect to 32,51%, or better with respect to
28,86%, if we do not consider the exceptional year 2018). Moreover, it is interesting to
see how much of the FCFEAfterNetDebt has been distributed to shareholders both in the forms
of dividends and stock buybacks: indeed, we should remember that paying dividends is
not the only way through which a company can return cash to investors. The average for
the ten-years period of the ratio relating total cash paid as a percentage of dividends
amounted to 124,12% (for all the details of Nike’s dividend ratios, look at in Table 17 in
Appendix A):
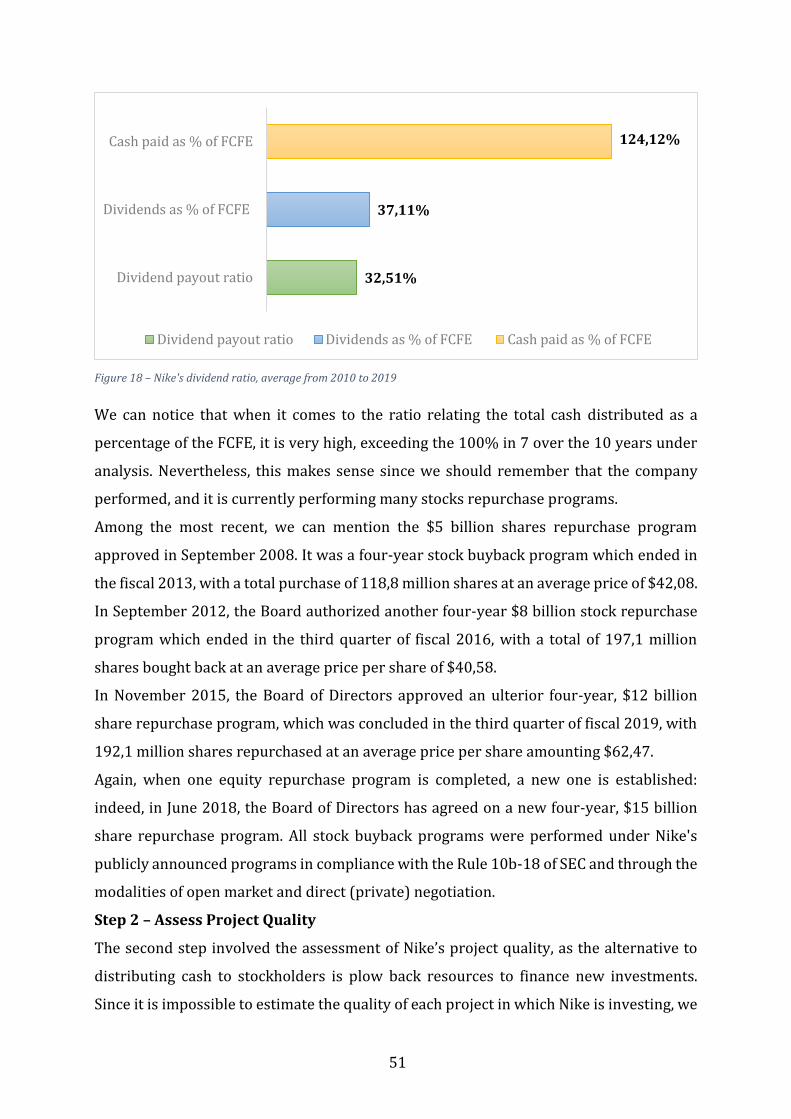
51
Figure 18 – Nike's dividend ratio, average from 2010 to 2019
We can notice that when it comes to the ratio relating the total cash distributed as a
percentage of the FCFE, it is very high, exceeding the 100% in 7 over the 10 years under
analysis. Nevertheless, this makes sense since we should remember that the company
performed, and it is currently performing many stocks repurchase programs.
Among the most recent, we can mention the $5 billion shares repurchase program
approved in September 2008. It was a four-year stock buyback program which ended in
the fiscal 2013, with a total purchase of 118,8 million shares at an average price of $42,08.
In September 2012, the Board authorized another four-year $8 billion stock repurchase
program which ended in the third quarter of fiscal 2016, with a total of 197,1 million
shares bought back at an average price per share of $40,58.
In November 2015, the Board of Directors approved an ulterior four-year, $12 billion
share repurchase program, which was concluded in the third quarter of fiscal 2019, with
192,1 million shares repurchased at an average price per share amounting $62,47.
Again, when one equity repurchase program is completed, a new one is established:
indeed, in June 2018, the Board of Directors has agreed on a new four-year, $15 billion
share repurchase program. All stock buyback programs were performed under Nike's
publicly announced programs in compliance with the Rule 10b-18 of SEC and through the
modalities of open market and direct (private) negotiation.
Step 2 – Assess Project Quality
The second step involved the assessment of Nike’s project quality, as the alternative to
distributing cash to stockholders is plow back resources to finance new investments.
Since it is impossible to estimate the quality of each project in which Nike is investing, we
32,51%
37,11%
124,12%
Dividend payout ratio
Dividends as % of FCFE
Cash paid as % of FCFE
Dividend payout ratio Dividends as % of FCFE Cash paid as % of FCFE
52
decided to use some accounting figures to determine how the firm’s current project
portfolio is performing. To be more precise, we compared the ROE with the cost of equity.
The ROE was obtained by taking the ratio between the net income and the book value of
equity at the start of each year, as reported in respectively the consolidated income
statement and balance sheet published in Nike’s annual report.
The cost of equity (the required rate of return) was computed by using the CAPM, where:
- For the risk-free rate we have used the 3-months T-bill, already provided by
Damodaran.
- Beta for equity is 0,8378 (source: Ycharts).
- For the return on market we have used the S&P 500 annual return, assuming
dividends were reinvested, as reported by Damodaran.
Nike has presented a positive accounting differential in all the years but one (2013): for
this reason, the company can be considered as trusted by its stockholders. To be more
precise, the average ROE has exceeded the cost of equity by 14,70% (26,55% - 11,85%).
Although the average ROE is below the one of the shoe industry in US, amounting to
40,16%, we believe that the company is well managed since, over years, the ROE has
tended to grow over time, (except from 2018) and, in 2019, it even surpassed the industry
standards, meaning that the company is moving in the right direction.
To support our statement, we looked also at how our stock performed against the
financial market, by comparing the annual return on stock with the required rate of
return, where:
- The annual return on stock of Nike was computed by adding the annual change in
the stock price with the dividend yield (for details, look at Table 18 in Appendix A);
- The required rate of rate was calculated by means of the CAPM, as explained
before.
The average Jensen’s alpha from 2010 to 2019 is 10,81%: since the company exhibited a
positive excess return in almost all the 10 years under analysis, we can say that it has
outperformed the market. The exceptions in 2016 and 2012, years in which the company
underperformed the market, were due to the decrease in price caused by the stock split.
As history demonstrated, these deficits were only momentaneous and the stock quickly
recovered.
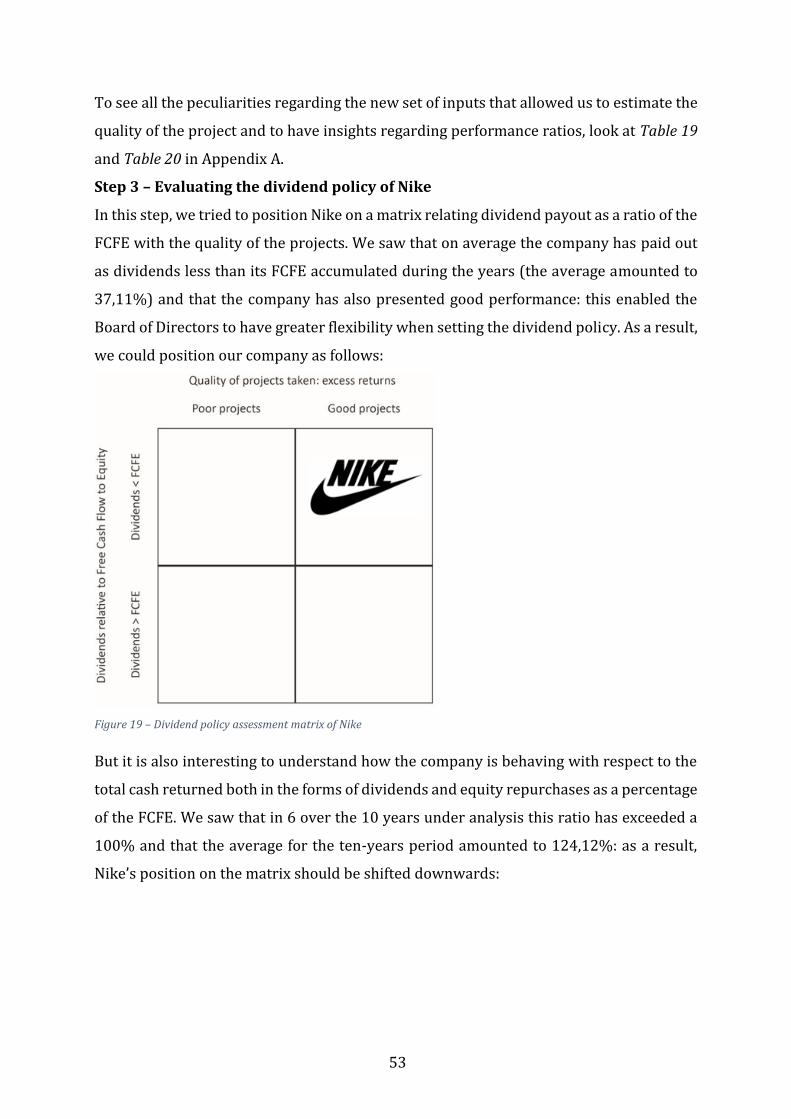
53
To see all the peculiarities regarding the new set of inputs that allowed us to estimate the
quality of the project and to have insights regarding performance ratios, look at Table 19
and Table 20 in Appendix A.
Step 3 – Evaluating the dividend policy of Nike
In this step, we tried to position Nike on a matrix relating dividend payout as a ratio of the
FCFE with the quality of the projects. We saw that on average the company has paid out
as dividends less than its FCFE accumulated during the years (the average amounted to
37,11%) and that the company has also presented good performance: this enabled the
Board of Directors to have greater flexibility when setting the dividend policy. As a result,
we could position our company as follows:
Figure 19 – Dividend policy assessment matrix of Nike
But it is also interesting to understand how the company is behaving with respect to the
total cash returned both in the forms of dividends and equity repurchases as a percentage
of the FCFE. We saw that in 6 over the 10 years under analysis this ratio has exceeded a
100% and that the average for the ten-years period amounted to 124,12%: as a result,
Nike’s position on the matrix should be shifted downwards:
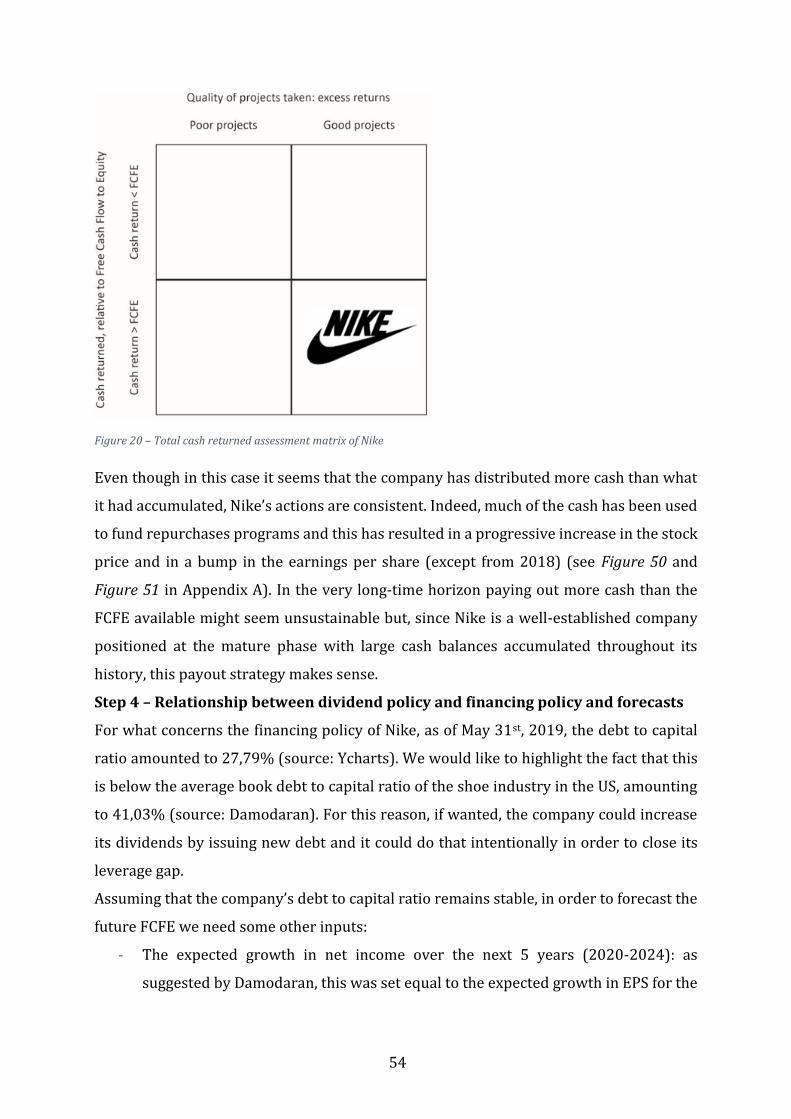
54
Figure 20 – Total cash returned assessment matrix of Nike
Even though in this case it seems that the company has distributed more cash than what
it had accumulated, Nike’s actions are consistent. Indeed, much of the cash has been used
to fund repurchases programs and this has resulted in a progressive increase in the stock
price and in a bump in the earnings per share (except from 2018) (see Figure 50 and
Figure 51 in Appendix A). In the very long-time horizon paying out more cash than the
FCFE available might seem unsustainable but, since Nike is a well-established company
positioned at the mature phase with large cash balances accumulated throughout its
history, this payout strategy makes sense.
Step 4 – Relationship between dividend policy and financing policy and forecasts
For what concerns the financing policy of Nike, as of May 31st, 2019, the debt to capital
ratio amounted to 27,79% (source: Ycharts). We would like to highlight the fact that this
is below the average book debt to capital ratio of the shoe industry in the US, amounting
to 41,03% (source: Damodaran). For this reason, if wanted, the company could increase
its dividends by issuing new debt and it could do that intentionally in order to close its
leverage gap.
Assuming that the company’s debt to capital ratio remains stable, in order to forecast the
future FCFE we need some other inputs:
- The expected growth in net income over the next 5 years (2020-2024): as
suggested by Damodaran, this was set equal to the expected growth in EPS for the
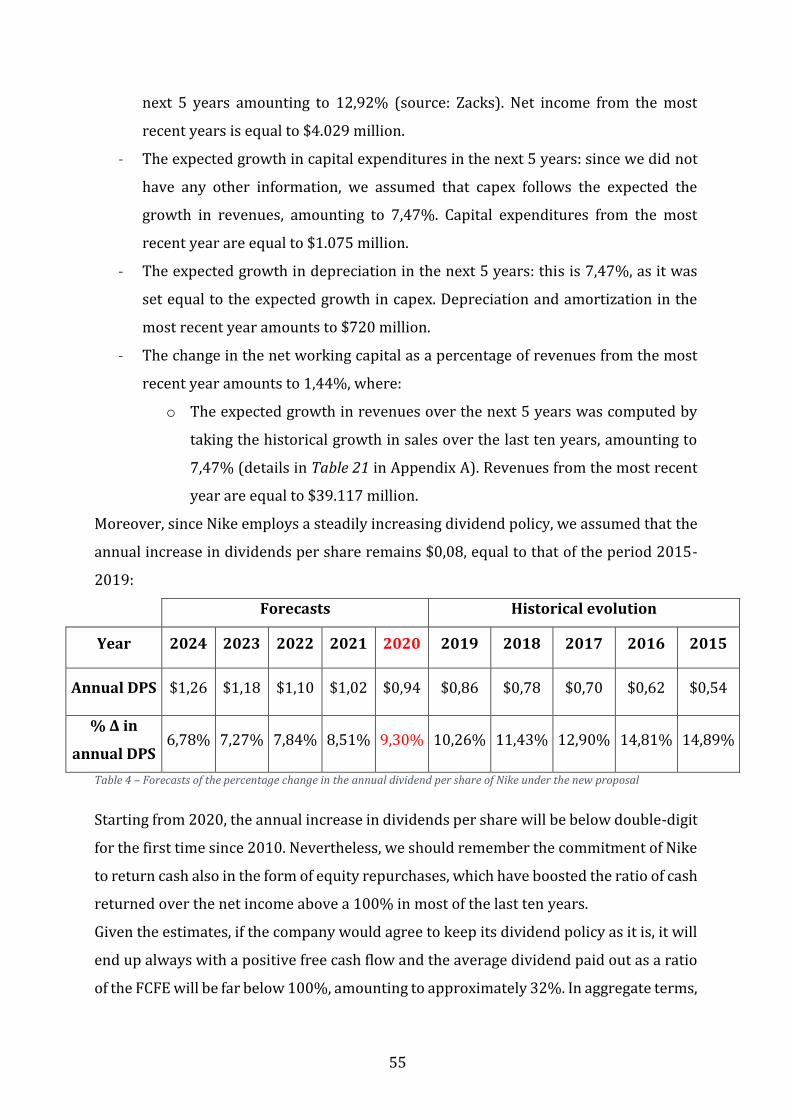
55
next 5 years amounting to 12,92% (source: Zacks). Net income from the most
recent years is equal to $4.029 million.
- The expected growth in capital expenditures in the next 5 years: since we did not
have any other information, we assumed that capex follows the expected the
growth in revenues, amounting to 7,47%. Capital expenditures from the most
recent year are equal to $1.075 million.
- The expected growth in depreciation in the next 5 years: this is 7,47%, as it was
set equal to the expected growth in capex. Depreciation and amortization in the
most recent year amounts to $720 million.
- The change in the net working capital as a percentage of revenues from the most
recent year amounts to 1,44%, where:
o The expected growth in revenues over the next 5 years was computed by
taking the historical growth in sales over the last ten years, amounting to
7,47% (details in Table 21 in Appendix A). Revenues from the most recent
year are equal to $39.117 million.
Moreover, since Nike employs a steadily increasing dividend policy, we assumed that the
annual increase in dividends per share remains $0,08, equal to that of the period 2015-
2019:
Forecasts Historical evolution
Year 2024 2023 2022 2021 2020 2019 2018 2017 2016 2015
Annual DPS $1,26 $1,18 $1,10 $1,02 $0,94 $0,86 $0,78 $0,70 $0,62 $0,54
% Δ in
annual DPS 6,78% 7,27% 7,84% 8,51% 9,30% 10,26% 11,43% 12,90% 14,81% 14,89%
Table 4 – Forecasts of the percentage change in the annual dividend per share of Nike under the new proposal
Starting from 2020, the annual increase in dividends per share will be below double-digit
for the first time since 2010. Nevertheless, we should remember the commitment of Nike
to return cash also in the form of equity repurchases, which have boosted the ratio of cash
returned over the net income above a 100% in most of the last ten years.
Given the estimates, if the company would agree to keep its dividend policy as it is, it will
end up always with a positive free cash flow and the average dividend paid out as a ratio
of the FCFE will be far below 100%, amounting to approximately 32%. In aggregate terms,
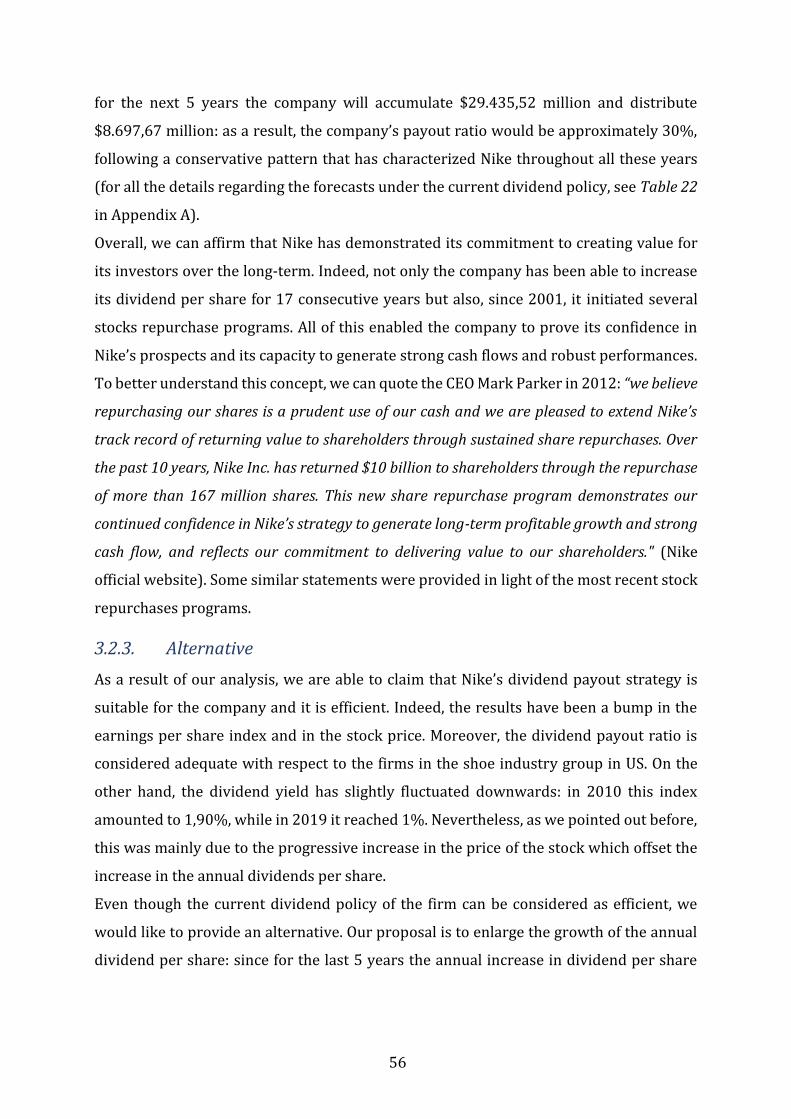
56
for the next 5 years the company will accumulate $29.435,52 million and distribute
$8.697,67 million: as a result, the company’s payout ratio would be approximately 30%,
following a conservative pattern that has characterized Nike throughout all these years
(for all the details regarding the forecasts under the current dividend policy, see Table 22
in Appendix A).
Overall, we can affirm that Nike has demonstrated its commitment to creating value for
its investors over the long-term. Indeed, not only the company has been able to increase
its dividend per share for 17 consecutive years but also, since 2001, it initiated several
stocks repurchase programs. All of this enabled the company to prove its confidence in
Nike’s prospects and its capacity to generate strong cash flows and robust performances.
To better understand this concept, we can quote the CEO Mark Parker in 2012: “we believe
repurchasing our shares is a prudent use of our cash and we are pleased to extend Nike’s
track record of returning value to shareholders through sustained share repurchases. Over
the past 10 years, Nike Inc. has returned $10 billion to shareholders through the repurchase
of more than 167 million shares. This new share repurchase program demonstrates our
continued confidence in Nike’s strategy to generate long-term profitable growth and strong
cash flow, and reflects our commitment to delivering value to our shareholders." (Nike
official website). Some similar statements were provided in light of the most recent stock
repurchases programs.
3.2.3. Alternative
As a result of our analysis, we are able to claim that Nike’s dividend payout strategy is
suitable for the company and it is efficient. Indeed, the results have been a bump in the
earnings per share index and in the stock price. Moreover, the dividend payout ratio is
considered adequate with respect to the firms in the shoe industry group in US. On the
other hand, the dividend yield has slightly fluctuated downwards: in 2010 this index
amounted to 1,90%, while in 2019 it reached 1%. Nevertheless, as we pointed out before,
this was mainly due to the progressive increase in the price of the stock which offset the
increase in the annual dividends per share.
Even though the current dividend policy of the firm can be considered as efficient, we
would like to provide an alternative. Our proposal is to enlarge the growth of the annual
dividend per share: since for the last 5 years the annual increase in dividend per share
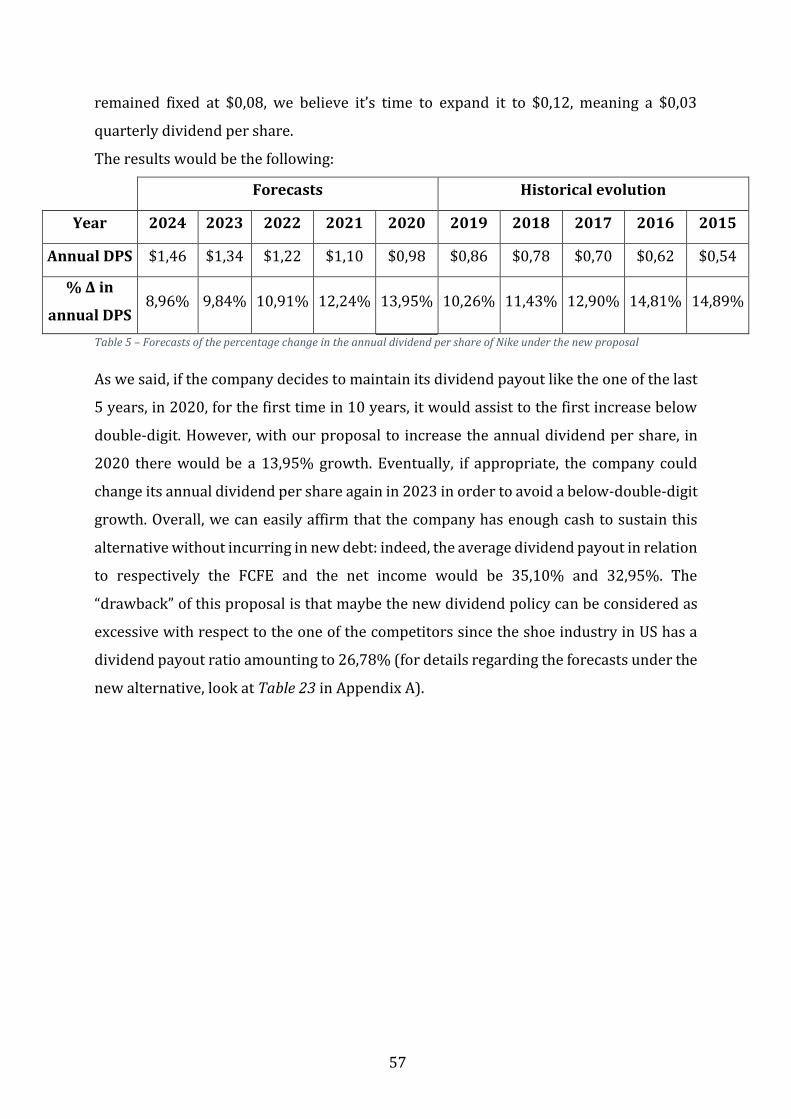
57
remained fixed at $0,08, we believe it’s time to expand it to $0,12, meaning a $0,03
quarterly dividend per share.
The results would be the following:
Forecasts Historical evolution
Year 2024 2023 2022 2021 2020 2019 2018 2017 2016 2015
Annual DPS $1,46 $1,34 $1,22 $1,10 $0,98 $0,86 $0,78 $0,70 $0,62 $0,54
% Δ in
annual DPS 8,96% 9,84% 10,91% 12,24% 13,95% 10,26% 11,43% 12,90% 14,81% 14,89%
Table 5 – Forecasts of the percentage change in the annual dividend per share of Nike under the new proposal
As we said, if the company decides to maintain its dividend payout like the one of the last
5 years, in 2020, for the first time in 10 years, it would assist to the first increase below
double-digit. However, with our proposal to increase the annual dividend per share, in
2020 there would be a 13,95% growth. Eventually, if appropriate, the company could
change its annual dividend per share again in 2023 in order to avoid a below-double-digit
growth. Overall, we can easily affirm that the company has enough cash to sustain this
alternative without incurring in new debt: indeed, the average dividend payout in relation
to respectively the FCFE and the net income would be 35,10% and 32,95%. The
“drawback” of this proposal is that maybe the new dividend policy can be considered as
excessive with respect to the one of the competitors since the shoe industry in US has a
dividend payout ratio amounting to 26,78% (for details regarding the forecasts under the
new alternative, look at Table 23 in Appendix A).

58
Chapter 4 – Case history: Adidas
4.1. Introduction to the company
Name Adidas, AG
Foundation 1949
Headquarter Adi-Dassler-Strasse 1, Herzogenaurach, Bavaria,
91074, Germany
Ticker ADS
Main Stock Exchange Frankfurt Stock Exchange
Market Cap € 56.792 million16
Shares outstanding 195.969.38717
Website https://www.adidas.com
Fiscal year end-date 31/12
Table 6 – Key information of Adidas AG
Adidas AG is a multinational corporation based in Herzogenaurach, Germany that was
founded by Adolf Dassler and his elder brother Rudolf in 1924 under the name Dassler
Brothers Shoe Factory. In 1949 it officially became Adidas-Salomon AG and in 2006 it was
re-named Adidas AG.
The company went public on November 17th, 1995 and, since then, its shares are listed on
the "Deutsche Börse" stock exchange in Frankfurt. In addition, the Adidas is a member of
several high-quality stock indexes around the world, among which the DAX-30, the EURO
STOXX 50, the MSCI World Textiles, Apparel and Luxury Goods Index are the most
important. The consolidated accounts are published in EUR and the closing date of the
annual reports is 31/12/year.
The company is the largest sportswear manufacturer in Europe and the second-largest in
the world, after Nike. The corporate Group comprises of 262 ultimately owned
subsidiaries and most of them are in the United States (119), Canada (15), China (11) and
Germany (9):
16 As of December 31st, 2019; source: Adidas annual report
17 As of December 31st, 2019; source: Adidas annual report
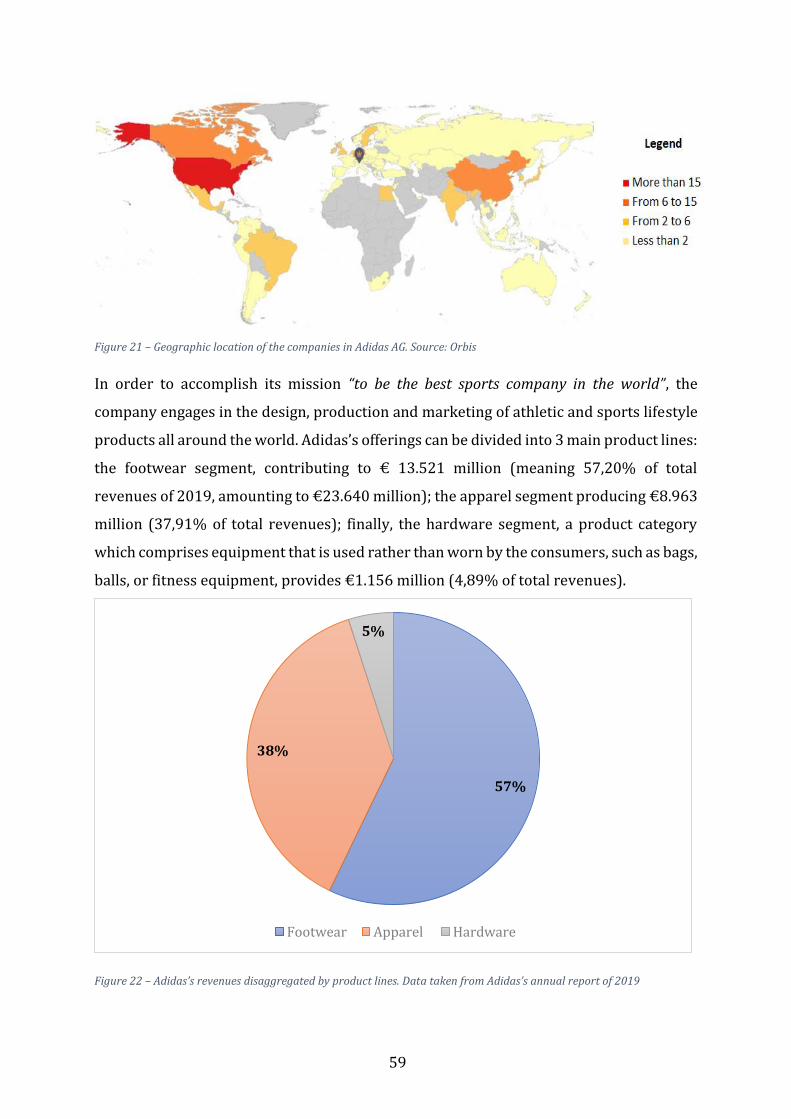
59
Figure 21 – Geographic location of the companies in Adidas AG. Source: Orbis
In order to accomplish its mission “to be the best sports company in the world”, the
company engages in the design, production and marketing of athletic and sports lifestyle
products all around the world. Adidas’s offerings can be divided into 3 main product lines:
the footwear segment, contributing to € 13.521 million (meaning 57,20% of total
revenues of 2019, amounting to €23.640 million); the apparel segment producing €8.963
million (37,91% of total revenues); finally, the hardware segment, a product category
which comprises equipment that is used rather than worn by the consumers, such as bags,
balls, or fitness equipment, provides €1.156 million (4,89% of total revenues).
Figure 22 – Adidas’s revenues disaggregated by product lines. Data taken from Adidas’s annual report of 2019
57%
38%
5%
Footwear Apparel Hardware
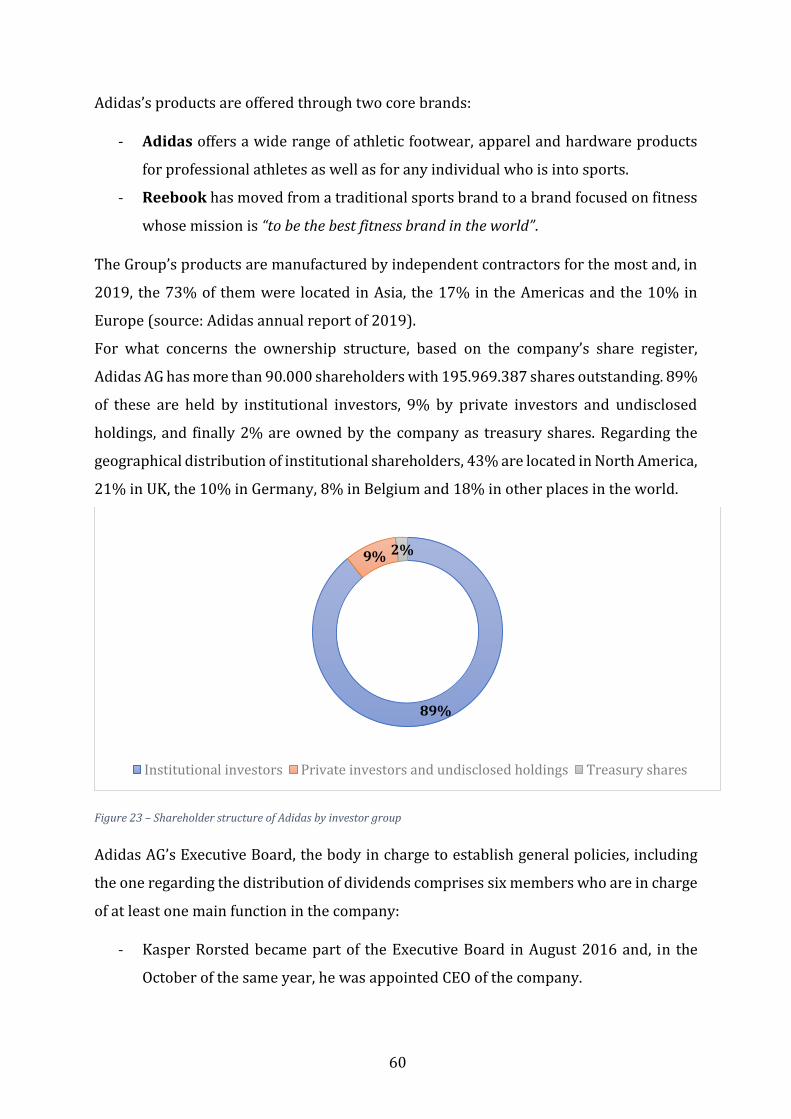
60
Adidas’s products are offered through two core brands:
- Adidas offers a wide range of athletic footwear, apparel and hardware products
for professional athletes as well as for any individual who is into sports.
- Reebook has moved from a traditional sports brand to a brand focused on fitness
whose mission is “to be the best fitness brand in the world”.
The Group’s products are manufactured by independent contractors for the most and, in
2019, the 73% of them were located in Asia, the 17% in the Americas and the 10% in
Europe (source: Adidas annual report of 2019).
For what concerns the ownership structure, based on the company’s share register,
Adidas AG has more than 90.000 shareholders with 195.969.387 shares outstanding. 89%
of these are held by institutional investors, 9% by private investors and undisclosed
holdings, and finally 2% are owned by the company as treasury shares. Regarding the
geographical distribution of institutional shareholders, 43% are located in North America,
21% in UK, the 10% in Germany, 8% in Belgium and 18% in other places in the world.
Figure 23 – Shareholder structure of Adidas by investor group
Adidas AG’s Executive Board, the body in charge to establish general policies, including
the one regarding the distribution of dividends comprises six members who are in charge
of at least one main function in the company:
- Kasper Rorsted became part of the Executive Board in August 2016 and, in the
October of the same year, he was appointed CEO of the company.
89%
9% 2%
Institutional investors Private investors and undisclosed holdings Treasury shares
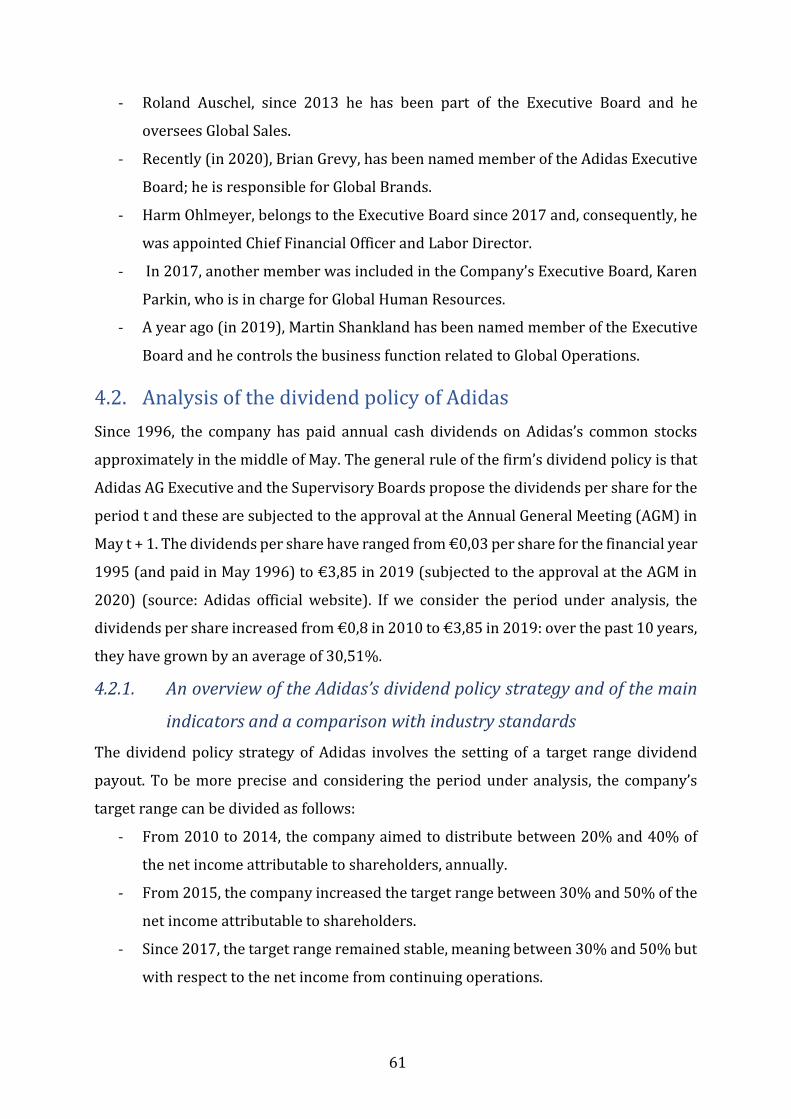
61
- Roland Auschel, since 2013 he has been part of the Executive Board and he
oversees Global Sales.
- Recently (in 2020), Brian Grevy, has been named member of the Adidas Executive
Board; he is responsible for Global Brands.
- Harm Ohlmeyer, belongs to the Executive Board since 2017 and, consequently, he
was appointed Chief Financial Officer and Labor Director.
- In 2017, another member was included in the Company’s Executive Board, Karen
Parkin, who is in charge for Global Human Resources.
- A year ago (in 2019), Martin Shankland has been named member of the Executive
Board and he controls the business function related to Global Operations.
4.2. Analysis of the dividend policy of Adidas
Since 1996, the company has paid annual cash dividends on Adidas’s common stocks
approximately in the middle of May. The general rule of the firm’s dividend policy is that
Adidas AG Executive and the Supervisory Boards propose the dividends per share for the
period t and these are subjected to the approval at the Annual General Meeting (AGM) in
May t + 1. The dividends per share have ranged from €0,03 per share for the financial year
1995 (and paid in May 1996) to €3,85 in 2019 (subjected to the approval at the AGM in
2020) (source: Adidas official website). If we consider the period under analysis, the
dividends per share increased from €0,8 in 2010 to €3,85 in 2019: over the past 10 years,
they have grown by an average of 30,51%.
4.2.1. An overview of the Adidas’s dividend policy strategy and of the main
indicators and a comparison with industry standards
The dividend policy strategy of Adidas involves the setting of a target range dividend
payout. To be more precise and considering the period under analysis, the company’s
target range can be divided as follows:
- From 2010 to 2014, the company aimed to distribute between 20% and 40% of
the net income attributable to shareholders, annually.
- From 2015, the company increased the target range between 30% and 50% of the
net income attributable to shareholders.
- Since 2017, the target range remained stable, meaning between 30% and 50% but
with respect to the net income from continuing operations.
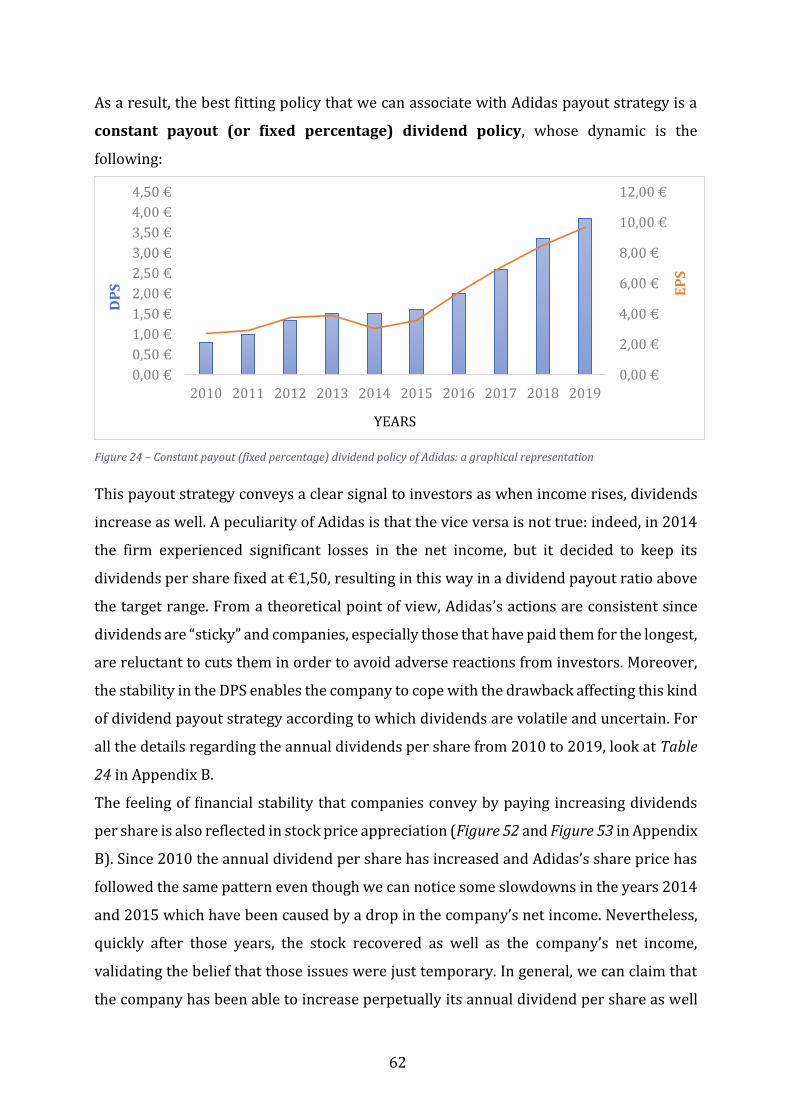
62
As a result, the best fitting policy that we can associate with Adidas payout strategy is a
constant payout (or fixed percentage) dividend policy, whose dynamic is the
following:
Figure 24 – Constant payout (fixed percentage) dividend policy of Adidas: a graphical representation
This payout strategy conveys a clear signal to investors as when income rises, dividends
increase as well. A peculiarity of Adidas is that the vice versa is not true: indeed, in 2014
the firm experienced significant losses in the net income, but it decided to keep its
dividends per share fixed at €1,50, resulting in this way in a dividend payout ratio above
the target range. From a theoretical point of view, Adidas’s actions are consistent since
dividends are “sticky” and companies, especially those that have paid them for the longest,
are reluctant to cuts them in order to avoid adverse reactions from investors. Moreover,
the stability in the DPS enables the company to cope with the drawback affecting this kind
of dividend payout strategy according to which dividends are volatile and uncertain. For
all the details regarding the annual dividends per share from 2010 to 2019, look at Table
24 in Appendix B.
The feeling of financial stability that companies convey by paying increasing dividends
per share is also reflected in stock price appreciation (Figure 52 and Figure 53 in Appendix
B). Since 2010 the annual dividend per share has increased and Adidas’s share price has
followed the same pattern even though we can notice some slowdowns in the years 2014
and 2015 which have been caused by a drop in the company’s net income. Nevertheless,
quickly after those years, the stock recovered as well as the company’s net income,
validating the belief that those issues were just temporary. In general, we can claim that
the company has been able to increase perpetually its annual dividend per share as well
0,00 €
2,00 €
4,00 €
6,00 €
8,00 €
10,00 €
12,00 €
0,00 €
0,50 €
1,00 €
1,50 €
2,00 €
2,50 €
3,00 €
3,50 €
4,00 €
4,50 €
2010 2011 2012 2013 2014 2015 2016 2017 2018 2019
EP
S
DP
S
YEARS
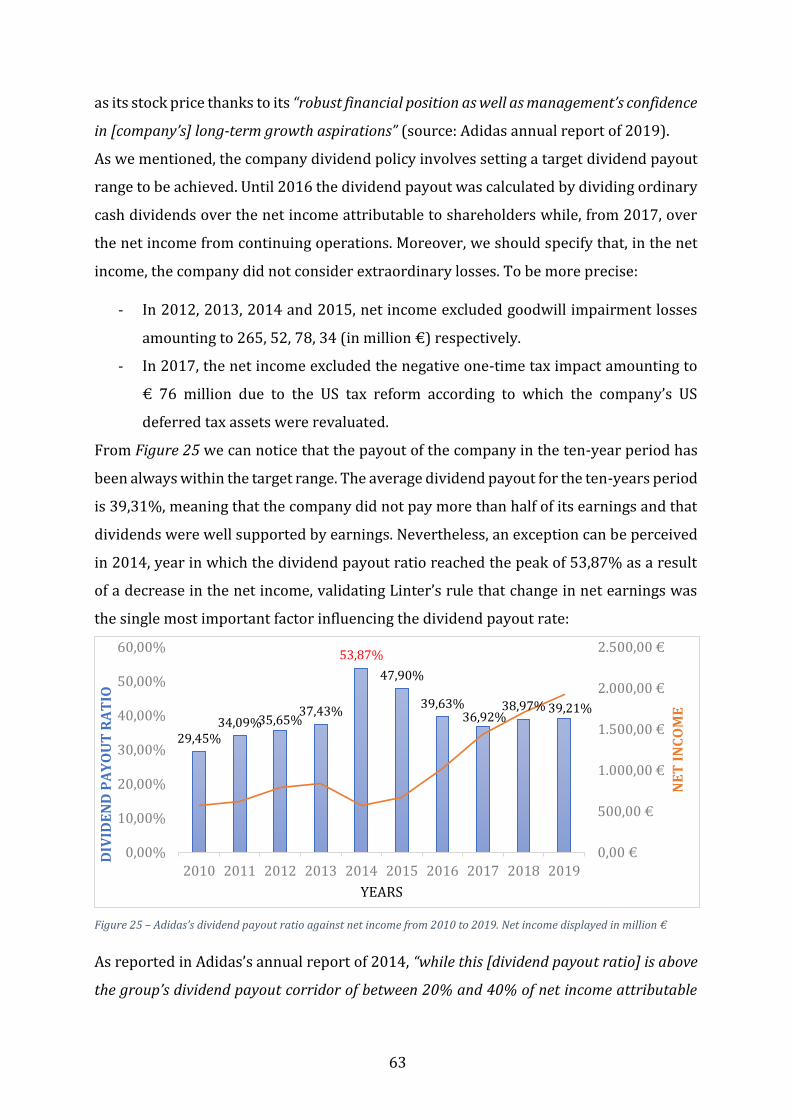
63
as its stock price thanks to its “robust financial position as well as management’s confidence
in [company’s] long-term growth aspirations” (source: Adidas annual report of 2019).
As we mentioned, the company dividend policy involves setting a target dividend payout
range to be achieved. Until 2016 the dividend payout was calculated by dividing ordinary
cash dividends over the net income attributable to shareholders while, from 2017, over
the net income from continuing operations. Moreover, we should specify that, in the net
income, the company did not consider extraordinary losses. To be more precise:
- In 2012, 2013, 2014 and 2015, net income excluded goodwill impairment losses
amounting to 265, 52, 78, 34 (in million €) respectively.
- In 2017, the net income excluded the negative one-time tax impact amounting to
€ 76 million due to the US tax reform according to which the company’s US
deferred tax assets were revaluated.
From Figure 25 we can notice that the payout of the company in the ten-year period has
been always within the target range. The average dividend payout for the ten-years period
is 39,31%, meaning that the company did not pay more than half of its earnings and that
dividends were well supported by earnings. Nevertheless, an exception can be perceived
in 2014, year in which the dividend payout ratio reached the peak of 53,87% as a result
of a decrease in the net income, validating Linter’s rule that change in net earnings was
the single most important factor influencing the dividend payout rate:
Figure 25 – Adidas’s dividend payout ratio against net income from 2010 to 2019. Net income displayed in million €
As reported in Adidas’s annual report of 2014, “while this [dividend payout ratio] is above
the group’s dividend payout corridor of between 20% and 40% of net income attributable
29,45%34,09%35,65%
37,43%
53,87%
47,90%
39,63%36,92%
38,97% 39,21%
0,00%
10,00%
20,00%
30,00%
40,00%
50,00%
60,00%
2010 2011 2012 2013 2014 2015 2016 2017 2018 2019
0,00 €
500,00 €
1.000,00 €
1.500,00 €
2.000,00 €
2.500,00 €
DIV
IDE
ND
PA
YO
UT
RA
TIO
YEARS
NE
T I
NC
OM
E

64
to shareholders, it reflects [company’s] commitment to a consistent, shareholder-oriented
dividend policy […] aimed towards continuity”. Hence, despite the fall in the earnings, the
company brought forward its devotion to achieve continuity and stability in its dividend
policy which translated in a maintenance of its dividends per share at €1,50, equal to the
DPS of the fiscal 2013. Indeed, as we should know by now, cuts in dividends are not
desired as they could communicate the wrong information. Moreover, this action allowed
the firm to express its tight judgement that the loss was just temporary and to convey its
confidence and trust both to the market and to company’s investors that earnings were
going to recovery quickly which, as history proved, it actually occurred.
If we want to compare the dividend payout ratio index with respect to that of the industry
standards, first we need to know in which industry the company belongs. Adidas has been
classified by Damodaran as a firm pertaining to the apparel industry18. The average
dividend payout of the apparel industry in Western Europe amounts to 49,35% (source:
Damodaran): hence, the average dividend payout of Adidas is lower than industry
standards. But, if we consider dividends over total net income, this ratio would become
43,37%, approaching industry standards:
Figure 26 – Dividend payout ratio of Adidas and a comparison with industry standards
Moving the focus of our attention to the other fundamental indicator regarding the
dividend policy, namely the dividend yield which represents the part of investors’ return
coming from dividends, we can notice that, from 2010 to 2019, it has oscillated between
a minimum of 1,30% to a maximum of 2,60% and that the average for the ten-year period
amounted to 1,76%:
18 Damodaran A. DivfundEurope.xls
43,37%
39,31%
49,35%
Average dividend payout as a ratio oftotal net income
Average dividend payout ratio 2019-2010
Apparel industry dividend payoutratio
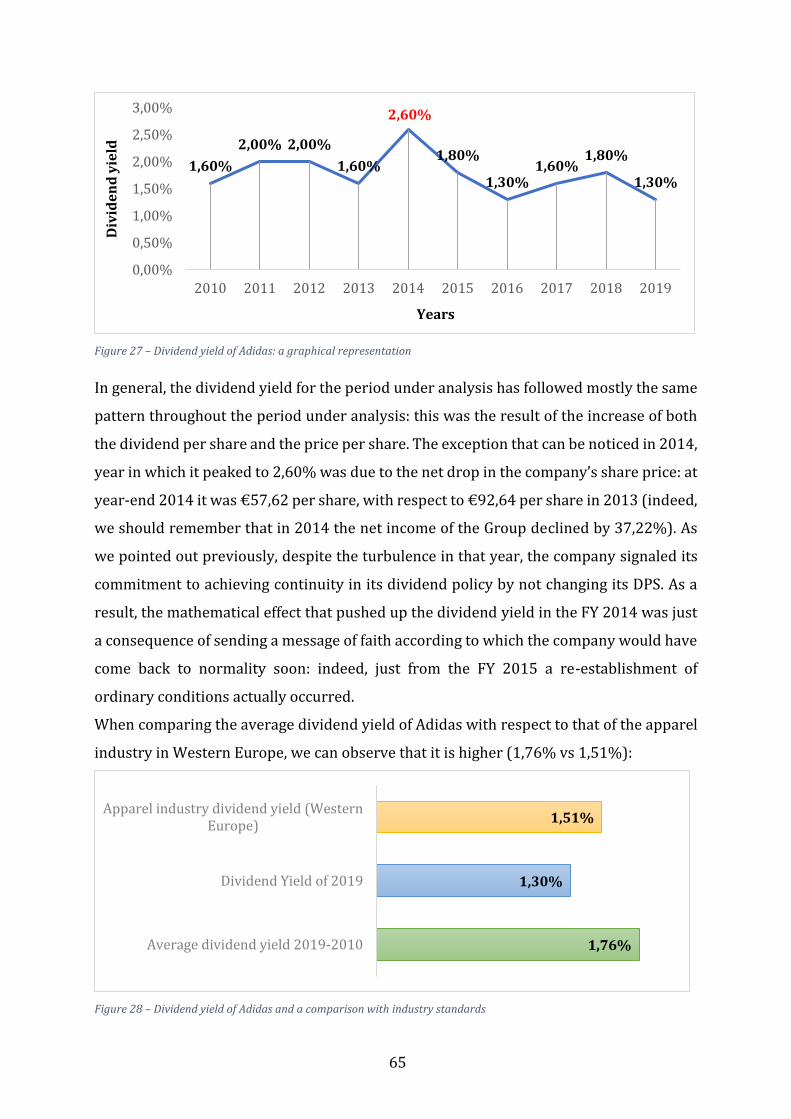
65
Figure 27 – Dividend yield of Adidas: a graphical representation
In general, the dividend yield for the period under analysis has followed mostly the same
pattern throughout the period under analysis: this was the result of the increase of both
the dividend per share and the price per share. The exception that can be noticed in 2014,
year in which it peaked to 2,60% was due to the net drop in the company’s share price: at
year-end 2014 it was €57,62 per share, with respect to €92,64 per share in 2013 (indeed,
we should remember that in 2014 the net income of the Group declined by 37,22%). As
we pointed out previously, despite the turbulence in that year, the company signaled its
commitment to achieving continuity in its dividend policy by not changing its DPS. As a
result, the mathematical effect that pushed up the dividend yield in the FY 2014 was just
a consequence of sending a message of faith according to which the company would have
come back to normality soon: indeed, just from the FY 2015 a re-establishment of
ordinary conditions actually occurred.
When comparing the average dividend yield of Adidas with respect to that of the apparel
industry in Western Europe, we can observe that it is higher (1,76% vs 1,51%):
Figure 28 – Dividend yield of Adidas and a comparison with industry standards
1,60%
2,00% 2,00%
1,60%
2,60%
1,80%
1,30%1,60%
1,80%
1,30%
0,00%
0,50%
1,00%
1,50%
2,00%
2,50%
3,00%
2010 2011 2012 2013 2014 2015 2016 2017 2018 2019
Div
ide
nd
yie
ld
Years
1,76%
1,30%
1,51%
Average dividend yield 2019-2010
Dividend Yield of 2019
Apparel industry dividend yield (WesternEurope)

66
As a result, this means that the total return on stock coming from dividends is higher with
respect to industry standards. Still, in the last five years, the dividend yield has
approached industry standards and, in 2019, it was even below: indeed, the denominator
(the price per share) has increased more than the annual dividend per share in percentage
terms, pushing down the ratio.
4.2.2. A cash flow approach to assess the appropriateness of Adidas AG’s
current dividend policy
Step 1 – Measuring the FCFE available and compare it with the amount actually
distributed
Like what we did for Nike, the primary thing we did in order to take this step was to
estimate the FCFE. The inputs needed for our ten-years period (2010-2019), as well as
the sources from which we have taken them, are the following:
- Net income: as reported in the consolidated income statement published inside
Adidas’s official annual reports. For simplicity, we have considered the total net
income (including one-time taxes and impairments of goodwill).
- Depreciation & amortization: this information was obtained through Orbis
platform by looking at the voice “depreciation, amortization and depletion”. By
double-checking the consolidated cash-flow statement under the voice
“depreciation, amortization and impairment losses other”, we found out that results
were consistent.
- Capex: this figure was available in the company’s annual report in which they
defined capital expenditures as “the total cash expenditure for the purchase of
tangible and intangible assets (excluding acquisition and [since 2019] right-of-use
assets according to IFRS 16)”.
- Change in net working capital: we calculated this information by summing up the
changes in working capital components displayed in the cash flow statement
published inside company’s annual report (details in Table 25 in Appendix B).
- Net debt issued: this element was calculated by summing up the change in short-
term borrowings with the change in long-term borrowings as reported in Orbis
platform (details in Table 26 in Appendix B). A double-check was performed by
looking at the statement of cash flow position of Adidas’s annual report and results
were coherent.
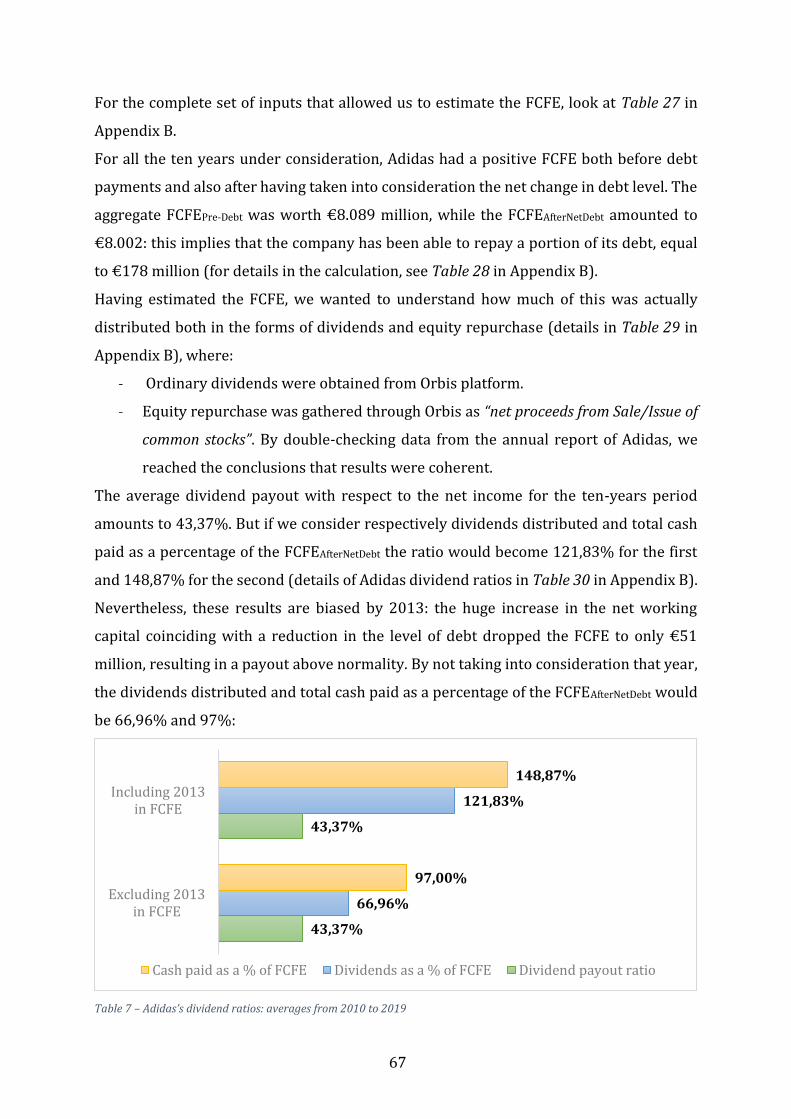
67
For the complete set of inputs that allowed us to estimate the FCFE, look at Table 27 in
Appendix B.
For all the ten years under consideration, Adidas had a positive FCFE both before debt
payments and also after having taken into consideration the net change in debt level. The
aggregate FCFEPre-Debt was worth €8.089 million, while the FCFEAfterNetDebt amounted to
€8.002: this implies that the company has been able to repay a portion of its debt, equal
to €178 million (for details in the calculation, see Table 28 in Appendix B).
Having estimated the FCFE, we wanted to understand how much of this was actually
distributed both in the forms of dividends and equity repurchase (details in Table 29 in
Appendix B), where:
- Ordinary dividends were obtained from Orbis platform.
- Equity repurchase was gathered through Orbis as “net proceeds from Sale/Issue of
common stocks”. By double-checking data from the annual report of Adidas, we
reached the conclusions that results were coherent.
The average dividend payout with respect to the net income for the ten-years period
amounts to 43,37%. But if we consider respectively dividends distributed and total cash
paid as a percentage of the FCFEAfterNetDebt the ratio would become 121,83% for the first
and 148,87% for the second (details of Adidas dividend ratios in Table 30 in Appendix B).
Nevertheless, these results are biased by 2013: the huge increase in the net working
capital coinciding with a reduction in the level of debt dropped the FCFE to only €51
million, resulting in a payout above normality. By not taking into consideration that year,
the dividends distributed and total cash paid as a percentage of the FCFEAfterNetDebt would
be 66,96% and 97%:
Table 7 – Adidas’s dividend ratios: averages from 2010 to 2019
43,37%
43,37%
66,96%
121,83%
97,00%
148,87%
Excluding 2013in FCFE
Including 2013in FCFE
Cash paid as a % of FCFE Dividends as a % of FCFE Dividend payout ratio
68
It is interesting to notice that both dividends distributed and total cash paid out as a ratio
of the FCFE are lower than 100%, meaning that, over the years, the company has
distributed less cash than the FCFE. This last ratio is very close to 100%: this is because
the company has engaged in several stock repurchases programs. Among the most recent,
we can mention 3-years, €1,5 billion share repurchase program launched on October 1st,
2014, as authorized by the AGM on May 8th, 2014. In the same year, the company
completed the first tranche of the program, with a total of approximately 4,9 million
shares bought back (equal to 2,34% of the firm’s nominal capital) at an average price of
€61,36, resulting in a total payout of about €300 million. On March 6th, 2015, the company
initiated the second tranche of the repurchase program, which ended with a total of
approximately 4,1 million shares (equal to 1,97% of firm’s share capital), at an average
price of €72,65, resulting in a total payout of about €300 million. On May 12th, 2016, the
AGM canceled the authorization of 2014 and, at the same time, approved another
authorization to the company’s Executive Board to buy shares back up to a 10% of the
nominal capital up to May 11th, 2021. Under this new authorization, the company
concluded the repurchase program of 2014 with a final third tranche from November 8th,
2016, to January 31st, 2017, with a total of approximately 2,1 million shares (equal to
1,02% of firm’s nominal capital) bought back at an average price of €140,96, resulting in
a total payout of €300 million. Based on the authorization granted on May 12th, 2016,
Adidas Executive Board initiated on May 22nd, 2018, a new €3 billion multi-years stock
repurchase program. In the same year, the company ended up the first tranche of the stock
buyback program, with a total purchase of approximately 5,1 million shares (equal to
2,5% of the firm’s share capital) at an average price of €196,45, resulting in a total payout
of €1 billion. On January 7th, 2019, the company started the second tranche of the
repurchase program, which ended with a total purchase of approximately 3,2 million
shares (equal to 1,6% of firm’s share capital), at an average price of €252,80, resulting in
a total payout of approximately 815 million €.
The stock buyback programs were financed mostly through company’s net cash position
and operating cash of the years ahead and, according to Adidas annual reports, they could
“be carried out via the stock exchange, through a public invitation to submit the sale offers,
through a public repurchase offer, or through granting tender rights to shareholder”.
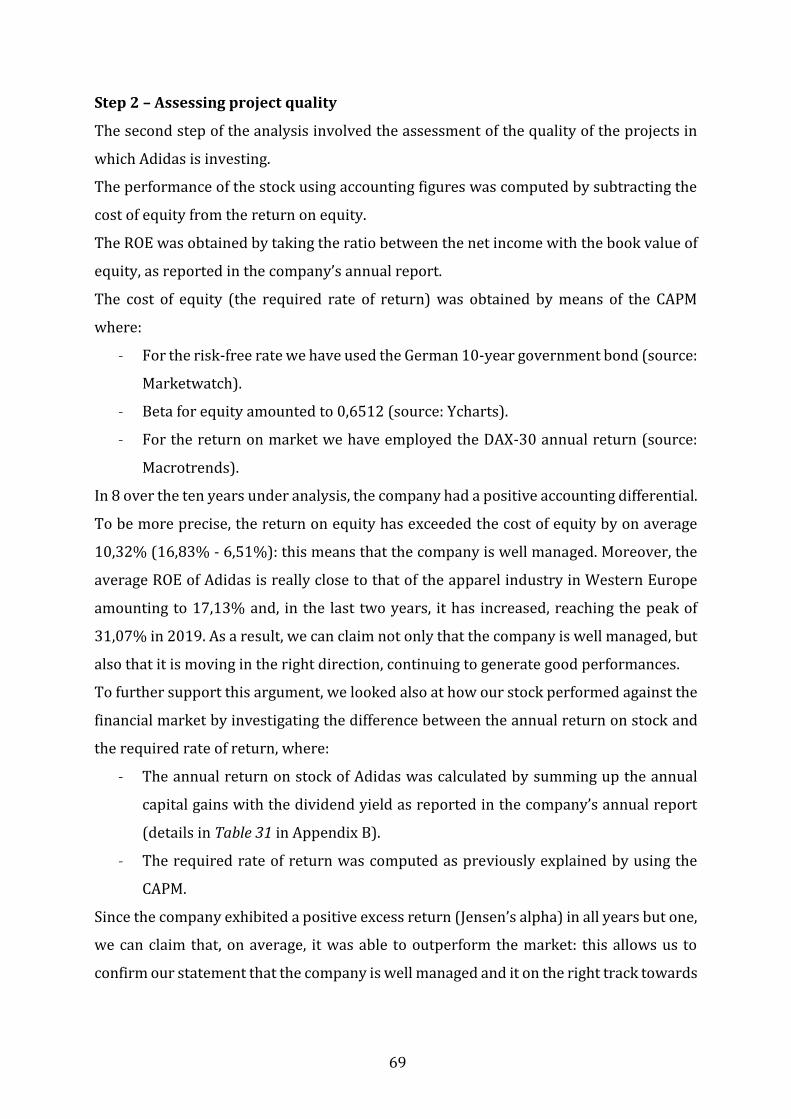
69
Step 2 – Assessing project quality
The second step of the analysis involved the assessment of the quality of the projects in
which Adidas is investing.
The performance of the stock using accounting figures was computed by subtracting the
cost of equity from the return on equity.
The ROE was obtained by taking the ratio between the net income with the book value of
equity, as reported in the company’s annual report.
The cost of equity (the required rate of return) was obtained by means of the CAPM
where:
- For the risk-free rate we have used the German 10-year government bond (source:
Marketwatch).
- Beta for equity amounted to 0,6512 (source: Ycharts).
- For the return on market we have employed the DAX-30 annual return (source:
Macrotrends).
In 8 over the ten years under analysis, the company had a positive accounting differential.
To be more precise, the return on equity has exceeded the cost of equity by on average
10,32% (16,83% - 6,51%): this means that the company is well managed. Moreover, the
average ROE of Adidas is really close to that of the apparel industry in Western Europe
amounting to 17,13% and, in the last two years, it has increased, reaching the peak of
31,07% in 2019. As a result, we can claim not only that the company is well managed, but
also that it is moving in the right direction, continuing to generate good performances.
To further support this argument, we looked also at how our stock performed against the
financial market by investigating the difference between the annual return on stock and
the required rate of return, where:
- The annual return on stock of Adidas was calculated by summing up the annual
capital gains with the dividend yield as reported in the company’s annual report
(details in Table 31 in Appendix B).
- The required rate of return was computed as previously explained by using the
CAPM.
Since the company exhibited a positive excess return (Jensen’s alpha) in all years but one,
we can claim that, on average, it was able to outperform the market: this allows us to
confirm our statement that the company is well managed and it on the right track towards
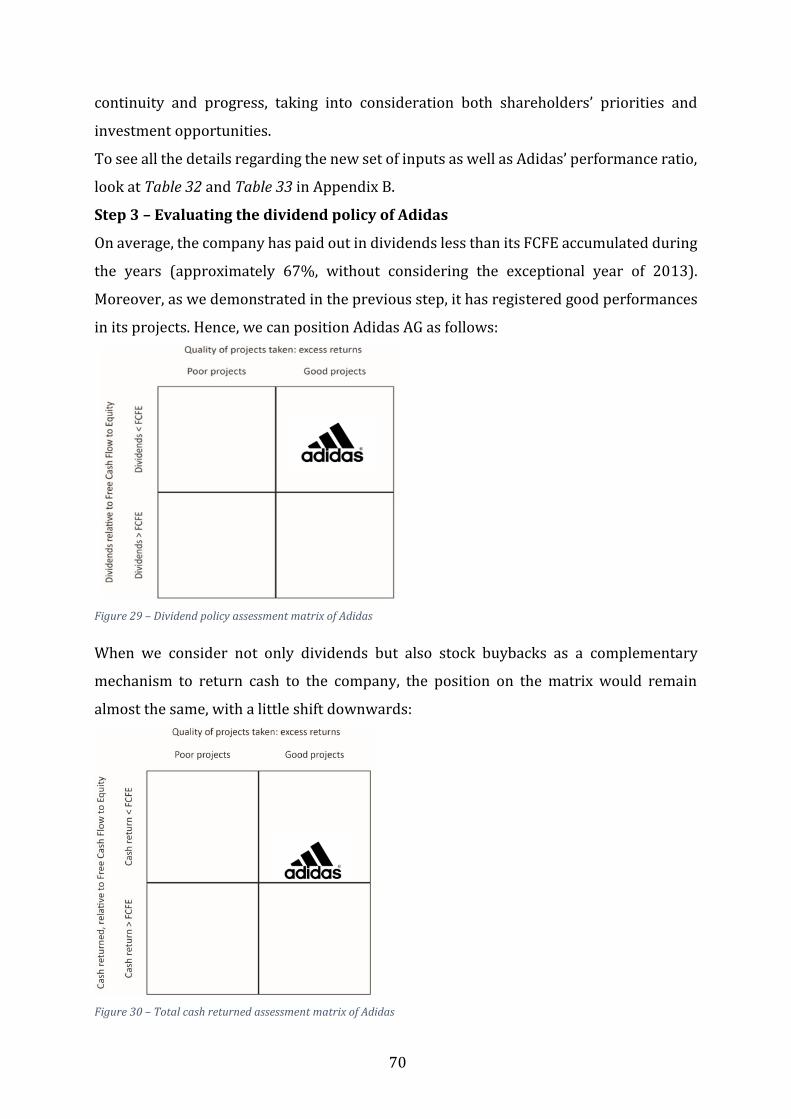
70
continuity and progress, taking into consideration both shareholders’ priorities and
investment opportunities.
To see all the details regarding the new set of inputs as well as Adidas’ performance ratio,
look at Table 32 and Table 33 in Appendix B.
Step 3 – Evaluating the dividend policy of Adidas
On average, the company has paid out in dividends less than its FCFE accumulated during
the years (approximately 67%, without considering the exceptional year of 2013).
Moreover, as we demonstrated in the previous step, it has registered good performances
in its projects. Hence, we can position Adidas AG as follows:
Figure 29 – Dividend policy assessment matrix of Adidas
When we consider not only dividends but also stock buybacks as a complementary
mechanism to return cash to the company, the position on the matrix would remain
almost the same, with a little shift downwards:
Figure 30 – Total cash returned assessment matrix of Adidas
71
In only 3 over the 10 years under analysis the company has distributed more cash than in
its FCFE and the average is approximately 97%, without considering 2013. As a result,
Adidas has been able to accumulate cash to be reinvested in new profitable projects and
the superior performance allowed the company to enjoy to a significant flexibility when
it comes to dividend policy. The good management’s actions of the company have resulted
in a progressive increase in the stock price and in the earnings per share (except for 2014)
(see Figure 53 and Figure 54 in Appendix B).
Step 4 – Relationship between dividend policy and financing policy and forecasts
As far as financing policy is concerned, as of 31st December 2019, the debt to capital ratio
of Adidas amounted to 19,42% (source: Ycharts). We have noticed that this is really below
the average book debt to capital ratio of the companies in the apparel industry of Western
Europe, amounting to 37,84% (source: Damodaran). Hence, since the company is
underleveraged, it could increase its dividends using also debt if required. Assuming that
we keep fixed the debt to capital ratio, in order to forecast future FCFE we need some
other inputs:
- The expected growth in net income over the next 5 years (2020-2024), where net
income for the most recent year (2019) amounts to €1.977 million: as suggested
by Damodaran, this was set equal to the expected growth in EPS for the next 5
years amounting 6,83% (source: Zacks).
- The expected growth in capital expenditures over the next 5 years: since we did
not have any other information, we assumed that capex follows the expected
growth in revenues, equal to 8,76%. Capital expenditures from the most recent
year, amounts to €711 million.
- The expected growth in depreciation over the next 5 years: this amounts to 8,76%,
as it was set equal to the expected growth in capex. Depreciation and amortization
in the most recent year, amounts to € 1.214 million
- The change in net working capital as a percent of revenues from the most recent
year amounts to –1,05%, where:
o The expected growth in revenues over the next 5 years was calculated by
taking the historical growth in sales over the last ten year, amounting to
8,76% (details in Table 11 in Appendix B). Revenues from the most recent
year equal to €23.640 million.
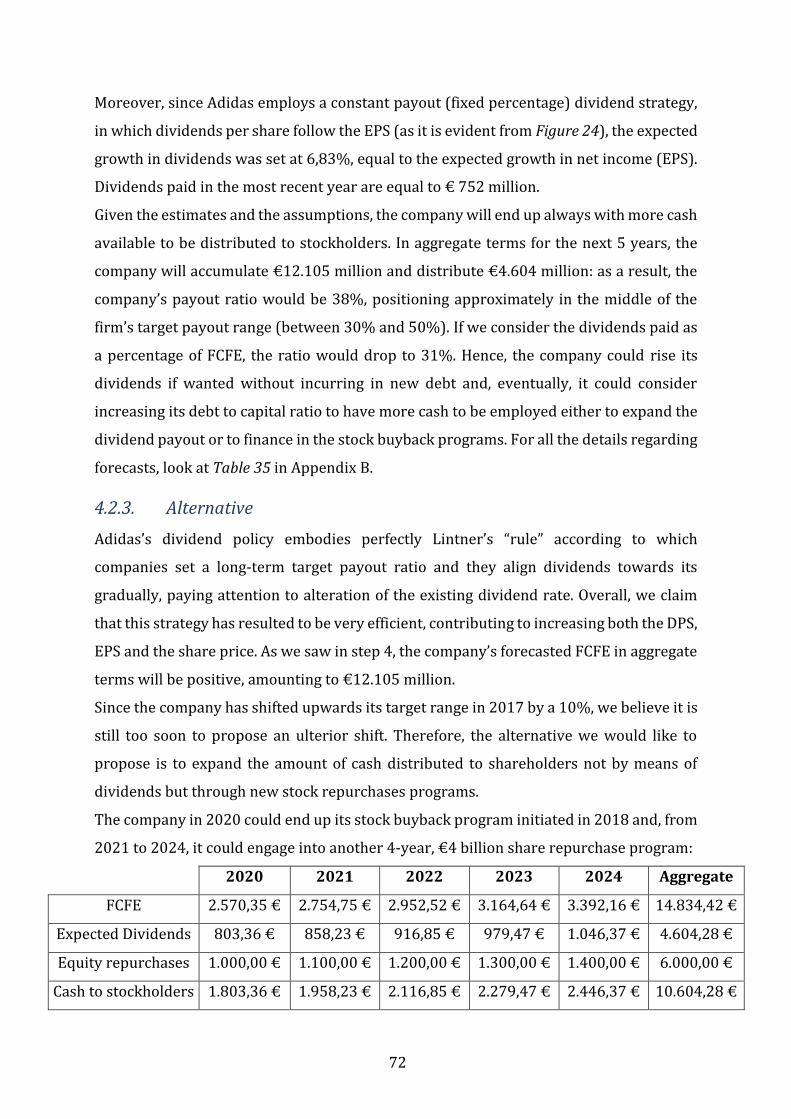
72
Moreover, since Adidas employs a constant payout (fixed percentage) dividend strategy,
in which dividends per share follow the EPS (as it is evident from Figure 24), the expected
growth in dividends was set at 6,83%, equal to the expected growth in net income (EPS).
Dividends paid in the most recent year are equal to € 752 million.
Given the estimates and the assumptions, the company will end up always with more cash
available to be distributed to stockholders. In aggregate terms for the next 5 years, the
company will accumulate €12.105 million and distribute €4.604 million: as a result, the
company’s payout ratio would be 38%, positioning approximately in the middle of the
firm’s target payout range (between 30% and 50%). If we consider the dividends paid as
a percentage of FCFE, the ratio would drop to 31%. Hence, the company could rise its
dividends if wanted without incurring in new debt and, eventually, it could consider
increasing its debt to capital ratio to have more cash to be employed either to expand the
dividend payout or to finance in the stock buyback programs. For all the details regarding
forecasts, look at Table 35 in Appendix B.
4.2.3. Alternative
Adidas’s dividend policy embodies perfectly Lintner’s “rule” according to which
companies set a long-term target payout ratio and they align dividends towards its
gradually, paying attention to alteration of the existing dividend rate. Overall, we claim
that this strategy has resulted to be very efficient, contributing to increasing both the DPS,
EPS and the share price. As we saw in step 4, the company’s forecasted FCFE in aggregate
terms will be positive, amounting to €12.105 million.
Since the company has shifted upwards its target range in 2017 by a 10%, we believe it is
still too soon to propose an ulterior shift. Therefore, the alternative we would like to
propose is to expand the amount of cash distributed to shareholders not by means of
dividends but through new stock repurchases programs.
The company in 2020 could end up its stock buyback program initiated in 2018 and, from
2021 to 2024, it could engage into another 4-year, €4 billion share repurchase program:
2020 2021 2022 2023 2024 Aggregate
FCFE 2.570,35 € 2.754,75 € 2.952,52 € 3.164,64 € 3.392,16 € 14.834,42 €
Expected Dividends 803,36 € 858,23 € 916,85 € 979,47 € 1.046,37 € 4.604,28 €
Equity repurchases 1.000,00 € 1.100,00 € 1.200,00 € 1.300,00 € 1.400,00 € 6.000,00 €
Cash to stockholders 1.803,36 € 1.958,23 € 2.116,85 € 2.279,47 € 2.446,37 € 10.604,28 €

73
Average
Cash as % of FCFE 70,16% 71,09% 71,70% 72,03% 72,12% 71,42%
Table 8 – Forecasts of Adidas under the new alternative, in million €
In this way the company could retain part of the profit inside the business, accumulating
large cash balances to be employed in particular cases and, at the same time, it could
distribute the remaining part to investors. Indeed, the average cash distributed as a
percentage of the FCFE is equal to 71,42%, approaching the same percentage of 2018 and
2019. This strategy would allow the company not only to demonstrate its commitment to
reward shareholders for their investments but also its continuity in remunerating them
through a series of share repurchases programs started in 2014. Eventually, if needed, the
company could issue additional debt to finance the new repurchases programs, maybe
also in the optic to close the leverage gap.
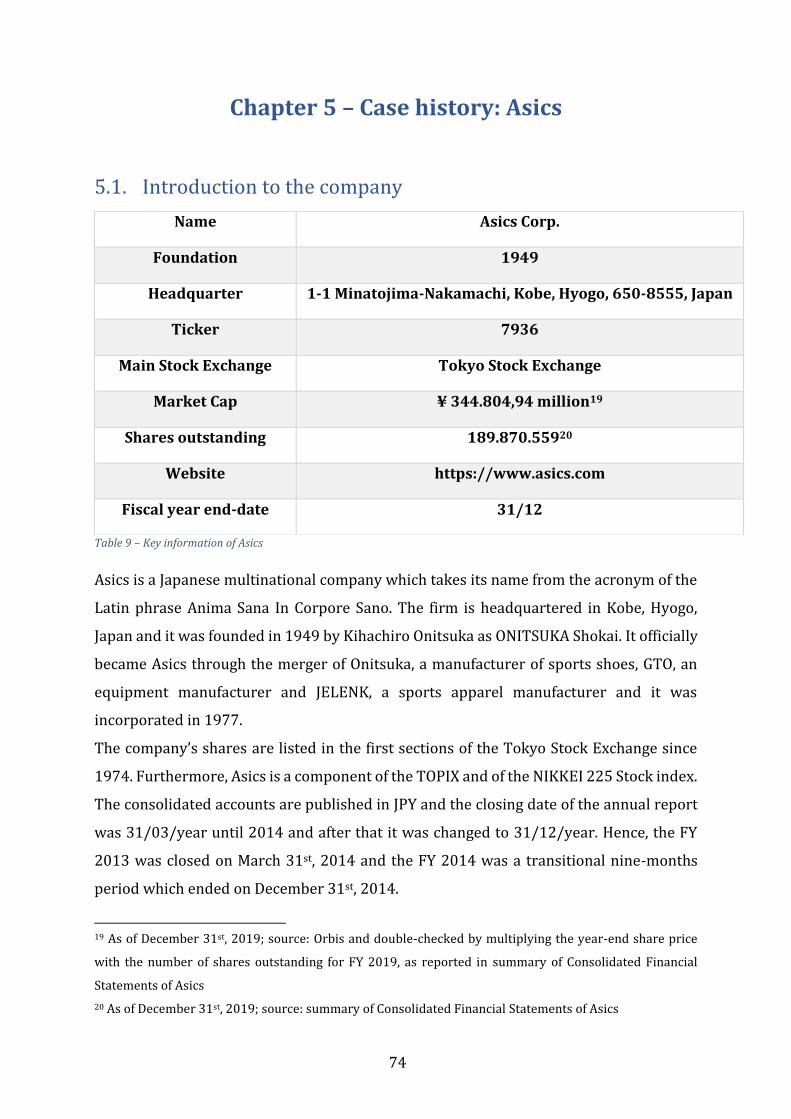
74
Chapter 5 – Case history: Asics
5.1. Introduction to the company
Table 9 – Key information of Asics
Asics is a Japanese multinational company which takes its name from the acronym of the
Latin phrase Anima Sana In Corpore Sano. The firm is headquartered in Kobe, Hyogo,
Japan and it was founded in 1949 by Kihachiro Onitsuka as ONITSUKA Shokai. It officially
became Asics through the merger of Onitsuka, a manufacturer of sports shoes, GTO, an
equipment manufacturer and JELENK, a sports apparel manufacturer and it was
incorporated in 1977.
The company’s shares are listed in the first sections of the Tokyo Stock Exchange since
1974. Furthermore, Asics is a component of the TOPIX and of the NIKKEI 225 Stock index.
The consolidated accounts are published in JPY and the closing date of the annual report
was 31/03/year until 2014 and after that it was changed to 31/12/year. Hence, the FY
2013 was closed on March 31st, 2014 and the FY 2014 was a transitional nine-months
period which ended on December 31st, 2014.
19 As of December 31st, 2019; source: Orbis and double-checked by multiplying the year-end share price
with the number of shares outstanding for FY 2019, as reported in summary of Consolidated Financial
Statements of Asics
20 As of December 31st, 2019; source: summary of Consolidated Financial Statements of Asics
Name Asics Corp.
Foundation 1949
Headquarter 1-1 Minatojima-Nakamachi, Kobe, Hyogo, 650-8555, Japan
Ticker 7936
Main Stock Exchange Tokyo Stock Exchange
Market Cap ¥ 344.804,94 million19
Shares outstanding 189.870.55920
Website https://www.asics.com
Fiscal year end-date 31/12
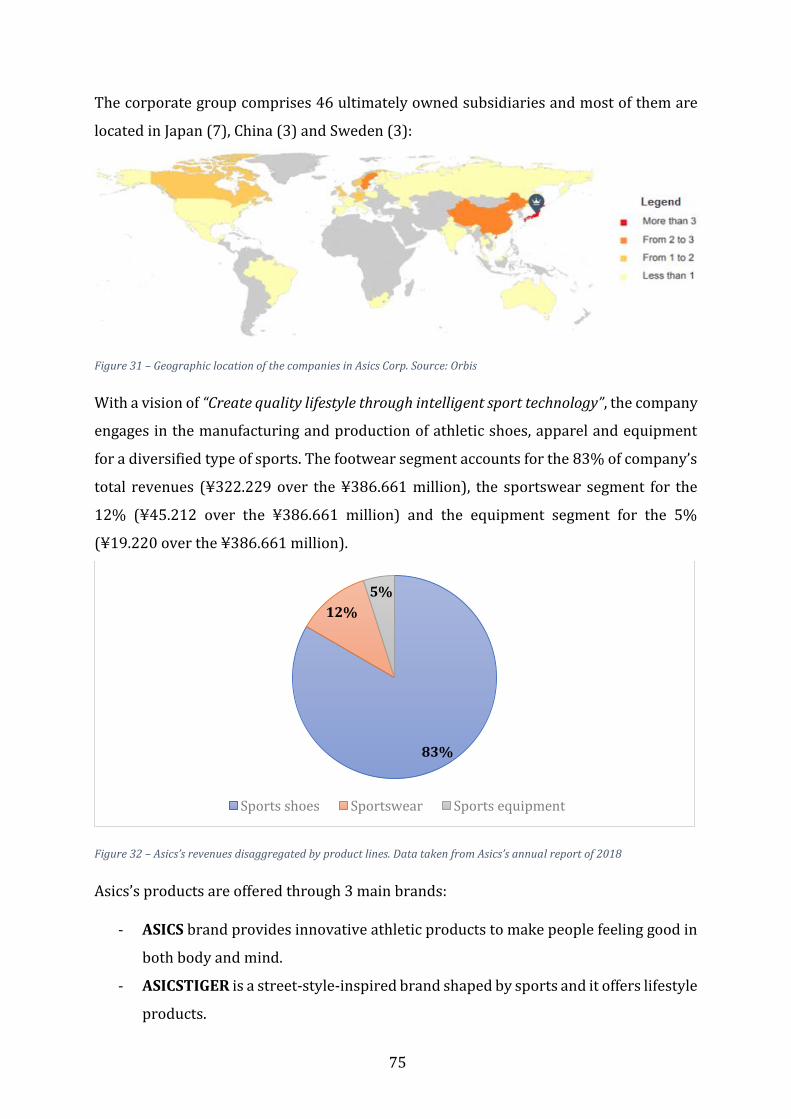
75
The corporate group comprises 46 ultimately owned subsidiaries and most of them are
located in Japan (7), China (3) and Sweden (3):
Figure 31 – Geographic location of the companies in Asics Corp. Source: Orbis
With a vision of “Create quality lifestyle through intelligent sport technology”, the company
engages in the manufacturing and production of athletic shoes, apparel and equipment
for a diversified type of sports. The footwear segment accounts for the 83% of company’s
total revenues (¥322.229 over the ¥386.661 million), the sportswear segment for the
12% (¥45.212 over the ¥386.661 million) and the equipment segment for the 5%
(¥19.220 over the ¥386.661 million).
Figure 32 – Asics’s revenues disaggregated by product lines. Data taken from Asics’s annual report of 2018
Asics’s products are offered through 3 main brands:
- ASICS brand provides innovative athletic products to make people feeling good in
both body and mind.
- ASICSTIGER is a street-style-inspired brand shaped by sports and it offers lifestyle
products.
83%
12%
5%
Sports shoes Sportswear Sports equipment
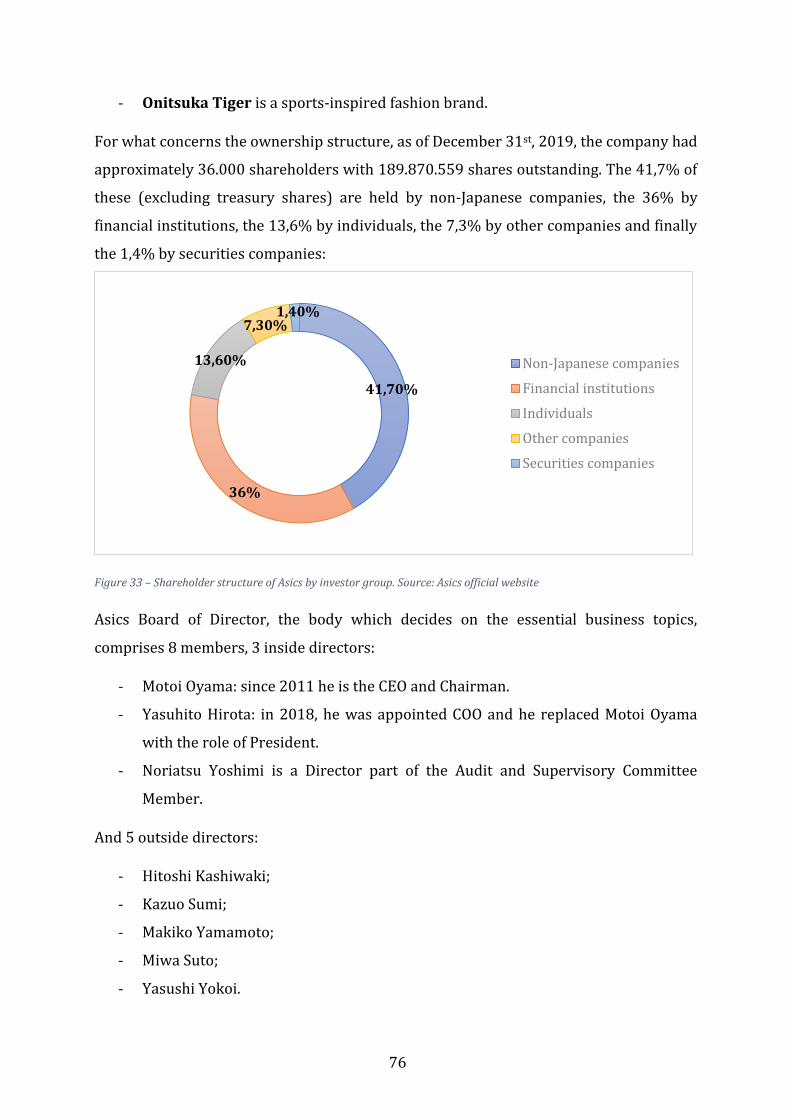
76
- Onitsuka Tiger is a sports-inspired fashion brand.
For what concerns the ownership structure, as of December 31st, 2019, the company had
approximately 36.000 shareholders with 189.870.559 shares outstanding. The 41,7% of
these (excluding treasury shares) are held by non-Japanese companies, the 36% by
financial institutions, the 13,6% by individuals, the 7,3% by other companies and finally
the 1,4% by securities companies:
Figure 33 – Shareholder structure of Asics by investor group. Source: Asics official website
Asics Board of Director, the body which decides on the essential business topics,
comprises 8 members, 3 inside directors:
- Motoi Oyama: since 2011 he is the CEO and Chairman.
- Yasuhito Hirota: in 2018, he was appointed COO and he replaced Motoi Oyama
with the role of President.
- Noriatsu Yoshimi is a Director part of the Audit and Supervisory Committee
Member.
And 5 outside directors:
- Hitoshi Kashiwaki;
- Kazuo Sumi;
- Makiko Yamamoto;
- Miwa Suto;
- Yasushi Yokoi.
41,70%
36%
13,60%
7,30%1,40%
Non-Japanese companies
Financial institutions
Individuals
Other companies
Securities companies
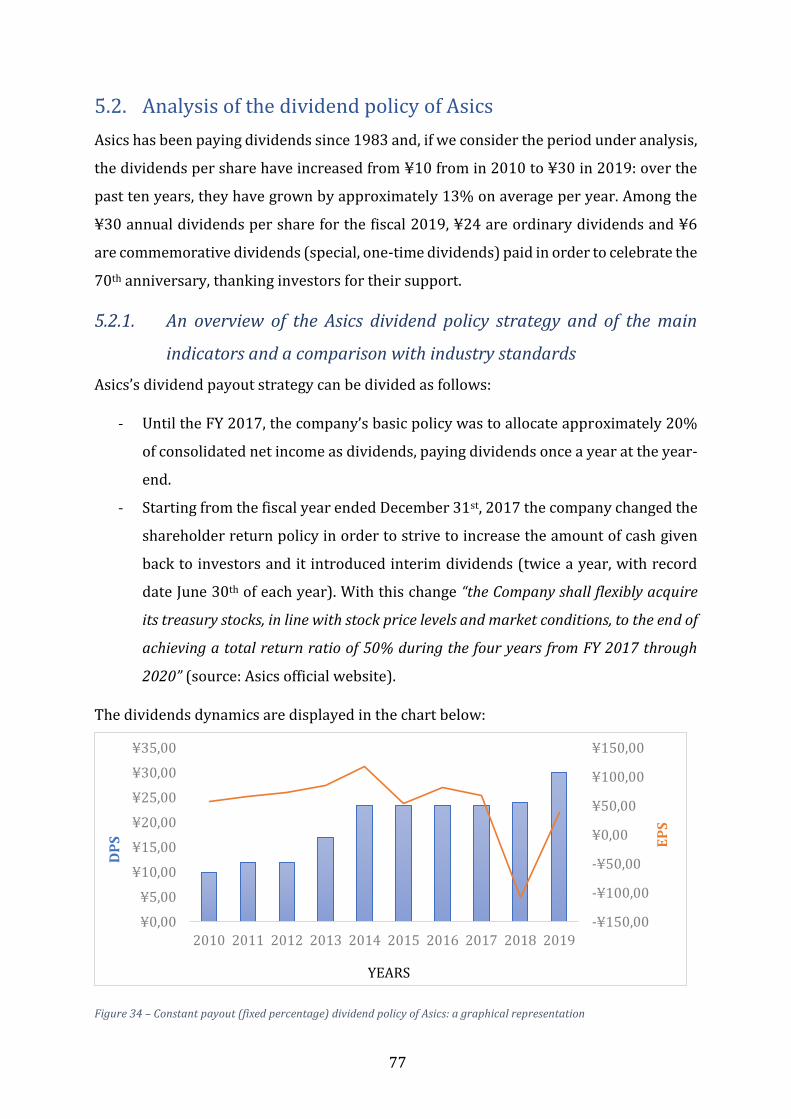
77
5.2. Analysis of the dividend policy of Asics
Asics has been paying dividends since 1983 and, if we consider the period under analysis,
the dividends per share have increased from ¥10 from in 2010 to ¥30 in 2019: over the
past ten years, they have grown by approximately 13% on average per year. Among the
¥30 annual dividends per share for the fiscal 2019, ¥24 are ordinary dividends and ¥6
are commemorative dividends (special, one-time dividends) paid in order to celebrate the
70th anniversary, thanking investors for their support.
5.2.1. An overview of the Asics dividend policy strategy and of the main
indicators and a comparison with industry standards
Asics’s dividend payout strategy can be divided as follows:
- Until the FY 2017, the company’s basic policy was to allocate approximately 20%
of consolidated net income as dividends, paying dividends once a year at the year-
end.
- Starting from the fiscal year ended December 31st, 2017 the company changed the
shareholder return policy in order to strive to increase the amount of cash given
back to investors and it introduced interim dividends (twice a year, with record
date June 30th of each year). With this change “the Company shall flexibly acquire
its treasury stocks, in line with stock price levels and market conditions, to the end of
achieving a total return ratio of 50% during the four years from FY 2017 through
2020” (source: Asics official website).
The dividends dynamics are displayed in the chart below:
Figure 34 – Constant payout (fixed percentage) dividend policy of Asics: a graphical representation
-¥150,00
-¥100,00
-¥50,00
¥0,00
¥50,00
¥100,00
¥150,00
¥0,00
¥5,00
¥10,00
¥15,00
¥20,00
¥25,00
¥30,00
¥35,00
2010 2011 2012 2013 2014 2015 2016 2017 2018 2019
EP
S
DP
S
YEARS
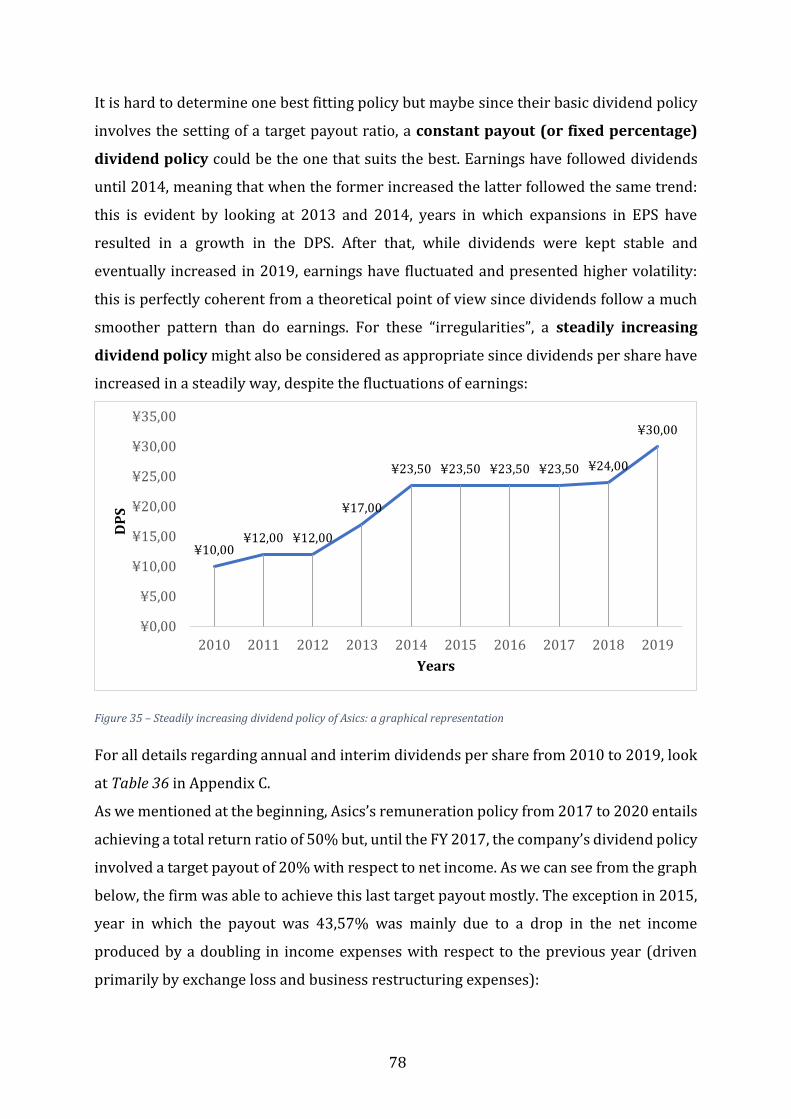
78
It is hard to determine one best fitting policy but maybe since their basic dividend policy
involves the setting of a target payout ratio, a constant payout (or fixed percentage)
dividend policy could be the one that suits the best. Earnings have followed dividends
until 2014, meaning that when the former increased the latter followed the same trend:
this is evident by looking at 2013 and 2014, years in which expansions in EPS have
resulted in a growth in the DPS. After that, while dividends were kept stable and
eventually increased in 2019, earnings have fluctuated and presented higher volatility:
this is perfectly coherent from a theoretical point of view since dividends follow a much
smoother pattern than do earnings. For these “irregularities”, a steadily increasing
dividend policy might also be considered as appropriate since dividends per share have
increased in a steadily way, despite the fluctuations of earnings:
Figure 35 – Steadily increasing dividend policy of Asics: a graphical representation
For all details regarding annual and interim dividends per share from 2010 to 2019, look
at Table 36 in Appendix C.
As we mentioned at the beginning, Asics’s remuneration policy from 2017 to 2020 entails
achieving a total return ratio of 50% but, until the FY 2017, the company’s dividend policy
involved a target payout of 20% with respect to net income. As we can see from the graph
below, the firm was able to achieve this last target payout mostly. The exception in 2015,
year in which the payout was 43,57% was mainly due to a drop in the net income
produced by a doubling in income expenses with respect to the previous year (driven
primarily by exchange loss and business restructuring expenses):
¥10,00¥12,00 ¥12,00
¥17,00
¥23,50 ¥23,50 ¥23,50 ¥23,50 ¥24,00
¥30,00
¥0,00
¥5,00
¥10,00
¥15,00
¥20,00
¥25,00
¥30,00
¥35,00
2010 2011 2012 2013 2014 2015 2016 2017 2018 2019
DP
S
Years
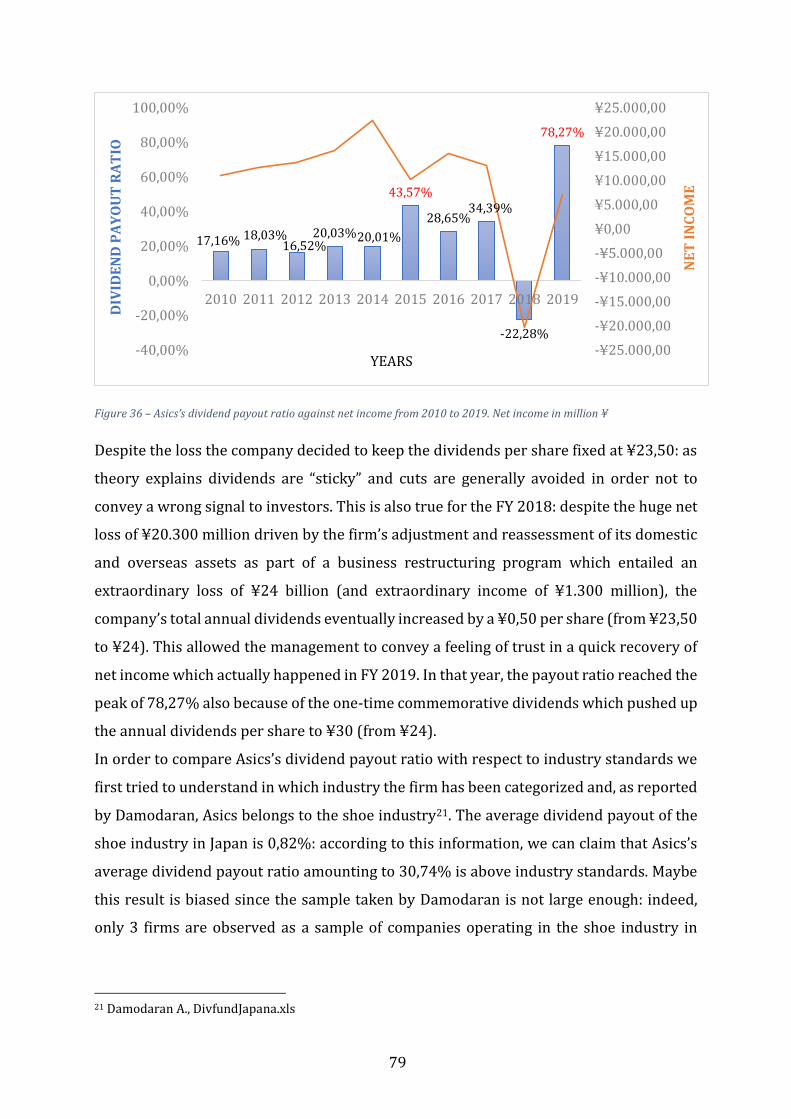
79
Figure 36 – Asics’s dividend payout ratio against net income from 2010 to 2019. Net income in million ¥
Despite the loss the company decided to keep the dividends per share fixed at ¥23,50: as
theory explains dividends are “sticky” and cuts are generally avoided in order not to
convey a wrong signal to investors. This is also true for the FY 2018: despite the huge net
loss of ¥20.300 million driven by the firm’s adjustment and reassessment of its domestic
and overseas assets as part of a business restructuring program which entailed an
extraordinary loss of ¥24 billion (and extraordinary income of ¥1.300 million), the
company’s total annual dividends eventually increased by a ¥0,50 per share (from ¥23,50
to ¥24). This allowed the management to convey a feeling of trust in a quick recovery of
net income which actually happened in FY 2019. In that year, the payout ratio reached the
peak of 78,27% also because of the one-time commemorative dividends which pushed up
the annual dividends per share to ¥30 (from ¥24).
In order to compare Asics’s dividend payout ratio with respect to industry standards we
first tried to understand in which industry the firm has been categorized and, as reported
by Damodaran, Asics belongs to the shoe industry21. The average dividend payout of the
shoe industry in Japan is 0,82%: according to this information, we can claim that Asics’s
average dividend payout ratio amounting to 30,74% is above industry standards. Maybe
this result is biased since the sample taken by Damodaran is not large enough: indeed,
only 3 firms are observed as a sample of companies operating in the shoe industry in
21 Damodaran A., DivfundJapana.xls
17,16% 18,03%16,52%
20,03%20,01%
43,57%
28,65%34,39%
-22,28%
78,27%
-¥25.000,00
-¥20.000,00
-¥15.000,00
-¥10.000,00
-¥5.000,00
¥0,00
¥5.000,00
¥10.000,00
¥15.000,00
¥20.000,00
¥25.000,00
-40,00%
-20,00%
0,00%
20,00%
40,00%
60,00%
80,00%
100,00%
2010 2011 2012 2013 2014 2015 2016 2017 2018 2019
NE
T I
NC
OM
E
DIV
IDE
ND
PA
YO
UT
RA
TIO
YEARS

80
Japan. If we compare the results in the same industry but in US (like Nike) and in Europe,
Asics’s payout is respectively above and below the standards:
Figure 37 – Dividend payout ratios of Asics and a comparison with industry standards
Moving the focus of attention to the dividend yield (the indicator which relates the annual
dividends per share with the price per share), we can notice that from 2010 to 2019 it has
fluctuated between a minimum of 0,76% to a maximum of 1,71% and the average for the
ten-years period amounted to 1,12%:
Figure 38 – Dividend yield of Asics: a graphical representation
52,51%
26,78%
0,82%
30,74%
Shoe industry dividend payout ratio (Europe)
Shoe industry dividend payout ratio (US)
Shoe industry dividend payout ratio (Japan)
Average dividend payout ratio (in absolutevalues) 2019-2010
0,90%
1,28%
0,76%0,84% 0,81%
0,93%1,01%
1,31%
1,71% 1,65%
0,00%
0,20%
0,40%
0,60%
0,80%
1,00%
1,20%
1,40%
1,60%
1,80%
2010 2011 2012 2013 2014 2015 2016 2017 2018 2019
Div
ide
nd
yie
ld
Years
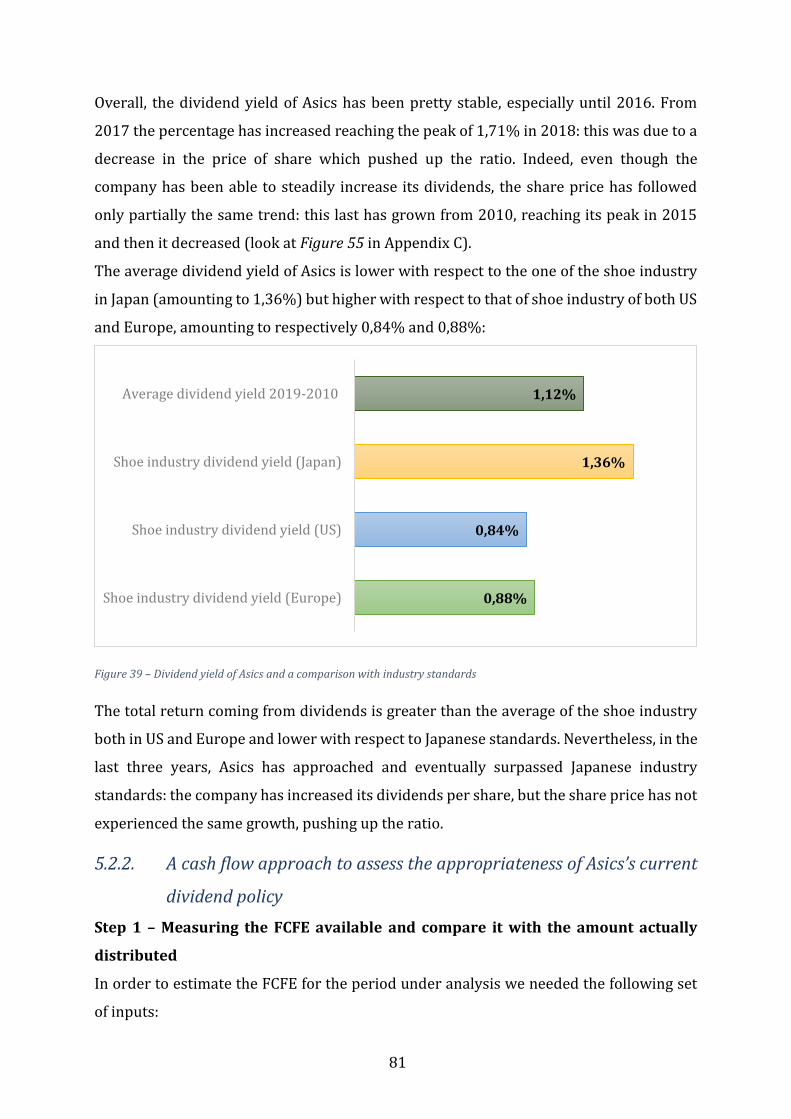
81
Overall, the dividend yield of Asics has been pretty stable, especially until 2016. From
2017 the percentage has increased reaching the peak of 1,71% in 2018: this was due to a
decrease in the price of share which pushed up the ratio. Indeed, even though the
company has been able to steadily increase its dividends, the share price has followed
only partially the same trend: this last has grown from 2010, reaching its peak in 2015
and then it decreased (look at Figure 55 in Appendix C).
The average dividend yield of Asics is lower with respect to the one of the shoe industry
in Japan (amounting to 1,36%) but higher with respect to that of shoe industry of both US
and Europe, amounting to respectively 0,84% and 0,88%:
Figure 39 – Dividend yield of Asics and a comparison with industry standards
The total return coming from dividends is greater than the average of the shoe industry
both in US and Europe and lower with respect to Japanese standards. Nevertheless, in the
last three years, Asics has approached and eventually surpassed Japanese industry
standards: the company has increased its dividends per share, but the share price has not
experienced the same growth, pushing up the ratio.
5.2.2. A cash flow approach to assess the appropriateness of Asics’s current
dividend policy
Step 1 – Measuring the FCFE available and compare it with the amount actually
distributed
In order to estimate the FCFE for the period under analysis we needed the following set
of inputs:
0,88%
0,84%
1,36%
1,12%
Shoe industry dividend yield (Europe)
Shoe industry dividend yield (US)
Shoe industry dividend yield (Japan)
Average dividend yield 2019-2010
82
- Net income: as reported in the consolidated financial summary of the company.
- Depreciation and amortization: this data was gathered from Orbis platform under
the voice “Depreciation, amortization and depletion” and double-checked by
looking at the cash flow statements in the company’s annual reports.
- Capex22: we obtained this element from Ycharts platform: since it was displayed
in $, but our analysis is computed in yen, we multiplied that figure by the average
exchange rate usd/jpy of each year under analysis, as reported in company’s
consolidated financial summary (for details look at Table 37 in Appendix C).
Results were double-checked in Marketwatch platform and they turned out to be
coherent.
- Changes in net working capital: we acquired this information from Ycharts
platform but, like for capex, we multiplied it by the average exchange rate usd/jpy
(for details look at Table 38 in Appendix C). By double-checking in Marketwatch
platform, we confirmed the results.
- Net debt issued: this element was calculated by summing up the change in short-
term borrowings with the change in long-term borrowings as reported in Orbis
platform (details in Table 39 in Appendix C). By checking Marketwatch platform
and Reuters, we found out that results were consistent.
For the complete set of inputs that allowed us to estimate the FCFE as well as the results
obtained (described hereafter), look respectively at Table 40 and Table 41 in the Appendix
C.
For 3 over the 10 years under analysis (2018, 2013 and 2010), the company has
registered a negative FCFE before net debt cashflows (the aggregate amounts to ¥62.755
million). If we count also the net change in the level of debt, the FCFE is positive in all
years but one and in aggregate terms it amounts to ¥92.631million: this means that in the
ten-years period, the company has issued new debt for ¥29.876. The anomaly in 2018,
year in which the Company has registered a negative FCFEAfterNetDebt amounting to
–¥22.286 million was due to the net loss of ¥20.300 million driven by the firm’s
adjustment and reassessment of its domestic and overseas assets as part of a business
22 For the other companies under investigation, we gathered this figure from their annual reports, but Asics
did not provide any information regarding this data
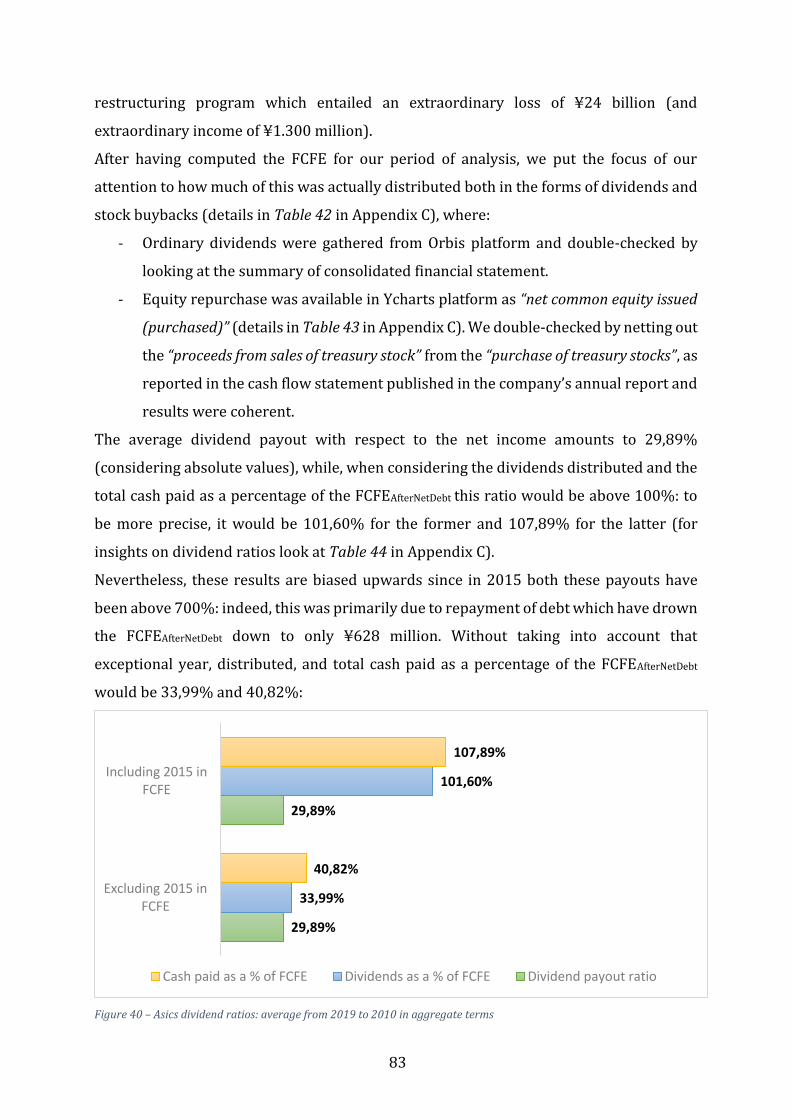
83
restructuring program which entailed an extraordinary loss of ¥24 billion (and
extraordinary income of ¥1.300 million).
After having computed the FCFE for our period of analysis, we put the focus of our
attention to how much of this was actually distributed both in the forms of dividends and
stock buybacks (details in Table 42 in Appendix C), where:
- Ordinary dividends were gathered from Orbis platform and double-checked by
looking at the summary of consolidated financial statement.
- Equity repurchase was available in Ycharts platform as “net common equity issued
(purchased)” (details in Table 43 in Appendix C). We double-checked by netting out
the “proceeds from sales of treasury stock” from the “purchase of treasury stocks”, as
reported in the cash flow statement published in the company’s annual report and
results were coherent.
The average dividend payout with respect to the net income amounts to 29,89%
(considering absolute values), while, when considering the dividends distributed and the
total cash paid as a percentage of the FCFEAfterNetDebt this ratio would be above 100%: to
be more precise, it would be 101,60% for the former and 107,89% for the latter (for
insights on dividend ratios look at Table 44 in Appendix C).
Nevertheless, these results are biased upwards since in 2015 both these payouts have
been above 700%: indeed, this was primarily due to repayment of debt which have drown
the FCFEAfterNetDebt down to only ¥628 million. Without taking into account that
exceptional year, distributed, and total cash paid as a percentage of the FCFEAfterNetDebt
would be 33,99% and 40,82%:
Figure 40 – Asics dividend ratios: average from 2019 to 2010 in aggregate terms
29,89%
29,89%
33,99%
101,60%
40,82%
107,89%
Excluding 2015 inFCFE
Including 2015 inFCFE
Cash paid as a % of FCFE Dividends as a % of FCFE Dividend payout ratio
84
We can observe that both dividends distributed and total cash paid out as a ratio of the
FCFE are far below 100%, meaning that over the years the company has distributed less
cash than the FCFE, having a conservative approach. The gap between the two ratios is
not large, mainly because the company has executed little repurchase of treasury stocks.
It is only in the last two years that Asics has expanded its stock repurchases “to improve
capital efficiency and implement flexible capital policies in accordance with the business”:
from February 15th, 2018 to March 31st, 2018 the company bought back 1.127.300 shares
of common stock at an aggregate purchase price of approximately ¥2.000 million. In 2019,
based on the authorization granted on August 2nd, 2019 at the Board of Directors’ meeting,
the company bought back 6.238.000 shares of common stock for an aggregate purchase
price of approximately ¥10.000 million.
Step 2 – Assessing Project quality
In order to assess the quality of the projects in which Asics is investing we first used some
accounting figures by taking the difference between the return on equity with the cost of
equity.
The ROE was obtained by calculating the ratio between the net income (as reported in the
company’s annual report) and the book value of equity at the start of each year, as
reported in Orbis platform and double-checked in the company’s annual report.
The cost of equity (the required rate of return) was computed by using the CAPM, where:
- For the risk-free rate we have used the 3-months T-bill (source: Damodaran).
- Beta for equity is 0,11 (source: Ycharts).
- For the return on market we have used the NIKKEI-225 annual return, assuming
dividends were reinvested23.
In 9 over the ten years under analysis, the company has exhibited a positive accounting
differential (only in 2018 the company’s ROE was negative since net income was
negative). To be more precise the average ROE has exceeded the cost of equity by 5,72%:
this means that the company is well managed. This is confirmed also by looking at how
the stock performed against the market, investigating the difference between the annual
return on stock with the required rate of return, where:
23 https://dqydj.com/nikkei-return-calculator-dividend-reinvestment/
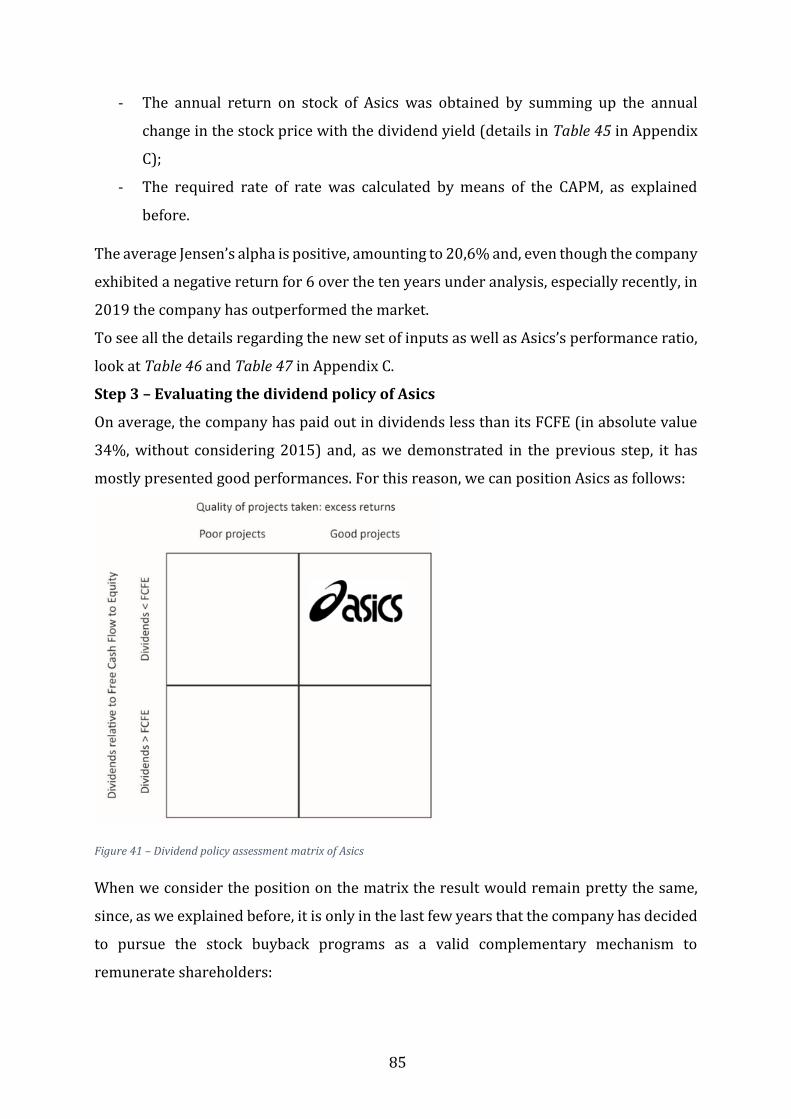
85
- The annual return on stock of Asics was obtained by summing up the annual
change in the stock price with the dividend yield (details in Table 45 in Appendix
C);
- The required rate of rate was calculated by means of the CAPM, as explained
before.
The average Jensen’s alpha is positive, amounting to 20,6% and, even though the company
exhibited a negative return for 6 over the ten years under analysis, especially recently, in
2019 the company has outperformed the market.
To see all the details regarding the new set of inputs as well as Asics’s performance ratio,
look at Table 46 and Table 47 in Appendix C.
Step 3 – Evaluating the dividend policy of Asics
On average, the company has paid out in dividends less than its FCFE (in absolute value
34%, without considering 2015) and, as we demonstrated in the previous step, it has
mostly presented good performances. For this reason, we can position Asics as follows:
Figure 41 – Dividend policy assessment matrix of Asics
When we consider the position on the matrix the result would remain pretty the same,
since, as we explained before, it is only in the last few years that the company has decided
to pursue the stock buyback programs as a valid complementary mechanism to
remunerate shareholders:
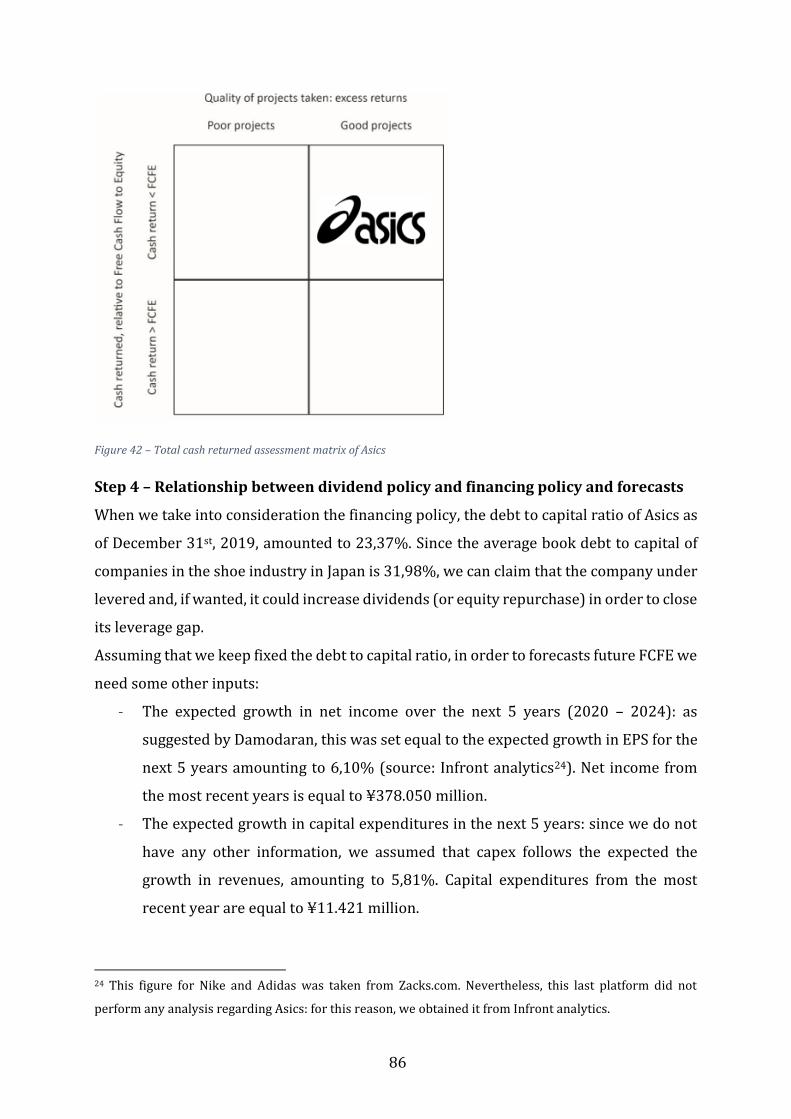
86
Figure 42 – Total cash returned assessment matrix of Asics
Step 4 – Relationship between dividend policy and financing policy and forecasts
When we take into consideration the financing policy, the debt to capital ratio of Asics as
of December 31st, 2019, amounted to 23,37%. Since the average book debt to capital of
companies in the shoe industry in Japan is 31,98%, we can claim that the company under
levered and, if wanted, it could increase dividends (or equity repurchase) in order to close
its leverage gap.
Assuming that we keep fixed the debt to capital ratio, in order to forecasts future FCFE we
need some other inputs:
- The expected growth in net income over the next 5 years (2020 – 2024): as
suggested by Damodaran, this was set equal to the expected growth in EPS for the
next 5 years amounting to 6,10% (source: Infront analytics24). Net income from
the most recent years is equal to ¥378.050 million.
- The expected growth in capital expenditures in the next 5 years: since we do not
have any other information, we assumed that capex follows the expected the
growth in revenues, amounting to 5,81%. Capital expenditures from the most
recent year are equal to ¥11.421 million.
24 This figure for Nike and Adidas was taken from Zacks.com. Nevertheless, this last platform did not
perform any analysis regarding Asics: for this reason, we obtained it from Infront analytics.
87
- The expected growth in depreciation in the next 5 years: this is 5,81%, as it was
set equal to the expected growth in capex. Depreciation and amortization in the
most recent year amounts to ¥12.920 million.
- The change in the net working capital as a percentage of revenues from the most
recent year amounts to 0,31%, where:
o The expected growth in revenues over the next 5 years was computed by
taking the historical growth in sales over the last ten years, amounting to
5,81% (details in Table 48 in Appendix C). Revenues from the most recent
year are equal to ¥378.050 million.
In addition, since the best fitting dividend policy associated with Asics is a constant payout
(fixed percentage) dividend strategy (despite the irregularities about which we have
previously talked), we assumed that the growth in dividends follows the expected growth
in the earnings per share, equal to 6,10%. Dividends paid in the most recent year are equal
to ¥5.555 million.
Given the estimates and the assumptions, the company will end up always with more cash
available to be distributed to stockholders. In aggregate terms for the next 5 years, the
company will accumulate ¥42.532 million and distribute ¥33.291 million: as a result, the
firm’s payout ratio would be very high amounting to 78,27%. When we relate instead the
dividends paid as a percentage of FCFE, the ratio would go down to 67,85%: in aggregate
terms the company will pay out ¥33.291 million out of ¥49.065.
Even though both these ratios payout are high, the company could finance the return
policy by means of debt: indeed, as we previously pointed out, the company is under
levered and a possibility to close its leverage gap is by financing dividends (or stock
buybacks) through issuing new debt. For all the details regarding forecasts, look at Table
49 in Appendix C.
5.2.3. Alternative
Evidences regarding Asics’s dividend policy are contradictory: despite a slowly increase
in DPS, both the share price and EPS have been volatile since 2014, being also negative in
2018 (look at respectively Figure 55 and Figure 56 in Appendix C). In the hope that the
new strategic plan put in place by the company will stem these fluctuations, we would like
to present an alternative scenario to the current dividend policy.
88
As we mentioned at the beginning of our analysis, the company’s DPS has been stable in
some years while in other they have increased. For this reason, we imagined that the
dividend per share would be constant at 30 throughout 2020, 2021 and increase in by 2
in 2022:
Years 2019 2020 2021 2022 2023 2024
Dividends per share ¥30 ¥30 ¥30 ¥32 ¥32 ¥32
Growth rate 0% 0% 6,67% 0% 0%
Table 10 – Increase in the annual DPS of Asics under the new proposal
Since the net income is slowly recovering from the net loss of the FY 2018, we believe it’s
wise to be prudential and to keep constant the dividend per share and be cautious to
increase it.
These changes would not alter the FCFE but the expected dividends and consequently the
cash available to repurchase equity as well as the payout ratios would be affected:
2020 2021 2022 2023 2024 Aggregate
FCFE ¥8.693 ¥9.220 ¥9.779 ¥10.371 ¥11.000 ¥49.063
Expected Dividends ¥5.555 ¥5.555 ¥5.555 ¥5.925 ¥5.925 ¥28.516
Cash available for stock buybacks ¥3.138 ¥3.665 ¥4.224 ¥4.446 ¥5.075 ¥20.547
Average
Dividend Payout Ratio 73,77% 69,53% 65,53% 65,88% 62,10% 67,36%
Dividends as % of FCFE 63,90% 60,25% 56,81% 57,13% 53,87% 58,39%
Table 11 – Forecasts of Asics under the new alternative, in million ¥
The dividend payout would progressively decrease and maybe in the long-run the
company will target its payout ratio to 30%, allowing the company to retain enough
capital to finance further expansions and new projects.

89
Conclusions
Having analyzed the dividend policy of the three companies, it is now time to put together
what we have learned so far, in order to extrapolate the final results of this study.
Nike pays its dividends quarterly and it employs a steadily increasing dividend payout
strategy, in which the dividends per share established in November by the Board of
Directors are kept until the subsequent November, when the new dividends per share are
set. The result is that the company holds constant its dividends per share in April, June
and October, while in January it increases them.
Adidas pays its dividends on a yearly basis and it employs a constant payout (fixed
percentage) dividend strategy which implicates the payment of a specific percentage of
company’s annual earnings. To be more precise, Adidas’s dividend policy involves the
setting of a target range to be achieved: between 20% and 40% until 2014 and after that
it shifted upwards by a 10%, meaning between 30% and 50% (at first with respect to the
net income attributable to shareholders and then with respect to the net income from
continuing operations).
Asics has paid annual dividends per share until the FY 2017 while after that it has
switched to a semi-annual payment. As saw in chapter 5, it was hard to associate one
single best policy with the Asics’s dividend payout strategy, but we reached the conclusion
that the one that suits better is the constant payout (or fixed percentage) dividend
policy (especially until 2014), but also a steadily increasing dividend policy may apply.
Indeed, on one hand, the company’s basic policy (until the FY 2017) was to allocate
approximately 20% of the consolidated net income as dividends (from this the constant
payout strategy); on the other hand, the dividends per share have been kept stable for
some years and then they increased, while earnings per share have presented higher
volatility (from this a steadily increasing payout strategy).
Hence, from all this, we are able to catch a first dissimilarity between the three firms:
despite they operate in the same industry, the types of dividend policy strategies
employed are different. Nevertheless, Asics could be considered as a bridge since it
employs a mix between Nike’s strategy (steadily increasing dividend policy) and Adidas’s
strategy (constant payout (fixed percentage) dividend policy). In addition, it is interesting
to remark the payout dynamics of Nike. Even though it employs a steadily increasing
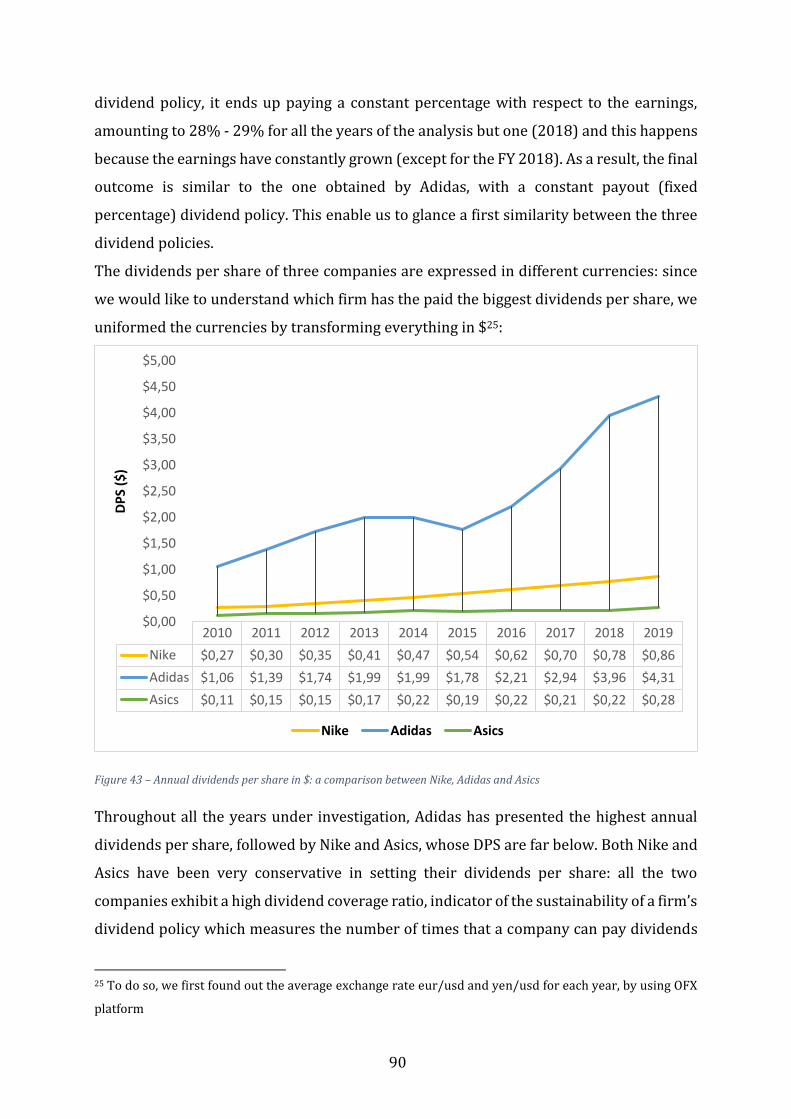
90
dividend policy, it ends up paying a constant percentage with respect to the earnings,
amounting to 28% - 29% for all the years of the analysis but one (2018) and this happens
because the earnings have constantly grown (except for the FY 2018). As a result, the final
outcome is similar to the one obtained by Adidas, with a constant payout (fixed
percentage) dividend policy. This enable us to glance a first similarity between the three
dividend policies.
The dividends per share of three companies are expressed in different currencies: since
we would like to understand which firm has the paid the biggest dividends per share, we
uniformed the currencies by transforming everything in $25:
Figure 43 – Annual dividends per share in $: a comparison between Nike, Adidas and Asics
Throughout all the years under investigation, Adidas has presented the highest annual
dividends per share, followed by Nike and Asics, whose DPS are far below. Both Nike and
Asics have been very conservative in setting their dividends per share: all the two
companies exhibit a high dividend coverage ratio, indicator of the sustainability of a firm’s
dividend policy which measures the number of times that a company can pay dividends
25 To do so, we first found out the average exchange rate eur/usd and yen/usd for each year, by using OFX
platform
2010 2011 2012 2013 2014 2015 2016 2017 2018 2019
Nike $0,27 $0,30 $0,35 $0,41 $0,47 $0,54 $0,62 $0,70 $0,78 $0,86
Adidas $1,06 $1,39 $1,74 $1,99 $1,99 $1,78 $2,21 $2,94 $3,96 $4,31
Asics $0,11 $0,15 $0,15 $0,17 $0,22 $0,19 $0,22 $0,21 $0,22 $0,28
$0,00
$0,50
$1,00
$1,50
$2,00
$2,50
$3,00
$3,50
$4,00
$4,50
$5,00
DP
S ($
)
Nike Adidas Asics
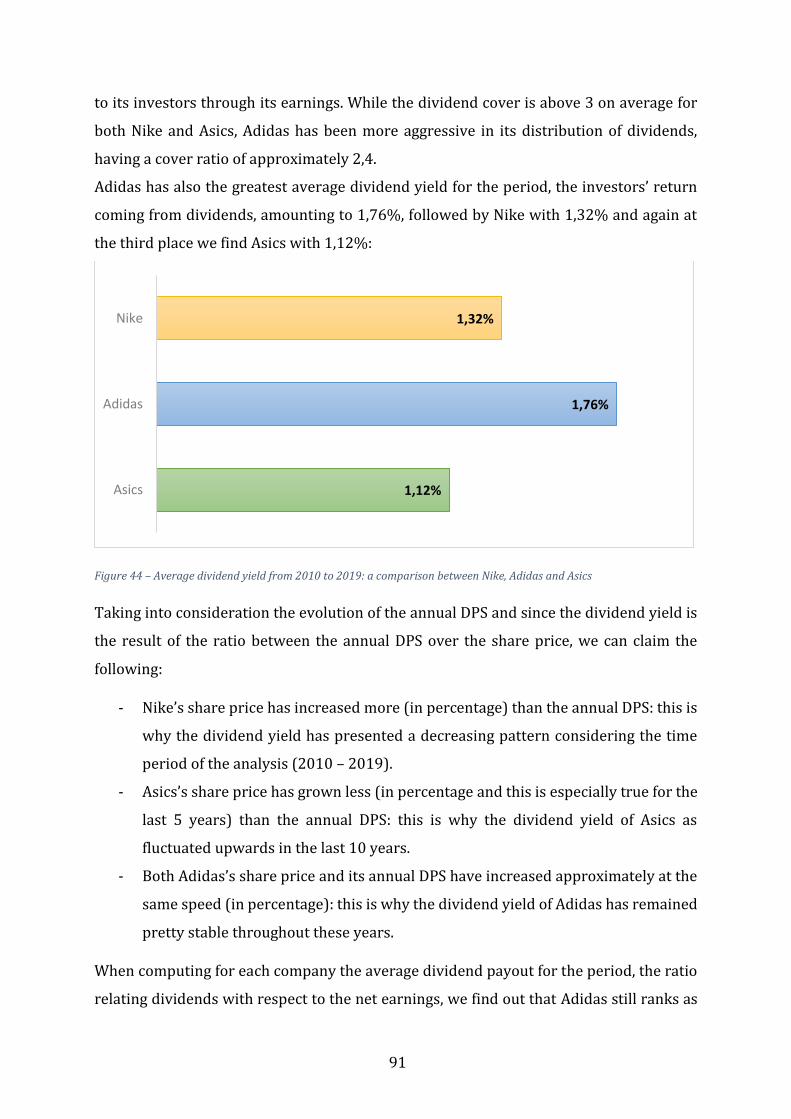
91
to its investors through its earnings. While the dividend cover is above 3 on average for
both Nike and Asics, Adidas has been more aggressive in its distribution of dividends,
having a cover ratio of approximately 2,4.
Adidas has also the greatest average dividend yield for the period, the investors’ return
coming from dividends, amounting to 1,76%, followed by Nike with 1,32% and again at
the third place we find Asics with 1,12%:
Figure 44 – Average dividend yield from 2010 to 2019: a comparison between Nike, Adidas and Asics
Taking into consideration the evolution of the annual DPS and since the dividend yield is
the result of the ratio between the annual DPS over the share price, we can claim the
following:
- Nike’s share price has increased more (in percentage) than the annual DPS: this is
why the dividend yield has presented a decreasing pattern considering the time
period of the analysis (2010 – 2019).
- Asics’s share price has grown less (in percentage and this is especially true for the
last 5 years) than the annual DPS: this is why the dividend yield of Asics as
fluctuated upwards in the last 10 years.
- Both Adidas’s share price and its annual DPS have increased approximately at the
same speed (in percentage): this is why the dividend yield of Adidas has remained
pretty stable throughout these years.
When computing for each company the average dividend payout for the period, the ratio
relating dividends with respect to the net earnings, we find out that Adidas still ranks as
1,12%
1,76%
1,32%
Asics
Adidas
Nike
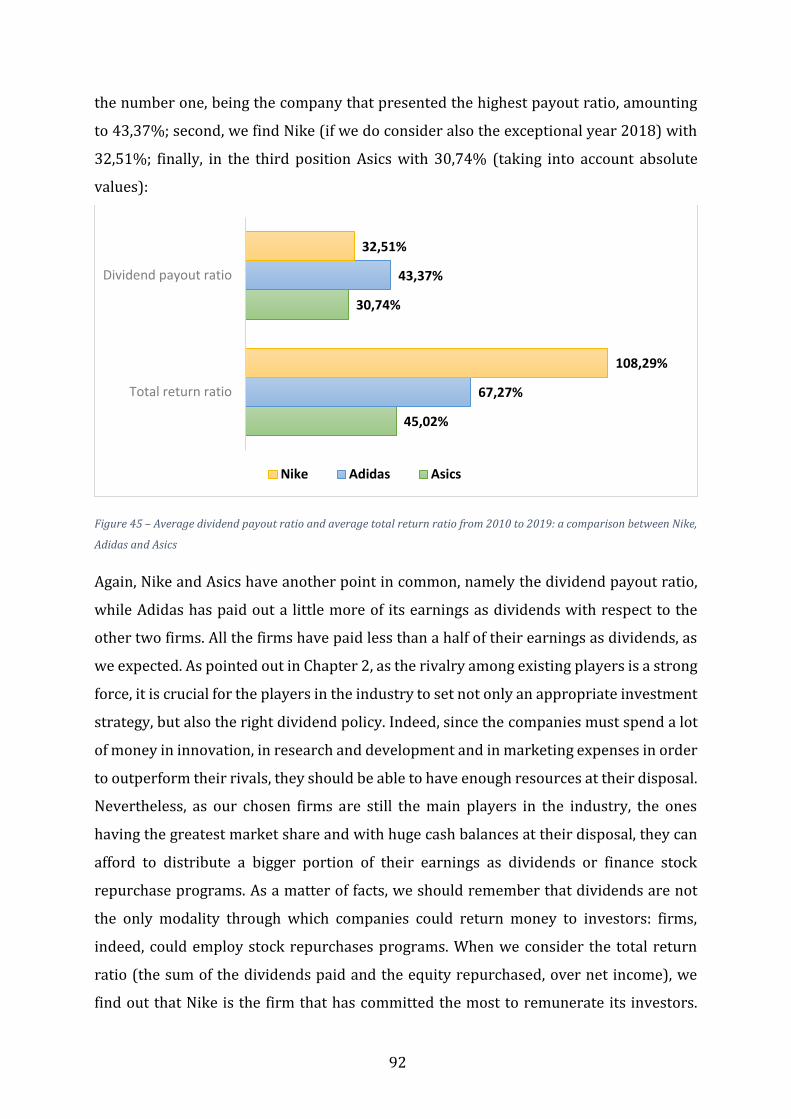
92
the number one, being the company that presented the highest payout ratio, amounting
to 43,37%; second, we find Nike (if we do consider also the exceptional year 2018) with
32,51%; finally, in the third position Asics with 30,74% (taking into account absolute
values):
Figure 45 – Average dividend payout ratio and average total return ratio from 2010 to 2019: a comparison between Nike,
Adidas and Asics
Again, Nike and Asics have another point in common, namely the dividend payout ratio,
while Adidas has paid out a little more of its earnings as dividends with respect to the
other two firms. All the firms have paid less than a half of their earnings as dividends, as
we expected. As pointed out in Chapter 2, as the rivalry among existing players is a strong
force, it is crucial for the players in the industry to set not only an appropriate investment
strategy, but also the right dividend policy. Indeed, since the companies must spend a lot
of money in innovation, in research and development and in marketing expenses in order
to outperform their rivals, they should be able to have enough resources at their disposal.
Nevertheless, as our chosen firms are still the main players in the industry, the ones
having the greatest market share and with huge cash balances at their disposal, they can
afford to distribute a bigger portion of their earnings as dividends or finance stock
repurchase programs. As a matter of facts, we should remember that dividends are not
the only modality through which companies could return money to investors: firms,
indeed, could employ stock repurchases programs. When we consider the total return
ratio (the sum of the dividends paid and the equity repurchased, over net income), we
find out that Nike is the firm that has committed the most to remunerate its investors.
45,02%
30,74%
67,27%
43,37%
108,29%
32,51%
Total return ratio
Dividend payout ratio
Nike Adidas Asics
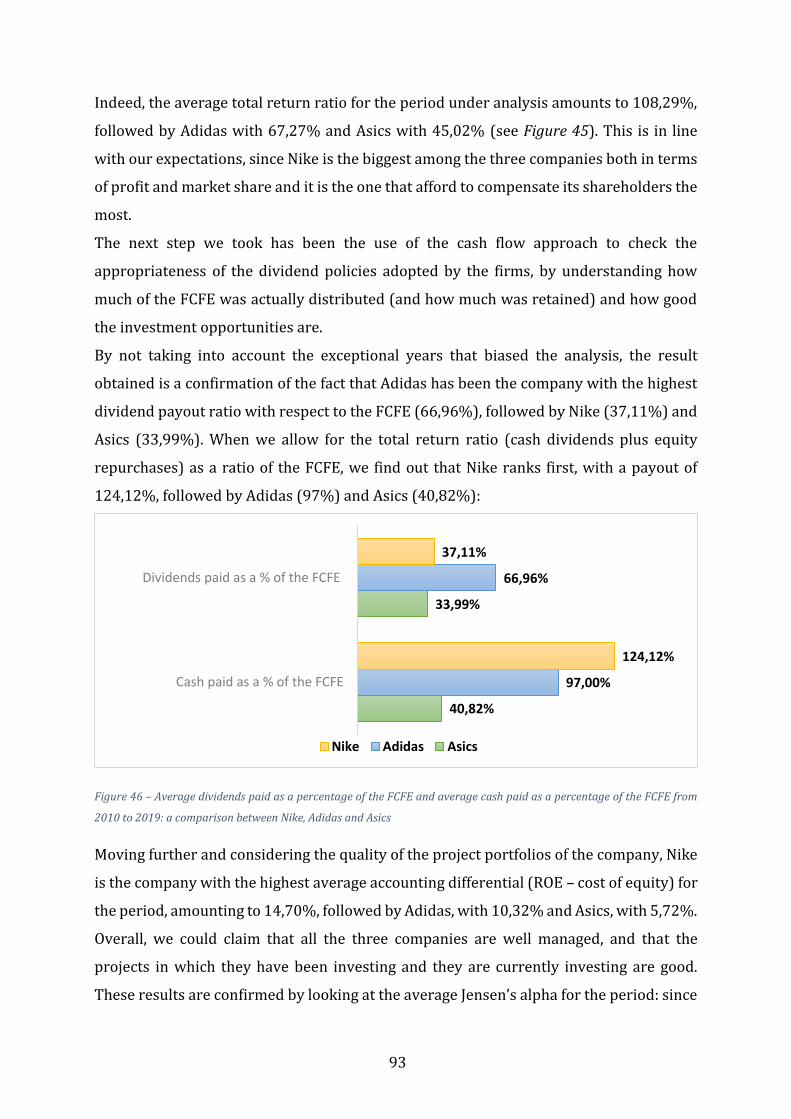
93
Indeed, the average total return ratio for the period under analysis amounts to 108,29%,
followed by Adidas with 67,27% and Asics with 45,02% (see Figure 45). This is in line
with our expectations, since Nike is the biggest among the three companies both in terms
of profit and market share and it is the one that afford to compensate its shareholders the
most.
The next step we took has been the use of the cash flow approach to check the
appropriateness of the dividend policies adopted by the firms, by understanding how
much of the FCFE was actually distributed (and how much was retained) and how good
the investment opportunities are.
By not taking into account the exceptional years that biased the analysis, the result
obtained is a confirmation of the fact that Adidas has been the company with the highest
dividend payout ratio with respect to the FCFE (66,96%), followed by Nike (37,11%) and
Asics (33,99%). When we allow for the total return ratio (cash dividends plus equity
repurchases) as a ratio of the FCFE, we find out that Nike ranks first, with a payout of
124,12%, followed by Adidas (97%) and Asics (40,82%):
Figure 46 – Average dividends paid as a percentage of the FCFE and average cash paid as a percentage of the FCFE from
2010 to 2019: a comparison between Nike, Adidas and Asics
Moving further and considering the quality of the project portfolios of the company, Nike
is the company with the highest average accounting differential (ROE – cost of equity) for
the period, amounting to 14,70%, followed by Adidas, with 10,32% and Asics, with 5,72%.
Overall, we could claim that all the three companies are well managed, and that the
projects in which they have been investing and they are currently investing are good.
These results are confirmed by looking at the average Jensen’s alpha for the period: since
40,82%
33,99%
97,00%
66,96%
124,12%
37,11%
Cash paid as a % of the FCFE
Dividends paid as a % of the FCFE
Nike Adidas Asics
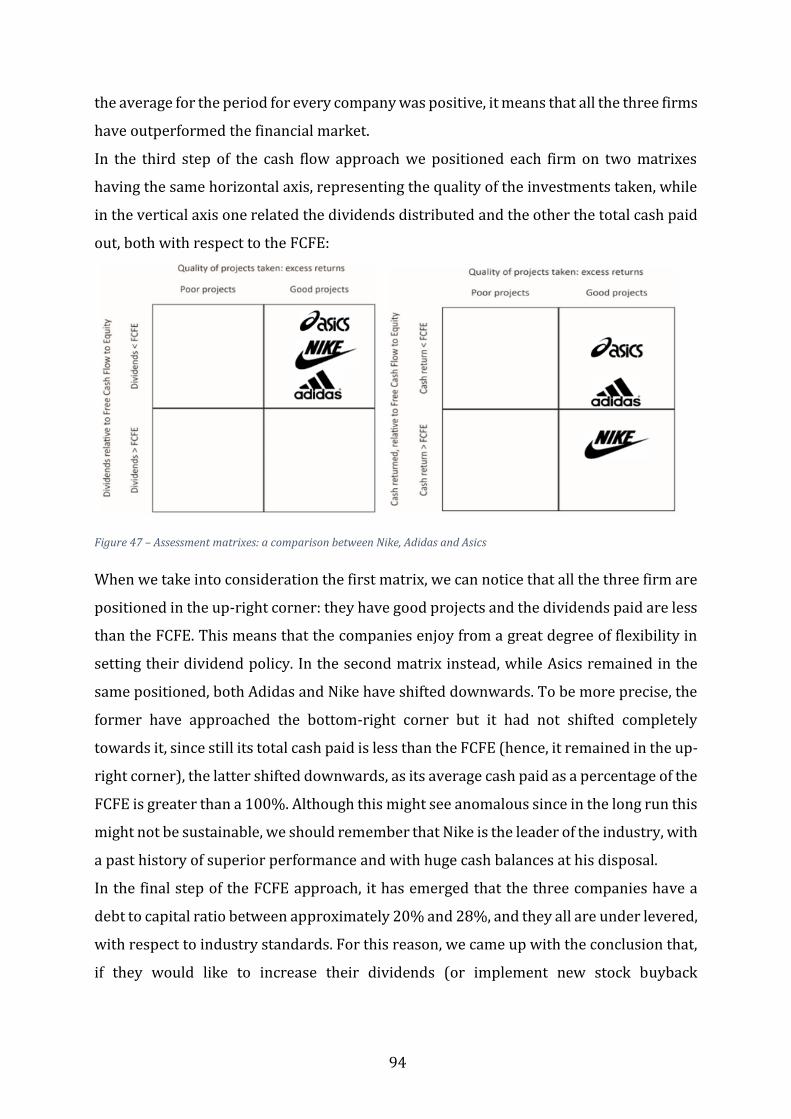
94
the average for the period for every company was positive, it means that all the three firms
have outperformed the financial market.
In the third step of the cash flow approach we positioned each firm on two matrixes
having the same horizontal axis, representing the quality of the investments taken, while
in the vertical axis one related the dividends distributed and the other the total cash paid
out, both with respect to the FCFE:
Figure 47 – Assessment matrixes: a comparison between Nike, Adidas and Asics
When we take into consideration the first matrix, we can notice that all the three firm are
positioned in the up-right corner: they have good projects and the dividends paid are less
than the FCFE. This means that the companies enjoy from a great degree of flexibility in
setting their dividend policy. In the second matrix instead, while Asics remained in the
same positioned, both Adidas and Nike have shifted downwards. To be more precise, the
former have approached the bottom-right corner but it had not shifted completely
towards it, since still its total cash paid is less than the FCFE (hence, it remained in the up-
right corner), the latter shifted downwards, as its average cash paid as a percentage of the
FCFE is greater than a 100%. Although this might see anomalous since in the long run this
might not be sustainable, we should remember that Nike is the leader of the industry, with
a past history of superior performance and with huge cash balances at his disposal.
In the final step of the FCFE approach, it has emerged that the three companies have a
debt to capital ratio between approximately 20% and 28%, and they all are under levered,
with respect to industry standards. For this reason, we came up with the conclusion that,
if they would like to increase their dividends (or implement new stock buyback
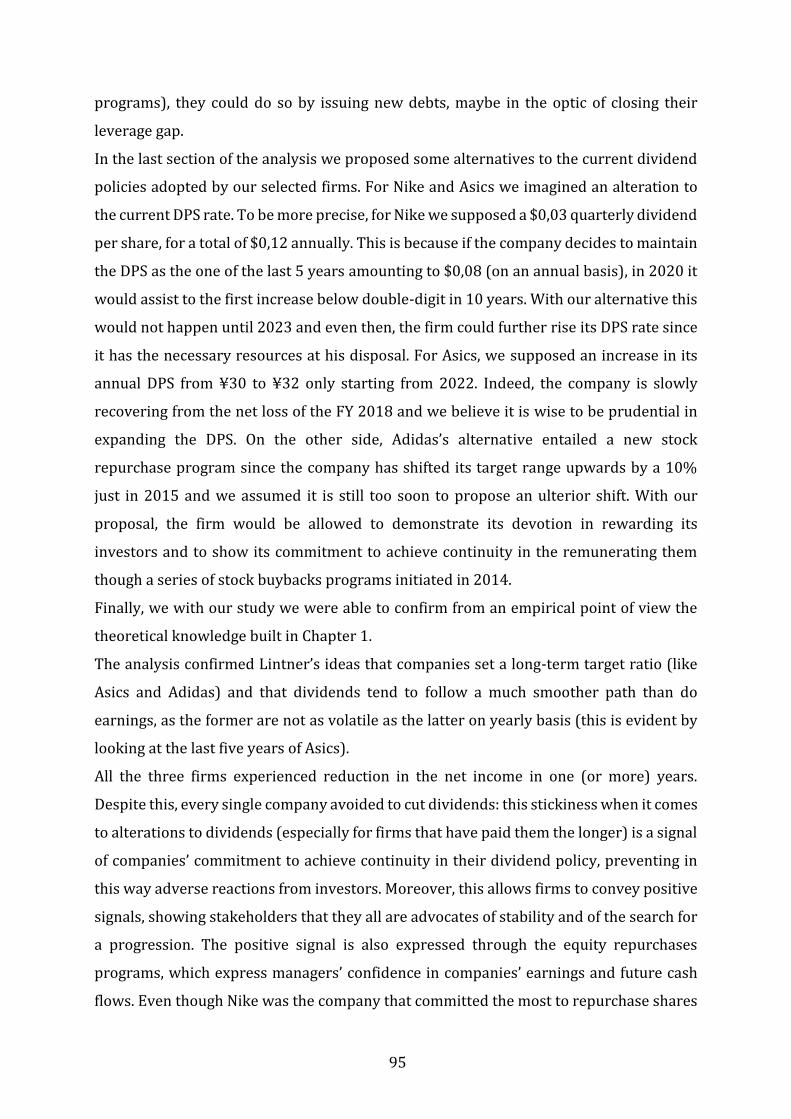
95
programs), they could do so by issuing new debts, maybe in the optic of closing their
leverage gap.
In the last section of the analysis we proposed some alternatives to the current dividend
policies adopted by our selected firms. For Nike and Asics we imagined an alteration to
the current DPS rate. To be more precise, for Nike we supposed a $0,03 quarterly dividend
per share, for a total of $0,12 annually. This is because if the company decides to maintain
the DPS as the one of the last 5 years amounting to $0,08 (on an annual basis), in 2020 it
would assist to the first increase below double-digit in 10 years. With our alternative this
would not happen until 2023 and even then, the firm could further rise its DPS rate since
it has the necessary resources at his disposal. For Asics, we supposed an increase in its
annual DPS from ¥30 to ¥32 only starting from 2022. Indeed, the company is slowly
recovering from the net loss of the FY 2018 and we believe it is wise to be prudential in
expanding the DPS. On the other side, Adidas’s alternative entailed a new stock
repurchase program since the company has shifted its target range upwards by a 10%
just in 2015 and we assumed it is still too soon to propose an ulterior shift. With our
proposal, the firm would be allowed to demonstrate its devotion in rewarding its
investors and to show its commitment to achieve continuity in the remunerating them
though a series of stock buybacks programs initiated in 2014.
Finally, we with our study we were able to confirm from an empirical point of view the
theoretical knowledge built in Chapter 1.
The analysis confirmed Lintner’s ideas that companies set a long-term target ratio (like
Asics and Adidas) and that dividends tend to follow a much smoother path than do
earnings, as the former are not as volatile as the latter on yearly basis (this is evident by
looking at the last five years of Asics).
All the three firms experienced reduction in the net income in one (or more) years.
Despite this, every single company avoided to cut dividends: this stickiness when it comes
to alterations to dividends (especially for firms that have paid them the longer) is a signal
of companies’ commitment to achieve continuity in their dividend policy, preventing in
this way adverse reactions from investors. Moreover, this allows firms to convey positive
signals, showing stakeholders that they all are advocates of stability and of the search for
a progression. The positive signal is also expressed through the equity repurchases
programs, which express managers’ confidence in companies’ earnings and future cash
flows. Even though Nike was the company that committed the most to repurchase shares
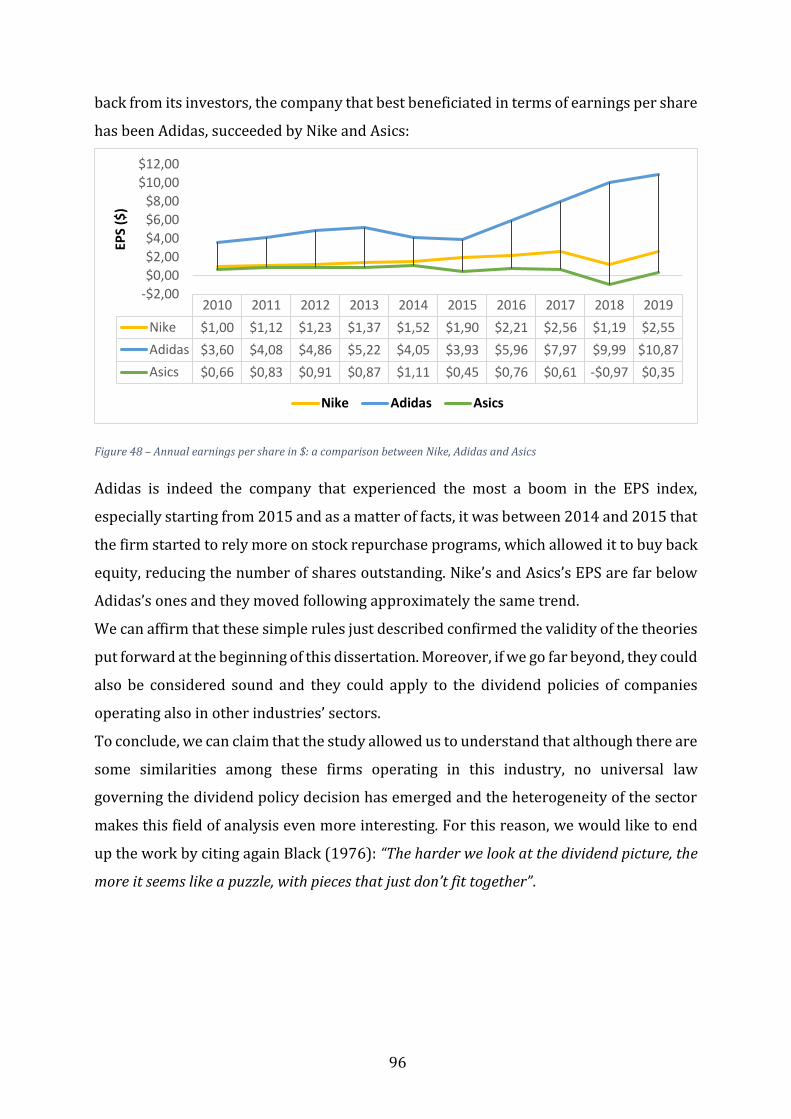
96
back from its investors, the company that best beneficiated in terms of earnings per share
has been Adidas, succeeded by Nike and Asics:
Figure 48 – Annual earnings per share in $: a comparison between Nike, Adidas and Asics
Adidas is indeed the company that experienced the most a boom in the EPS index,
especially starting from 2015 and as a matter of facts, it was between 2014 and 2015 that
the firm started to rely more on stock repurchase programs, which allowed it to buy back
equity, reducing the number of shares outstanding. Nike’s and Asics’s EPS are far below
Adidas’s ones and they moved following approximately the same trend.
We can affirm that these simple rules just described confirmed the validity of the theories
put forward at the beginning of this dissertation. Moreover, if we go far beyond, they could
also be considered sound and they could apply to the dividend policies of companies
operating also in other industries’ sectors.
To conclude, we can claim that the study allowed us to understand that although there are
some similarities among these firms operating in this industry, no universal law
governing the dividend policy decision has emerged and the heterogeneity of the sector
makes this field of analysis even more interesting. For this reason, we would like to end
up the work by citing again Black (1976): “The harder we look at the dividend picture, the
more it seems like a puzzle, with pieces that just don’t fit together”.
2010 2011 2012 2013 2014 2015 2016 2017 2018 2019
Nike $1,00 $1,12 $1,23 $1,37 $1,52 $1,90 $2,21 $2,56 $1,19 $2,55
Adidas $3,60 $4,08 $4,86 $5,22 $4,05 $3,93 $5,96 $7,97 $9,99 $10,87
Asics $0,66 $0,83 $0,91 $0,87 $1,11 $0,45 $0,76 $0,61 -$0,97 $0,35
-$2,00
$0,00
$2,00
$4,00
$6,00
$8,00
$10,00
$12,00
EPS
($)
Nike Adidas Asics

97
Appendix A
Figure 49 – Increase in Nike’s yearly dividend per share from 2010 to 2019: a graphical representation
Figure 50 – Stock Price of Nike from 2010 to nowadays. Source: Macrotrends
$0,27 $0,30
$0,35 $0,41
$0,47 $0,54
$0,62
$0,70
$0,78
$0,86
$0,00
$0,10
$0,20
$0,30
$0,40
$0,50
$0,60
$0,70
$0,80
$0,90
$1,00
2010 2011 2012 2013 2014 2015 2016 2017 2018 2019
DP
S
Years
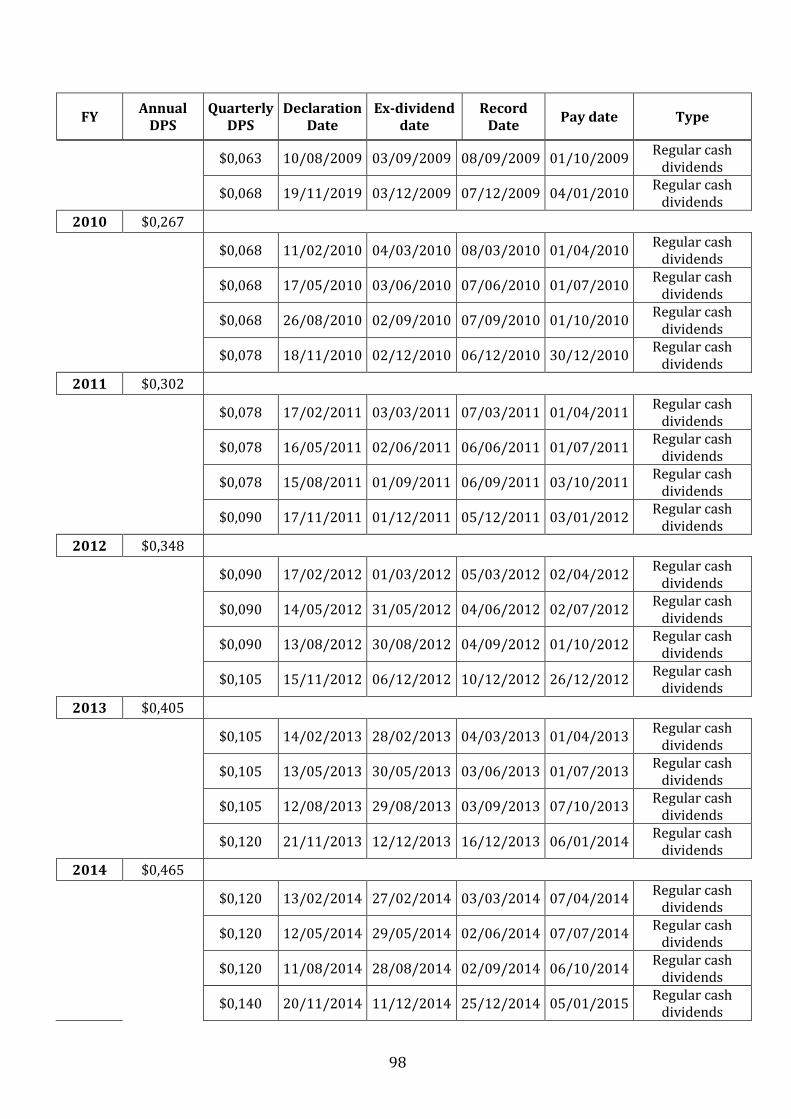
98
FY Annual
DPS Quarterly
DPS Declaration
Date Ex-dividend
date Record
Date Pay date Type
$0,063 10/08/2009 03/09/2009 08/09/2009 01/10/2009 Regular cash
dividends
$0,068 19/11/2019 03/12/2009 07/12/2009 04/01/2010 Regular cash
dividends
2010 $0,267
$0,068 11/02/2010 04/03/2010 08/03/2010 01/04/2010 Regular cash
dividends
$0,068 17/05/2010 03/06/2010 07/06/2010 01/07/2010 Regular cash
dividends
$0,068 26/08/2010 02/09/2010 07/09/2010 01/10/2010 Regular cash
dividends
$0,078 18/11/2010 02/12/2010 06/12/2010 30/12/2010 Regular cash
dividends
2011 $0,302
$0,078 17/02/2011 03/03/2011 07/03/2011 01/04/2011 Regular cash
dividends
$0,078 16/05/2011 02/06/2011 06/06/2011 01/07/2011 Regular cash
dividends
$0,078 15/08/2011 01/09/2011 06/09/2011 03/10/2011 Regular cash
dividends
$0,090 17/11/2011 01/12/2011 05/12/2011 03/01/2012 Regular cash
dividends
2012 $0,348
$0,090 17/02/2012 01/03/2012 05/03/2012 02/04/2012 Regular cash
dividends
$0,090 14/05/2012 31/05/2012 04/06/2012 02/07/2012 Regular cash
dividends
$0,090 13/08/2012 30/08/2012 04/09/2012 01/10/2012 Regular cash
dividends
$0,105 15/11/2012 06/12/2012 10/12/2012 26/12/2012 Regular cash
dividends
2013 $0,405
$0,105 14/02/2013 28/02/2013 04/03/2013 01/04/2013 Regular cash
dividends
$0,105 13/05/2013 30/05/2013 03/06/2013 01/07/2013 Regular cash
dividends
$0,105 12/08/2013 29/08/2013 03/09/2013 07/10/2013 Regular cash
dividends
$0,120 21/11/2013 12/12/2013 16/12/2013 06/01/2014 Regular cash
dividends
2014 $0,465
$0,120 13/02/2014 27/02/2014 03/03/2014 07/04/2014 Regular cash
dividends
$0,120 12/05/2014 29/05/2014 02/06/2014 07/07/2014 Regular cash
dividends
$0,120 11/08/2014 28/08/2014 02/09/2014 06/10/2014 Regular cash
dividends
$0,140 20/11/2014 11/12/2014 25/12/2014 05/01/2015 Regular cash
dividends

99
2015 $0,540
$0,140 12/02/2015 26/02/2015 02/03/2015 06/04/2015 Regular cash
dividends
$0,140 12/05/2015 28/05/2015 01/06/2015 06/07/2015 Regular cash
dividends
$0,140 10/08/2015 03/09/2015 08/09/2015 01/05/2015 Regular cash
dividends
$0,160 19/11/2015 07/12/2015 09/12/2015 23/12/2015 Regular cash
dividends
2016 $0,620
$0,160 11/02/2016 03/03/2016 07/03/2016 04/04/2016 Regular cash
dividends
$0,160 13/05/2016 02/06/2016 06/06/2016 05/07/2016 Regular cash
dividends
$0,160 11/08/2016 01/09/2016 06/09/2016 03/10/2016 Regular cash
dividends
$0,180 18/11/2016 01/12/2016 05/12/2016 03/01/2017 Regular cash
dividends
2017 $0,700
$0,180 16/02/2017 02/03/2017 06/03/2017 03/04/2017 Regular cash
dividends
$0,180 11/05/2017 01/06/2017 05/06/2017 05/07/2017 Regular cash
dividends
$0,180 09/08/2017 31/08/2017 05/09/2017 02/10/2017 Regular cash
dividends
$0,200 16/11/2017 01/12/2017 04/12/2017 02/01/2018 Regular cash
dividends
2018 $0,780
$0,200 15/02/2018 02/03/2018 05/03/2018 02/04/2018 Regular cash
dividends
$0,200 10/05/2018 01/06/2018 04/06/2018 05/07/2018 Regular cash
dividends
$0,200 09/08/2018 31/08/2018 04/09/2018 01/10/2018 Regular cash
dividends
$0,220 15/11/2018 30/11/2018 03/12/2018 02/01/2019 Regular cash
dividends
2019 $0,860
$0,220 14/02/2019 01/03/2019 04/03/2019 01/04/2019 Regular cash
dividends
$0,220 09/05/2019 31/05/2019 03/06/2019 01/07/2019 Regular cash
dividends
$0,220 08/08/2019 30/08/2019 03/09/2019 30/09/2019 Regular cash
dividends
$0,245 14/11/2019 29/11/2019 02/12/2019 02/01/2020 Regular cash
dividends Table 12 – Annual and quarterly dividends per share of Nike. Source: Nike’s official website and Morningstar. Remark: the
numbers have been restated to mirrors the historical stock splits and have been rounded to the nearest thousandth
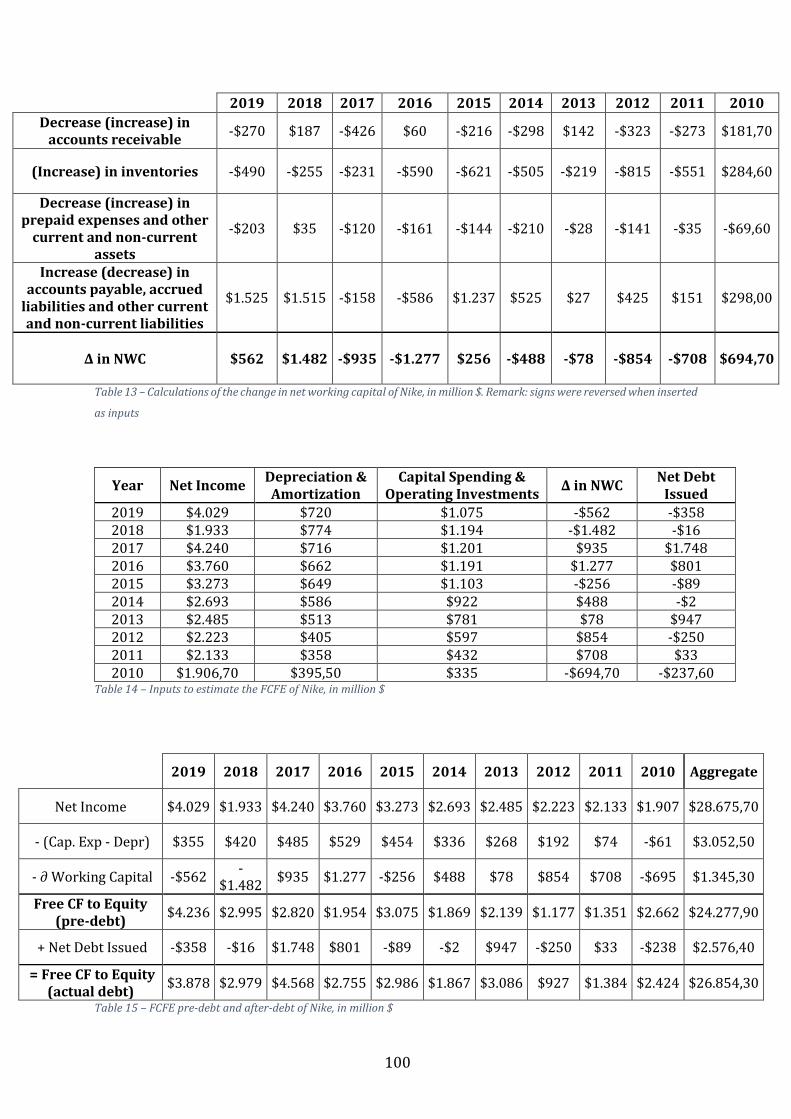
100
2019 2018 2017 2016 2015 2014 2013 2012 2011 2010
Decrease (increase) in accounts receivable
-$270 $187 -$426 $60 -$216 -$298 $142 -$323 -$273 $181,70
(Increase) in inventories -$490 -$255 -$231 -$590 -$621 -$505 -$219 -$815 -$551 $284,60
Decrease (increase) in prepaid expenses and other
current and non-current assets
-$203 $35 -$120 -$161 -$144 -$210 -$28 -$141 -$35 -$69,60
Increase (decrease) in accounts payable, accrued
liabilities and other current and non-current liabilities
$1.525 $1.515 -$158 -$586 $1.237 $525 $27 $425 $151 $298,00
Δ in NWC $562 $1.482 -$935 -$1.277 $256 -$488 -$78 -$854 -$708 $694,70
Table 13 – Calculations of the change in net working capital of Nike, in million $. Remark: signs were reversed when inserted
as inputs
Year Net Income Depreciation & Amortization
Capital Spending & Operating Investments
Δ in NWC Net Debt
Issued
2019 $4.029 $720 $1.075 -$562 -$358 2018 $1.933 $774 $1.194 -$1.482 -$16 2017 $4.240 $716 $1.201 $935 $1.748 2016 $3.760 $662 $1.191 $1.277 $801 2015 $3.273 $649 $1.103 -$256 -$89 2014 $2.693 $586 $922 $488 -$2 2013 $2.485 $513 $781 $78 $947 2012 $2.223 $405 $597 $854 -$250 2011 $2.133 $358 $432 $708 $33 2010 $1.906,70 $395,50 $335 -$694,70 -$237,60
Table 14 – Inputs to estimate the FCFE of Nike, in million $
2019 2018 2017 2016 2015 2014 2013 2012 2011 2010 Aggregate
Net Income $4.029 $1.933 $4.240 $3.760 $3.273 $2.693 $2.485 $2.223 $2.133 $1.907 $28.675,70
- (Cap. Exp - Depr) $355 $420 $485 $529 $454 $336 $268 $192 $74 -$61 $3.052,50
- ∂ Working Capital -$562 -
$1.482 $935 $1.277 -$256 $488 $78 $854 $708 -$695 $1.345,30
Free CF to Equity (pre-debt)
$4.236 $2.995 $2.820 $1.954 $3.075 $1.869 $2.139 $1.177 $1.351 $2.662 $24.277,90
+ Net Debt Issued -$358 -$16 $1.748 $801 -$89 -$2 $947 -$250 $33 -$238 $2.576,40
= Free CF to Equity (actual debt)
$3.878 $2.979 $4.568 $2.755 $2.986 $1.867 $3.086 $927 $1.384 $2.424 $26.854,30
Table 15 – FCFE pre-debt and after-debt of Nike, in million $

101
2019 2018 2017 2016 2015 2014 2013 2012 2011 2010 Aggregate
Dividends $1.360 $1.265 $1.159 $1.053 $931 $821 $727 $639 $569 $514,80 $9.038,80
+ Equity Repurchases
$3.521 $3.521 $2.734 $2.731 $2.020 $2.245 $1.361 $1.346 $1.514 $376,70 $21.369,70
= Cash to Stockholders
$4.881 $4.786 $3.893 $3.784 $2.951 $3.066 $2.088 $1.985 $2.083 $891,50 $30.408,50
Table 16 – Cash returned to stockholders of Nike, in million $
2019 2018 2017 2016 2015 2014 2013 2012 2011 2010 Average Dividend
Payout Ratio
33,76% 65,44% 27,33% 28,01% 28,44% 30,49% 29,26% 28,74% 26,68% 27,00% 32,51%
Dividends as % of
FCFE 35,07% 42,46% 25,37% 38,22% 31,18% 43,97% 23,56% 68,93% 41,11% 21,23% 37,11%
Cash Paid as % of
FCFE 125,86% 160,66% 85,22% 137,35% 98,83% 164,22% 67,66% 214,13% 150,51% 36,77% 124,12%
Table 17 – Nike’s dividend ratios
Table 18 – Nike’s historical annual return on stock
Year Year-high Year-low Year-close Annual % Δ
in stock price Dividend
yield Annual return
on stock
2019 $101,57 $72,75 $101,31 36,65% 1,00% 37,65%
2018 $85,55 $62,49 $74,14 18,53% 1,20% 19,73%
2017 $64,81 $50,83 $62,55 23,06% 1,10% 24,16%
2016 $64,90 $49,62 $50,83 -18,67% 1,00% -17,67%
2015 $67,17 $45,59 $62,50 30,01% 1,20% 31,21%
2014 $49,67 $35,26 $48,08 22,27% 1,30% 23,57%
2013 $39,93 $25,92 $39,32 52,40% 1,50% 53,90%
2012 $28,60 $21,95 $25,80 7,09% 1,40% 8,49%
2011 $24,44 $18,86 $24,09 12,82% 1,60% 14,42%
2010 $23,08 $15,33 $21,36 29,29% 1,90% 31,19%
$16,52
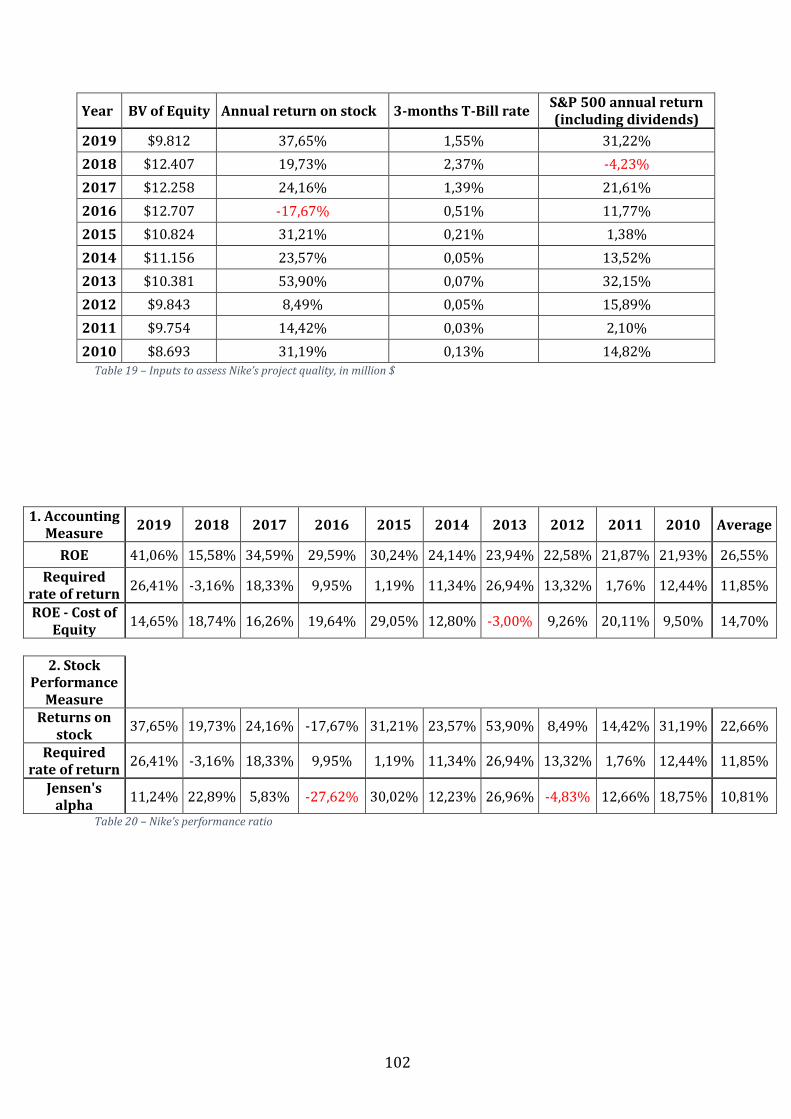
102
Year BV of Equity Annual return on stock 3-months T-Bill rate S&P 500 annual return (including dividends)
2019 $9.812 37,65% 1,55% 31,22%
2018 $12.407 19,73% 2,37% -4,23%
2017 $12.258 24,16% 1,39% 21,61%
2016 $12.707 -17,67% 0,51% 11,77%
2015 $10.824 31,21% 0,21% 1,38%
2014 $11.156 23,57% 0,05% 13,52%
2013 $10.381 53,90% 0,07% 32,15%
2012 $9.843 8,49% 0,05% 15,89%
2011 $9.754 14,42% 0,03% 2,10%
2010 $8.693 31,19% 0,13% 14,82% Table 19 – Inputs to assess Nike’s project quality, in million $
1. Accounting Measure
2019 2018 2017 2016 2015 2014 2013 2012 2011 2010 Average
ROE 41,06% 15,58% 34,59% 29,59% 30,24% 24,14% 23,94% 22,58% 21,87% 21,93% 26,55%
Required rate of return
26,41% -3,16% 18,33% 9,95% 1,19% 11,34% 26,94% 13,32% 1,76% 12,44% 11,85%
ROE - Cost of Equity
14,65% 18,74% 16,26% 19,64% 29,05% 12,80% -3,00% 9,26% 20,11% 9,50% 14,70%
2. Stock
Performance Measure
Returns on stock
37,65% 19,73% 24,16% -17,67% 31,21% 23,57% 53,90% 8,49% 14,42% 31,19% 22,66%
Required rate of return
26,41% -3,16% 18,33% 9,95% 1,19% 11,34% 26,94% 13,32% 1,76% 12,44% 11,85%
Jensen's alpha
11,24% 22,89% 5,83% -27,62% 30,02% 12,23% 26,96% -4,83% 12,66% 18,75% 10,81%
Table 20 – Nike’s performance ratio
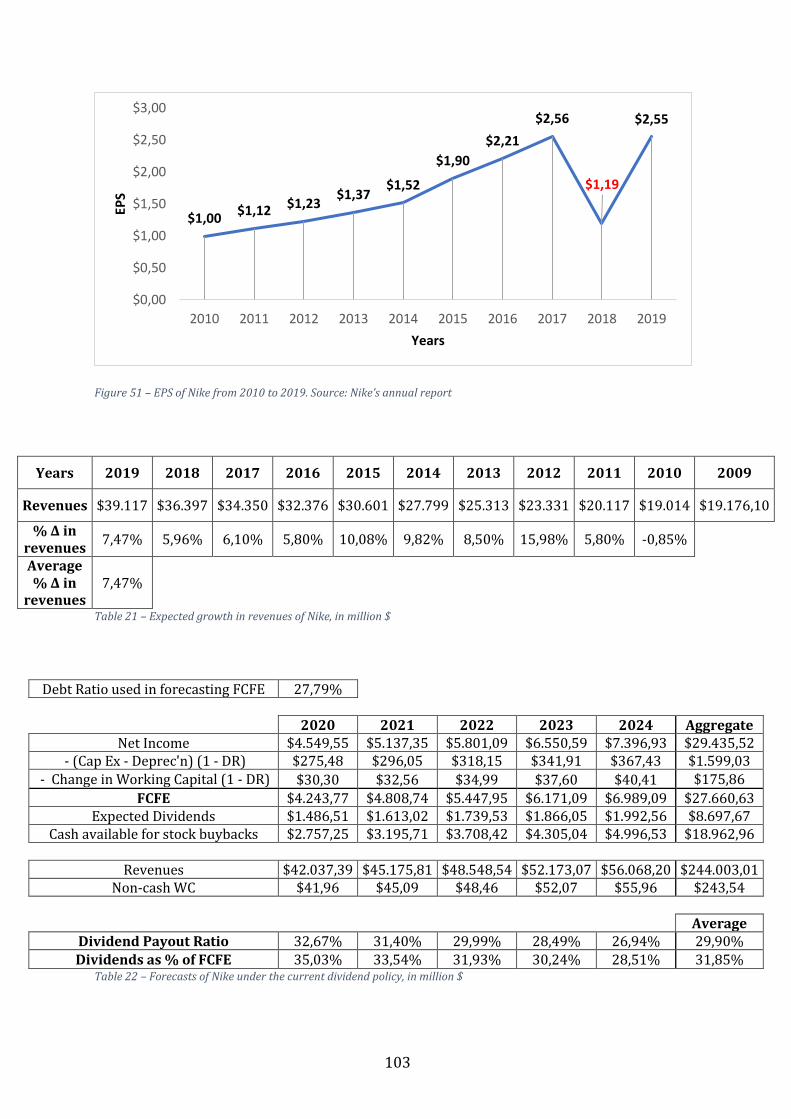
103
Figure 51 – EPS of Nike from 2010 to 2019. Source: Nike’s annual report
Years 2019 2018 2017 2016 2015 2014 2013 2012 2011 2010 2009
Revenues $39.117 $36.397 $34.350 $32.376 $30.601 $27.799 $25.313 $23.331 $20.117 $19.014 $19.176,10
% Δ in revenues
7,47% 5,96% 6,10% 5,80% 10,08% 9,82% 8,50% 15,98% 5,80% -0,85%
Average % Δ in
revenues 7,47%
Table 21 – Expected growth in revenues of Nike, in million $
Debt Ratio used in forecasting FCFE 27,79% 2020 2021 2022 2023 2024 Aggregate
Net Income $4.549,55 $5.137,35 $5.801,09 $6.550,59 $7.396,93 $29.435,52 - (Cap Ex - Deprec'n) (1 - DR) $275,48 $296,05 $318,15 $341,91 $367,43 $1.599,03
- Change in Working Capital (1 - DR) $30,30 $32,56 $34,99 $37,60 $40,41 $175,86
FCFE $4.243,77 $4.808,74 $5.447,95 $6.171,09 $6.989,09 $27.660,63 Expected Dividends $1.486,51 $1.613,02 $1.739,53 $1.866,05 $1.992,56 $8.697,67
Cash available for stock buybacks $2.757,25 $3.195,71 $3.708,42 $4.305,04 $4.996,53 $18.962,96
Revenues $42.037,39 $45.175,81 $48.548,54 $52.173,07 $56.068,20 $244.003,01 Non-cash WC $41,96 $45,09 $48,46 $52,07 $55,96 $243,54
Average
Dividend Payout Ratio 32,67% 31,40% 29,99% 28,49% 26,94% 29,90% Dividends as % of FCFE 35,03% 33,54% 31,93% 30,24% 28,51% 31,85%
Table 22 – Forecasts of Nike under the current dividend policy, in million $
$1,00$1,12 $1,23
$1,37$1,52
$1,90
$2,21
$2,56
$1,19
$2,55
$0,00
$0,50
$1,00
$1,50
$2,00
$2,50
$3,00
2010 2011 2012 2013 2014 2015 2016 2017 2018 2019
EPS
Years

104
Debt Ratio used in forecasting FCFE
27,79%
2020 2021 2022 2023 2024 Aggregate
Net Income $4.549,55 $5.137,35 $5.801,09 $6.550,59 $7.396,93 $29.435,52
- (Cap Ex - Deprec'n) (1 - DR) $275,48 $296,05 $318,15 $341,91 $367,43 $1.599,03
- Change in Working Capital (1 - DR) $30,30 $32,56 $34,99 $37,60 $40,41
$175,86
FCFE $4.243,77 $4.808,74 $5.447,95 $6.171,09 $6.989,09 $27.660,63
Expected Dividends $1.549,77 $1.739,53 $1.929,30 $2.119,07 $2.308,84 $9.646,51
Cash available for stock buybacks $2.694,00 $3.069,20 $3.518,65 $4.052,02 $4.680,25 $18.014,12
Revenues $42.037,39 $45.175,81 $48.548,54 $52.173,07 $56.068,20 $244.003,01
Non-cash WC $41,96 $45,09 $48,46 $52,07 $55,96 $243,54
Average
Dividend Payout Ratio 34,06% 33,86% 33,26% 32,35% 31,21% 32,95%
Dividends as % of FCFE 36,52% 36,17% 35,41% 34,34% 33,03% 35,10% Table 23 – Forecasts of Nike under the new alternative, in million $

105
Appendix B
FY Annual DPS
Declaration Date
Ex-dividend date
Record Date
Pay date Type
2010 0,80 € 12/04/2011 10/05/2011 12/05/2011 20/05/2011 Regular Cash
2011 1,00 € 23/04/2012 08/05/2012 10/05/2012 18/05/2012 Regular Cash
2012 1,35 € 19/04/2013 06/05/2013 08/05/2013 15/05/2013 Regular Cash
2013 1,50 € 09/04/2014 06/05/2014 08/05/2014 16/05/2014 Regular Cash
2014 1,50 € 30/04/2015 05/05/2015 07/05/2015 15/05/2015 Regular Cash
2015 1,60 € 06/05/2016 10/05/2016 12/05/2016 20/05/2016 Regular Cash
2016 2,00 € 38-03-2017 12/05/2017 16/05/2017 23/05/2017 Regular Cash
2017 2,60 € 24/04/2018 10/05/2018 11/05/2018 22/05/2018 Regular Cash
2018 3,35 € 08/04/2019 10/05/2019 13/05/2019 21/05/2019 Regular Cash
2019 3,85 € - - - 19/05/2020 Regular Cash
Table 24 – Annual dividend per share of Adidas AG; annual DPS of 2019 is subjected to the Annual General Meeting approval
in 2020. Source: Adidas official website and Ycharts
Figure 52 – Increase in Adidas’ yearly dividend per share from 2010 to 2019: a graphical representation
0,80 €1,00 €
1,35 €1,50 € 1,50 € 1,60 €
2,00 €
2,60 €
3,35 €
3,85 €
0,00 €
0,50 €
1,00 €
1,50 €
2,00 €
2,50 €
3,00 €
3,50 €
4,00 €
4,50 €
2010 2011 2012 2013 2014 2015 2016 2017 2018 2019
DP
S
Years
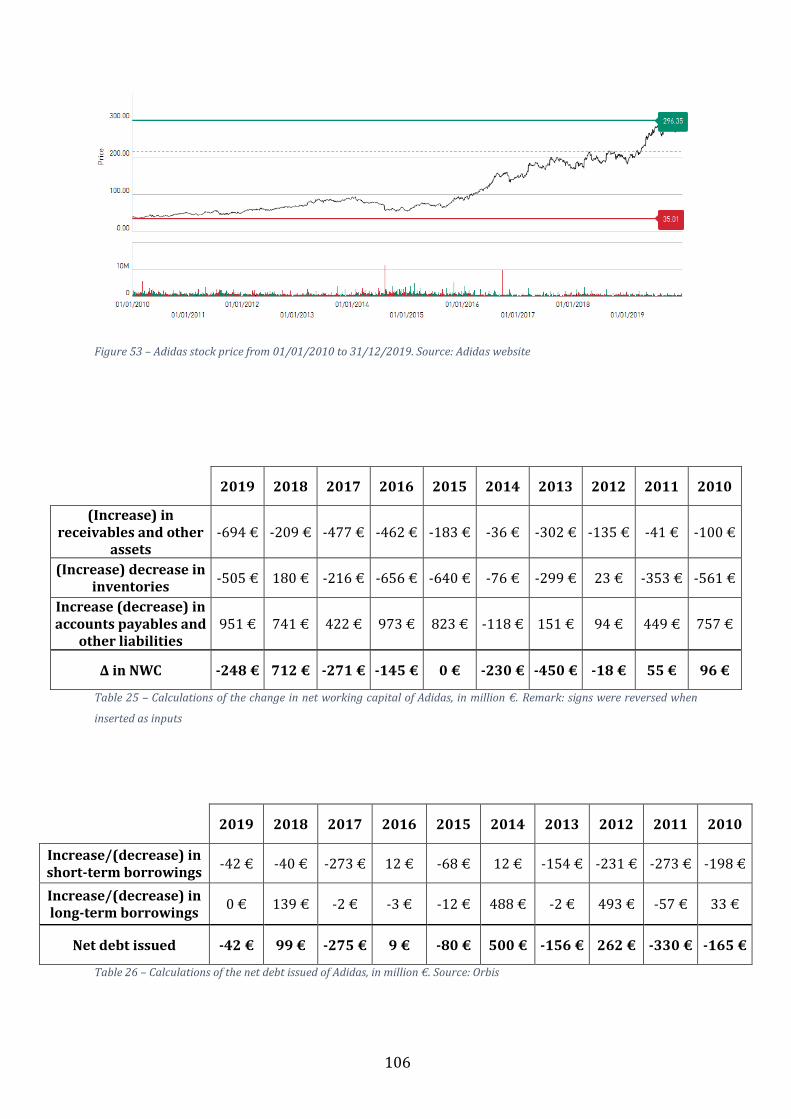
106
Figure 53 – Adidas stock price from 01/01/2010 to 31/12/2019. Source: Adidas website
2019 2018 2017 2016 2015 2014 2013 2012 2011 2010
(Increase) in receivables and other
assets -694 € -209 € -477 € -462 € -183 € -36 € -302 € -135 € -41 € -100 €
(Increase) decrease in inventories
-505 € 180 € -216 € -656 € -640 € -76 € -299 € 23 € -353 € -561 €
Increase (decrease) in accounts payables and
other liabilities 951 € 741 € 422 € 973 € 823 € -118 € 151 € 94 € 449 € 757 €
Δ in NWC -248 € 712 € -271 € -145 € 0 € -230 € -450 € -18 € 55 € 96 €
Table 25 – Calculations of the change in net working capital of Adidas, in million €. Remark: signs were reversed when
inserted as inputs
2019 2018 2017 2016 2015 2014 2013 2012 2011 2010
Increase/(decrease) in short-term borrowings
-42 € -40 € -273 € 12 € -68 € 12 € -154 € -231 € -273 € -198 €
Increase/(decrease) in long-term borrowings
0 € 139 € -2 € -3 € -12 € 488 € -2 € 493 € -57 € 33 €
Net debt issued -42 € 99 € -275 € 9 € -80 € 500 € -156 € 262 € -330 € -165 €
Table 26 – Calculations of the net debt issued of Adidas, in million €. Source: Orbis
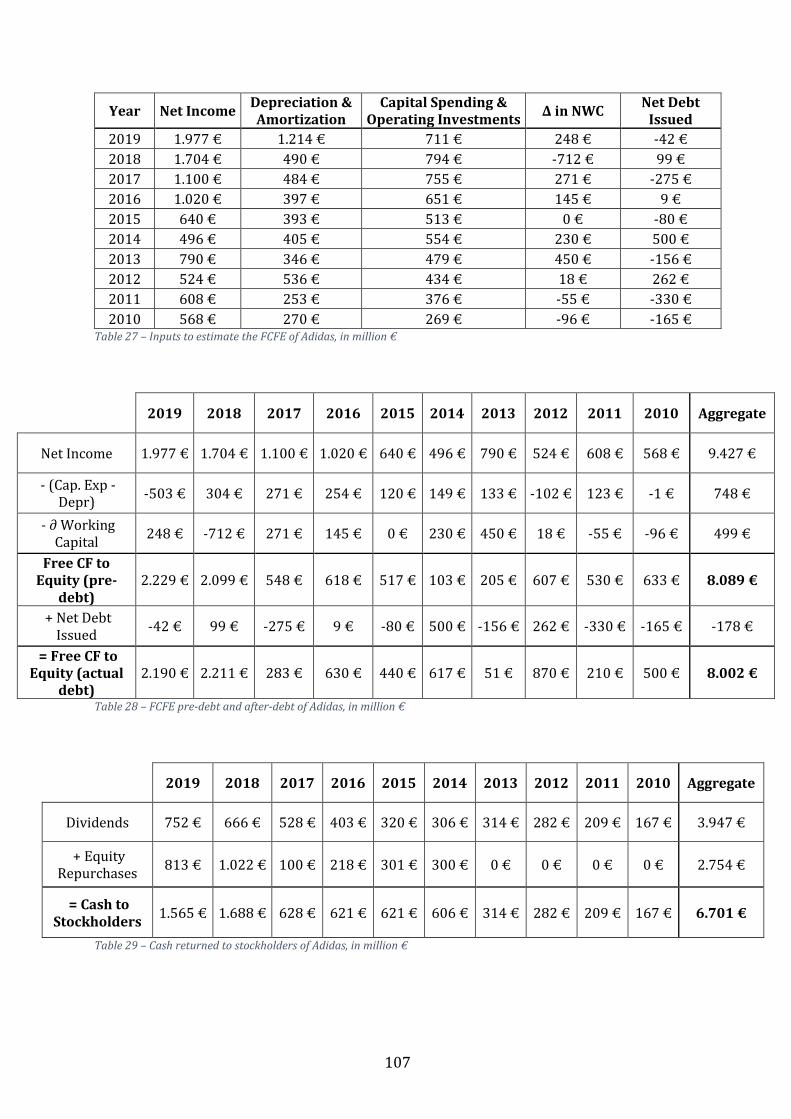
107
Year Net Income Depreciation & Amortization
Capital Spending & Operating Investments
Δ in NWC Net Debt
Issued
2019 1.977 € 1.214 € 711 € 248 € -42 €
2018 1.704 € 490 € 794 € -712 € 99 €
2017 1.100 € 484 € 755 € 271 € -275 €
2016 1.020 € 397 € 651 € 145 € 9 €
2015 640 € 393 € 513 € 0 € -80 €
2014 496 € 405 € 554 € 230 € 500 €
2013 790 € 346 € 479 € 450 € -156 €
2012 524 € 536 € 434 € 18 € 262 €
2011 608 € 253 € 376 € -55 € -330 €
2010 568 € 270 € 269 € -96 € -165 € Table 27 – Inputs to estimate the FCFE of Adidas, in million €
2019 2018 2017 2016 2015 2014 2013 2012 2011 2010 Aggregate
Net Income 1.977 € 1.704 € 1.100 € 1.020 € 640 € 496 € 790 € 524 € 608 € 568 € 9.427 €
- (Cap. Exp - Depr)
-503 € 304 € 271 € 254 € 120 € 149 € 133 € -102 € 123 € -1 € 748 €
- ∂ Working Capital
248 € -712 € 271 € 145 € 0 € 230 € 450 € 18 € -55 € -96 € 499 €
Free CF to Equity (pre-
debt) 2.229 € 2.099 € 548 € 618 € 517 € 103 € 205 € 607 € 530 € 633 € 8.089 €
+ Net Debt Issued
-42 € 99 € -275 € 9 € -80 € 500 € -156 € 262 € -330 € -165 € -178 €
= Free CF to Equity (actual
debt) 2.190 € 2.211 € 283 € 630 € 440 € 617 € 51 € 870 € 210 € 500 € 8.002 €
Table 28 – FCFE pre-debt and after-debt of Adidas, in million €
2019 2018 2017 2016 2015 2014 2013 2012 2011 2010 Aggregate
Dividends 752 € 666 € 528 € 403 € 320 € 306 € 314 € 282 € 209 € 167 € 3.947 €
+ Equity Repurchases
813 € 1.022 € 100 € 218 € 301 € 300 € 0 € 0 € 0 € 0 € 2.754 €
= Cash to Stockholders
1.565 € 1.688 € 628 € 621 € 621 € 606 € 314 € 282 € 209 € 167 € 6.701 €
Table 29 – Cash returned to stockholders of Adidas, in million €
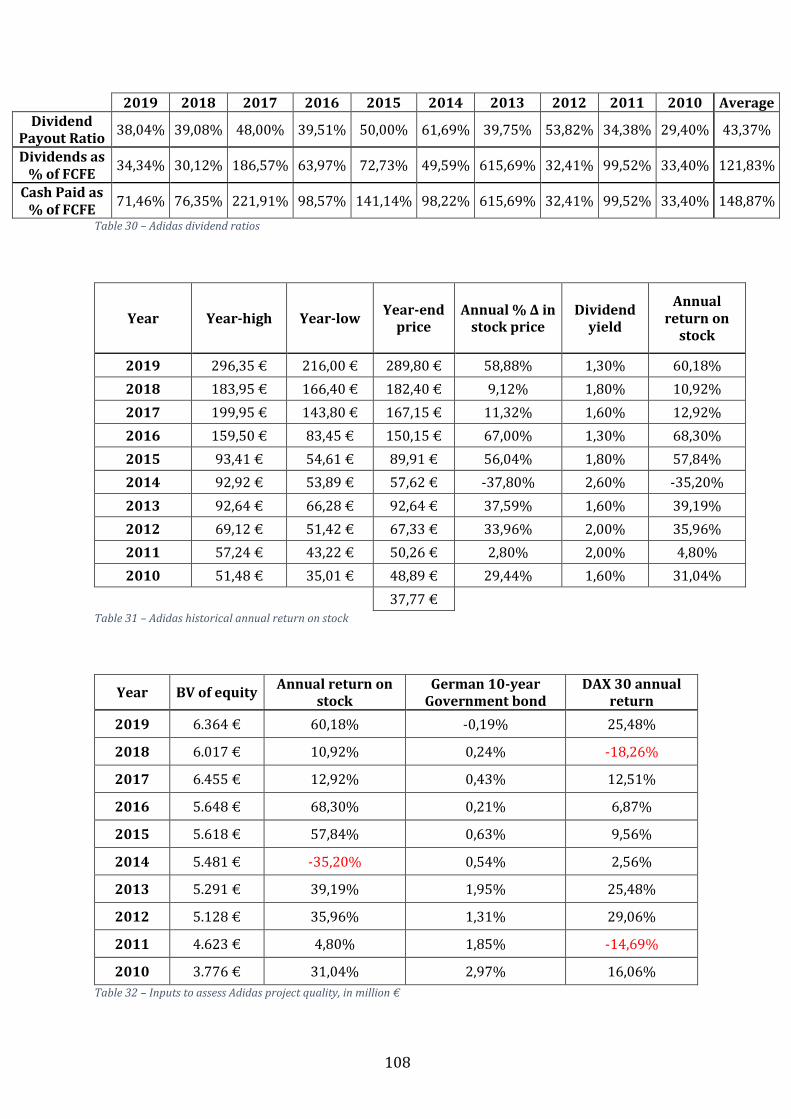
108
2019 2018 2017 2016 2015 2014 2013 2012 2011 2010 Average
Dividend Payout Ratio
38,04% 39,08% 48,00% 39,51% 50,00% 61,69% 39,75% 53,82% 34,38% 29,40% 43,37%
Dividends as % of FCFE
34,34% 30,12% 186,57% 63,97% 72,73% 49,59% 615,69% 32,41% 99,52% 33,40% 121,83%
Cash Paid as % of FCFE
71,46% 76,35% 221,91% 98,57% 141,14% 98,22% 615,69% 32,41% 99,52% 33,40% 148,87%
Table 30 – Adidas dividend ratios
Year Year-high Year-low Year-end
price Annual % Δ in
stock price Dividend
yield
Annual return on
stock
2019 296,35 € 216,00 € 289,80 € 58,88% 1,30% 60,18%
2018 183,95 € 166,40 € 182,40 € 9,12% 1,80% 10,92%
2017 199,95 € 143,80 € 167,15 € 11,32% 1,60% 12,92%
2016 159,50 € 83,45 € 150,15 € 67,00% 1,30% 68,30%
2015 93,41 € 54,61 € 89,91 € 56,04% 1,80% 57,84%
2014 92,92 € 53,89 € 57,62 € -37,80% 2,60% -35,20%
2013 92,64 € 66,28 € 92,64 € 37,59% 1,60% 39,19%
2012 69,12 € 51,42 € 67,33 € 33,96% 2,00% 35,96%
2011 57,24 € 43,22 € 50,26 € 2,80% 2,00% 4,80%
2010 51,48 € 35,01 € 48,89 € 29,44% 1,60% 31,04%
37,77 €
Table 31 – Adidas historical annual return on stock
Year BV of equity Annual return on
stock German 10-year
Government bond DAX 30 annual
return
2019 6.364 € 60,18% -0,19% 25,48%
2018 6.017 € 10,92% 0,24% -18,26%
2017 6.455 € 12,92% 0,43% 12,51%
2016 5.648 € 68,30% 0,21% 6,87%
2015 5.618 € 57,84% 0,63% 9,56%
2014 5.481 € -35,20% 0,54% 2,56%
2013 5.291 € 39,19% 1,95% 25,48%
2012 5.128 € 35,96% 1,31% 29,06%
2011 4.623 € 4,80% 1,85% -14,69%
2010 3.776 € 31,04% 2,97% 16,06%
Table 32 – Inputs to assess Adidas project quality, in million €
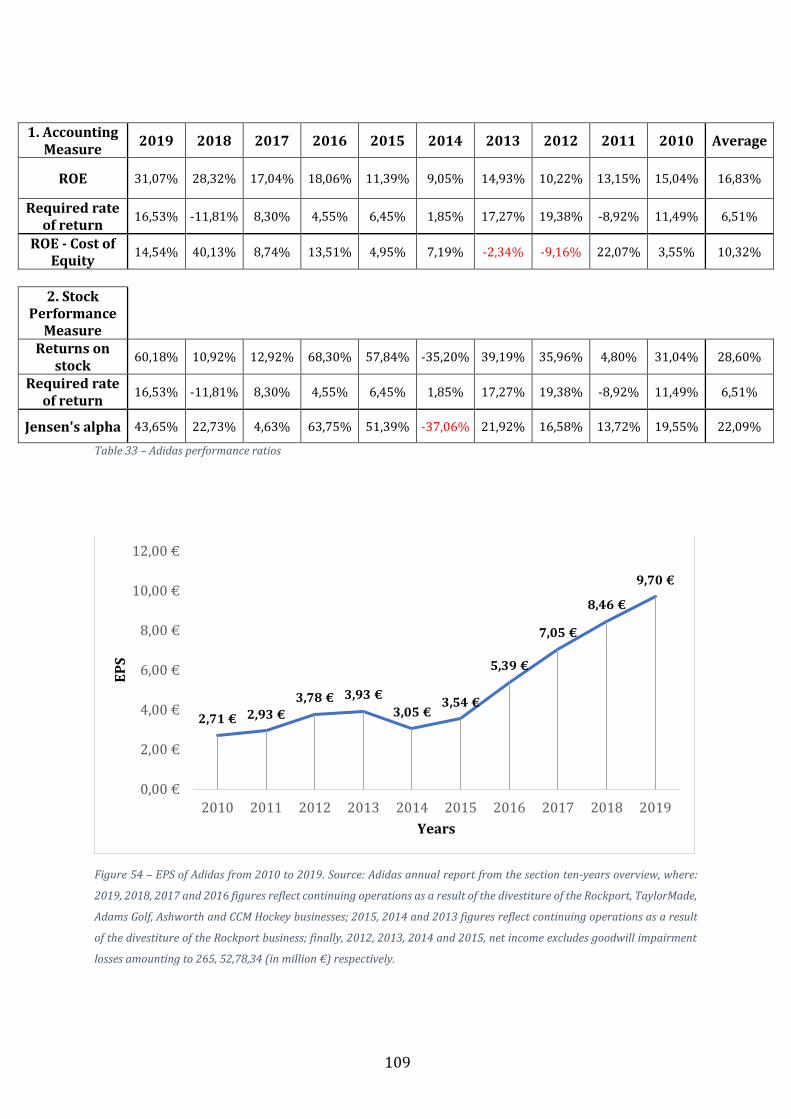
109
1. Accounting Measure
2019 2018 2017 2016 2015 2014 2013 2012 2011 2010 Average
ROE 31,07% 28,32% 17,04% 18,06% 11,39% 9,05% 14,93% 10,22% 13,15% 15,04% 16,83%
Required rate of return
16,53% -11,81% 8,30% 4,55% 6,45% 1,85% 17,27% 19,38% -8,92% 11,49% 6,51%
ROE - Cost of Equity
14,54% 40,13% 8,74% 13,51% 4,95% 7,19% -2,34% -9,16% 22,07% 3,55% 10,32%
2. Stock Performance
Measure
Returns on stock
60,18% 10,92% 12,92% 68,30% 57,84% -35,20% 39,19% 35,96% 4,80% 31,04% 28,60%
Required rate of return
16,53% -11,81% 8,30% 4,55% 6,45% 1,85% 17,27% 19,38% -8,92% 11,49% 6,51%
Jensen's alpha 43,65% 22,73% 4,63% 63,75% 51,39% -37,06% 21,92% 16,58% 13,72% 19,55% 22,09%
Table 33 – Adidas performance ratios
Figure 54 – EPS of Adidas from 2010 to 2019. Source: Adidas annual report from the section ten-years overview, where:
2019, 2018, 2017 and 2016 figures reflect continuing operations as a result of the divestiture of the Rockport, TaylorMade,
Adams Golf, Ashworth and CCM Hockey businesses; 2015, 2014 and 2013 figures reflect continuing operations as a result
of the divestiture of the Rockport business; finally, 2012, 2013, 2014 and 2015, net income excludes goodwill impairment
losses amounting to 265, 52,78,34 (in million €) respectively.
2,71 € 2,93 €
3,78 € 3,93 €
3,05 €3,54 €
5,39 €
7,05 €
8,46 €
9,70 €
0,00 €
2,00 €
4,00 €
6,00 €
8,00 €
10,00 €
12,00 €
2010 2011 2012 2013 2014 2015 2016 2017 2018 2019
EP
S
Years
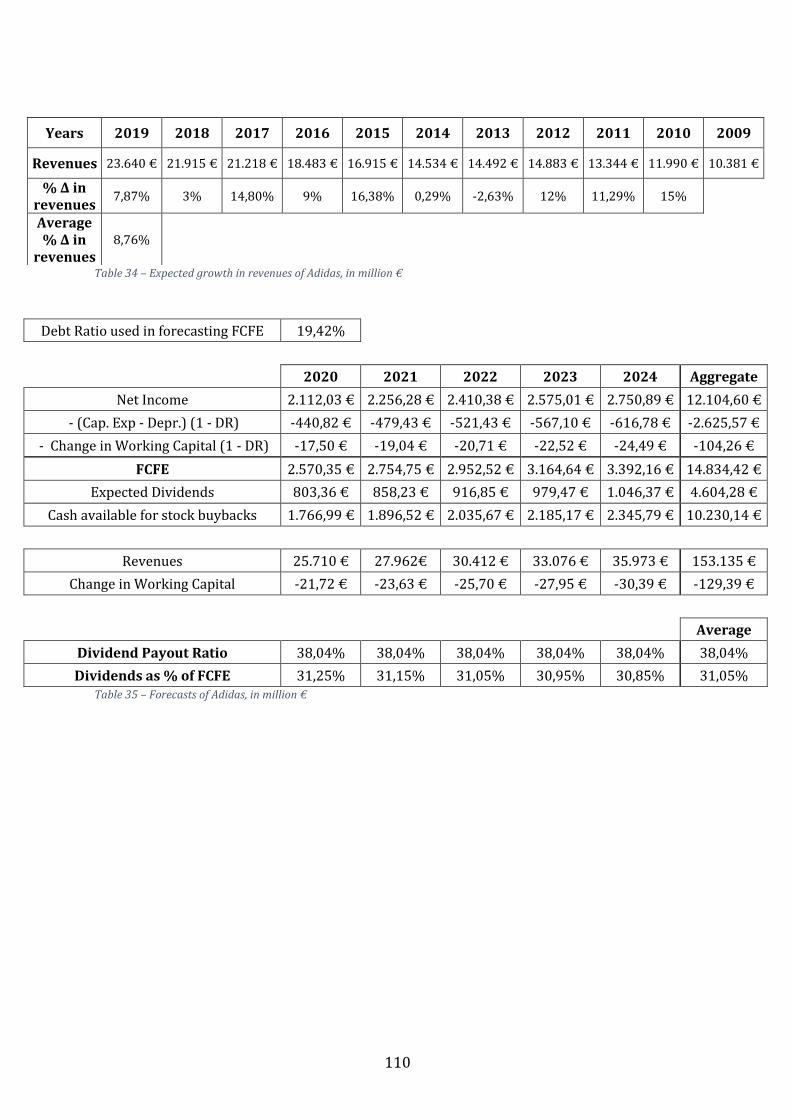
110
Table 34 – Expected growth in revenues of Adidas, in million €
Table 35 – Forecasts of Adidas, in million €
Years 2019 2018 2017 2016 2015 2014 2013 2012 2011 2010 2009
Revenues 23.640 € 21.915 € 21.218 € 18.483 € 16.915 € 14.534 € 14.492 € 14.883 € 13.344 € 11.990 € 10.381 €
% Δ in revenues
7,87% 3% 14,80% 9% 16,38% 0,29% -2,63% 12% 11,29% 15%
Average % Δ in
revenues 8,76%
Debt Ratio used in forecasting FCFE 19,42%
2020 2021 2022 2023 2024 Aggregate
Net Income 2.112,03 € 2.256,28 € 2.410,38 € 2.575,01 € 2.750,89 € 12.104,60 €
- (Cap. Exp - Depr.) (1 - DR) -440,82 € -479,43 € -521,43 € -567,10 € -616,78 € -2.625,57 €
- Change in Working Capital (1 - DR) -17,50 € -19,04 € -20,71 € -22,52 € -24,49 € -104,26 €
FCFE 2.570,35 € 2.754,75 € 2.952,52 € 3.164,64 € 3.392,16 € 14.834,42 €
Expected Dividends 803,36 € 858,23 € 916,85 € 979,47 € 1.046,37 € 4.604,28 €
Cash available for stock buybacks 1.766,99 € 1.896,52 € 2.035,67 € 2.185,17 € 2.345,79 € 10.230,14 €
Revenues 25.710 € 27.962€ 30.412 € 33.076 € 35.973 € 153.135 €
Change in Working Capital -21,72 € -23,63 € -25,70 € -27,95 € -30,39 € -129,39 €
Average
Dividend Payout Ratio 38,04% 38,04% 38,04% 38,04% 38,04% 38,04%
Dividends as % of FCFE 31,25% 31,15% 31,05% 30,95% 30,85% 31,05%
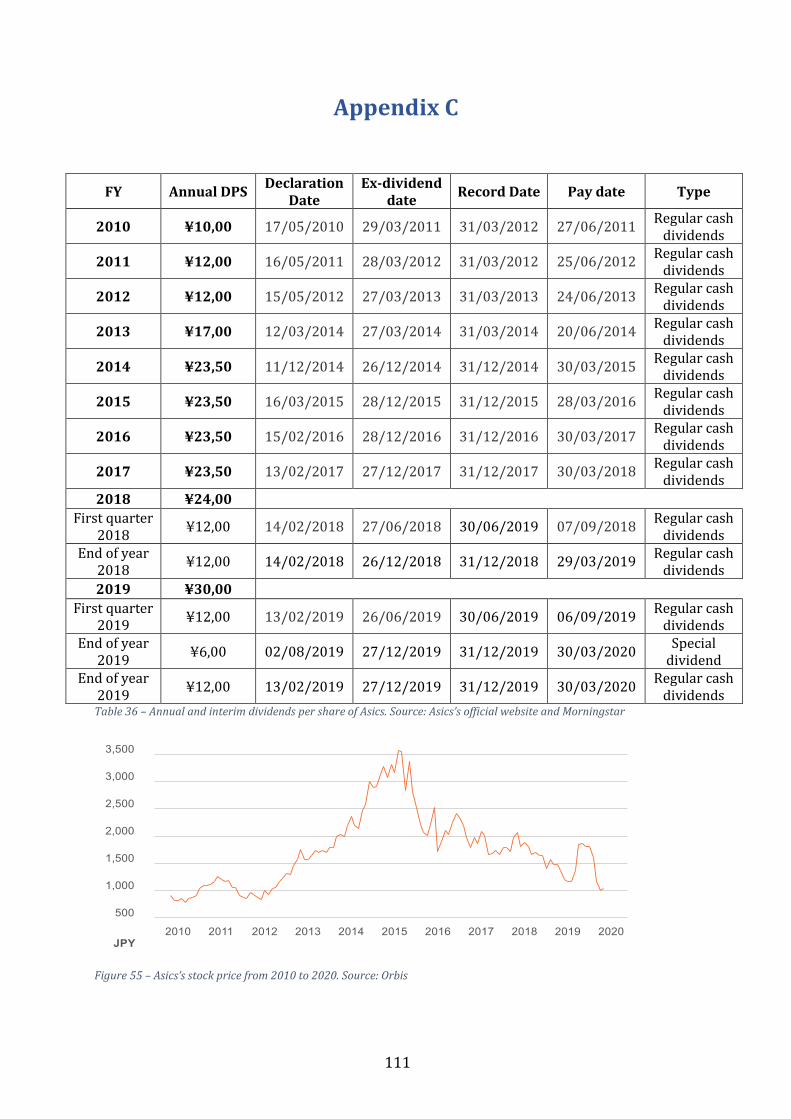
111
Appendix C
FY Annual DPS Declaration
Date Ex-dividend
date Record Date Pay date Type
2010 ¥10,00 17/05/2010 29/03/2011 31/03/2012 27/06/2011 Regular cash
dividends
2011 ¥12,00 16/05/2011 28/03/2012 31/03/2012 25/06/2012 Regular cash
dividends
2012 ¥12,00 15/05/2012 27/03/2013 31/03/2013 24/06/2013 Regular cash
dividends
2013 ¥17,00 12/03/2014 27/03/2014 31/03/2014 20/06/2014 Regular cash
dividends
2014 ¥23,50 11/12/2014 26/12/2014 31/12/2014 30/03/2015 Regular cash
dividends
2015 ¥23,50 16/03/2015 28/12/2015 31/12/2015 28/03/2016 Regular cash
dividends
2016 ¥23,50 15/02/2016 28/12/2016 31/12/2016 30/03/2017 Regular cash
dividends
2017 ¥23,50 13/02/2017 27/12/2017 31/12/2017 30/03/2018 Regular cash
dividends
2018 ¥24,00
First quarter 2018
¥12,00 14/02/2018 27/06/2018 30/06/2019 07/09/2018 Regular cash
dividends End of year
2018 ¥12,00 14/02/2018 26/12/2018 31/12/2018 29/03/2019
Regular cash dividends
2019 ¥30,00
First quarter 2019
¥12,00 13/02/2019 26/06/2019 30/06/2019 06/09/2019 Regular cash
dividends End of year
2019 ¥6,00 02/08/2019 27/12/2019 31/12/2019 30/03/2020
Special dividend
End of year 2019
¥12,00 13/02/2019 27/12/2019 31/12/2019 30/03/2020 Regular cash
dividends Table 36 – Annual and interim dividends per share of Asics. Source: Asics’s official website and Morningstar
Figure 55 – Asics’s stock price from 2010 to 2020. Source: Orbis
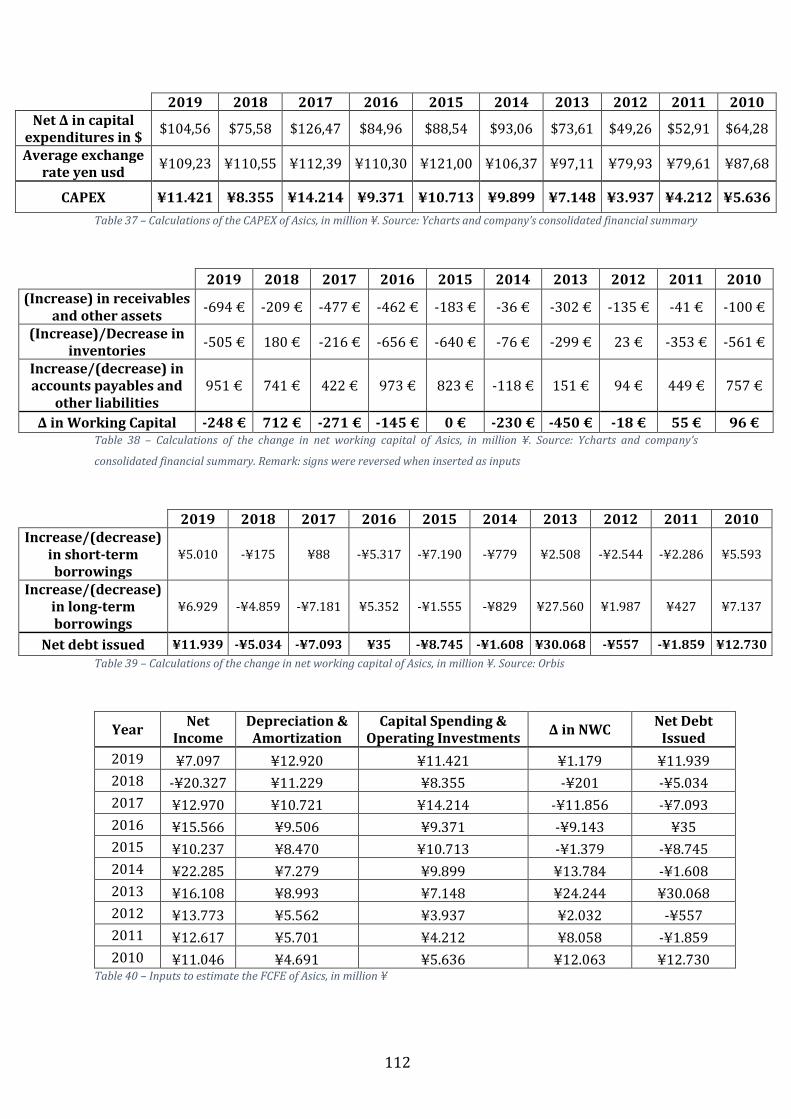
112
2019 2018 2017 2016 2015 2014 2013 2012 2011 2010 Net Δ in capital
expenditures in $ $104,56 $75,58 $126,47 $84,96 $88,54 $93,06 $73,61 $49,26 $52,91 $64,28
Average exchange rate yen usd
¥109,23 ¥110,55 ¥112,39 ¥110,30 ¥121,00 ¥106,37 ¥97,11 ¥79,93 ¥79,61 ¥87,68
CAPEX ¥11.421 ¥8.355 ¥14.214 ¥9.371 ¥10.713 ¥9.899 ¥7.148 ¥3.937 ¥4.212 ¥5.636
Table 37 – Calculations of the CAPEX of Asics, in million ¥. Source: Ycharts and company’s consolidated financial summary
2019 2018 2017 2016 2015 2014 2013 2012 2011 2010
(Increase) in receivables and other assets
-694 € -209 € -477 € -462 € -183 € -36 € -302 € -135 € -41 € -100 €
(Increase)/Decrease in inventories
-505 € 180 € -216 € -656 € -640 € -76 € -299 € 23 € -353 € -561 €
Increase/(decrease) in accounts payables and
other liabilities 951 € 741 € 422 € 973 € 823 € -118 € 151 € 94 € 449 € 757 €
Δ in Working Capital -248 € 712 € -271 € -145 € 0 € -230 € -450 € -18 € 55 € 96 € Table 38 – Calculations of the change in net working capital of Asics, in million ¥. Source: Ycharts and company’s
consolidated financial summary. Remark: signs were reversed when inserted as inputs
2019 2018 2017 2016 2015 2014 2013 2012 2011 2010 Increase/(decrease)
in short-term borrowings
¥5.010 -¥175 ¥88 -¥5.317 -¥7.190 -¥779 ¥2.508 -¥2.544 -¥2.286 ¥5.593
Increase/(decrease) in long-term borrowings
¥6.929 -¥4.859 -¥7.181 ¥5.352 -¥1.555 -¥829 ¥27.560 ¥1.987 ¥427 ¥7.137
Net debt issued ¥11.939 -¥5.034 -¥7.093 ¥35 -¥8.745 -¥1.608 ¥30.068 -¥557 -¥1.859 ¥12.730
Table 39 – Calculations of the change in net working capital of Asics, in million ¥. Source: Orbis
Year Net
Income Depreciation & Amortization
Capital Spending & Operating Investments
Δ in NWC Net Debt
Issued
2019 ¥7.097 ¥12.920 ¥11.421 ¥1.179 ¥11.939
2018 -¥20.327 ¥11.229 ¥8.355 -¥201 -¥5.034
2017 ¥12.970 ¥10.721 ¥14.214 -¥11.856 -¥7.093
2016 ¥15.566 ¥9.506 ¥9.371 -¥9.143 ¥35
2015 ¥10.237 ¥8.470 ¥10.713 -¥1.379 -¥8.745
2014 ¥22.285 ¥7.279 ¥9.899 ¥13.784 -¥1.608
2013 ¥16.108 ¥8.993 ¥7.148 ¥24.244 ¥30.068
2012 ¥13.773 ¥5.562 ¥3.937 ¥2.032 -¥557
2011 ¥12.617 ¥5.701 ¥4.212 ¥8.058 -¥1.859
2010 ¥11.046 ¥4.691 ¥5.636 ¥12.063 ¥12.730 Table 40 – Inputs to estimate the FCFE of Asics, in million ¥
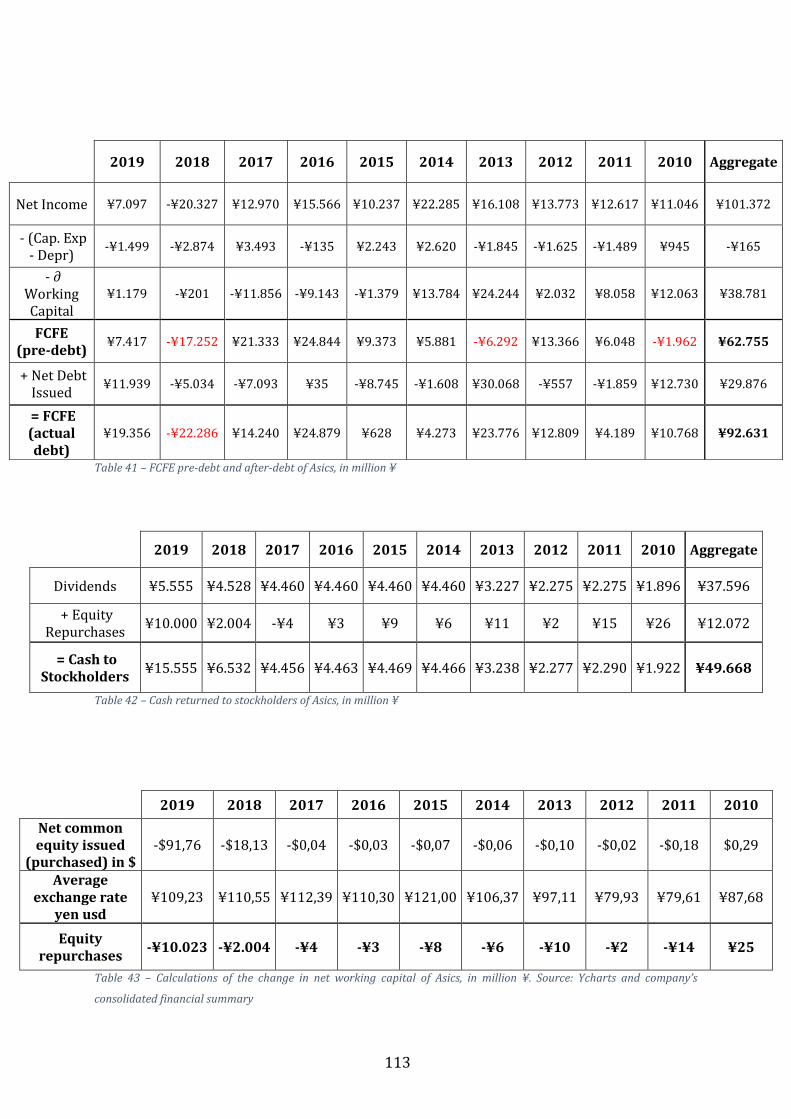
113
Table 41 – FCFE pre-debt and after-debt of Asics, in million ¥
2019 2018 2017 2016 2015 2014 2013 2012 2011 2010 Aggregate
Dividends ¥5.555 ¥4.528 ¥4.460 ¥4.460 ¥4.460 ¥4.460 ¥3.227 ¥2.275 ¥2.275 ¥1.896 ¥37.596
+ Equity Repurchases
¥10.000 ¥2.004 -¥4 ¥3 ¥9 ¥6 ¥11 ¥2 ¥15 ¥26 ¥12.072
= Cash to Stockholders
¥15.555 ¥6.532 ¥4.456 ¥4.463 ¥4.469 ¥4.466 ¥3.238 ¥2.277 ¥2.290 ¥1.922 ¥49.668
Table 42 – Cash returned to stockholders of Asics, in million ¥
2019 2018 2017 2016 2015 2014 2013 2012 2011 2010
Net common equity issued
(purchased) in $ -$91,76 -$18,13 -$0,04 -$0,03 -$0,07 -$0,06 -$0,10 -$0,02 -$0,18 $0,29
Average exchange rate
yen usd ¥109,23 ¥110,55 ¥112,39 ¥110,30 ¥121,00 ¥106,37 ¥97,11 ¥79,93 ¥79,61 ¥87,68
Equity repurchases
-¥10.023 -¥2.004 -¥4 -¥3 -¥8 -¥6 -¥10 -¥2 -¥14 ¥25
Table 43 – Calculations of the change in net working capital of Asics, in million ¥. Source: Ycharts and company’s
consolidated financial summary
2019 2018 2017 2016 2015 2014 2013 2012 2011 2010 Aggregate
Net Income ¥7.097 -¥20.327 ¥12.970 ¥15.566 ¥10.237 ¥22.285 ¥16.108 ¥13.773 ¥12.617 ¥11.046 ¥101.372
- (Cap. Exp - Depr)
-¥1.499 -¥2.874 ¥3.493 -¥135 ¥2.243 ¥2.620 -¥1.845 -¥1.625 -¥1.489 ¥945 -¥165
- ∂ Working Capital
¥1.179 -¥201 -¥11.856 -¥9.143 -¥1.379 ¥13.784 ¥24.244 ¥2.032 ¥8.058 ¥12.063 ¥38.781
FCFE (pre-debt)
¥7.417 -¥17.252 ¥21.333 ¥24.844 ¥9.373 ¥5.881 -¥6.292 ¥13.366 ¥6.048 -¥1.962 ¥62.755
+ Net Debt Issued
¥11.939 -¥5.034 -¥7.093 ¥35 -¥8.745 -¥1.608 ¥30.068 -¥557 -¥1.859 ¥12.730 ¥29.876
= FCFE (actual debt)
¥19.356 -¥22.286 ¥14.240 ¥24.879 ¥628 ¥4.273 ¥23.776 ¥12.809 ¥4.189 ¥10.768 ¥92.631
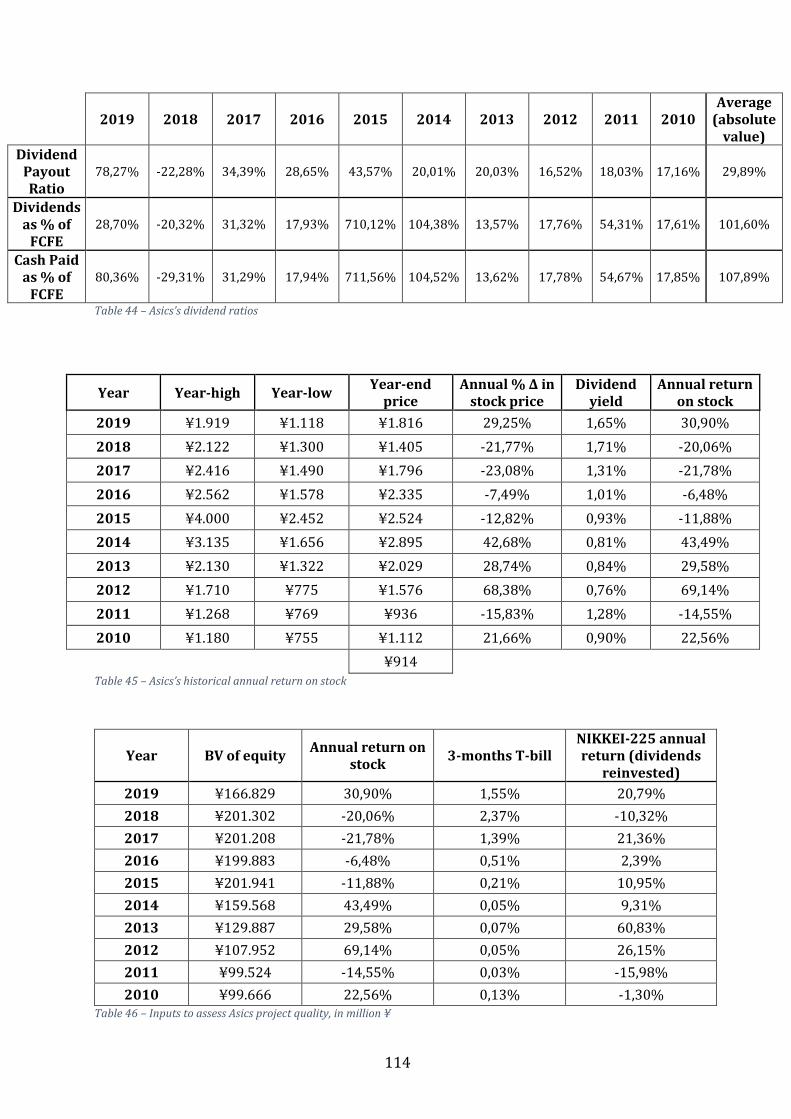
114
2019 2018 2017 2016 2015 2014 2013 2012 2011 2010 Average
(absolute value)
Dividend Payout Ratio
78,27% -22,28% 34,39% 28,65% 43,57% 20,01% 20,03% 16,52% 18,03% 17,16% 29,89%
Dividends as % of
FCFE 28,70% -20,32% 31,32% 17,93% 710,12% 104,38% 13,57% 17,76% 54,31% 17,61% 101,60%
Cash Paid as % of
FCFE 80,36% -29,31% 31,29% 17,94% 711,56% 104,52% 13,62% 17,78% 54,67% 17,85% 107,89%
Table 44 – Asics’s dividend ratios
Year Year-high Year-low Year-end
price Annual % Δ in
stock price Dividend
yield Annual return
on stock
2019 ¥1.919 ¥1.118 ¥1.816 29,25% 1,65% 30,90%
2018 ¥2.122 ¥1.300 ¥1.405 -21,77% 1,71% -20,06%
2017 ¥2.416 ¥1.490 ¥1.796 -23,08% 1,31% -21,78%
2016 ¥2.562 ¥1.578 ¥2.335 -7,49% 1,01% -6,48%
2015 ¥4.000 ¥2.452 ¥2.524 -12,82% 0,93% -11,88%
2014 ¥3.135 ¥1.656 ¥2.895 42,68% 0,81% 43,49%
2013 ¥2.130 ¥1.322 ¥2.029 28,74% 0,84% 29,58%
2012 ¥1.710 ¥775 ¥1.576 68,38% 0,76% 69,14%
2011 ¥1.268 ¥769 ¥936 -15,83% 1,28% -14,55%
2010 ¥1.180 ¥755 ¥1.112 21,66% 0,90% 22,56%
¥914 Table 45 – Asics’s historical annual return on stock
Year BV of equity Annual return on
stock 3-months T-bill
NIKKEI-225 annual return (dividends
reinvested)
2019 ¥166.829 30,90% 1,55% 20,79%
2018 ¥201.302 -20,06% 2,37% -10,32%
2017 ¥201.208 -21,78% 1,39% 21,36%
2016 ¥199.883 -6,48% 0,51% 2,39%
2015 ¥201.941 -11,88% 0,21% 10,95%
2014 ¥159.568 43,49% 0,05% 9,31%
2013 ¥129.887 29,58% 0,07% 60,83%
2012 ¥107.952 69,14% 0,05% 26,15%
2011 ¥99.524 -14,55% 0,03% -15,98%
2010 ¥99.666 22,56% 0,13% -1,30% Table 46 – Inputs to assess Asics project quality, in million ¥
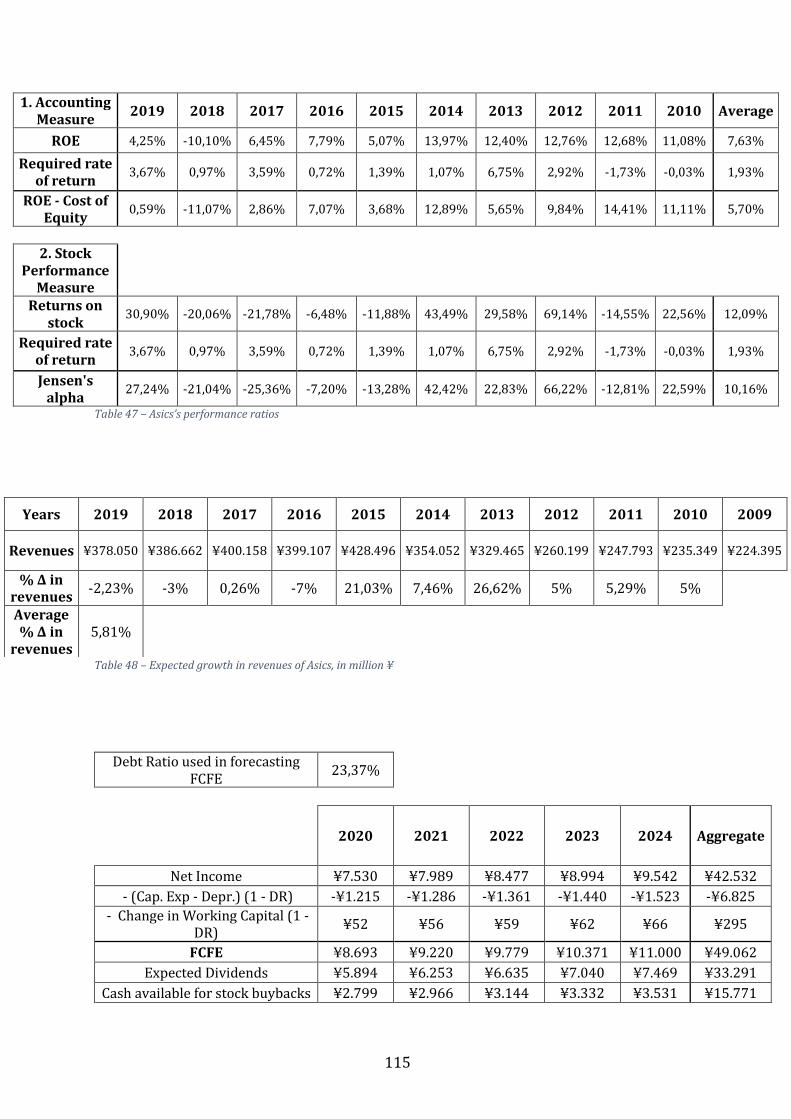
115
1. Accounting Measure
2019 2018 2017 2016 2015 2014 2013 2012 2011 2010 Average
ROE 4,25% -10,10% 6,45% 7,79% 5,07% 13,97% 12,40% 12,76% 12,68% 11,08% 7,63%
Required rate of return
3,67% 0,97% 3,59% 0,72% 1,39% 1,07% 6,75% 2,92% -1,73% -0,03% 1,93%
ROE - Cost of Equity
0,59% -11,07% 2,86% 7,07% 3,68% 12,89% 5,65% 9,84% 14,41% 11,11% 5,70%
2. Stock Performance
Measure
Returns on stock
30,90% -20,06% -21,78% -6,48% -11,88% 43,49% 29,58% 69,14% -14,55% 22,56% 12,09%
Required rate of return
3,67% 0,97% 3,59% 0,72% 1,39% 1,07% 6,75% 2,92% -1,73% -0,03% 1,93%
Jensen's alpha
27,24% -21,04% -25,36% -7,20% -13,28% 42,42% 22,83% 66,22% -12,81% 22,59% 10,16%
Table 47 – Asics’s performance ratios
Table 48 – Expected growth in revenues of Asics, in million ¥
Debt Ratio used in forecasting FCFE
23,37%
2020 2021 2022 2023 2024 Aggregate
Net Income ¥7.530 ¥7.989 ¥8.477 ¥8.994 ¥9.542 ¥42.532
- (Cap. Exp - Depr.) (1 - DR) -¥1.215 -¥1.286 -¥1.361 -¥1.440 -¥1.523 -¥6.825
- Change in Working Capital (1 - DR)
¥52 ¥56 ¥59 ¥62 ¥66 ¥295
FCFE ¥8.693 ¥9.220 ¥9.779 ¥10.371 ¥11.000 ¥49.062
Expected Dividends ¥5.894 ¥6.253 ¥6.635 ¥7.040 ¥7.469 ¥33.291
Cash available for stock buybacks ¥2.799 ¥2.966 ¥3.144 ¥3.332 ¥3.531 ¥15.771
Years 2019 2018 2017 2016 2015 2014 2013 2012 2011 2010 2009
Revenues ¥378.050 ¥386.662 ¥400.158 ¥399.107 ¥428.496 ¥354.052 ¥329.465 ¥260.199 ¥247.793 ¥235.349 ¥224.395
% Δ in revenues
-2,23% -3% 0,26% -7% 21,03% 7,46% 26,62% 5% 5,29% 5%
Average % Δ in
revenues 5,81%
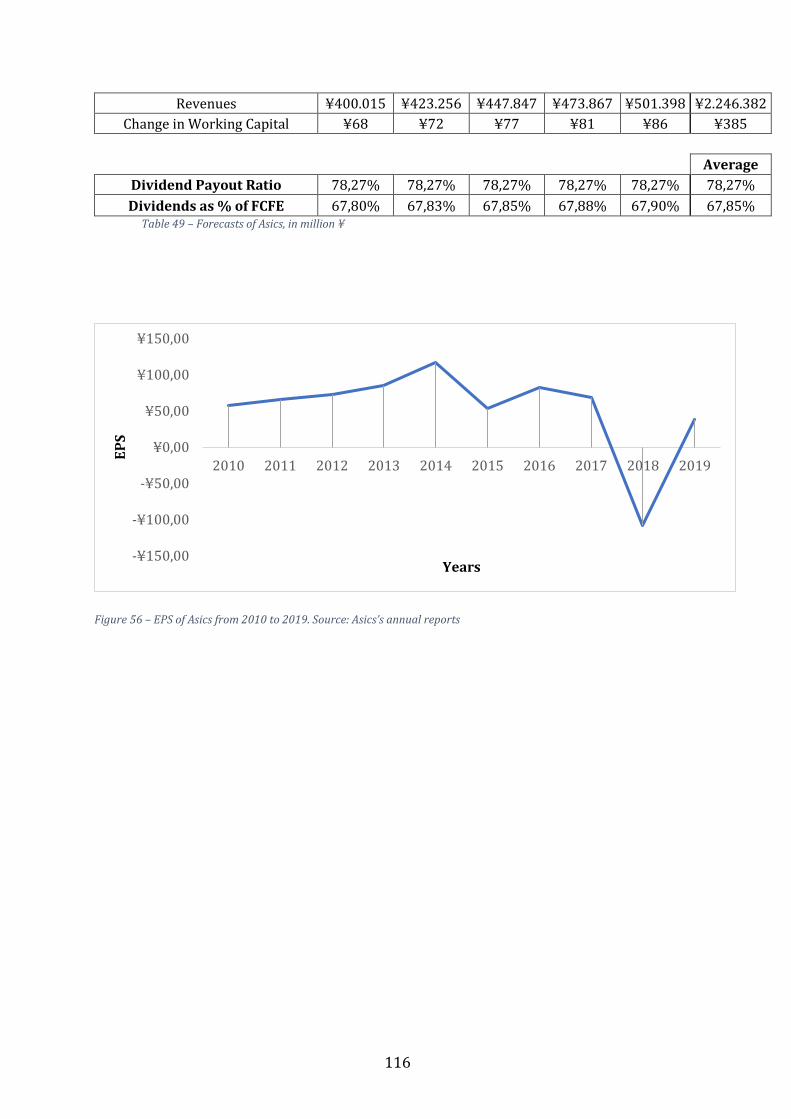
116
Revenues ¥400.015 ¥423.256 ¥447.847 ¥473.867 ¥501.398 ¥2.246.382
Change in Working Capital ¥68 ¥72 ¥77 ¥81 ¥86 ¥385
Average
Dividend Payout Ratio 78,27% 78,27% 78,27% 78,27% 78,27% 78,27%
Dividends as % of FCFE 67,80% 67,83% 67,85% 67,88% 67,90% 67,85% Table 49 – Forecasts of Asics, in million ¥
Figure 56 – EPS of Asics from 2010 to 2019. Source: Asics’s annual reports
-¥150,00
-¥100,00
-¥50,00
¥0,00
¥50,00
¥100,00
¥150,00
2010 2011 2012 2013 2014 2015 2016 2017 2018 2019
EP
S
Years
117
List of Figures
Figure 1 – Stable dividend policy: a graphical representation. EPS = earnings per share;
DPS = dividends per share. Source: www.accountingnotes.net .................................................... 8
Figure 2 – Steadily increasing dividend policy: a graphical representation. Source:
www.accountingnotes.net ........................................................................................................................... 9
Figure 3 – Constant payout (or fixed percentage) dividend policy: a graphical
representation. Source: www.accountingnotes.net ........................................................................... 9
Figure 4 – A residual dividend policy: graphical representation. Source: Watson et al.
(2016), "Corporate Finance, Principles and Practice in Europe", Pearson Education ...... 10
Figure 5 – The dividend payment procedure & its effect on stock price: a graphical
representation. Source: Damodaran A. (2004), “Applied Corporate Finance”, John Wiley &
Sons, Inc., 4th Edition ................................................................................................................................... 13
Figure 6 – A graphical representation of the fluctuations of the earnings and dividends for
companies in the S&P 500 from 1960 to 2012. Source: Damodaran A. (2004), “Applied
Corporate Finance”, John Wiley & Sons, Inc., 4th Edition .............................................................. 13
Figure 7 – The lifecycle of a firm and the dividend payout. Source: Damodaran A. (2004),
“Applied Corporate Finance”, John Wiley & Sons, Inc., 4th Edition ............................................ 15
Figure 8 – Outcome from the survey confirming Lintner’s results. Source: Brav et al.
(2005), “Payout Policy in the 21st Century”, Journal of Financial Economics, 77 ............... 15
Figure 9 – Dividends and Buybacks for S&P 500 companies ...................................................... 23
Figure 10 – Assessment matrixes .......................................................................................................... 37
Figure 11 – Geographical location of the companies in the Nike Group. Source: Orbis .... 41
Figure 12 – Nike’s revenues disaggregated by product lines. Data are taken from Nike’s
annual report of 2019 ................................................................................................................................. 41
Figure 13 – Increase in Nike’s quarterly dividend per share from 2010 to nowadays: a
graphical representation ........................................................................................................................... 45
Figure 14 – Nike’s dividend payout ratio against net income from 2010 to 2019. Net
Income displayed in million $ .................................................................................................................. 46
Figure 15 – Nike’s dividend payout ratio and a comparison with industry standards ..... 47
Figure 16 – Dividend yield of Nike: a graphical representation ................................................ 48
Figure 17 – Nike’s dividend yield and a comparison with industry standards .................... 48
118
Figure 18 – Nike's dividend ratio, average from 2010 to 2019 .................................................. 51
Figure 19 – Dividend policy assessment matrix of Nike ............................................................... 53
Figure 20 – Total cash returned assessment matrix of Nike ....................................................... 54
Figure 21 – Geographic location of the companies in Adidas AG. Source: Orbis ................. 59
Figure 22 – Adidas’s revenues disaggregated by product lines. Data taken from Adidas’s
annual report of 2019 ................................................................................................................................. 59
Figure 23 – Shareholder structure of Adidas by investor group ............................................... 60
Figure 24 – Constant payout (fixed percentage) dividend policy of Adidas: a graphical
representation ............................................................................................................................................... 62
Figure 25 – Adidas’s dividend payout ratio against net income from 2010 to 2019. Net
income displayed in million € ................................................................................................................. 63
Figure 26 – Dividend payout ratio of Adidas and a comparison with industry standards
............................................................................................................................................................................. 64
Figure 27 – Dividend yield of Adidas: a graphical representation ............................................ 65
Figure 28 – Dividend yield of Adidas and a comparison with industry standards ............. 65
Figure 29 – Dividend policy assessment matrix of Adidas ........................................................... 70
Figure 30 – Total cash returned assessment matrix of Adidas .................................................. 70
Figure 31 – Geographic location of the companies in Asics Corp. Source: Orbis ................. 75
Figure 32 – Asics’s revenues disaggregated by product lines. Data taken from Asics’s
annual report of 2018 ................................................................................................................................. 75
Figure 33 – Shareholder structure of Asics by investor group. Source: Asics official website
............................................................................................................................................................................. 76
Figure 34 – Constant payout (fixed percentage) dividend policy of Asics: a graphical
representation ............................................................................................................................................... 77
Figure 35 – Steadily increasing dividend policy of Asics: a graphical representation ...... 78
Figure 36 – Asics’s dividend payout ratio against net income from 2010 to 2019. Net
income in million ¥ ...................................................................................................................................... 79
Figure 37 – Dividend payout ratios of Asics and a comparison with industry standards 80
Figure 38 – Dividend yield of Asics: a graphical representation ............................................... 80
Figure 39 – Dividend yield of Asics and a comparison with industry standards ................ 81
Figure 40 – Asics dividend ratios: average from 2019 to 2010 in aggregate terms .......... 83
Figure 41 – Dividend policy assessment matrix of Asics .............................................................. 85
Figure 42 – Total cash returned assessment matrix of Asics ...................................................... 86
119
Figure 43 – Annual dividends per share in $: a comparison between Nike, Adidas and Asics
............................................................................................................................................................................. 90
Figure 44 – Average dividend yield from 2010 to 2019: a comparison between Nike,
Adidas and Asics ........................................................................................................................................... 91
Figure 45 – Average dividend payout ratio and average total return ratio from 2010 to
2019: a comparison between Nike, Adidas and Asics .................................................................... 92
Figure 46 – Average dividends paid as a percentage of the FCFE and average cash paid as
a percentage of the FCFE from 2010 to 2019: a comparison between Nike, Adidas and
Asics ................................................................................................................................................................... 93
Figure 47 – Assessment matrixes: a comparison between Nike, Adidas and Asics............ 94
Figure 48 – Annual earnings per share in $: a comparison between Nike, Adidas and Asics
............................................................................................................................................................................. 96
Figure 49 – Increase in Nike’s yearly dividend per share from 2010 to 2019: a graphical
representation ............................................................................................................................................... 97
Figure 50 – Stock Price of Nike from 2010 to nowadays. Source: Macrotrends .................. 97
Figure 51 – EPS of Nike from 2010 to 2019. Source: Nike’s annual report .........................103
Figure 52 – Increase in Adidas’ yearly dividend per share from 2010 to 2019: a graphical
representation .............................................................................................................................................105
Figure 53 – Adidas stock price from 01/01/2010 to 31/12/2019. Source: Adidas website
...........................................................................................................................................................................106
Figure 54 – EPS of Adidas from 2010 to 2019. Source: Adidas annual report from the
section ten-years overview, where: 2019, 2018, 2017 and 2016 figures reflect continuing
operations as a result of the divestiture of the Rockport, TaylorMade, Adams Golf,
Ashworth and CCM Hockey businesses; 2015, 2014 and 2013 figures reflect continuing
operations as a result of the divestiture of the Rockport business; finally, 2012, 2013, 2014
and 2015, net income excludes goodwill impairment losses amounting to 265, 52,78,34
(in million €) respectively. .....................................................................................................................109
Figure 55 – Asics’s stock price from 2010 to 2020. Source: Orbis ..........................................111
Figure 56 – EPS of Asics from 2010 to 2019. Source: Asics’s annual reports .....................116

120
List of Tables
Table 1 – A summary of the reasons to distribute (or not) dividends & their explanations
............................................................................................................................................................................. 22
Table 2 – A summary of the reasons to buy back shares & their explanations .................... 28
Table 3 – Key information of Nike ......................................................................................................... 40
Table 4 – Forecasts of the percentage change in the annual dividend per share of Nike
under the new proposal ............................................................................................................................. 55
Table 5 – Forecasts of the percentage change in the annual dividend per share of Nike
under the new proposal ............................................................................................................................. 57
Table 6 – Key information of Adidas AG .............................................................................................. 58
Table 7 – Adidas’s dividend ratios: averages from 2010 to 2019 ............................................. 67
Table 8 – Forecasts of Adidas under the new alternative, in million € ................................... 73
Table 9 – Key information of Asics ........................................................................................................ 74
Table 10 – Increase in the annual DPS of Asics under the new proposal ............................... 88
Table 11 – Forecasts of Asics under the new alternative, in million ¥ .................................... 88
Table 12 – Annual and quarterly dividends per share of Nike. Source: Nike’s official
website and Morningstar. Remark: the numbers have been restated to mirrors the
historical stock splits and have been rounded to the nearest thousandth ............................ 99
Table 13 – Calculations of the change in net working capital of Nike, in million $. Remark:
signs were reversed when inserted as inputs .................................................................................100
Table 14 – Inputs to estimate the FCFE of Nike, in million $ .....................................................100
Table 15 – FCFE pre-debt and after-debt of Nike, in million $ .................................................100
Table 16 – Cash returned to stockholders of Nike, in million $................................................101
Table 17 – Nike’s dividend ratios .........................................................................................................101
Table 18 – Nike’s historical annual return on stock .....................................................................101
Table 19 – Inputs to assess Nike’s project quality, in million $ ................................................102
Table 20 – Nike’s performance ratio ...................................................................................................102
Table 21 – Expected growth in revenues of Nike, in million $ ..................................................103
Table 22 – Forecasts of Nike under the current dividend policy, in million $ ....................103
Table 23 – Forecasts of Nike under the new alternative, in million $....................................104
121
Table 24 – Annual dividend per share of Adidas AG; annual DPS of 2019 is subjected to
the Annual General Meeting approval in 2020. Source: Adidas official website and Ycharts
...........................................................................................................................................................................105
Table 25 – Calculations of the change in net working capital of Adidas, in million €.
Remark: signs were reversed when inserted as inputs ...............................................................106
Table 26 – Calculations of the net debt issued of Adidas, in million €. Source: Orbis .....106
Table 27 – Inputs to estimate the FCFE of Adidas, in million € ................................................107
Table 28 – FCFE pre-debt and after-debt of Adidas, in million € ............................................107
Table 29 – Cash returned to stockholders of Adidas, in million € ..........................................107
Table 30 – Adidas dividend ratios .......................................................................................................108
Table 31 – Adidas historical annual return on stock ....................................................................108
Table 32 – Inputs to assess Adidas project quality, in million € ..............................................108
Table 33 – Adidas performance ratios ...............................................................................................109
Table 34 – Expected growth in revenues of Adidas, in million € ............................................110
Table 35 – Forecasts of Adidas, in million € ....................................................................................110
Table 36 – Annual and interim dividends per share of Asics. Source: Asics’s official website
and Morningstar .........................................................................................................................................111
Table 37 – Calculations of the CAPEX of Asics, in million ¥. Source: Ycharts and company’s
consolidated financial summary...........................................................................................................112
Table 38 – Calculations of the change in net working capital of Asics, in million ¥. Source:
Ycharts and company’s consolidated financial summary. Remark: signs were reversed
when inserted as inputs ...........................................................................................................................112
Table 39 – Calculations of the change in net working capital of Asics, in million ¥. Source:
Orbis ................................................................................................................................................................112
Table 40 – Inputs to estimate the FCFE of Asics, in million ¥ ...................................................112
Table 41 – FCFE pre-debt and after-debt of Asics, in million ¥ ................................................113
Table 42 – Cash returned to stockholders of Asics, in million ¥ ..............................................113
Table 43 – Calculations of the change in net working capital of Asics, in million ¥. Source:
Ycharts and company’s consolidated financial summary ...........................................................113
Table 44 – Asics’s dividend ratios ........................................................................................................114
Table 45 – Asics’s historical annual return on stock ....................................................................114
Table 46 – Inputs to assess Asics project quality, in million ¥ .................................................114
Table 47 – Asics’s performance ratios ...............................................................................................115
122
Table 48 – Expected growth in revenues of Asics, in million ¥ ................................................115
Table 49 – Forecasts of Asics, in million ¥ ........................................................................................116

123
Bibliography
Adidas, Annual Report 2010
Adidas, Annual Report 2011
Adidas, Annual Report 2012
Adidas, Annual Report 2013
Adidas, Annual Report 2014
Adidas, Annual Report 2015
Adidas, Annual Report 2016
Adidas, Annual Report 2017
Adidas, Annual Report 2018
Adidas, Annual Report 2019
Allen F., Michaely R. (1995), “Dividend policy”, chapter 25 of the “Handbooks in
Operations Research and Management Science”, 9
Allen F., Michaely R. (2003), “Payout policy”, chapter 7 of the Handbook “Economics of
Finance”
Asics, Annual Report 2010
Asics, Annual Report 2011
Asics, Annual Report 2012
Asics, Annual Report 2013
Asics, Annual Report 2014
Asics, Annual Report 2015
Asics, Annual Report 2016
Asics, Annual Report 2017
Asics, Annual Report 2018
124
Asics, Annual Report 2019
Asics, Consolidated Financial Summary 2010
Asics, Consolidated Financial Summary 2011
Asics, Consolidated Financial Summary 2012
Asics, Consolidated Financial Summary 2013
Asics, Consolidated Financial Summary 2014
Asics, Consolidated Financial Summary 2015
Asics, Consolidated Financial Summary 2016
Asics, Consolidated Financial Summary 2017
Asics, Consolidated Financial Summary 2018
Asics, Consolidated Financial Summary 2019
Baker H.K. (2009), “Dividends And Dividend Policy”, John Wiley & Sons
Baker H.K., Weigand R. A. (2015), “Corporate dividend policy revisited”, Managerial
Finance, 41(2)
Baker M., Wurgler J. (2004), “A Catering Theory of Dividends”, The Journal of Finance, 59
(3)
Bartov et al. (1998), “Evidence on how companies choose between dividends and open-
market stock repurchases, Journal of Applied Corporate Finance, 11 (1)
Bhattacharyya N., “Dividend policy: a review”, Managerial Finance, 33(1)
Bhattacharyya S. (1979), ‘‘Imperfect information, dividend policy, and ‘the bird in the
hand’ fallacy’’, Bell Journal of Economics, 10
Black F. (1976), “The dividend puzzle”, Journal of Portfolio Management, 2
Black F., Scholes M. S. (1974), “The effects of dividend yield and dividend policy on
common stock prices and return”, Journal of Financial Economics, 1(1)
Blume M.E. (1980), “Stock Returns and Dividend Yields: Some more Evidence”, Review of
Economics and Statistics, 62
125
Brav et al. (2005), “Payout Policy in the 21st Century”, Journal of Financial Economics, 77
Breadley R. A., Myers S. C., Allen F. (2011), “Principles of corporate Finance”, McGraw-Hill,
Irwin
Cyert R., March J. (1993), “A Behavioral theory of the firm”, Prentice Hall
Damodaran A. (2004), “Applied Corporate Finance”, John Wiley & Sons, Inc., 4th Edition
De Angelo H., De Angelo L., Skinner D.J. (1992), “Dividends and losses, Journal of Finance”,
47(5)
DeAngelo H., DeAngelo L. (1990), ‘‘Dividend policy and financial distress: an empirical
investigation of troubled NYSE firms’’, Journal of Finance, 45
Fama E.F., Babiak (1968), “Dividend Policy: An Empirical Analysis”, Journal of the
American Statistical Association, 63(324)
Frankfurter G. M. (1999), “What is the puzzle in “the dividend puzzle?”, The Journal of
Investing, 8(3)
Gordon M. J., Shapiro E. (1956), “Capital equipment analysis: the required rate of profit”,
Management Science, 3(1)
Gordon M.J. (1959), “Dividends, Earnings And Stock Prices”, The Review of Economics and
Statistics, 41(2)
Graham B., Dodd D. L. (1934), “Security analysis: principles and techniques”, McGraw-Hill
(first edition)
Grullon et al. (2002), “Are Dividend Changes a Sign of Firm Maturity?”, The Journal of
Business, 75(3)
Harkavy O., (1953), “The Relation Between Retained Earnings And Common Stock Prices
For Large, Listed Corporations”, Journal of Finance, 8 (3)
Healy P.M., Palepu G.K., 1988, “Earnings information conveyed by dividend initiations and
omissions”, Journal of Financial Economics, 21(2)
Holder et al. (1998), “Dividend policy determinants: an investigation of the influences of
stakeholder theory”, Financial Management, 27(3)
126
Jensen M. C. (1986), “Agency Costs of Free Cash Flow, Corporate Finance, and Takeovers”,
The American Economic Review, 76 (2)
Jensen M. C., Meckling W.H. (1976), “Theory of the firm: Managerial behavior, agency costs
and ownership structure”, Journal of Financial Economics, 3 (4)
Kahneman D., Tversky A. (1979), “Prospect theory: An analysis of decision under risk”,
Econometrica, 47
Keown A.J. et al (2005), “Foundations of finance: the logic and practice of financial
management” Prentice Hall
Lam K. (2014), “The Dividend Puzzle: A summary Review of Explanations”, Journal of
Finance and Investment Analysis, 3(4)
Lintner J. (1956), “Distribution Of Income Of Corporation Among Dividends, Retained
Earning And Taxes”, American Economic Review, 46(2)
Lofti T. (2019), “Dividend Policy, Signaling Theory: A Literature Review”
Miller M. H., Scholes M. S. (1982) “Dividends and Taxes: Some Empirical Evidence”, The
Journal of Political Economy, 90 (6)
Modigliani F., Miller M. H. (1961), “Dividend Policy, Growth, and the Valuation of Shares”,
Journal of Business, 34(4)
Modigliani F., Miller M. H. (1961), “The cost of capital, corporation finance and the theory
of investment”, The American Economic Review, 48 (3)
Nike, Annual Report 2010
Nike, Annual Report 2011
Nike, Annual Report 2012
Nike, Annual Report 2013
Nike, Annual Report 2014
Nike, Annual Report 2015
Nike, Annual Report 2016
Nike, Annual Report 2017
127
Nike, Annual Report 2018
Nike, Annual Report 2019
Partington G. H. (1985), “Dividend Policy and its relationship to investment and financing
policies: empirical evidence”, Journal of Business Finance & Accounting, 12(4)
Purmessur R. D., Boodhoo R. (2009), “Signalling Power of Dividend on Firms’ Future
Profits: A Literature Review”, International Interdisciplinary Journal
Ross et al. (2002), “Fundamentals of Corporate Finance”, McGraw-Hill
Séverin E., du Jardin P. (2011), “Dividend policy”, Bankers, Markets & Investors
Smith, C.W. and Watts, R.L. (1992), ‘‘The investment opportunity set and corporate
financing, dividend, and compensation policies’’, Journal of Financial Economics, 32
Walter J. E. (1956), “Dividend Policies and common stock prices”, The Journal of Finance,
11(1)
Xian M., Xing W. (2015), “Analysis of dividend policy of listed company and its financial
impacts”, Atlantis Press
128
Sitography
http://www.accountingnotes.net/financial-management/types-of-dividend-
policy/types-of-dividend-policy/17326
https://corporatefinanceinstitute.com/resources/knowledge/finance/dividend-
coverage-ratio-formula/
https://dictionary.cambridge.org/dictionary/english/dividend
https://dqydj.com/
https://edited.com/resources/activewear-market-analysis/
https://finance.yahoo.com/
https://it.reuters.com/
https://orbis.bvdinfo.com/version-2020626/orbis/1/Companies/Search
https://pestleanalysis.com/pestle-analysis-adidas/
https://www.accountingtools.com/articles/2017/5/13/liquidating-dividend
https://www.alliedmarketresearch.com/athletic-footwear-market
https://www.alliedmarketresearch.com/sports-apparel-market
https://www.grin.com/document/429698
https://www.infrontanalytics.com/
https://www.investopedia.com/ask/answers/05/stockcashdividend.asp
https://www.investopedia.com/terms/c/capitalgain.asp
https://www.investopedia.com/terms/d/dividend.asp
https://www.investopedia.com/terms/d/dividend-per-share.asp
https://www.investopedia.com/terms/d/dividendpolicy.asp
https://www.investopedia.com/terms/s/specialdividend.asp
https://www.macrotrends.net/
https://www.marketwatch.com/
https://www.nasdaq.com/articles/truth-about-dividend-payout-ratio-2012-11-07
https://www.openpr.com/news/1869505/global-sports-apparel-market-2019-swot-
analysis-top-key
https://www.researchnester.com/reports/sporting-goods-market-global-demand-
analysis-opportunity-outlook-2023/214
https://www.statista.com/
https://www.ukessays.com/essays/marketing/competition-in-the-sportswear-
industry-marketing-essay.php
