analysis of right-in, right-out commercial driveway safety
TRANSCRIPT

Clemson UniversityTigerPrints
All Theses Theses
5-2017
Analysis of Right-In, Right-Out CommercialDriveway Safety, Operations and Use ofChannelization as Compliance CountermeasureSarath Chandra GorthyClemson University, [email protected]
Follow this and additional works at: https://tigerprints.clemson.edu/all_theses
This Thesis is brought to you for free and open access by the Theses at TigerPrints. It has been accepted for inclusion in All Theses by an authorizedadministrator of TigerPrints. For more information, please contact [email protected].
Recommended CitationGorthy, Sarath Chandra, "Analysis of Right-In, Right-Out Commercial Driveway Safety, Operations and Use of Channelization asCompliance Countermeasure" (2017). All Theses. 2628.https://tigerprints.clemson.edu/all_theses/2628

ANALYSIS OF RIGHT-IN, RIGHT-OUT COMMERCIAL DRIVEWAY
SAFETY, OPERATIONS AND USE OF CHANNELIZATION AS
COMPLIANCE COUNTERMEASURE
A Thesis
Presented to
the Graduate School of
Clemson University
In Partial Fulfillment
of the Requirements for the Degree
Master of Science
Civil Engineering
by
Sarath Chandra Gorthy
May 2017
Accepted by:
Dr. Wayne A. Sarasua, Committee Chair
Dr. Jennifer H. Ogle
Dr. William J. Davis
ii
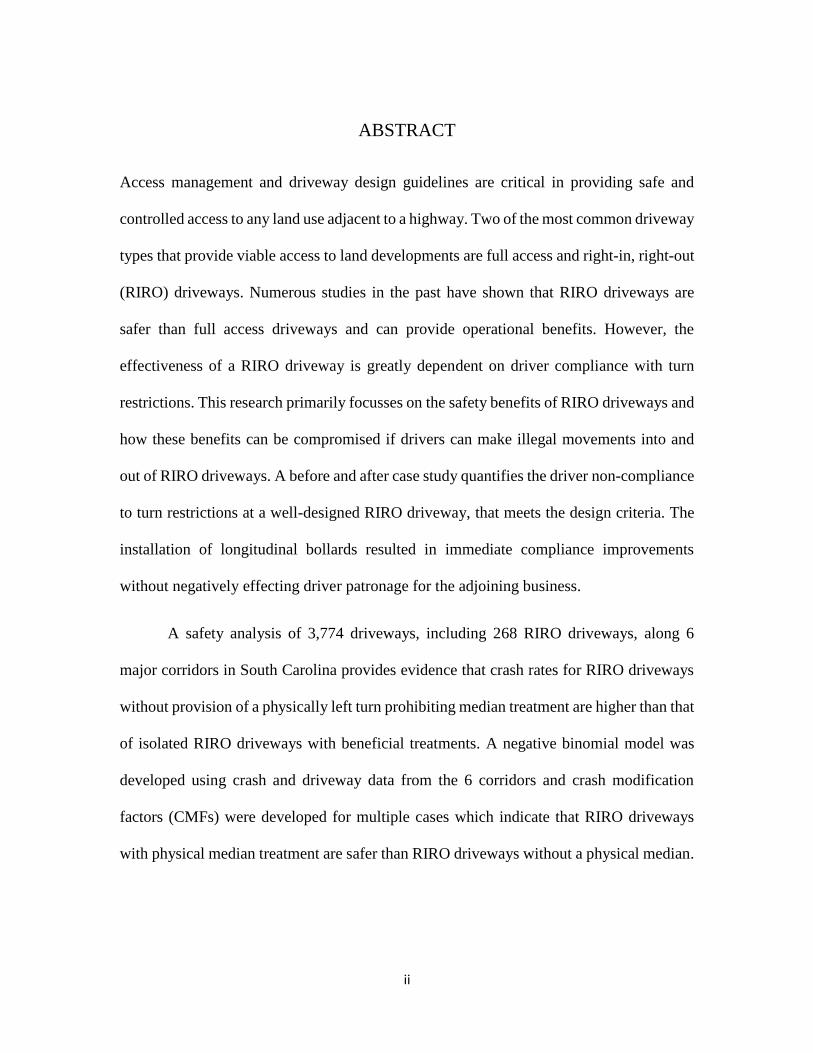
ABSTRACT
Access management and driveway design guidelines are critical in providing safe and
controlled access to any land use adjacent to a highway. Two of the most common driveway
types that provide viable access to land developments are full access and right-in, right-out
(RIRO) driveways. Numerous studies in the past have shown that RIRO driveways are
safer than full access driveways and can provide operational benefits. However, the
effectiveness of a RIRO driveway is greatly dependent on driver compliance with turn
restrictions. This research primarily focusses on the safety benefits of RIRO driveways and
how these benefits can be compromised if drivers can make illegal movements into and
out of RIRO driveways. A before and after case study quantifies the driver non-compliance
to turn restrictions at a well-designed RIRO driveway, that meets the design criteria. The
installation of longitudinal bollards resulted in immediate compliance improvements
without negatively effecting driver patronage for the adjoining business.
A safety analysis of 3,774 driveways, including 268 RIRO driveways, along 6
major corridors in South Carolina provides evidence that crash rates for RIRO driveways
without provision of a physically left turn prohibiting median treatment are higher than that
of isolated RIRO driveways with beneficial treatments. A negative binomial model was
developed using crash and driveway data from the 6 corridors and crash modification
factors (CMFs) were developed for multiple cases which indicate that RIRO driveways
with physical median treatment are safer than RIRO driveways without a physical median.

iii
DEDICATION
I dedicate this thesis to my parents, Swarajya Lakshmi and Bhaskara Murthy Gorthy,
whose kindness, unconditional love and humble ways have taught me the right approach
in life and will always be a constant source of inspiration to me. I am truly thankful to them
for their support and care in moulding me into what I am today.

iv
ACKNOWLEDGMENTS
Firstly, I would like to express my sincere thanks to my advisor, Dr. Wayne Sarasua, who
has given me this opportunity and has supported, motivated and mentored me for the past
2 years. It has been a privilege to work under his guidance and I will always cherish his
leadership and dedication towards the students. I would like to thank my thesis committee
members, Dr. Jennifer H. Ogle and Dr. William J. Davis, for their guidance,
encouragement and feedback throughout this research.
I would like to thank South Carolina Department of Transportation (SCDOT) for their
cooperation and assistance in making this research possible.
I would like to thank my parents for their patience and support during this thesis. I would
also like to thank the students and staff at Glenn Department of Civil Engineering, Clemson
University for making my stay at Clemson very exciting and educative. I would like to
thank Dr. Kweku Brown and Drew Stokes for providing me the technical inputs that helped
me in completing this thesis.
Lastly, I would like to thank Clemson ITE Chapter for helping me with data collection for
the case study.
Even though care was taken to acknowledge all the personnel who helped me throughout
this thesis, there could be a few contributions that are not mentioned. I would like to express
my deepest gratitude to all whom I might have missed.

v
TABLE OF CONTENTS
Page
TITLE PAGE .................................................................................................................... i
ABSTRACT ..................................................................................................................... ii
DEDICATION ................................................................................................................ iii
ACKNOWLEDGMENTS .............................................................................................. iv
TABLE OF CONTENTS ................................................................................................. v
LIST OF TABLES ........................................................................................................ viii
LIST OF FIGURES ........................................................................................................ ix
CHAPTER
I. INTRODUCTION ........................................................................................... 1
Introduction and Problem Statement ........................................................ 1
Research Objective ................................................................................... 3
Benefits of this Research .......................................................................... 4
Thesis Organization .................................................................................. 4
vi
Table of Contents (Continued)
Page
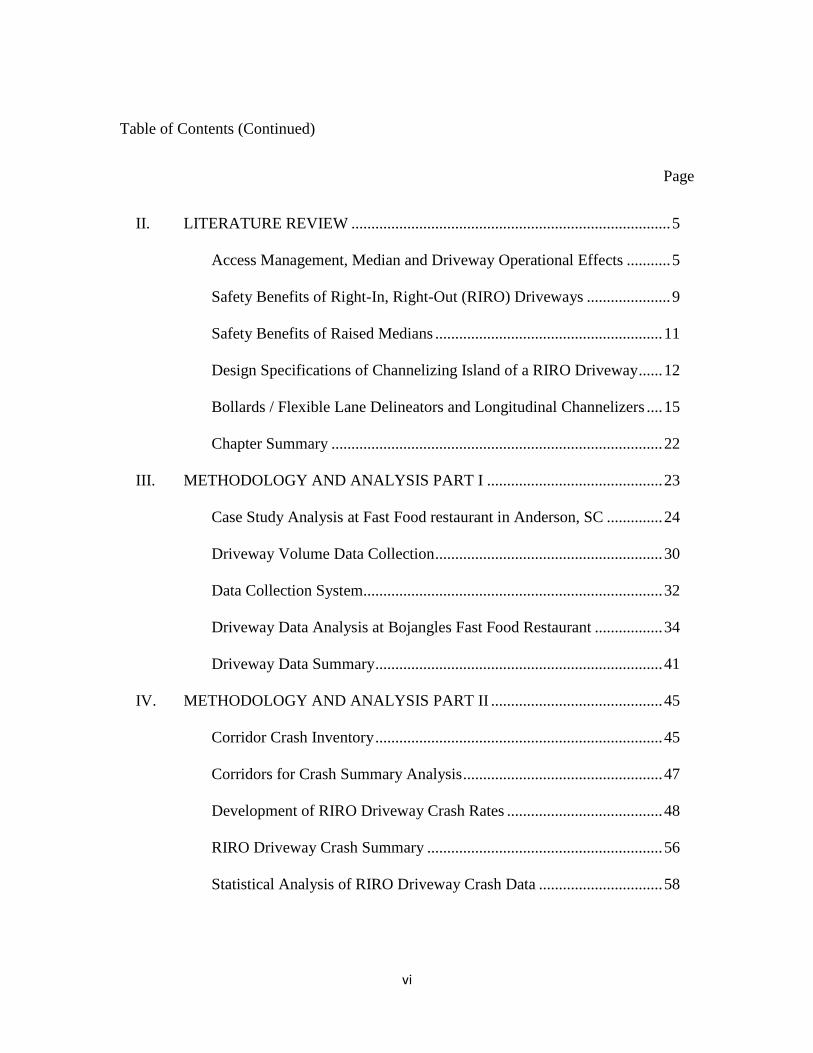
II. LITERATURE REVIEW ................................................................................ 5
Access Management, Median and Driveway Operational Effects ........... 5
Safety Benefits of Right-In, Right-Out (RIRO) Driveways ..................... 9
Safety Benefits of Raised Medians ......................................................... 11
Design Specifications of Channelizing Island of a RIRO Driveway ...... 12
Bollards / Flexible Lane Delineators and Longitudinal Channelizers .... 15
Chapter Summary ................................................................................... 22
III. METHODOLOGY AND ANALYSIS PART I ............................................ 23
Case Study Analysis at Fast Food restaurant in Anderson, SC .............. 24
Driveway Volume Data Collection ......................................................... 30
Data Collection System........................................................................... 32
Driveway Data Analysis at Bojangles Fast Food Restaurant ................. 34
Driveway Data Summary ........................................................................ 41
IV. METHODOLOGY AND ANALYSIS PART II ........................................... 45
Corridor Crash Inventory ........................................................................ 45
Corridors for Crash Summary Analysis .................................................. 47
Development of RIRO Driveway Crash Rates ....................................... 48
RIRO Driveway Crash Summary ........................................................... 56
Statistical Analysis of RIRO Driveway Crash Data ............................... 58

vii
Table of Contents (Continued)
Page
V. RESULTS AND DISCUSSIONS .................................................................. 67
Negative Binomial Model Results .......................................................... 67
Development of Crash Modification Factors .......................................... 75
VI. CONCLUSIONS AND RECOMMENDATIONS ........................................ 78
REFERENCES .............................................................................................................. 81

viii
LIST OF TABLES
Table Page
3.1: SCDOT Driveway Classification based on number of trips generated .................. 26
3.2: Driveway Design Specifications Satisfied by the RIRO ........................................ 28
3.3: Morning/AM (7:00 am - 8:30 am), RIRO Driveway Traffic Counts ..................... 42
3.4: Afternoon (11:30 am - 1:00 pm), RIRO Driveway Traffic Counts ........................ 42
3.5: AM and Afternoon FA Driveway Traffic Counts & Total Site Traffic .................. 43
4.1: Ranking of 11 Corridors ......................................................................................... 47
4.2: Summary of Right-In, Right-Out Crashes .............................................................. 58
4.3: Driveway Attributes and Input Codes .................................................................... 61
5.1: Negative Binomial Estimation Results – Summary ............................................... 67
5.2: Negative Binomial Estimation Results – Half Buffers (All RIROs) ...................... 68
5.3: Negative Binomial Estimation Results – Full Buffers (All RIROs) ....................... 69
5.4: Negative Binomial Estimation Results – Half Buffers (Raised Median) ............... 72
5.5: Negative Binomial Estimation Results – Full Buffers (Raised Median) ................ 72
5.6: Negative Binomial Estimation Results – Half Buffers (Non-Raised Median) ....... 73
5.7: Negative Binomial Estimation Results – Full Buffers (Non-Raised Median) ........ 74

ix
5.8: Negative Binomial Estimation Results (RIROs) .................................................... 75

x
LIST OF FIGURES
Figure Page
2.1: Types of turn restrictions similar to a RIRO........................................................... 13
2.2: 3 Types of Tubular Markers (source: www.trafficwks.com) ................................. 17
2.3: Design specifications of a Tubular Marker............................................................. 18
2.4: Longitudinal Bollards at New Spring Church, Clemson, SC ................................. 19
2.5: Bollards displaced at New Spring Church, Clemson, SC ....................................... 19
2.6: FG 300 Interstate Grade Curb System .................................................................... 20
2.7: Qwick Kurb System ................................................................................................ 21
2.8: Quick Curb System ................................................................................................. 21
3.1: RIRO Driveway connecting to SC State Route 81 ................................................. 25
3.2: Full Access Driveway connecting to Financial Boulevard ..................................... 25
3.3: Case study site schematic ....................................................................................... 29
3.4: Case study site location and major highways in the vicinity .................................. 30
3.5: Bollard Installation and Analysis Period ................................................................ 31
3.6: Camera Setup .......................................................................................................... 33
3.7: Data Collection System .......................................................................................... 33

xi
3.8: Coverage of Video Data from the ANART cameras .............................................. 34
3.9: Typical Right Turn Entry Movement ..................................................................... 35
3.10 Typical Right Turn Exit Movement ....................................................................... 35
3.11: Typical Left Turn Entry Movement ...................................................................... 36
3.12: Typical Left Turn Exit Movement ........................................................................ 36
3.13: Bollard segment relative to driveway ................................................................... 38
3.14: Typical Left Turn Entry Movement ...................................................................... 40
3.15: Typical Left Turn Exit Movement ........................................................................ 41
4.1: Map of 11 corridors ................................................................................................ 46
4.2: A FA Driveway (Top) and Attributes Associated (Bottom)................................... 50
4.3: Travelway Buffer .................................................................................................... 51
4.4: Travelway Buffer Correction .................................................................................. 52
4.5: Full-access and RIRO driveway buffers ................................................................. 53
4.6: Three Scenario Possible with Half Buffer Overlay ................................................ 55
4.7: Crash Rates by Year for Driveways (2011 - 2014) ................................................ 57
4.8: Crash Rates for Driveways after removing overlapped Crashes ............................ 57
5.1: R Output for Negative Binomial Model for Raised Medians (Full Buffer) ........... 71

1
CHAPTER ONE
INTRODUCTION
1.1. Introduction and Problem Statement
Commercial driveways are commonly found along various functional classes of
highways, among which, major and minor arterials are significant in terms of volumes. The
application of access management principles and driveway design guidelines is critical in
providing a safe and controlled access to commercial driveways that are adjacent to
highways. The most commonly used types of driveways in the United States are Full
Access and Right-In, Right-Out only (RIRO). The intent of this research is to evaluate the
access control treatments for RIRO commercial driveways and its adjacent streets. As per
the National Cooperative Highway Research study on geometric design of driveways (1),
left turn entry or exit movements comprise 70 percent of the observed driveway crashes.
In the recent years, there has been a greater emphasis on the reduction of driveway crashes
due to left-turning movements, though a variety of access management strategies, often
placing turn restrictions at high-risk locations.
Use of raised median treatments along roadways is one of the most effective means
to regulate driveway access, resulting in overall safety improvement through removal of
left turning vehicles. This has been studied in the past through numerous research studies.
Research by Florida DOT determined that making U-turn at a median opening along a bust
multilane highway is 25% safer than a direct left turn from a side street or other access
point (2). However, retrofitting raised medians along urban and suburban roadways with

2
established commercial land use is often costly and raises concerns from businesses that
depend on pass-by traffic (especially high turnover gas stations, convenient stores and fast-
food restaurants). The business owners generally fear that added restrictions, due to access
management treatments, will result in adverse consequences. These concerns include many
misperceptions of business owners regarding economic indicators such as property values,
gross sales, changes in available parking spaces or employees, and accessibility (3).
Along busy multilane highways, use of RIRO commercial driveways can provide
viable access management treatments to address traffic safety and operational concerns. A
RIRO driveway only permits vehicles to enter or exit through right turn maneuvers and is
intended to eliminate left turn movements of vehicles to enhance safety. This is usually
done through supplementing the driveway with a raised median island and separating the
two directions of traffic flow along the road adjacent to the driveway using a raised median.
At locations without raised medians, RIRO driveways may experience compliance issues
with drivers making illegal left turns, even when raised channelizing islands are provided.
Providing a raised median for highways may be difficult at several locations due to
restriction for the roadways’ cross-sectional width, construction issues and raising
concerns for business owners As the effectiveness of a RIRO driveway is greatly dependent
on the driver compliance with turn restriction, this necessitates the use of alternate means
to address compliance issues.
A RIRO driveway is usually supplemented with regulatory signs that preclude
specific illegal left turn maneuvers. However, these signs are often ignored by drivers and
a significant number of non-compliant movements are usually produced. The presence of
3
a physical restraint may be required to ensure driver compliance and realize the safety
benefits of a right-in, right-out only commercial driveway configurations, at the fullest
potential.
1.2.Research Objectives
The focus of this research is to evaluate RIRO driveways with emphasis on design
configuration, traffic volumes, regulatory compliance, and safety. Of particular concern is
a comparison between RIRO driveways that have a physical median or barrier and RIRO
driveways that do not. The hypothesis is that a lack of a physical median will result in
driver noncompliance regardless of design which in turn compromises safety. The primary
objective will be to quantify how safety is compromised. Other objectives will be:
to quantify the compliance improvement attained through installing flexible
delineators, by comparing the violations before and after the installation for a case
study; and
to study the impact of a physical longitudinal delineator on driveway volume by
conducting a before and after case study at a commercial driveway
The major tasks for achieving the objectives will be to conduct: 1) a literature review of
the safety effects of RIRO driveways and the use of longitudinal delineators; 2) a before
and after case study of a commercial site location with added channelization safety
countermeasures in the form of flexible travel lane delineators/bollards; and 3) a statistical
safety analysis of driveways in South Carolina along selected corridors to quantify the the
benefits of having physical barriers associated with RIRO driveways..

4
1.3. Benefits of this Research
It is anticipated that the findings of this research will lead to a better understanding of
the safety benefits of alternative RIRO driveway configurations. Crash modification
factors developed as part of the statistical analysis should be useful to decision makers
responsible for choosing a RIRO driveway configuration.
1.4. Thesis Organisation
This thesis is organised into 7 chapters. Chapter 2 contains the survey of existing literature
related to access management, safety and operational benefits of right-in, right-out
driveways, raised medians, driveway geometric design specifications, and characteristics
of longitudinal channelizing devices. Chapter 3 presents the before and after case study of
a longitudinal bollard installation and summarizes driver non-compliance improvements
after installation. Also, potential safety issues resulting from a well-designed RIRO
driveway, without physical restriction are discussed in this chapter. Chapter 4 contains the
analysis of 3,774 driveways, including 268 RIRO driveways along 6 major corridors in
South Carolina. The chapter summarises the crash rates experienced by RIRO driveways
with and without median treatments. Additionally, Chapter 4 includes a negative binomial
regression model for various driveway attributes, including driveway type (RIRO with and
without raised median and Full Access). The results of the analysis are summarised in
Chapter 5, along with the crash modification factors for converting full access driveways
to different classes of RIRO driveway (with and without raised median). Finally, the
conclusions and recommendations for future research are concluded in Chapter 6.

5
CHAPTER TWO
LITERATURE REVIEW
The application of access management principles, to address safety issues and
enhance traffic flow, has increased in the recent years. A significant amount of research
has been done to emphasize the safety issues associated with a direct left turn (DLT) into
and out of driveways along high volume roadways. The safety and mobility benefits of a
Right Turn, U-Turn (RTUT) movements over DLTs have been studied in the past and
results indicate that the crash rates are lower at driveways that restrict left turn movements.
The literature review section summarises the previous research on access management and
the median and driveway operational effects, alongside the design specifications, safety
benefits and non-compliance issues of a right-in, right-out only driveway. The discussion
also includes previous research on the use of longitudinal delineating devices and the
studies conducted on driveways which have a RIRO supplemented by a full access
driveway.
2.1. Access Management, Median and Driveway Operational Effects
In a research sponsored by Texas Department of Transportation, Eisele (4)
conducted micro-simulation using VISSIM on three field test corridors and three
theoretical corridors to investigate the operational impacts (travel time, speed and delay).
The results indicated that on two of the three test corridors, replacing a Two Way Left Turn
Lane (TWLTL) with a raised median resulted in an increase in travel time and a decrease
in travel time on the other test corridor. Simulation results suggested small increases in

6
travel times using raised median treatments compared to TWLTL conditions. In the same
research, based on a detailed crash analysis on 11 test corridors, it was observed that crash
rate increases with access point density, regardless of the median type. Also, a reduction in
crash rate was found for all the test corridors which were investigated before and after
installing a raised median.
Zhou (5) conducted field studies to quantify the operational impacts of replacing
U-turns as alternatives to direct left turns (DLT) from driveways, at eight sites in Tampa
and Clearwater areas of Florida. Delay and travel-time models were developed for DLT
and right turn plus U-turn (RTUT), as a function of major and minor road traffic flow rates.
In addition, operations models were used to measure system performance of a full median
opening versus a directional median opening at a weighted-average total delay standpoint.
The results indicated that U-turns have better operational performance than DLTs under
certain traffic conditions, implying that directional median opening designs provide more
efficient traffic flow compared to full median opening. The study also indicated that RTUT
provides better safety in terms of traffic conflicts and fewer effects on through traffic of
the major road.
In another study by Liu (6), the operational effects of using U-turns as an alternative
to direct left turns (DLT) from driveways, were quantified along 34 roadway segments in
central Florida. The delay and travel times of DLTs, right turn plus U-turn (RTUT) at
median openings and RTUT at signalised intersections were compared, under different
levels of driveway volume and major road through volume. The results indicated that the
vehicles making a RTUT at a downstream median opening, before a signalised intersection,

7
have comparable total travel times with the vehicles making DLTs at driveways. The study
also concluded that the percentage of drivers selecting RTUT increases with the upstream
through traffic, left turn volume from major road to driveway and total left turn demand at
driveways.
The operational performance of DLT and right turn plus U-turn (RTUT) have been
evaluated through simulation of a field study, conducted on six sites by Yang and Zhou
(7). The traffic conditions under which replacing a DLT with RTUT would be beneficial
from operational point of view, were studied using a combination of FRESIM and
NETSIM. The delay and travel times were used as measures of effectiveness (MOE) at
different levels of traffic volumes. Results indicated that, with an increase in the through
traffic volume of the major road, the delay and travel time of direct left turns were higher
than those of right turn plus U-turn.
In a research sponsored by Texas Department of Transportation, Qi (8) studied the
design issues related to raised medians and alternative movements, namely restricted
crossing U-turns (RCUTs), median U-turns (MUTs) and continuous flow intersections
(CFIs). The results identified some critical design issues in application of raised medians.
A set of implementation-oriented guidelines were developed focusing on applicability,
geometric design, and access management of these three alternative movements, as
follows:

8
On roadways with narrow medians and high driveway densities, a median opening
within the influence area (queue length) of a signalised intersection increases the safety
issues related to the raised medians.
Restricted crossing U-turn (RCUT) improved mainline traffic operation while
compromising side street traffic operation.
Substandard median turn lanes could result in significant total delays, is used
consistently along a road.
Converting full median opening into directional opening, reduced the crossing conflict
points significantly.
Lu (9) conducted studies on evaluating the impacts of offset distance between
driveways and the downstream U-turn locations (median opening or signalised
intersection) on the safety and operational performance of vehicles making a RTUT
movement. 4 different roadway conditions were considered, including 4-lane and 6-lane
divided roadways with U-turns at median openings and at signalised intersections. Crash
data, conflict analysis and operations analysis were used for field measurements from 68
sites, located in the Tampa Bay area in Florida. Additionally, crash history of 192 roadway
segments was investigated. The results showed that crash rate and conflict rate at weaving
sections decrease with an increase in the offset distance between driveways and the
downstream U-turn locations.
The studies done in the past collectively support the implication that vehicles exiting
driveways making a right turn, followed by a U-turn are relatively safer than vehicles

9
making direct left turns movements. In addition, these studies have suggested that delay
and travel time of indirect left turn movements (RTUT) is not significantly higher than a
direct left turn movement, if a median opening is provided in advance of downstream
intersections to facilitate U-turn movements. According to Highway Safety Manual (10),
Two Way Left Turn Lanes (TWLTLs) should only be used at locations where the right of
way limitations are present and channelization can be provided to constrain the drivers
from making uncontrolled left turns.
2.2. Safety Benefits of Right-In, Right-Out (RIRO) Driveways
The studies conducted by Box (11) on 1350 driveways in three suburban
communities of Chicago, Illinois, have determined that the left turn entry movement is
responsible for one-half of the total driveway crashes. The proportion of accidents by
movement have been summarised for each of right and left turning entry and exit
movements. The study indicated that the total driveway crashed attributed to left turn entry
vehicles account for 43 to 78 percent of the total driveway crashes and the left turn exiting
vehicles accounted for 14 to 32 percent of total driveway crashes. The study also found a
57 percent reduction in driveway left turn entry accidents after installing a two way left
turn lane (TWLTL) and suggested to either restrict or provide for left turn entry movements
to the degree possible. For locations without a turn lane along the roadway for driveway
traffic, this research indicated a 25 percent reduction in left turning vehicles at driveways
when a TWLTL was provided.

10
Research by Stokes (12), which included 9000 driveways along 11 major corridors
in South Carolina showed that converting full access driveways into right-in, right-out only
driveways along the roadways, reduce the crashes by 55%. Other key finding indicates that
the driveways within 150 feet of an intersection have nearly twice the crash frequency of
driveways that are 150 feet to 300 feet from an intersection. From the driveways analysed
in the research, it was concluded that the expected number of crashes for a full-access
driveway are more than double that of a right-in, right-out driveway, for higher turnover
land uses like fast-food restaurants and gas stations.
In a study to numerically analyse various driveway and median configurations,
Dixon (13) used a risk assessment method to evaluate conflicts for various driveway
configurations using a 55mph severe crash condition as a base comparison crash. A risk
assessment index was developed though an expected gap analysis procedure using vehicle
velocity, perception-reaction time, probability and volumes. The research findings indicate
that the full access driveways (provided with a median opening) have nearly 10 times
greater risk compared to that of right-in, right-out only driveways (provided with a
controlled median).
Zhou studied the impact of cross-section related design elements on crash severity,
crash type and the driver gap acceptance for turning maneuvers at urban arterial
commercial driveway locations using data from corridor sites in Oregon, Arkansas and
Oklahoma. Using crash data, traffic data and roadway information, supplemented by traffic
interaction videos, the research conducted gap acceptance studies to determine critical gaps
for driveways located along arterial roads. The results of the gap analysis indicated that

11
driveway locations with raised medians experienced lower critical gap values than
driveways with median openings. Additionally, a simulation analysis in CORSIM
examined the influence of median type, traffic volume and access point density on traffic
operational performance, which analysed 60 hypothetical driveways with aligned
configuration. The simulation results suggested that the delay and travel times of corridors
for raised median scenario is significantly lower than those of a two way left turn lane
(TWLTL) for aligned driveway configuration and are close for staggered driveway
configuration. Furthermore, the study implies that the removal of left-turning vehicles
enables drivers to focus more directly on approaching vehicles from the left, resulting in
beneficial shorter critical gap values for right-turn maneuvers exiting from driveways.
2.3. Safety Benefits of Raised Medians
All the driveways which are along a road with a continuous raised median are
inherently RIRO driveways. Research in the past has indicated the fact that roadways with
a raised median usually have lower crash rates compared to roadways with a two way left
turn lane, other types of medians or without a raised median separating the opposing traffic
flows. Gattis (15) studied the crash rates, travel times and other attributes of three urban
street segments by comparing them, which have different levels of access control along
them. All the three segments studied have roughly the same lengths, traffic conditions and
similar commercial development lined along their sides. Additionally, all the three sections
have four through lanes and relatively level grades. The relationship between crash rates
and types of medians, categorized into roadways with no median, roadways with
occasional left-turn lanes, roadways with two-way left turn lanes and roadways with raised

12
or depressed medians, was developed. The study concluded that the raised or depressed
medians generally had higher travel time but lower crash rates compared to the other two
segments. The research also indicated that the better operational performance of the
segment with raised median was not due to excessive speeds but due to elimination in
causes of delay, such as major street vehicles slowing down for the vehicles turning off or
into the through street from driveways.
In similar research, Mauga and Kaseko (16) have evaluated and quantified the
impact of mainly two types of medians, namely raised medians and two-way left turn lanes,
on traffic crashes in the midblock sections of roadways. Other access management
attributes like traffic signal spacing, driveway density, median opening, and un-signalised
crossroads were considered. The results showed that segments with a raised median had
lowered the crash rate by 23% compared to segments with a two-way left turn lane. The
higher densities of driveways and median opening resulted in higher crash rates and
severity. For segments with raised medians, each additional median opening per mile
resulted in 4.7% increase in the total crash rate.
2.4. Design Specifications of Channelizing Island of a RIRO Driveway
Among the various types of right-in, right-out only driveways, one of the most common
type includes a raised island to channelize the traffic entering and exiting driveway and
provides adequate signage and pavement markings. The following are some of the classes
of RIRO driveways:
1. Painted Island

13
2. Raised Island
3. Painted Median (Double-Double Yellow)
4. Raised Median
NCHRP Report No. 659 states that driveway triangular islands (pork chops) are
provided in the driveway entry throat at driveway intersection with the adjacent street. The
purpose of a triangular island is to channelize right turns, discourage or prohibit left turn
entry and exit movements and prohibit refugee for pedestrians. Figure 2.1 depicts three
types of driveways which use triangular islands to discourage left-turn movements. A right-
in, right-out only driveway discourages the left running movements both entering and
exiting the driveway.
Examples of the geometric configurations of right in right our driveways that are
followed in some states are as follows: Florida DOT does not use driveway triangular
islands on undivided roadways. Lakewood, Colorado uses a 40 foot by 18-foot island (with
an area of 360 sq. feet), where all the left turning movements are prohibited (1).
Figure 2.1: Types of turn restrictions similar to a RIRO

14
Different geometric configurations exist as the design guidelines for a triangular
raised median island of a RIRO driveway. Some of the key design guidelines are provided
by South Carolina Access and Roadside Management Standards (SC ARMS) and
American Association of State Highway and Transportation Officials (AASHTO) Green
Book titled, ‘A Policy on Geometric Design of Highways and Streets’.
2.4.1. Design Specifications of SC ARMS:
Minimum Area of Concrete Island = 100 sq. feet (without pedestrian accommodation)
Minimum length of each side after rounding for corners = 12 feet
Minimum offset of the concrete island from the edge of the travel way = 4 feet (for a
road with curb and gutter)
In addition, a typical RIRO driveway island has the following design features:
A throat length of 40 feet from the edge of the travel way
Minimum angle of intersection of driveway with the adjacent highway should be
greater than 70 degrees
A 24’’ solid white Stop Bar in the exit side of the driveway
A throat width (driveway width) of 28 feet for a driveway with single lane for each of
entering and exiting vehicles
2.4.2. Design Specifications of MUTCD:
The vehicles exiting the driveway must be provided with a STOP sign followed by NO
LEFT TURN sign consequently on edges of the triangular island

15
The vehicles entering the driveway must be provided with a KEEP RIGHT sign on the
edge at the beginning of the RIRO driveway
The height of a roadside sign or sign on median should be a minimum of 7 feet for
business, commercial or residential areas
The minimum lateral offset provided for a roadside sign is 2 feet
2.4.3. Design Specifications of AASHTO:
Minimum Area of Concrete Island = 100 sq. feet for urban areas (However, 100 sq.
feet is preferred)
Minimum length of each side of a triangular island = 12 foot (14 feet preferable)
Most commonly used height of curb = 150 mm (6 inches)
While the guidelines provide the geometric features of an adequate island, the traffic
engineer designing the driveway can adjust some features under proper authorisation. The
island must be made sufficiently large to attract attention of the drivers and the curbed
islands, leading into and out of driveways, are common in urban streets.
2.5. Bollards / Flexible Lane Delineators and Longitudinal Channelizers
In some cases, the raised island and the other physical features directing the drivers
to make a right turn into and out of driveways are supplemented with a raised median along
the roadway. In the presence of a raised median the drivers can make no illegal turns, given
the median openings and signalised intersections are spaced at a significant distance from
the driveway.

16
However, some of the RIRO driveways cannot have their adjacent major streets
provided with a raised median, due to right-of-way issues. In such a case, there is a
significant number of vehicles that make illegal movements entering and exiting the
driveway, i.e., left-in and left-out. In such cases, longitudinal bollard / flexile lane
delineators can be used to restrict the illegal left turn movements.
Flexible lane delineators/bollards and longitudinal channelizers are commonly used
to guide the drivers horizontally and can be effective for speed-reduction or traffic calming
(17). These devices when used in conjunction with other speed reducing devices, can
reduce injury accidents by 25%. Flexible bollards are cost effective and can withstand
vehicle impacts, however, placement needs should not impede with the normal functioning
of the traffic. Figure 2.2 shows an example of the common types of flexible delineator
posts, namely tubular markers. The flexible delineators are designed to withstand impacts
from vehicles by transferring the stress from impact point to the base.
As per NCHRP Report 350, the length of the segment, excluding end anchorage
devices should be at least three times the length of deformation predicted in impact, but
not less than 30 meters for flexible barriers (such as a metal beam and post roadside
barriers.

17
Figure 2.2: 3 Types of Tubular Markers (source: www.trafficwks.com)
The MUTCD specifications for tubular markers as follows:
Shall have a minimum length of 450 mm (18 inches) and a width of 50 mm (2 inches)
(Standard)
Shall be made of a material that can be stuck without causing damage to the
impacting vehicle (Guidance)
Tubular markers shall be attached to the pavement to display the minimum width (2
inches) to the approaching road users (Standard)
Tubular markers should only be used where space restrictions do not allow for the use
of other more visible devices (Guidance)
Figure 2.3 depicts the MUTCD design specifications two types of tubular markers that are
used for flexible longitudinal delineation.

18
Figure 2.3: Design specifications of a Tubular Marker
Channelizers must not be used in excess to avoid the risk of loss in effectiveness as
a speed-reducing device, as indicated in research by to Jurgita (17). In another study, Zhou
has evaluated the safety and economic performance of two types of longitudinal
channelizer’s treatments. One of the treatments evaluates a conversion from full median
opening to directional median opening and the other evaluates conversion from full median
opening to left in only median opening. Results determined that the longitudinal
channelizers can reduce the left-turn crashes by 60% and 45% for conversion to directional
and left-turn in only median treatments, respectively.
The longitudinal bollards presented in this chapter, even though effective as
delineation devices, can be damaged due to vehicle impact or wear out over time. Figure
2.4 shows a location with well-designed isolated RIRO driveway at New Spring Church,
supplemented with longitudinal bollards on US 123 in Clemson, SC. It can be observed
that the bollards are displaced from their actual position and the large gap thus formed

19
allows the drivers to make left turn maneuvers without much difficulty. This can be seen
in Figure 2.5. The images pertain to March 30, 2017.
Figure 2.4: Longitudinal Bollards at New Spring Church, Clemson, SC
Figure 2.5: Bollards displaced at New Spring Church, Clemson, SC

20
There are several other devices in the market that can provide longitudinal delineation at
an isolated RIRO driveway like bollards. They could be more effective in terms of
restricting the drivers from making left turn maneuvers at RIRO driveways. Some of the
examples are interstate grade curb system, qwick kurb and road quick curb. An interstate
grade curb system is depicted in Figure 2.6. An interstate grade curb system provides
channelization on interstates, toll-ways and city streets and other functional classes of
highways as lane separation devices.
Figure 2.6: FG 300 Interstate Grade Curb System
(Source: http://www.pexco.com)
Figure 2.7 depicts a qwick kurb system used as a channelization device and provides a
raised curb system unlike the longitudinal bollards. Similarly, Figure 2.8 shows road quick
curb used to channelize traffic with portable delineation devices.

21
Figure 2.7: Qwick Kurb System
(Source: http://www.qwickkurb.com)
Figure 2.8: Quick Curb System
(Source: www.alibaba.com)

22
2.6. Chapter Summary
The literature of a number of studies is in agreement that restricting left turn
movements at driveways enhances safety and operational aspects of driveways. Most of
the literature regarding restricting left-turn movements focuses on physical medians. Little
discussion was found that mentioned non-compliance at RIRO driveways without median
which is a focus of this thesis.
The chapter does provide driveway design guidelines and specifications in term of
geometric design, signage and pavement markings that can be used to RIRO driveways.
These guidelines will be used to determine if the case study driveways conforms to design
standards.
The design and utility specifications of longitudinal bollards are presented
alongside the issues associated with their usage in the field and an alternative longitudinal
delineation device is presented that could be more effective in restricting the illegal
movements at RIRO driveways.

23
CHAPTER THREE
METHODOLOGY AND ANALYSIS
PART I
The methodology for this research includes a two-phased approach as follows:
1. A before and after case study analysis of a fast food restaurant with an existing well
designed Right-In, Right-Out only (RIRO) driveway experiencing a significant number
of illegal left turn maneuvers, for which longitudinal channelizing devices were
installed as a countermeasure
2. A safety analysis on 3774 driveways along 6 major highway corridors in South
Carolina, using crash data from 2011 to 2014
In the current chapter the data collection and analysis of a before and after case study
in Anderson, SC, US, is discussed and the driveway crash analysis of 6 major corridors in
South Carolina is discussed in the following chapter.
Through the before and after case study, illegal turning movements have been
quantified for each possible movement made by vehicles. Traffic volumes of the vehicles
entering and exiting the primary driveway (RIRO) along a major state route, supplemented
by a secondary driveway (FA) along a minor street, have been analysed as legally permitted
and illegal movements. The percentage of left turning volume is depicted as a part of total
volume, showing the significance of providing a physical median barrier to restrict the
illegal movements of vehicles.
24
In the safety analysis, a collective driveway database of major highway corridors,
including various driveway attributes such as driveway width, type, crash incidence from
2011 to 2014, etc., has been analysed to develop Crash Modification Factors (CMFs)
associated with converting a full access driveway to a specific type of RIRO driveway.
Thus, CMFs obtained from the negative binomial analysis shows the effect of having a
physical median barrier on driveway access safety compared to full access and other
isolated RIRO driveways without a physical longitudinal barrier.
3.1. Case Study Analysis at Fast Food restaurant in Anderson, SC
As a part of this research, a before and after case study was conducted initially to
evaluate the effectiveness of longitudinal bollards in prohibiting illegal left turn
movements. The case study primarily focused on quantifying the impact of bollards in
reducing the number of left turning maneuvers. The study was performed at a Bojangles
fast food restaurant located on South Carolina State Route 81 (SC 81) in Anderson, SC.
The site includes a two lane RIRO driveway located on SC 81 and a two lane, full access
driveway connecting with Financial Boulevard. Figure 3.1 shows the primary driveway
(right-in, right-out only) and Figure 3.2 shows the secondary driveway (full access) as seen
in the field.

25
Figure 3.1: RIRO Driveway connecting to SC State Route 81
Figure 3.2: Full Access Driveway connecting to Financial Boulevard
26
The RIRO driveway includes a raised traffic island with signage and pavement
markings intended to prevent left turning movements. However, through the initial visual
observation and traffic volume data collected, illegal left turning vehicles entering and
exiting the driveway have been evident and occurred with regularity.
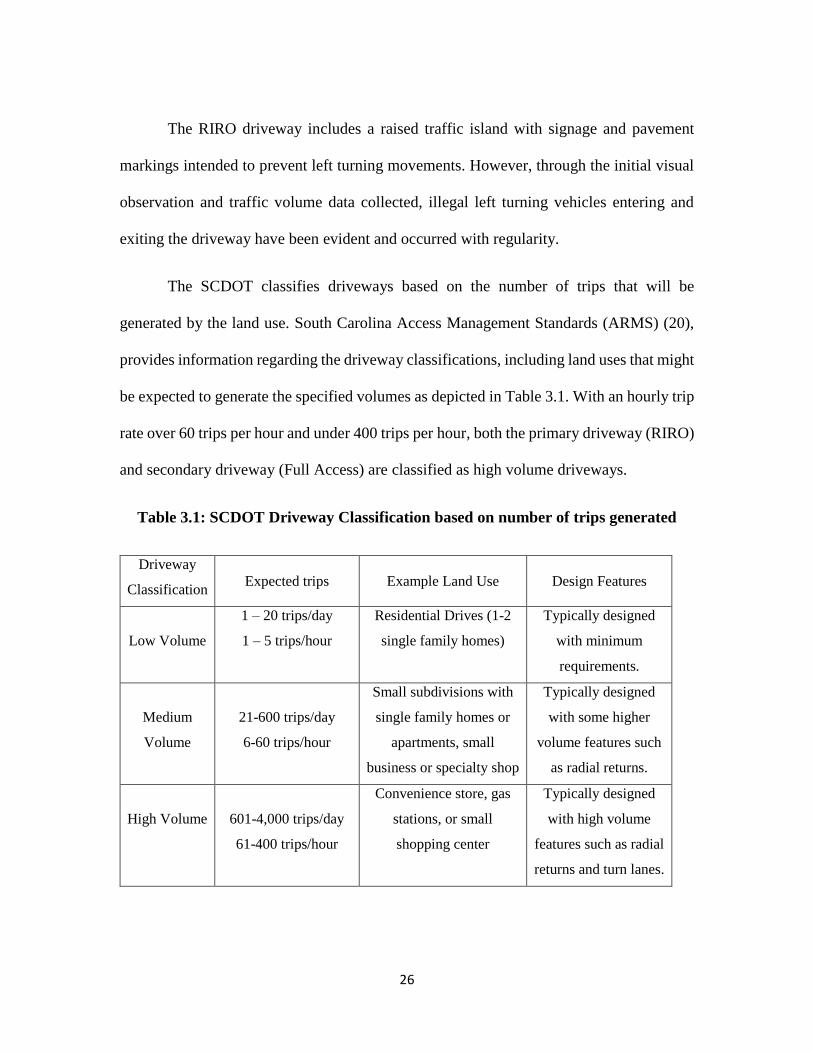
The SCDOT classifies driveways based on the number of trips that will be
generated by the land use. South Carolina Access Management Standards (ARMS) (20),
provides information regarding the driveway classifications, including land uses that might
be expected to generate the specified volumes as depicted in Table 3.1. With an hourly trip
rate over 60 trips per hour and under 400 trips per hour, both the primary driveway (RIRO)
and secondary driveway (Full Access) are classified as high volume driveways.
Table 3.1: SCDOT Driveway Classification based on number of trips generated
Driveway
Classification
Expected trips
Example Land Use
Design Features
Low Volume
1 – 20 trips/day
1 – 5 trips/hour
Residential Drives (1-2
single family homes)
Typically designed
with minimum
requirements.
Medium
Volume
21-600 trips/day
6-60 trips/hour
Small subdivisions with
single family homes or
apartments, small
business or specialty shop
Typically designed
with some higher
volume features such
as radial returns.
High Volume
601-4,000 trips/day
61-400 trips/hour
Convenience store, gas
stations, or small
shopping center
Typically designed
with high volume
features such as radial
returns and turn lanes.

27
Major
Volume
>4,000 trips/day
>400 trips/hour
Large shopping center or
regional mall
Designed with high
volume features
including radial
returns, turn lanes and
medians
Source: 2008 Access and Roadside Management Standards (SCDOT, 2008)
The geometric features of the Bojangles RIRO driveway exceeds specifications
provided by Access and Roadside Management Standards (SC ARMS) (20), MUTCD and
American Association of State Highway and Transportation Officials (AASHTO Green
Book Chapter 9.7). The raised traffic island for the RIRO driveway is 118 sq.ft., exceeding
the minimum required area of 100 sq.ft, as specified in ARMS. The driveway lane widths
of 14 ft are also compliant with ARMS. The RIRO driveway is provided with four
regulatory signs that are provided for traffic entering and exiting the driveway, as specified
in ARMS. The signs provided include a NO LEFT TURN, KEEP RIGHT and a STOP
sign. The use and placement of the ground mounted signs are provided in compliance with
specifications in MUTCD (21). Even though the design of the isolated RIRO driveway
meets design criteria specified in both ARMS and MUTCD, illegal movements are still a
chronic issue causing potential safety issues. Some of the other design specifications that
are satisfied by the existing driveway geometry are summarised in Table 3.2. An AutoCAD
drawing depicting the site location with respect to the existing roadway geometry and
pavement markings is depicted in Figure 3.3.

28
Table 3.2: Driveway Design Specifications Satisfied by the RIRO
Design Guideline Description Specification Provided
Area of Concrete Island (ARMS) Min. 100 sq. ft 128 sq. ft
Length of each side of Island (ARMS) Min. 12ft 16’×16’×16’
Offset of the island from edge of the travel
way (ARMS)
Min. 4ft 6 ft.
Solid white Stop Bar Width (MUTCD) 12 in. to 24 in. 24 in.
Driveway width (Throat Width) Min. 28ft 24 ft.
Height of the sign 5ft in rural areas 5 ft.
Lateral offset provided for the sign Min. 2ft 2 ft.
Lane Width 14ft 14 ft.
Angle of intersection of driveway with the
adjacent highway (ARMS)
Min. 70 degrees 90 degrees
Width of dividing pavement marking 4 in. to 6 in. 4 in.
Driveway Length (Throat length) Min. 40 ft 56 ft

29
FIGURE 3.3: Case study site schematic
The Annual Average Daily Traffic (AADT) data was obtained from the South
Carolina Department of Transportation (SCDOT) website for the years 2010 to 2015.
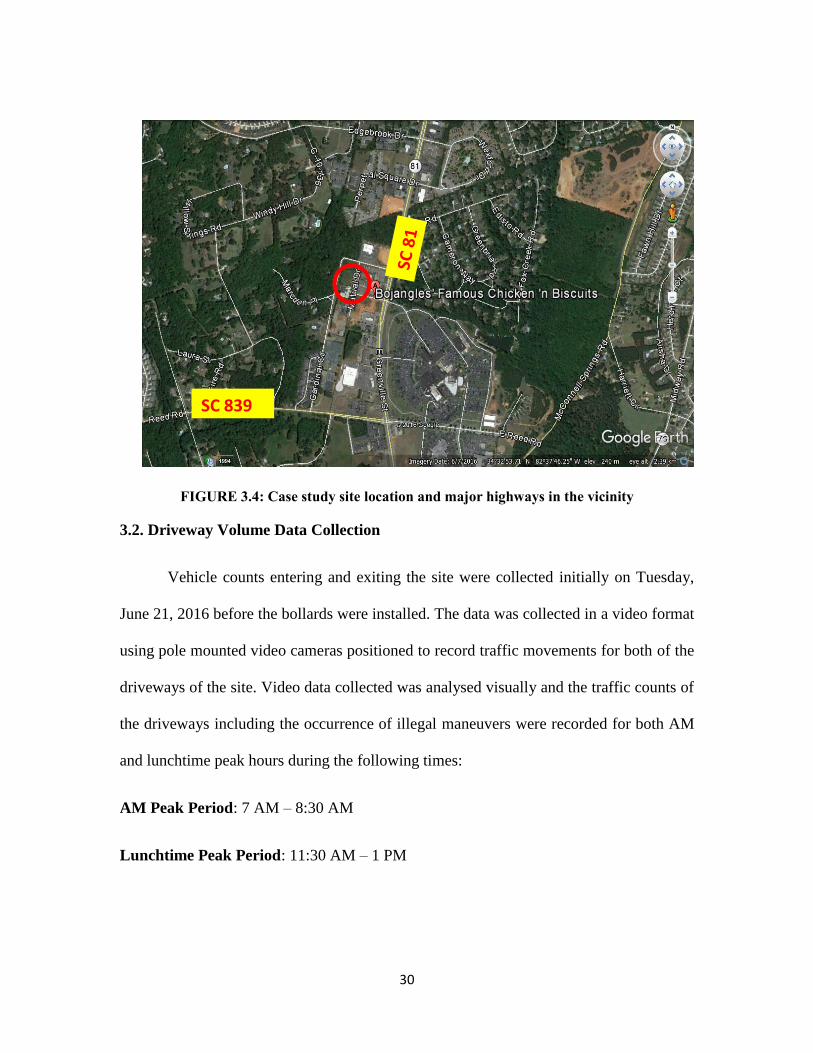
Figure 3.4 depicts a Google Earth Map of major state routes near the case study location.
SC State Route 81 is adjacent to the RIRO Driveway and has an AADT of 13,600 vehicles
per day in 2015 and an average AADT (2010 to 2015) of 13,150 vehicles per day and SC
State Route 839, which is near the location has an AADT of 13,600 vehicles per day in
2015 and an average AADT (2010 to 2015) of 9,350 vehicles per day. The major highways
(SC 81 and SC 839) and the study location is depicted in Figure 3.4.
30
FIGURE 3.4: Case study site location and major highways in the vicinity
3.2. Driveway Volume Data Collection
Vehicle counts entering and exiting the site were collected initially on Tuesday,
June 21, 2016 before the bollards were installed. The data was collected in a video format
using pole mounted video cameras positioned to record traffic movements for both of the
driveways of the site. Video data collected was analysed visually and the traffic counts of
the driveways including the occurrence of illegal maneuvers were recorded for both AM
and lunchtime peak hours during the following times:
AM Peak Period: 7 AM – 8:30 AM
Lunchtime Peak Period: 11:30 AM – 1 PM
SC 839
31
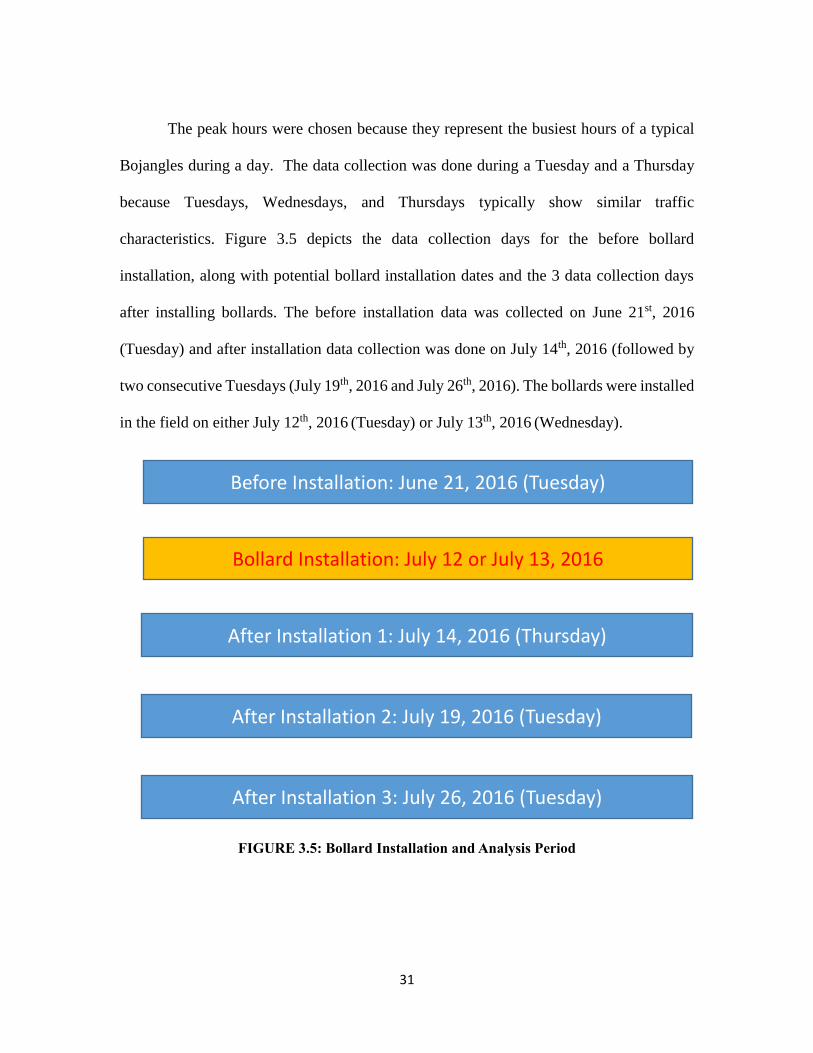
The peak hours were chosen because they represent the busiest hours of a typical
Bojangles during a day. The data collection was done during a Tuesday and a Thursday
because Tuesdays, Wednesdays, and Thursdays typically show similar traffic
characteristics. Figure 3.5 depicts the data collection days for the before bollard
installation, along with potential bollard installation dates and the 3 data collection days
after installing bollards. The before installation data was collected on June 21st, 2016
(Tuesday) and after installation data collection was done on July 14th, 2016 (followed by
two consecutive Tuesdays (July 19th, 2016 and July 26th, 2016). The bollards were installed
in the field on either July 12th, 2016 (Tuesday) or July 13th, 2016 (Wednesday).
FIGURE 3.5: Bollard Installation and Analysis Period
Before Installation: June 21, 2016 (Tuesday)
After Installation 1: July 14, 2016 (Thursday)
After Installation 2: July 19, 2016 (Tuesday)
After Installation 3: July 26, 2016 (Tuesday)
Bollard Installation: July 12 or July 13, 2016

32
3.3. Data Collection System
Driveway data was collected initially in video format so that driver behaviour could
be monitored in addition to recording the movements. The video data provided adequate
clarity and coverage to observe driver behaviours such as vehicles trying to exit the
driveway through a left turn maneuver but gave up due to heavy through traffic on the
adjacent highway (State Route 81).
A low-cost traffic data collection system was used for collecting the video data.
The video from this system was processed manually using JAMAR digital count boards.
The key components of the system are the generic all-weather action camera (ANART)
and the mounting system. The camera system is a light weight, portable, and
environmentally protected setup with sufficient memory and power supply to last for a
minimum of 1 1/2 hours (the analysis period for this study is 90 minutes). The camera is
enabled with Wi-fi to allow viewing during data collection. This ensured adequate
coverage of the driveways. The basic setup for the data collection system at a driveway
includes the camera enclosed in a protective case, a telescoping pole, a mounting bracket,
battery supply, and memory. Figure 3.6 shows the camera enclosed in a protective case.
This camera is mounted on the telescoping pole using the mounting bracket and raised and
attached to an existing utility or light pole in the field. The setup is shown in Figure 3.7
and a video image is shown in Figure 3.8. The complete installation usually takes about
5-10 minutes in the field.

33
Figure 3.6: Camera Setup
Figure 3.7: Data Collection System

34
Figure 3.8: Coverage of Video Data from the ANART cameras
3.4. Driveway Data Analysis at Bojangles Fast Food Restaurant
The traffic counts extracted from the videos include the number of vehicles making
each of the possible movements into and out of the driveways. The 4 major movements
are: right turn entry, right turn exit, left turn entry and left turn exit. All possible
movements are possible at the full-access Financial Blvd. driveway while only right turn
movements are legally permitted at the RIRO driveway on Highway 81. Figure 3.9 shows
a typical right turn entry maneuver at the RIRO driveway and Figure 3.10 shows a typical
right turn exit maneuver at this driveway before bollard installation. An illegal left-turn
entry movement into the driveway is depicted in Figure 3.11 and a left-turn exit movement
is depicted in Figure 3.12 before bollard installation. Illegal left turn maneauvers before
the bollard installation was found to be significant, despite the driveway meeting all design
critera.

35
Figure 3.9: Typical Right Turn Entry Movement
Figure 3.10: Typical Right Turn Exit Movement

36
Figure 3.11: Typical Left Turn Entry Movement
Figure 3.12: Typical Left Turn Exit Movement

37
Before Bollard Installation
The videos were analysed and the turning movement data including illegal
maneuvers was tabulated. The counts were summarised for traffic entering and exiting the
RIRO only driveway for the AM and lunchtime peak periods. Illegal turning maneuvers
made by the drivers before bollard installation ranged from 11-15 percent of total driveway
volume during the two peak periods (morning and lunchtime) collected.
A closer look at driver behaviour from the video and field observation during the
data collection periods indicated that there would have been several more illegal turning
maneuvers however these vehicles gave up because of the heavy conflicting volume “peer
pressure” by following drivers. The heavy through traffic on SC 81 made it difficult for
drivers to find adequate gaps to make illegal left turn maeuvers. It was observed that
multiple drivers waited at the STOP bar to make a left turn out of driveway and finally
made a right turn. This suggests the possibility that the percentage of driver making illegal
movements would be higher during non-peak traffic on SC 81.
Bollard Installation
The flexible delineating bollards were installed at the site on July 12th, 2016 or July
13th, 2016 to discourage illegal left turning movements into and out of the RIRO driveway.
The offsets of the bollard segment relative to the driveway are depicted in Figure 3.13
where the green line segment represents bollard segment.
Bollards were installed with the following geometric features:

38
1. Distance between 2 delineating posts (bollards) = 4.75 feet
2. Number of delineating posts (bollards) = 30
3. Total length of bollard segment = 138 feet
4. Offset of bollard segment from center of the driveway (left) = 74 feet
5. Offset of bollard segment from center of the driveway (right) = 62 feet
Figure 3.13: Bollard segment relative to driveway
The following are the cost details of Delineator Posts at Bojangles on SC 81 in Anderson:
Material Costs:
Delineators = 30 ($36.95 per each) + $60 (freight) = $1,246.01
Last Bollard (Left)
Last Bollard (Right)
74’
62’
Centerline
Bollard Segment
39
Adhesive = Liquid nails construction adhesive = Approx. $50
Labor Costs:
SCDOT Crew cost = Approx. $255 (3 hrs. of labor)
Traffic Control = variable (a contractor would likely charge $250 - $ 1,000 for
traffic control in a median, but varies with location)
Total cost = Approx. $2,000
The cost of Qwick Kurb for the same segment is estimated to be over $10,000, which is
significantly greater than that of longitudinal delineator posts.
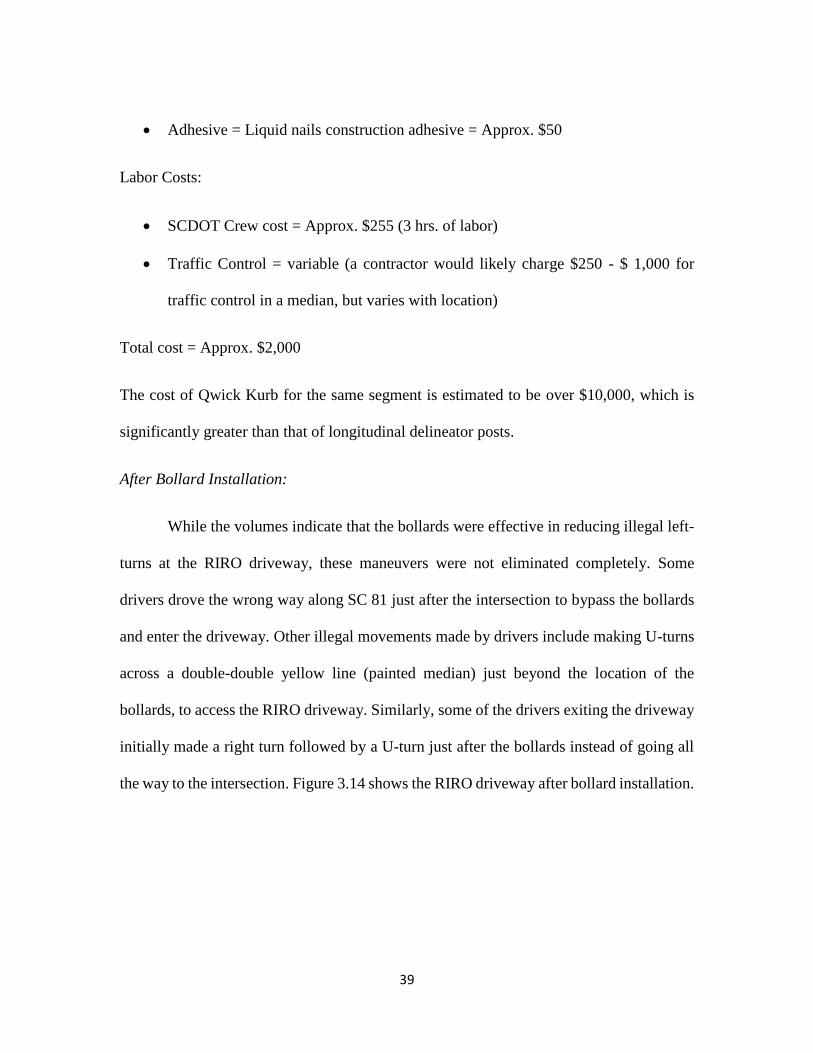
After Bollard Installation:
While the volumes indicate that the bollards were effective in reducing illegal left-
turns at the RIRO driveway, these maneuvers were not eliminated completely. Some
drivers drove the wrong way along SC 81 just after the intersection to bypass the bollards
and enter the driveway. Other illegal movements made by drivers include making U-turns
across a double-double yellow line (painted median) just beyond the location of the
bollards, to access the RIRO driveway. Similarly, some of the drivers exiting the driveway
initially made a right turn followed by a U-turn just after the bollards instead of going all
the way to the intersection. Figure 3.14 shows the RIRO driveway after bollard installation.

40
Figure 3.14: RIRO with bollards installed
It is also worth noting that the longitudinal delineating bollards, while effective in
working as channelization devices, are prone to be knocked off. Figure 3.15 shows that
some of the bollards towards the right end were knocked off at the driveway as of March
24th, 2017.

41
Figure 3.15: RIRO Bollards as on March 24, 2017
3.5. Driveway Data Summary
Table 3.3 and Table 3.4 summarize the traffic counts for vehicles turning into and
out of the right-in, right-out only driveway for the AM and lunchtime peak periods. Table
3.5 summarizes traffic counts for entering and exiting the secondary full access driveway
connecting to Financial Boulevard for both the AM and lunchtime peak periods. By
combining volumes for both driveways, total site traffic can be determined during each
period (1 for before period and 3 for after periods), which is given in the last row of Table
3.5.
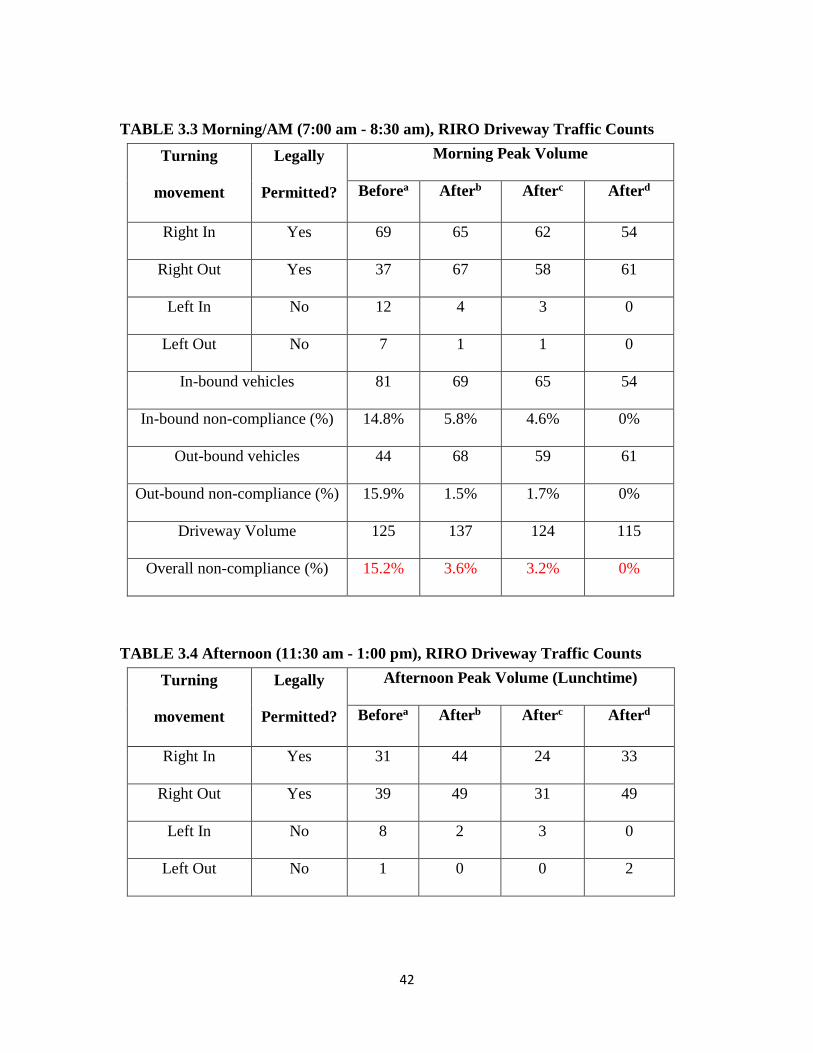
42
TABLE 3.3 Morning/AM (7:00 am - 8:30 am), RIRO Driveway Traffic Counts
Turning
movement
Legally
Permitted?
Morning Peak Volume
Beforea Afterb Afterc Afterd
Right In Yes 69 65 62 54
Right Out Yes 37 67 58 61
Left In No 12 4 3 0
Left Out No 7 1 1 0
In-bound vehicles 81 69 65 54
In-bound non-compliance (%) 14.8% 5.8% 4.6% 0%
Out-bound vehicles 44 68 59 61
Out-bound non-compliance (%) 15.9% 1.5% 1.7% 0%
Driveway Volume 125 137 124 115
Overall non-compliance (%) 15.2% 3.6% 3.2% 0%
TABLE 3.4 Afternoon (11:30 am - 1:00 pm), RIRO Driveway Traffic Counts
Turning
movement
Legally
Permitted?
Afternoon Peak Volume (Lunchtime)
Beforea Afterb Afterc Afterd
Right In Yes 31 44 24 33
Right Out Yes 39 49 31 49
Left In No 8 2 3 0
Left Out No 1 0 0 2

43
In-bound vehicles 39 46 27 33
In-bound non-compliance (%) 20.5% 4.3% 11.1% 0%
Out-bound vehicles 40 49 31 51
Out-bound non-compliance (%) 2.5% 0% 0% 3.8%
Driveway Volume 79 95 58 84
Overall non-compliance (%) 11.4% 2.1% 5.2% 2.4%
TABLE 3.5 AM and Afternoon FA Driveway Traffic Counts & Total Site Traffic
Turning
movement
Morning Peak Volume Afternoon Peak Volume
Beforea Afterb Afterc Afterd Beforea Afterb Afterc Afterd
Full Access In-
bound
52 76 53 71 49 49 47 55
Full Access Out-
bound
43 55 48 48 50 46 35 33
Total Full Access
Driveway
95 131 101 119 99 95 82 88
Total RIRO
Driveway
125 137 124 115 79 95 58 84
Total site traffic 220 268 225 234 178 190 140 172
a data collected on Tuesday, June 21, 2016
b data collected on Tuesday, July 14, 2016
c data collected on Tuesday, July 19, 2016
d data collected on Tuesday, July 26, 2016
Even though there was one dataset for before bollard installation and three datasets
for after installation, total site traffic remained reasonably consistent for the fast food
44
restaurant. The first after date exhibited the highest site traffic for both the morning and
lunchtime peak periods, however this may have occurred due to data collection on a
different day of the week (Thursday). All other data collection dates were Tuesdays. The
initial indication from the before and after study is that: bollard installation has improved
driver compliance with turn restrictions and exhibited no adverse impacts on business
patronage.

45
CHAPTER FOUR
METHODOLOGY AND ANALYSIS
PART II
4.1. Corridor Crash Inventory
A large amount of data was evaluated for accuracy in South Carolina, which
includes crash data, roadway characteristics, and driveway characteristics. At the initial
stages, 30 corridors within the state with a high incidence of driveway related crashes in
the state were identified for further analysis. The driveway related crashes are coded as
junction type 02 in the crash database. The top 30 corridors were identified based on a 3-
year combined average crash frequency ranking.
Based on further analysis a set of 11 corridors with the high crash incidence as well
as spatial distribution throughout the state were selected (Figure 4.1). Table 4.1 depicts the
name of the route, length of analysis segment, crash incident along the segment and 3-year
average crash rank of driveway (from 2010, 2011 and 2012). To minimize high crash
frequency bias, the selected corridors were all greater than 10 miles in length with sections
that varied considerably in many regards including driveway density, corner clearance,
median type, AADT, crash frequency, etc.
However, among these 11 corridors some were in Cities where much of the crash
reporting is done by city police who are not equipped with the SCCATS crash reporting
system. The precision of the crashes geocoded using SCCATS is much better than the
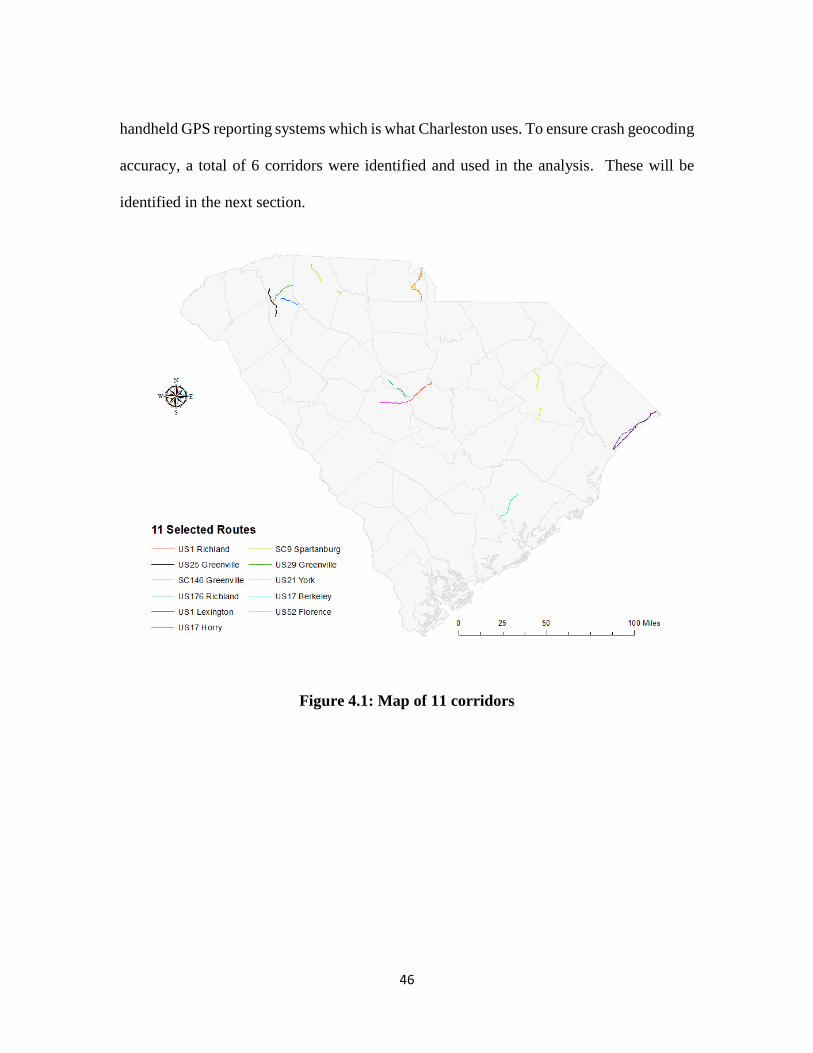
46
handheld GPS reporting systems which is what Charleston uses. To ensure crash geocoding
accuracy, a total of 6 corridors were identified and used in the analysis. These will be
identified in the next section.
Figure 4.1: Map of 11 corridors

47
Table 4.1 Ranking of 11 Corridors (Source: Sarasua et.al., Support for the Development and
Implementation of an Access Management Program through Research and Analysis of Collision Data,
South Carolina Department of Transportation, 2015)
COUNTY ROUTE
TYPE
ROUTE
NUMBER
LENGTH
(MILES)
3 YEAR
DRIVEWAY
AVG RANK
DRIVEWAY
CRASHES
Richland US 1 18.5 1 353
Greenville US 25 18.7 2 309
Greenville SC 146 13.5 3 294
Richland US 176 15.8 4 274
Lexington US 1 17.6 5 214
Horry US 17 55.4 6 195
Spartanburg SC 9 15.8 7 173
Greenville US 29 15.4 8 159
York US 21 35.6 9 147
Berkeley US 17 18.8 11 149
Florence US 52 20.4 12 131
4.2. Corridors for Crash Summary Analysis
The safety analysis of RIRO driveways focused on crashes along 6 corridors in
South Carolina occurring from 2011 to 2014. A driveway database for the selected

48
corridors was created in a Geographic Information System (GIS) and included driveway
information such as whether a driveway is a RIRO and if a median was present. RIRO
driveways were further classified based on geometry and signage. The classification of
RIRO fall under the following categories: painted island, raised island, and signage
presence. The RIRO driveway attributes also include the condition of RIRO channelization
treatment. Driveways were identified and populated with attribute data by analysing Bing
and Google digital maps and Google Streetview images.
Initially, data was tabulated for more than 9,000 driveways, including 1,365 RIRO
driveways along 11 corridors in South Carolina. For the 6 selected corridogs, there were,
3,774 driveways including 268 RIRO driveways. The following are the 6 corridors
analysed for the driveway crash analysis:
1. SC 146 – Greenville, SC
2. SC 9 - Spartanburg, SC
3. US 1 - Richland, SC
4. US 17 - Berkeley, SC
5. US 176 - Richland, SC
6. US 25 - Greenville, SC
4.3. Development of RIRO Driveway Crash Rates
To determine the safety effects of right-in, right-out only driveways on crash
incidence on the roadway, it is necessary to associate driveway crashes with driveways.
Using queries to select possible crash types that could be associated with driveways (such

49
as rear end, angle, etc.), the assumption was that any crashes within an influence area of a
driveway are considered driveway related crashes for that specific driveway (23).
Driveway Attribute Data
The SCDOT Roadside Inventory Management Systems (RIMS) road
characteristics database is used for the driveway attribute data collection. Based on aerial
imagery (Bing and Google street view), driveway attribute data has been populated for the
selected 6 corridors. The categories and description of attribute data populated for the 3,774
driveways, including 268 RIRO driveways are summarized. Figure 4.2 depicts the
driveway attributes for a full access driveway located at a high turnover land use. Input
codes were provided for each driveway attribute with multiple categories, starting from 1.
Driveways which do not fall under any specific category for a driveway attribute will by
default be populated with an input code 0. The driveway attributes used for the analysis
fall under “Full Access” and ‘Right In-Right Out Class’. The RIRO attribute is further
stratified into input codes from 1 to 9, representing various types of RIRO driveways. A
full access driveway is given an input code 0 for this category.
Driveway Buffer Creation
To effectively identify driveway related crashes, it is crucial that the driveway
influence areas are as precise as possible. One possible approach is to buffer an area on the
travelway adjacent to each driveway to delineate the influence area. This can be done using
ArcGIS buffer techniques. For this purpose, roadway centerline segments are needed along
with information related to the roadway width.

50
Figure 4.2: A FA Driveway (Top) and Attributes Associated (Bottom)
SCDOT maintains a GIS layer of roadway centerlines for all roads on the South Carolina
state route system. Attribute data for centerline segments is either associated with its entire
segment or linearly referenced by mile point using dynamic segmentation. Using the buffer

51
by attribute feature in ArcGIS allows creation of a polygon based on an attribute of
individual segments. By using this feature and offsetting from centerline segments by half
of the roadway width RIMS attribute across both sides of the line, travelway buffers were
created for all 6 corridors.
Figure 4.3 shows the travelway buffer for a section of SC 146 along Greenville,
SC., which includes the centerline along with driveway points and crash locations (for
2012) depicted as point shape files in ArcGIS. Additionally, the legend depicts the names
of the layers used for the travelway buffer creation in ArcGIS.
Figure 4.3: Travelway Buffer
Legend
DrivewayCrahes_2012
SC146_Greenville_RIRO_Driveways
SC146_Greenville_DynamicSeg
SC146_Greenville_DynamicSeg_Proj_Buffer_Correct
52
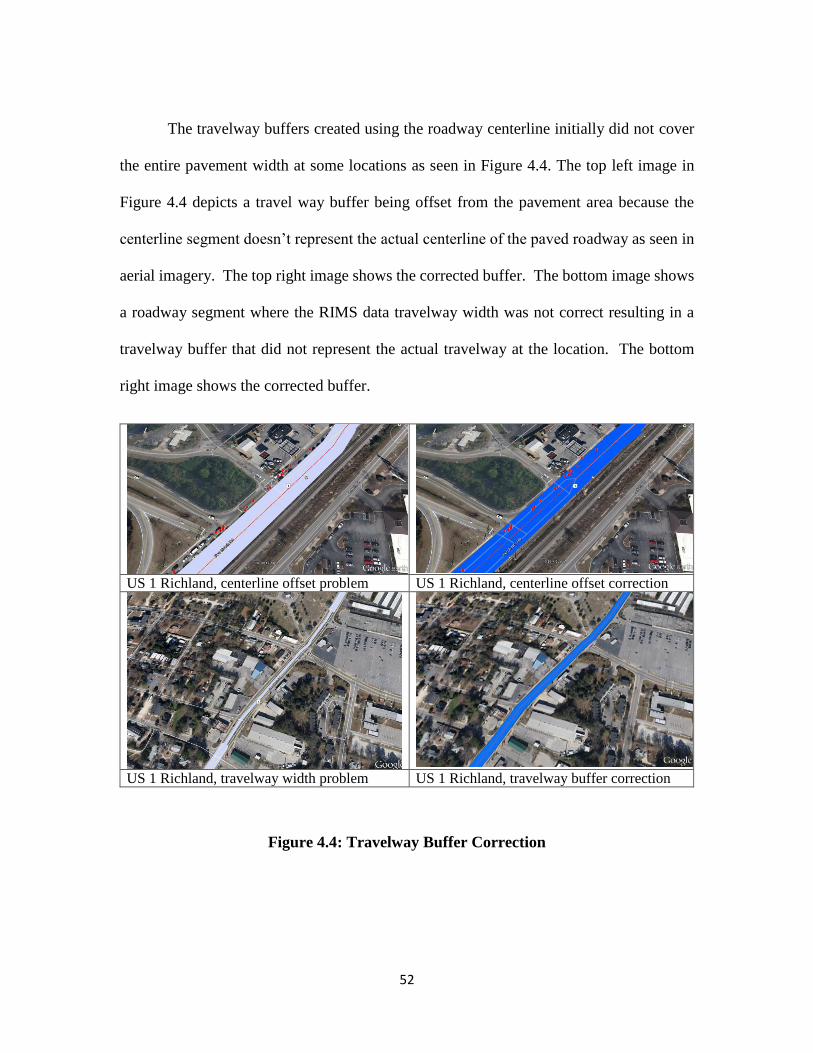
The travelway buffers created using the roadway centerline initially did not cover
the entire pavement width at some locations as seen in Figure 4.4. The top left image in
Figure 4.4 depicts a travel way buffer being offset from the pavement area because the
centerline segment doesn’t represent the actual centerline of the paved roadway as seen in
aerial imagery. The top right image shows the corrected buffer. The bottom image shows
a roadway segment where the RIMS data travelway width was not correct resulting in a
travelway buffer that did not represent the actual travelway at the location. The bottom
right image shows the corrected buffer.
Figure 4.4: Travelway Buffer Correction
US 1 Richland, centerline offset problem US 1 Richland, centerline offset correction
US 1 Richland, travelway width problem US 1 Richland, travelway buffer correction

53
Upon creating the travelway buffers, driveway buffers were created, to represent
their influence area from a crash standpoint. One problem with standard circular buffering
based on location of the driveway access point is that it would bias toward crashes that
occur closer to the edge of the road (near the driveway entrance). Ideally, rectangular
buffers would provide a better indicator of a driveway’s influence area. Thus, a model was
created that could make rectangular buffers that stretched across the roadway as shown in
Figure 4.5.
Two models were created depending on driveway type: a model for full access
driveways that creates buffers extending across all travel lanes; and a model for right-in
right-out (RIRO) driveways that creates buffers that extend to the roadway centerline.
Figure 4.5: Full-access and RIRO driveway buffers

54
Additionally, driveway buffers were created for RIRO driveways that extend
across all travel lanes similar to full access driveways. The reason for this more
conservative approach is because our initial assumption that the crashes geocoded by the
police officers completing the crash report are pinpointed to their precise locations is not
true. Instead, they geocode crashes close to the centerline shown on their GIS map
display. The reason for this is that centerlines provide the only spatial reference to the
officer. Edge of pavement lines or underlying images are not provided. As our centerline
has been modified and does not necessarily align exactly with the centerline used by the
police, there is a possibility of having one of the following three scenarios at driveway
buffers, using half buffer overlays (as depicted in Figure 4.6):
Scenario 1: Centerline used by police and centreline used in our research align exactly
(Crashes are counted accurately assuming the officer locates crashes on the correct side
of the road relative to the centerline)
Scenario 2: Centerline used by police is away from and centerline used in our research
but farther off from the half buffer (Possibility of undercounting crashes)
Scenario 3: Centerline used by police is away from and centreline used in our research
but inside the half buffer (Possibility of overcounting crashes)

55
Figure 4.6: Three Scenarios Possible with Half Buffer Overlay
A comparative summary analysis was done for RIRO driveway buffers extending across
all the travel lanes and RIRO buffers extending to the roadway centerline. The crash data
from 2011 to 2014 were aggregated and used for this analysis.
Driveway width attributes from the driveway database are used in both the models
(full access and RIRO) to create the driveway buffers. The driveway buffer width is the
driveway width plus thirty feet to accommodate about a car length on each side of the
driveway. The 30-foot value was identified in a separate analysis using different values
starting at 0 (thus the driveway influence area would only be equal to the actual driveway
width) to 60’ in 6-foot increments. The number of crashes that fell within each buffer
was determined and graphed. An inflection (abrupt change in slope) occurred for 30-feet.
P C
P
P
Crashes
Police Centerline
Our Centerline
Half Buffer

56
4.4. RIRO Driveway Crash Summary
Once the driveway buffers were created for the selected 6 corridors, potential
driveway crashes from 2011-2014 were aggregated in each RIRO driveway buffer using
the GIS overlay tool. The resulting crash counts aggregated in each buffer are used to
calculate the 4-year crash rate for each driveway. The average 4-year crash rate of the 6
corridors represents the total number of crashes that fell within driveway buffers divided
by the total number of driveways.
The crash rates of RIRO driveways along various corridors were developed for
RIRO buffers with two approaches:
1. FA buffers extending across all the travel lanes and RIRO buffers extending until
roadway centreline (RIRO Half Buffer)
2. Both FA and RIRO buffers extending across all the travel lanes (Both Full Buffer)
Figure 4.7 shows driveway crash rates by year for all the years between 2011 and
2014 for full and half buffers of RIRO driveways. Figure 4.8 shows the same depiction
for the crash rates by year between 2011 and 2014, after the overlapped crashes have
been removed for the RIRO driveways which are opposite to each other. The removal
of overlapping crashes for Full Buffer RIRO driveways was done to reduce over-
counting of the crashes for these driveways. Crashes overlapping between two RIRO
driveways which are on opposite directions were assigned to one of the driveways for
crash summary analysis.

57
Figure 4.7: Crash Rates by Year for Driveways (2011 - 2014)
Figure 4.8: Crash Rates for Driveways after Removing Overlapped Crashes
0.55
0.27
0.470.52
0.29
0.47
0.56
0.28
0.48
0.69
0.31
0.47
1
RIRO Full vs. RIRO Half vs. Full Access
RIRO Full Buffer RIRO Half Buffer FA RIRO Full BufferRIRO Half Buffer FA RIRO Full Buffer RIRO Half BufferFA RIRO Full Buffer RIRO Half Buffer FA
2011 2012 2013 2014
0.51
0.27
0.47 0.47
0.29
0.47 0.50
0.28
0.48
0.65
0.31
0.47
1
RIRO Full(-overlapped crashes) vs. RIRO Half vs. Full Access
RIRO Full 2011 RIRO Half 2011 FA 2011 RIRO Full 2012RIRO Half 2012 FA 2012 RIRO Full 2013 RIRO Half 2013FA 2013 RIRO Full 2014 RIRO Half 2014 FA 2014
2011 2012 2013 2014

58
Additionally, Table 4.2 provides a summary of four years of crash data for the 11
corridors in SC, that were initially selected based on their high 4-year average crashes. The
two primary classes of driveways analyzed are: 1) without median treatment, and 2) with
median treatment. Median treatments may include raised, grassed, or some type of
longitudinal delineator. Table 8 shows that there is significant disparity between the 4-year
crash rate for RIRO driveways without median treatments (1.27) versus driveways with
median treatments (0.57).
TABLE 4.2 Summary of Right-In, Right-Out Crashes
Type of Driveway
Crashes
(2011-2014) Driveways
4-year
Crash Rate
Average Annual
Crash Rate
RIRO without median 186 147 1.27 0.32
RIRO with median 691 1218 0.57 0.14
Total RIRO 877 1365 0.64 0.16
Full Access 12396 7221 1.72 0.43
4.5. Statistical Analysis of RIRO Driveway Crash Data
While RIRO driveway crash rate summary statistics provide insights into the crash
experience of each driveway, crash rates can be deceiving in some occasions due to
59
confounding effects of other driveway characteristics and biases towards small
denominators. To address this concern, models were developed to predict the individual
contribution of the RIRO characteristics of a driveway to crash incidence and determine
the statistical significance of this contribution.
Incidence of vehicle crashes are random, discrete and non-negative. Two of the
commonly-used statistical models used to study traffic crashes are Poisson and Negative
Binomial regression models. A major reason for frequent usage of these models is their
ability to effectively identify a broad range of risk factors for crashes and thereby provide
valuable information for users to select mitigation measures. As the mean and variance of
crashes per driveway are not approximately equal, Poisson model was deemed
inappropriate for this study. For this study, Negative Binomial Regression model was
employed to identify driveway geometrics and roadway characteristics that affect driveway
related crashes.
The negative binomial model is shown in the equation below:
iii X ln
where:
i is the expected number of crashes for driveway i,
iX is a vector of explanatory variables,
is vector of estimable coefficients, and

60
)exp( i is a gamma-distributed error term with mean one and variance
A negative binomial regression analysis was performed on the data from 3774
driveways and 2012 crash data from 6 corridors, which were selected from the initial 11
corridors included in the driveway database because of differences in geocoding crash
locations by some jurisdictions compared to others. The crash data from the selected six
corridors are predominantly geocoded with SCDOT’s new mapped based reporting system
which has been shown to be much more accurate than the previous system (22). Negative
Binomial Regression models were developed using R-Programming Language (in R 3.3.3).
The model takes input attribute data from comma-separated-value files, exported from
Excel spreadsheets. The primary input attributes for Negative Binomial Regression include
driveway width, driveway type (full access or RIRO), driveway class (low, medium, high
or major turnover driveway), Driveway control (signalized or unsignalized) and Average
Annual Daily Traffic (AADT) as shown in Table 4.3.
In addition to the above attributes, the RIRO variable where the value of 1 indicates it
is a RIRO driveway and a value of 0 indicates it is a full-access driveway.

61
Table 4.3 Driveway Attributes and Input Codes
Attribute
Attribute
Code Inputs
Input
Code
Segment Number Segment_No Number
Driveway Number Driveway_N Number
Segment Driveway
Number Seg_Dr_No Number
Driveway Spacing D_Spacing
Distance (FT) - Round to nearest
foot
Driveway Turning
Radius D_Radius Radius (FT) - Estimate
Driveway Width D_Width Width (FT)
Number of entry lanes N_Entry_Ln Number
Number of exiting Lanes N_Exit_Ln Number
Driveway Angle D_Angle Ortho 1
Skewed 2
62
Driveway Corner
Clearance D_Corner_C Distance (FT)
Driveway Throat Length D_Throat Distance (FT)
Sight Distance Sight_Dist Good 1
Questionable 2
Bad 3
Driveway Description D_Type
Right in right out- channalized
(painted- obvious geometry or
raised) 1
Right in right out- unchannalized
(No left turn sign) 2
No restriction 3
Open driveway (too wide) 4
Oneway 5
Auxiliary Lane from
road into the driveway Aux_Lane_R
None
1
Left 2
Right 3

63
Both 4
Median Type On
Roadway Median_Ty
Single or double solid yellow
line/no median/undivided 1
Raised median (Including aux
lane) 2
Grass Median 3
Two way left turn lane
(TWLTL) 4
Painted Double Double Yellow
Median 5
Median opening 6
Aux Left Turn Lane (Bad) 7
Parking Type On
Roadway Parking_Ty None
1
Parallel 2
Angle 3
Perpendicular 4
Driveway Land Use D_Use Commercial 1
64
Industrial_Institutional 2
Residential 3
Mixed Use 4
Vacant Developed 5
Vacant Undeveloped 6
Other 7
Driveway Class based on
volume D_Class Low (Single Dwelling Units) 1
Medium Residential (Sub-
Division/Apartments) 2
Medium (Low turnover small
business) 3
High (fast food, gas station,
drivethrough banks…) 4
Major (Big box) 5
Size of Land Use D_Use_Size Low: 0-10 Parking 1
Medium: 11-50 Parking 2

65
Large: >50 Parking 3
Extra Large: Big box, Mall, High
Rise, Parking Block 4
Driveway Use Shared? Sh_Use Yes 1
No 2
Number of Driveways
per Use No_D_Use One of One 1
One of Two 2
One of Many 3
Driveway Hierarchy D_Hierarch Primary Drive 1
Secondary Drive 2
Not Applicable 3
Control at Driveway D_Control Unsignalized 1
Signalized 2
Any additional
comments Comments
Data Collector Student Name of Student Text
66
Right In-Right Out Class RIRO_Class Painted Island Good 1
Painted Island Bad 2
Raised Island Good 3
Raised Island Bad 4
Raised/ Grass Median 5
Painted (Double Double)
Median 6
Combination 7
Questionable 8
Wrong 9

67
CHAPTER FIVE
RESULTS AND DISCUSSIONS
5.1. Negative Binomial Model Results
Negative Binomial Models were implemented for the following cases using Full and
Half Buffer Overlays:
1. Full access driveways vs. all RIRO driveways (Half Buffers for RIRO)
2. Full access driveways vs. RIRO with raised median (Half Buffers for RIRO)
3. Full access driveways vs. RIRO without raised median (Half Buffers for RIRO)
4. Full access driveways vs. all RIRO driveways (Full Buffers for RIRO)
5. Full access driveways vs. RIRO with raised median (Full Buffers for RIRO)
6. Full access driveways vs. RIRO without raised median (Full Buffers for RIRO)
Table 5.1 shows the crash modification factors obtained for full and half buffer overlays
and for full access vs. different types of RIRO driveways.
Table 5.1 Negative Binomial Estimation Results – Summary
CMF /Buffer type Half Buffer Full Buffer
FA vs. All RIRO 0.382 0.689
FA vs. Raised RIRO 0.335 0.665
FA vs. Non-Raised RIRO 0.489 0.748

68
Full access driveways vs. all RIRO driveways
The negative binomial estimation results of annual crashes per driveway are shown
in Table 5.2, which includes a total of 189 RIRO driveways. For this model, all RIRO
driveways were assigned a value of 1 and all full access driveways were assigned a value
of 0. The results were obtained for Full and Half Buffer overlays for average crashes for
the years 2011 to 2014.
Table 5.2 Negative Binomial Estimation Results – Half Buffers (All RIROs)
Variables Estimate Std. Error z-value Pr(>|z|)
(Intercept) -17.301760 0.832649 -20.78 < 2e-16
D_Width 0.020971 0.001506 13.93 < 2e-16
D_Class4 0.775981 0.066337 11.70 < 2e-16
D_Class5 0.987578 0.095001 10.39 < 2e-16
D_Control 1.199351 0.103232 11.62 < 2e-16
LN(AADT) 1.560474 0.082372 18.94 < 2e-16
RIROorFA -0.963053 0.126720 -7.60 2.97e-14

69
Table 5.3 Negative Binomial Estimation Results – Full Buffers (All RIROs)
Variables Estimate Std. Error z-value Pr(>|z|)
(Intercept) -17.473587 0.826440 -21.14 < 2e-16
D_Width 0.021119 0.001462 14.45 < 2e-16
D_Class4 0.775194 0.065043 11.92 < 2e-16
D_Class5 0.985066 0.092477 10.65 < 2e-16
D_Control 1.145503 0.101456 11.29 < 2e-16
LN(AADT) 1.577820 0.081728 19.31 < 2e-16
RIROorFA -0.372851 0.100764 -3.70 0.000215
The first column in Table 5.2 shows the final model variables; they were obtained
through a systematic evaluation and removal of variables with little-to-no impact on model
performance. Column 2 of Table 5.2 shows the estimated coefficients of variables. A
positive coefficient is interpreted as increasing crashes and a negative coefficient as
decreasing crashes. Column 3 shows the standard errors for the regression coefficients. The
last two columns show the z-values (test statistics) and p-values for the null hypothesis that
an individual predictor's regression coefficient is zero, given that the rest of the predictors
are in the model.
70
The results in Table 5.2 indicate that converting a full access driveway into RIRO
will decrease driveway related crashes. Conversely, increasing driveway width (as
opposed to channeling entries/exits), increasing corridor volume (lnAADT), adding a
driveway to serve a high-turnover fast food restaurant (Driveway Class 4), or being
driveway that serves a major commercial development (Driveway Class 5) will increase
crashes.
Further, the magnitude of the coefficients can be interpreted as follows. By having a RIRO
driveway instead of a full-access driveway, the difference in the natural logs of expected
crashes will decrease by a factor of 1.14, while holding the other variables in the model
constant. Regarding the constant (intercept), it indicates that the expected number of
crashes is zero (actual value for i is 3.061e-8; ln(3.061e-8) = -17.302).
Additionally, it was noted that the dispersion parameters for all the negative binomial
models are greater than 0 (based on output from R as indicated in red color in Figure 5.1).
The variance of a negative binomial model is a function of its mean and dispersion
parameter (theta). As the dispersion parameter gets larger, the variance converges to the
same value as the mean, and the negative binomial models turn to a Poisson distribution.
Thus, a positive dispersion parameter with a value not significantly greater than 1 indicates
that the negative binomial model is more suitable than the Poisson model for analyzing
driveway crashes.

71
Figure 5.1: R Output for Negative Binomial Model for Raised Medians (Full Buffer)
Full access driveways vs. RIRO with raised median
In the second negative binomial model, RIRO driveways with a raised median were
assigned a value of 1 instead of all RIRO. The total number of RIRO driveways (with a
raised median) considered for this were 189, alongside 3506 full access driveways. The
results are depicted in Table 5.4 and Table 5.5.

72
Table 5.4 Negative Binomial Estimation Results – Half Buffers (Raised Median)
Variables Estimate Std. Error z-value Pr(>|z|)
(Intercept) -17.442200 0.841172 -20.736 < 2e-16
D_Width 0.020723 0.001535 13.498 < 2e-16
D_Class4 0.768380 0.067287 11.419 < 2e-16
D_Class5 0.988337 0.097133 10.175 < 2e-16
D_Control 1.227463 0.106881 11.484 < 2e-16
LN(AADT) 1.575054 0.083218 18.927 < 2e-16
RIROorFA -1.094345 0.160757 -6.807 9.93e-12
Table 5.5 Negative Binomial Estimation Results – Full Buffers (Raised Median)
Variables Estimate Std. Error z-value Pr(>|z|)
(Intercept) -17.606447 0.837310 -21.027 < 2e-16
D_Width 0.020699 0.001488 13.913 < 2e-16
D_Class4 0.768389 0.066160 11.614 < 2e-16
D_Class5 0.963606 0.095692 10.070 < 2e-16
D_Control 1.213074 0.105816 11.464 < 2e-16

73
LN(AADT) 1.592041 0.082813 19.224 < 2e-16
RIROorFA -0.408623 0.121734 -3.357 0.000789
Full access driveways vs. RIRO without raised median
Table 5.6 and Table 5.7 show the results of performing a negative binomial
regression model between FA driveways and RIRO Driveways without raised median
(number of RIRO driveways without median treatment =79)
Table 5.6 Negative Binomial Estimation Results – Half Buffers(Non-Raised Median)
Variables Estimate Std. Error z-value Pr(>|z|)
(Intercept) -17.298466 0.838505 -20.630 < 2e-16
D_Width 0.022368 0.001652 13.536 < 2e-16
D_Class4 0.744585 0.068042 10.943 < 2e-16
D_Class5 0.986169 0.097111 10.155 < 2e-16
D_Control 1.177896 0.105788 11.135 < 2e-16
LN(AADT) 1.557018 0.082949 18.771 < 2e-16
RIROorFA -0.715166 0.201297 -3.553 0.000381

74
Table 5.7 Negative Binomial Estimation Results – Full Buffers (Non-Raised Median)
Variables Estimate Std. Error z-value Pr(>|z|)
(Intercept) -17.313607 0.834870 -20.738 <2e-16
D_Width 0.022431 0.001645 13.632 <2e-16
D_Class4 0.748174 0.067616 11.065 <2e-16
D_Class5 1.008360 0.095699 10.537 <2e-16
D_Control 1.142163 0.104858 10.893 <2e-16
LN(AADT) 1.558612 0.082580 18.874 <2e-16
RIROorFA -0.289892 0.170964 -1.696 0.09
RIRO without raised median vs. RIRO with raised median
Table 5.8 shows the results of performing a negative binomial regression model
between RIRO Driveways without median treatment and RIRO driveways with raised
median treatment (number of RIRO driveways without median treatment = 79, number of
RIRO driveways with a median treatment = 189). The results in Table 5.8 represent full
buffer overlay analysis of crashes. It can be observed that by using a more conservative
approach i.e. full buffers, there was a negative correlation between RIRO aspect of the
driveway and the crashes. This indicates a reduction in crashes by converting RIRO
driveways without a median treatment to RIRO driveways with a median treatment.
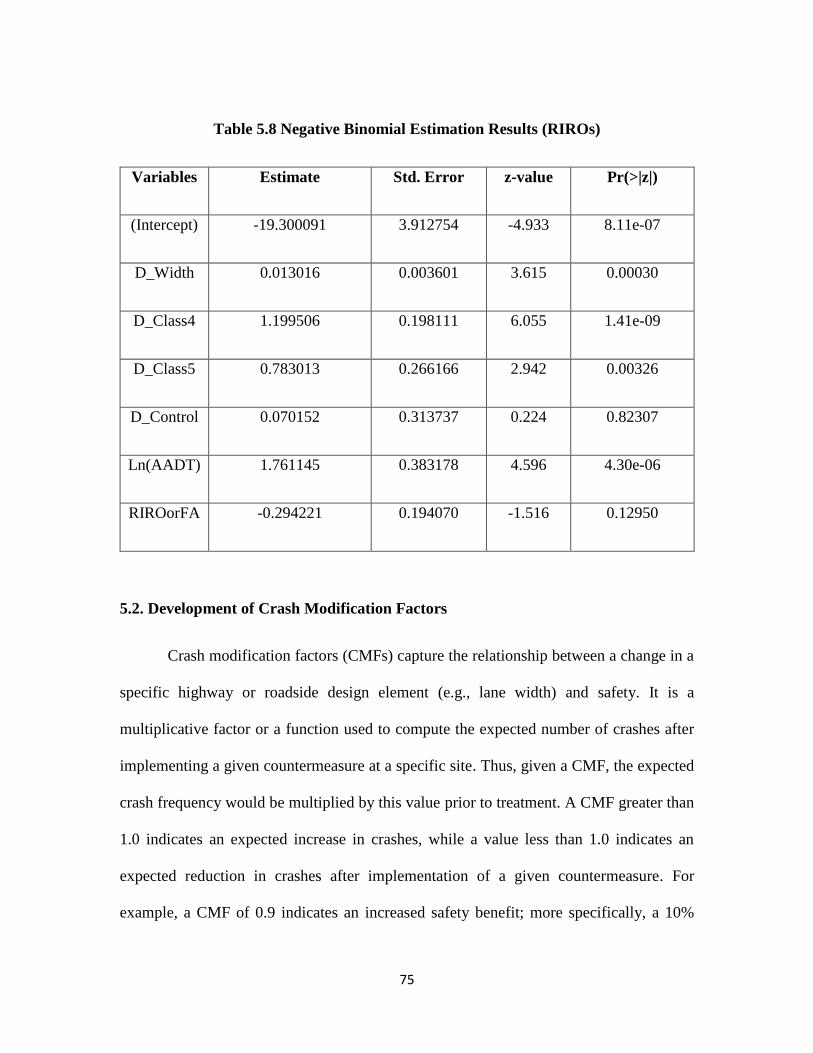
75
Table 5.8 Negative Binomial Estimation Results (RIROs)
Variables Estimate Std. Error z-value Pr(>|z|)
(Intercept) -19.300091 3.912754 -4.933 8.11e-07
D_Width 0.013016 0.003601 3.615 0.00030
D_Class4 1.199506 0.198111 6.055 1.41e-09
D_Class5 0.783013 0.266166 2.942 0.00326
D_Control 0.070152 0.313737 0.224 0.82307
Ln(AADT) 1.761145 0.383178 4.596 4.30e-06
RIROorFA -0.294221 0.194070 -1.516 0.12950
5.2. Development of Crash Modification Factors
Crash modification factors (CMFs) capture the relationship between a change in a
specific highway or roadside design element (e.g., lane width) and safety. It is a
multiplicative factor or a function used to compute the expected number of crashes after
implementing a given countermeasure at a specific site. Thus, given a CMF, the expected
crash frequency would be multiplied by this value prior to treatment. A CMF greater than
1.0 indicates an expected increase in crashes, while a value less than 1.0 indicates an
expected reduction in crashes after implementation of a given countermeasure. For
example, a CMF of 0.9 indicates an increased safety benefit; more specifically, a 10%
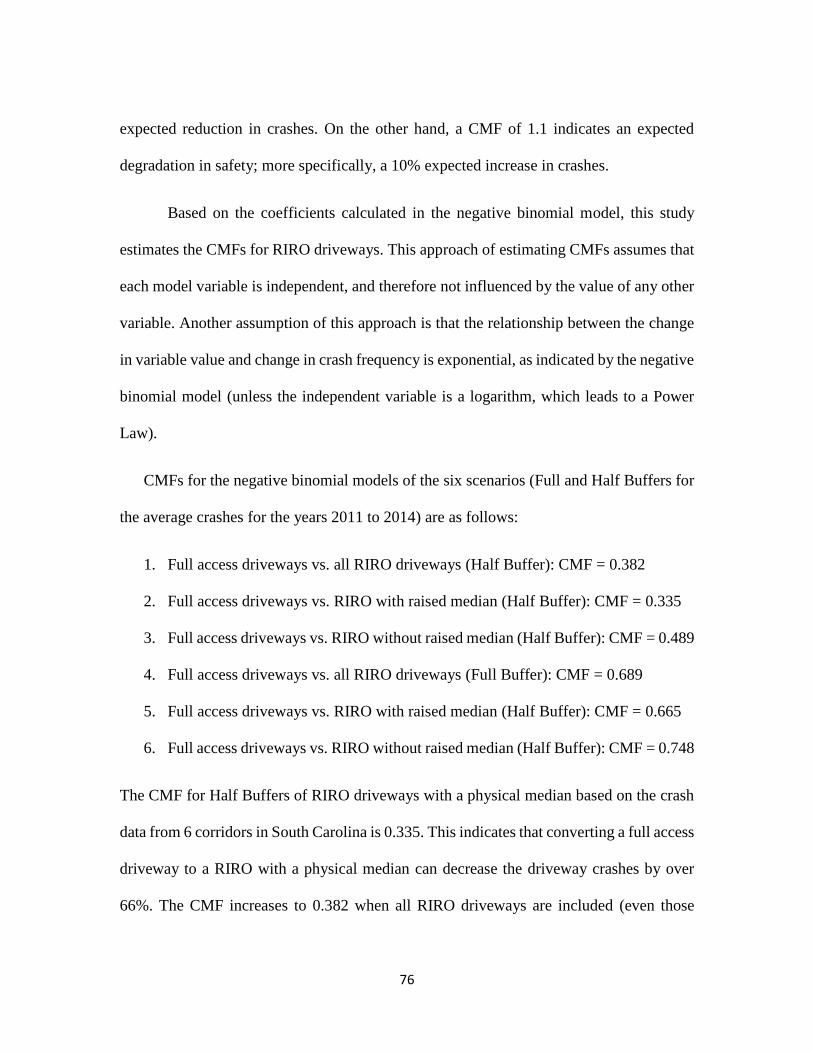
76
expected reduction in crashes. On the other hand, a CMF of 1.1 indicates an expected
degradation in safety; more specifically, a 10% expected increase in crashes.
Based on the coefficients calculated in the negative binomial model, this study
estimates the CMFs for RIRO driveways. This approach of estimating CMFs assumes that
each model variable is independent, and therefore not influenced by the value of any other
variable. Another assumption of this approach is that the relationship between the change
in variable value and change in crash frequency is exponential, as indicated by the negative
binomial model (unless the independent variable is a logarithm, which leads to a Power
Law).
CMFs for the negative binomial models of the six scenarios (Full and Half Buffers for
the average crashes for the years 2011 to 2014) are as follows:
1. Full access driveways vs. all RIRO driveways (Half Buffer): CMF = 0.382
2. Full access driveways vs. RIRO with raised median (Half Buffer): CMF = 0.335
3. Full access driveways vs. RIRO without raised median (Half Buffer): CMF = 0.489
4. Full access driveways vs. all RIRO driveways (Full Buffer): CMF = 0.689
5. Full access driveways vs. RIRO with raised median (Half Buffer): CMF = 0.665
6. Full access driveways vs. RIRO without raised median (Half Buffer): CMF = 0.748
The CMF for Half Buffers of RIRO driveways with a physical median based on the crash
data from 6 corridors in South Carolina is 0.335. This indicates that converting a full access
driveway to a RIRO with a physical median can decrease the driveway crashes by over
66%. The CMF increases to 0.382 when all RIRO driveways are included (even those

77
without a physical median. Based on the manner of collision as indicated in the crash
report, this increase is most likely attributable to driver noncompliance.

78
CHAPTER SIX
CONCLUSIONS AND RECOMMENDATIONS
Findings from this research confirm results from previous studies showing that
RIRO driveways produce much lower crash rates than full-access driveways. However, the
effectiveness of RIRO driveways is greatly dependent on driver compliance with turn
restrictions. Specific findings are summarized for each of the following research
concentrations:
1) Compliance data comparison for before and after bollard case study,
2) Crash rate comparison for RIRO driveways with and without median restrictions, and
3) Estimation of RIRO crash modification factors
The before and after case study conducted as part of this research showed that even
a well-design RIRO driveway, meeting all published design criteria, can experience a
considerable amount of illegal movements (11-15 percent of total driveway volume). The
installation of longitudinal bollards resulted in immediate compliance improvement at the
RIRO driveway. Additionally, the after-volume data indicated that the secondary full
access driveway received increased use after installation of the longitudinal bollards, with
no noticeable drop off in inbound and outbound traffic volumes indicating that the bollards
exhibited no adverse impacts on business patronage.
The summary statistics of 877 crashes at 1,365 RIRO driveways along 11 major
business corridors in South Carolina indicates that crash rates for RIRO driveways without

79
a physically prohibiting median treatment (1.27, 4-yr crash rate) are more than double that
of RIRO driveways with treatments (0.57, 4-yr. crash rate). Additionally, a much higher
proportion of angle crashes occur at RIRO driveways without treatments, even though left-
turn crossing movements should not occur, if driver compliance was not an issue.
Using driveway influence areas of RIRO driveways extending to the centreline
(half buffer) and all the travel lanes (full buffer) separately, crash modification factors were
calculated using statistical analysis of RIRO driveways. The reason for using full buffer
overlays is that they are less conservative in terms of crash counts compared to half buffers.
Based on half buffer overlays, the results indicate that for RIRO driveways with
physical median treatments (189 RIRO driveways) can reduce crashes by 67 percent as
compared with full access driveways. The overall beneficial impact drops to 51 percent
when RIRO driveways without physical medians (79 RIRO driveways) are combined in
the analysis. Using full buffer overlays, RIRO driveways with physical median treatments
(189 RIRO driveways) had 33.5 percent lower crashes compared to full access driveways.
The overall beneficial impact drops to 25 percent when RIRO driveways without physical
medians (79 RIRO driveways) are combined in the analysis. This can be attributed to
compliance issues associated with the RIRO driveways without physical medians. The
beneficial impact reduction would likely be even more dramatic if the proportion of RIRO
driveways without physical medians was not small compared to RIRO driveways with
physical medians.

80
The research has found a significant difference in terms of` safety between RIRO
driveways with raised medians and those without raised medians. Therefore, there are
safety benefits associated with RIROs with physical restriction for left turns. However,
retrofitting raised medians is not always feasible in urban and suburban corridors due to
roadway cross-sectional width limitations and construction issues. In such cases providing
flexible delineation devices is both economical and time saving, yet it is also effective in
providing physical restriction for illegal turn movements at the driveway.

81
REFERENCES
1. Gattis, J., J. Gluck, J. Barlow, R. Eck, W. Hecker, H. Levinson. Guide for the
geometric design of driveways. National cooperative highway research program,
Report No. 659. Transportation Research Board of the National Academies,
Washington, D.C., 2010.
2. Lu, J., Methodology to Quantify the Effects of Access Management on Roadway
Operations and Safety, 3 volumes, prepared by the University of South Florida for
the Florida Department of Transportation, 2001.
3. Eisele, William L., William E. Frawley. A Methodology for Determining
Economic Impacts of Raised Medians: Data Analysis on Additional Case Studies.
No. TX-00/3904-3. Texas Transportation Institute, Texas A & M University
System, 1999.
4. Eisele, W., W Frawley. Estimating the safety and operational impact of raised
medians and driveway density: Experiences from texas and oklahoma case
studies. In Transportation Research Record: Journal of the transportation research
board, No. 1931, Transportation Research Board of the National Academies,
Washington, D.C., 2005, pp. 108-116.

82
5. Zhou, H., J. J. Lu, X. K. Yang, S. Dissanayake, K. M. Williams. Operational
effects of u-turns as alternatives to direct left turns from driveways. In
Transportation Research Record: Journal of the transportation research board, No.
1796, Transportation Research Board of the National Academies, Washington,
D.C., 2002, pp. 72-79.
6. Liu, P., Lu, J., Zhou, H., Sokolow, G. Operational effects of u-turns as
alternatives to direct left-turns. J. Transp. Eng. Vol. 133(5), 2007, pp. 327–334.
7. Yang, X., Zhou, H. CORSIM-Based simulation approach to evaluation of direct
left turn versus right turn plus u-turn from driveways. J. Transp. Eng., Vol.
130(1), 2004, pp. 68-75.
8. Qi, Y., C. Xiaoming, L. Yu, H. Liu, G. Liu, D. Li, K. Persad, K. Pruner.
Development of guidelines for operationally effective raised medians and the use
of alternative movements on urban roadways. Publication FHWA/TX-13/0-6644-
1. FHWA, TX Department of Transportation, 2013.
9. Lu, J. J., P. Liu, F. Pirinccioglu. Determination of the offset distance between
driveway exits and downstream u-turn locations. Publication BD544-05, Florida
Department of Transportation, 2005.
10. AASHTO (2010), Highway Safety Manual, First Edition, American Association
of State Highway and Transportation Officials Washington, DC, pp. 1296.
83
11. Box, P.C., and Associates, “Effects of Intersections on Driveway Accidents,”
Conference Proceedings of Third Nation Access Management Conference, U.S.
Department of Transportation, Fort Lauderdale, FL, pp 417-431, 1998.
12. Stokes, A., W. Sarasua, N. Huynh, K. Brown, J. Ogle, A. Mammardahimli, W.
Davis, M. Chowdhury, “Safety Analysis of Driveway Characteristics along Major
Urban Arterial Corridors in South Carolina,” 16-6766, Proceedings of the 95th
Annual Transportation Research Board Meeting, Washington, DC, 2016.
13. Dixon, K., R. Layton, “Risk Rating Procedure for Assessing Driveway
Configurations,” 12-4267, Proceedings of the 91st Annual Transportation
Research Board Meeting, Washington, DC, 2012.
14. Zhou, Y., K. Dixon, J. Gattis, “The Influences of Cross-Sectional Design
Elements at Urban Arterial Driveway Locations,” 15-3219, Proceedings of the
94th Annual Transportation Research Board Meeting, Washington, DC, 2015.
15. Gattis, J., Hutchison, D. (2000) “Comparison of Delay and Accidents on Three
Roadway Access Designs in Springfiel,” 4th National Access Management
Conference, Portland, OR
16. Mauga, T., M. Kaseko. "Modeling and Evaluating the Safety Impacts of Access
Management (AM) Features in the Las Vegas Valley." In Transportation
Research Record: Journal of the Transportation Research Board, No. 2171,
Transportation Research Board of the National Academies, Washington, D.C.,
2010, pp. 57-65..
84
17. Jurgita Kinderyte‐Poškiene, Edgar Sokolovskij. Traffic control elements influence
on accidents, mobility and the environment. Transport, Vol. 23(1), 2008, pp. 5-58.
18. Hallmark, S., E. Peterson, E. Fitzsimmons, N. Hawkins, J. Resler, T. Welch,
Evaluation of gateway and low-cost traffic-calming treatments for major routes in
small rural communities," InTrans Project Reports. 2007.
19. Zhou, H., J. Zhao, P. Hsu, J. Huang, Safety effects of median treatments using
longitudinal channelizers: Empirical bayesian before-and-after study. J. Transp.
Eng., Vol. 139(12), 2013, pp. 1149-1155.
20. SCDOT, (2008) “Access and Roadside Management Standards,” SCDOT Traffic
Engineering, South Carolina Department of Transportation, Columbia, SC, 130
pp.
21. US DOT (2009). Manual on Uniform Traffic Control Devices, (Revised 2015).
U.S. Department of Transportation, Washington, DC, pp. 862.
22. Brown, K. Sarasua, W., Ogle, J., Mammadrahimli, A., Chowdhury, M., Davis,
W., Huynh, N., "Assessment of Crash Location Improvements in Map-Based
Geocoding Systems and Subsequent Benefits to Geospatial Crash Analysis",
Conference Proceeding, Transportation Research Board 94th Annual Meeting
(15-5364), 2015.
85
23. Sarasua, W., Davis, W., Ogle, J., Huynh, N., and Chowdhury, R., Support for the
Development and Implementation of an Access Management Program through
Research and Analysis of Collision Data, Report No. FHWA-SC-15-02, South
Carolina Department of Transportation, 2015