analysis of rainfall onset, cessation and length of …ousmane/print/onset/...analysis of rainfall...
TRANSCRIPT

a g r i c u l t u r a l a n d f o r e s t m e t e o r o l o g y 1 4 8 ( 2 0 0 8 ) 1 1 2 3 – 1 1 3 5
avai lab le at www.sc iencedi rec t .com
journal homepage: www.e lsev ier .com/ locate /agr formet
Analysis of rainfall onset, cessation and length of growingseason for western Kenya
Edward M. Mugalavai a, Emmanuel C. Kipkorir a,*, Dirk Raes b, Manchiraju S. Rao c
aMoi University, School of Environmental Studies, P.O. Box 3900, Eldoret, KenyabDepartment of Land Management and Economics, K.U. Leuven University, Celestijnenlaan 200E, B-3001 Leuven, BelgiumcCentre for Atmospheric Science and Weather Modification, Jawaharlal Nehru Technological University, Kukatpally, 500085 Hyderabad, India
a r t i c l e i n f o
Article history:
Received 27 June 2007
Received in revised form
27 February 2008
Accepted 29 February 2008
Keywords:
Planning
Rainfed agriculture
Dependable probability levels
Soil water balance
a b s t r a c t
Onset, cessation and length of growing season statistics are generated for both long and
short rainy seasons in western Kenya. Onset identification is based on a daily analysis of the
soil water balance over the initial growth stage (30 days) by identifying and quantifying the
risk of failure of crop development. Cessation is based on a daily analysis of the soil water
balance by identifying and quantifying the water stress in the root zone for maize. The
length of growing season for a particular year is obtained from the difference between
cessation and onset of that year. Historical daily climatic data of a 15–34-year period and soil
data from 26 stations, spatially distributed in the study area, were considered. Results
indicate that there exist organized progression of rainfall onset within the western Kenya
region with the long rains showing a southerly progression while the short rains show a
south-westerly progression. Cessation of rainfall for both seasons show strong localized
influences, mainly surrounding Lake Victoria and forested areas, including orographic
features. For stations with long length of growing season, the length varies more than
# 2008 Elsevier B.V. All rights reserved.
the onset date.
1. Introduction
Lake Victoria Basin in western Kenya, is an area of high
agricultural potential for both subsistence and plantation
farming. The area is characterized by two rainfall seasons: the
long rains and the short rains. The agricultural activities in
this area are mainly rainfed. However, the rainfall character-
istics in terms of length of growing season have always been
uncertain due to high variability of onset and cessation of the
rainy season. In some years the rains start early while in
others it arrives late. The yearly variation makes the planning
of sowing and the selection of the crop type and variety rather
difficult. Generally yields may suffer significantly with either a
late onset or early cessation of the growing season, as well as
with a high frequency of damaging dry spells within the
* Corresponding author. Tel.: +254 53 43013; fax: +254 53 43149.E-mail addresses: [email protected], ekipkorir@mu
0168-1923/$ – see front matter # 2008 Elsevier B.V. All rights reservedoi:10.1016/j.agrformet.2008.02.013
growing season. The ability to estimate effectively the actual
start of the season therefore becomes vital. In order to plan
rainfed agriculture, dependable probability levels of onset
dates of the rainy period and length of growing season are
important.
Previous work on rainfall onset has employed different
techniques depending on the rain generating mechanisms of
the region in question. Ilesanmi (1972) empirically formulated
the onset, advance and cessation of the rains in Nigeria.
Oshodi (1971), using a simple pentad method, arrived at
similar isochrones of the onset of the rains in Nigeria. Nicholls
(1984) used a wet season onset index in determining beyond
reasonable doubt, the existence of the predictability of
seasonal rainfall in Australia. Calooy (1981) used auto-
regression models in predicting the seasonal rainfall of
.ac.ke (E.C. Kipkorir).
d.

a g r i c u l t u r a l a n d f o r e s t m e t e o r o l o g y 1 4 8 ( 2 0 0 8 ) 1 1 2 3 – 1 1 3 51124
Bangladesh. Lineham (1983) used a water balance method in
determining the onset and cessation of the rainy season in
Zimbabwe. FAO (1978) defined the start of the growing season
as the date when precipitation exceeds half of the potential
evapotranspiration. Stewart and Hash (1982) evaluated the
suitability of a given crop for a semi-arid location in Kenya
using a water balance approach. Individual seasons were
categorized according to date of rain onset and adequacy of
rainfall for maize. This allowed recommendations on seed and
fertiliser rates and thinning out of plants to be made and yield
predicted for planning purposes. For bimodal rainfall regions
of Kenya it was shown (Stewart, 1985), that if the onset of rains
is early, maize could be grown, but in the case of delayed onset,
which occurs in about half the number of years, sorghum and
millet should be favoured over maize. Raes et al. (2004) carried
out an evaluation of first planting dates in Zimbabwe by
means of a soil water balance model and recommended the
DEPTH (40 mm of rain in 4 days) criterion, based on the
farmers’ practices as an appropriate wet season sowing
criterion.
The presence of a relationship between the onset and
cessation dates and between the length of the season and the
onset and/or cessation dates is also very relevant for planning
activities in the season. Sivakumar (1988) carried out an
analysis of long-term daily rainfall data for 58 locations in the
southern Sahelian and Sudanian climatic zones of West
Africa. The study showed that a significant relationship exists
between the onset of rains and the length of the growing
season. Oladipo and Kyari (1993) investigated the fluctuation
in the onset, cessation and length of the growing season in
Northern Nigeria and reported also that the length of the
growing season is more sensitive to the onset of the rains than
to the cessation. Reliable prediction of rainfall characteristics,
especially the onset, is needed to determine a less risky
planting date or planting method, or sowing of less risky types/
varieties of crops in responsive farming (Stewart, 1991).
In this study the two rainy seasons in western Kenya are
analyzed with the objective to determine the patterns of
rainfall onset, cessation and length of growing season and
subsequently establish the relationships between these
characteristics.
2. Materials and methods
2.1. Study area
The lake Victoria Basin which lies in the western part of Kenya
between 18300N and 28000S and between 348000E and 358450E is
considered in this study. The study area has close to
48,000 km2 and is bordered by Uganda to the west, Tanzania
to the south, and demarcated by the lake basin boundaries in
the north and the east. Administratively, Nyanza and Western
Provinces, and the western parts of Rift Valley province fall in
this region (Fig. 1). The region is an area of high agricultural
potential for both subsistence and plantation farming. The
agricultural activities in this area are mainly under rainfed
conditions.
The rainfall characteristics in the study area are influenced
by several factors, which range from meso- to global-scale.
These factors include; the meso-scale circulation induced by
Lake Victoria, the Inter-Tropical Convergence Zone (ITCZ) and
the Congo air mass (Ininda, 1994). There are two main rainfall
seasons in the area, the ‘long rains’, which occur from mid
March to May and the ‘short rains’, which occur from mid
October to early December. The rains are usually associated
with the northward/southward movement of the ITCZ.
Daily rainfall records and mean daily evaporation from 26
weather stations (Fig. 1) were collected for a period of 15–34
years from Kenya Meteorological Department (KMD) head-
quarters. The characteristics of the stations are presented in
Table 1 with daily rainfall records spanning from 1970 to 2003
apart for Baraton University station, which spans from 1960 to
1987. Only eight stations had pan evaporation data (Epan) based
on class A pan. The estimation of evaporation data for the
other stations was based on the homogeneous zonation of the
Lake Victoria basin established by Ogallo (1980, 1989) and
Agwata (1992). Spatially evaporation changes slowly and
therefore this estimation was considered representative for
the region. The eight stations were within the established
homogeneous zones in the region and thus the evaporation
data for the remaining stations was interpolated for these
particular zones. Mean daily reference evapotranspiration
(ETo) was derived from Epan data by using a representative pan
coefficient (Allen et al., 1998) for each of the eight meteor-
ological stations.
Characteristics of the top soil for soil types found in the
study area are indicated in Table 2. These are indicative
values, which are obtained by means of a pedotransfer
function (Saxton et al., 1986; Saxton, 2003) by considering
the soil type.
2.2. Onset criteria
Onset is quantified by the DEPTH method described by Raes
et al. (2004). It considers a cumulative rainfall depth that will
bring the top 0.25 m of the soil profile to field capacity during a
maximum of 4 days. The corresponding threshold rainfall
quantifies the field inspection method by farmers to deter-
mine whether conditions are favourable for wet sowing. This
is achieved by digging a test hole, usually a day after a rain
event. The logic is to allow the rain to reach deeper layers of
the soil, forming a recognisable wetting front. The total
available soil water (TAW) during the initial stage for annual
crops, for the major soils in the study area (Table 2) was used to
determine the amount of rainfall required to raise the soil
water content from wilting point to field capacity. Since TAW
values in Table 2 do not vary widely from one soil type to
another, with an exception of silt loam found in one station, an
average TAW was considered. A mean threshold value of 40-
mm rainfall is obtained by upgrading the TAW values (Table 2)
by 20% to take care of losses by surface runoff, non-uniform
wetting, and soil evaporation. Evaluation of onset criteria
revealed that a threshold value of 40 mm rainfall during a
maximum of 4 days is appropriate for the study area
(Mugalavai, 2007; Kipkorir et al., 2007).
For each of the 26 stations, and for each of the 15–34 years
of the period that daily rainfall data was available, RAIN
software (Kipkorir, 2005) was used to determine the actual
onset and cessation dates for each year. RAIN is a software
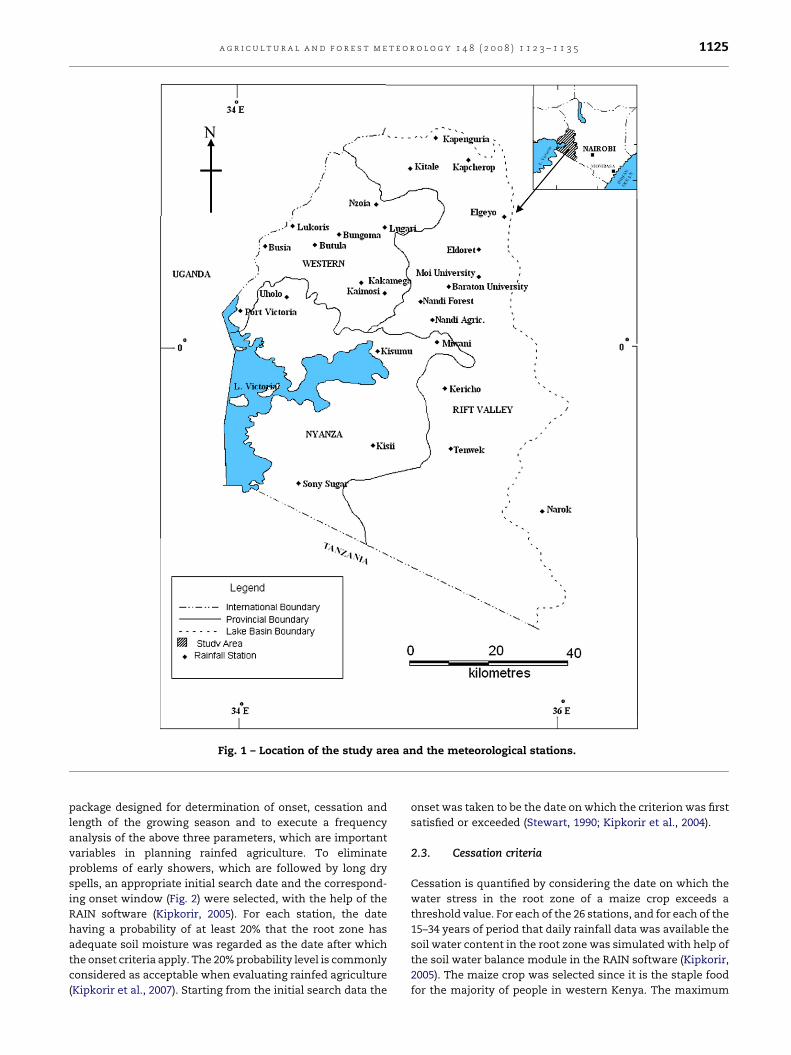
Fig. 1 – Location of the study area and the meteorological stations.
a g r i c u l t u r a l a n d f o r e s t m e t e o r o l o g y 1 4 8 ( 2 0 0 8 ) 1 1 2 3 – 1 1 3 5 1125
package designed for determination of onset, cessation and
length of the growing season and to execute a frequency
analysis of the above three parameters, which are important
variables in planning rainfed agriculture. To eliminate
problems of early showers, which are followed by long dry
spells, an appropriate initial search date and the correspond-
ing onset window (Fig. 2) were selected, with the help of the
RAIN software (Kipkorir, 2005). For each station, the date
having a probability of at least 20% that the root zone has
adequate soil moisture was regarded as the date after which
the onset criteria apply. The 20% probability level is commonly
considered as acceptable when evaluating rainfed agriculture
(Kipkorir et al., 2007). Starting from the initial search data the
onset was taken to be the date on which the criterion was first
satisfied or exceeded (Stewart, 1990; Kipkorir et al., 2004).
2.3. Cessation criteria
Cessation is quantified by considering the date on which the
water stress in the root zone of a maize crop exceeds a
threshold value. For each of the 26 stations, and for each of the
15–34 years of period that daily rainfall data was available the
soil water content in the root zone was simulated with help of
the soil water balance module in the RAIN software (Kipkorir,
2005). The maize crop was selected since it is the staple food
for the majority of people in western Kenya. The maximum

Table 1 – Characteristics of the 26 meteorological stations used in the study
Station name Latitude Longitude Altitude(m)
Record(years)
Mean annualrainfall (mm)
Climate Soil type Data
Narok 18060S 358520E 1576 34 779 Semi-humid Silt loam P, Epan
Sony-Sugar 08540S 348320E 1455 18 1806 Humid Clay P
Tenwek 08450S 358220E 2000 33 1451 Humid Clay loam P
Kisii 08410S 348470E 1761 34 2106 Humid Clay P, Epan
Kericho 08220S 35816E 1965 30 1956 Humid Clay loam P, Epan
Kisumu 0806S 348450E 1142 34 1354 Humid Clay P, Epan
Miwani 08030S 348590E 1200 26 1418 Humid Clay P
Nandi Agric 08070N 358110E 1988 25 1480 Humid Clay P
Port Victoria 08090N 348010E 1212 20 776 Transitional Clay P
Uholo 08110N 348200E 1212 34 1731 Humid Clay P
Nandi Forest 08120N 358040E 1970 26 1822 Humid Clay P
Kaimosi 08130N 348570E 1697 29 1809 Humid Clay P
Baraton University 08150N 358050E 1970 28 1639 Humid Clay P
Kakamega 08160N 348450E 1585 34 1926 Humid Clay P, Epan
Moi University 08170N 358200E 2240 15 1252 Humid Sandy loam P, Epan
Butula 08200N 348210E 1288 34 1930 Humid Clay P
Busia 08280N 348060E 1182 34 1891 Humid Clay P
Eldoret 08320N 358170E 2120 32 1063 Sub-humid Sandy loam P, Epan
Bungoma 08350N 348340E 1394 34 1511 Humid Clay P
Lukoris 08380N 348150E 1212 30 1443 Humid Clay P
Lugari 08400N 348540E 1680 34 1371 Humid Sandy clay loam P
Elgeyo 08430N 358310E 2303 34 1302 Humid Sandy loam P
Nzoia 08450N 348560E 1812 34 1291 Humid Clay P
Kitale 18000N 348590E 1840 25 1256 Humid Clay P, Epan
Kapcherop 18030N 358190E 2212 34 1211 Humid Sandy loam P
Kapenguria 18140N 358070E 2121 25 1223 Humid Sandy loam P
P indicates that rainfall data were available; Epan indicates that pan evaporation data were available.
a g r i c u l t u r a l a n d f o r e s t m e t e o r o l o g y 1 4 8 ( 2 0 0 8 ) 1 1 2 3 – 1 1 3 51126
rooting depth for maize of 0.70 m and a readily available soil
water (RAW) of 50% of TAW were considered in this study.
Water stress was assessed by means of the water stress
coefficient Ks (Allen et al., 1998). As long as a fraction of RAW
remains available in the root zone, there is no water stress and
Ks is 1. When water stress occurs, Ks decreases linearly with
the soil water content and becomes zero when wilting point is
reached. The cessation of the rainy season is assumed whenKs
drops below 0.40 within the cessation window (Fig. 2). At that
moment the crop experiences severe water stress and early
canopy senescence is likely to be triggered. This simple
approach eliminates the unrealistic long back-ends to the
growing season. The cessation was taken to be the date on
which the criterion was first satisfied or exceeded.
The simulation period is specified as between the derived
onset date and the latest cessation date (Fig. 2). To avoid
Table 2 – Soil water contents and the corresponding totalavailable water (TAW) in the 0.25-m soil profile for soiltypes used in the study
Soil type Fieldcapacity(vol.%)
Wiltingpoint
(vol.%)
TAW(mm/0.25 msoil depth)
Silt loam 33.8 9.2 62
Clay loam 40.0 26.4 34
Clay 42.4 29.8 32
Sandy clay loam 23.4 10.7 32
Sandy loam 23.8 10.0 35
negative length of the growing season, the difference between
the earliest cessation and latest onset is set at a minimum of
10 days. To eliminate problems of late showers, which are
followed by long dry spells, an appropriate late cessation
search date had to be chosen. The date having a probability of
at least 20% that the root zone has adequate soil moisture (i.e.,
Ks is 1) was regarded as the date before which the cessation
criteria apply.
2.4. Length of growing season
The length of the growing season (days) for a particular year is
taken as the difference between the Julian day numbers of the
Fig. 2 – Probability on a day with adequate root zone soil
moisture for Lukoris climatic station with indication of the
onset and cessation search windows for long rainy
season.
a g r i c u l t u r a l a n d f o r e s t m e t e o r o l o g y 1 4 8 ( 2 0 0 8 ) 1 1 2 3 – 1 1 3 5 1127
determined cessation date and the determined onset date for
that year.
2.5. Statistical analysis
Probabilities of exceedance of the onset and cessation dates
(specified as Julian day numbers) and of the length of growing
season were calculated using the frequency analysis module
in the RAIN software (Kipkorir, 2005). The frequency analysis
in RAIN is based on ranking the data values in a descending
order and assigning a serial rank number to each value to
obtain a plotting position. The plotting position corresponds
with frequency of exceedance on probability scale of prob-
ability plot. After selecting the distribution assumption, data
values are plotted and a theoretical distribution line drawn. In
RAIN normal probability distribution function is used, how-
ever, the data can be transformed using log, square or square
root functions. Instead of drawing the theoretical line, a
straight line can be fitted through the data points by the
method of least squares and information on the goodness of fit
(R2) is displayed. If the R2 value is acceptable, it may be
assumed that the data can be approximated by the assumed
distribution. After selecting the type of distribution with the
best fit, the 80, 50 and 20% probabilities of exceedance were
determined and used as indicators of early, normal and late
onset and cessation dates, respectively. For the length of
growing season analysis, the 80, 50 and 20% probabilities of
exceedance were determined and used as indicators of short,
normal and long season. To confirm that the selected onset
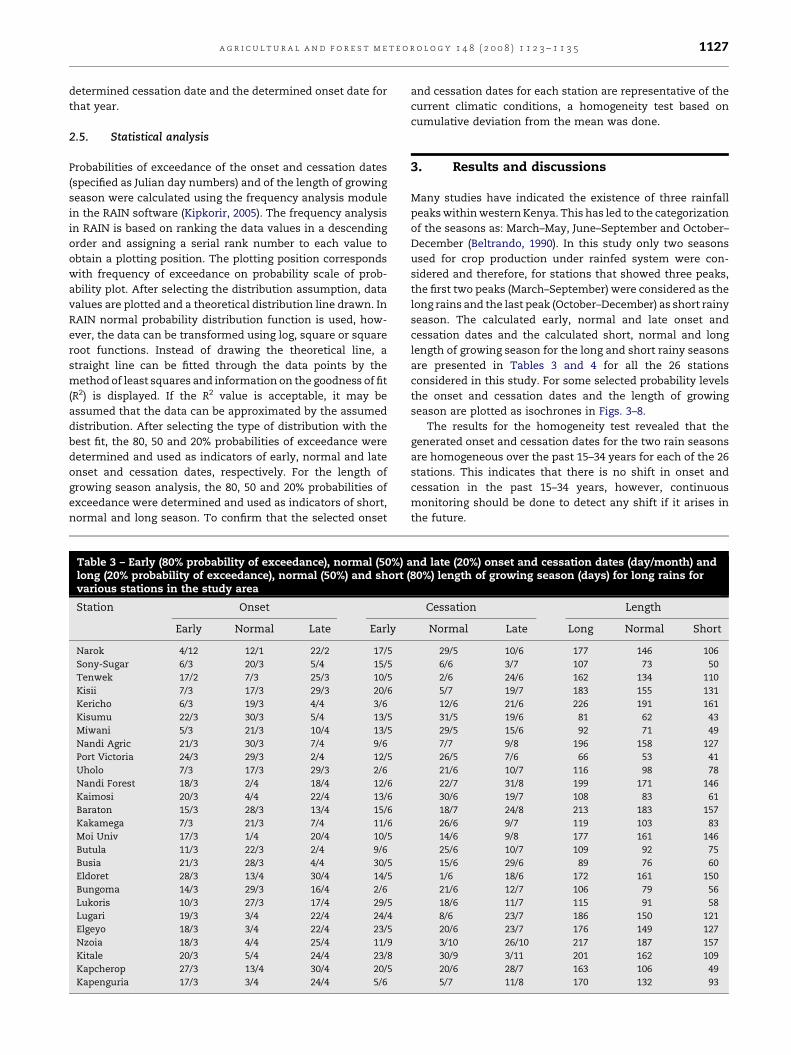
Table 3 – Early (80% probability of exceedance), normal (50%) along (20% probability of exceedance), normal (50%) and short (various stations in the study area
Station Onset
Early Normal Late Early
Narok 4/12 12/1 22/2 17/5
Sony-Sugar 6/3 20/3 5/4 15/5
Tenwek 17/2 7/3 25/3 10/5
Kisii 7/3 17/3 29/3 20/6
Kericho 6/3 19/3 4/4 3/6
Kisumu 22/3 30/3 5/4 13/5
Miwani 5/3 21/3 10/4 13/5
Nandi Agric 21/3 30/3 7/4 9/6
Port Victoria 24/3 29/3 2/4 12/5
Uholo 7/3 17/3 29/3 2/6
Nandi Forest 18/3 2/4 18/4 12/6
Kaimosi 20/3 4/4 22/4 13/6
Baraton 15/3 28/3 13/4 15/6
Kakamega 7/3 21/3 7/4 11/6
Moi Univ 17/3 1/4 20/4 10/5
Butula 11/3 22/3 2/4 9/6
Busia 21/3 28/3 4/4 30/5
Eldoret 28/3 13/4 30/4 14/5
Bungoma 14/3 29/3 16/4 2/6
Lukoris 10/3 27/3 17/4 29/5
Lugari 19/3 3/4 22/4 24/4
Elgeyo 18/3 3/4 22/4 23/5
Nzoia 18/3 4/4 25/4 11/9
Kitale 20/3 5/4 24/4 23/8
Kapcherop 27/3 13/4 30/4 20/5
Kapenguria 17/3 3/4 24/4 5/6
and cessation dates for each station are representative of the
current climatic conditions, a homogeneity test based on
cumulative deviation from the mean was done.
3. Results and discussions
Many studies have indicated the existence of three rainfall
peaks within western Kenya. This has led to the categorization
of the seasons as: March–May, June–September and October–
December (Beltrando, 1990). In this study only two seasons
used for crop production under rainfed system were con-
sidered and therefore, for stations that showed three peaks,
the first two peaks (March–September) were considered as the
long rains and the last peak (October–December) as short rainy
season. The calculated early, normal and late onset and
cessation dates and the calculated short, normal and long
length of growing season for the long and short rainy seasons
are presented in Tables 3 and 4 for all the 26 stations
considered in this study. For some selected probability levels
the onset and cessation dates and the length of growing
season are plotted as isochrones in Figs. 3–8.
The results for the homogeneity test revealed that the
generated onset and cessation dates for the two rain seasons
are homogeneous over the past 15–34 years for each of the 26
stations. This indicates that there is no shift in onset and
cessation in the past 15–34 years, however, continuous
monitoring should be done to detect any shift if it arises in
the future.
nd late (20%) onset and cessation dates (day/month) and80%) length of growing season (days) for long rains for
Cessation Length
Normal Late Long Normal Short
29/5 10/6 177 146 106
6/6 3/7 107 73 50
2/6 24/6 162 134 110
5/7 19/7 183 155 131
12/6 21/6 226 191 161
31/5 19/6 81 62 43
29/5 15/6 92 71 49
7/7 9/8 196 158 127
26/5 7/6 66 53 41
21/6 10/7 116 98 78
22/7 31/8 199 171 146
30/6 19/7 108 83 61
18/7 24/8 213 183 157
26/6 9/7 119 103 83
14/6 9/8 177 161 146
25/6 10/7 109 92 75
15/6 29/6 89 76 60
1/6 18/6 172 161 150
21/6 12/7 106 79 56
18/6 11/7 115 91 58
8/6 23/7 186 150 121
20/6 23/7 176 149 127
3/10 26/10 217 187 157
30/9 3/11 201 162 109
20/6 28/7 163 106 49
5/7 11/8 170 132 93

Table 4 – Early (80% probability of exceedance), normal (50%) and late (20%) onset and cessation dates (day/month) andlong (20% probability of exceedance), normal (50%) and short (80%) length of growing season (days) for short rains forvarious stations in the study area
Station Onset Cessation Length
Early Normal Late Early Normal Late Long Normal Short
Narok – – – – – – – – –
Sony-Sugar 19/7 19/8 25/9 1/12 12/12 23/12 141 118 88
Tenwek 25/8 30/8 3/9 18/11 2/12 16/12 106 95 84
Kisii 31/7 24/8 19/9 5/12 13/12 21/12 127 112 94
Kericho 3/8 11/8 19/8 21/11 2/12 13/12 133 116 95
Kisumu 7/11 9/11 11/11 23/11 30/11 8/12 30 20 13
Miwani 30/10 4/11 8/11 16/11 27/11 8/12 36 19 10
Nandi Agric 27/10 31/10 5/11 23/11 28/11 4/12 37 26 18
Port Victoria 9/11 10/11 11/11 23/11 24/11 26/11 21 15 0
Uholo 24/7 16/8 5/9 20/11 29/11 7/12 120 105 89
Nandi Forest 18/10 21/10 23/10 3/11 16/11 30/11 37 24 16
Kaimosi 8/7 23/7 8/8 15/10 5/11 26/11 127 102 82
Baraton 29/7 6/8 13/8 18/10 3/11 21/11 106 88 74
Kakamega 9/7 26/7 14/8 9/11 23/11 8/12 140 117 98
Moi Univ 8/10 17/10 27/10 10/11 18/11 25/11 44 31 18
Butula 4/8 26/8 18/9 16/11 26/11 5/12 105 94 80
Busia 9/8 30/8 22/9 12/11 22/11 2/12 108 89 64
Eldoret 3/10 15/10 26/10 14/11 21/11 27/11 54 41 23
Bungoma 15/8 25/8 3/9 28/10 9/11 21/11 102 77 53
Lukoris 17/10 25/10 3/11 19/11 27/11 4/12 48 33 17
Lugari 10/10 15/10 19/10 6/11 13/11 20/11 39 29 20
Elgeyo 21/10 28/10 3/11 20/11 28/11 7/12 42 30 21
Nzoia 7/8 11/8 15/8 17/9 6/10 27/10 73 55 40
Kitale 11/10 19/10 28/10 15/11 28/11 12/12 58 45 25
Kapcherop 11/10 16/10 21/10 12/11 20/11 27/11 46 32 22
Kapenguria 14/10 17/10 21/10 27/10 11/11 26/11 35 23 15
– indicates non-existence of short rains season at the station.
a g r i c u l t u r a l a n d f o r e s t m e t e o r o l o g y 1 4 8 ( 2 0 0 8 ) 1 1 2 3 – 1 1 3 51128
For the long rains, onset ranges from early March to end of
April in the region (Table 3). In a year with an early onset for
the long-rainy season, the onset over the region generally
shows a gradual progression from the southern part of the
basin towards the north, however, it shows a general south-
westerly progression from the Lake Victoria area. Since this is
the period when the south-east (SE) monsoon sets in, there is a
south-easterly progression of the onset and the stronger
south-westerly progression and gradually, both arms move
northwards (Fig. 3). Onset results indicate availability of
homogeneous zones and examples are the northeasterly
moving ridge covering Uholo, Busia and Bungoma and around
Nandi Forest and Nandi Agriculture stations (Fig. 3). These
findings are in agreement with those of Barring (1988) who
analyzed the spatial patterns of daily rainfall from 73 stations
in Kenya, and defined 11 major regions partly linked to
orographic features. The results indicate an organized
progression of the rain belt which, contradicts the observation
by Alusa and Mushi (1974) that dismissed the existence of such
organized movement of rain belts within Kenya except at the
Coast. This could primarily be attributed to the poor coverage
of data up to that time.
Results indicate that cessation of the long rains is generally
slow from the south but as it progresses northwards its speed
increases due to the orographic effects around Kisii, Kericho
and Sony-Sugar (Fig. 4). Cessation generally shows an
increasing pattern from south to north. However, around
Kisumu and Miwani stations, the pattern suddenly changes.
The area around Kisumu gets an early cessation because it is a
lowland channel between the high grounds north and south of
it. The air within the channel undergoes horizontal divergence
as it flows. This divergence causes an early cessation in the
area since it does not favour formation of rains. From the
channel towards the high grounds in the north, progress is
faster up to July, but beyond that meso-scale factors take
control of the cessation. The divergence that is prevalent in
this region between June and September delineates the lake
basin into two with the lowland channel around Kisumu
acting as a transition zone. This creates different patterns of
cessation north and south of the channel. In the southern part,
cessation progresses from late May (30) to early July (5). From
the channel towards the north, cessation also occurs faster
starting from late May (30) to early July (5). Beyond that the
cessation tends to follow localized patterns with some form of
closed isochrones, for example the area around Nzoia and
Kitale. This pattern is attributed to the presence of Nzoia
forest, which influences the microclimate of the area. It is,
however, clear that cessation generally progresses from the
southern part to the northern part, although this pattern is
interfered with in the lowland channel. However, after the
channel the pattern increases northwards although creating
some closed patterns due to meso-scale factors (Fig. 4).
The normal lengths of the long rains growing season
results (Fig. 5) indicate that there are stations with shorter

Fig. 3 – Early (80% probability of exceedance) onset dates (day/month) for long rains for various stations in the study area.
a g r i c u l t u r a l a n d f o r e s t m e t e o r o l o g y 1 4 8 ( 2 0 0 8 ) 1 1 2 3 – 1 1 3 5 1129
lengths (�140 days) and others that have longer lengths (>140
days). Therefore the whole region can be delineated into two
by use of the determined lengths of growing season (Fig. 5).
Results indicated that the stations that grow crops with short
growing lengths (�140 days) are mainly situated to the
western part of the Kenyan Lake Victoria basin with normal
onset, cessation and length of 27 March, 15 June, and 80 days,
respectively. Stations that grow crops with long growing
lengths (>140 days) are situated to the eastern part of the Lake
Victoria Basin region with normal onset, cessation and length
of 25 April, 27 September and 155 days, respectively.
To determine the strength of the relationships between the
onset and cessation dates and the length of growing season for
the long rains a correlation analysis was done. The stations
were divided into two groups: those with a short (�140 days)
and those with a long length (>140 days) of growing season.
Results indicate a positive correlation between the length of
the growing season and the cessation of the long rains. The
correlation is strong (r = 0.9) for stations with a short length of
season, and weak (r = 0.3) for stations with a long length of the
long rainy season. Similarly a negative correlation exists
between the length of the growing season and the onset of the
long rains. The correlation is strong (r = �0.6) for stations with
a short length of season, and weak (r = �0.3) for stations with a
long length of the long rainy season. The noted difference in
strength of the correlation can be attributed to the fact that the

Fig. 4 – Normal (50% probability of exceedance) cessation for long rains for various stations in the study area.
a g r i c u l t u r a l a n d f o r e s t m e t e o r o l o g y 1 4 8 ( 2 0 0 8 ) 1 1 2 3 – 1 1 3 51130
longer the lengths of the growing season the larger the
variations between stations.
The correlation between the onset and cessation date is
very weak (r = �0.1) for the stations with a short growing
length but very strong (r = 0.9) for the stations with long
growing length. Therefore there is no significant relationship
between onset and cessation for the stations with short
growing lengths. For the stations with a long growing length,
an early onset translates to an early cessation during the long
rainy season.
The western Kenya region experiences a rainfall peak
during July/August, which is associated with the westerly
influx of moisture from the Atlantic Ocean and moist Congo
air masses. This study considered this period to constitute the
onset of the short rains. During this period the lake basin
region is located south of the ITCZ and the rains occur mainly
as thunderstorms in the deep monsoon air originating from
the Congo Basin. The results reveal that onset of the short
rains generally show a southwesterly progression (Fig. 6)
confirming that the Congo Basin, which lies to the west of this
region, plays an important role in the occurrence of short
rains.
The contribution of the Congo air masses is enhanced by
the convergence of the NE and SE monsoon winds which

Fig. 5 – Normal (50% probability of exceedance) length of growing season (days) for long rains for various stations in the
study area.
a g r i c u l t u r a l a n d f o r e s t m e t e o r o l o g y 1 4 8 ( 2 0 0 8 ) 1 1 2 3 – 1 1 3 5 1131
converge over the area in October just after the passage of the
ITCZ as it moves southwards. Activities intensify in October
since the ITCZ normally lags behind the seasonal movement
of the overhead sun by about 3–4 weeks. The onset of the short
rains do not indicate a direct progression from south to north
but clearly reveal a southwesterly progression of the onset
with two arms: one to the north and another to the south
revolving around the Kisumu lowland channel. Both arms
show that the onset progresses from mid-late August and
extends to late October. However, the strong localized effects
of the Kakamega forest causes an early onset that is indicated
by the closed isochrones around the forested area (Fig. 6). The
closed isochrone emphasizes the influence of Kakamega
forest, which is a remnant of the tropical rain forest. For this
station, the onset occurs in July and spreads out to other areas.
During the month of November–December (northern
winter), the NE monsoon is predominant over the Lake
Victoria basin region. The NE monsoon air current has its
roots in the high-pressure centre over the Arabian and Indian
subcontinent. Since this air current has a continental origin, it
is dry and it has also been observed to be divergent over
eastern Africa (Findlater, 1971; Anyamba, 1983). This explains
why cessation occurs during this period. The plot for the
cessation dates (Fig. 7) suggests strong micro- to meso-scale
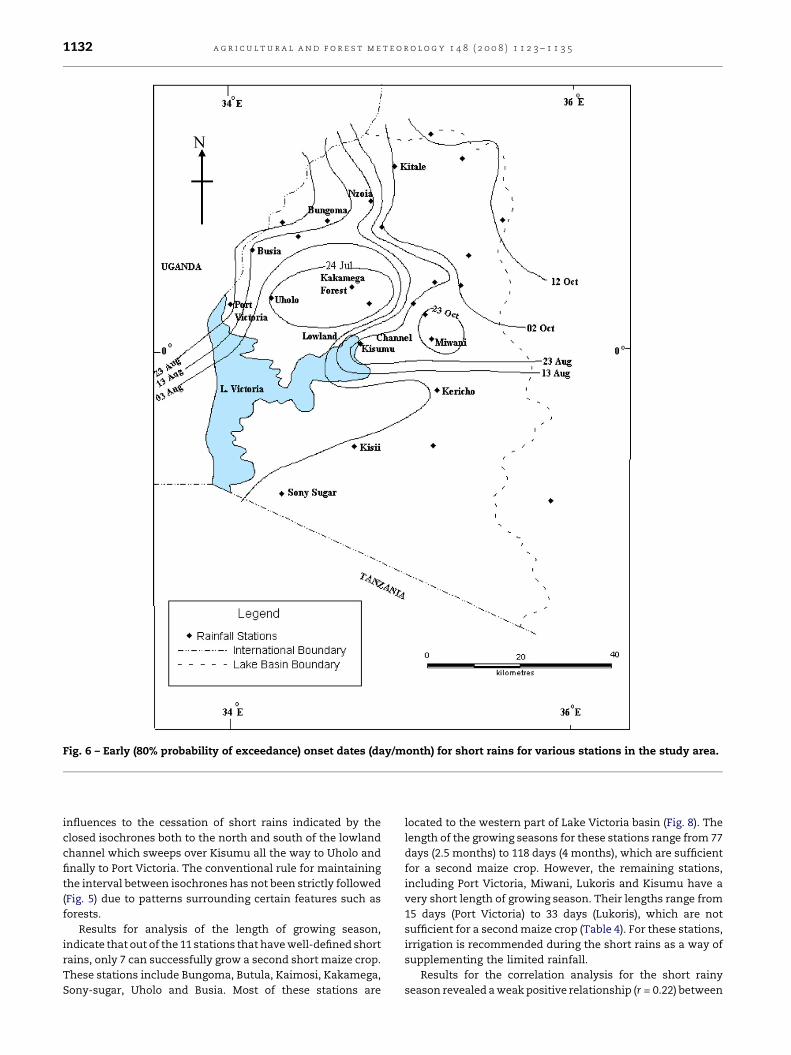
Fig. 6 – Early (80% probability of exceedance) onset dates (day/month) for short rains for various stations in the study area.
a g r i c u l t u r a l a n d f o r e s t m e t e o r o l o g y 1 4 8 ( 2 0 0 8 ) 1 1 2 3 – 1 1 3 51132
influences to the cessation of short rains indicated by the
closed isochrones both to the north and south of the lowland
channel which sweeps over Kisumu all the way to Uholo and
finally to Port Victoria. The conventional rule for maintaining
the interval between isochrones has not been strictly followed
(Fig. 5) due to patterns surrounding certain features such as
forests.
Results for analysis of the length of growing season,
indicate that out of the 11 stations that have well-defined short
rains, only 7 can successfully grow a second short maize crop.
These stations include Bungoma, Butula, Kaimosi, Kakamega,
Sony-sugar, Uholo and Busia. Most of these stations are
located to the western part of Lake Victoria basin (Fig. 8). The
length of the growing seasons for these stations range from 77
days (2.5 months) to 118 days (4 months), which are sufficient
for a second maize crop. However, the remaining stations,
including Port Victoria, Miwani, Lukoris and Kisumu have a
very short length of growing season. Their lengths range from
15 days (Port Victoria) to 33 days (Lukoris), which are not
sufficient for a second maize crop (Table 4). For these stations,
irrigation is recommended during the short rains as a way of
supplementing the limited rainfall.
Results for the correlation analysis for the short rainy
season revealed a weak positive relationship (r = 0.22) between

Fig. 7 – Normal (50% probability of exceedance) cessation for short rains for various stations in the study area.
a g r i c u l t u r a l a n d f o r e s t m e t e o r o l o g y 1 4 8 ( 2 0 0 8 ) 1 1 2 3 – 1 1 3 5 1133
the onset and cessation date and a strong negative correlation
(r = �0.94) between the onset and the length of the growing
season. This indicates that an early onset translates to a long
length of growing season for short rains.
To be able to operationalize the findings of this study there
is need for collaborative approach between the scientist,
agricultural extension staff and farmers. This paper addresses
the potential contributions of agricultural meteorology to
agricultural planning and development. These contributions
can take the form of agro-meteorological forecasting (WMO,
1981) and weather advisories (Stigter, 1984). If this approach
can be made operational it will be the most powerful tool to
meet the needs of low input agriculture. Since the paper has
established the rainfall characteristics of the region based on a
determined criterion (Mugalavai, 2007), there is need for the
criterion to be used in identifying the onset dates for the
ongoing season to enable the farmers to better plan their
seasonal cropping activities (Ati et al., 2002). For the short rains
for example, if the onset of the rains is early crops with long
length of growing season can be grown, but in the case of
delayed onset crops with short length of growing season
should be favoured.

Fig. 8 – Normal (50% probability of exceedance) length of growing season (days) for short rains for various stations in the
study area.
a g r i c u l t u r a l a n d f o r e s t m e t e o r o l o g y 1 4 8 ( 2 0 0 8 ) 1 1 2 3 – 1 1 3 51134
4. Conclusion
The onset and cessation dates were identified by using water
balance techniques for 26 stations spatially distributed in
western Kenya. The identified onset and cessation dates and
the lengths of the growing season are presented in form of
dependable probability of exceedance levels, which are quite
valuable for planning of rainfed agricultural activities.
Analysis of onset results indicate that there exist organized
progression of rainfall onset within the western Kenya region
with the long rains showing a southerly progression while the
short rains show a south-westerly progression, indicating
that the Congo air mass has influence on the short rainy
season. However, the cessation of rainfall for both seasons
show strong localized influences, mainly surrounding Lake
Victoria and forested areas, including orographic features.
Correlation analysis of onset and cessation for long rains
indicate that for the stations with longer length of growing
season, early onset translates to early cessation, while, for the
short rains, early onset translates to a longer length of
growing season. This information is very important to
farmers in the region in deciding on crop types to be cultivated
and on planning sowing dates as a function of observed onset
dates.

a g r i c u l t u r a l a n d f o r e s t m e t e o r o l o g y 1 4 8 ( 2 0 0 8 ) 1 1 2 3 – 1 1 3 5 1135
r e f e r e n c e s
Agwata, J.F.M. 1992. The response of L. Victoria levels to regionaland global climate changes. M.Phil. Thesis. Moi University,Kenya, 158 pp.
Allen, R., Pereira, L.S., Raes, D., Smith, M. 1998. Cropevapotranspiration—guidelines for computing crop waterrequirements, FAO Irrigation and Drainage Paper No. 56.FAO, Rome, Italy, 300 pp.
Alusa, A.L., Mushi, M.T., 1974. A study of the onset duration andcessation of the rains in East Africa. In: East AfricanMeteorological Society, Pre prints, Int. Trop. MeteorologyMeeting, Nairobi, Kenya, pp. 133–140.
Anyamba, E.K. 1983. On the monthly mean lower troposphericcirculation and anomalous circulation during the 1961/62flood over East Africa. M.Sc. Thesis. University of Nairobi,Nairobi, Kenya.
Ati, O.F., Stigter, C.J., Oladipo, E.O., 2002. A comparison ofmethods to determine the onset of growing season inNorthern Nigeria. J. Climatol. 22, 731–742.
Barring, L., 1988. Regionalisation of daily rainfall in Kenya bymeans of common factor analysis. J. Climatol. 8, 371–389.
Beltrando, G. 1990. Variabilite interannuelle des precipitationsen Afrique Orientale et relations avec la dynamique deI’atmosphere. Thesis. Universite d’Aix-Marseille II, 223 pp.
Calooy, J.E. 1981. Predicting the seasonal rainfall of Bangladesh.Paper Presented at the Symposium on Long RangePrediction of Monsoon Rainfall SPARSO, Bangladesh and theInternational Centre for Theoret Physics, Italy.
FAO, 1978. Report on the agroecological zones project vol. 1:Methodology and results for Africa World Soil ResourcesReport No. 48. FAO, Rome.
Findlater, J. 1971. Mean monthly airflow at low levels overwestern Indian Ocean. Geophys. Memo. No. 115. HMSO,London, UK.
Ilesanmi, O.O., 1972. An empirical formulation of the onset,advance and retreat of rainfall in Nigeria. J. Trop. Georgia 34,15–33.
Ininda, J.M., 1994. Numerical simulation of the influence of thesea surface temperature anomalies on the East Africanseasonal rainfall. Ph.D. Thesis. University of Nairobi,Nairobi, Kenya.
Kipkorir, E.C., 2005. Software Package for Determination ofRainfall Parameters and Relative Yield Forecast. MoiUniversity, Eldoret, Kenya, p. 22.
Kipkorir, E.C., Gachuir, J.S., Mukabana, M., Raes, D., 2004.Evaluation of the onset of the growing season for variousclimatic zones in Kenya by means of soil water balancemethod for different soil types. In: Demaree, G., De Dapper,M., Alexandre, J. (Eds.), Tropical Climatology, Meteorologyand Hydrology. pp. 137–150.
Kipkorir, E.C., Raes, D., Bargerei, R.J., Mugalavai, E.M., 2007.Evaluation of two risk assessment methods for
sowing maize in Kenya. Agric. For. Meteorol. 144,193–199.
Lineham, S. 1983. How wet is a rainy season. Notes on Agric.Meteorology No. 25. Department of Meteorology Services,Zimbabwe.
Mugalavai, E.M. 2007. A study of rainfall characteristics in arainfed agricultural establishment: case study of theKenyan Lake Victoria basin region. M.Phil. Thesis. MoiUniversity, Kenya, pp. 116.
Nicholls, N., 1984. A System for predicting the onset of the NorthAustralian wet-season. J. Climatol. 4, 425–435.
Ogallo, L.J., 1980. Regional classification of East African rainfallstations into homogeneous groups using the method ofprincipal component analysis. Dev. Atmos. Sci. 13, 255–266.
Ogallo, L.J., 1989. The spatial and temporal patterns of EastAfrican seasonal rainfall derived from principal componentanalysis. J. Climatol. 9, 145–167.
Oladipo, E.O., Kyari, J.D., 1993. Fluctuations in the onset,termination and length of the growing season in NorthernNigeria. Theory Appl. Climatol. 47 (4), 241–250.
Oshodi, F.R. 1971. A study of pentade normal of rainsfall inNigeria. Nigerian Meteorological Service. Quart. Meteor.Mag. 1, No. 4.
Raes, D., Sithole, A., Makaru, A., Millford, J., 2004. Evaluation offirst planting dates recommended by criteria currently usedin Zimbabwe. Agric. For. Meteorol. 125, 177–185.
Saxton, K.E. 2003. Soil water characteristics hydraulic propertiescalculator. http://wilkes.edu/�boram/soilwatr.htm.
Saxton, K.E., Rawls, W.J., Romberger, J.S., Papendick, R.I., 1986.Estimating generalized soil water characteristics fromtexture. Soil Sci. Soc. Am. J. 50, 1031–1036.
Sivakumar, M.V.K., 1988. Predicting rainy season potential fromthe onset of rains in Southern Sahelian and Sudanianclimatic zones of West Africa. Agric. For. Meteorol. 42, 295–305.
Stewart, J.I. (Ed.), 1985. International Conference onAgricultural Development. Technology, Ecology andSociety. California State Polytechnic University, USA.
Stewart, J.I., 1990. Principles and performance of responsefarming. In: Russell, C., Bellammy, J.A. (Eds.), Climatic Riskin Crop Production. Brisbane, Australia, pp. 361–382.
Stewart, J.I., 1991. Principles and performance of responsefarming. In: Ford, W., Muchow, R.C., Bellamy, Z.A. (Eds.),Climatic Risk in Crop Production. Model and Managementfor the Semi-arid Tropics and Sub-tropics. CABInternational, Wallingford.
Stewart, J.I., Hash, C.T., 1982. Impact of weather analysis onagriculture production and planning decisions for the semi-arid areas of Kenya. Appl. Meteorol. 21, 477–494.
Stigter, C.J., 1984. Forecasting and weather services foragriculture in Africa. In: Hawksworth, D.L. (Ed.),Proceedings of the CAB First Scientific Conference (Arusha),CAB, Farnham Royal (Slough), pp. 327–331.
WMO, 1981. Guide to Agricultural Meteorological Practices, 2nded. No. 134, WMO, Geneva.