analysis of price volatility in energy commodities
TRANSCRIPT

0 | P a g e
ANALYSIS OF PRICE VOLATILITY IN ENERGY
COMMODITIES
A Dissertation Report Submitted in Partial Fulfillment of
Requirements
For
BBA (Oil and Gas marketing)
Batch 2010-2013
University of Petroleum and Energy Studies
Dehradun
SUBMITTED TO:
Mr. Sunil Bharthwal
Under guidance of
Dr.H .Roy
Assistant Professor
College of Management Studies
University of Petroleum and Energy Studies
SUMITTED BY
Vindyanchal Kumar (R170210052)
Enrollment NO: R170210052
Sap ID: 500011944
1 | P a g e
Acknowledgement
First and Foremost I wish to express my deep sense of gratitude and indebtedness to this
great institution of mine “University of Petroleum & Energy Studies” which has given me
privilege to imbibe ample technical and managerial knowledge.
I place on record my sincere sense of gratitude towards my mentor Dr. H. Roy, (Assistant
Professor, College Of Management Studies, UPES), BBA(Oil and Gas Marketing)and Faculty
of University of Petroleum & Energy Studies along with my colleagues for their cooperation
and most of all in making my post graduation a memorable experience.
Above all I would like to thank my parents and Family for giving me all the support.
Signature of Student
Vindyanchal Kumar
Place:
Date:

2 | P a g e
Certificate of Originality
This is to certify that the project titled “Analysis of Price Volatility in Energy
Commodities” is an original work of the student and is being submitted in partial
fulfillment of Bachelor Degree in Business Administration (BBA Oil and Gas
marketing) of University of Petroleum and Energy Studies, Dehradun for the
fulfillment of requirement of the course of study. This report has not been
submitted earlier to any other university/institution for the requirement of a
course of study.
Signature of Student
Vindyanchal Kumar
Place:
Date:

3 | P a g e
Bonafide Certificate
This is to certify that Mr. Vindyanchal Kumar, a student of „University of
Petroleum and Energy Studies, Dehradun, pursuing BBA (oil and gas
marketing), has successfully completed his dissertation report as a part of his
course curriculum. The project report entitled “Analysis of Price Volatility in
Energy Commodities”, submitted by the student to the undersigned is an
authentic record of his original work, which he carried out under my supervision
and guidance.
I wish him all the best.
Date:
Dr. H. Roy
Assistant Professor
University of Petroleum and Energy Studies
Dehradun, Uttrakhand
4 | P a g e
Abstract
In the recent years, India’s energy consumption has been increasing at one of the fastest
rates in the world due to population growth and economic development. To meet the demand
of the energy which is increasing at the rate of 6% and India is importing 76% crude oil, 22.5%
natural gas and 14.8% of coal to meet its energy demand. These energy commodities are also
influence the growth and development of the country. The import is increasing which leads to
the country fiscal deficit.
In 20th century energy market has tremendous growth recent studies shows the
speculation activities become one of the reason behind increased volatility. The example is the
Dec. 2008 when prices shoot up and touch the $147 and suddenly dropped down to $34 within
few months and now it’s between $70-80. Due to this many small players who did not react
accordingly and secure its position, have to bear a huge losses.
Looking at the crude oil crisis 1998, 2001, 2005 and 2008 many companies make losses.
Due to the price fluctuation many small players got bankrupt and many end up with huge
losses. We need to identify what are the factors affecting price of the energy commodities and
develop various precaution to reduce the risk exposure, so that the future losses can be reduce.

5 | P a g e
Table of Content:
Acknowledgement
Certificate of Originality
Bonafide Certificate
Abstract
List of Table
Chapter-1
1.1 Introduction
1.2Need for Research
1.3Objective of the study
1.4 Research Methodology
1.5 Literature Review
1.6 Scope for study
1.7 Limitations of the study
Chapter-2 Crude
2.1 Introduction to crude
2.2 Price volatility in crude oil
2.3 Price Trend analysis
2.4 Critical Price drivers of Crude Oil

6 | P a g e
Chapter -3 Coal
3.1 Introduction of Coal
3.2 Price Volatility in Coal
3.3 Supply Demand Fundamentals
Chapter -4 Natural Gas
4.1 Introduction to Natural Gas
4.2 Price volatility of Natural Gas
4.3 Relationship between oil and natural Gas Price
4.4 Price driving factors of natural Gas
4.5 Trend in natural gas price
Chapter – 5 Conclusion
Bibliography

7 | P a g e
Chapter - 1
1.1 Introduction
Crude oil, Coal and Natural Gas are the major source of energy for world economy since the last
century. These commodities had played a vital role in industrial development and growth of world
economy. The global economy is highly affected by the fluctuations in prices of these energy
commodities. There are several factors which affect the price of energy commodities, thus affecting
the world economy directly. The analysis shows that infrastructure; weather data, geopolitical
problem in Middle East countries, dollar index, unemployment rate etc. are the major fundamental
factors that affect the prices of energy commodities. For example. Analysis done on the crude oil
prices show that the price of crude oil shows high volatility in reference to change in Dollar value. It
shows an upward or downward trend depending on decrease or increase in Dollar value similarly the
Middle East countries also impacts the crude oil prices.
Some of the fundamental factors affecting the Natural Gas prices are weather condition such as
Katrina, Rita, and coming Richard in Gulf of Mexico affect the supply side of natural gas prices.
Also the seasonal demand shows that US consumes 1.5 times more in winters than other months
which leads to increase in price. There is a correlation between the price of natural gas and other
energy commodity such as crude oil and coal.
Demand of natural is increasing due to newly developed gas base power plant and economic
development of the countries and also concern toward the global warming. That is why the
consumption of natural gas increased.
Coal demand is highly dependent on energy demand, as the majority of power generation in several
countries (such as China, India and South Africa) comes from coal generation so the prices of coal
are correlated with price of electricity. Due to the weather condition and floods in Australia from
Richards Bay port not able to transport the coal leads to decrease in the supply to other nations as 1.8
million tonnes to 1.1 million tonnes. In India consumption is higher than production will leads to
price hike in near future. Due to the Global Warming problems in future some restrictions may take
place by the government agencies or environment protection agency. It will be macro-economic
factors such as GDP, trade deficit, national debt, inflation, interest rates that can indirectly influence
the price of coal.
8 | P a g e
The recent geo-political issues with producer and consumer countries are adversely affecting the
prices of energy commodities and Crude, Coal and Natural Gas prices showing upward trend.
Libyan rebel and the earthquake in Japan lead to huge volatility in the energy commodities, The
prices of crude oil is touching $115 from $80-$90.
1.2 Need for the Research:
To suggest relevant strategies to Producers, Consumers and Investors to protect from loss.
Effect of price volatility on GDP of countries
To know relationship between coal price and natural gas price
To find market force and factors driving the commodity price
Due to the price volatility in the commodity market producers, consumers, investors and the
government have to bear huge losses. To mitigate the price risk the derivative market provide the
platform to various players to indulge in the various contract but selection of the strategies become
irrelevant when you don‟t know the market direction where the market is going, is it following the
uptrend or downtrend within the given timeframe. So there is a need to find out the market force and
factors driving the commodity price that can be done by fundamental and technical analysis
sometimes known as techno-fundamental analysis. The fundamental analysis in simple term is
analysis of what is going on in the business environment and how it is affecting the basic demand
and supply factors of the physical energy market because the gap between the demand and supply
has direct relationship with price of the energy commodity. As a Simple statement of the head of
Saudi Arabian crude oil company that in case of price rise he will increase the production of oil leads
to decrease in the crude oil spot price from $88 to $79. Because single news in the market can leads
to heavy price fluctuation in the commodity market so we need to identify those factors and analyze
the intensity or magnitude of those factors.
In Technical analysis we follow the assumption that history repeats itself so by analysing the
historical databases. we will try to identify the trend of market for particular commodity, at the same
time try to find out the market direction or market forces, who is influencing the market is that
buyers or sellers who is controlling and driving the market who actually define the market price of

9 | P a g e
the particular commodity. For analysing the Volatility we can use ATR (Average True Range) which
tell us what might be the volatility or movement in a particular energy commodity in a particular day.
1.3 Objective of study:
1. To study Price Volatility
2. To analyse Fundamental factors influencing Price of Energy Commodities.
3. To analyse price volatility using technical tools.
4. To suggest relevant strategies to Producers, Consumers and Investors.
5. To identify time periods at which we will definitely see the price volatility in the market.
6. To determine the price trend of crude oil in relationship with prices of alternative fuels.
7. To know the consequences and there possible remedies .
1.4 Research Methodology
Type of research: Descriptive
Sampling technique:
Non probabilistic method of convenience sampling will be used. The data will be collected from
easily available and cost effective sources.
Data Source:
Secondary Data will be collected by visiting various Internet sites such as Bloomberg, Reuters,
and Ticker Plant, Website of Commodity Exchanges e.g. Nymex, MCX, ICE, Ministry of Petroleum
and Natural Gas; various global futures exchange websites, Platts, IMF, EIA, and MCX etc.

10 | P a g e
Data Analysis:
Data collected from different sources will be tabulated and analyzed using different analytical tools
as:
Average True Range
Standardeviation
1.5 Literature Review
There is adequate literature available for the reference for the project. Extensive usage has been
made of all the available literature for the information. The books on derivatives and risk
management have been of great help for the understanding of the concept of derivatives. Oil Trading
Manual by David Long, Energy Price Risk by Tom James, Energy hedging in Asia by PETER C.
FUSARO, technical analysis of financial market by john j. Murphy needs special mention as these
books has been extensively used.
Also for the understanding of the concept many research papers both international as well as
national will be studied. These research papers are very helpful as these bring the clarity about the
subject of the topics. They help in showing the correct direction for the project work and how one
shall proceed with it. Over the study of different research papers, it has been found that every paper
has different aspect to work out, as the papers are written on problems faced by importers, refiners,
producers due to price volatility.
Research paper
1. Coal Price Projection
Author-
Date-oct 2011
Place-EU,CHINA, RUSSIA,COLUMBIA
No pages-42

11 | P a g e
This paper set out key consideration used by DECC in creating price assumption for the coal market
over the next 20 years.
It is done by external agencies like EIA, IEA.
It uses mainly demand, supply, and analysis of long run marginal costs models.
Results
a) It is find that price of coal largely depend on china.
b) Price of coal directly depends on price of gas.
c) Demand of coal will decrease n 2050 because coal eliminates double carbon than the gas, so
company have to paid more tax.
2. OIL in charge
Author- ABE COFNAS
1. This research paper is about effect of price volatility in oil exporting and importing countries.
2. Effect of price volatility on developing and developed countries.
3. Analysis of “Impact of high oil price on the global economy “in may 2004.
Finding
a) Economy of developing countries like Asia, Africa is affected because their economy depend
more on imported oil.
b) Oil importing countries uses more than twice petroleum product to produce one unit of output than
developed countries.
c) US economy less effected by price hike because one and another way there dollar return to them.

12 | P a g e
3. Natural gas
Analysis of change in market price
Author –GAO
Date – Dec 2002
No .of page- 97
Why did GAO do this survey?
During the winter of 2000-2001, the wholesale price of natural gas peaked at a level four times
greater than its usual level.
Responding to the congressional interest and concern caused by these high prices,
GAO undertook a study to
1) Factors that influence natural gas price volatility and the high prices of 2000-2001;
2) Federal government‟s role in ensuring that natural gas prices are determined in a competitive,
informed market place .
.
3) Choices available to gas utility companies that want to mitigate the effects of price spikes on their
residential customers.
What GAO found;
a) Price spikes occur periodically in natural gas markets because supplies cannot quickly adjust to
demand changes.
b) While market forces make natural gas prices susceptible to price volatility, investigations are
underway to determine if natural gas prices were manipulated in the Western United States during
the winter of 2000-2001
4. Oil price volatility and U.S macroeconomic Activity
Author- Hui GUA and Kevin L. Kliesen
Place- St. Lousis
No of pages-16
This research paper distinguishes two most important channel through which change in oil price
affect aggregate economic activities.

13 | P a g e
I. The change in the dollar price of crude oil
II. The change in the uncertainty about future price.
Result:
a) Oil price volatility has negative and significant effect on future GDP growth.
b) This volatility effect becomes more significant after we control oil price change.
c) Both the oil price change and its volatility lose their significance after we control non linear oil
shock measure
5. Price volatility ,hedging and variable risk premium in the crude oil market
Author –Ahmad R. Jalali-Naini and Maryam Kazemi Manesh
No of pages-17
Date –Jan 2006
Place-New York, Texas
In this research paper author compare OHR (optimal hedge ratio) for the crude oil. This research is
done in New York and Texas.
It is done by using different model like GARCH and ARCH model. It also tested the variable
existing risk premium in the crude oil market
Finding
Research finds that there is zero risk premium with helping GARCH model.
6. NEW evidence on the asymmetry in gasoline price: volatility versus margin?
Author: Salah Abosedra and Stanislav Radchenko
Place-Beirut, USA
Date – Sept 2006
No of pages-27

14 | P a g e
This paper examine recent evidence on the role that gasoline margins and volatility play in the
asymmetric response of gasoline prices to change in oil price to change in oil price at different stages
of distribution process.
This research paper has used regression model with margin
Finding
a) Margin is statistically significant in explaining asymmetry between crude oil and spot gasoline
prices,
b) Spot gasoline prices and wholesale gasoline price etc and it has same finding in volatility of price.
7. Volatility Relationship between Crude Oil and Petroleum Products
Author-Thomas K. Lee & John Zyren
No pages-17
Date -17 Jan 2007
This paper utilizes calculated historical volatility and GARCH models to compare the historical price
volatility behavior of crude oil, motor gasoline and heating oil in U.S. markets since 1990. We
incorporate a shift variable in the GARCH/TARCH models to capture the response of price volatility
to a change in OPEC‟s pricing behavior.
Finding
a) There was an increase in volatility as a result of a structural shift to higher crude oil prices after
April 1999.
b) Volatility shocks from current news are not important since GARCH effects dominate ARCH
effects in the variance equation.
c) Persistence of volatility in all commodity markets is quite transitory, with half-lives normally
being a few weeks.
15 | P a g e
Reports and Journals
“Methodology and Specifications Guide” published by Platt‟s
The crude specifications mentioned in this guide contain the primary specifications and
methodologies for Platt‟s crude oil cargo and pipeline assessments throughout the world. These
methodologies are used by oil producers, traders, refiners and final consumers for pricing of crude
oil throughout the world. The Platt‟s prices are considered benchmark for crude oil pricing. So this
report helps in finding out the factors which affect the price of crude oil.
Ahuja N.L. (2005): “Commodity Derivatives Market in India: Development, Regulation and
Future Prospects” published in „„International Research Journal of Finance and Economics‟‟
This paper analyzes the evolution of Indian commodity market and how did India pull it off in
such a short time since 2002? Is this progress sustainable and what are the obstacles that need urgent
attention if the market is to realize its full potential? Why are commodity derivatives important and
what could other emerging economies learn from the Indian mistakes and experience?
Shah Ash Narayan: “Price Discovery in Cash and Futures Market: The Case of Nymex Crude
and Heating Oil” published in Contemporary Issues in Energy Sector, 1st Edition, 2009.
This paper analyzes the role of futures exchanges in price discovery of crude oil and heating oil
using monthly data of prices at Nymex. It uses co-integration and error correction model for analysis
of prices. The findings of study prove that there exists a long term relationship between spot and
future prices of crude oil and heating oil. Further, error correction model establishes a feedback
relation between spot and future prices of crude and heating oil. This relationship study will help in
determining the role of spot markets in price discovery of crude oil.
Dr. Diwan Parag: “Energycopia”, First Edition, 2008
This book covers crude oil trading and natural gas trading. It examines the principal issues
concerning energy sector. These contemporary issues include concepts of energy economics, the
regulation and policy framework, the conservation issues, the global energy trade and finally the idea
of achieving energy security. The book will help in finding out current scenario of energy sector and
understanding the trading mechanism of crude oil and natural gas.
16 | P a g e
Murphy, john j. “technical analysis of financial market” prentice hall direct, 1999
This book covers Technical analysis tools which are widely used by the traders to trade in the
exchanges. It briefly explains the various tools, how to use them and the importance of those tools.
This book will help in finding the strategies with tools to trade and manage price risk by telling when
to enter the market and when to exit or say when to buy and when to sell.
1.6 Scope of Study
My research will cover whole world and can be used both individually or group.
It will be used by managers of oil companies to forecast future price.
My research will be helpful for the oil company like HPCL, BPCL, and IOCL etc.
It will be also helpful for the company whose work somehow related with petroleum product.
1.7 Limitations of the Study
1. Data is collected from secondary sources so there are chances of error.
2. The strategies have to be implemented in real market conditions to find out their efficacy.
3. Availability of time and budget constraints.
4. Technical analysis will be used to forecast crude oil prices but sometimes it may not yield
effective results.

17 | P a g e
Chapter-2
2.1 Introduction of crude oil
Crude oil is a mixture of about 5oo organic chemicals, predominantly hydrocarbons (molecules
made of carbon and hydrogen). It is recovered from underground reservoirs, normally 1000 - 5000
meters down the earth. Crude oil can be of wide variety and characteristics. It could be very fluid,
very viscous or semisolid. The colour could be black, dark brown, amber or light brown. It is also
called Petroleum.
Classification of Crude Oil
Various crude oils are often referred by their API Gravity. API Gravity is expressed as (141.5/
Sp. Gravity - 131.5). As specific gravity is in the denominator, API Gravity is higher for lighter
crude and lower for heavier crude. A comparative idea of this gravity unit can be obtained by
comparison with water: Water: 10 API Typical API Gravity figures for crude oil are
Mumbai High Crude: 40 API - Light Crude
Arabian Crude: 34 API - Medium Crude
Venezuelan Crude: 15 API - Heavy Crude
There could be sub-categorization as Medium Heavy or Light Medium. Another common
classification is based on Characterization Factor, which depends on API Gravity and Boiling Point.
Types of Crude oil
Light crude has low density making it easier to transport and refine. Most refiners prefer the
light sweet crude oil because it contains low sulfur content. Light crude is chemically "closer" to
many desired finished products such as gasoline and diesel fuel and usually it requires less refining
and processing and therefore is typically more valuable and more expensive than "heavy" oil.
Heavy crude has high density, making it more difficult to transport and refine. Heavy crude is
cheaper to buy and usually cheaper to extract though heavy crude produced from tar sands can cost
twice as much as conventional drilling.

18 | P a g e
Crude oil Bench marks
Brent Crude Oil
Brent Crude oil is used as a bench mark for deciding the price of crude oil. It is light and sweet
crude oil but not as much sweet as WTI. The API gravity of the Brent crude oil is near about the
38.o6 and the specific gravity is near about the 0.835. Sulfur content in the Brent crude oil is
approximately the O.37%. Mostly it is use for the distillation of gasoline and middle distillate
product.
Future and option contracts of the Brent crude oil are traded on the ICE (Inter Continental
Exchange), NYMEX (New York Mercantile Exchange). The symbol of the Brent crude oil is CL4 in
the commodity trading market. Earlier the Brent crude oil was traded on the open outcry on the IPE
but now it is to be traded electronically on the ICE. One contract of the Brent crude oil is 1000 barrel
of crude oil. The contract price of the Brent crude oil is to be quoted in the dollar per barrel.
West Texas Intermediate (WTI) crude oil is of very high quality and is excellent for the Refining.
Its API gravity is 39.6 degrees and it contains only about 0.24 percent of sulfur. Most WTI crude oil
gets refined in the Midwest region of the country, with some more refined with in the Gulf Coast
region. Although the production of WTI crude oil is on the decline, it still is the major benchmark of
crude oil in the America.
Tapis
Tapis is a Malaysian crude oil used as pricing marker crude in Singapore. It is not only traded on
market like Brent and WTI, it is often used as oil marker for Asia.

19 | P a g e
Dubai and Oman
Dubai crude is a light sour crude oil. It is used as benchmark in Middle East.
• It has API gravity of 31 and sulphur content of 2%
• It is considerably more heavy and viscous and sourer, making sweet crude marker is an
inadequate tool with which to manage sour crude price risk.
Hence introduction to exchange traded Middle East sour crude facilitates risk management of sour
crude in Middle East, Asia and beyond also.
Dubai Oman crude uses by the Middle Eastern Countries for determining the price of their crude oil.
In early days the Middle Eastern Countries decide their price on the basis of Brent crude but Brent
crude oil is light sweet crude oil while the Middle Eastern countries crude oil contains high sulfur
content and the API gravity near about the 15 to 17 API. So the price is not determined on the base
of a Brent crude oil. Dubai Oman crude traded on the Dubai Mercantile Exchange. In July 2007
DME launched the future contract of the Dubai Oman Crude oil.
Introduction to Global Crude oil market
Over the last three decades oil has become the biggest commodity market in the world. During this
period, oil trading has evolved from a primarily physical activity into a sophisticated financial
market. It has attracted the interest of a wide range of participants including banks, governments,
financial institutions, fund managers as well as the airlines, traditional oil majors, independents and
physical oil traders.
Prior to 1970s, oil trading was a marginal activity for most companies who only used the market to
resolve any imbalances in supply and demand that might emerge. The industry was dominated by
large integrated oil companies and as a result trading volumes were typically small and usually spot
and the prices were much less transparent than they are today.
As the nationalization of oil companies took place in 1970 in the Middle East and elsewhere, the
major oil companies were forced to buy huge amount of crude oils from their former host
20 | P a g e
governments and trading eventually became an integral part of any oil company‟s supply and
marketing operations. With more oil being traded, external market began to set the price for internal
transfers as well as third‐party sales, fuelling the growth of the market.
The driving force behind the rapid growth in oil trading is the huge variability in the price of oil. The
daily price movements of $2/barrel are not uncommon and prices frequently change by up to 50
cents/barrel. Since there is no obvious upper or lower bound to oil prices, the value of a barrel of oil
can double or halve within the space of a few months.
As a result, everyone involved in the industry is exposed to the risk of very large changes in the
value of any oil that they are producing, transporting, refining or purchasing, and a range of new
markets have evolved in order to provide effective hedging instruments against the elaborate
combination of absolute and relative price risks that characterize the oil business.
Trading Horizons
The most important change to the oil market has been the gradual extension of trading horizons.
Before the introduction of forward and futures contracts, oil companies had no effective means
setting prices for future delivery. As a result, the spot market was forced to bear the brunt of trading
decisions that might relate to time periods ranging anywhere from a day to a year ahead, which could
only have added to price volatility.
However, the time horizon of the oil market has been extended much further forward as can be seen.
The most active futures contracts, such as NYMEX WTI, now trade for delivery up to nine years
ahead and the industry has acquired a new set of trading instruments that enable participants to
establish prices even further into the future. Instead of being limited to a time horizon of only a few
months, prices can now be reliably obtained for periods from one to ten years ahead. This has been
made possible by the introduction of financial instruments such as OTC options, which have created
a liquid market that enables companies to trade the price of oil over a time frame that is appropriate
for producers investing in new oil fields or for consumers building new power stations. And for
physical traders who frequently use financial instruments to fix price independently of delivery.
21 | P a g e
2.2 Price Volatility in Crude oil:-
The price volatility in the crude oil can be because of two factors one is the investor‟s sentiments
and the other is known as fundamentals of crude oil. The first factor is investors sentiments is the
price when the investor like to invest or exit from the market. These investor‟s sentiments can be
predicted by using the technical and statistical analysis. One of the tools is ATR (Average True
Range).
ATR(Average True Range)
The average true range (ATR) determines Commodities volatility over a given period. That is,
the tendency of a commodity to move, in either direction.
More specifically, the average true range is the average of the true range for a given period. The true
range is the greatest of the following:
The difference between the current high and the current low
The difference between the current high and the previous close
The difference between the current low and the previous close
The ATR is mainly used to have stop loss or to exit from the trade while trading. Because they
expect that the commodity price will not move more than this level in a particular day.
Other statistical method we can use is by finding the Standard deviation from the expected price
of the commodity.
22 | P a g e
Standard Deviation:-
Standard deviation is a widely used measurement of variability or diversity used in statistics and
probability theory. It shows how much variation there is from the average. A low standard deviation
indicates that the data points tend to be very close to the mean, whereas high standard deviation
indicates that the data are spread out over a large range of values.
The second major factor is fundamentals of crude oil. The market react according to the news is
coming in to the market. The market players are sensitive about market news. Whenever there is a
news in a market, the market participants try to grab that opportunities and react accordingly but at
the same time there are some big players who tried to trap the other players and move the market in a
opposite direction and make their stop loss triggered and the others end up with the losses. So we
have to very careful while trading and finally market always moves in the way it should move. So we
have to analyse at what time and which side the market will move and accordingly we can trade. For
that purposes we can actually see the market past news when they come how the market move in
shorter duration and in the longer duration.
ATR calculation of the Crude oil
Calculation
The Average True Range (ATR) is based on 14 periods and can be calculated on an daily, weekly
or monthly basis. For this example, the ATR will be based on daily data. Because there must be a
beginning, the first TR value is simply the High minus the Low, and the first 14-day ATR is the
average of the daily TR values for the last 14 days.
ATR value from NYMEX
Given
Long term ATR for the Coal is = $ 0.8023385
The 14 days ATR is = $ 3.74951683
The 5 days ATR is = $3.8286829
23 | P a g e
The 5 days ATR and 14 days ATR is commonly used ATR for trading activities. It is considered
that the price in a particular day might move to this range and then will stop moving. But we cannot
assure that the price will not move more than that because the price is unpredictable and it can move
further but chances of moving not more than this is very less.
The all time ATR or say ATR from 1983 to 2013 says that the average movement in a particular
day is $0.8023385. The crude oil price will not move more than this but the observation is related to
the long term and in the initial days the prices are not much volatile and now a days the market is
much more volatile than ever. The conditions are changing and the market is becoming more
dynamic.
If we analyse the past prices then we will find that market is not moving more than is value when
the market conditions are normal or say the investors are not in panic. But if there is adverse news
then in that case the market may move more than this value so in this case we can take more 5 days
ATR or 14 days ATR to know the volatility in short term or can say current volatility in the market.
In this report there is 14 days ATR and we find that the max. Value of the ATR is $ 3.74951683.
Means in the time duration of the 14 days the average movement of the crude was $ 3.74 and the
average value is somewhere around the $ 3.5 so we can say that according to the current market the
price will generally move $3.5 and in the adverse condition the value can be move by $ 3.74.
In 5 days ATR we find that the max Value is $3.8286829. in this case we can also take the 5 days
ATR because it tells the current market volatility and if the volatility according to the 14 days and 5
days are approx. Same in this case we can say that the market might move near to the ATR value but
if both the ATR is not equal then we can say that the market will move the higher value of the ATR.
After doing the calculation of the ATR we found that the 5 days and the 14days ATR are
showing the nearly same values in this case we can consider the both the ATR‟s. And then we can
take the position in the market.
The analysis shows that the average value of the ATR of the crude oil is $ 3.74 to $3.82. so in the
general market condition when there is no opposite news in the market or small news in the market
the market will not move more than $ 3 in a trading day so if the market already moves this much in
a particular trading day we can trade considering the market will go side wave or will show the
retracement.
24 | P a g e
Standard Deviation:-
Month Standard
Deviation
January
February
March
April
May
June
July
August
September
October
November
December
January
February
March
2.69695
4.437884
1.819859
1.969535
2.127439
0.463244
1.532626
3.559421
2.116307
2.190369
4.726454
1.358177
1.138042
2.795458
3.452517
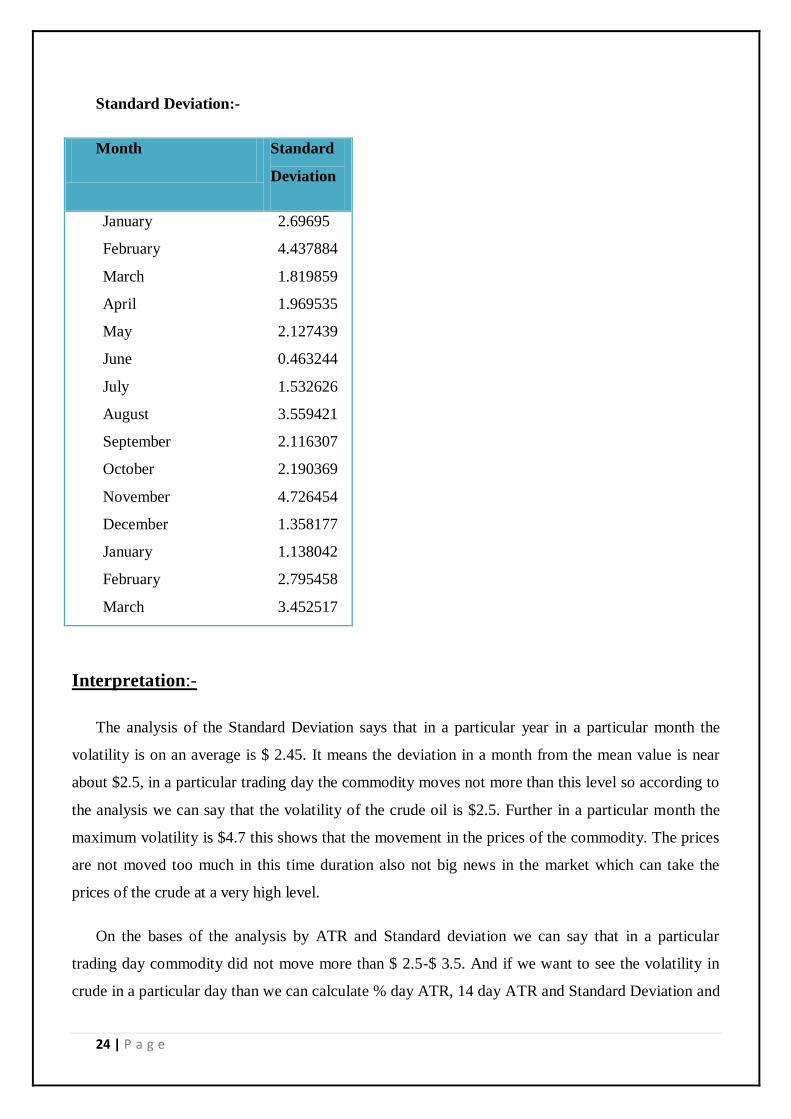
Interpretation:-
The analysis of the Standard Deviation says that in a particular year in a particular month the
volatility is on an average is $ 2.45. It means the deviation in a month from the mean value is near
about $2.5, in a particular trading day the commodity moves not more than this level so according to
the analysis we can say that the volatility of the crude oil is $2.5. Further in a particular month the
maximum volatility is $4.7 this shows that the movement in the prices of the commodity. The prices
are not moved too much in this time duration also not big news in the market which can take the
prices of the crude at a very high level.
On the bases of the analysis by ATR and Standard deviation we can say that in a particular
trading day commodity did not move more than $ 2.5-$ 3.5. And if we want to see the volatility in
crude in a particular day than we can calculate % day ATR, 14 day ATR and Standard Deviation and
25 | P a g e
we will get the value which will tell us that in that day what is the rage of the commodity and how
much it may move.
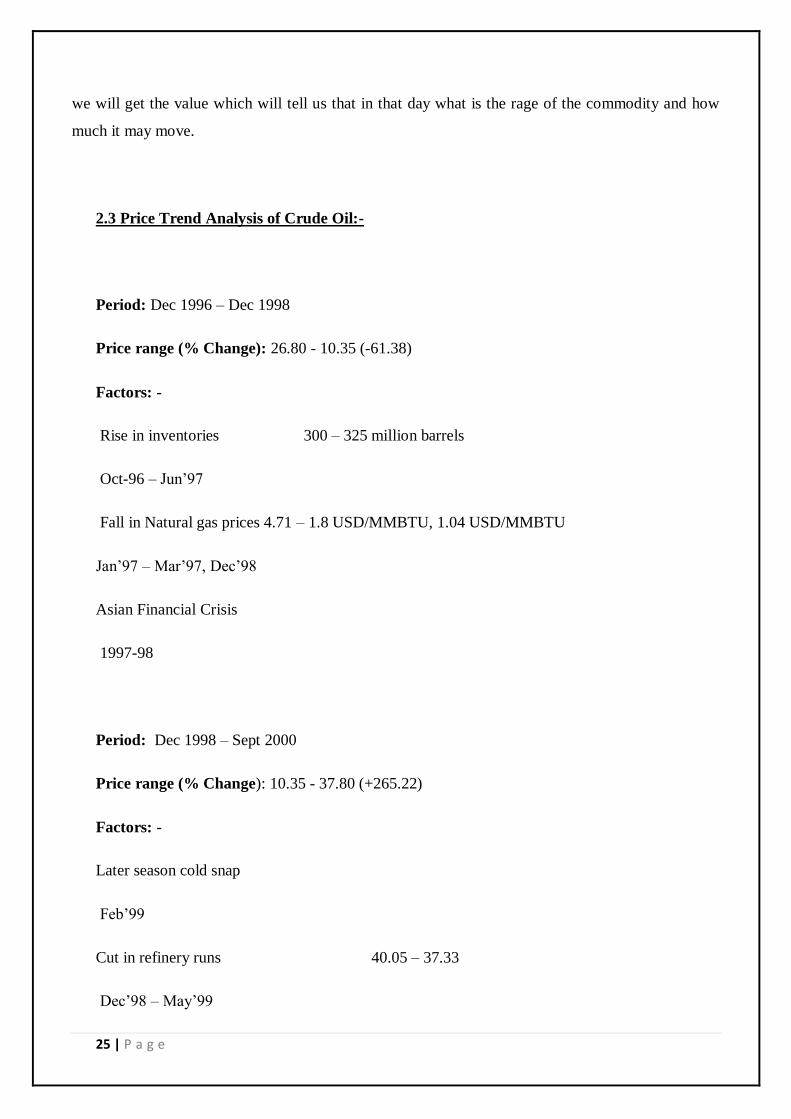
2.3 Price Trend Analysis of Crude Oil:-
Period: Dec 1996 – Dec 1998
Price range (% Change): 26.80 - 10.35 (-61.38)
Factors: -
Rise in inventories 300 – 325 million barrels
Oct-96 – Jun‟97
Fall in Natural gas prices 4.71 – 1.8 USD/MMBTU, 1.04 USD/MMBTU
Jan‟97 – Mar‟97, Dec‟98
Asian Financial Crisis
1997-98
Period: Dec 1998 – Sept 2000
Price range (% Change): 10.35 - 37.80 (+265.22)
Factors: -
Later season cold snap
Feb‟99
Cut in refinery runs 40.05 – 37.33
Dec‟98 – May‟99

26 | P a g e
Increased seasonal gasoline demand 7.83 – 9.08 Mbpd
Apr‟99 – July‟99
Fall in peak season inventories 284 (334) million
Period: Sept 2000 – Jan 2002
Price range (% Change): 37.80 - 17.85 (-52.78)
Reasons:
OPEC production cut 1 MBpd (25.2-24.2 MBpd)
Apr‟01
Concerns over US and global economy
Period: Jan 2002 – July 2006
Price range (% Change): 17.85 - 79.86(+347.39)
Reasons:
OPEC output cut 1.5 MBpd (23.2-21.7 MBpd)
Dec‟01
Global supply shortfall 0.8 MBpd (76.9 MBpd supply vs. 77.7 MBpd demand) 2002
Decline in inventories (Cold weather) 10.55 percent (311.06 – 278.25 million barrels) 2002
Geopolitical tensions
Nigeria, Iran
Early 2007
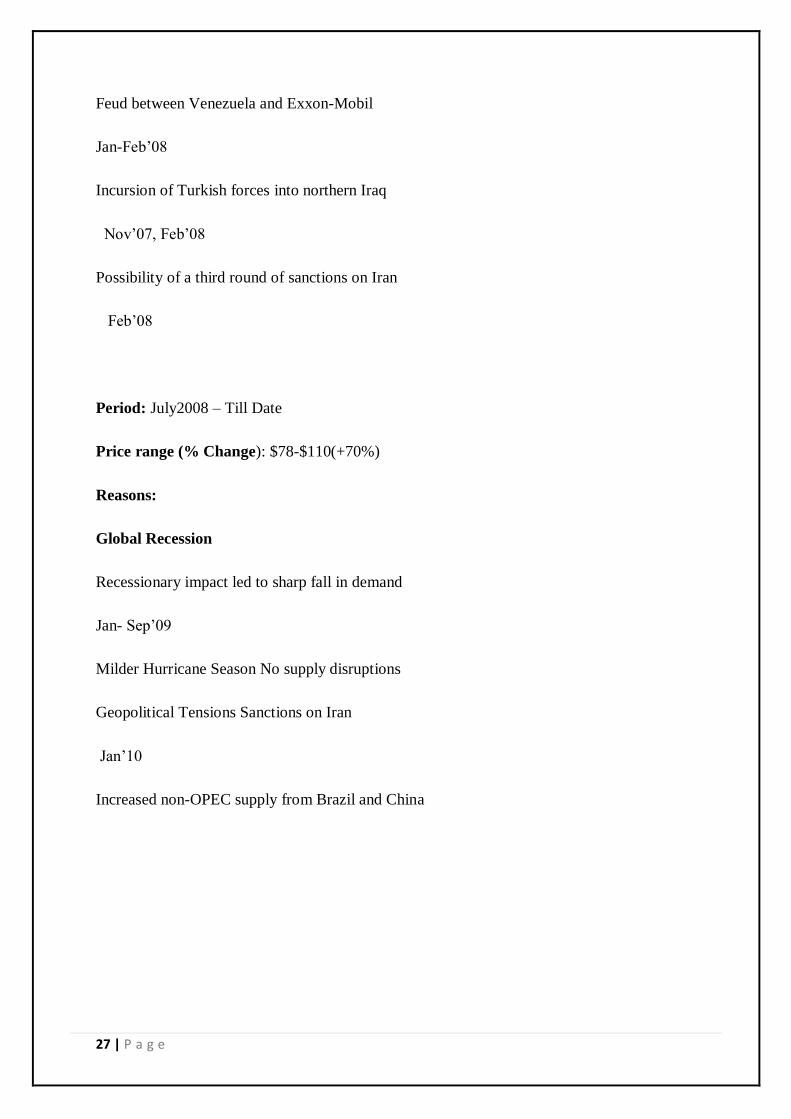
27 | P a g e
Feud between Venezuela and Exxon-Mobil
Jan-Feb‟08
Incursion of Turkish forces into northern Iraq
Nov‟07, Feb‟08
Possibility of a third round of sanctions on Iran
Feb‟08
Period: July2008 – Till Date
Price range (% Change): $78-$110(+70%)
Reasons:
Global Recession
Recessionary impact led to sharp fall in demand
Jan- Sep‟09
Milder Hurricane Season No supply disruptions
Geopolitical Tensions Sanctions on Iran
Jan‟10
Increased non-OPEC supply from Brazil and China

28 | P a g e
2.4 Critical price drivers of Crude oil: -
From the above analysis of crude oil price trend, the following factors are identified as crucial in
determining the movement and direction in crude oil prices on a regular basis:
Seasonal patterns in prices
World demand and supply of crude oil
Demand and supply trends of crude oil at the US front
Natural gas prices
Weather conditions
Fluctuations in the value of dollar
Policy/ regulatory aspects
Inventories of Crude oil and products (mainly at the US front)
Performance of end use sectors
Trend in other global markets (inter-product (derivatives) and intra-product)
These factors can further be classified into short term and medium term based on their
significance and horizon of influence on price movement.
Short-Term Factors
Weekly US crude and product demand
Weekly crude and product inventories
Weekly crude oil and product imports
Weekly refinery production of crude oil and products etc
Weather conditions
Natural gas prices
Trend in other global markets
Currency movements
Political/geopolitical issues

29 | P a g e
Medium Term Factors
Monthly IEA (International energy agency) and OPEC (Organization of petroleum exporting
countries) reports covering petroleum products demand and supply scenario at OECD
countries
Seasonal patterns in demand and supply of crude oil
Performance of end used sectors
Global demand and supply scenario
Political/geopolitical issues
Economic scenario
30 | P a g e
Chapter -3
3.1 INTRODUCTION TO COAL:-
Coal is a combustible black or brownish-black sedimentary rock normally occurring in rock strata in
layers or veins called coal beds or coal seams. The harder form of the coal is anthracite coal. Coal is
composed primarily of carbon along with variable quantities of other elements, chiefly sulfur,
hydrogen, oxygen and nitrogen.
Types OF COAL:
There are various types of coal available in the market. Different type of coal having different
Peat, The peat coal is considered to be a precursor of coal; it has industrial importance as a fuel in
some regions, for instance, Ireland and Finland. In its dehydrated form, peat is a highly effective
absorbent for fuel and oil spills on land and water.
Lignite, the Lignite coal is referred as brown coal, it is the lowest rank of coal, and it is used
exclusively as fuel for electric power generation.
Bituminous coal, The Bituminous coal is dense sedimentary rock, black but sometimes dark brown,
often with well-defined bands of bright and dull material. The Bituminous Coal is used primarily as
fuel in steam-electric power generation, with substantial quantities also used for heat and power
applications in manufacturing and to make coke.
Anthracite, It is the highest rank of coal and contains 86 to 97 percent carbon. It is used for
residential and commercial space heating. Otherwise called as hard coal it contains a high percentage
of fixed carbon and low percentage of volatile matter. It is the cleanest burning fuel and the most
efficient among the varieties.
Graphite, it is mostly used in pencils and, when powdered, as a lubricant.

31 | P a g e
Coal as a Traded Commodity
Coal futures contracts are currently traded on the New York Mercantile Exchange. The trading unit
is 1,550 short tons (1,410 t) per contract, and is quoted in U.S. dollars and cents per ton. Since coal is
the principal fuel for generating electricity in the world, the coal futures contracts also provides coal
producers and consumers an important tool for hedging and risk management.
In addition to the NYMEX contract, the InterContinental Exchange (ICE) has European (Rotterdam)
and South African (Richards Bay) coal futures available for trading. The trading unit for these
contracts is 5,000 tones (5,500 short tons), and are also quoted in U.S. dollars and cents per ton.
The price of coal increased from around $30.00 per short ton in 2000 to around $150.00 per short ton
as of September 2008.
Economic aspects:
Estimates of the cost of producing liquid fuels from coal suggest that domestic U.S. production of
fuel from coal becomes cost-competitive with oil priced.
China is by far the largest producer of coal in the world. It has now become the world's largest
energy consume but relies on coal to supply about 70% of its energy needs. An estimated 5 million
people work in China's coal-mining industry.
Pricing of Coal
Coal is mainly priced on
1. GCV
2. Moisture
Congestion at Load Port & Discharge Port
Freight
Weather
Inventory
Currency
32 | P a g e
Finished product price
Government policies
Prices of alternatives
New technology development
3.2 Price Volatility in Coal:-
Coal is another energy which is used from the past long time in the world for various purposes.
Mainly Coal is used in Iron and Steel industry and Power generation. The change in the prices of
coal affects the Industry which is actually backbone of the country as power sector. As other
commodities coal is also a most traded commodity but coal is mainly traded in OTC (Over-the-
counter (OTC) or off-exchange) market and less traded in the exchanges so the speculation
activities are very less. There is not much volatility in the prices of the coal but there are several
factors affecting the price of coal. Coal is traded mainly in long term contracts so the prices are
determined by the market and the players but sometimes due change in the demand of the coal the
prices started changing so it affect the cash market or say the spot market, So the companies who
cannot store good quantity of the Coal face the problems because they have to purchase it from the
spot market they need to monitor the price and have to hedge their position in the future.

33 | P a g e
ATR of COAL
ATR value from NYMEX
Given
Long term ATR for the Coal is = $ 1.43655
The 14 days ATR is = $ 3.4563
The 5 days ATR is = $ 2.35646
On the bases of the we can say that in the general condition of the market the price movement in
a particular trading day is $ 1.5 which is the long term ATR but we cannot rely only on the long term
analysis we have to know the current volatility as well so we consider the 5 days ATR and 14 Days
ATR which tells us that now days the average movement in the coal prices are near about $ 2.6. So
when we trade in the coal we can say that the expected movement will be near $ 2.5 - $ 3 .but if there
is any news related to the Demand and Supply of the Coal then the prices will more than the ATR
value.

34 | P a g e
Standard Deviation:-
SD is another tool to check the volatility in which we can check the volatility and the price
movement in a particular time duration we are using the same for coal.
The long term 1 year standard deviation is = $ 5.675741
Month wise SD table
Month Standard Deviation
April
May
June
July
August
September
October
November
December
January
February
March
1.89786
3.45644
2.45345
1.75532
3.372067
1.882181
1.438301
1.078546
2.139523
2.471605
3.152573
3.28046
On the bases of the analysing the monthly SD we can say that volatility in the prices is from $ 2.1
to $ 3.1 which means in a particular month the movement of the commodity will be between these
values but again we can say that the coal is mainly based on a fundamental factors so need to
combine the both of the thing then try to find the trend of the Coal.
On the bases of the two of the analysis ATR and SD says that in a particular normal trading day
when there is no news in the market the Coal prices will move up to the $ 2 to $ 3 and in case of the
market news the Coal price can move up to $ 5 in a particular trading day.

35 | P a g e
3.4 Supply-demand fundamentals for Coal:-
As it is mainly (almost 70% on a global level) used for power generation, coal is competing with
other energy sources and therefore strongly linked to their availability (e.g. hydro conditions, nuclear
plant outages, wind conditions). Retirements and new additional coal-fired power plants are also
fundamental in determining future changes of steam coal demand.
Production is linked to timely and adequate investments in new expansions, productivity rates and
depletion rates of existing reserves, as well as strikes, availability of mining service equipment and
skilled labor, low water levels in inland transportation.

36 | P a g e
Chpter-4
4.1 INTRODUCTION TO NATURAL GAS:-
Natural gas is consisting primarily of methane, with 0-20% hydrocarbons. It is found associated with
other hydrocarbons. It is an important fuel source and a major feedstock for fertilizers.
Most natural gas is created by biogenic, thermogenic and abogenic process. Biogenic gas is created
by methanogenic organisms in marshes, bogs, landfills, and shallow sediments. Deeper in the earth,
at greater temperature and pressure, thermogenic gas is created from buried organic material.
Before natural gas can be used as a fuel, we must remove almost all materials other than methane.
The by-products of that processing include ethane, propane, butanes, pentanes, and higher molecular
weight hydrocarbons, elemental sulfur, carbon dioxide, water vapor, and sometimes helium and
nitrogen.
Natural Gas is colorless, shapeless, and odorless in its pure form. Natural gas is clean burning and
emits lower levels of harmful byproducts into the air. We require energy constantly, to heat our
homes, cook our food, and generate our electricity.
Typical Composition of Natural Gas
Methane CH4 70-90%
Ethane C2H6 0-20%
Propane C3H8
Butane C4H10
Carbon Dioxide CO2 0-8%
Oxygen O2 0-0.2%
Nitrogen N2 0-5%
Hydrogen sulfide H2S 0-5%
Rare gases A, He, Ne, Xe, trace

37 | P a g e
The natural gas that is delivered to your home, it is almost pure methane. Methane is a molecule
made up of one carbon atom and four hydrogen atoms, and is referred to as CH4. Mercaptan aids in
detecting any leaks.
Natural gas has many uses, generally it is found underneath of earth with other hydrocarbons.
Production companies search for presence of these reservoirs by using technology that helps to find
the location of the natural gas, and drill wells in the earth where it is likely to be found. The natural
gas is refined to remove water, other gases, sand, and other compounds. Propane and Butane are
removed and sold separately. Other impurities are also removed, such as hydrogen sulfide. Then
clean natural gas is transmitted through a network of pipelines.
4.2 Price Volatility in Natural Gas:-
The price volatility in the natural gas can be analyzed in the short term and long term. As we had
the ATR and Standard Deviation for analyzing the price volatility of crude oil and it is also an energy
commodity so we are applying the same method for the coal also. The natural gas is less volatile then
the Crude Oil because the Natural Gas market is not that much developed as the Crude Oil market.
Natural Gas has correlation with Crude oil. If the prices of the crude oil will increase the prices of the
Natural Gas increase the price of Natural Gas will also increase. Initial Days crude oil was the only
source of energy but after the development of the natural gas sector it is also considered as a major
energy commodity. Because of the wide Industrial use of natural gas now small change in the price
hampers the growth of the industry and the economy. The only way to secure ourselves is to do
hedging of the commodity in the crude oil market. For that we need to know how much Natural Gas
price can move according to that the companies try to hedge their position in the market.

38 | P a g e
ATR of NATURAL GAS:-
ATR value from NYMEX
Given
All time average ATR is = 0.1498101
Maximum value of the 14 days ATR = 0.64708
Maximum value of the 5 days ATR = 1.0535879
5 day ATR and the 14 days ATR can be use for the research work and for trading but all time
ATR is also good for the analysis.
As the all time ATR is showing that the movement is around $ .15 which means in a general
market the price of the Natural Gas moves either side of the market by $ .15. But we know that it is
considering a long term so the data will not be sufficient in the current market because it is more
volatile than last decade.
The 5 days ATR is showing the value of $ 1.06 that means according to the current market
volatility and the time of the energy shocks the price of the Natural Gas may move up to the $ 1 so at
the time of the important news in the market we can expect the price will change up to $ 1 in one
trading day.
The 14 days ATR is showing the value of $ .65 that means in a 14 trading day the maximum
volatility was $.65. On the bases of the average of the last month 5 days and 14 days ATR the values
are near about the $ .15 so we can say that in a particular trading day the price of the Natural Gas can
move up to $ .15 and then we can expect the market will retrace the price or will go to the side wave.
Again it is better to have all three ATR for the trading of Natural Gas because there are many
factors which are influencing the price and in that condition we can use these values as levels for the
trading as support and resistance level.

39 | P a g e
Standard Deviation:-
Month Standard Deviation
value
January
February
March
April
May
June
July
August
September
October
November
December
January
February
March
0.205596
0.195777
0.105677
0.885451
0.185215
0.140683
0.088427
0.290022
0.163761
0.215118
0.143578
0.121659
0.28379
0.262
0.228274
Now if we look at the SD on month bases then we find that the average SD for the Natural Gas is
$ .25 so we can say that the average movement in the Natural Gas in a particular trading day is $.25-
$.30, In case of the huge volatility the movement can be change but in last few days there is no such
news in the market so we can say that the movement will not high but in particular time of the day
the expected movement will be$ .25.
Now if analyze the both values ATR and the SD then we will find that the volatility of the
Natural Gas is $.15 - $.25, and in case of adverse condition or big market news the market can move
up to $ 1.

40 | P a g e
4.3 Relation between Crude Oil and Natural Gas Prices: -
The availability of natural gas supplies act as a demand dampener for crude oil in the form of
competition for residual crude oil in electricity generation and with distillate crude‟s for space
heating applications. Thus, there stands a relationship between the prices of natural gas and crude oil.
Despite the substitution effect of natural gas prices on crude oil prices, prices were found to have a
positive correlation
While there is a strong stable long-run price relationship between oil and natural gas prices,
seasonal fluctuations and other factors such as abrupt changes in weather, supply disruptions and
inventory trends can alter this price relationship in the short-term.

41 | P a g e
4.4 price driving factors of natural gas
Factors Affecting Short Term Demand for Natural Gas: -
Demand for natural gas has been cyclical in nature. Demand for natural gas depends highly on the
time of year, and changes from season to season. In the past, the cyclical nature of natural gas is:
demand was highest during the coldest months of winter and lowest during the warmest months of
summer. The driver for this cycle of natural gas demand is the need for residential and commercial
heating. This has resulted in demand for natural gas showing spikes in January and February, and
Low during the months of July and August.
The recent change in the use of natural gas for the generation of electricity has resulted in an
deviation in this traditional cyclical behavior. Requirements of natural gas for heating decrease
during the summer months demand for space cooling increases during this warmer season. As we
know Electricity is the primary source of energy for residential and commercial cooling
requirements, it is leading to an increase in demand for electricity. Because natural gas is used to
generate a large portion of electricity, simply increased electrical demand often means increased
natural gas demand. This results in a smaller spike in natural gas demand during the warmest months
of the year. Thus, natural gas demand experiences its most pronounced increase in the coldest
months, but as the use of natural gas for the generation of electricity increases, the magnitude of the
smaller summer peak in demand for natural gas is expected to become more pronounced.
There are two primary drivers that determine the demand for natural gas in the short term:
Weather – as we know that natural gas demand peaks during the coldest months of the year and
tapers off during the warmest months of the year, with a slight increase during the summer to meet
the demands of electric generators. The weather during any particular season has effect on cyclical
demand for natural gas. The colder the weather during the winter, the more pronounced will be the
winter peak. A warm winter may result in a less winter peak. Extremely hot winter can result in even
greater cooling demands, which in turn increase summer demand for natural gas.
Fuel Switching - demand and supply in the marketplace determine the short term price of natural
gas. This can work in reverse as well; the price of natural gas can affect its demand. This is
particularly true for those consumers who have the capacity to switch the fuel upon which they rely.
While most residential and commercial customers rely solely on natural gas to meet many of their
energy requirements, some industrial and electric generation consumers have the capacity to switch
42 | P a g e
between different fuels. For example, during a period of extremely high natural gas prices, many
electric generators may switch from using natural gas to using cheaper coal, thus decreasing the
demand for natural gas.
Economy - The state of the economy in general can have a considerable effect on the demand for
natural gas in the short term. If the economy is developing then output from industrial sectors will
also increasing at the same rate. If the economy is in recession, output from industrial sectors will
drops. These fluctuations in industrial output accompanying economic upswings and downturns
affects the amount of natural gas needed by these industrial users. For Example, during the economic
downturn of 2001, industrial natural gas consumption fell by 6%. Thus we can say that the short term
status of the economy has an effect on the amount of natural gas consumed.
Factors Affecting Long Term Demand for Natural Gas
It is the long term demand factors that reflect the basic trends for natural gas use into the future. In
order to analyze those factors that affect the long term demand for natural gas, we can examine
natural gas demand by sector. It is useful to have an understanding where and how the natural gas
can be used in different sector.
Transportation Sector Demand
Natural gas use in the transportation sector is still in its in starting stage, Demand from the
transportation sector accounts for 3 % of total world natural gas demand. Natural gas supplies barely
a fraction of the total energy used in the transportation sector.
The demand for alternative fuel vehicles is expected to increase in the future primarily due to new
legislation and regulation about the emissions from the transportation sector. As more stringent
emissions standards are adopted.

43 | P a g e
Electric Generation Demand
The demand for electricity is increase by an average rate of 1.8 % per year through to 2025. In order
to meet this growing demand, 335 Giga watts of new electric generation capacity are expected to be
needed by 2025. Relatively low capital requirements for building natural gas fired combined cycle
generation plants, and the reduction of emissions that can be earned from using natural gas as
opposed to other dirtier hydrocarbons like coal, we expects 57 % of new electric generation capacity
built by 2025 will be natural gas combined-cycle or combustion turbine generation. Natural gas fired
electricity generation accounted for 16 percent of all generation in 2002.
Residential and Commercial Demand
We expect residential energy demand to increase 25 percent between 2002 and 2025. Residential use
of natural gas is expected to increase by 1.5 percent per year from 2002 to 2010 and 0.9 percent from
2010 to 2025, increasing 25.5 percent from 2002 to 2025. Residential natural gas consumption
accounts for 12 percent of all consumption in the world.
The analyses of factors that affect long term demand across all sectors are complicated. The actual
demand for any source of energy relies on a variety of interrelated factors, and it is very difficult to
predict how these factors will combine to shape overall demand.
Hurricanes can impact both the supply of and demand for natural gas. For example, as hurricanes
approach the Gulf of Mexico, offshore natural gas platforms are shut down as workers evacuate,
thereby shutting in production. In addition, hurricanes can also cause severe destruction to offshore
(and onshore) production facilities. For example, Hurricane Katrina (2005) resulted in massive shut-
ins of natural gas production.
Hurricane damage can also reduce natural gas demand. The destruction of power lines interrupting
electricity produced by natural gas to distribute , can result in significant reduction in demand for a
given area (e.g., Florida).

44 | P a g e
Factors Affecting the Supply of Natural Gas: -
The production of natural gas in the world is based on competitive market forces: inadequate supply
at any one time leads to price increases, and it signal to production companies that they need to
increase the supply of natural gas to the market. Supplying natural gas in the world in order to meet
this demand, however, is dependent on a number of factors: -
Short Term Supply Barriers
Price signals would be recognized and acted upon immediately, and there would be little lag time
between increased demand for natural gas, and an increase in supplies reaching the market. In reality,
this lag time does exist.
Availability of Skilled Workers – it is very difficult to find the skilled workers and to train them, it
requires time and money. So in that time the production is low and the demand is increasing
according to the market. For example, from 1991 to 1999, relatively low prices indicated adequate
supplies of natural gas existed, and the exploration and production industry contracted in response. In
this period, the U.S. Bureau of Labor Statistics recorded a 26 percent average decrease in
employment in the oil and gas extraction industry. Some of these workers left the industry altogether
rather than remain unemployed. The production companies began to react to higher prices in late
1999. So the companies have to pay higher wages to the workers.
Natural Gas Prices and Drilling Rig Operation:
Availability of Equipment - Drilling rigs are very expensive. Price volatility in the industry makes it
very difficult for producers, as well as production equipment suppliers, to plan the construction and
placement of drilling rigs far in advance. Low prices results in reduction of the number of available
rigs. If prices respond to increase demand, and drilling activity increases, time is required to build
and place an adequate number of drilling rigs. For this reason, drilling rig counts are a good
indication of the status of the oil and natural gas production industry.
Inclement Weather Can Disrupt Offshore Operations
Weather and Delivery Disruptions - weather patterns may have a significant impact on natural gas
production. For instance, hurricanes can have an impact on the offshore production of natural gas, as
safety measures require the temporary shutdown of offshore drilling and production platforms. While
45 | P a g e
the safety record of the natural gas industry is extremely good, malfunctions and accidents may occur
from time to time that disrupt the delivery of natural gas.
On the bases of the previous analysis we can say that:-
The demand for natural gas is mainly driven by the following factors:
Weather
Demographics
Economic growth
Fuel competition
Storage
Exports
The supply for natural gas is mainly driven by the following factors:
Pipeline capacity
Storage
Gas drilling rates
Natural phenomena
Technical issues
Imports
International Trade of Natural Gas
26.3% of total world marketed natural gas production was internationally traded. LNG tankers trade
accounted for 21% of total international trade. The low share of international trade is due to the high
transportation costs. Natural gas is complex to transport and requires large investments, while many
gas resources are far from consuming centers. The construction and management of pipelines also
poses legal and logistical problems. Most LNG trade takes place in Asia-Pacific, with Indonesia,
Malaysia and Australia as exporting countries and Japan as the main importing country. Algeria and
Qatar are also major exporters of LNG.
46 | P a g e
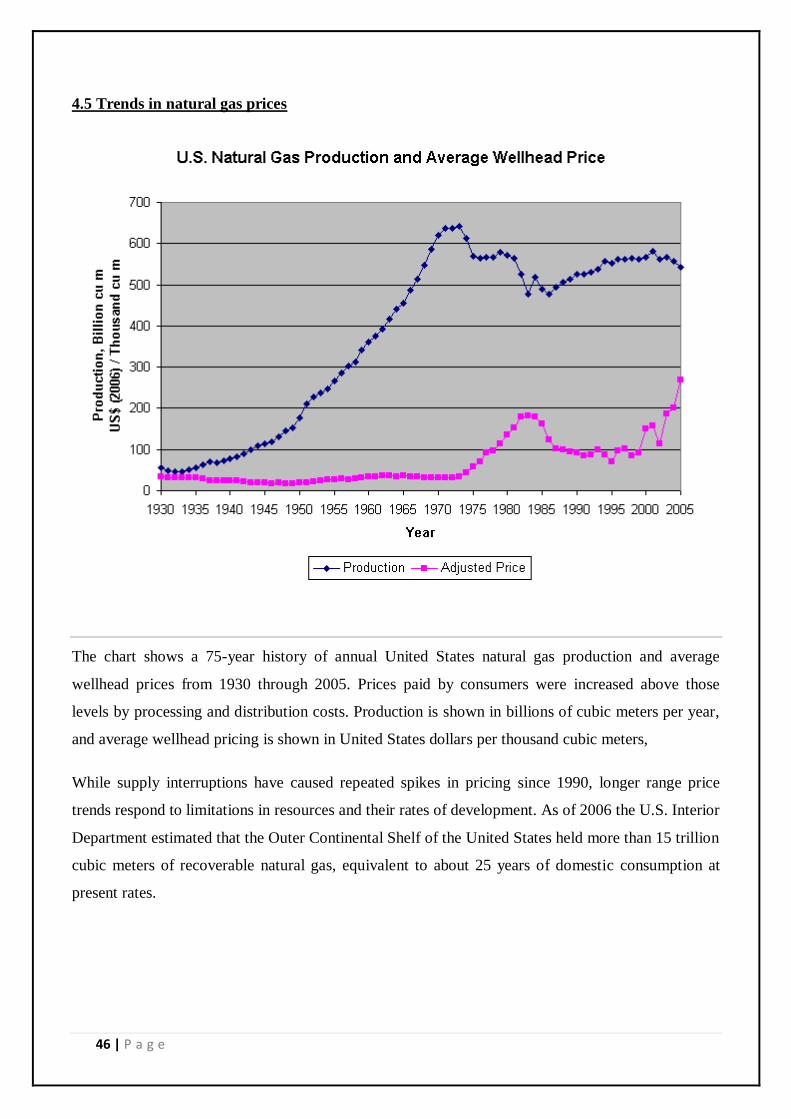
4.5 Trends in natural gas prices
The chart shows a 75-year history of annual United States natural gas production and average
wellhead prices from 1930 through 2005. Prices paid by consumers were increased above those
levels by processing and distribution costs. Production is shown in billions of cubic meters per year,
and average wellhead pricing is shown in United States dollars per thousand cubic meters,
While supply interruptions have caused repeated spikes in pricing since 1990, longer range price
trends respond to limitations in resources and their rates of development. As of 2006 the U.S. Interior
Department estimated that the Outer Continental Shelf of the United States held more than 15 trillion
cubic meters of recoverable natural gas, equivalent to about 25 years of domestic consumption at
present rates.

47 | P a g e
Chapter - 5
Conclusion:-
Energy commodities play an important role in the economy. Small change in the price of these
commodities leads to big losses to the consumers. In the research we tried to find the factors
affecting the price and the movement of the price in a particular day. The study carried out by the
technical and statistical tools followed by analysis of the factors affecting the price of Crude oil,
Natural gas and Coal.
These three commodities are the major commodities which having influence in all the
sectors. And we find that in a particular trading day in normal condition the prices of crude
oil moves between $ 2- $ 3 and if there is any news in the market it may become more
volatile and move according to the news in the market. The factors which are affecting the
crude oil are Weekly US crude and product demand, Weekly crude and product inventories,
Weekly crude oil and product imports, Weekly refinery production of crude oil and products
etc, Weather conditions, Natural gas prices, Trend in other global markets, Currency
movements and Political/geopolitical issues.
Natural Gas market is developing now as these days and the demand is increasing
continuously. In the study we find that in general conditions it moves between$.15- $ .25 and
in adverse condition it can move up to $1. Natural gas having a very good correlation with
crude oil. Crude oil and the demand in power sector and transportation sector influence the
price of natural gas with majorly considering the factors affecting the supply.
Coal is another prominent commodity used mainly in the power generation so the industrial
demand and the demand in the power sector having influence in the price of coal. Majorly the
coal is not traded in exchanges it is traded in OTC market. Analysis says that the movement
in the price of coal is between $ 2- $ 3 and the other market condition it can be reach up to
$5.5.
There are still many factors which are affecting the prices such as the correlation between the
commodities and the effect of the change in the price currency value in which the commodity
traded.

48 | P a g e
Bibliography
1)Cofnas ABE, ”Ol in charge”
2) GAO, “ Natural gas analysis of hang in maet prce”
3) Gua Hui & Kliesen Kivin, “ Oil price volatility and US micro economic activity”
4) Ahmad R Jalali & Naini, Kazimi Mariyam, “Price volatility and hedging variables risk premium
in crude oil market”
5) Abosedra Salah, Radcheneso Stanislav, “New evidence on the asymmetric gasoline price:
volatility vs margin?”
6) Lie Thomas K, “ Volatility relationship between crude oil & petroleum product”
Websites:
http://weatherbugbrowserbar.mysearch.com/search/redirect.jhtml?qid=0FEAEA5868BE6FC
84B42FF8E556E677D&action=click&p=AJmain&ss=sub&ptnrS=&st=bar&cb=WB&pg=AJ
main&ord=18&searchfor=Descriptive+Research&tpr=jrel3&redirect=AJmain.jhtml&ct=RR
http://www.onlinetradingconcepts.com/TechnicalAnalysis/MovingAverageEnvelopes.html
http://www.geocities.com/dancoman/TA/gannangles.html
http://chartschool.wordpress.com
http://ask.reference.com/related/Descriptive+Research?
http://answers.yahoo.com/question/index?qid=
http://www.powermin.nic.in/
http://www.globalcoal.com/
http://www.coalspot.com/
http://www.mccloskeycoal.com/
http://www.coalindia.in/
http://seekingalpha.com/search/articles/?q=crude&cx=00151423756733

49 | P a g e
http://www.marketoracle.co.uk/
http://www.marketwatch.com/