analysis of price incentives for coffee in ethiopia€¦ · • coffee is considered the main...
TRANSCRIPT

Analysis of price incentives for coffee in Ethiopia for the time period 2005–2012
April 2014

Analysis of price incentives for coffee in Ethiopia for the time period 2005–2012
April 2014
This technical note is a product of the Monitoring and Analysing Food and Agricultural Policies (MAFAP) programme. It may be updated as new data becomes available.
MAFAP is implemented by the Food and Agriculture Organization of the United Nations (FAO) in collaboration with the Organisation for Economic Co-operation and Development (OECD) and national partners in participating countries. It is financially supported by the Bill and Melinda Gates Foundation, the United States Agency for International Development (USAID) and FAO.
The analysis presented in this document is the result of partnerships established in the context of the MAFAP programme with the Ethiopian Development Research Institute.
This technical note was prepared by Tadesse Kuma Worako of the Ethiopian Development Research Institute, with support and contributions from Alban MasAparisi and Barthélemy Lanos of the FAO.
For more information: http://www.fao.org/in-action/mafap

Recommended citation: FAO. 2014. Analysis of price incentives for coffee in Ethiopia. Technical notes series, MAFAP, by Kuma Worako, T., MasAparisi, A. and Lanos B., Rome.
The designations employed and the presentation of material in this information product do not imply the expression of any opinion whatsoever on the part of the Food and Agriculture Organization of the United Nations (FAO) concerning the legal or development status of any country, territory, city or area or of its authorities, or concerning the delimitation of its frontiers or boundaries. The mention of specific companies or products of manufacturers, whether or not these have been patented, does not imply that these have been endorsed or recommended by FAO in preference to others of a similar nature that are not mentioned.
The views expressed in this information product are those of the author(s) and do not necessarily reflect the views or policies of FAO.
© FAO, 2014
FAO encourages the use, reproduction and dissemination of material in this information product. Except where otherwise indicated, material may be copied, downloaded and printed for private study, research and teaching purposes, or for use in non-commercial products or services, provided that appropriate acknowledgement of FAO as the source and copyright holder is given and that FAO’s endorsement of users’ views, products or services is not implied in any way.
All requests for translation and adaptation rights, and for resale and other commercial use rights should be made via www.fao.org/contact-us/licence-request or addressed to [email protected].
FAO information products are available on the FAO website (www.fao.org/publications) and can be purchased through [email protected].

TABLE OF CONTENTS TABLE OF CONTENTS ............................................................................................................................... iv
SUMMARY OF THE NOTE .......................................................................................................................... v
COMMODITY CONTEXT .................................................................................................................... v
DRIVING FACTORS ........................................................................................................................... vi
RECOMMENDATIONS ...................................................................................................................... vi
1. PURPOSE OF THE NOTE ................................................................................................................... 1
2. COMMODITY CONTEXT ................................................................................................................... 2
PRODUCTION ....................................................................................................................................... 2
CONSUMPTION/UTILIZATION ............................................................................................................. 4
MARKETING AND TRADE ..................................................................................................................... 5
DESCRIPTION OF THE VALUE CHAIN ................................................................................................... 9
POLICY DECISIONS AND MEASURES .................................................................................................. 13
3. METHODOLOGY ............................................................................................................................. 15
4. DATA REQUIREMENTS AND CALCULATION OF INDICATORS ........................................................ 19
TRADE STATUS OF THE PRODUCT ..................................................................................................... 19
MARKET PATHWAY ANALYSED .......................................................................................................... 19
BENCHMARK PRICES .......................................................................................................................... 20
DOMESTIC PRICES ............................................................................................................................. 21
EXCHANGE RATES .............................................................................................................................. 22
ACCESS COSTS ................................................................................................................................... 23
BUDGET AND OTHER TRANSFERS ..................................................................................................... 29
QUALITY AND QUANTITY ADJUSTMENTS .......................................................................................... 29
DATA OVERVIEW ............................................................................................................................... 30
SUMMARY OF INDICATORS ............................................................................................................... 32
5. RESULTS AND INTERPRETATION .................................................................................................... 33
6. RECOMMENDATIONS .................................................................................................................... 41
7. CONCLUSION ................................................................................................................................. 43
MAIN MESSAGE ................................................................................................................................. 43
LIMITATIONS ..................................................................................................................................... 43
FURTHER INVESTIGATION AND RESEARCH ....................................................................................... 43
BIBLIOGRAPHY ....................................................................................................................................... 45
ANNEX I: Data and calculations used in the analysis ............................................................................ 47

SUMMARY OF THE NOTE Product: Coffee Period analyzed: 2005-2012 Trade status: Exported in all years
COMMODITY CONTEXT • As the birthplace of coffee Arabica, Ethiopia is still a major producing country of high-value
coffee. It has accounted, on average, for about 5 percent of gross domestic product (GDP), 10 percent of total agricultural production as in 2011, the country produced around 5 percent of world production and 39 percent of the total production of coffee in Sub-Saharan Africa (ICO, 2012).
• Coffee is considered the main export crop in the country, providing thirty-one percent of Ethiopia’s foreign exchange earnings.
• Over four million small-scale farmers produce ninety-five percent of the total coffee output, and twenty-five percent of the Ethiopian population directly or indirectly depends on the coffee value chain for their income and employment.
• Forty-eight percent of coffee produced in Ethiopia is locally consumed, reflecting the commodity’s cultural importance in the country.
Figure 1. Observed and adjusted Nominal Rate of Protection at farm gate level for coffee in Ethiopia (%), 2005-2012
Source: MAFAP, 2014
The observed Nominal Rate of Protection (NRP, green bar) in the graph above measures the effect of policy distortions and overall market performance on price incentives for producers. The adjusted NRP (blue bar) captures the same elements as the observed NRP, in addition to any market distortions resulting from inefficiencies in the commodity’s value chain and exchange rate misalignment.
-60
-40
-20
0
20
40
60
80
100
120
2005 2006 2007 2008 2009 2010 2011 2012
Perc
enta
ge
Observed nominal rate of protection at farm gateAdjusted nominal rate of protection at farm gate
v

DRIVING FACTORS • Our results show that there are mainly incentives for wholesalers and producers in the
observed domain. This has been due to lucrative coffee prices in the international market, coupled with improved infrastructure and market information system in the country in recent years. Furthermore, strong local demand combined with an increase in per capita income may also contribute to incentives facing producers and wholesalers. Prices of Jimma coffee were sometimes over-valued at the point of competition due to artificial shortages created by suppliers speculating for better prices in the future. This over-valued price created an incentive at the wholesale level and was transmitted to producers.
• Market inefficiencies and policy distortions are considerable and arise from 1) overvalued exchange rate, 2) high level of impurities and weight losses 3) excessive margins from traders over producers, and 4) high transport and marketing costs. This suggests that the actors in the coffee value chain could benefit from high prices without having to resort to oligopolistic trade practices. Lower exchange rate, efficient value chain with a good grading system incurring less impurities and weight losses would bring more room to increase prices. A better connection between producers and exporters would also help raise income for producers of high-value coffee.
• Trade value has increased since 2008-2009 due to high world prices, and the government of Ethiopia needs to ensure this opportunity is seized in order to foster economic development down to the smallholder level, which is currently the main producing level for coffee by far. A sustainable and healthy marketing system is needed in order to encourage this.
RECOMMENDATIONS In order to address the above-mentioned issues driving the price incentives/disincentives environment for coffee supply in Ethiopia, policy work could include:
• Support to market infrastructure development to limit weight loss and reduce transport fees along the value chain. This would allow producers to benefit from the promotion of bulk transport without losing the traceability of their coffee. This will appeal more to the producers who continue to trade their coffee through cooperative unions that have the power to export directly.
• Reinforcement of the grading certification for coffee under the ECX system to ensure its high value and prevent impurity losses and adulteration of coffee; Improving the transparency and objectivity of grading would strengthen the relationship between traders ECX.
• Connection improvement between producers and exporters to ensure higher market power for producers and to limit oligopolistic practices from coffee suppliers.
• Providing proper extension services on coffee production with regards to widespread coffee wilt, coffee berry disease (CBD) treatment and risk management of weather related shocks.
• Intensification of certification process and grading in order to improve the traceability and thus, the added value of the exported coffee.
• Refinement of the currency valuation could ensure better revenues for wholesalers.
vi

1. PURPOSE OF THE NOTE This technical note is an attempt to measure, analyze and interpret market incentives and disincentives for coffee in Ethiopia over the period 2005-2012. This note is a technical document and as an input for the MAFAP Ethiopia Country Report.
For this purpose, yearly averages of domestic farm gate and wholesale prices are compared with reference prices calculated on the basis of the price of the commodity in the international market. The price gaps between reference prices and domestic prices along the commodity’s value chain indicate the extent to which incentives (positive gaps) or disincentives (negative gaps) were present at the farm gate and Point of Competition level. The price gaps are expressed in relative terms as a percentage of the reference price, referred to as the Nominal Rate of Protection (NRP). These key indicators are used by MAFAP to assess the effects of policy and market performance on prices.
This technical note begins with a review of the commodity’s production, consumption/utilization, marketing and trade, value chain and policy context (Chapter 2). It also provides a detailed description of how key data elements were obtained and indicators were calculated (Chapter 3). The indicators were then interpreted in light of existing policies and market characteristics (Chapter 4), and key policy recommendations were formulated on the basis of this interpretation (Chapter 5). Finally, the note concludes with a few main messages, limitations of the analysis and areas identified for further research to improve the analysis (Chapter 6).
The results and recommendations presented in this analysis of price incentives can be used by stakeholders involved in policy-making for the food and agriculture sector. They can also serve as input for evidence-based policy dialogue at the national, regional or international level.
This technical note should not be interpreted as an in-depth value chain analysis or detailed description of the commodity’s production, consumption/utilization, marketing and trade or policy context. All information related to these areas is presented merely to provide background on the commodity under review, help understand major trends and facilitate the interpretation of the indicators.
All information in this technical note is subject to review and validation.
1

2. COMMODITY CONTEXT Ethiopia is the birthplace of coffee Arabica. More genetically diverse strains of C. Arabica exist in Ethiopia than anywhere else in the world, which has lead botanists and scientists to agree that Ethiopia is the center for origin, diversification and dissemination of the coffee plant (Mekuria T., et al., 2004). The high genetic diversity of Ethiopian coffee is considered to be of great value both nationally and internationally, as it represents a pool to develop improved breeds of coffee. There are currently hundreds of types of coffee under cultivation, each with varying aromas, tastes or colors, especially in the Southwestern part of the country. Ethiopian coffee ranks highly in intrinsic quality of the bean due to the diverse agro-ecological zones and immense genetic diversity aforementioned. It is also de facto wild and organic due to predominant subsistence and traditional production systems (Kufa, 2006). The main category of coffee produced in Ethiopia is Arabica coffee, with no production of Robusta1.
Coffee cultivation plays a vital role both in the cultural and socio-economic life of the nation. Ninety-five percent of the total coffee output is produced by over four million small-scale producers (Arslan and Reicher, 2011, CSA, 2012), and almost 20 percent of the Ethiopian population depends either directly or indirectly on coffee production, processing, marketing and transporting (USDA, 2012). The recent innovation of catering traditional coffee in most towns and cities has created jobs for a large number of youth. It must be noted that Ethiopia is also a coffee consuming country, with forty-eight percent of production being consumed domestically, more than any other coffee producing country (USDA, 2012 and Worako, 2008).
PRODUCTION In 2011, Ethiopia produced around 5 percent of the world’s production and 39 percent of the total production of coffee in Sub-Saharan Africa (International Coffee Organization, 2012). It is the first coffee-producing African country and stands fifth in the world. Coffee is currently providing 31percent of Ethiopia’s foreign exchange earnings (CSA, 2012). Despite its high value, it has to be noted that coffee production is not very important in terms of area cultivated. In 2011, it held only 3.8 percent of Ethiopia’s cultivation area, corresponding to 515,882 hectares (CSA, 2012). Overall, it is estimated that there is a potential 6 million hectares of cultivable land suitable for coffee production (Mekuria et al., 2004).
Ethiopia’s coffee production is the fastest growing in the world, with an estimated annual average growth rate of 12 percent, compared to 7, 5 and 3 percent for Brazil, Vietnam and Colombia, respectively (Bekele, 2011)2. Ethiopia’s annual average coffee production was approximately 275,000 tons over the 2005-2010 period. Total coffee production has been improving steadily during the past twenty years, with a 110 percent increase between 1993 and 2011. After a peak production of 325,800 tons in 2007, however, the volume of coffee produced dropped sharply, although the level of area cultivated continued to increase. The yields have therefore strongly diminished. An explanation could be the adverse weather that damaged the crops (Promar Consulting, 2011) and a lack of proper extension services in this case. Additional explanation on why production stalled after 2007 is that a new marketing system was introduced by the government, the Ethiopian Commodity
1 Arabica and Robusta are two different species of coffee, Arabica being considered a higher-quality coffee. 2 For the 2000-2008 period, using yearly averages.
2

Exchange, prompting wholesalers to hold on to their supplies to see if the system would work, and wait for better prices. Also, exports were hit in 2008 for various reasons (see Marketing and Trade section), which possibly trickled down to the offer side, i.e. production. In 2011, coffee production rose sharply again, increasing from 270,000 tons to 376,823 tons.
Figure 2.Yields (Hg/Ha), Area Harvested (Ha) and Production (tons) for coffee in Ethiopia, 1993-2012
Source: FAOSTAT, 2012 and CSA, 2012 for the year 2011
Coffee is mainly grown by smallholder farmers on less than 1 hectare of land, and earning less than a dollar per day (McCarthy, 2007). Small-scale farmers produce coffee through a mixed farming system (McCarthy, 2007), which accounts for 90percent of coffee production, whereby forest and semi-forest, and plantation systems contribute for 5 percent (Mekuria 2004). Coffee produced by small-scale farmers typically yields 500 to 600 kg per hectare, while commercial plantations and state farms can yield up to 1200 kg per hectare (Dejene, 2011, from CSA).
There are several coffee types in Ethiopia. Coffee cultivation takes place at various altitudes, ranging from 550-2,750 meters above sea level, albeit the bulk of coffee is produced in the eastern, southern and western parts of the country, which have altitudes ranging from 1,300 - 1,800 masl (ECEA, 2012). The optimal temperature for coffee Arabica is considered 15-25ºc. All of the coffee-growing regions have fertile, friable, loamy soils, with a depth of at least 1.5 meters.
Almost 95 percent of Ethiopian coffee is produced in the administrative zones of Keffa, Sidamo, Ilubabor, Wellega, Gedeo and Harerghe (Hailu, 2011). These zones correspond to the Southern Nations and Nationalities Peoples Regional State (SNNPR) and Oromia Regional State. The four major types of commercial coffee are Jimma in the Oromia and SNNPR region, Sidama and Yirgacheffe in the SNNPR region, and Harar in the Oromia region. The names correspond to the cities around which they are produced. These four coffee trademarks represent around 70 percent of total coffee exports registered by the Ethiopian Revenue and Customs Authority from 2004 to 2009 (Arslan and Reicher, 2010).
0
2000
4000
6000
8000
10000
12000
0
100000
200000
300000
400000
500000
600000
1993
1994
1995
1996
1997
1998
1999
2000
2001
2002
2003
2004
2005
2006
2007
2008
2009
2010
2011
2012
Yield(Hg/Ha)
AreaHarvested(Ha)
Production(tonnes)
3

Figure 3: Major commercial coffee producing areas
Source: Worako, 2008
In most coffee-growing areas of Ethiopia, the harvesting period for red coffee beans falls between August and January. Coffee harvesting is largely done through family labour and coffee is then processed with two different methods: dry and wet. Dry processing means that coffee cherries are sun-dried to extract the beans. This traditional method is used for 73 percent of coffee harvested (TayeKufa, 2006 in Hailu, 2011) and produces ‘’unwashed’’ coffee, which is considered to be of a lesser quality. The wet processing method is more costly and complex and produces ‘’washed coffee.’’ This method implies that the coffee is ‘’pulped, fermented and washed to remove its sticky mucilage” (NegaritGazeta, 2008). Washed coffee also fetches about 20 percent higher prices compared to sun-dried coffee of the same type.
CONSUMPTION/UTILIZATION It is estimated that nearly 50 percent of coffee produced in Ethiopia is self-consumed (USAID, 2012). Indeed, a special feature of Ethiopian coffee production is that domestic consumption is considerably high, as coffee is a traditional beverage throughout the country (Hailu, 2011). Most of the coffee that is locally consumed originates from the coffee growing areas of Shoa, GamuGofa, Arsi, Gojjam, Bale and Wello. These areas produce mainly for domestic consumption and are thus to be differentiated from export-oriented coffee production areas.
Coffee consumption has remained almost unchanged during the 1990s, being consumed at an annual average of 1.4 kg per person from 1993 to 2002 (Figure 4). Nonetheless, the level of consumption strongly decreased from 2003, reaching its lowest level in 2004 at 0.5 kg per year, which then
4

represented 25 percent of the annual production. Notwithstanding, per capita consumption of coffee rose again to more than 2 kg per person in 2007, back to the level that prevailed in the 1980s. The drop in consumption can be associated with the production in the country that diminished during the same period due to causes aforementioned (see Production section). Other reasons include increasing local prices of coffee and the changing consumption habits of Ethiopian youth. It has also to be noted that sources differ on the amount of coffee consumed within the country, with a rate of 3 kg per person/year being reported for 2010 by Hailu (2011), whereas the consumption rate never exceeds 2.2 kg per person/year in the FAOSTAT database.
Figure 4. Total coffee consumption (kg/capita/yr, in blue) and production (hundred thousand tons, in red), in Ethiopia, 2000-2012
Source : FAOSTAT, 2012
MARKETING AND TRADE Coffee is the main export crop in Ethiopia. In 2012, it was providing 31 percent of Ethiopia’s foreign exchange earnings (CSA, 2012), down from 65 percent a decade ago, which is due to the slump in coffee prices since the mid-1990s (Mekuria et al., 2004).
0.0
0.5
1.0
1.5
2.0
2.5
3.0
3.5
4.0
2000
2001
2002
2003
2004
2005
2006
2007
2008
2009
2010
2011
2012
Production (100thousand tons)
Percapitaconsumption(Kg/hd/yr)
5

Figure 5: Coffee price variations in Ethiopia, 1991-2009, for producer (PPN), auction (APN) and international price (FPN), in US per Pound
Source:Seyoum, 2010
However, prices have been slightly recovering since 2003. Hence, despite the price slump from the mid-1990s to 2002, exports tripled in volume from 1993 to 2009, while being multiplied by 5 in value during the same period, reaching almost 700 million US dollars in 2009 (FAOSTAT).
This can be partly attributed to policy measures such as the devaluation of local currency, removal of taxes on coffee exports, global coffee price situation and improved roads and marketing infrastructure (Worako et al., 2008). As can be seen when comparing
Figure 5 and Figure 6, growth in coffee export earnings in Ethiopia are highly linked to international prices or windfall gain, rather than improvement in production, quality or marketing efficiency.
Figure 6: Exports of coffee from Ethiopia, 1993-2011, in quantity (tons) and value (1000 USD)
Source : FAOSTAT, 2012
0
100
200
300
400
500
600
700
800
900
1993
1994
1995
1996
1997
1998
1999
2000
2001
2002
2003
2004
2005
2006
2007
2008
2009
2010
2011
2012
Valu
e (m
illio
n $)
& Q
uant
ity (1
000t
ons)
Export Value (Million $)
ExportQuantity (1000tons)
2 per. Mov.Avg. (ExportValue ( Million$))
6
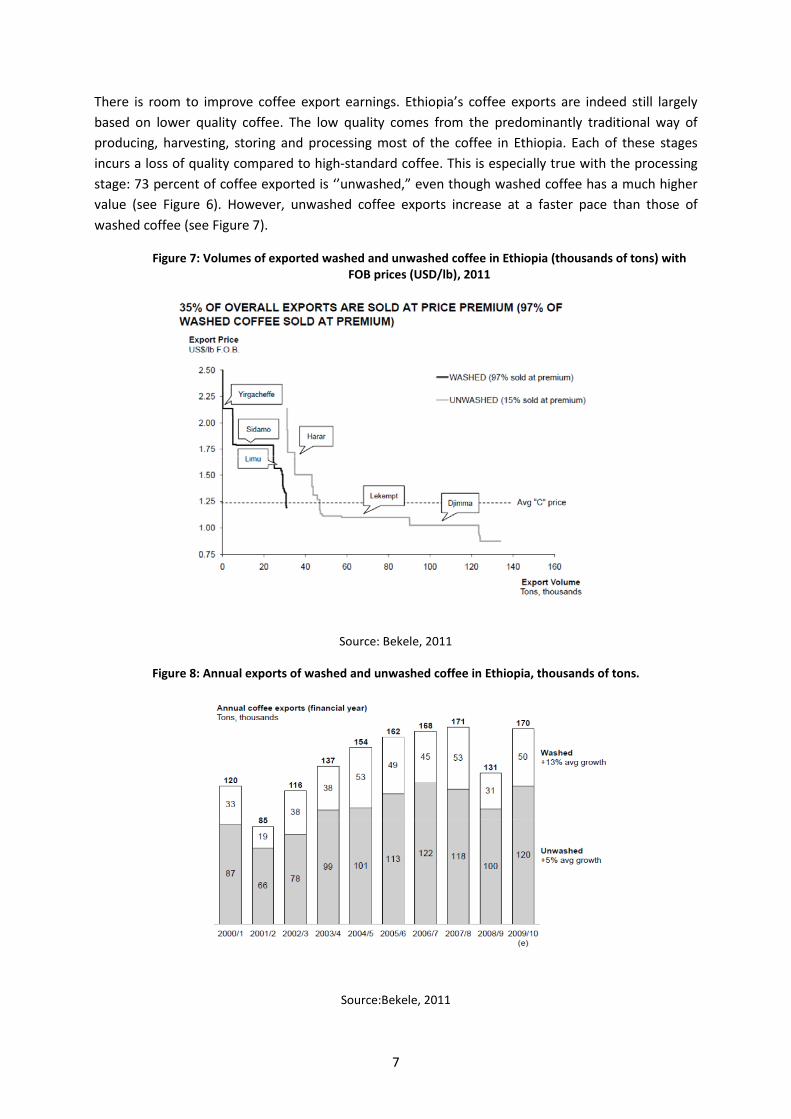
There is room to improve coffee export earnings. Ethiopia’s coffee exports are indeed still largely based on lower quality coffee. The low quality comes from the predominantly traditional way of producing, harvesting, storing and processing most of the coffee in Ethiopia. Each of these stages incurs a loss of quality compared to high-standard coffee. This is especially true with the processing stage: 73 percent of coffee exported is ‘’unwashed,” even though washed coffee has a much higher value (see Figure 6). However, unwashed coffee exports increase at a faster pace than those of washed coffee (see Figure 7).
Figure 7: Volumes of exported washed and unwashed coffee in Ethiopia (thousands of tons) with FOB prices (USD/lb), 2011
Source: Bekele, 2011
Figure 8: Annual exports of washed and unwashed coffee in Ethiopia, thousands of tons.
Source:Bekele, 2011
7

Certified coffee is also high-value. There are two main certifications. The first one is organic coffee, which corresponds to coffee that was produced so that the ‘’biological value of coffee harvested is equal to the value returned to the soil (Boot, 2011).” Ethiopia is the second largest exporter of organic coffee in the world, behind Peru. In 2005, Ethiopia shipped 19 percent of the world’s organic coffee exports, representing some 9,000 tons. Organic coffee accounts for 6percent of total Ethiopian coffee exports (Kodama, 2007). The certification for such coffee is low cost and easy to access for Ethiopian producers, all the more because 90percent of Ethiopian coffee is already organic (Mekuria, 2004). This explains the high share of organic coffee in Ethiopian exports, which is bound to increase.
The second most used certification is Fair Trade. Fair Trade originally refers to the Fairtrade Labeling Organizations International, a program formalized in 1997 in Germany (Boot, 2011). The term is now used as a label by a large network of companies following a similar approach. Fair Trade implies granting producers a decent price for their product, allowing them to fulfill basic needs such as access to water or education.3 Fair trade exports represent 2 percent of total coffee exports in Ethiopia, as it is more difficult to obtain the label based on the floor price paid to the farmer, rather than on its mode of production.
It has to be noted that not all of trade is taken into account in the official statistics. A substantial volume of coffee is also smuggled through parallel markets, especially in the Western, Northern and Eastern borders. Although data is missing on informal trade, it is known that in 2006 about 15 percent of coffee produced in the Southwestern and Western zones were smuggled via Sudan. Overall, when self-consumption and smuggling are added up, less than 40 percent of the total national production of coffee is exported through official export markets (Worakoet al., 2008).
Ethiopia’s main trading partners from 1995 to 2011 were Germany (29 percent), Saudi Arabia (15 percent) and Japan (16 percent). However, Japan has strongly reduced imports since 2007, after traces of pesticides were discovered on packing bags. Exports to the United States are also on the rise, their share of total exports increasing from 4 percent to 8 percent between 2000 and 2011.
3 The definition provided by the four main Fair Trade networks is the following: ‘’Fair trade is a trading partnership, based on dialogue, transparency, and respect, that seeks greater equity in international trade. It contributes to sustainable development by offering better trading conditions to, and securing the rights of, marginalized producers and workers – especially in the South’’
8

Figure 9: Ethiopia’s main trading partners for coffee exports, in % of total kgs exported from 1995 to 2011
Source: UNCOMTRADE, 2012
DESCRIPTION OF THE VALUE CHAIN Coffee trees are being grown to produce coffee cherries (McCarthy, 2007), either by smallholders (90 percent) or on plantations (5 percent). Five percent of coffee cherries are also being picked from wild coffee trees in the forest. Coffee cherries are therefore picked and gathered by either producers or wageworkers, and are then sold to cooperatives, wholesalers (akrabies), or collectors (sebsabies). Cherries can be pre-processed by producers, but cooperatives or private operators always intervene in the processing of coffee cherries.
Two methods are being used: wet and dry.
i. Dry processing is the traditional method because it is cheap and generally made by the producers themselves and represents more than 73 percent of coffee processing in Ethiopia (TayeKufa, 2006 in Hailu, 2011). It results in “unwashed” coffee, largely traded through ECX (accounting for 60 percent of ECX transactions). The berries are left to dry under the sun, which can take several weeks. Producers undertake the drying themselves, unless they sell the cherries as “fresh cherries.” Once the cherries are dried, producers then sell them to collectors, wholesalers or cooperatives. These actors then hull the cherries, so as to remove the outer pulp, and obtain green beans that can be sold on the outer market. Jimma coffee, chosen for the MAFAP analysis (see Data Requirement section), is mainly processed through this method.
ii. Wet processing uses a costly method that requires high quantities of water and appropriate machinery. It also needs fully ripe cherries. Wet-processing results in “washed” coffee, which is considered to be of a premium quality. In a few cases, wholesalers or cooperatives either own or rent pulperies, and process fresh cherries bought from the producers or the collectors. Exporters also own processing plants where they reprocess coffee so as to reach premium standards
Germany 29%
Saudi Arabia 15%
Japan 16%
USA 8%
Belgium 6%
Italy 5%
France 5%
Sweden 2%
Europe Other 7%
Asia Other 3%
Africa Other 3%
Oceania Other 1%
9

Figure 10. Functions and actors along the coffee value chain in Ethiopia
Source: Authors, based on Böhnert, E. & N. Dieter, 2006
Coffee beans are then presented to the Coffee Liquoring Unit by wholesalers and unions. The CLU is a governmental agency that performs quality checks on arrival at the export market and also grants export clearance. It holds regional offices and warehouses all over Ethiopia to facilitate control and marketing.
There are three pathways for processed beans to be sold to the export market:
i. Since 2008, most coffee beans are sold through the Ethiopian Commodity Exchange market (ECX), which was handling 90 percent of the exports in 2012. This market was set up by the government in 2008 to organize coffee trading in the country. Members include producers, cooperatives, wholesalers and exporters. It is compulsory for traders and exporters to go through the ECX, unless they are cooperatives, producers, or export straight from their commercial plantations4. Law obliges farmers to sell their produce in primary markets selected by the Ministry of Trade, from where traders and cooperatives buy and transport it. They then have to take the coffee beans to a regional ECX warehouse, where they are standardized by region and graded by the CLU. Then the Exchange delivers a Good Received
4 According to Ethiomedia, the punishment for illegal trading could reach up to 20-year prison term and 50 000 birr fine.
Specific inputs
FUNCTIONS
Production Processing Marketing Further processing
Sale to consumers
• Buying at primary coffee market • Pulping/hulling • Transport to regional ECX warehouse • Quality inspection • Obtaining Good Received Note • ECX trading floor • Sale to exporters/importers
ACTORS
• Wet or dry processing • Hulling • Packaging • Storage
• Propagation • Planting • Maintenance • Picking/gathering
• Training and organization • Breeding
• Distribution • End consumption
• Cleaning • Blending • Roasting • Grinding • Bagging
• Buyers • Certifiers • Cooperatives • Wholesalers • Exporters • Coffee Unions • Coffee Growers association, Fora • Ethiopian Commodity Exchange Authority (ECEA) • ECX • Transporters • Insurers • Importers • Roasters
• Hulling plan owners • Wageworker
• Farmers • Plantation owners • Wageworkers • Production associations
• Village inhabitants • Farmers • Breeders/researchers • Gene bank
• Wholesalers • Supermarkets • Discounters • Retailers • Gourmet coffee sales • End consumer
• Roasters
10

Note to traders, which allows them to meet with exporters at the ECX trading floor in Addis-Ababa. Wholesalers and exporters must pay a fee to get a seat at the ECX trading floor, and exporters must be Ethiopian. Also, they cannot taste the coffee before buying, and the coffee is not traceable to a specific farm or sub-region. Indeed, coffee is stocked and sold by quality grading rather than by the identity of the depositor (USAID, 2010). Once exporters have bought the coffee, they need a clearance from the CLU, after which they can then sell to international companies. Before 2008, coffee beans were either traded directly by wholesalers to licensed exporters, or through an auction market run by the former state agency, the Coffee and Tea Authority. Coffee quality was brought to Addis-Ababa to be inspected for quality, and then traded. However, trade through the Addis-Ababa auction market was not compulsory.
Figure 11. Simplified representation of ECX system
Source : Authors from USAID, 2010
The ECX system has brought two-sided changes to coffee marketing in Ethiopia. On one hand, it has rationalized trade and marketing within the country, with more competitive prices, and hence, lower margins for traders and unions. On the other hand, ECX has faced criticism from various actors (traders, NGOs, researchers) due to two main reasons. The first one is that ECX imposes excessive restrictions by making trade through ECX regional warehouses compulsory. The multiple steps incurred at the marketing stage of the value chain create bottlenecks, due to poor service delivery. Moreover, exporters are not allowed to store more than 500 tons of coffee for more than two months, which restricts the possibility to wait for a better signal. The second reason is that trade through ECX hinders traceability of coffee beans, and destroys the privileged relations that some producers had established with high-quality coffee importers from abroad. It therefore acts as a deterrent
Farmer, cooperative, or traderbrings coffee to Exchange-operated delivery center
The exchange assesses qualityand issues Good Received Noteon basis on quantity andweight
Buyer deposits pre-trade fundsinto settlement account inExchange partner bank
ECX Trading Floor
ECX Back Office
Seller posts offer
Buyer posts bid
•Order reconciliation
•Clearing and
settlement
•Market info
transmission
•Market surveillance
•Risk management
•Member database
•Disaster recovery
•Data center
11

for the high-quality coffee niche industry, which represents one of Ethiopia’s comparative advantages. As a consequence, cooperative unions often sell directly to export markets (as they are allowed to), rather than through ECX.
ii. Direct exports are another pathway to trade coffee in Ethiopia. Unions have been allowed to bypass the auction market and sell directly to international companies since 2001, and indeed seldom go through the auction market. There are six unions, four of which are larger scale: Oromiya, Sidama, Yirgachefe and Kaffa. The two others are Tepi and Bench Maji. Unions5 buy coffee from primary cooperatives, and then sell it to international companies, giving back 30 percent of the dividends to the cooperatives and 70 percent to the farmers (Kodama, 2007). Unions generally sell specialty coffee; for instance, in the year 2005, 93 percent of coffee bought by the Yirgachefe Union was Fair Trade or Organic (Kodama, 2007). Unions are encouraged to sell specialty coffee because they can have a direct relation with the buyer, making their coffee more traceable than on the auction market. However, many primary cooperatives do not sell their coffee through unions. This is either because the coffee produced exceeds the amount the unions are able to sell, or because the quality level of the coffee is unsatisfactory. Thus, the price at the auction market is better than what the union can offer (Kodama, 2007). In 2005, cooperatives belonging to the Yirgachefe Union sold around 87 percent of their coffee through the exchange market, rather than through the union (Kodama, 2007). Furthermore, cooperatives themselves do not capture the bulk of coffee production. It is estimated that only 40 percent of coffee producers are members of cooperatives (Kodama, 2007), meaning that most of the production goes through private traders and not cooperatives. Since 2008, producers have also had the possibility to sell directly to international companies, yet few producers have the financial means to bypass traders and cooperatives. Exporters are also allowed to export directly if the coffee comes from their plantations. This remains minor (around 5 percent), although it is gaining more importance.
iii. Coffee that has been rejected by the CLU, whether coming from commercial plantations or smallholders, is usually resold to wholesalers and small roasters. They process and sell it to retailers, who then sell the coffee to national consumers in their turn.
5 Unions refers to “Coffee Farmers Cooperative Unions”
12
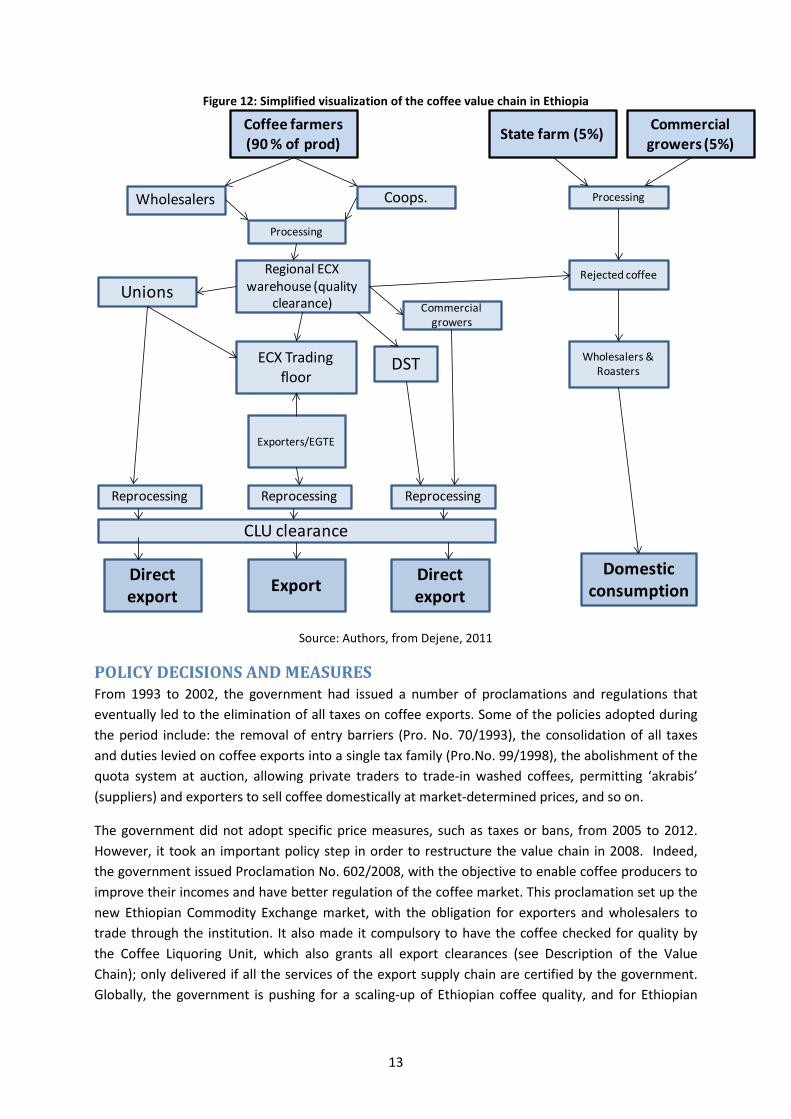
Figure 12: Simplified visualization of the coffee value chain in Ethiopia
Source: Authors, from Dejene, 2011
POLICY DECISIONS AND MEASURES From 1993 to 2002, the government had issued a number of proclamations and regulations that eventually led to the elimination of all taxes on coffee exports. Some of the policies adopted during the period include: the removal of entry barriers (Pro. No. 70/1993), the consolidation of all taxes and duties levied on coffee exports into a single tax family (Pro.No. 99/1998), the abolishment of the quota system at auction, allowing private traders to trade-in washed coffees, permitting ‘akrabis’ (suppliers) and exporters to sell coffee domestically at market-determined prices, and so on.
The government did not adopt specific price measures, such as taxes or bans, from 2005 to 2012. However, it took an important policy step in order to restructure the value chain in 2008. Indeed, the government issued Proclamation No. 602/2008, with the objective to enable coffee producers to improve their incomes and have better regulation of the coffee market. This proclamation set up the new Ethiopian Commodity Exchange market, with the obligation for exporters and wholesalers to trade through the institution. It also made it compulsory to have the coffee checked for quality by the Coffee Liquoring Unit, which also grants all export clearances (see Description of the Value Chain); only delivered if all the services of the export supply chain are certified by the government. Globally, the government is pushing for a scaling-up of Ethiopian coffee quality, and for Ethiopian
Coffee farmers (90 % of prod) State farm (5%) Commercial
growers (5%)
Coops.Wholesalers
Processing
ECX Trading floor
Regional ECX warehouse (quality
clearance)Unions
Exporters/EGTE
CLU clearance
Direct export Export Direct
export
Commercial growers
Reprocessing Reprocessing Reprocessing
Processing
Rejected coffee
Domestic consumption
Wholesalers & RoastersDST
13

producers to target the high quality niche market. It backed the Ethiopian Coffee Quality Improvement Project (an International Trade Centre project) from 2004 to 2010, which was designed to improve local coffee quality in the country, mainly by building decentralized laboratories and providing capacity building. There are also limited attempts to produce improved coffee seeds through the Jimma Research Center (Kufa et al., 2011). Detractors of the ECX system claim, however, that the efforts to target the high quality market are undermined by ECX’s opaque system (see Figure 11).
Finally, in November 2011, a Directive from the Ministry of Trade imposed traders to transport their coffee in bulk, rather than using the traditional 60kg-jute bags, worsening the loss of traceability along the value chain but gaining from cheaper costs. In 2010, so as to answer criticism over the loss of traceability for high quality coffee, ECX launched the Direct Specialty Trade (DST). The DST acts as a hybrid system between the regular ECX system and the non-ECX direct exports system. Through DST, buyers and small farmer cooperatives/commercial growers meet at a monthly bidding session at the ECX trading floor of Addis-Ababa. Unlike regular ECX trade, DST provides an opportunity for small cooperatives to showcase traceable, high-value coffee to interested buyers, who can taste the coffee before buying. Exporters are not involved, and a condition for participation in DST bidding is that farmers will receive an 85 percent share of the final export price.
14

3. METHODOLOGY MAFAP methodology seeks to measure price incentives for producers and other marketing agents in key agricultural value chains. The analysis is based on the comparison between observed domestic prices and constructed reference prices. Reference prices are calculated from the international price of the product at the country’s border, where the product enters the country (if imported) or exits the country (if exported). This price is considered the benchmark price free of influence from domestic policies and markets. MAFAP estimates two types of reference prices – observed and adjusted. Observed reference prices are those that producers and other marketing agents could receive if the effects of distortions from domestic market and trade policies, as well as overall market performance, were removed. Adjusted reference prices are the same as observed reference prices, but also exclude the effects of any additional distortions from domestic exchange rate policies, structural inefficiencies in the commodity’s value chain, and imperfect functioning and non-competitive pricing in international markets.
MAFAP’s price incentives analysis is based on the law of one price, which is the economic theory that there is only one prevailing price for each product in a perfectly competitive market. This law only applies in the case of homogeneous goods, if information is correct and free, and if transaction costs are zero. Thus, this analysis was conducted for goods that are either perfectly homogeneous or perfect substitutes in the local market in terms of quality, or, failing that, are simply comparable goods. Indicators calculated from reference and domestic prices will, therefore, reveal whether domestic prices represent support (incentives) or a tax (disincentives) to various agents in the value chain.
Domestic prices are compared to reference prices at two specific locations along commodity value chains – the farm gate (usually the main production area for the product) and the point of competition(usually the main wholesale market where the domestic product competes with the internationally traded product). The approach for comparing prices at each location is summarized below, using an imported commodity as an example. In this situation, the country is importing a commodity that arrives in the port at the benchmark price (usually the unit value CIF price at the port of entry). In the domestic market, we observe the price of the same commodity at the point of competition, which is in this case the wholesale market, and at the farm gate. We also have information on observed access costs, which are all the costs associated with bringing the commodity to market, such as costs for processing, storage, handling, transport and the different margins applied by marketing agents in the value chain. These include access costs between the border and wholesale, as well as between the farm gate and wholesale.
The benchmark price is made comparable to the domestic price at wholesale by adding the access costs between the border and wholesale, resulting in the observed reference price at wholesale. This takes into account all the costs incurred by importers and other agents to bring the commodity to market, which in effect, raises the price of the commodity. The reference price at wholesale is further made comparable to the domestic price at the farm gate by deducting the access costs between the farm gate and wholesale, resulting in the observed reference price at farm gate. This takes into account all the costs incurred by farmers and other agents to bring the commodity from the farm to the wholesale market. Mathematically, the equations for calculating the observed
15

reference prices at wholesale (𝑅𝑅𝑅𝑅𝑜𝑜𝑜𝑜ℎ) and farm gate �𝑅𝑅𝑅𝑅𝑜𝑜𝑜𝑜𝑜𝑜�for an imported commodity are as follows:
𝑅𝑅𝑅𝑅𝑜𝑜𝑜𝑜ℎ = 𝑅𝑅𝑏𝑏 + 𝐴𝐴𝐴𝐴𝑜𝑜𝑜𝑜ℎ
𝑅𝑅𝑅𝑅𝑜𝑜𝑜𝑜𝑜𝑜 = 𝑅𝑅𝑅𝑅𝑜𝑜𝑜𝑜ℎ − 𝐴𝐴𝐴𝐴𝑜𝑜𝑜𝑜𝑜𝑜
where 𝐴𝐴𝐴𝐴𝑜𝑜𝑜𝑜ℎ are the observed access costs from the border to wholesale, including handling costs at the border, transport costs from the border to the wholesale market, profit margins and all observed taxes and levies, except tariffs, and 𝑅𝑅𝑏𝑏 is the benchmark price. 𝐴𝐴𝐴𝐴𝑜𝑜𝑜𝑜𝑜𝑜 are the observed access costs from the farm gate to wholesale, including handling costs at the farm, transport costs from farm to wholesale market, processing, profit margins and all observed taxes and levies.
The same steps described above can be taken a second time using benchmark prices and access costs that have been adjusted to eliminate market distortions due to exchange rate misalignments, structural inefficiencies in the commodity’svalue chain 6 and imperfect functioning and non-competitive pricing in international markets, where possible and relevant. The adjusted benchmark prices and access costs are then used to generate a second set of adjusted reference prices, in addition to the first set of observed reference prices calculated.
For exported commodities, a slightly different approach is used. In this case, the border is generally considered the point of competition (wholesale), and the unit value FOB price for the commodity is normally taken as the benchmark price. Furthermore, observed and adjusted reference prices at wholesale are obtained by subtracting, rather than adding, the access costs between the border and wholesale. Mathematically, the equations for calculating the observed reference prices at wholesale(𝑅𝑅𝑅𝑅𝑜𝑜𝑜𝑜ℎ) and farm gate �𝑅𝑅𝑅𝑅𝑜𝑜𝑜𝑜𝑜𝑜�for an exported commodity are as follows:
𝑅𝑅𝑅𝑅𝑜𝑜𝑜𝑜ℎ = 𝑅𝑅𝑏𝑏 − 𝐴𝐴𝐴𝐴𝑜𝑜𝑜𝑜ℎ
𝑅𝑅𝑅𝑅𝑜𝑜𝑜𝑜𝑜𝑜 = 𝑅𝑅𝑅𝑅𝑜𝑜𝑜𝑜ℎ − 𝐴𝐴𝐴𝐴𝑜𝑜𝑜𝑜𝑜𝑜
After observed and adjusted reference prices are calculated for the commodity, they are subtracted from the domestic prices at each point in the value chain to obtain the observed and adjusted price gaps at wholesale and farm gate. Observed price gaps capture the effect of distortions from trade and market policies directly influencing the price of the commodity in domestic markets (e.g. price ceilings and tariffs), as well as overall market performance. Adjusted price gapscapture the same as the observed, in addition to the effect of any distortions from domestic exchange rate policies, structural inefficiencies in the commodity’s value chain, and imperfect functioning and non-competitive pricing in international markets. Mathematically, the equations for calculating the observed price gaps at wholesale(𝑅𝑅𝑃𝑃𝑜𝑜𝑜𝑜ℎ) and farm gate �𝑅𝑅𝑃𝑃𝑜𝑜𝑜𝑜𝑜𝑜�are as follows:
𝑅𝑅𝑃𝑃𝑜𝑜𝑜𝑜ℎ = 𝑅𝑅𝑜𝑜ℎ − 𝑅𝑅𝑅𝑅𝑜𝑜𝑜𝑜ℎ
𝑅𝑅𝑃𝑃𝑜𝑜𝑜𝑜𝑜𝑜 = 𝑅𝑅𝑜𝑜𝑜𝑜 − 𝑅𝑅𝑅𝑅𝑜𝑜𝑜𝑜𝑜𝑜
6 Structural inefficiencies in commodity value chains may include government taxes and fees (excluding fees for services), high transportation and processing costs, high profit margins captured by various marketing agents, bribes and other non-tariff barriers.
16

where 𝑅𝑅𝑜𝑜𝑜𝑜is the domestic price at farm gate, 𝑅𝑅𝑅𝑅𝑜𝑜𝑜𝑜𝑜𝑜 is the observed reference price at farm gate, 𝑅𝑅𝑜𝑜ℎ is the domestic price at wholesale, and 𝑅𝑅𝑅𝑅𝑜𝑜𝑜𝑜ℎ is the observed reference price at wholesale.
A positive price gap, resulting when the domestic price exceeds the reference price, means that the policy environment and market functioning as a whole generate incentives (support) to producers or wholesalers. For an imported commodity this could be due to distortions such as the existence of an import tariff. On the other hand, if the reference price exceeds the domestic price, resulting in a negative price gap, this means that the policy environment and market functioning as a whole generate disincentives (taxes) to producers or wholesalers. For an imported commodity this could be due to distortions such as a price ceiling established by the government to keep domestic prices low.
In general, price gaps provide an absolute measure of the market price incentives (or disincentives) that producers and wholesalers face. Therefore, price gaps at wholesale and farm gate are divided by their corresponding reference price and expressed as a ratio, referred to as the Nominal Rate of Protection (NRP), which can be compared between years, commodities, and countries.
The Observed Nominal Rates of Protection at the farm gate (𝑁𝑁𝑅𝑅𝑅𝑅𝑜𝑜𝑜𝑜𝑜𝑜) and wholesale (𝑁𝑁𝑅𝑅𝑅𝑅𝑜𝑜𝑜𝑜ℎ) are defined by the following equations:
𝑁𝑁𝑅𝑅𝑅𝑅𝑜𝑜𝑜𝑜𝑜𝑜 =𝑅𝑅𝑃𝑃𝑜𝑜𝑜𝑜𝑜𝑜𝑅𝑅𝑅𝑅𝑜𝑜𝑜𝑜𝑜𝑜
; 𝑁𝑁𝑅𝑅𝑅𝑅𝑜𝑜𝑜𝑜ℎ =𝑅𝑅𝑃𝑃𝑜𝑜𝑜𝑜ℎ𝑅𝑅𝑅𝑅𝑜𝑜𝑜𝑜ℎ
Where 𝑅𝑅𝑃𝑃𝑜𝑜𝑜𝑜𝑜𝑜is the observed price gap at farm gate, 𝑅𝑅𝑅𝑅𝑜𝑜𝑜𝑜𝑜𝑜 is the observed reference price at the farm gate,𝑅𝑅𝑃𝑃𝑜𝑜𝑜𝑜ℎis the observed price gap at wholesale and 𝑅𝑅𝑅𝑅𝑜𝑜𝑜𝑜ℎ is the observed reference price at wholesale.
Similarly, the Adjusted Nominal Rates of Protection at the farm gate (𝑁𝑁𝑅𝑅𝑅𝑅𝑎𝑎𝑜𝑜𝑜𝑜) and wholesale (𝑁𝑁𝑅𝑅𝑅𝑅𝑎𝑎𝑜𝑜ℎ) are defined by the following equations:
𝑁𝑁𝑅𝑅𝑅𝑅𝑎𝑎𝑜𝑜𝑜𝑜 =𝑅𝑅𝑃𝑃𝑎𝑎𝑜𝑜𝑜𝑜𝑅𝑅𝑅𝑅𝑎𝑎𝑜𝑜𝑜𝑜
; 𝑁𝑁𝑅𝑅𝑅𝑅𝑎𝑎𝑜𝑜ℎ =𝑅𝑅𝑃𝑃𝑎𝑎𝑜𝑜ℎ𝑅𝑅𝑅𝑅𝑎𝑎𝑜𝑜ℎ
where𝑅𝑅𝑃𝑃𝑎𝑎𝑜𝑜𝑜𝑜is the adjusted price gap at farm gate, 𝑅𝑅𝑅𝑅𝑎𝑎𝑜𝑜𝑜𝑜 is the adjusted reference price at the farm gate,𝑅𝑅𝑃𝑃𝑎𝑎𝑜𝑜ℎis the adjusted price gap at wholesale and 𝑅𝑅𝑅𝑅𝑎𝑎𝑜𝑜ℎ is the adjusted reference price at wholesale.
If public expenditure allocated to the commodity is added to the price gap at farm gate when calculating the ratios, the Nominal Rate of Assistance (NRA) is generated. This indicator summarizes the incentives (or disincentives) due to policies, market performance and public expenditure.7 Mathematically, the Nominal Rate of Assistance is defined by the following equation:
𝑁𝑁𝑅𝑅𝐴𝐴 =𝑅𝑅𝑃𝑃𝑎𝑎𝑜𝑜𝑜𝑜 + 𝑅𝑅𝑃𝑃𝑐𝑐𝑐𝑐𝑐𝑐
𝑅𝑅𝑅𝑅𝑎𝑎𝑜𝑜𝑜𝑜
7 The NRA indicator was not calculated for any of the commodities analyzed because of insufficient data on public expenditure. However, it will be developed in the forthcoming reports, as the public expenditure analysis is improved and better data are made available.
17

wherePEcsp is commodity-specific public expenditure that has been identified and measured as monetary units per tonne.
Finally, MAFAP methodology estimates the Market Development Gap (MDG), which is the portion of the price gap that can be attributed to “excessive” or inefficient access costs within a given value chain, exchange rate misalignments, and imperfect functioning of international markets. “Excessive” access costs may result from factors such as poor infrastructure, high processing costs due to obsolete technology, government taxes and fees (excluding fees for services), high profit margins captured by various marketing agents, bribes and other non-tariff barriers. Therefore, the total MDG at farm gate is comprised of three components – gaps due to “excessive” access costs, the exchange rate policy gap and the international market gap. When added together, these components are equivalent to the difference between the observed and adjusted price gaps at farm gate.
Similar to the price gaps calculated, the MDG is an absolute measure, which is also expressed as a ratio to allow for comparison between years, commodities, and countries. This relative indicator of the total MDG affecting farmers is derived by calculating the ratio between the total MDG at farm gate and the adjusted reference price at farm gate as follows:
𝑀𝑀𝑀𝑀𝑃𝑃𝑜𝑜𝑜𝑜 = (𝐴𝐴𝐴𝐴𝐴𝐴𝑤𝑤ℎ+𝐴𝐴𝐴𝐴𝐴𝐴𝑓𝑓𝑓𝑓+𝐸𝐸𝐸𝐸𝐸𝐸𝐴𝐴+𝐼𝐼𝐼𝐼𝐴𝐴)𝑅𝑅𝐸𝐸𝑎𝑎𝑓𝑓𝑓𝑓
whereACGwh is the access cost gap at wholesale defined as the difference between observed and adjusted access costs at wholesale,ACGfg is the access cost gap at farm gate defined as the difference between observed and adjusted access costs at the farm gate, ERPG is the exchange rate policy gap, and IMG is the international market gap.
A more detailed description of the methodology applied in this analysis is available on MAFAP’s website atwww.fao.org/in-action/mafap/.
18

4. DATA REQUIREMENTS AND CALCULATION OF INDICATORS To calculate MAFAP’s price incentive indicators, several types of data are needed. This section presents the data that was obtained and the methodological decisions that were taken in this analysis.
TRADE STATUS OF THE PRODUCT Coffee is an export product by excellence in Ethiopia, with almost no imports.
Table 1:Traded volumes and trade status for coffee in Ethiopia (Tons), 2005-2012 sources 2005 2006 2007 2008 2009 2010 2011 2012
Export volumes (ton)
Customs Authority 150,465.55 181,799.23
156,150.07
177,294.45
129,749.09
211,655.50 159,096.22 203,391.67
Uncomtrade 14,101.96 32,043.60 156,150.06 176,862.10 129,749.09 211,673.50 159,134.61 203,549.38
FAOSTAT 172,193.00 188,237.00 158,467 179,283 129,833 211,840 159,135 NA
Import Volumes (ton)
Customs Authority 0.69 1,52 0,926 0 1,289 0 0 0
Uncomtrade 0.69 40,921.84 46.29 27,053.96 1,289 53.04 50.54 11.47
FAOSTAT 1.00 40,928.00 47 27,103 4 25 64 NA
Trade Status Net
Exporter Net
Exporter Net
Exporter Net
Exporter Net
Exporter Net
Exporter Net
Exporter Net
Exporter
Source: FAOSTAT, Customs Authority and UNcomtrade, 2013
MARKET PATHWAY ANALYSED
Almost 95 percent of Ethiopian coffee (Hailu, 2011) is produced in the administrative zones of Keffa, Sidamo, Ilubabor, Wellega, Gedeo and Harerghe, in the Southern Nations and Nationalities Peoples Regional State (SNNPR) and Oromia Regional State. As the major type of commercial coffee is Jimma in the Oromia and SNNPR regions, the farm gate was chosen in Jimma region (see Figure 13).
Before 2008, coffee beans were either traded directly by wholesalers to licensed exporters, or through an auction market run by the former state agency, the Coffee and Tea Authority. Coffee quality was brought to Addis-Ababa to be inspected for quality, and then traded (Figure 13). However, trade through the Addis-Ababa auction market was not compulsory.
Since 2008, most coffee beans are sold through the Ethiopian Commodity Exchange market (ECX). Wholesalers/suppliers have to take the coffee beans to a regional ECX warehouse, where they are standardized by region and graded by the CLU. As the farm-gate was chosen in the Jimma Region, we are considering the ECX regional warehouse in Jimma, as it is the most preferred option. Even though the physical product stays in the regional warehouse, trading is made in the ECX trading floor in Addis. Thus, it has been considered as the Point of Competition for the whole period (Figure 13). The remaining difference is made in the transport costs, which are raised for exporters after ECX, as they have to incur the costs of the transport from Jimma to Addis.
19

From there, the product is shipped to Djibouti to reach the international market (exit point of the commodity).
Figure 13. Market pathway for coffee in Ethiopia from Jimma (farm-gate), Addis Ababa (point of competition) and Djibouti (exit point), 2005 - 2012
Source: Authors from Google Maps, 2014
BENCHMARK PRICES Observed
The basis for calculating a reference parity price to determine whether Ethiopia's coffee bean farmers receive price incentives is to establish a benchmark price. The FOB price at port of Djibouti is used as a benchmark, given that Ethiopia is a net exporter of coffee to the world and that most coffee internationally exported by Ethiopia goes through the port of Djibouti. The specific type of coffee chosen for the analysis is the Jimma Coffee. It is indeed the main type of coffee produced by smallholders in Ethiopia, which is the most relevant criteria since the study intends to determine incentives to production for a representative share of producers in the country. Jimma coffee however, fetches the lowest prices of all main types of coffee. For instance, between 1992 and 2006, Harar, Wellega, Yirgachefe, Sidama and Jimma coffee fetched on average 143, 108, 106, 104 and 92 US cents per pound, respectively – ‘’which clearly depicts the differences in the quality and price of these coffee types” (Worako et al., 2008).
20

The FOB price for Jimma coffee (unspecified washed and unwashed) has been collected from the Ethiopian Revenue and Customs Authority. The price in US dollars was converted in Ethiopian Birr for the analysis.
Table 2: FOB Price for Ethiopian Jimma coffee at Djibouti, in USD/ton and ETB/ton, 2005-2012 2005 2006 2007 2008 2009 2010 2011 2012
FOB price in USD/ton
2,077 2,123 2,120 2,580 2,489 2,368 5,256 4,318
Exchange Rate 8,67 8,70 9,00 9,60 11,90 14,70 16,90 17,60 FOB price in ETB/ton
18,008 18,470 19,080 24,768 29,619 34,810 88,822 75,994
Source: Ethiopia Revenue and Customs Authority and Ethiopian National Bank, 2013
Adjusted
No adjustments to the benchmark prices were made.
DOMESTIC PRICES Observed prices at point of competition
Wholesale prices, in the 2005-2010 coffee analysis, correspond to two sets of prices, both related to Jimma coffee.
• The first set of prices, from 2005 to 2007, corresponds to independent traders’ prices in Addis-Ababa. These important traders bought coffee from semi-wholesalers based in producing areas or directly from producers through collectors. They would then sell the coffee to exporters.
• The second set of prices, from 2008 to 2012, corresponds to the auction market price, also in Addis-Ababa. Since 2008, the government has implemented the ECX system, which has absorbed the biggest share of coffee trade in Ethiopia (see Description of the Value Chain section).
Table 3: Traders price and ECX price for Ethiopian Jimma coffee at Addis-Ababa, in ETB/tonne, 2005-2012 2005 2006 2007 2008 2009 2010 2011 2012
Traders’ price 16,023 15,772 19,730 NA NA NA NA NA ECX price NA NA NA 21,906 23,072 32,230 76,974 65,241
Source: Worako (2008) for 2005-2007 and ECX: 2008-2012
Observed prices at farm gate
Producer prices for Jimma Coffee in the Jimma area have been chosen and were collected from the Central Statistical Agency’s monthly producer price survey for Jimma.
Producer prices for Jimma are obtained from CSA. The Central Statistical Agency collects producer prices from private farmers and cooperatives for each Enumeration Area (EA). A maximum of three price quotations are collected from different producers and the average is reported. The CSA reports these prices in two forms: (1) ‘coffee whole’ and (2) ‘coffee bean.’ ‘Coffee whole’ refers to the sun-dried, not decorticated bean (locally called ‘jenfal’), and ‘coffee bean’ refers to the ungraded green bean, which is often called ‘morbush’ or ‘clean coffee.’ The majority of the coffee farmers in Ethiopia
21

sell their coffee in the form of dry cherries (jenfal). These cherries are then hulled by wholesalers or sebsabys.
Since all the later stages of coffee trade are based on clean coffee beans (used as a benchmark), the local producer price for dry cherry is converted to clean coffee equivalent using standard conversion rates using literatures, information from processors (akrabys), and researcher knowledge about the sector. Accordingly, 2.0 kg of dry cherries yield, on average, 1 kg of clean coffee with fair and average quality (FAQ). One kilogram of dry cherry, on average, is equal to about 3 kg of red cherries. However, there could be slight variations depending on the coffee type, agro-ecology conditions, fertility and agricultural practices.
Moreover, coffee quality at the producer level is not as good as in the auction market – rather it is morbush with impurities. The weight loss due to cleaning of morbush is estimated to be 8 percent, which means that 1 kg of morbush coffee equals, on average, 0.92 kg of clean coffee (based on information from akrabys). Thus, we add 8 percent additional value on CSA’s clean coffee (morbush) to get a standard clean coffee at auction level.
Table 4. Producer price for Ethiopian Jimma coffee in the Jimma area, in ETB/ton, 2005-2012 2005 2006 2007 2008 2009 2010 2011 2012
(1) Price for Jenfal coffee at Farm Gate (ETB/tonne)
4 502 5 199 6 375 8 299 7 962 11 528 27 140 22 540
(2) Quantity factor from jenfal to morbush coffee
0.5 0.5 0.5 0.5 0.5 0.5 0.5 0.5
(3) Quality adjustement factor from jenfal to morbush coffee
0.92 0.92 0.92 0.92 0.92 0.92 0.92 0.92
(1)*(2)*(3) Producer price for morbush coffee (ETB/tonne)
9,787 11,304 13,859 18,042 17,309 25,061 58,508 48,881
Source: CSA, 2013
EXCHANGE RATES Observed and Adjusted
The observed exchange rate change varied little between 2005 and 2008. It increased from an average of Birr 8.67 per USD in 2005 to 9.00 in 2008. The rate increased to Birr 11.9 in 2009 and Birr 14.7 in 2010. As of September 2010, it was at 16.3 birr per USD. This continued devaluation has a direct bearing on the government’s intention to promote exports and hence reduce foreign exchange shortage, while encouraging direct foreign investment.
Despite this devaluation, it is believed that the domestic currency (Birr) was overvalued, especially in 2008, 2009 and 2010. The extent of overvaluation was estimated at 40 percent during this period. A study by Dorosh et al. (2009), suggests that the nominal exchange rate appreciated by 13.8 percent between July 2004 and January 2008. To curb the excessive drawdown of the foreign exchange reserve, access to foreign exchange for imports was restricted in March 2008. This was aggravated by high rates of domestic inflation in Ethiopia, relative to the country’s major trading partners.
As stated by Demeke (2012), the local currency was, on average, 20 percent overvalued during the period 2005-2010, and an adjusted exchange rate has been calculated accordingly. The adjustment factor approximates the depreciation of the local currency, had a more liberal policy been pursued. For 2011 and 2012, the adjusted exchange rate was calculated on the basis of information obtained
22

from IMF (2013) Consultative Group report on the status of Ethiopia's exchange rate. According to this group, the Ethiopian Birr was estimated to be overvalued 10-14 percent in 2012. This 12 percent overvaluation (average rate) was considered to calculate the adjusted exchange rate for years 2012 and 2013. From the same source, the exchange rate for 2011 was estimated to be overvalued at about 13.26 percent. The adjusted exchange rate has thus increased from Birr 10.40 in 2005 per US$1 to Birr 19.70 in 2012 (see Table 5).
Table 5: Observed and adjusted exchange rate Birr to US$ (annual average) 2005 2006 2007 2008 2009 2010 2011 2012
Observed (Birr per US$1) 8.67 8.74 9.21 9.80 12.10 12.89 16.9 17.6
Adjustment Factor 1.2 1.2 1.2 1.2 1.2 1.2 1.1 1.1
Adjusted (Birr per US$1) 10.40 10.49 10.05 11.76 14.5 15.5 19.1 19.7
Source: National Bank of Ethiopia, IMF and Demeke, 2012
ACCESS COSTS Observed
Addis Ababa to Djibouti
The first segment of the calculation of access costs is between the wholesale market (2005 to 2007) and ECX auction market (2008 to 2010) at Addis-Ababa and the port of Djibouti. For the major part, the structure of costs incurred to export coffee from Addis-Ababa to Djibouti has not varied with the introduction of ECX. Such costs include but are not limited to, processing and handling (including sample fees), port related costs, and traders’ margins. The traders’ margin has been estimated at 5 percent, given that coffee is a highly competitive sector. Some extra costs have also been added from 2008 onwards, due to the addition of ECX services: ECX warehouse fees, extra loading fees, and VAT on services.
Data for these costs have been collected from key actors in the value chain, including coffee suppliers, processors and exporters and also from institutions that work directly or indirectly for coffee such as ECX, MOT, MOA, etc. For some of the years where data was missing, costs have been calculated using the annual average inflation rate from CSA, used to estimate the missing value (Table 6).
23

Table 6: Annual average inflation rate in Ethiopia, 2005-2012 2005 2006 2007 2008 2009 2010 2011 2012
Inflation rate 11.61 12.31 17.24 44.39 8.47 8.14 33.2 18.4
Source: World Bank, 2012
The impurity loss component and the interest on capital component were calculated. For impurity losses, it was estimated through discussion with the Ethiopian Coffee Processing and Warehouse Entreprise that 14 kilograms (kgs) out of 100 are not sold on the export market due to poor quality beans that were not detected during the inspection process. However, the 14 kgs are sold at around 50 percent of FOB price on the domestic market. The impurity loss cost was thus estimated as (FOB price * 0.14)/2.
Table 7: Impurity loss costs calculation, 2005-2012, in ETB/ton 2005 2006 2007 2008 2009 2010 2011 2012
(1) FOB Price 18,008 18,555 19,525 25,284 30,117 30,524 88,822 75,994
(2) Loss ratio 0.14 0.14 0.14 0.14 0.14 0.14 0.14 0.14
(1)*(2)/2 Impurity loss costs 1261 1299 1367 1770 2108 2137 6218 5320
Source: Authors survey from the Ethiopian Coffee Processing and Warehouse Entreprise
Interest on capital, on the other hand, is paid by traders to the banks for the money borrowed to proceed to coffee transactions. Interest rates have been estimated at 9 percent of full access costs (access + wholesale price), and to cover three months of the year, which is the time required for a full round transaction (hence multiplied by 0.25).
Table 8: Interest on capital calculation, 2005-2012, in ETB/ton 2005 2006 2007 2008 2009 2010 2011 2012
1 Wholesale price + access costs 20003 19994 24613 28960 3106 41964 86505 74939
2 Interest rate (9%) 0.09 0.09 0.09 0.09 0.09 0.09 0.09 0.09
3 Converter to three-month period 0.25 0.25 0.25 0.25 0.25 0.25 0.25 0.25
(1*2)*3 Interest on capital 414 409 509 596 636 868 1768 1392
Source: Authors
24

Table 9: Observed access costs from wholesale market and ECX (Addis-Ababa) to border (Djibouti), in ETB/ton
2005 2006 2007 2008 2009 2010 2011 2012 Processing and handling costs Cleaning and reprocessing cost 263 263 263 300 300 360 440 287 Weight loss during cleaning (1.5% of wholesale price) 240 237 296 329 346 483 490 490
Impurity losses (14% of FOB) 1261 1299 1367 1769 2108 2137 6217 5320 Loading and unloading 35 34.8 45 50 50 55 55 50 Costs of jute bags 169 169 235 300 420 450 517 468 Marking bags/leveling bags NA NA NA NA 50 100 100 100 Storage costs and warehouse fees 80 80 135 189 191 199 209 209
Samplers (Wogiwoch) fee 9 9 9 9 9 9 9 4.17 Liquoring Fee/Quality Inspection 10 10 10 19 19 19 19 19 Cost of coffee drawn for sample 47 47 59 66 69 97 200 150 Transport costs from Jimma(regional ECX warehouse) to Addis - - - 750 800 900 950 950
Transport cost from Addis Ababa to port (Djibouti) (and related port costs) 351 394 444 750 800 1050 1200 981
Bank charges Interest on capital 414 409 509 596 636 868 1768 1392 Service charge 40 45 53 76 83 89 77 77 ECX costs Trading fee on value of purchase (0.4%) NA NA NA 88 92 129 191 382 Warehouse charge (2.10/kesha/bag) NA NA NA 25 25 25 25 35 VAT on services charges NA NA NA 17 18 23 32 32 Port costs Insurance 18 18 21 31 34 36 38 205 Postage, telephone, fax and interest 8 8 9 13 14 16 13 14 Port handling and transit charges 173 174 179 192 233 282 389 343 Other costs Contribution for coffee sport club 16 16 16 32 32 32 32 32 ECEA promotion fee 5.2 5 5.2 20 20 20 20 20 Other Miscellaneous expenses* 50 47 55 80 86 93 100 476 Estimated margins for traders (observed 5% total costs) 876 865 1077 1261 1342 1830 3734 2938
Total Observed Access Costs from Border to PoC 4065 4131 4788 6961 7927 9351 16875 14932
Source: Worako, 2008 and discussion with coffee exporters and traders
* calculated using the inflation rate8. N.A = did not exist before the ECX system
It is good to note that, although the structure of access costs itself has not varied much since the introduction of ECX, the costs themselves have gone up (Table 10). This can be attributed both to a rise in FOB prices, and to a system that proves to be more costly for agents along the value chain due to better services and guarantee.
8 See Table 6: Annual average inflation rate in Ethiopia 2005-2010
25
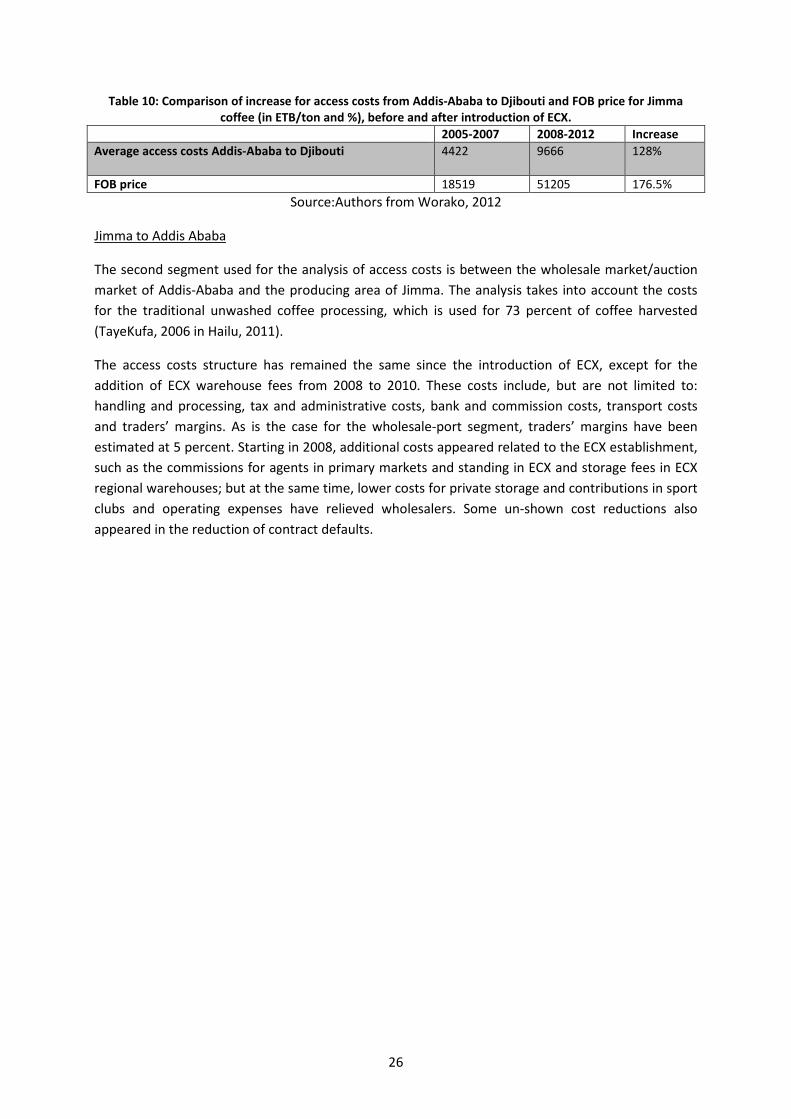
Table 10: Comparison of increase for access costs from Addis-Ababa to Djibouti and FOB price for Jimma coffee (in ETB/ton and %), before and after introduction of ECX.
2005-2007 2008-2012 Increase Average access costs Addis-Ababa to Djibouti 4422
9666 128%
FOB price 18519 51205 176.5% Source:Authors from Worako, 2012
Jimma to Addis Ababa
The second segment used for the analysis of access costs is between the wholesale market/auction market of Addis-Ababa and the producing area of Jimma. The analysis takes into account the costs for the traditional unwashed coffee processing, which is used for 73 percent of coffee harvested (TayeKufa, 2006 in Hailu, 2011).
The access costs structure has remained the same since the introduction of ECX, except for the addition of ECX warehouse fees from 2008 to 2010. These costs include, but are not limited to: handling and processing, tax and administrative costs, bank and commission costs, transport costs and traders’ margins. As is the case for the wholesale-port segment, traders’ margins have been estimated at 5 percent. Starting in 2008, additional costs appeared related to the ECX establishment, such as the commissions for agents in primary markets and standing in ECX and storage fees in ECX regional warehouses; but at the same time, lower costs for private storage and contributions in sport clubs and operating expenses have relieved wholesalers. Some un-shown cost reductions also appeared in the reduction of contract defaults.
26

Table 11: Observed access costs from farm-gate (Jimma area) to wholesale market/ECX (Addis-Ababa), ETB/Ton
Handling and processing cost 2005 2006 2007 2008 2009 2010 2011 2012 Bags 190 190 190 412 412 412 412 412 Cost of quality inspection at Woreda 11 11 11 3 3 3 3 3 Samplers (Wogiwoch) 3 3 3 6 6 6 6 6 Commission for Agent at PM 120 120 120 294 294 294 340 340 Cost of sample coffee (6 kgs at woreda and ECX) 7 7 7 28 28 28 37 44 Impurity loss during cleaning (8% of the producer price) 783 904 1109 1443 1385 2005 2050 2000 Tax and Admin cost Municipality tax 40 40 40 81 81 81 108 108 Development tax/tax paid to finance 11 11 11 129 129 129 129 129 Warehouse fee (ECX warehouse after 2008) 314 314 314 314 314 Salary for accountant 200 200 200 300 300 300 400 450 Bank and Commission Interest on capital 295 334 399 553 535 732 778 921 Bank charge 16 16 16 71 71 71 95 95 Other costs Contribution for sport club 18 18 18 13 13 13 13 13 Operating Expenses (Hotel; others) 218 218 218 16 16 16 50 60 Licensee renewal fee 6 6 6 16 16 16 16 16 Agent commission at trading floor 118 118 118 587 587 587 587 587 Others 88 88 88 70 70 70 93 110 Transport cost from farm-gate to wholesale/ECX 324 324 324 275 275 275 300 354 Estimated margins for wholesalers, observed (5% total costs) 625 709 850 1187 1146 1575 2350 2130 Total Observed Access Cost from FG to PoC 3060 3304 3715 5744 5626 6873 8080 8092
Source: Worako, 2008 and discussion with experts from the value chain
Similarly to the wholesale-Djibouti segment, access costs have clearly risen from 2008 to 2010, which seems, yet again, due to both a general rise in price and to a more costly ECX system. The cost increase is very similar to that of the Addis Ababa-Djibouti segment (Table 12), which suggests that the introduction of the ECX system had a trickledown effect on costs in the whole value chain.
Table 12: Comparison of increase for access costs from Jimma to Addis-Ababa and FOB price for Jimma coffee (in ETB/ton and %), before and after introduction of ECX.
2005-2007 2008-2012 Increase Average access costs Addis-Ababa to Djibouti 3984
8294
114.4%
FOB price 18519 51205 176.5% Source: Authors
The structure of access costs has also varied for both segments after the introduction of the ECX system. Indeed, for the Wholesale-Border segment, the share of transport costs increased threefold. Since 2008, exporters have paid transport costs from Jimma all the way to Djibouti. The processing and handling costs also increased, mainly due to the rise in oil price. Finally, the share of the margin has diminished slightly, which suggests that ECX has probably reduced room for traders’ margins.
27

Figure 14: Comparison of access costs structure for 2005-2008 (left) and 2009-2012 (right) for the wholesale-border segment, for Jimma Coffee in Ethiopia
Source: Authors from Worako, 2008
On the contrary, on the segment Jimma-Addis Ababa, transport costs went down by 4 percent, while taxes and administration costs went up by 4 percent (Figure 15). With the introduction of ECX, wholesalers had to start paying the ECX membership fee and other related costs (warehouse fees and operating expenses).
Figure 15: Comparison of access costs structure for 2005-2008 (left) and 2009-2012 (right) for the farm-gate to wholesale segment, for Jimma Coffee in Ethiopia
Source: Authors from Worako, 2008
Adjusted
Addis Ababa to Djibouti
From the wholesale market to the border segment, observed costs are adjusted by subtracting additional costs incurred by weight losses, impurity losses, transport costs and considering lower margins at 2.5 percent instead of 5 percent. In addition, the contribution to the coffee sport club and to the Ethiopian Coffee Exporters Association (ECEA) promotion have been counted out, as they are not necessary for an efficient functioning of the value chain.
28

Table 13: Calculation of adjusted access costs for the wholesale to border segment for Jimma coffee in Ethiopia, 2005-2012
2005 2006 2007 2008 2009 2010 2011 2012 1 Observed access costs 3995 4052 4686 6829 7773 9516 12066 12145
2 Difference between observed and adjusted margin 476 472 581 683 732 991 1359 1240
3 Weight loss (1% remaining) 79 78 98 108 114 160 162 162
4 Impurity loss (8% remaining) 619 635 657 852 1019 1198 1580 1643
5 Sport club + ECEA promotion fee 21 21 21 52 52 52 52 52
6 Transport costs from regional warehouse to border (50% cut) 0 0 0 375 400 450 475 475
7 Jute bags (50% lower) 85 84 118 150 210 225 258 234 1 –
(2+3+4+5+6+7)
Adjusted access costs 2714 2761 3213 4608 5246 6441 8181 8340
Source: Authors from Worako, 2008
Jimma to Addis Ababa
The same calculation is applied to the farm-gate to wholesale segment, with reduced weight loss (counted as 4 percent of the farm-gate), adjusted transport costs (half reduced as the transport in regions in the WB segment) and the contribution to sport club costs being counted out. Traders’ margins were estimated at 2.5 percent instead of 5 percent.
Table 14. Calculation of adjusted access costs for the farm-gate to wholesale segment for Jimma coffee in Ethiopia, 2005-2012
2005 2006 2007 2008 2009 2010 2011 2012 1 Observed access costs 3569 3813 4223 7077 6959 8205 9531 9698
2 Difference between observed margin and adjusted margin 313 355 425 593 573 787 1175 1065
3 Weight loss during cleaning (4% remaining) 391 452 554 722 692 1002 1025 1000 4 Sport club 18 18 18 13 13 13 13 13 5 Commission to agents (50% lower) 119 119 119 441 441 441 464 464 6 Transport costs 162 162 162 138 138 138 150 177
1 – (2+3+4+5+6) Adjusted access costs 2452 2593 2831 5074 5006 5728 6604 6861
Source: MAFAP from Worako, 2008
BUDGET AND OTHER TRANSFERS No budgetary transfer has been taken into account in the analysis.
QUALITY AND QUANTITY ADJUSTMENTS No quantity or quality adjustments were used since impurity losses are taken into account in the adjusted access costs calculation.
29

DATA OVERVIEW Following the discussions above, the table below summarizes the main data sources used, and methodological decisions taken for the analysis.
Table 15: Data sources and methodological decisions Description
Concept Observed Adjusted
Benchmark price FOB Price at Djibouti for Jimma Coffee, obtained from the Ethiopian Revenue and Customs Authority
Non relevant
Domestic price at point of competition
1. Average independent traders’ price for Jimma Coffee in Addis-Ababa, computed from monthly prices collected from Worako (2008), for 2005-2007
2. ECX price for Jimma Coffee in Addis-Ababa, computed from monthly prices collected through ECX, for 2008-2010
Non relevant
Domestic price at farm gate
Farm-gate price for Jimma Coffee, in the Jimma area, collected from the Central Statistical Agency (CSA)
Non relevant
Exchange rate Birr-US dollar exchange rate collected from National Bank of Ethiopia
Adjustment factors from Demeke (2012) and the International Monetary Fund (2013)
Access cost from border to point of competition
Processing and handling, bank and commission, tax and administrative costs, port related costs, and miscellaneous costs between Addis-Ababa and Djibouti collected from local counterparts. Traders’ margins estimated at 5 percent.
Traders’ margins estimated at 2.5 percent, impurity and weight losses are also adjusted at 8 and 1 percent. Sport club and ECEA promotion fees discarded.
Access cost from farm-gate to border
Handling, bank and commission, tax and administrative costs, and miscellaneous costs between Addis-Ababa and Djibouti collected from local counterparts. Traders’ margins estimated at 5 percent.
Traders’ margins estimated at 2.5 percent, weight losses at 4 percent of farm-gate price. Sport club fee are discarded. Transport costs are estimated at 50% lower and the margins lowered by 50%.
QT adjustment Bor-Wh - - Wh-FG - -
QL adjustment Bor-Wh - - Wh-FG - -
30

The data used for this analysis is summarized below.
Table 16. Data used for the analysis
Year 2005 2006 2007 2008 2009 2010 2011 2012
trade status X X X X X X X X
DATA Unit Symbol Benchmark Price
Observed Pb(int$) 2,077 2,123 2,120 2,580 2,489 2,368 5,256 4,318 Adjusted Pba - - - - - -
Exchange Rate Observed ERo
8.67 8.70 9.00 9.60 11.90 14.70 16.90
17.60
Adjusted ERa 10.40 10.49 10.80 11.52 14.30 17.70 19.10 19.70 Access costs border - wholesale
Observed ACowh 4,065 4,131 4,788 6,961 7,927 9,351 16,875 14,932 Adjusted ACawh 2,722 2,773 3,232 4,634 5,275 6,328 10,508 9,500
Domestic price at wholesale Pdwh 16,023 15,772 19,730 21,906 23,072 32,230 69,683 53,633 Access costs wholesale - farm gate
Observed ACofg 3,060 3,304 3,715 5,744 5,626 6,873 8,080 8,092 Adjusted ACafg 2,064 2,205 2,443 3,865 3,797 4,519 5,254 5,374
Farm gate price Pdfg 9,787 11,304 13,859 18,042 17,309 25,061 59,000 49,000 Externalities associated with
production E
Budget and other product related transfers
BOT
Quantity conversion factor (border - point of competition)
Fraction QTwh
Quality conversion factor (border - point of competition)
Fraction QLwh
Quantity conversion factor (point of competition – farm gate)
Fraction QTfg
Quality conversion factor (point of competition – farm gate)
Fraction QLfg
31

SUMMARY OF INDICATORS Table 17.MAFAP Price Gaps for coffee in Ethiopia, (ETB/ton), 2005-2012
2005 2006 2007 2008 2009 2010 2011 2012
Trade status for the year x x x X x X X X
Observed price gap at point of competition
2,080 1,348 4,992 3,583 882 11,057 -2,264 -7,430
Adjusted price gap at point of competition
-2,856 -3,725 -464 -3,801 -7,793 1,925 -20,194 -21,928
Observed price gap at farm gate -1,095 185 2,837 5,463 745 10,761 -4,866 -3,970
Adjusted price gap at farm gate -7,028 -5,988 -3,892 -3,800 -9,759 -725 -25,623 -21,188
Source: Author’s own calculations using data as described above.
Table 18:MAFAP Nominal Rates of Protection and Assistance for Coffee in Ethiopia, (%), 2005-2012 2005 2006 2007 2008 2009 2010 2011 2012
Trade status for the year x x x x x x x X
Observed NRP at point of
competition 15% 9% 34% 20% 4% 52% -3% -12%
Adjusted NRP at point of
competition -15% -19% -2% -15% -25% 6% -22% -29%
Observed NRP at farm gate -10% 2% 26% 43% 4% 75% -8% -7%
Adjusted NRP at farm gate -42% -35% -22% -17% -36% -2% -32% -31%
Observed NRA at farm gate -10% 2% 26% 43% 4% 75% -8% -7%
Adjusted NRA at farm gate -42% -35% -22% -17% -36% -2% -32% -31%
Source: Author’s own calculations using data as described above.
Table 19.MAFAP Market Development Gaps for coffee in Ethiopia, (ETB/ton), 2005-2012
2005 2006 2007 2008 2009 2010 2011 2012
Trade status for the year x x x x x x x X Access costs gap to competition point (ACGwh)
-1,343
-1,358
-1,556
-2,327
-2,652
-3,023
-6,367
-5,431
Access costs gap to farm gate (ACGfg)
-996
-1,099
-1,272
-1,879
-1,829
-2,354
-2,827
-2,719
Exchange rate policy gap (EXRP)
-3,593
-3,715
-3,901
-5,057
-6,023
-6,109
-11,563
-9,067
International markets gap (IMG)
Source: Author’s own calculations using data as described above.
32

5. RESULTS AND INTERPRETATION There are no specific trade policies for coffee in Ethiopia such as specific export taxes or quotas. However, two important changes took place regarding coffee trade from 2005 to 2012. Firstly, the Ethiopian government introduced the Ethiopian Commodity Exchange market (ECX) in 2008, which modified the marketing and trade structure of coffee (see Description of the Value Chain section). Secondly, though the price of Jimma coffee has been volatile, the FOB price has increased sharply.
Implementation of the ECX and the trends of international prices have been the main factors of change in price incentives in Ethiopia over the 2005-2012 period. It was expected that thanks to the new ECX system, which was put in place to rationalize coffee trade, producers would have benefited from increasing world prices without being overly protected, i.e. there would be a Nominal Rate of Protection (NRP) close to zero.
MAFAP analysis reveals that this has not been the case. Indeed, the structure of incentives over the 2005-2012 period has been somewhat chaotic, but overall, to the apparent benefit of producers and wholesalers who have received, on average, positive incentives.
In fact, except for in 2005, 2011 and 2012, producers have received incentives ranging from 7 to 66 percent. This suggests that prices were not only fully transmitted to producers but that they were protected, earning higher prices than what they should have received in the absence of domestic policies.
Additionally, the positive price gaps that generated incentives for producers from 2007 to 2010 have mainly come from the significant increase in domestic prices by 80 percent. In 2010, farmers received more than 10,000 ETB/tonne above the reference price, as well as the wholesalers who received 11,000 ETB/tonne more than the reference price at wholesale (Figure 16). After the peak, both producers and wholesalers received a lower price than they should have. The highest loss of income incurred by farmers in 2011, and wholesalers in 2012, reached almost 10,000 ETB/tonne (Figure 16).
33

Figure 16: Observed and Adjusted Price Gaps at Wholesale and Farm Gate in Ethiopia, 2005-2012 (ETB/Ton)
Source: Authors
In order to make a more refined analysis, it is crucial to compare the absolute price gaps to the price levels during the period. This enables an accurate idea about the real incentives/disincentives that agents have faced during the period. To do so, we are using the ratio to get the Nominal Rate of Protection (see METHODOLOGY).
Figure 17: Observed and adjusted nominal rate of protection at wholesale and farm-gate in Ethiopia for coffee (%), 2005-2012
Source: MAFAP, 2014
From 2005 to 2007, wholesalers received close to 15 percent higher incentives than farmers. In fact, wholesalers had significant marketing power due to the non-integrative and non-transparent market in Ethiopia, in which farmers were not really aware of the export price.
(30,000)
(25,000)
(20,000)
(15,000)
(10,000)
(5,000)
-
5,000
10,000
15,000
2005 2006 2007 2008 2009 2010 2011 2012
ETB/
Ton
Observed price gap at point of competition Adjusted price gap at point of competition
Observed price gap at farm gate Adjusted price gap at farm gate
-60
-40
-20
0
20
40
60
80
100
2005 2006 2007 2008 2009 2010 2011 2012
Perc
enta
ge
Observed nominal rate of protection at point of competitionAdjusted nominal rate of protection at point of competitionObserved nominal rate of protection at farm gateAdjusted nominal rate of protection at farm gate
34

Beginning in 2008, farmers started to receive higher incentives. In fact, in that year the domestic price at farm-gate rose by 30 percent, compared to the 11 percent rise that hit the wholesale price. This was most likely due to the announcement of the launch of the Ethiopian Commodity Exchange (ECX), meant to improve the export market. Indeed, it is likely that major processors and wholesalers bought large volumes of coffee because of the new trade rules through ECX. Furhtermore, the relative shortage of coffee in the country during that year may have also contributed to this incentive environment for farmers.
The incentives environment for farmers may also be a result of three factors: (1) there is more competition at the producer level due to the engagement of a large number of private traders thanks to easier licensing requirements; (2) the introduction of mobile technology that has improved producers’ access to market information; and (3) the expansion of road infrastructure in the rural areas opened up access for traders. These three major issues for producers and rural traders have improved coffee producers’ competitiveness.
After the creation of ECX in late 2008, coffee farmers faced depressed prices while wholesale prices went up. However, in 2009, all agents faced neither incentives nor disincentives and the local market was slightly distorted. This might be due to two reasons:
- Although ECX aimed to create a more integrative and transparent market (with no contract failures, better links between agents, high export quality standards), wholesalers had to incur some additional costs such as grading, processing and ECX warehouse fees. This led to a surge in access costs, likely ending to some extent in a fall in prices for farmers.
- At the same time, as ECX allows a limited number of wholesalers in the auction market (about 150), unhealthy practices within the institution might have led to oligopolistic behavior when bargaining with the processors and/or farmers.9
- Lastly, the installment of ECX as the main trading institution had likely disturbed the market until wholesalers and exporters had the time to re-organize their business. This resulted in a dramatic shortfall of exported volumes in 2009. Indeed, the level of exports that year fell down to 1,851,000 bags (ICO, 2014), the worst year since 2001.
The impressive increase of incentives in 2010 both for wholesalers and farmers (50% and 70% increase respectively) is mainly due to the coffee shortage on the international market. Indeed, producer prices increased by 45 percent and wholesale prices by 40 percent. The drop of global supply followed by the increasing demand for Ethiopian coffee on the international market (International Coffee Organization, 2014) led to a price upsurge. Indeed, low global stocks and bad weather forecasts led to a dramatic increase of coffee exports from Ethiopia in that year (63 percent).The great increase of the producer price compared to the FOB might be also due to the inelastic demand for coffee in the country.
In this context of price escalation, farmers benefitted more from high incentives than the wholesalers. This was likely due to unhealthy competition between processors who were ready to inflate their prices, no matter the international price, in light of the bad weather forecasts and subsequent increasing prices. This is a rather common practice, especially in the processing season
9 Since establishment of ECX, suppliers have an association called “Ethiopian Coffee Suppliers Association” – which provide market information and raised bargaining power.
35
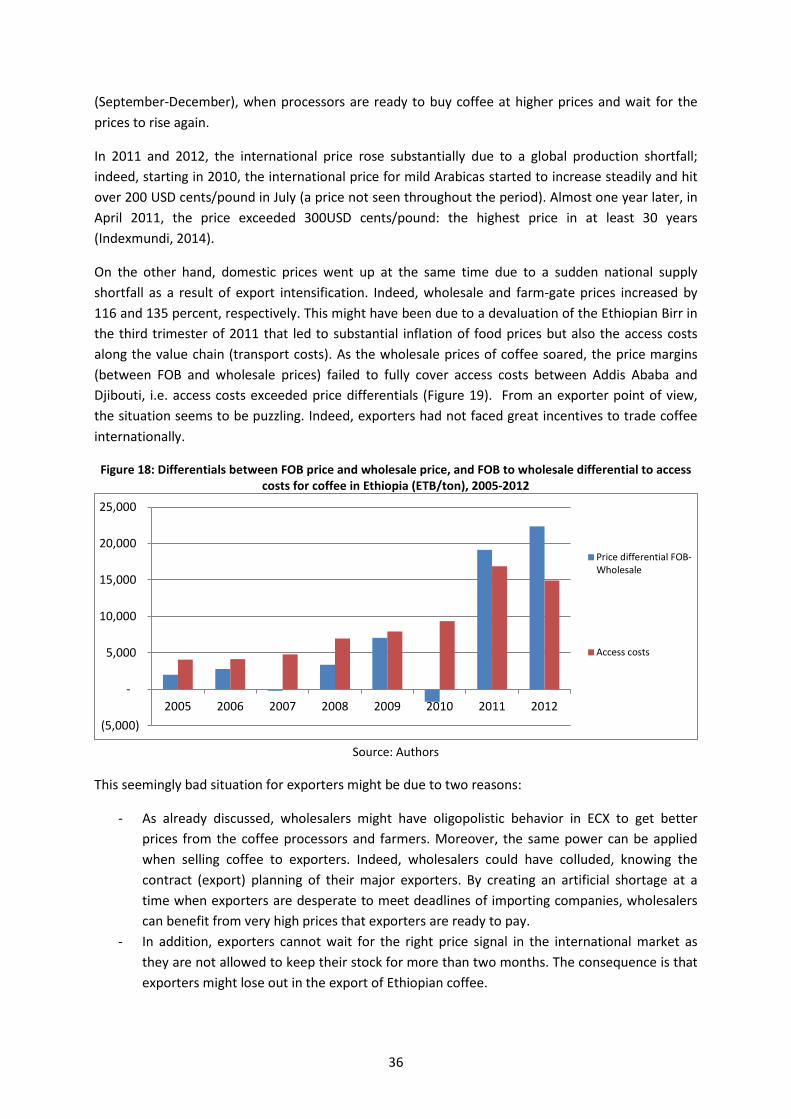
(September-December), when processors are ready to buy coffee at higher prices and wait for the prices to rise again.
In 2011 and 2012, the international price rose substantially due to a global production shortfall; indeed, starting in 2010, the international price for mild Arabicas started to increase steadily and hit over 200 USD cents/pound in July (a price not seen throughout the period). Almost one year later, in April 2011, the price exceeded 300USD cents/pound: the highest price in at least 30 years (Indexmundi, 2014).
On the other hand, domestic prices went up at the same time due to a sudden national supply shortfall as a result of export intensification. Indeed, wholesale and farm-gate prices increased by 116 and 135 percent, respectively. This might have been due to a devaluation of the Ethiopian Birr in the third trimester of 2011 that led to substantial inflation of food prices but also the access costs along the value chain (transport costs). As the wholesale prices of coffee soared, the price margins (between FOB and wholesale prices) failed to fully cover access costs between Addis Ababa and Djibouti, i.e. access costs exceeded price differentials (Figure 19). From an exporter point of view, the situation seems to be puzzling. Indeed, exporters had not faced great incentives to trade coffee internationally.
Figure 18: Differentials between FOB price and wholesale price, and FOB to wholesale differential to access costs for coffee in Ethiopia (ETB/ton), 2005-2012
Source: Authors
This seemingly bad situation for exporters might be due to two reasons:
- As already discussed, wholesalers might have oligopolistic behavior in ECX to get better prices from the coffee processors and farmers. Moreover, the same power can be applied when selling coffee to exporters. Indeed, wholesalers could have colluded, knowing the contract (export) planning of their major exporters. By creating an artificial shortage at a time when exporters are desperate to meet deadlines of importing companies, wholesalers can benefit from very high prices that exporters are ready to pay.
- In addition, exporters cannot wait for the right price signal in the international market as they are not allowed to keep their stock for more than two months. The consequence is that exporters might lose out in the export of Ethiopian coffee.
(5,000)
-
5,000
10,000
15,000
20,000
25,000
2005 2006 2007 2008 2009 2010 2011 2012
Price differential FOB-Wholesale
Access costs
36

On the other hand, exporters have agreements with the government to be paid a portion (10 percent) of the foreign currencies they generate. This would allow exporters to benefit from having foreign currency which they can use to import machinery, equipment or any other item for sale in the local market or for personal use. Furthermore, if an exporter wants more foreign currency to import goods, he/she can apply for additional allocation depending on the total amount he/she generated through coffee export. Given that the informal or black market exchange rates are higher than the official exchange rates, exporters can make a good profit from the hard currencies they are allocated. Government control over exchange rates may also have led to some under-invoicing practices by exporters.
The introduction of ECX in 2008 has not changed the market structure. It appears that ECX has failed to bring about more balanced domestic prices. First, the ECX has reduced the number of middle men but this has increased the market power of the coffee suppliers and probably allowed them to inflate prices by creating shortages. Indeed, although ECX is now the main wholesale structure for coffee in the country, the coffee still has to go through local wholesalers before reaching regional ECX level. Second, inefficient and non-transparent grading contributes to excessive losses at wholesale-exporter level, and raises their costs significantly.
The consideration of adjusted indicators permits further understanding of the trade and marketing structure of coffee in Ethiopia. The adjusted nominal rates of protection are calculated to reflect the functioning of the market and whether inefficiencies are present such as impurity or weight losses, excessive margins, or over-valued exchange rate (see Figure 17).
The adjusted Nominal Rate of Protection is negative at wholesale and farm gate level, with respective averages of -17 percent and -26 percent over the period. This suggests that producers and traders would have received lower prices than the international ones in a perfectly efficient value chain. Over the period, adjusted NRPs are greater at wholesale level than producers’, except in 2007 (Figure 17). Wholesalers, in particular, could have benefitted from higher prices without having to use oligopolistic practices if the exchange rate was not overvalued and if market inefficiencies were removed.
Impurity losses represent by far the main share of market inefficiencies between the border and point of competition, followed by excessive margins from exporters (see Figure 19). It must be noted however that the share of impurity losses may be even higher. This is because the relatively high margins are adjusted based on MAFAP methodology, and may in fact only occur in rare cases, leaving a greater share of the market inefficiencies to impurity losses. Indeed, due to the market power of coffee suppliers, exporters have limited capacity to receive such high margins, especially since they cannot store their coffee more than two months.
37

Figure 19: Share of various market inefficiencies in the observed and adjusted access costs gap between border and wholesale for coffee in Ethiopia, 2005-2012
Source: Authors
The share of each inefficiency component is very similar to that of the wholesale to border level (Figure 20), with commission for traders, license fee to sit at ECX trading floor and high impurity losses during cleaning. The importance of losses due to impurities and weight losses in the value chain suggests that the market could be more efficient by improving the quality of coffee produced but also the quality of the grading system. Indeed, although it is understandable that there are quality losses on the producer-wholesale segment, there should not be such losses on the wholesale to border segment since the coffee is supposed to be graded at ECX regional level.
Figure 20. Share of various market inefficiencies in the observed and adjusted access costs gap between farm-gate and wholesale for coffee in Ethiopia, 2005-2012
Sources: Authors
The difference between observed and adjusted access costs is used in the calculation of what is referred to as the Market Development Gap (MDG). The Market Development Gap indicator permits the understanding of structural inefficiencies (from market and exchange rate misalignment) that act
0%
10%
20%
30%
40%
50%
60%
70%
80%
90%
100%
2005 2006 2007 2008 2009 2010 2011 2012
Difference observed/adjusted margins Sport club + ECEA promotion fee Weight loss Impurity losses
0%10%20%30%40%50%60%70%80%90%
100%
2005 2006 2007 2008 2009 2010 2011 2012Difference observed/adjusted margins Sport club + license renewal fee
Taxes and Admin costs Impurity losses
38

as disincentives to producers and wholesalers. For coffee, the MDG is significant, at -36 percent on average over the 2005-2012 period (see Figure 21). This indicator reflects the fact that despite apparent incentives in the observed domain for coffee producers and wholesalers, the market development gap remains high, meaning that there is scope to ensure high domestic prices by removing inefficiencies.
Figure 21: Market development gap for coffee in Ethiopia, 2005-2012
Source: Authors
-5,870 -6,105 -6,646 -9,157 -10,380 -11,538
-18,275 -15,592
-20,000
-18,000
-16,000
-14,000
-12,000
-10,000
-8,000
-6,000
-4,000
-2,000
0
2005 2006 2007 2008 2009 2010 2011 2012
ETB/
Ton
Exchange rate policy gap Total market development gapAccess costs gap to farm gate Access costs gap to point of competition
39


6. RECOMMENDATIONS In order to improve the coffee market and trade structure, the government could focus more on the following policy work:
• Improve the efficiency of the coffee grading system; ensuring that grading is done effectively between farm-gate and wholesale would reduce the overall costs along the value chain.
• Refine the fees for the services provided by the Ethiopian Commodity Exchange (marketing, storage and sampling among others).
• Focus on improving the quality and traceability of coffee as well as the effectiveness of the marketing system. This would certainly lower access costs and offer incentives to supplier and exporters, preventing them from having to resort to market practices that create artificially high prices.
• Ensure better connection between farm-gate and exporters. This is especially true for high-quality coffee, for which value is lost in the opaque ECX system, as exporters do not fully trust the quality attributed by ECX. Better linkages between farm-gate level and exporters would ultimately lead to high prices for producers that would not derive from coffee suppliers’ oligopolistic behavior.
41


7. CONCLUSION
MAIN MESSAGE Wholesalers and producers of coffee bean in Ethiopia seem to receive production incentives between 2005 and 2010, at 20 percent and 30 percent on average, respectively. However, such incentives derive from specific market practices: the oligopoly of coffee suppliers allows them to inflate prices at wholesale level, a ‘’protection’’ that is transmitted through a cascade effect to producers.
The introduction of the ECX system in 2008 does not seem to change this practice. On the contrary, it increased access costs and disconnected exporters from producers, which increased market power for coffee suppliers, while setting up a grading system that has to be reinforced to avoid the sale of overpriced coffee at ECX.
The market development gap is high, at 43 percent, due to very high impurity and weight losses along the value chain but also to over-valued exchange rate. This means that there is scope to increase domestic prices in the coffee value chain by adopting a lower exchange rate and improving the marketing system.
LIMITATIONS All results and conclusions provided are contingent on the quality of the data. Price data used in the analysis seems very reliable but it is difficult to ensure that coffee of the same quality is being compared - although prices for Jimma coffee have been used for producer, wholesale/ECX, and border level. Data on access costs have been collected through various sources, but mainly result from discussion with coffee traders and ECX in Addis-Ababa and on the field. Access costs may thus have been over-valued, especially between producer and wholesale level, although they have been cross-checked to ensure they are close to the reality.
An important weakness of the research lies in the fact that the analysis has not been carried over into 2013 and 2014, although these years will be considered in the next MAFAP note. This shows the relevance of an institutionalized monitoring system tracking the changes in policies and prices over time, and not on a one-off basis.
Finally, although this analysis does not consider the input side, there is an intention to conduct this form of analysis in the next stages of MAFAP work.
FURTHER INVESTIGATION AND RESEARCH There are a number of areas where further research would be useful:
• On access costs, to ensure the structure is as precise as possible. However, the data collected already reaches a particularly detailed level.
• On prices, to ensure the same Jimma coffee is precisely compared, and to better understand how producer and wholesale prices are fixed and why they seem to be so high.
• On the impact of ECX on incentives and disincentives. This would require a longer time series of prices and access costs.
43


BIBLIOGRAPHY Alemu, Z.G., and T.K. Worrako, 2008.Price transmission and adjustment in the Ethiopian coffee market.Development Bank of Southern Africa (DBSA) & University of the Free State, South.
Arslan, A. and Reicher, C. 2011. The Effects of the Coffee Trademarking Initiative and Starbucks Publicity on Export Prices of Ethiopian Coffee. Journal of African Economies, Vol. 20, number 5, pp. 704–736
Bekele, 2011.Arabica Coffee Research and Development Intervention to Improve Coffee Production and Productivity in Ethiopia. Presented at 8th Eastern African Fine Coffees Association Conference and Exhibition
Böhnert, E., and N. Dieter, 2006 GTZ-GFU.Argan Oil Production in Morocco. Chapter 4 in Value Chains for the Conservation of Biological Diversity for Food and Agriculture: Potatoes in the Andes, Ethiopian Coffee, Argan Oil from Morocco and Grasscutters in West Africa.
Böhnert, E., and N. Dieter, 2006.Value Chains for the Conservation of Biological Diversity for Food and Agriculture - Potatoes in the Andes, Ethiopian Coffee, Argan Oil from Morocco and Grasscutters in West Africa. GTZ, Eschborn.
CSA, 2010.Agricultural Sample Survey 2010/2011.Area and production of crops. Central Statistical Agency of Ethiopia, Addis Ababa
Demel, T., A. Ababu, M. Getahun and E. Mehari, 1998. Study on forest coffee conservation. Coffee Improvement Project, Ethiopia. In Mekuria, T., D. Neuhoff and U. Köpke, 2004 .The Status Of Coffee Production And The Potential For Organic Conversion In Ethiopia.Conference on International Agricultural Research for Development University of Bonn, Institute of Organic Agriculture. Germany.
ECEA. 2012. http://www.ecea.org.et/major-growing-areas
Hailu, H., 2011. Growth and Physiological Response of Two Coffee Arabica L. Populations under High and Low Irradiance. Thesis submitted to Addis Ababa University.
ITC, 2011.Ethiopian Coffee quality improvement project. Available on line here: http://www.intracen.org/WorkArea/DownloadAsset.aspx?id=51214
Kodama, Y. 2007. New Role of Cooperatives in Ethiopia: the Case of Ethiopian Coffee Farmers Cooperatives’. African Study Monographs, pp. 87–109.
Kodama, Y. 2007. New Role of Cooperatives in Ethiopia: the Case of Ethiopian Coffee Farmers Cooperatives’. African Study Monographs, pp. 87–109.
Kufa, T., A. Ayano, A. Yilma, T. Kumela and W. Tefera, 2011.The contribution of coffee research for coffee seed development in Ethiopia.Journal of Agricultural Research and Development Vol. 1(1).pp. 009-016
McCarthy, S. P., 2007. Smallholder Specialty Coffee Compliance: Ethiopia and Yemen Case Studies. Trade Standards Practitioners Network (TSPN) Workshop. “African Smallholders and the Challenge of
45

Assured Compliance: What Have We Learned From Our Interventions?” Washington. D.C. June 19-20, 2007
Mekuria, T., D. Neuhoff, U. Köpke, 2004.The Status of Coffee Production and Potential for Organic Conversion in Ethiopia.Conference on International Agricultural Research for Development.University of Bonn, Institute of Organic Agriculture. Bonn.
Promar Consulting, 2011. The African Coffee Industry and Japan’s Trade and Aid Supporting the Tanzanian and Ethiopian Coffee Industries and their Export Promotion
Seyoum ,Mengistu , 2010.Price transmission system in Ethiopian coffee market.Second cycle, A2E. Uppsala: SLU, Dept. of Economics
Stellmacher, T., and U. Grote, 2011.Forest Coffee Certification in Ethiopia: Economic Boon or Ecological Bane? ZEF Working Paper Series 76, ZEF, Bonn.
Worako, TK., HD. van Schalkwyk, Z.G. Alemu and G. Ayele, 2008.Producer price and price transmission in a deregulated Ethiopian coffee market.Agrekon, Vol 47, No 4.
46
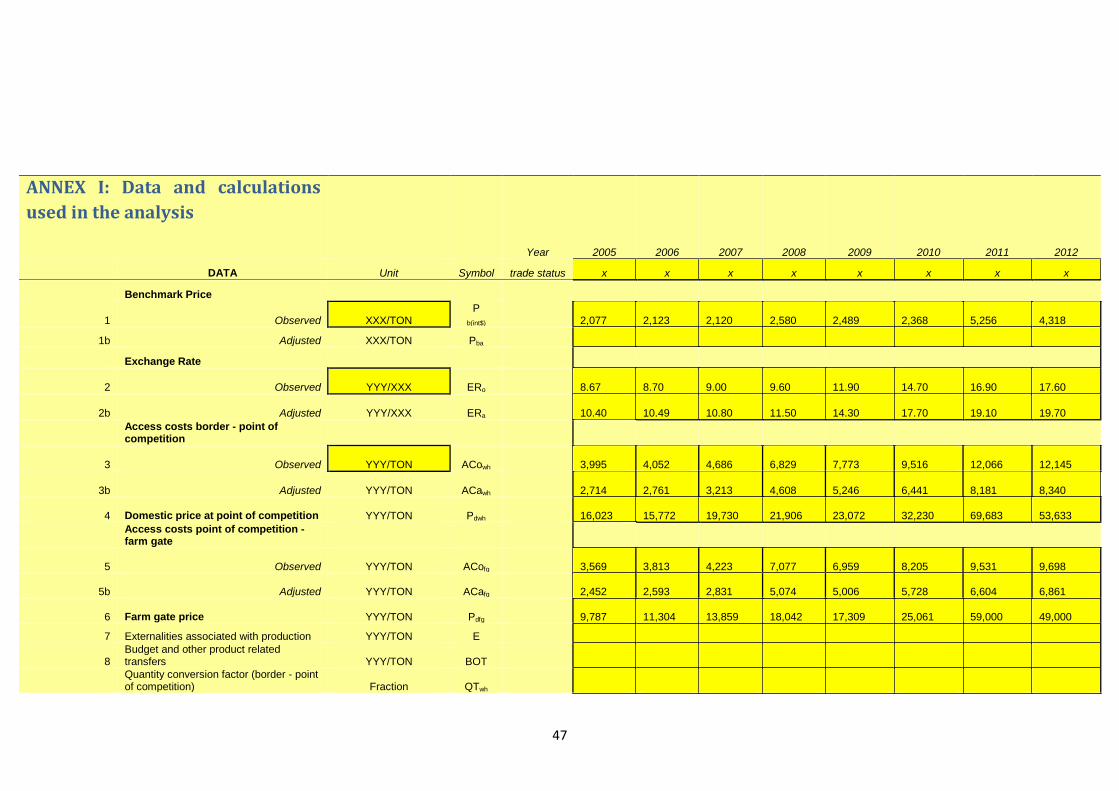
ANNEX I: Data and calculations used in the analysis
Year 2005 2006 2007 2008 2009 2010 2011 2012
DATA Unit Symbol trade status x x x x x x x x
Benchmark Price
1 Observed XXX/TON P
b(int$) 2,077
2,123
2,120
2,580
2,489
2,368
5,256
4,318
1b Adjusted XXX/TON Pba
Exchange Rate
2 Observed YYY/XXX ERo 8.67
8.70
9.00
9.60
11.90
14.70
16.90
17.60
2b Adjusted YYY/XXX ERa 10.40
10.49
10.80
11.50
14.30
17.70
19.10
19.70
Access costs border - point of competition
3 Observed YYY/TON ACowh 3,995
4,052
4,686
6,829
7,773
9,516
12,066
12,145
3b Adjusted YYY/TON ACawh 2,714
2,761
3,213
4,608
5,246
6,441
8,181
8,340
4 Domestic price at point of competition YYY/TON Pdwh 16,023
15,772
19,730
21,906
23,072
32,230
69,683
53,633
Access costs point of competition - farm gate
5 Observed YYY/TON ACofg 3,569
3,813
4,223
7,077
6,959
8,205
9,531
9,698
5b Adjusted YYY/TON ACafg 2,452
2,593
2,831
5,074
5,006
5,728
6,604
6,861
6 Farm gate price YYY/TON Pdfg 9,787
11,304
13,859
18,042
17,309
25,061
59,000
49,000
7 Externalities associated with production YYY/TON E
8 Budget and other product related transfers YYY/TON BOT
Quantity conversion factor (border - point of competition) Fraction QTwh
47

Quality conversion factor (border - point of competition) Fraction QLwh
Quantity conversion factor (point of competition - farm gate) Fraction QTfg
Quality conversion factor (point of competition - farm gate) Fraction QLfg
CALCULATED PRICES Unit Symbol 2005 2006 2007 2008 2009 2010 2011 2012
Benchmark price in local currency
9 Observed YYY/TON Pb(loc$) 18,007.59
18,470.10
19,080.00
24,768.00
29,619.10
34,809.60
88,821.91
75,994.28
10 Adjusted YYY/TON Pb(loc$)a 21,600.80
22,270.27
22,896.00
29,670.00
35,592.70
41,913.60
100,384.52
85,061.78
Reference Price at point of competition
11 Observed YYY/TON RPowh 14,012.98
14,418.21
14,394.02
17,938.82
21,846.05
25,293.36
76,755.73
63,848.90
12 Adjusted YYY/TON RPawh 18,886.56
19,508.79
19,683.49
25,061.71
30,347.16
35,472.24
92,203.88
76,721.95
Reference Price at Farm Gate
13 Observed YYY/TON RPofg 10,444.24
10,605.55
10,170.54
10,862.29
14,887.37
17,088.24
67,225.10
54,150.96
14 Adjusted YYY/TON RPafg 16,434.48
16,915.39
16,852.09
19,987.82
25,341.55
29,744.51
85,599.92
69,860.51
INDICATORS Unit Symbol 2005 2006 2007 2008 2009 2010 2011 2012
Price gap at point of competition
15 Observed YYY/TON PGowh 2,010.02
1,353.79
5,335.98
3,967.18
1,225.95
6,936.64
(7,073.15)
(10,215.91)
16 Adjusted YYY/TON PGawh (2,863.56)
(3,736.79)
46.51
(3,155.71)
(7,275.16)
(3,242.24)
(22,521.30)
(23,088.96)
Price gap at farm gate
17 Observed YYY/TON PGofg (657.24)
698.45
3,688.46
7,179.71
2,421.63
7,972.76
(8,225.10)
(5,150.96)
18 Adjusted YYY/TON PGafg (6,647.48)
(5,611.39)
(2,993.09)
(1,945.82)
(8,032.55)
(4,683.51)
(26,599.92)
(20,860.51)
Nominal rate of protection at point of competition
19 Observed % NRPowh 14.34% 9.39% 37.07% 22.12% 5.61% 27.42% -9.22% -16.00%
48

20 Adjusted % NRPawh -15.16% -19.15% 0.24% -12.59% -23.97% -9.14% -24.43% -30.09%
Nominal rate of protection at farm gate
21 Observed % NRPofg -6.29% 6.59% 36.27% 66.10% 16.27% 46.66% -12.24% -9.51%
22 Adjusted % NRPafg -40.45% -33.17% -17.76% -9.74% -31.70% -15.75% -31.07% -29.86%
Nominal rate of assistance
23 Observed % NRAo -6.29% 6.59% 36.27% 66.10% 16.27% 46.66% -12.24% -9.51%
24 Adjusted % NRAa -40.45% -33.17% -17.76% -9.74% -31.70% -15.75% -31.07% -29.86%
- 0.00% 0.00% 0.00% 0.00% 0.00% 0.00% 0.00%
(3,593.21)
(3,800.17)
(3,816.00)
(4,902.00)
(5,973.60)
(7,104.00)
(11,562.61)
(9,067.50)
Decomposition of PWAfg Unit Symbol 2005 2006 2007 2008 2009 2010 2011 2012
25 International markets gap YYY/TON IRG - - - - - - -
-
26 Exchange policy gap YYY/TON ERPG (3,593.21)
(3,800.17)
(3,816.00)
(4,902.00)
(5,973.60)
(7,104.00)
(11,562.61)
(9,067.50)
27 Access costs gap to point of competition YYY/TON ACGwh (1,280.38)
(1,290.41)
(1,473.47)
(2,220.89)
(2,527.52)
(3,074.88)
(3,885.54)
(3,805.55)
28 Access costs gap to farm gate YYY/TON ACGfg (1,116.65)
(1,219.26)
(1,392.08)
(2,002.64)
(1,953.06)
(2,477.39)
(2,926.67)
(2,836.50)
29 Externality gap YYY/TON EG - - - - - - -
-
Market Development Gap YYY/TON MDG (5,990.24)
(6,309.84)
(6,681.55)
(9,125.53)
(10,454.18)
(12,656.27)
(18,374.82)
(15,709.55)
Market Development Gap % MDG (0.36)
(0.37)
(0.40)
(0.46)
(0.41)
(0.43)
(0.21)
(0.22)
49
