analysis of parvocellular and magnocellular visual
TRANSCRIPT
Systems/Circuits
Analysis of Parvocellular and Magnocellular VisualPathways in Human Retina
Rania A. Masri,1,2 Ulrike Grünert,1,2 and Paul R. Martin1,21Faculty of Medicine and Health, Save Sight Institute and Discipline of Clinical Ophthalmology, The University of Sydney, Sydney, New SouthWales 2000, Australia, and 2Australian Research Council Center of Excellence for Integrative Brain Function, The University of Sydney, Sydney,New South Wales 2000, Australia
Two main subcortical pathways serving conscious visual perception are the midget-parvocellular (P), and the parasol-magno-cellular (M) pathways. It is generally accepted that the P pathway serves red-green color vision, but the relative contributionof P and M pathways to spatial vision is a long-standing and unresolved issue. Here, we mapped the spatial sampling proper-ties of P and M pathways across the human retina. Data were obtained from immunolabeled vertical sections of six postmor-tem male and female human donor retinas and imaged using high-resolution microscopy. Cone photoreceptors, OFF-midgetbipolar cells (P pathway), OFF-diffuse bipolar (DB) types DB3a and DB3b (M pathway), and ganglion cells were countedalong the temporal horizontal meridian, taking foveal spatial distortions (postreceptoral displacements) into account. Wefound that the density of OFF-midget bipolar and OFF-midget ganglion cells can support one-to-one connections to 1.05-mm(3.6°) eccentricity. One-to-one connections of cones to OFF-midget bipolar cells are present to at least 10-mm (35°) eccentric-ity. The OFF-midget ganglion cell array acuity is well-matched to photopic spatial acuity measures throughout the central35°, but the OFF-parasol array acuity is well below photopic spatial acuity, supporting the view that the P pathway underlieshigh-acuity spatial vision. Outside the fovea, array acuity of both OFF-midget and OFF-DB cells exceeds psychophysical meas-ures of photopic spatial acuity. We conclude that parasol and midget pathway bipolar cells deliver high-acuity spatial signalsto the inner plexiform layer, but outside the fovea, this spatial resolution is lost at the level of ganglion cells.
Key words: human vision; magnocellular; parvocellular; primate retina; spatial acuity; subcortical visual pathways
Significance Statement
Wemake accurate maps of the spatial density and distribution of neurons in the human retina to aid in understanding humanspatial vision, interpretation of diagnostic tests, and the implementation of therapies for retinal diseases. Here, we map neu-rons involved with the midget-parvocellular (P pathway) and parasol-magnocellular (M pathway) through human retina.We find that P-type bipolar cells outnumber M-type bipolar cells at all eccentricities. We show that cone photoreceptors andP-type pathway bipolar cells are tightly connected throughout the retina, but that spatial resolution is lost at the level of theganglion cells. Overall, the results support the view that the P pathway is specialized to serve both high acuity vision and red-green color vision.
IntroductionNeurons in the retina are organized into parallel pathways thatconvey signals serving distinct submodalities of vision (Wässle,2004). Knowledge of the morphology and spatial distribution ofretinal cells involved in specific pathways is pivotal to under-standing how the visual scene is processed, and more broadly inrelating the underlying precision of neural wiring to human vis-ual performance.
It is customary to describe the midget-parvocellular (P) path-way in diurnal primates as serving high acuity achromatic visionand red/green color vision (Nassi and Callaway, 2009; Lee et al.,2010), whereas the parasol-magnocellular (M) pathway is pri-marily involved in motion detection (Kaplan and Shapley, 1986;Croner and Kaplan, 1995; Crook et al., 2008). This view is
Received June 30, 2020; revised Aug. 26, 2020; accepted Sep. 22, 2020.Author contributions: R.A.M., U.G., and P.R.M. designed research; R.A.M. performed research; R.A.M., U.G.,
and P.R.M. analyzed data; U.G. and P.R.M. wrote the paper.This work was supported by the National Health and Medical Research Council Project Grant 1123418 (to
U.G. and P.R.M.), a Fellowship of the Sydney Medical School Foundation (U.G.), a Research Training ProgramScholarship of the Australian Government (R.A.M.), and an Ophthalmology and Vision Science PhD Scholarshipby Save Sight Institute (R.A.M.). We thank the Lions NSW Eye Bank at Sydney Eye Hospital for making humandonor eyes available. We also thank Arzu Demir, Sammy Lee and Siva Purushothuman for assistance withexperiments, and Larry Thibos for helpful comments on the manuscript.The authors declare no competing financial interests.Correspondence should be addressed to Paul R. Martin at [email protected]://doi.org/10.1523/JNEUROSCI.1671-20.2020
Copyright © 2020 the authors
8132 • The Journal of Neuroscience, October 14, 2020 • 40(42):8132–8148
however not universally accepted, because several features of Pcell receptive fields (for example, low contrast sensitivity) areinconsistent with properties of human spatial vision (for review,see Shapley and Perry, 1986; Lee et al., 2010). The broad aim ofthe present study is to measure spatial sampling properties ofbipolar cell arrays serving P and M pathways in human retinaand judge their suitability as substrates for human form andcolor vision. We concentrate here on OFF-bipolar arrays becausewell-characterized antibodies to label OFF-P and OFF-M bipolarcells are available.
The resolution capacity of the P pathway in the fovea is set bythe one-to-one convergence and tight synaptic connectivitybetween cones, midget bipolar, and midget ganglion cells.Studies in macaque and human retina showed over 80% of bipo-lar input to midget ganglion cells derives from midget bipolarcells (Kolb and DeKorver, 1991; Calkins et al., 1994; Tsukamotoand Omi, 2015). In macaques, the one-to-one ratio betweencones and midget bipolar cells extends to at least 8-mm (40°) ec-centricity (Wässle et al., 1994), but it is not known whether thesame pattern of connections is present in human retina. This isan important question because an array of single-cone contactingmidget bipolar cells can deliver both spatial and chromatic selec-tive signals to the inner plexiform layer, and support chromaticselective responses in midget ganglion cells in peripheral retina(Martin et al., 2001; Reid and Shapley, 2002; Kolb and Marshak,2003; Buzás et al., 2006; Wool et al., 2018).
There is evidence that the M pathway is involved in spatialvision at low image contrast, because individual parasol ganglioncells have threshold spatial acuity as high as that of individualmidget ganglion cells (Kaplan and Shapley, 1986; Crook et al.,1988, 2008; Merigan et al., 1991; Croner and Kaplan, 1995).Parasol ganglion cells receive cone input via diffuse bipolar (DB)cells which contact multiple cone photoreceptors (Boycott andWässle, 1991). Studies in macaque and marmoset retinas showedthat the major bipolar input to OFF-parasol cells derives fromDB3a, with lesser input from DB2 and DB3b cells (Jacoby andMarshak, 2000; Jacoby et al., 2000; Tsukamoto and Omi, 2015;Masri et al., 2016), whereas the input to ON-parasol ganglioncells derives mainly from DB4 and DB5 cells (Puthussery et al.,2013; Tsukamoto and Omi, 2016). The spatial density of thesebipolar cell arrays sets an upper bound to spatial resolutioncapacity of the M pathway, but only one population (DB4 cells)has been analyzed quantitatively in macaque retina and no dataare available for human retina (Grünert and Martin, 2020). Here,we measured spatial density of DB3a and DB3b cells in humanretina to establish the distribution of DB cells contributing to theOFF-M pathway.
In the fovea, ganglion cells are displaced from the position ofthe cones that feed the receptive field center (Sjöstrand et al.,1999; Drasdo et al., 2007; Bringmann et al., 2018). Here, wemeasured lateral displacements in the same preparations as usedto determine the densities of cones, bipolar and ganglion cells,enabling accurate calculation of the spatial resolving power ofbipolar cells feeding P and M pathways in the human fovea.
Materials and MethodsTissue collection and preparationPostmortem human eyes from male and female donors with no knownhistory of eye disease were obtained from the Lions NSW Eye Bank(Sydney Eye Hospital) and Australian Ocular Biobank with consent andethical approval from The University of Sydney Human Research EthicsCommittee (HREC #2012/2833). Information about the donor eyes issummarized in Table 1. Four of the retinas used in this study were also
used in our previous study on the rod pathway in human retina (Lee etal., 2019). Retinas from donors under 60 years of age with a postmortemdelay shorter than 10 h from death to fixation were used. Eyes werereceived with the cornea removed, and in most cases, the posterior eyecup was immersed in 2% paraformaldehyde (PFA) in 0.1 M phosphatebuffer (PB). In one case (#15415), eyes were first placed into CO2 inde-pendent medium (Invitrogen) for 1 h and subsequently fixed in 2% PFAin 0.1 M PB. Eyes were rinsed in 0.1 M PB, and the retina was dissectedout of the eye cup. The vitreous was removed and relieving cuts weremade to flatten the retina. Retina quadrants were immersed in 30% su-crose in 0.1 M PB overnight, then frozen in liquid nitrogen, and stored at�80°C until use. Retinal pieces measuring 3–5 mm in width and 4–5mm in length were prepared from defined eccentricities along the nasal-temporal axis (1 mm nasal to 15 mm temporal). The retinal pieces wereembedded in 3% low melting Agarose (Sea Plaque Agarose Lonza) dis-solved in PBS and sectioned vertically at a thickness of 100mm using aVibratome (VT 1200 S, Leica Microsystems). Sections were processedimmediately or kept in 0.1 M PB containing 0.05% NaN3 for up tofourweeks until use.
ImmunohistochemistrySections were preincubated in 5% normal donkey serum (NDS; JacksonImmunoResearch) and 0.5% Triton X-100 (BDH Chemicals) in PBS for1 h or overnight. The antibodies used in this study are summarized inTable 2. Antibodies against recoverin were used to identify OFF-midgetbipolar cells (Milam et al., 1993), antibodies against calbindin were usedto identify DB3a cells (Haverkamp et al., 2003), and antibodies againstCD15 were used to identify DB3b cells (Haverkamp et al., 2003;Puthussery et al., 2013). Cones were labeled with antibodies against conearrestin (Wikler et al., 1997; Zhang et al., 2003), short wavelength-sensi-tive cones (S-cones) with antibodies against S-opsin, and ganglion cellswere labeled with antibodies against RNA-binding protein with multiplesplicing (RBPMS; Rodriguez et al., 2014). Sections were incubated withprimary antibodies diluted in PBS containing 0.5% Triton X-100, 0.05%NaN3, and 3% NDS for 4–7d. Secondary antibodies (made in donkey)coupled to Alexa 594, Alexa 488 or Alexa 647 (Jackson ImmunoResearch)were diluted in PBS containing 0.5% Triton X-100 and 3% NDS. The nu-clear stain 4’,6-diamidino-2-phenylindole dihydrochloride (DAPI; 10mg/ml; D9542, Sigma) was usually added to the secondary antibody diluent.Sections were incubated in secondary antibody for 14–24 h. Adhesivespacers (20-mm diameter, 0.12-mm depth; ThermoFisher Scientific) werefitted onto poly-lysine-coated microscope slides. The tissue was rinsed,mounted within the wells of the adhesive spacers, then coverslipped usingVectashield Mounting Medium (Vector Laboratories Inc.).
MicroscopyImages were obtained using a confocal scanning microscope (ZeissLSM700) equipped with 405-, 408-, 555-, and 635-nm lasers. The entirevibratome section (at least 3 mm in length and up to 100-mm thickness)was imaged in tiled stacks which were subsequently stitched using ZeissZEN Black software. Stacks of images were obtained using 20� air objec-tive (Plan Apochromat no. 420650-9901) at a resolution of 2048� 2048or 1024� 1024 pixels and a step size of 0.87–1mm for each optical sec-tion. At the fovea, we used a 40� water immersion objective (Plan
Table 1. Details of donor retinas
ID Eye Sex Age (years)Time toenucleation (h)
Time tofixation (h)
Time infixative*(h)
13587 Right F 44 2 4 1213699 Right M 56 2 9 2114064 Right F 44 1 3 1314458 Left F 31 3 5 2515415** Left F 54 3 5 1715649 Left F 36 0.5 8 40
*All retinas were fixed in 2% PFA in 0.1 M PB while attached to the ora serrata and the retinal pigment epi-thelium. **The eye was placed into CO2 independent medium for 1 h before fixation. The cornea wasremoved but the anterior chamber for this eye was otherwise intact. Times above 1 h are shown to thenearest hour.
Masri et al. · Parvocellular and Magnocellular Pathways in Human Retina J. Neurosci., October 14, 2020 • 40(42):8132–8148 • 8133
Apochromat no. 421767-9970) to obtain stacks of images to distin-guish individual cones. Depth readings taken using the air objectivewere corrected to account for the refractive index of the Vectashieldmounting medium (1.45). The contrast and brightness of the imageswere adjusted using Zen Blue (Zeiss), Adobe Photoshop, or Imaris(Bitplane) software.
Experimental design and statistical analysisIndividual OFF-midget bipolar and DB cells (DB3a and DB3b) werereconstructed from stacks of confocal images using the surface tool inImaris. The diameter of the bipolar axon terminals was measured fromreconstructed terminals at three different eccentricities.
The density of cells was determined from tiled stacks of images usingZeiss ZEN Blue software as described previously by Lee et al. (2019).Cells were counted from volumetric reconstructions of Vibratome sec-tions. The length of the section was divided into bins of 100mm width,and cells were counted within each bin across a minimum depth of10mm in the z-plane. Areal densities (cells/mm2) were calculated foreach bin using the formula D ¼ w� d, where D is cell density, w is thebin width, and d is depth in the z-plane. Counts were made frombetween 9 and 21 sections for each antibody; a minimum of 20 cells wascounted for each 100-mm bin by adjusting the z-plane sample depth. Asin our previous study (Lee et al., 2019), these values were chosen to givethe best practical compromise between sample statistical power at eachpoint (i.e., ;5% sample noise at each point) and accurate estimates ofcell density gradients (i.e., 10 density samples/linear mm). For one prep-aration (case #1357R; recoverin staining) density values were cross-checked against counts obtained from whole mount pieces flanking thevibratome section yielding consistent results.
Cells were counted when the morphology, stratification, and pat-tern of expression was consistent with previous descriptions: OFF-midget bipolar cells (Boycott and Wässle, 1991; Milam et al., 1993;Wässle et al., 1994; Kolb and Marshak, 2003); DB cells (Boycott andWässle, 1991; Grünert et al., 1994; Jacoby et al., 2000; Tsukamotoand Omi, 2015). Ganglion cells were always counted in conjunctionwith the DAPI nuclear stain to identify the nucleus and therebyavoid counting the same cell in more than one optical plane.Vertical sections taken across the entire length and depth of thefovea were used to locate the foveal center where the foveal pit wasdeepest and the cone density was highest.
Eccentricity was calculated by taking into account the triangulateddistance from the fovea. Average densities for each cell population weredetermined from samples at various eccentricities along the temporalhorizontal meridian. No correction for shrinkage was applied because(1) the retina remained attached to the ora serrata and retinal pigmentepithelium during fixation, (2) PFA fixation produces minimal shrinkage(Curcio and Allen, 1990; Abbott et al., 2009), and (3) the tissuewas mounted using a water based mounting medium (Vectashield).Postreceptoral cell density as a function of eccentricity was fit inMATLAB V9.2 (MathWorks) with three-stage difference-of-exponentialsfunctions, across eccentricities from 0 to 15 mm along the temporal hori-zontal axis. Because a limited number of foveal sections was available, oursample resolution at the foveal center is lower than that achieved in previ-ous studies of cones and ganglion cells in human retina (Curcio andAllen, 1990; Curcio et al., 1990). Optimal fit parameters are given in Table3 for the equation:D ¼ c1 exp l1Xð Þ1 c2 exp l2Xð Þ1 c3 exp l3Xð Þ, whereD is cell density (cells/mm2), l1; l2andl3 are exponential coefficients,c1; c2 and c3 are multiplicative coefficients, and X is eccentricity (mm).
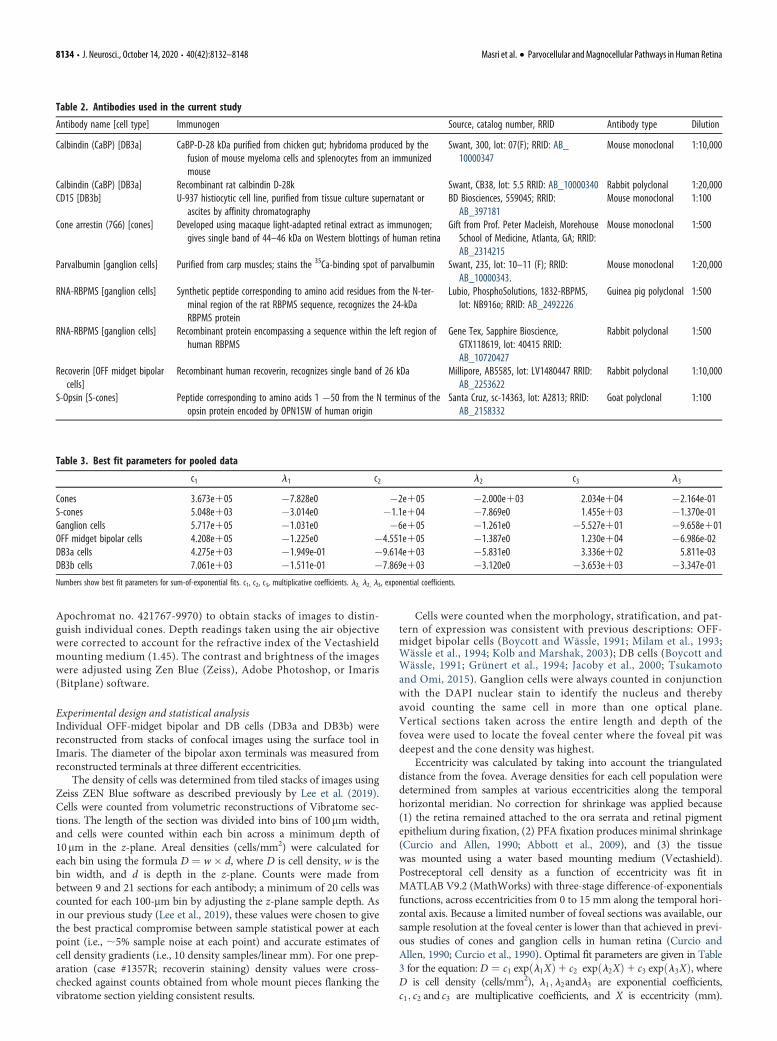
Table 2. Antibodies used in the current study
Antibody name [cell type] Immunogen Source, catalog number, RRID Antibody type Dilution
Calbindin (CaBP) [DB3a] CaBP-D-28 kDa purified from chicken gut; hybridoma produced by thefusion of mouse myeloma cells and splenocytes from an immunizedmouse
Swant, 300, lot: 07(F); RRID: AB_10000347
Mouse monoclonal 1:10,000
Calbindin (CaBP) [DB3a] Recombinant rat calbindin D-28k Swant, CB38, lot: 5.5 RRID: AB_10000340 Rabbit polyclonal 1:20,000CD15 [DB3b] U-937 histiocytic cell line, purified from tissue culture supernatant or
ascites by affinity chromatographyBD Biosciences, 559045; RRID:AB_397181
Mouse monoclonal 1:100
Cone arrestin (7G6) [cones] Developed using macaque light-adapted retinal extract as immunogen;gives single band of 44–46 kDa on Western blottings of human retina
Gift from Prof. Peter Macleish, MorehouseSchool of Medicine, Atlanta, GA; RRID:AB_2314215
Mouse monoclonal 1:500
Parvalbumin [ganglion cells] Purified from carp muscles; stains the 35Ca-binding spot of parvalbumin Swant, 235, lot: 10–11 (F); RRID:AB_10000343.
Mouse monoclonal 1:20,000
RNA-RBPMS [ganglion cells] Synthetic peptide corresponding to amino acid residues from the N-ter-minal region of the rat RBPMS sequence, recognizes the 24-kDaRBPMS protein
Lubio, PhosphoSolutions, 1832-RBPMS,lot: NB916o; RRID: AB_2492226
Guinea pig polyclonal 1:500
RNA-RBPMS [ganglion cells] Recombinant protein encompassing a sequence within the left region ofhuman RBPMS
Gene Tex, Sapphire Bioscience,GTX118619, lot: 40415 RRID:AB_10720427
Rabbit polyclonal 1:500
Recoverin [OFF midget bipolarcells]
Recombinant human recoverin, recognizes single band of 26 kDa Millipore, AB5585, lot: LV1480447 RRID:AB_2253622
Rabbit polyclonal 1:10,000
S-Opsin [S-cones] Peptide corresponding to amino acids 1 �50 from the N terminus of theopsin protein encoded by OPN1SW of human origin
Santa Cruz, sc-14363, lot: A2813; RRID:AB_2158332
Goat polyclonal 1:100
Table 3. Best fit parameters for pooled data
c1 l1 c2 l2 c3 l3
Cones 3.673e105 �7.828e0 �2e105 �2.000e103 2.034e104 �2.164e-01S-cones 5.048e103 �3.014e0 �1.1e104 �7.869e0 1.455e103 �1.370e-01Ganglion cells 5.717e105 �1.031e0 �6e105 �1.261e0 �5.527e101 �9.658e101OFF midget bipolar cells 4.208e105 �1.225e0 �4.551e105 �1.387e0 1.230e104 �6.986e-02DB3a cells 4.275e103 �1.949e-01 �9.614e103 �5.831e0 3.336e102 5.811e-03DB3b cells 7.061e103 �1.511e-01 �7.869e103 �3.120e0 �3.653e103 �3.347e-01
Numbers show best fit parameters for sum-of-exponential fits. c1, c2, c3, multiplicative coefficients. l2, l2, l3, exponential coefficients.
8134 • J. Neurosci., October 14, 2020 • 40(42):8132–8148 Masri et al. · Parvocellular and Magnocellular Pathways in Human Retina

Negative fit values in the fovea were set to zero. Cumulative density acrossthe horizontal meridian was calculated by circular integration of spatial den-sities within annuli of defined eccentricity ranges, radiating from the fovealcenter in a “bullseye” pattern. The following formula was applied to calcu-late the number of cells within each annulus:
Densitycellsmm2
� �� Annulus Area mm2ð Þ
Annulus Area ¼ p � ro2ð Þ � p � ri
2ð Þ;
where ro represents the radius of the outer border and ri represents theradius of the inner border of the eccentricity range in question.
For comparison to human photopic acuity measurements, the maxi-mum resolvable spatial frequency (Nyquist limit) of an hexagonalmosaic with spatial density D was calculated for each measured cell pop-
ulation using the formula N ¼ m= affiffiffi3
p� �, where N is the Nyquist limit
(cycles per degree), m is the retinal magnification factor, and a is the
intercell distance. Intercell distance was calculated as a ¼ffiffiffiffiffiffiffiffiffiffiffiffiffiffiffiffiffiffiffiffiffiffiffi1=
ffiffiffi3
p
2D
� �s,
where D is the population spatial density (cells/mm2). For simplicity, weignored the nonlinear relation of retinal magnification to eccentricity(Drasdo and Fowler, 1974); we used a constant magnification factor of0.29 mm/°. This simplification introduces maximum ;10% overesti-mate of retinal magnification at 30°; exact magnification values can berecovered by reference to Drasdo and Fowler (1974; their Figure 5).
Receptoral and postreceptoral displacementReceptoral displacement (Henle fiber length) in temporal retina was deter-mined using stacks of confocal images to trace the axons of individual conephotoreceptors to their synaptic terminal (cone pedicle). The horizontal dis-tance between the cone pedicle and the soma was measured. Postreceptoraldisplacement was measured as the horizontal distance from the midline ofthe dendritic tree (presumed location of the cone pedicle) of the bipolar cellto the midline of the bipolar axon terminal.
TerminologyBased on previous studies (Hendrickson, 2005; Provis et al., 2013;Strettoi et al., 2018; Lee et al., 2019), we employ the following definitions:
foveal retina refers to a radius of 0.8 mm (5.5° diameter of visual angle),central retina refers to eccentricities up to 3.0 mm (first 10° radius of vis-ual angle) where the ganglion cell layer is more than one cell thick,roughly equivalent to the diameter of the macula lutea (Boycott et al.,1987; Bringmann et al., 2018), mid-peripheral retina refers to eccentric-ities between 3.0 and 6 mm and eccentricities beyond 6 mm are referredto as far peripheral retina.
ResultsData were obtained from one male and five female human donorretinas aged from 30 to 60 years (Table 1). Retinas were freefrom any obvious pathology, and the yellow pigment of the mac-ula lutea was readily distinguishable (which facilitated identifica-tion of the fovea before sectioning). We did not specificallyaddress the question of age-related differences in the distributionof retinal neurons but observed that variation between retinaswas not obviously dependent on donor age. Figure 1 shows con-focal images of vertical sections through the fovea of a 54-year-old (#15415; Fig. 1A) and a 44-year-old (#14604; Fig. 1B–H)female donor. The center of the fovea, where cone photoreceptordensity is highest and the inner retinal layers are displaced, isindicated by the arrow in Figure 1A. The figure also shows thatthe thickness of the nuclear layers, and thus the cell densitychanges significantly with eccentricity.
Multiple immunohistochemical markers were applied to suchsections to compare different populations of neurons in the samepreparation. Each section was imaged across its entire length andZ-stack depth at high resolution. Regions where there was distor-tion of retinal layers or poor immunohistochemical stainingwere excluded from the cell counts.
Cone photoreceptorsAs reported previously, cone arrestin is expressed in the entirecone including the outer and inner segments, the axon (Henlefiber) and the pedicles of all cone types (Wikler et al., 1997;Zhang et al., 2003). This pattern of expression is consistent acrossall eccentricities (Fig. 2A–E). Figure 2A–E also shows that the
Figure 1. Retinal layers across the horizontal meridian. Confocal images of vertical sections through human retina cut through the fovea along the horizontal axis. A, Micrograph of a verticalsection cut through the fovea of retina #15415. Nomarski optics is used to reveal retinal layers, the arrow points to the foveal pit. Tick marks are 500mm apart. B, Micrograph of a vertical sec-tion cut through the fovea of retina #14064 showing DAPI nuclear stain. C–H, Regions of interest from retina #14064 showing DAPI labeled nuclei at different eccentricities. The ganglion celllayer is six cells deep at 1-mm eccentricity and about one cell deep by 5-mm eccentricity. ONL: outer nuclear layer, INL: inner nuclear layer, GCL: ganglion cell layer. Scale bars: 200mm (B) and50mm (C, applies to C–H).
Masri et al. · Parvocellular and Magnocellular Pathways in Human Retina J. Neurosci., October 14, 2020 • 40(42):8132–8148 • 8135

diameter of the cone inner and outer segments increases with ec-centricity whereas the cone density decreases.
Cone density was estimated in fourteen vibratome sectionsfrom four preparations stained for cone arrestin by countingthe cone inner segments (Fig. 2E, arrow). In two sectionsfrom mid-peripheral and far peripheral retina (preparations#13587 and #15415), cone density was estimated from cal-bindin labeling. Calbindin is expressed by medium and longwavelength but not S-cone photoreceptors in human retina(Chiquet et al., 2002). Thus, these latter counts do notinclude S-cones.
Peak cone density at the foveal center was derived from twopreparations which demonstrated comparable density (150,667cells/mm2 and 141,935 cells/mm2; Fig. 2G,H). These values arelower than the average peak density of 199,000 cells/mm2
reported by Curcio and colleagues, who measured density fromwhole mount preparations (Curcio et al., 1990), but our valueslie within the range of individual variability in their study. Thedensity of cones in the foveal center changes dramatically suchthat an error of 100mm could reduce the peak cone density byhalf (Packer et al., 1989), meaning that we may have underesti-mated peak foveal densities. Overall, the pattern of cone
Figure 2. Cone photoreceptors: immunohistochemical labeling and spatial density. A–E, Confocal images of vertical vibratome sections through the fovea stained with antibodies againstcone arrestin to reveal cone photoreceptors in preparation #14064. Eccentricities are indicated in the upper right corners of the images. The diameter of the cone inner segments increases witheccentricity as cones become less tightly packed. The arrow in E points to the inner segment of a cone. F, Confocal image of a vertical section through the fovea of preparation #15415L show-ing S-opsin expression. S-cones are near-absent at the fovea. The Henle fibers of the S-cones can be observed. The inset in F shows a different focal plane of the same vibratome section. Theregion is 115mm wide and includes the S-cone-free zone at the foveal center. Total cone density (G) and S-cone density (I) are plotted against eccentricity from up to six preparations. Eachpreparation is allocated a unique symbol and each point on the graph represents the density (y-axis) of the target cell type within a counting window at a particular eccentricity (x-axis).Pooled data from the six preparations is fit to a curve shown in H for all cones and in J for S-cones. Error bars (in many cases smaller than the marker symbols) show SDs. ONL: outer nuclearlayer, HFL: Henle fiber layer, INL: inner nuclear layer, IPL: inner plexiform layer, GCL: ganglion cell layer. Scale bars: 50mm (E, applies to A–E) and 100mm (F).
8136 • J. Neurosci., October 14, 2020 • 40(42):8132–8148 Masri et al. · Parvocellular and Magnocellular Pathways in Human Retina

distribution across the retina is consistent with previous reports(Østerberg, 1935; Curcio et al., 1990; Sjöstrand et al., 1999): conedensity declines steeply outside the fovea, falling to an average of15,000 cells/mm2 by 1-mm eccentricity. The cone density contin-ues to decline gradually in mid-peripheral retina and drops to;3500 cells/mm2 beyond 12-mm eccentricity (Fig. 2G,H).
The S-cones were identified with an antibody against S-opsin(Fig. 2F). As expected, S-cones are sparse in the fovea and absentat the foveola (Curcio et al., 1991). The S-cones were counted atthe level of their inner segments (#13587, #13699, #14064) ortheir somas (#15415 and #15649). The S-cone density was esti-mated in six preparations from 20 sections, two of whichincluded the foveal center (Fig. 2I). Consistent with previousreports (Curcio et al., 1991), average S-cone density peaks at0.36-mm eccentricity temporal with a density of 2400 cells/mm2
(range 2100–2880 cells/mm2; Fig. 2J). The location of the peakvaried slightly between preparations, ranging from 0.23- to 0.32-mm eccentricity. The S-cone free zone was measured across thetemporal axis in one preparation (#15415): it had a diameter of70mm, with the first S-cones appearing as close as 30-mm eccentric-ity in temporal retina (Fig. 2F, inset). The proportion of S-coneswas determined from the pooled data shown in Figure 2H,J. The S-cones made up 6% of the cone population at their average peakdensity, and this proportion gradually increased to;8–10% beyond1-mm eccentricity. These findings are consistent with previousreports in human (Curcio et al., 1991) and non-human primates(Marc and Sperling, 1977; Wikler and Rakic, 1990; Martin andGrünert, 1999). Taken together, our results show that the density ofcone photoreceptors can be quantified using immunolabeled verti-cal sections through the retina, but some accuracy may be sacrificedin estimates of peak cone density.
Off-midget bipolar cellsConsistent with previous findings in human retina (Milam et al.,1993; Haverkamp et al., 2003) recoverin is expressed by rod andcone photoreceptors and also by large numbers of bipolar cellswith cell bodies in the center of the inner nuclear layer (Figs. 3A–D, 4B). Recoverin immunoreactivity is present in the primarydendrite, the soma, and the axon terminal of the bipolar cells.The broadly stratifying axonal terminals are located in the outerhalf of the inner plexiform layer. This morphology is consistentwith descriptions of OFF-midget bipolar cells (Kolb et al., 1992;Milam et al., 1993; Wässle et al., 1994). We note that Milam et al.(1993) suggest that recoverin is expressed by another bipolar celltype which is present at very low densities. We could not isolatean additional recoverin positive bipolar cell, but if this popula-tion is present its inclusion would result in only a slight overesti-mation of OFF-midget bipolar cell density.
In total 17 vibratome sections from four retinal preparationsprocessed with antibodies against recoverin were analyzed; foursections included the fovea. In one preparation (#15649), somerecoverin-labeled somas were also encountered near the borderwith the inner plexiform layer (data not shown). These cells didnot show the typical bipolar morphology and thus were pre-sumed to be amacrine cells and excluded from the counts. Inpreparation #15415 recoverin immunoreactivity was present inphotoreceptors but near absent in bipolar cells, although theexpression of other immunohistochemical markers was normalin this preparation (e.g. Fig. 2F). This preparation was notincluded in the density counts for midget bipolar cells.
Figure 3E,F shows the spatial density of recoverin labeledOFF-midget bipolar cells in four preparations. The greatest vari-ation in density between preparations is between 0.5- and 1.5-
Figure 3. OFF-midget bipolar cells: immunohistochemical labeling and spatial density. A–D, Confocal micrographs of a vertical section from preparation #14064 stained with antibodiesagainst recoverin to label OFF-midget bipolar cells. Recoverin immunoreactivity is shown in conjunction with Nomarski optics to reveal retinal layers. Expression of recoverin can be observed inthe photoreceptors as well as OFF-midget bipolar cells. E, Spatial density of OFF-midget bipolar cells is plotted against eccentricity for four preparations. F, Pooled data from the four prepara-tions in E, fit to a curve to illustrate population density of OFF-midget bipolar cells across the retina. Error bars (in many cases smaller than the marker symbols) show SDs. ONL: outer nuclearlayer, HFL: Henle fiber layer, OPL: outer plexiform layer, INL: inner nuclear layer, IPL: inner plexiform layer, GCL: ganglion cell layer. Scale bar: 50mm (D, applies to A–D).
Masri et al. · Parvocellular and Magnocellular Pathways in Human Retina J. Neurosci., October 14, 2020 • 40(42):8132–8148 • 8137

mm eccentricity (Fig. 3E). The density of OFF-midget bipolar cellspeaks near 1 mm at an average of 22,000 cells/mm2 (range 19,700–31,800 cells/mm2; Fig. 3F). The pooled fit shows the density ofOFF-midget bipolar cells decreases rapidly between 1 and 4 mm,and then gradually declines to 6300 cells/mm2 by 9-mm eccentric-ity. There was no obvious variation in the distribution of OFFmidget bipolar cells between temporal and nasal retina within 1mm from the fovea. Peripheral nasal retina was not studied.
In one preparation (case #13587R) we compared the arealdensity calculated for recoverin-labeled cells with density meas-ured from two flat mount pieces flanking the vibratome sectionsin peripheral retina (Fig. 4F, open circles). The whole mount countsyielded only marginally lower density estimates (mean 6 SD, 41846 545, n=8) than did the vibratome section counts (51436 938;n=14; p=0.02, Wilcoxon non-parametric rank-sum test for inde-pendent samples), indicating there is no large systematic bias in esti-mates of areal density from vertical sections.
We analyzed vibratome sections double labeled for conearrestin (Fig. 4A) and recoverin (Fig. 4B) and found abundantexamples of OFF-midget bipolar dendrites contacting single
cone pedicles in central (Fig. 4C), mid-peripheral (Fig. 4D), andfar peripheral (Fig. 4E) retina. We did not see clear examples ofbranched midget bipolar dendrites at eccentricities below 8 mm,but we did observe occasional examples of midget bipolar cellscontacting multiple cones at eccentricities between 8 and 10 mm(Fig. 5C).
We used double-labeled sections to directly compare the spa-tial density of cone photoreceptors and OFF-midget bipolar cellswithin the same preparation (#13587 and #14064). In both prep-arations the ratio of cones to OFF-midget bipolar cells is close to1:1 up to at least 10-mm eccentricity (Figs. 4F,G). Taken to-gether, the matched spatial densities and abundance of single-cone contacting OFF-midget bipolar cells implies predominantlyone-to-one connectivity between these two populations at leastto 10-mm (;35°) eccentricity. Kolb et al. (1992) obtained con-sistent results from Golgi impregnated human retina and alsoshowed examples of single-cone contacting invaginating (ON)midget bipolar cells up to 8-mm eccentricity their Fig. 26C, sug-gesting that low cone convergence may also be a feature of theON-midget system in human retina.
Figure 4. Convergence of cones to midget bipolar cells. A, B, Confocal images of a vertical vibratome section through temporal retina 300mm superior to the fovea of preparation #14064stained with antibodies against cone arrestin (A) and recoverin (B). C–E, Confocal images from sections double labeled for cone arrestin and recoverin to illustrate connectivity between conephotoreceptors and OFF-midget bipolar cells at various eccentricities. Insets in each image show that single-headed flat midget bipolar cells can be identified up to at least 10-mm eccentricity.Eccentricity is indicated in the lower left corner. F, G, Cell density is plotted against eccentricity for cone photoreceptors and flat midget bipolar cells in preparation #13587 (F) and #14064 (G).Open circle symbols in panel F show values obtained from whole mounts, as described in the text. The curves represent the average density of cone photoreceptors across all preparations. Inboth preparations, the ratio of cones to OFF-midget bipolar cells is 1:1 in peripheral retina. Scale bars: 200mm (B, applies to A, B) and 50mm (E, applies to C–E).
8138 • J. Neurosci., October 14, 2020 • 40(42):8132–8148 Masri et al. · Parvocellular and Magnocellular Pathways in Human Retina

We measured the diameter of the axonal terminals for recon-structed midget bipolar cells at 1-, 4-, and 10-mm eccentricity(Fig. 5A–C). The average axon terminal diameter was 10mm(61.8mm, n=10) at 1-mm eccentricity, 16.7mm (62.2mm,n= 10) at 4-mm eccentricity, and 20.1mm (63.1mm, n= 10) at10-mm eccentricity. We used measurements of dendritic fielddiameters of midget ganglion cells from published data (Daceyand Petersen, 1992) and divided the average dendritic field areaby the axon terminal area of midget bipolar cells. This resultindicates that each midget bipolar cell provides input to onemidget ganglion cell at 1 mm, increasing to over 10 midget
bipolar cells converging onto each midget ganglion cell at 10mm. Kolb and Marshak (2003) reported compatible values forcentral and mid-peripheral retina but lower convergence (;4:1)frommidget bipolar to midget ganglion cells in peripheral retina.
DB3a and DB3b cellsDB cell types involved with OFF-parasol cells were identifiedwith antibodies against calbindin (DB3a) and antibodies againstCD15 (DB3b). Figure 6A shows a vertical section labeled withantibodies against calbindin. Immunoreactivity is present incone photoreceptors, and in the inner nuclear layer, it is localized
Figure 5. Reconstructions of OFF-midget bipolar cells. A–C, Confocal images and three-dimensional reconstructions of OFF-midget bipolar cells from recoverin-labeled vertical sections takenat three different eccentricities (indicated in the lower right corner). INL: inner nuclear layer, IPL: inner plexiform layer, GCL: ganglion cell layer. Scale bar: 20mm (A, applies to all).
Figure 6. Immunohistochemical labeling of DB3a and DB3b cells. A, Confocal image of a vibratome section from preparation #13587 (central retina) stained with antibodies against calbin-din, imaged with Nomarski optics to reveal retinal layers. Calbindin expression can be observed in cone photoreceptors, horizontal cells, amacrine cells, and in DB3a bipolar cells (arrowheads).B, Confocal image of a vibratome section from preparation #13699 (central retina) labeled with antibodies against CD15 and imaged with Nomarski optics. Expression of CD15 is restricted toDB3b bipolar cells. C–E, Region of interest from a section double labeled with antibodies against calbindin (green, DB3a cells) and antibodies against CD15 (magenta, DB3b cells). DB3a andDB3b cells form separate populations. The axon terminals of DB3a cells are indicated by arrows and are located slightly more sclerad than the axon terminals of DB3b cells. ONL: outer nuclearlayer, HFL: Henle fiber layer, OPL: outer plexiform layer, INL: inner nuclear layer, IPL: inner plexiform layer, GCL: ganglion cell layer. Scale bars: 100mm (B, applies to A, B) and 25mm (E,applies to C–E).
Masri et al. · Parvocellular and Magnocellular Pathways in Human Retina J. Neurosci., October 14, 2020 • 40(42):8132–8148 • 8139

to horizontal, bipolar, and amacrinecells. The axon terminals of calbindin-labeled DB3a cells form a distinct bandin the OFF sublamina close to the mid-dle of the inner plexiform layer. Twoother bands can be distinguished in theinner plexiform layer: one is located inthe ON sublamina close to its center andthe other is located at the border withthe ganglion cell layer. These bands arerespectively formed by the processes ofON starburst amacrine, and the den-drites of inner stratifying melanopsin-expressing ganglion cells (Chandra etal., 2019).
Antibodies against CD15 (Fig. 6B)revealed a single bipolar cell type, theDB3b cell, which stratifies at nearly thesame level as the DB3a cell in stratum 2of the inner plexiform layer (Haverkampet al., 2003; Puthussery et al., 2013).Antibodies against CD15 in human alsorevealed weak expression in the ganglioncell layer and diffuse expression across theinner plexiform layer (Fig. 6B). In double-labeled sections, it becomes obvious thatDB3a and DB3b cells form distinct non-overlapping populations (Fig. 6C–E). Thisfinding is consistent with recent RNA sequencing of the macaqueretina which showed that DB3a and DB3b cells have distinct molec-ular signatures (Peng et al., 2019).
We quantified the spatial density of DB3a and DB3b cellsfrom 19 sections in six preparations. As shown in Figure 7, thetwo bipolar types follow a very similar distribution. The firstDB3a cells appear 100mm from the foveal center and the firstDB3b cells are present at 180mm temporal to the fovea. Both celltypes have similar peak density at around 1-mm eccentricity.The average peak density of DB3a cells is 3900 cells/mm2 (range
4000–7000 cells/mm2). The average peak density of DB3b cells isclose to 3500 cells/mm2 (range 3000–7000 cells/mm2). The den-sity for both DB3a and DB3b cells decreases in peripheral retinato fall below 1500 cells/mm2 by 10-mm eccentricity. Taken to-gether, our results suggest that the density of DB3a and DB3bcells is well-matched across the retina.
Figure 8 shows reconstructions of calbindin-labeled DB3acells (Fig. 8A) and CD15-labeled DB3b cells (Fig. 8B,C). Theaxon terminal diameter of DB3a and DB3b cells was measuredfrom reconstructed cells in two preparations (#14064 and#15415). For DB3a cells, the average axon terminal diameter was
Figure 7. Spatial density of DB3a and DB3b bipolar cells. A, Density of DB3a cells quantified using antibodies against calbindin in six preparations. B, Data from A fit to a sum of exponentscurve to illustrate the spatial density of DB3a cells across temporal retina. C, The density of DB3b cells plotted against eccentricity for five preparations. DB3b cells were identified with antibod-ies against CD15. D, Pooled data across these five preparations fit to a sum of exponents curve to show the population density of DB3a cells up to 15 mm temporal to the fovea. DB3a andDB3b cells have comparable densities across the retina. Error bars in B, D (in many cases smaller than the marker symbols) show SDs.
Figure 8. Reconstructions of DB3a and DB3b bipolar cells. Confocal images and three-dimensional reconstructions of DB cellsfrom immunolabeled vertical sections. A, DB3a bipolar cells (magenta) reconstructed from a section labeled with antibodiesagainst calbindin (green) in mid-peripheral (5 mm) retina. B, C, DB3b cells (green and magenta) reconstructed from a sectionlabeled with antibodies against CD15 (red) in far peripheral (8–10 mm) retina. DAPI nuclear stain is shown in blue. INL: innernuclear layer, IPL: inner plexiform layer, GCL: ganglion cell layer. Scale bar: 20mm (A, applies to A–C).
8140 • J. Neurosci., October 14, 2020 • 40(42):8132–8148 Masri et al. · Parvocellular and Magnocellular Pathways in Human Retina
25mm (60.7mm, n=2), 26.2mm (62.4mm, n= 5), and 26mm(64.0mm, n=5) at 1, 4, and 9 mm, respectively. For DB3b cells,the axon terminal diameter was 20.7mm (60.6mm, n= 2),29.2mm (62.8mm, n=5), and 35mm (64.0mm, n=5) at 1, 4,and 9 mm, respectively. The DB3a terminals were difficult to iso-late, and the expression of CD15 was poor in some sections,hence our measurements of DB3a and DB3b axon terminal di-ameter should be regarded as approximations.
In comparison to OFF-midget bipolar cells (Figs. 3, 5), DB3aand DB3b cells have a larger axon terminal diameter and a lowerdensity across the retina. The OFF midget bipolar cells outnum-ber DB3a and DB3b cells (combined) by a ratio of 3:1 across theretina. In central retina the axon terminal diameter of OFF-midget bipolar cells is less than half that of DB cells. Our resultsimply high convergence between cones and DB cells and reflectthe lower density of parasol ganglion cells compared with midgetganglion cells across the retina (Rodieck et al., 1985; Dacey andPetersen, 1992).
Ganglion cellsWe identified ganglion cells by their immunoreactivity to anti-bodies against RBPMS (Kwong et al., 2010; Rodriguez et al.,2014). As shown in Figure 9A–F, RBPMS was localized to mostsomas in the ganglion cell layer, whereas presumed displacedamacrine cells were not labeled (Fig. 9B–F, arrows). Consistentwith previous reports (Polyak, 1941; Curcio and Allen, 1990;Grünert et al., 1993), some ganglion cells as well as other celltypes were observed within the foveal pit (Fig. 9A).
In two preparations (#13699 and #14064), antibodies againstthe calcium binding protein parvalbumin, which label a largeproportion of cells in the ganglion cell layer in human retina (deSouza et al., 2016; Kántor et al., 2016) were applied. In order todetermine whether ganglion cells are parvalbumin positive, twovertical sections from two preparations (#15415 and #15649)were double labeled with antibodies against parvalbumin andantibodies against RBPMS (Fig. 9G–J). Double-labeled cells werecounted between 0- and 6-mm eccentricity. On average, 92% ofRBPMS-labeled ganglion cells were also labeled for parvalbumin.This proportion varied between 80% and 100% for individualregions and was not dependent on eccentricity, indicating that asmall population of ganglion cells is parvalbumin negative.
Ganglion cell density was determined from five preparationsin central retina and two preparations in mid-peripheral and farperipheral retina, using 10 vibratome sections labeled forRBPMS (#13587, #15415, #15649) and three sections labeled forparvalbumin (#13699, #14064). The results are comparable in allpreparations, but the peak ganglion cell density varies betweenindividuals (range 28,000–50,000 cells/mm2; Fig. 9K). The aver-age peak density of 34,000 cells/mm2 at 1-mm eccentricity falls ata steep rate within the central 3 mm temporal to the fovea, andthen more gradually to 300 cells/mm2 at 12-mm eccentricity(Fig. 9L). Similar results were obtained by Curcio and Allen(1990), who reported a 2-fold variation in ganglion cell densitybetween individuals and added that such individual differencesimply a large variation in the total number of ganglion cells serv-ing central vision.
As noted above, we did not observe any clear age-relatedchanges in cell density. For example, preparations from olderdonors (#15415 and #13699) showed comparable ganglion celldensities to retinas from younger donors (#15469; Fig. 9K).Recent data are inconclusive regarding age-related changes inganglion cell density, with some reports indicating changes aremost pronounced past 60 years of age (Yoshioka et al., 2017),
and others suggesting decrease in ganglion cell density occursgradually from late 30 s onwards (Tong et al., 2019). Our samplesize is too small to contribute to this debate. In summary, theganglion cell density across the human retina determined herefrom vertical sections is in good agreement with previous studiesusing whole mount preparations (Curcio and Allen, 1990) andindicates that our bipolar cell measurements fit into a picturewhich is congruent with estimates of other cell types in humanretina.
As outlined above, cone photoreceptors and OFF-midgetbipolar cells exist in equal proportions up to 10-mm eccentricity(Fig. 4), indicating that convergence in the midget pathwayoccurs in the inner retina where multiple midget bipolar cellscontact a single midget ganglion cell. Here, we compared the den-sity of cones, OFF-midget bipolar cells and ganglion cells for twoindividual preparations (Fig. 10A,B) as well as the pooled densitiesacross all preparations (Fig. 10C) from 1- to 10-mm eccentricity.Decline in ganglion cell density from central to peripheral retina ismuch steeper than that of cones or midget bipolar cells. Across allpreparations, ganglion cell density exceeds that of cones between1- and 2-mm eccentricity. The density of ganglion cells falls belowthat of cone photoreceptors at 2.3 mm (7.9°) in preparation#13587, 3.3 mm (11.4°) in preparation #14064, and at 2.6 mm(8.9°) when data are pooled from all preparations. These data areconsistent with findings in macaque retina which show that thesampling density of ganglion cells decreases beyond 15° (3–4 mm;Wässle et al., 1990). Convergence in foveal retina needs to take thereceptoral displacement into account and is discussed separatelybelow.
In addition to parvalbumin positive/RBPMS positive ganglioncells, we found cells in the ganglion cell layer which were parval-bumin positive but RBPMS negative (data not shown). Thesecells were usually located close to the border with the inner nu-clear layer and had relatively small somas. Thus, these cells arepresumed to be displaced amacrine cells. The density of parval-bumin positive displaced amacrine cells was quantified for onepreparation (#15415) between 0.3- and 6-mm eccentricity. Thepeak density was 1400 cells/mm2 between 1- and 2-mm eccen-tricity and fell to 300 cells/mm2 by 6-mm eccentricity.
Receptoral and postreceptoral displacementAs outlined above (Fig. 2), in the center of the fovea, cone photo-receptors are densely packed, and the remaining layers of the ret-ina are displaced away from the center. We determined thislateral displacement (see Materials and Methods) in the samepreparations as used to determine bipolar and ganglion cell den-sities described above. We first measured the receptoral displace-ment (Henle fiber length), then we measured the postreceptoraldisplacement between the dendritic contacts of bipolar cells withcones and their axonal terminals (contacts with retinal ganglioncells). We ignored the additional displacement due to the offsetof the ganglion cell dendritic tree from the soma (Perry andCowey, 1988) since this accounts for ,1% of total lateral dis-placement (Sjöstrand et al., 1999).
Figure 11A–C shows that the longest Henle fibers (300–400mm) are found at cone soma eccentricities between 0.5 and 1mm temporal. Outside the fovea, Henle fiber length decreased to,100mm by 2.5 mm with some variation between preparations(Fig. 11C). By ;6-mm eccentricity, cone photoreceptor somasare vertically aligned with their pedicles (Fig. 2E), and thus thereis no receptoral displacement. These results are consistent withprevious reports in human (Polyak, 1941; Sjöstrand et al., 1999)
Masri et al. · Parvocellular and Magnocellular Pathways in Human Retina J. Neurosci., October 14, 2020 • 40(42):8132–8148 • 8141

and macaque retinas (Perry and Cowey, 1988; Schein, 1988;Bringmann et al., 2018).
Postreceptoral (bipolar cell) displacement was measured ateccentricities ranging from 0.24 to 8.6 mm along the temporalaxis from recoverin labeled OFF-midget bipolar (Fig. 3A–D), cal-bindin-labeled DB3a (Fig. 6A,C) or CD15-labeled DB3b (Fig. 6B,D) cells; all these measurements yielded comparable results.Individual variability is less evident in postreceptoral displace-ment compared with receptoral displacement (Fig. 11D). The
largest displacement occurs between 0.3- and 0.8-mm eccentric-ity with average magnitude 55mm and maximum 70mm (Fig.11D). From ;2.5-mm eccentricity, there is no appreciable dis-placement. Similar values were reported by Sjöstrand et al.(1999) in human retina and by Perry and Cowey (1988) in maca-que retina.
The peak total displacement was 389mm (range ;300–400mm) at 0.5 mm from the foveal center. Previous studies ofhuman retina report a total displacement in the range of 370mm
Figure 9. Retinal ganglion cells: immunolabeling and spatial density. A, Confocal micrograph of a vertical section through the fovea of preparation #15415 showing DAPI-labeled cell nuclei(white) and RBPMS-labeled ganglion cell somas (green) within 250-mm radius of the foveal center. In addition to RBPMS-labeled ganglion cell somas, other cell nuclei can be observed on thefoveal floor. B–F, Regions of interest from vertical sections of the same preparation shown in A showing RBPMS-positive ganglion cells together with Nomarski optics. Occasional displaced gan-glion cells can be observed in the inner nuclear layer. Arrows point to cells in the ganglion cell layer which do not express RBPMS. G–J, Confocal images of a region of interest from a verticalsection at 1.2-mm eccentricity labeled with antibodies against parvalbumin (magenta) and antibodies against RBPMS (green). G, Nomarski optics reveals the layers of the retina. H, RBPMS-la-beled ganglion cell somas. I, Parvalbumin-labeled cells in the ganglion cell layer: J, The merged image shows that most ganglion cells are double labeled for RBPMS and parvalbumin but thereis a small population of ganglion cells (arrowheads) that do not express parvalbumin. K, L, Ganglion cell density is shown relative to eccentricity. Data from five preparations is shown in K andaverage density across all preparations, fit to a sum of exponents, is shown in L. Error bars (in many cases smaller than the marker symbols) show SDs. ONL: outer nuclear layer, HFL: Henle fiberlayer, INL: inner nuclear layer, IPL: inner plexiform layer, GCL: ganglion cell layer. Scale bars: 50mm (A), 50mm (B, applies to B–F), and 20mm (G, applies to G–J).
8142 • J. Neurosci., October 14, 2020 • 40(42):8132–8148 Masri et al. · Parvocellular and Magnocellular Pathways in Human Retina

(Sjöstrand et al., 1999) to 526mm (Drasdo et al., 2007). Drasdo etal. (2007) attribute this interstudy variability to meridional differ-ences, but no such differences were reported in macaque retinas(Perry and Cowey, 1988; Schein, 1988). Alternatively, Drasdo etal. (2007) may have overestimated displacement because of over-correction for shrinkage and the exclusion of outliers. Overall,the peak total lateral displacement of 389mm obtained here isconsistent with previous studies.
Density variabilityIt is clear from the foregoing results that there is variation inspatial density (both within and between individuals) foreach measured population at any given eccentricity (Figs.2G–J, 3E, 4F,G, 7, 9K,L). It is therefore natural to questionthe extent to which conclusions based on six retinas can beapplied to a larger population. Our study does not addressthis question directly, but our small sample can neverthelessprovide rough upper and lower bounds to the densities andratios calculated above. Table 4 compares mean density andSD of each cell population in central (1 mm), mid-peripheral
(3 mm), and far peripheral retina (9 mm). In most cases, thecoefficient of variation (mean/SD) lies between 20% and30%, giving a rough estimate of variability expected at popu-lation level. For simplicity, we did not attempt a finer-grained analysis of ratios between all measured cellpopulations.
Parallel pathways in the foveaWe used the density counts of cones, OFF-midget bipolar cells,DB3a, and ganglion cells (Fig. 12A–D, left panel) to determinethe cumulative numbers of each cell type (Fig. 12A–D, rightpanel) within 2-mm eccentricity. We then accounted for recep-toral displacement of bipolar cells and total displacement of gan-glion cells to calculate cumulative cell numbers within themidget-parvocellular and parasol-magnocellular pathways (Fig.12A–D, red dotted lines).
Figure 11. Lateral displacement. A, B, Confocal images of a vertical section through thefovea labeled with antibodies against cone arrestin. Eccentricities are indicated in the lowerleft corner. C, The lateral distance of the cone pedicle from the soma is plotted as receptoraldisplacement on the y-axis. The eccentricity of the soma is plotted on the x-axis against thehorizontal distance to the cone pedicle. D, Postreceptoral displacement is plotted against ec-centricity for three preparations. The displacement was measured from the center of the den-dritic bouquet to the center of the axon terminal of calbindin, CD15, and recoverin labeledbipolar cells, respectively. On the x-axis, the distance of the center of the dendritic bouquetfrom the fovea is plotted as the assumed eccentricity of the cone pedicle. Curves show differ-ence-of-exponentials functions. ONL: outer nuclear layer, HFL: Henle fiber layer, OPL: outerplexiform layer. Scale bar: 50mm (B, applies to A, B).
Figure 10. Density of cone photoreceptors, OFF-midget bipolar cells, and ganglion cells.The average densities of cone photoreceptors (blue), OFF-midget bipolar cells (orange), andganglion cells (pink) are shown on a logarithmic scale from 1- to 10-mm eccentricity forpreparations #13587 (A) and #14064 (B), as well as the average across all preparations(n= 6; C).
Masri et al. · Parvocellular and Magnocellular Pathways in Human Retina J. Neurosci., October 14, 2020 • 40(42):8132–8148 • 8143

Table 4. Spatial density in central and peripheral retina
Density (cells/mm2) CV (SD/mean) Density (cells/mm2) CV (SD/mean) Density (cells/mm2) CV (SD/mean)
Eccentricity (mm) 1 1 3 3 9 9Cones (inner segment) 14,8416 2565 (7) 17.3% 92576 1939 (37) 20.9% 45416 635 (54) 14.0%S-cones (inner segment) 13246 463 (20) 35.0% 9256 314 (63) 33.9% 3556 209 (26) 58.7%Ganglion cells 34,1816 8253 (10) 24.1% 11,8996 3721 (53) 31.3% 10016 307 (24) 30.7%OFF midget bipolar cells 21,4246 3821 (17) 17.8% 13,1326 3359 (62) 25.6% 65636 1152 (15) 17.5%DB3a cells 37226 878 (17) 23.6% 25136 820 (47) 32.6% 11256 322 (36) 28.6%DB3b cells 29496 0.781 (10) 26.5% 31256 667 (34) 21.3% 12826 219 (15) 17.1%
Values show mean cell density (cells/mm2) 6 SD. the number of observations is shown in parentheses. Abbreviation: CV, coefficient of variation (SD/mean).
Figure 12. Cumulative density of cells in OFF-midget and OFF-parasol pathways of the retina. A–D, The panels on the left represent pooled average densities for cones, OFF-midget bipolarcells, DB3a bipolar cells, and ganglion cells from 0- to 2-mm eccentricity. The panels on the right show the cumulative counts for each cell population across the same eccentricity range. Thered dotted lines represent the cumulative numbers for each cell type adjusted for receptoral (B, C) and total lateral displacement (D). E, Ratio of ganglion cells to cones from 0.5- to 2-mm ec-centricity interpolated from data in panels A, D. F, Ratio of ganglion cells to OFF-midget bipolar cells interpolated from data in panels B, D. Circle symbols in E, F show pooled data; diamondand square symbols show individual double-labeled cases.
8144 • J. Neurosci., October 14, 2020 • 40(42):8132–8148 Masri et al. · Parvocellular and Magnocellular Pathways in Human Retina

Midget-parvocellular pathwayThe number of cones is 240,000 by 2-mm eccentricity (Fig. 12A),and the number of OFF-midget bipolar cells is 300,000 by 2 mm,taking Henle fiber displacement into account (Fig. 12B). The ra-tio of cones to OFF-midget bipolar cells is 1:1 at 0.4-mm eccen-tricity, 1.2:1 at 0.5-mm eccentricity, and 0.8:1 between 0.5- and2-mm eccentricity. Therefore, after accounting for receptoral dis-placement due to Henle fibers, the number of OFF-midget bipo-lar cells in central retina allows for a single OFF-midget bipolarcell for every cone.
Parasol-magnocellular pathwayAt 1 mm, the total number of DB3a cells is ;22,200 (Fig. 12C),and the total number of cones is ;88,000, which translates tofour cones converging onto a single DB3a cell at the fovea. Theratio of cones to DB3a cells is fairly consistent across eccentric-ities. A similar pattern of convergence for DB3b cells is expectedfrom the tightly matched densities of the two populations (Fig.7B,D). Previous estimates of convergence of cones to DB3a cellsexist only at eccentricities beyond 3 mm, and are in the range of8–12 cones for each DB3a cell for macaque (Boycott and Wässle,1991; Grünert et al., 1994; Tsukamoto and Omi, 2015) and mar-moset (Luo et al., 1999) retinas. Our results thus show that multi-ple cone photoreceptors converge onto DB cells in foveal as wellas peripheral primate retina.
Ganglion cell sampling densityAt 1-mm eccentricity, the total number of ganglion cells is closeto 180,000 (Fig. 12D). Figure 12E shows the ratio of ganglioncells to cones from 0.5- to 2-mm eccentricity after accounting fortotal lateral displacement. The ratio of ganglion cells to cones at1 mm is 2.2:1. This ratio decreases from 1 mm onwards to a ratioof 1.5:1 by 2 mm, as the sampling density of ganglion cellsdecreases. Over this eccentricity range the OFF-midget bipolarcells is over half the density of ganglion cells (mean 64.2%; Fig.12F), consistent with dominance of the midget-parvocellularpathway at the fovea (Dacey, 1993; Liu et al., 2017). If OFF-midget ganglion cells likewise make up 64% of all ganglion cellsat the fovea, then the ratio of OFF-midget ganglion cells to OFF-midget bipolar cells would fall below unity (implying conver-gence of bipolar to ganglion cells) at eccentricities above 1.05mm (3.6°). These calculations based on the pooled data sampleare supported by analysis of three retinas where the relevant pop-ulations were measured in the same sections, in double-labeledpreparations (case #14064, Fig. 12E,F; case #15415, Fig. 12E; case#13587, Fig. 12F). In each case, the ratio of ganglion cells tocones exceeds 2.2:1 within the central-most 1.5 mm, and midgetbipolar cells are present at high density throughout foveal retina.In summary, at the fovea, a ratio of at least 2.2 ganglion cells forevery cone allows for one-to-one connectivity of cones to midgetganglion cells, as well as the presence of parasol cells and otherwidefield cells at low densities.
Comparison to human photopic acuityFinally, in Figure 13, we compare the resolving power ofbipolar and ganglion cell arrays to achromatic grating resolu-tion measured in photopic human vision (Anderson et al.,1991; Wilkinson et al., 2016). Such comparisons requireassumptions and must be made with caution but can yield usefulinsights on the anatomic substrates of human visual performance.We calculated cell array acuity using the formulas described inMaterials and Methods. Following Dacey (1993), we assumedthat midget ganglion cells make up 95% of all ganglion cells in the
central 10°, 85% at 15°, 70% at 20°, and 46% at 30°, and that para-sol cells make up 10% of all ganglion cells throughout this eccen-tricity range. For simplicity, we did not take into account factorssuch as cell coupling (Vaney, 1994; Shlens et al., 2006) or thesmall proportion (;20%) of synaptic input from DB cells tomidget ganglion cells (Tsukamoto and Omi, 2015).
Figure 13A shows that acuity of the human OFF-midget gan-glion cell array closely follows photopic grating acuity between 5°and 30°. The OFF-midget bipolar array acuity is close to gratingacuity at 5°, but is substantially higher at greater eccentricities,and falls less steeply than grating acuity to leave almost a log unitgap between the curves at 30°. In other words, although humangrating acuity falls to only 6% of foveal acuity (Snellen fraction)by 30° eccentricity, the midget bipolar array acuity is muchhigher (close to 30% Snellen fraction). A similar pattern of resultsis evident for the OFF-parasol pathway (Fig. 13B), with theclear exception that OFF-parasol ganglion cell acuity is wellbelow human grating acuity at all eccentricities. Overall, thisresult agrees with the studies cited above (Wilkinson et al.,2016; Anderson et al., 1991; see also Merigan and Katz,1990), indicating that the midget-parvocellular pathway is amore compelling anatomic basis of human photopic acuitythan is the parasol-magnocellular pathway. We return to thisquestion in Discussion.
DiscussionPrevious studies of human retina have quantified photoreceptors(Curcio et al., 1990) and ganglion cells (Curcio and Allen, 1990),but cone bipolar pathways have remained undescribed. Here, wehave four main findings. First, the OFF-midget-bipolar cells in
Figure 13. Comparison of cell array acuity to psychophysically measured photopic spatialacuity. A, Acuity of OFF-midget ganglion cell and OFF-midget bipolar cell arrays comparedwith two measures of human achromatic grating acuity [Anderson et al., 1991 (diamondsymbols); Wilkinson et al., 2016 (triangle symbols)] across the eccentricity range 5–30°. Notethe close correspondence of OFF-midget ganglion cell array acuity to the psychophysicalmeasures. B, Comparison with OFF-DB cell (combined DB3a and DB3b) and parasol ganglioncell array acuity with the same psychophysical data. Note that parasol cell array acuity fallswell below human acuity at all eccentricities.
Masri et al. · Parvocellular and Magnocellular Pathways in Human Retina J. Neurosci., October 14, 2020 • 40(42):8132–8148 • 8145

human retina preserve the spatial and chromatic signals from thecone array, transmitting them to the inner plexiform layer fromthe fovea to at least 30° eccentricity (Figs. 4, 5, 10, 12) . Second,OFF-parasol contacting bipolar cells (DB3a, DB3b) are also pres-ent throughout the central 30°, at combined density close toone-third that of the midget bipolar array (Figs. 6, 7, 12). Third,ganglion cell and bipolar cell density in the human fovea is con-sistent with divergence of foveal cone signals to parallel midgetand parasol pathways (Fig. 12). Finally, midget bipolar and gan-glion cell density in peripheral retina can support the spatial re-solution of human photopic vision (Fig. 13). In the following, wediscuss these findings in context of other studies of human andnon-human primate retina.
The off-midget-parvocellular pathwayThe peak density of OFF-midget bipolar cells is 22,000 cells/mm2, which is very close to peak density estimated at 22,300cells/mm2 in macaque retina (Wässle et al., 1994). We found thatcone photoreceptors and OFF-midget bipolar cells are present ina one-to-one ratio to at least 10-mm eccentricity, also as previ-ously shown for macaque retina (Wässle et al., 1994). By con-trast, in marmoset monkeys, one-to-one connectivity of cones tomidget bipolar cells is restricted to the fovea (Chan et al., 2001;Telkes et al., 2008; Weltzien et al., 2015).
One-to-one connections of cones to bipolar cells implies pres-ervation of the chromatic specificity of the long/medium (L/M)wavelength cone arrays in inner peripheral retina. Some (but notall) electrophysiological studies in macaque retina (Martin et al.,2001; Solomon et al., 2005; Field et al., 2010; Wool et al., 2018)and psychophysical studies in human (Abramov et al., 1991;Mullen and Beaudot, 2002; Mullen et al., 2005) show that chro-matic sensitivity is slightly above that predicted by random “hitor miss” connections with L/M cones.
An obvious question arising is whether the same patterns ofdistribution and connectivity that we see in the OFF-midgetpathway are present in the ON-midget pathway. Ahmad and col-leagues (2003) report twice as many OFF-DB cells than ON-DBcells in the fovea, but comparable numbers of OFF-midget andON-midget bipolar cells. In macaque and human, receptive anddendritic fields of ON-parasol cells are larger than that of OFF-parasol cells (Dacey and Petersen, 1992; Chichilnisky andKalmar, 2002), implying lower densities of ON-parasol thanOFF-parasol cells, but whether this difference is reflected in bipo-lar cell densities needs to be determined.
Off-parasol-magnocellular pathwayThe peak density of DB3a cells in human retina ranges between4000 and 7000 cells/mm2. Similar values were obtained in maca-que (Martin and Grünert, 1992) and marmoset retinas (Weltzienet al., 2015). The peak density of DB3b cells ranged from 3000 to7000 cells/mm2 and thus DB3b cells exist in equal proportions toDB3a cells across human retina (Fig. 7). Comparable densitiesacross species likely reflect consistencies in organization of theparasol-magnocellular pathway across primates (Ghosh et al.,1996; Jacoby et al., 2000; Masri et al., 2016).
We found the numerical convergence of cones to DB cellswas close to 4:1, and that the combined density of DB3a andDB3b cells was close to one third that of midget bipolar cellsacross the retina. These observations are consistent with thefunctional properties of high sensitivity to contrast and weakchromatic selectivity which characterizes the parasol-magnocel-lular pathway. The OFF parasol pathway relies in part on a largereceptive field (Schiller et al., 1990; Petrusca et al., 2007; Crook et
al., 2008) and specializations of DB cell ion channels (Puthusseryet al., 2013) to respond to high temporal frequency stimuli, andto detect motion and flicker in visual space.
Foveal sampling densityWe measured receptoral displacement at the fovea by directlytracing the Henle fibers in sections through the center of the fovea.A degree of error in this method can arise from tissue distortionsand the potential for misidentifying the foveal center (Packer et al.,1989; Curcio et al., 1990). Nonetheless, our results are consistentwith previous estimates from Sjöstrand et al. (1999) and recentwork by Bringmann et al. (2018) in human retina.
We estimate a ratio of 2.2 ganglion cells per cone in the foveaafter accounting for total lateral displacement. Previous estimatesin human fovea exist in the range of 1:1 (Missotten, 1974), 2:1(Curcio and Allen, 1990; Drasdo et al., 2007), and 3–4:1(Sjöstrand et al., 1999). Midget ganglion cells make up at least80% of the ganglion cells in human fovea (Rodieck et al., 1985;Dacey, 1993; Yan et al., 2020), and existing evidence supports thepresence of one ON-midget and one OFF-midget ganglion cellfor every foveal cone (Kolb and DeKorver, 1991). It is assumed thatthe remaining 10–20% of ganglion cells in the human fovea consistsof parasol cells, small bistratified and widefield ganglion cells, asshown for non-human primates (Dacey, 1993; Grünert et al., 1994;Percival et al., 2013; Sinha et al., 2017; Peng et al., 2019). It followsthat estimates lower than 2:1 ganglion cells per cone do not allowfor the presence of foveal non-midget ganglion cells.
Finally, we note that our estimates of peak cone density at thefovea for two retinas (respectively, 150,667 and 141,935 cells/mm2)correspond to Nyquist frequencies 60.5 and 58.7 cycles/° (cpd),which is close to foveal achromatic acuity values (;45 cpd)reported by Anderson et al. (1991) andWilkinson et al. (2016).
Functional roles of P and M pathwaysOur anatomic results have some relevance to a debate over therole of midget-parvocellular (P) and parasol-magnocellular (M)pathways in spatial vision, which was ignited over 30 years ago(Shapley and Perry, 1986). The literature on this topic is exten-sive, and the details have been reviewed elsewhere (Lee et al.,2010). The nub of it lies in discrepancies between anatomy andfunction of midget ganglion (P) cells. As shown here and else-where, the midget-parvocellular pathway in the retina clearly hasa much finer spatial grain than does the parasol-magnocellular(M) pathway (Kolb and DeKorver, 1991; Calkins et al., 1994;Boycott and Wässle, 1999). But (1) achromatic contrast sensitiv-ity of individual P cells is much lower than human achromaticcontrast sensitivity (for review, see Shapley and Perry, 1986), (2)P and M cells have comparable spatial acuity at low contrast(Hicks et al., 1983; Blakemore and Vital-Durand, 1986), and (3)M cells are a more viable substrate for the (high spatial resolu-tion) luminance channel than are P cells (for review, see Lennieet al., 1993; Lee et al., 2010). Our anatomic results cannot resolvethese specific functional questions (or, indeed, the broader ques-tion whether the brain uses only one ganglion cell type to achievehigh-acuity vision: Schiller et al., 1990; Merigan and Maunsell,1993), but they bring two new points to bear on the debate. First,our data (Fig. 13) have confirmed psychophysical predictionsthat parasol cell array acuity is too low to support photopic acuityat any retinal eccentricity (Anderson et al., 1991; Wilkinson etal., 2016). Second, high density of midget bipolar cells in periph-eral retina has been suggested as a sign of specialization of themidget pathway for peripheral red/green color vision (Martinand Grünert, 1992; Wässle et al., 1994; Lee et al., 2010). But here
8146 • J. Neurosci., October 14, 2020 • 40(42):8132–8148 Masri et al. · Parvocellular and Magnocellular Pathways in Human Retina

we find that the DB3a and DB3b cells which feed parasol cellsare present at high density in peripheral retina. This resultimplies that high density of bipolar cells in peripheral retina is ageneral feature of retinal wiring rather than something specific tothe midget-parvocellular pathway.
Comparison of human and macaque retinaIt could be argued that much of what we have found here hasbeen predicted by previous studies of macaque monkey retina.But it is important to remember that human and macaques havehad at least 25 million years independent evolution in widely dif-fering environments. Clear precedents of rapid evolutionarychanges in retinal populations are evident, for example, on com-parison of wild and domestic cat retina (Williams et al., 1993)and wolf and domestic dog retina (Peichl, 1992). In humans, ithas been estimated that alleles leading to red-green color visiondeficiencies in European populations have increased in preva-lence from ,2% to over 8% in the past 120 generations (Post,1982). Here, we have found that, overall, the similarities betweenhuman and macaque retina greatly outweigh the differences,supporting the value of macaque monkey as a non-human pri-mate model for normal and abnormal visual function.
ReferencesAbbott CJ, McBrien NA, Grünert U, Pianta MJ (2009) Relationship of the
optical coherence tomography signal to underlying retinal histology inthe tree shrew (Tupaia belangeri). Invest Ophthalmol Vis Sci 50:414–423.
Abramov I, Gordon J, Chan H (1991) Color appearance in the peripheral ret-ina: effects of stimulus size. J Opt Soc Am A 8:404–414.
Ahmad KM, Klug K, Herr S, Sterling P, Schein S (2003) Cell density ratios ina foveal patch in macaque retina. Visual Neurosci 20:189–209.
Anderson SJ, Mullen KT, Hess RF (1991) Human peripheral spatial resolu-tion for achromatic and chromatic stimuli: limits imposed by optical andretinal factors. J Physiol 442:47–64.
Blakemore C, Vital-Durand F (1986) Organization and post-natal develop-ment of the monkey’s lateral geniculate nucleus. J Physiol 380:453–491.
Boycott BB, Wässle H (1991) Morphological classification of bipolar cells ofthe primate retina. Eur J Neurosci 3:1069–1088.
Boycott BB, Wässle H (1999) Parallel processing in the mammalian retina.The Proctor Lecture. Invest Ophthalmol Vis Sci 40:1313–1327.
Boycott BB, Hopkins JM, Sperling HG (1987) Cone connections of the hori-zontal cells of the rhesus monkey’s retina. Proc R Soc Lond B Biol Sci229:345–379.
Bringmann A, Syrbe S, Görner K, Kacza J, Francke M, Wiedemann P,Reichenbach A (2018) The primate fovea: structure, function and devel-opment. Prog Retin Eye Res 66:49–84.
Buzás P, Blessing EM, Szmajda BA, Martin PR (2006) Specificity of M and Lcone inputs to receptive fields in the parvocellular pathway: random wir-ing with functional bias. J Neurosci 26:11148–11161.
Calkins DJ, Schein SJ, Tsukamoto Y, Sterling P (1994) M and L cones in mac-aque fovea connect to midget ganglion cells by different numbers of exci-tatory synapses. Nature 371:70–72.
Chan TL, Martin PR, Clunas N, Grünert U (2001) Bipolar cell diversity inthe primate retina: morphologic and immunocytochemical analysis of aNew World monkey, the marmoset Callithrix jacchus. J Comp Neurol437:219–239.
Chandra AJ, Lee SCS, Grünert U (2019) Melanopsin and calbindin immuno-reactivity in the inner retina of humans and marmosets. Visual Neurosci36:E009.
Chichilnisky EJ, Kalmar RS (2002) Functional asymmetries in ON and OFFganglion cells of primate retina. J Neurosci 22:2737–2747.
Chiquet C, Dkhissi-Benyahya O, Chounlamountri N, Szel A, Degrip WJ,Cooper HM (2002) Characterization of calbindin-positive cones in pri-mates. Neuroscience 115:1323–1333.
Croner LJ, Kaplan E (1995) Receptive fields of P and M ganglion cells acrossthe primate retina. Vision Res 35:7–24.
Crook JM, Lange-Malecki B, Lee BB, Valberg A (1988) Visual resolution ofmacaque retinal ganglion cells. J Physiol 396:205–224.
Crook JD, Peterson BB, Packer OS, Robinson FR, Troy JB, Dacey DM (2008)Y-cell receptive field and collicular projection of parasol ganglion cells inmacaque monkey retina. J Neurosci 28:11277–11291.
Curcio CA, Allen KA (1990) Topography of ganglion cells in human retina. JComp Neurol 300:5–25.
Curcio CA, Sloan KR, Kalina RE, Hendrickson AE (1990) Human photore-ceptor topography. J Comp Neurol 292:497–523.
Curcio CA, Allen KA, Sloan KR, Lerea CL, Hurley JB, Klock IB, Milam AH(1991) Distribution and morphology of human cone photoreceptorsstained with anti-blue opsin. J Comp Neurol 312:610–624.
Dacey DM (1993) The mosaic of midget ganglion cells in the human retina. JNeurosci 13:5334–5355.
Dacey DM, Petersen MR (1992) Dendritic field size and morphology ofmidget and parasol ganglion cells of the human retina. Proc Natl AcadSci USA 89:9666–9670.
de Souza CF, Nivison-Smith L, Christie DL, Polkinghorne P, McGhee C,Kalloniatis M, Acosta ML (2016) Macromolecular markers in normalhuman retina and applications to human retinal disease. Exp Eye Res150:135–148.
Drasdo N, Fowler CW (1974) Non-linear projection of the retinal image in awide-angle schematic eye. Br J Ophthalmol 58:709–714.
Drasdo N, Millican CL, Katholi CR, Curcio CA (2007) The length of Henlefibers in the human retina and a model of ganglion receptive field densityin the visual field. Vision Res 47:2901–2911.
Field GD, Gauthier JL, Sher A, Greschner M, Machado TA, Jepson LH,Shlens J, Gunning DE, Mathieson K, Dabrowski W, Paninski L, LitkeAM, Chichilnisky EJ (2010) Functional connectivity in the retina at theresolution of photoreceptors. Nature 467:673–677.
Ghosh KK, Goodchild AK, Sefton AE, Martin PR (1996) Morphology of reti-nal ganglion cells in a New World monkey, the marmoset Callithrix jac-chus. J Comp Neurol 366:76–92.
Grünert U, Martin PR (2020) Cell types and cell circuits in human and nonhuman primate retina. Prog Retin Eye Res. Advance online publication.Retrieved Feb 5, 2020. doi: 10.1016/j.preteyeres.2020.100844.
Grünert U, Greferath U, Boycott BB, Wässle H (1993) Parasol (Pa) ganglioncells of the primate fovea: immunocytochemical staining with antibodiesagainst GABAA receptors. Vision Res 33:1–14.
Grünert U, Martin PR, Wässle H (1994) Immunocytochemical analysis ofbipolar cells in the macaque monkey retina. J Comp Neurol 348:607–627.
Haverkamp S, Haeseleer F, Hendrickson A (2003) A comparison of immuno-cytochemical markers to identify bipolar cell types in human and monkeyretina. Vis Neurosci 20:589–600.
Hendrickson A (2005) Organization of the adult primate fovea. In: Maculardegeneration (PenfoldPL, Provis JM, eds). Berlin, Heidelberg: Springer.
Hicks TP, Lee BB, Vidyasagar TR (1983) The responses of cells in macaquelateral geniculate nucleus to sinusoidal gratings. J Physiol 337:183–200.
Jacoby RA, Marshak DW (2000) Synaptic connections of DB3 diffuse bipolarcell axons in macaque retina. J Comp Neurol 416:19–29.
Jacoby RA, Wiechmann AF, Amara SG, Leighton BH, Marshak DW (2000)Diffuse bipolar cells provide input to OFF parasol ganglion cells in themacaque retina. J Comp Neurol 416:6–18.
Kántor O, Mezey S, Adeghate J, Naumann A, Nitschke R, Énzsöly A, SzabóA, Lukáts A, Németh J, Somogyvári Z, Völgyi B (2016) Calcium bufferproteins are specific markers of human retinal neurons. Cell Tissue Res365:29–50.
Kaplan E, Shapley RM (1986) The primate retina contains two types of gan-glion cells, with high and low contrast sensitivity. Proc Natl Acad SciUSA 83:2755–2757.
Kolb H, DeKorver L (1991) Midget ganglion cells of the parafovea of thehuman retina: a study by electron microscopy and serial section recon-structions. J Comp Neurol 303:617–636.
Kolb H, Marshak DW (2003) The midget pathways of the primate retina.Doc Ophthalmol 106:67–81.
Kolb H, Linberg KA, Fisher SK (1992) Neurons of the human retina: a Golgistudy. J Comp Neurol 318:146–187.
Kwong JM, Caprioli J, Piri N (2010) RNA binding protein with multiplesplicing: a new marker for retinal ganglion cells. Invest Ophthalmol VisSci 51:1052–1058.
Lee BB, Martin PR, Grünert U (2010) Retinal connectivity and primatevision. Prog Retin Eye Res 29:622–639.
Lee SCS, Martin PR, Grünert U (2019) Topography of neurons in the rodpathway of human retina. Invest Ophthalmol Vis Sci 60:2848–2859.
Masri et al. · Parvocellular and Magnocellular Pathways in Human Retina J. Neurosci., October 14, 2020 • 40(42):8132–8148 • 8147

Lennie P, Pokorny J, Smith VC (1993) Luminance. J Opt Soc Am A 10:1283–1293.
Liu Z, Kurokawa K, Zhang F, Lee JJ, Miller DT (2017) Imaging and quantify-ing ganglion cells and other transparent neurons in the living human ret-ina. Proc Natl Acad Sci USA 114:12803–12808.
Luo X, Ghosh KK, Martin PR, Grünert U (1999) Analysis of two types ofcone bipolar cells in the retina of a New World monkey, the marmoset,Callithrix jacchus. Visual Neurosci 16:709–719.
Marc RE, Sperling HG (1977) Chromatic organization of primate cones.Science 196:454–456.
Martin PR, Grünert U (1992) Spatial density and immunoreactivity of bipo-lar cells in the macaque monkey retina. J Comp Neurol 323:269–287.
Martin PR, Grünert U (1999) Analysis of the short wavelength sensitive(“blue”) cone mosaic in the primate retina: a comparison of New Worldand OldWorld monkeys. J Comp Neurol 406:1–14.
Martin PR, Lee BB, White AJR, Solomon SG, Rüttiger L (2001) Chromaticsensitivity of ganglion cells in the peripheral retina. Nature 410:933–936.
Masri RA, Percival KA, Koizumi A, Martin PR, Grünert U (2016)Connectivity between the OFF bipolar type DB3a and six types of gan-glion cell in the marmoset retina. J Comp Neurol 524:1839–1858.
Merigan WH, Katz LM (1990) Spatial resolution across the macaque retina.Vision Res 30:985–991.
Merigan WH, Maunsell JH (1993) How parallel are the primate visual path-ways? Annu Rev Neurosci 16:369–402.
Merigan WH, Byrne CE, Maunsell JH (1991) Does primate motion percep-tion depend on the magnocellular pathway. J Neurosci 11:3422–3429.
Milam AH, Dacey DM, Dizhoor AM (1993) Recoverin immunoreactivity inmammalian cone bipolar cells. Vis Neurosci 10:1–12.
Missotten L (1974) Estimation of the ratio of cones to neurons in the fovea ofthe human retina. Invest Ophthalmol Vis Sci 13:1045–1049.
Mullen KT, Beaudot WH (2002) Comparison of color and luminance visionon a global shape discrimination task. Vision Res 42:565–575.
Mullen KT, Sakurai M, Chu W (2005) Does L/M cone opponency disappearin human periphery? Perception 34:951–959.
Nassi JJ, Callaway EM (2009) Parallel processing strategies of the primate vis-ual system. Nat Rev Neurosci 10:360–372.
Østerberg GA (1935) Topography of the layer of rods and cones in thehuman retina. Acta Ophthalmol (Copenh) 6:1–102.
Packer O, Hendrickson AE, Curcio CA (1989) Photoreceptor topography of theadult pigtail macaque (Macaca nemestrina). J CompNeurol 288:165–183.
Peichl L (1992) Topography of ganglion cells in the dog and wolf retina. JComp Neurol 324:603–620.
Peng YR, Shekhar K, Yan W, Herrmann D, Sappington A, Bryman GS, vanZyl T, Do MTH, Regev A, Sanes JR (2019) Molecular classification andcomparative taxonomics of foveal and peripheral cells in primate retina.Cell 176:1222–1237.
Percival KA, Martin PR, Grünert U (2013) Organisation of koniocellular-projecting ganglion cells and diffuse bipolar cells in the primate fovea.Eur J Neurosci 37:1072–1086.
Perry VH, Cowey A (1988) The lengths of the fibres of Henle in the retina ofmacaque monkeys: implications for vision. Neuroscience 25:225–236.
Petrusca D, Grivich MI, Sher A, Field GD, Gauthier JL, Greschner M, ShlensJ, Chichilnisky EJ, Litke AM (2007) Identification and characterization ofa Y-like primate retinal ganglion cell type. J Neurosci 27:11019–11027.
Polyak SL (1941) The Retina. Chicago: The University of Chicago Press.Post RH (1982) Population differences in red and green color vision deficiency:
a review, and a query on selection relaxation. Soc Biol 29:299–315.Provis JM, Dubis AM, Maddess T, Carroll J (2013) Adaptation of the central
retina for high acuity vision: cones, the fovea and the avascular zone.Prog Retin Eye Res 35:63–81.
Puthussery T, Venkataramani S, Gayet-Primo J, Smith RG, Taylor WR(2013) NaV1.1 channels in axon initial segments of bipolar cells augmentinput to magnocellular visual pathways in the primate retina. J Neurosci33:16045–16059.
Reid RC, Shapley RM (2002) Space and time maps of cone photoreceptor sig-nals in macaque lateral geniculate nucleus. J Neurosci 22:6158–6175.
Rodieck RW, Binmoeller KF, Dineen J (1985) Parasol and midget ganglioncells of the human retina. J Comp Neurol 233:115–132.
Rodriguez AR, Pérez de Sevilla Müller L, Brecha NC (2014) The RNA bind-ing protein RBPMS is a selective marker of ganglion cells in the mamma-lian retina. J Comp Neurol 522:1411–1443.
Schein SJ (1988) Anatomy of macaque fovea and spatial densities of neuronsin foveal representation. J Comp Neurol 269:479–505.
Schiller PH, Logothetis NK, Charles ER (1990) Functions of the colour-oppo-nent and broad-band channels of the visual system. Nature 343:68–70.
Shapley R, Perry VH (1986) Cat and monkey retinal ganglion cells and theirvisual functional roles. Trends Neurosci 9:229–235.
Shlens J, Field GD, Gauthier JL, Grivich MI, Petrusca D, Sher A, Litke AM,Chichilnisky EJ (2006) The structure of multi-neuron firing patterns inprimate retina. J Neurosci 26:8254–8266.
Sinha R, Hoon M, Baudin J, Okawa H, Wong RO, Rieke F (2017) Cellularand circuit mechanisms shaping the perceptual properties of the primatefovea. Cell 168:413–426.e12.
Sjöstrand J, Olsson V, Popovic Z, Conradi N (1999) Quantitative estimationsof foveal and extra-foveal retinal circuitry in humans. Vision Res39:2987–2998.
Solomon SG, Lee BB, White AJ, Rüttiger L, Martin PR (2005) Chromatic or-ganization of ganglion cell receptive fields in the peripheral retina. JNeurosci 25:4527–4539.
Strettoi E, Masri RA, Grünert U (2018) AII amacrine cells in the primatefovea contribute to photopic vision. Sci Rep 8:16429.
Telkes I, Lee SC, Jusuf PR, Grünert U (2008) The midget-parvocellular path-way of marmoset retina: a quantitative light microscopic study. J CompNeurol 510:539–549.
Tong J, Phu J, Khuu SK, Yoshioka N, Choi AY, Nivison-Smith L, Marc RE,Jones BW, Pfeiffer RL, Kalloniatis M, Zangerl B (2019) Development of aspatial model of age-related change in the macular ganglion cell layer to pre-dict function from structural changes. Am J Ophthalmol 208:166–177.
Tsukamoto Y, Omi N (2015) OFF bipolar cells in macaque retina: type-spe-cific connectivity in the outer and inner synaptic layers. Front Neuroanat9:122.
Tsukamoto Y, Omi N (2016) ON bipolar cells in macaque retina: type-spe-cific synaptic connectivity with special reference to OFF counterparts.Front Neuroanat 10:104.
Vaney DI (1994) Patterns of neuronal coupling in the retina. Prog Ret EyeRes 13:301–355.
Wässle H (2004) Parallel processing in the mammalian retina. Nat RevNeurosci 5:747–757.
Wässle H, Grünert U, Röhrenbeck J, Boycott BB (1990) Retinal ganglion celldensity and cortical magnification factor in the primate. Vision Res30:1897–1911.
Wässle H, Grünert U, Martin PR, Boycott BB (1994) Immunocytochemicalcharacterization and spatial distribution of midget bipolar cells in themacaque monkey retina. Vision Res 34:561–579.
Weltzien F, Percival KA, Martin PR, Grünert U (2015) Analysis of bipolarand amacrine populations in marmoset retina. J Comp Neurol 523:313–334.
Wikler KC, Rakic P (1990) Distribution of photoreceptor subtypes in the ret-ina of diurnal and nocturnal primates. J Neurosci 10:3390–3401.
Wikler KC, Rakic P, Bhattacharyya N, MacLeish PR (1997) Early emergenceof photoreceptor mosaicism in the primate retina revealed by a novelcone-specific monoclonal antibody. J Comp Neurol 377:500–508.
Wilkinson MO, Anderson RS, Bradley A, Thibos LN (2016) Neural band-width of veridical perception across the visual field. J Vis 16:1–1.
Williams RW, Cavada C, Reinoso-Suárez F (1993) Rapid evolution of the vis-ual system: a cellular assay of the retina and dorsal lateral geniculate nu-cleus of the Spanish wildcat and the domestic cat. J Neurosci 13:208–228.
Wool LE, Crook JD, Troy JB, Packer OS, Zaidi Q, Dacey DM (2018)Nonselective wiring accounts for red-green opponency in midget gan-glion cells of the primate retina. J Neurosci 38:1520–1540.
Yan W, Peng YR, van Zyl T, Regev A, Shekhar K, Juric D, Sanes JR (2020)Cell atlas of the human fovea and peripheral retina. Sci Rep 10:9802.
Yoshioka N, Zangerl B, Nivison-Smith L, Khuu SK, Jones BW, Pfeiffer RL,Marc RE, Kalloniatis M (2017) Pattern recognition analysis of age-relatedretinal ganglion cell signatures in the human eye. Invest Ophthalmol VisSci 58:3086–3099.
Zhang H, Cuenca N, Ivanova T, Church-Kopish J, Frederick JM, MacLeishPR, Baehr W (2003) Identification and light-dependent translocation of acone-specific antigen, cone arrestin, recognized by monoclonal antibody7G6. Invest Ophthalmol Vis Sci 44:2858–2867.
8148 • J. Neurosci., October 14, 2020 • 40(42):8132–8148 Masri et al. · Parvocellular and Magnocellular Pathways in Human Retina