analysis of oil well drilling costs in different locations
TRANSCRIPT

Social Sciences Research Journal, Volume 4, Issue 2, 11-22 (June 2015), ISSN: 2147-5237 11
T.C. Sağlık Bakanlığı Sağlık Hizmetleri Genel Müdürlüğü Mithatpaşa Cad. No:3 B Blok 06434
Sıhhiye/ANKARA, Tel: 0312 585 14 92-93, GSM: 0505 962 25 62, e-posta: [email protected]
Analysis of Oil Well Drilling Costs in Different Locations with PERT-CPM
Project Planning Techniques
Aslı Yıldız (Republic of Turkey Ministry of Health
General Directorate of Health Services)
Globalization and increasing competition made the completion of projects on time foreseen and with
available resources mandatory. Therefore, to conduct the cost and the time components of projects at
the optimal level, effective project management is needed and project planning techniques are utilized.
For large-scale projects, the most important source of success is certainly a good project plan and
project management. The productivity of the projects will increase with a good project management
and it creates opportunities for companies. The purpose of this study is to make the project plans of the
projects of oil well drilling with similar depths in different locations by using PERT-CPM project-
planning techniques and to reveal how the differences of location affects the time and costs of the
projects. Another purpose is to make the implementation of the project-planning techniques in a
different sector be contributed to the literature. The implementation of the PERT-CPM techniques on
two oil well projects is included in the study via WINQSB program. The time of the activities to be
performed were estimated for the relevant projects and the project plans were prepared. Besides, the
transactions of the total costs estimations were carried out. Budget constraints were determined by the
project engineers of the Company, the acceleration acts to each point of time possible under these
budget constraints were performed, and out of these accelerated project plans, optimal project plans
were obtained for each well. Based on the assumption that no delays occurred in the activities during
the projects, it was projected that as a result of the implementation of the optimal plans, the relevant
projects could be completed before their expected completion times with 13,89% and 7,36% profits,
respectively. Consequently, it is thought that it would be beneficial to the companies to use the new
project plans made in accordance with the optimal acceleration points at the management and control
stage of the projects having high cost and risk elements. The study, which based on the data supplied
from a petroleum company, was carried out in cooperation with the Petroleum Engineers having field
experience.
Keywords: Project Management, drill, different locations, cost, time
Introduction
Projects are the plannings showing how and in what way the sources will be used to
optimally reach the predetermined specific purposes in a given time period (Yamak, 1998, p.
2). In projects, the activities are in relation to each other in a logical sequence. In other terms,
some activities cannot start unless other activities are completed in full (Rençber, 2011).
Project management ensures the completion of large-scale investment projects at
affordable costs, within the required time and with available sources and the realization of the
objectives set out in the project at the required level. A successfully-applied project
management avoids the waste of sources and, thus, prevents the loss of time and cost overruns
(Sarıca, 2006, p. 19).
The history of modern project management's primitive and initial applications dates back
to the Industrial Revolution (Kır, 2007). Due to the rapid advancement of technology and the
fact that available techniques do not respond to the problems, modern project management
techniques slowly began to emerge at the beginning of the 20th
century. In 1917, Henry
GANTT developed the GANTT chart, one of the modern project management techniques,
which provides great conveniences in establishing the routing of the project (Kır, 2007). After

Social Sciences Research Journal, Volume 4, Issue 2, 11-22 (June 2015), ISSN: 2147-5237 12
T.C. Sağlık Bakanlığı Sağlık Hizmetleri Genel Müdürlüğü Mithatpaşa Cad. No:3 B Blok 06434
Sıhhiye/ANKARA, Tel: 0312 585 14 92-93, GSM: 0505 962 25 62, e-posta: [email protected]
the World War II, companies have embarked on a quest of more practical techniques in
response to the greater complexity of the works against the declining labor force. In this
regard, CPM and PERT techniques, the more advanced forms of GANTT chart, have been
developed (Özkan, 2005). Among the project planning techniques, PERT was first used, in
1958, in the development phase of the Polaris Missile designed by the US Navy for
submarines (Öztürk, 1987, p. 189). In Turkey, however, PERT technique is known to be used
in the management of large-scale projects such as Keban Dam and the Bosphorus Bridge
(Rençber, 2011, p. 31). Another project planning technique, the CPM, was developed by
DuPont and UNIVAC at the end of 1950s for the scheduling of the conditions to be created
for the maintenance in chemical plants and is now a project planning technique often used in
the construction industry.
In the literature, there are numerous academic studies on PERT-CPM project planning
techniques. In his study, Sarıca (2006) conducted the analysis for the estimated time of
completion of an olympic ice rink construction project using the technique PERT-CPM;
Karadeniz (2007) established, in his study, the work program for the Marmaray Üsküdar
Turnout Tunnel Project using the CPM technique; in their studies, Rençber (2011) and Gür
(2006) calculated the completion time of a construction project and a natural gas installation
construction project using PERT technique; in his study, Daigh (2012) applied the CPM
technique in the planning and programming of the final assembly process of the helicopters
which constitutes a highly complex work; Coşkun and Ekmekçi (2012) examined, in their
study, the time and cost analysis of a construction project.
It is surely beyond doubt that the investments make a large contribution to the economies
of developing countries. However, the optimal use of available sources is an important point
that should be emphasized while making investments. Supposing that especially the large-
scale projects are not carried out within a well-established plan, the resulting work would be
considered as weak in terms of efficiency, even if the project is successfully completed, as a
result of the inert use of the capital and sources. The damage which may be encountered in
such projects would be a direct increase in costs or a loss of time due to delay (Gibbs, 1984).
Method
Description of the Projects
This study addresses the oil well projects F-200/3 and F-200/4 planned to be opened in
different locations by an petroleum company operating in Turkey.
The well F-200/3 will be opened in a location of 7500 square meters where there are also
several other oil wells.As a result of the seismic studies conducted, it was decided and
planned to open the well by vertical drilling and to complete the drilling at a depth of 1993
meters after a total of 28 activities carried out.
The other project where project management techniques will be applied is the well F-
200/4. The well was planned to be opened in a new location of 6000 square meters. As a
result of the similar seismic surveys conducted, it was decided and planned to open the well
by directional drilling using special drilling equipment due to the location of the oil reservoir
which was inaccessible by vertical drilling and to complete the drilling at a depth of 1997
meters after a total of 32 activities carried out.
As in all projects of oil wells, the main activities to be carried out during the projects
addressed are given in Figure 1.
Social Sciences Research Journal, Volume 4, Issue 2, 11-22 (June 2015), ISSN: 2147-5237 13
T.C. Sağlık Bakanlığı Sağlık Hizmetleri Genel Müdürlüğü Mithatpaşa Cad. No:3 B Blok 06434
Sıhhiye/ANKARA, Tel: 0312 585 14 92-93, GSM: 0505 962 25 62, e-posta: [email protected]
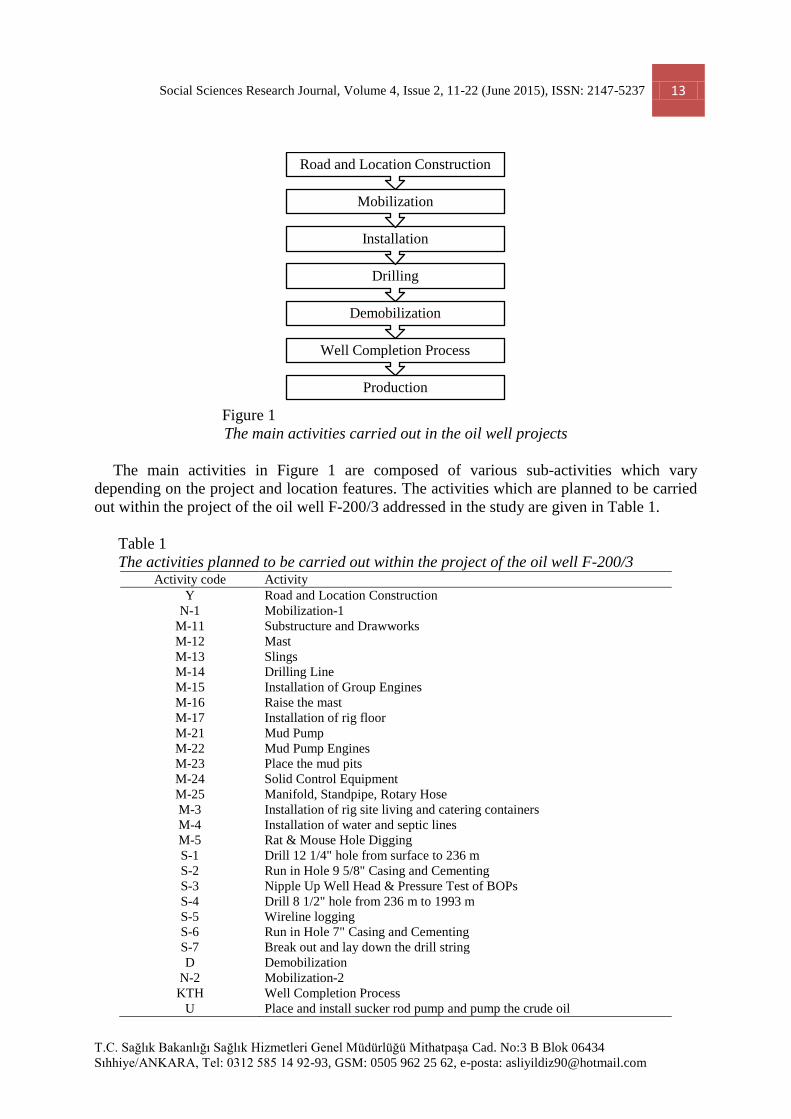
Figure 1
The main activities carried out in the oil well projects
The main activities in Figure 1 are composed of various sub-activities which vary
depending on the project and location features. The activities which are planned to be carried
out within the project of the oil well F-200/3 addressed in the study are given in Table 1.
Table 1
The activities planned to be carried out within the project of the oil well F-200/3 Activity code Activity
Y Road and Location Construction
N-1 Mobilization-1
M-11 Substructure and Drawworks
M-12 Mast
M-13 Slings
M-14 Drilling Line
M-15 Installation of Group Engines
M-16 Raise the mast
M-17 Installation of rig floor
M-21 Mud Pump
M-22 Mud Pump Engines
M-23 Place the mud pits
M-24 Solid Control Equipment
M-25 Manifold, Standpipe, Rotary Hose
M-3 Installation of rig site living and catering containers
M-4 Installation of water and septic lines
M-5 Rat & Mouse Hole Digging
S-1 Drill 12 1/4" hole from surface to 236 m
S-2 Run in Hole 9 5/8" Casing and Cementing
S-3 Nipple Up Well Head & Pressure Test of BOPs
S-4 Drill 8 1/2" hole from 236 m to 1993 m
S-5 Wireline logging
S-6 Run in Hole 7" Casing and Cementing
S-7 Break out and lay down the drill string
D Demobilization
N-2 Mobilization-2
KTH Well Completion Process
U Place and install sucker rod pump and pump the crude oil
Production
Well Completion Process
Demobilization
Drilling
Installation
Mobilization
Road and Location Construction
Social Sciences Research Journal, Volume 4, Issue 2, 11-22 (June 2015), ISSN: 2147-5237 14
T.C. Sağlık Bakanlığı Sağlık Hizmetleri Genel Müdürlüğü Mithatpaşa Cad. No:3 B Blok 06434
Sıhhiye/ANKARA, Tel: 0312 585 14 92-93, GSM: 0505 962 25 62, e-posta: [email protected]
Project Planning Techniques: PERT and CPM
The first systematic approach to the project planning techniques is the GANTT diagram
which was developed during military applications in the World War I. Due to a number of
deficiencies arising in the GANTT chart typically used in small-scale projects, network
models such as PERT and CPM were developed with the impact of the discipline of
Operational Research (Sarıca, 2006, p. 29). The project planning techniques PERT and CPM
to be also addressed in this study are the techniques most commonly used in practice.
The project planning techniques PERT and CPM are composed of three different phases
which interact with and complete each other. These are the planning, programming and
control phases.
Planning constitutes the phase in which the project activities are determined and then the
work flow diagram is drawn estimating the activity times. Drawing a work flow diagram
provides the advantage of examining in detail the different activities. The most important
aspect of this phase is the use in the development of the project (Gaither, 1980, p. 297).
Programming, the second phase, constitutes the phase in which a network model showing
the start and end time of each activity included in the project determining the critical activities
which are vital in completing the project on time and non-critical (delayable) activities
(Timör, 2010, p. 448).
Control phase, however, answers the purpose of drawing up the progress reports of the
project, work flow diagram and network model are used for this purpose. In the control phase,
the project is updated, analyzed and, if necessary, the options for the remaining parts of the
project are determined (Gaither, 1980, p. 297).
The following steps are taken while creating the PERT/CPM network models: first of all,
project and the activities forming the project are identified; the precedence-succession
relations between the activities are determined; the project network diagram is drawn up
taking into consideration the relations between the activities ; time requirements and costs of
the activities are estimated; the earliest and latest start and completion times of all activities
and abundances are identified and the critical path of the project is determined (Timör, 2010,
p. 448).
Assumptions and Limitations
Since the activities vary in terms of time in the relevant oil well projects as a result of the
setbacks that may occur especially during the drilling activities, it was assumed that there was
an uncertainty in the times of all activities and the times of activities were obtained making
triple time estimation.
The total costs of the activities involved in the projects were obtained using the physical
costs in the "well reports" prepared by the experts in the relevant petroleum company prior to
the project.
The oil wells addressed in the study constitute the wells planned and opened in 2013 and
all the project planning and cost analysis conducted were made assuming that the project has
not yet been realized.
While determining the crashed plan for both wells, the Dollar exchange rates on
15.04.2013 and 05.07.2013, the dates on which the plannings were made, were taken as the
basis.
As "Brent" oil prices, the average of the "Brent" oil prices in the past months of the
relevant year including the month in which the addressed project was planned, was taken as
the basis.

Social Sciences Research Journal, Volume 4, Issue 2, 11-22 (June 2015), ISSN: 2147-5237 15
T.C. Sağlık Bakanlığı Sağlık Hizmetleri Genel Müdürlüğü Mithatpaşa Cad. No:3 B Blok 06434
Sıhhiye/ANKARA, Tel: 0312 585 14 92-93, GSM: 0505 962 25 62, e-posta: [email protected]
This study discusses the analysis results of only the F-200/3 project and verbally addresses
the analyses of the F-200/4 project.
Application
The completion times of activities in the projects of oil well drilling usually show
uncertainties. Since such times differ in each project according to the location and project
properties, the average completion time of the activities involved in the projects addressed in
this study were calculated using the PERT technique.
In PERT, the activity times are obtained using the triple time estimations including the
optimistic time, the most likely time and the pessimistic time.
Table 2 shows the triple time estimations made by Petroleum Engineers for the activities
involved in the oil well project F-200/3, based upon their past field experiences.
Table 2
Triple time estimations for the activities in the oil well F-200/3
Activity
name
Immediate predecessor Optimistic
time
Most likely
time
Pessimistic
time
Y - 15 21 24
N-1 Y 2 3 4
M-11 N-1 1 1 2
M-12 M-11 1 1 2
M-13 M-12 1 1 2
M-14 M-12 1 1 2
M-15 M-11 1 1 2
M-16 M-13, M-14, M-15 1 1 2
M-17 M-16 1 1 2
M-21 N-1 1 1 2
M-22 M-21 1 1 2
M-23 N-1 1 1 2
M-24 M-23 1 1 2
M-25 M-22, M-24 1 1 2
M-3 N-1 1,5 2 3
M-4 N-1 2,5 3 5
M-5 M-17, M-25, M-3, M-4 0,5 1 2
S-1 M-5 2 3 5
S-2 S-1 0,5 1 2
S-3 S-2 0,5 1 2
S-4 S-3 16 23 28
S-5 S-4 0,5 1 2
S-6 S-5 0,5 1 2
S-7 S-6 1 1 3
D S-7 3 5 6
N-2 D 2 3 4
KTH N-2 8 10 15
U KTH 4 5 8
Social Sciences Research Journal, Volume 4, Issue 2, 11-22 (June 2015), ISSN: 2147-5237 16
T.C. Sağlık Bakanlığı Sağlık Hizmetleri Genel Müdürlüğü Mithatpaşa Cad. No:3 B Blok 06434
Sıhhiye/ANKARA, Tel: 0312 585 14 92-93, GSM: 0505 962 25 62, e-posta: [email protected]
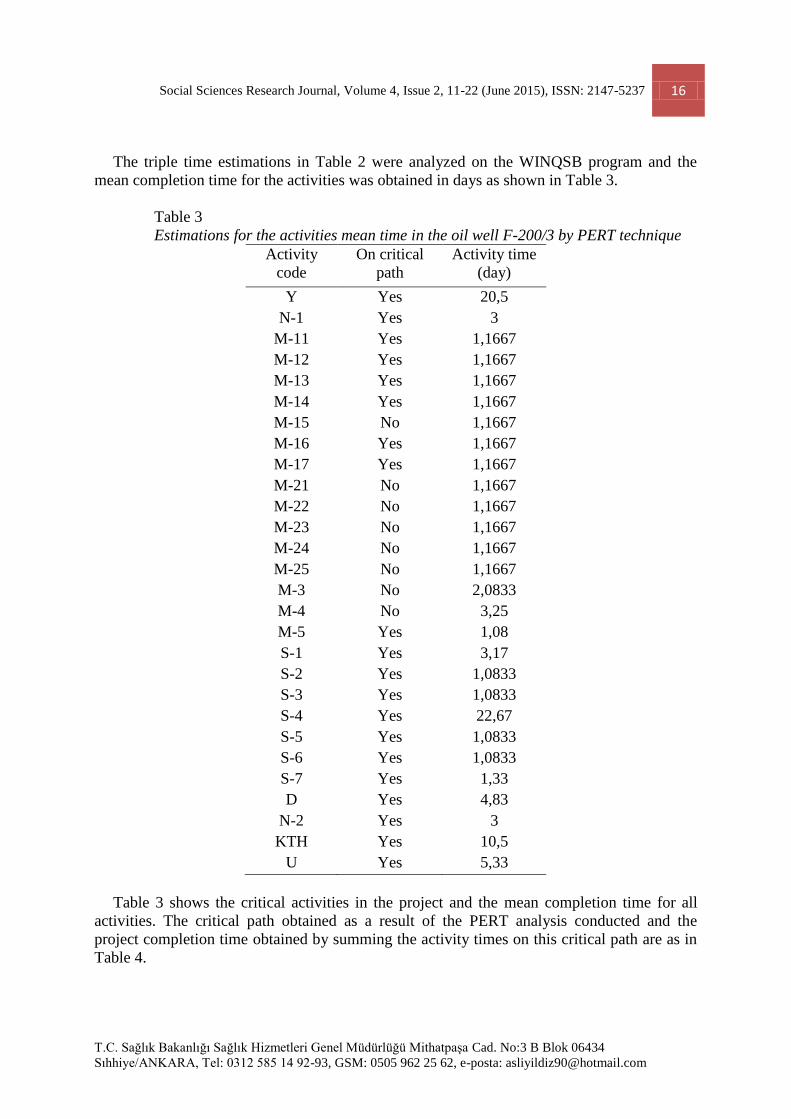
The triple time estimations in Table 2 were analyzed on the WINQSB program and the
mean completion time for the activities was obtained in days as shown in Table 3.
Table 3
Estimations for the activities mean time in the oil well F-200/3 by PERT technique
Activity
code
On critical
path
Activity time
(day)
Y Yes 20,5
N-1 Yes 3
M-11 Yes 1,1667
M-12 Yes 1,1667
M-13 Yes 1,1667
M-14 Yes 1,1667
M-15 No 1,1667
M-16 Yes 1,1667
M-17 Yes 1,1667
M-21 No 1,1667
M-22 No 1,1667
M-23 No 1,1667
M-24 No 1,1667
M-25 No 1,1667
M-3 No 2,0833
M-4 No 3,25
M-5 Yes 1,08
S-1 Yes 3,17
S-2 Yes 1,0833
S-3 Yes 1,0833
S-4 Yes 22,67
S-5 Yes 1,0833
S-6 Yes 1,0833
S-7 Yes 1,33
D Yes 4,83
N-2 Yes 3
KTH Yes 10,5
U Yes 5,33
Table 3 shows the critical activities in the project and the mean completion time for all
activities. The critical path obtained as a result of the PERT analysis conducted and the
project completion time obtained by summing the activity times on this critical path are as in
Table 4.

Social Sciences Research Journal, Volume 4, Issue 2, 11-22 (June 2015), ISSN: 2147-5237 17
T.C. Sağlık Bakanlığı Sağlık Hizmetleri Genel Müdürlüğü Mithatpaşa Cad. No:3 B Blok 06434
Sıhhiye/ANKARA, Tel: 0312 585 14 92-93, GSM: 0505 962 25 62, e-posta: [email protected]
Table 4
Critical path of the oil well project F-200/3
Critical
path-1
Critical
path-2
1 Y Y
2 N-1 N-1
3 M-11 M-11
4 M-12 M-12
5 M-13 M-14
6 M-16 M-16
7 M-17 M-17
8 M-5 M-5
9 S-1 S-1
10 S-2 S-2
11 S-3 S-3
12 S-4 S-4
13 S-5 S-5
14 S-6 S-6
15 S-7 S-7
16 D D
17 N-2 N-2
18 KTH KTH
19 U U
Project completion time 85,58
Standard deviation 3,06
As is clear from Table 4, the expected project completion time and its standard deviation
were obtained as, respectively, 85,58 days and 3,06 days. It is expected that, if the relevant
project is started on 13.05.2013 as planned, it would be completed on 07.08.2013. The
expected total project cost obtained by entering to the program the physical costs of activities
in the well reports of the well project F-200/3 was, however, found to be 3.547.094,00 TL
(Turkish Liras). Table 5 shows the Brent oil prices between 2009 and 2014.
Table 5
Europe Brent Spot Price
Year Europe Brent Spot Price ($/barrel)
2009 43,4 43,3 46,5 50,2 57,3 68,6 64,4 72,5 67,7 72,8 76,7 74,5
2010 76,2 73,8 78,8 84,8 76,0 74,8 75,6 77,0 77,8 82,7 85,3 91,5
2011 96,5 103,7 114,6 123,3 115,0 113,8 117,0 110,2 112,8 109,6 110,8 107,9
2012 110,7 119,3 125,5 119,8 110,3 95,2 102,6 113,4 112,9 111,7 109,1 109,5
2013 113,0 116,1 108,5 102,3 102,6 102,9 107,9 111,3 111,6 109,1 107,8 110,8
2014 108,1 108,9 107,5 107,8 109,5 111,8 106,8 101,6 97,1 87,4 79,4 62,3 Note: The prices shown in the Table 5 are the prices of crude oil with 35 API (American Petroleum Institute)
gravity.
Social Sciences Research Journal, Volume 4, Issue 2, 11-22 (June 2015), ISSN: 2147-5237 18
T.C. Sağlık Bakanlığı Sağlık Hizmetleri Genel Müdürlüğü Mithatpaşa Cad. No:3 B Blok 06434
Sıhhiye/ANKARA, Tel: 0312 585 14 92-93, GSM: 0505 962 25 62, e-posta: [email protected]
Starting production as soon as possible in a period when the oil prices are high is important
since this would provide financing to the company for its future well drillings and the
purchase of new drilling rigs. The average daily gross earning of the company from the
relevant well which will provide a production capacity of 150 barrels a day with 35 API
(American Petroleum Institute) gravity would be $16.489,50 and the company will derive a
daily net profit of $13.189,50 when the $22,00/barrel production cost is subtracted. In
addition, the company intends to complete the oil wells in optimal time in order to achieve the
annual target of drilling amount. For these reasons, it was considered necessary to make
crashing transactions on the project.
According to the results of the project completion analysis made on the WINQSB program,
the possibility of half-day early completion for the F-200/3 project with available sources is
18% while the possibility of a-day-and-a-half early completion is about 9%. This result
demonstrates that the project cannot be crashed by the current budget plan, and additional
sources are needed for such a crashing.
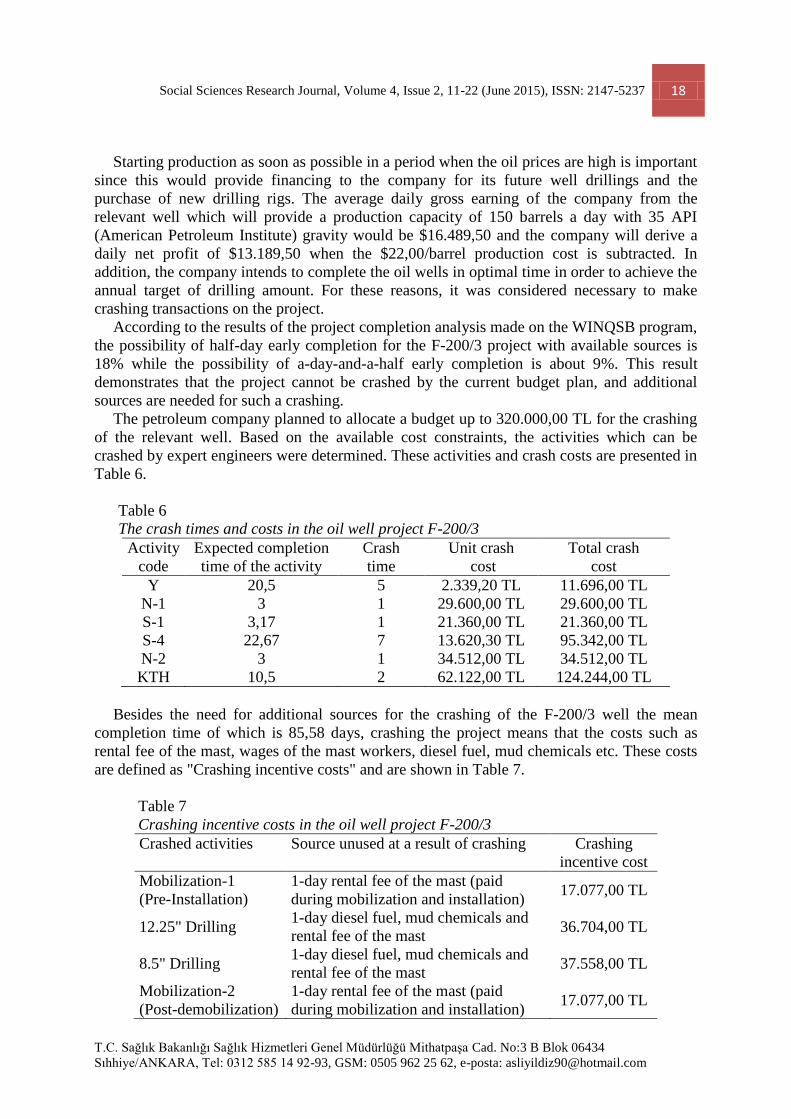
The petroleum company planned to allocate a budget up to 320.000,00 TL for the crashing
of the relevant well. Based on the available cost constraints, the activities which can be
crashed by expert engineers were determined. These activities and crash costs are presented in
Table 6.
Table 6
The crash times and costs in the oil well project F-200/3
Activity
code
Expected completion
time of the activity
Crash
time
Unit crash
cost
Total crash
cost
Y 20,5 5 2.339,20 TL 11.696,00 TL
N-1 3 1 29.600,00 TL 29.600,00 TL
S-1 3,17 1 21.360,00 TL 21.360,00 TL
S-4 22,67 7 13.620,30 TL 95.342,00 TL
N-2 3 1 34.512,00 TL 34.512,00 TL
KTH 10,5 2 62.122,00 TL 124.244,00 TL
Besides the need for additional sources for the crashing of the F-200/3 well the mean
completion time of which is 85,58 days, crashing the project means that the costs such as
rental fee of the mast, wages of the mast workers, diesel fuel, mud chemicals etc. These costs
are defined as "Crashing incentive costs" and are shown in Table 7.
Table 7
Crashing incentive costs in the oil well project F-200/3
Crashed activities Source unused at a result of crashing Crashing
incentive cost
Mobilization-1
(Pre-Installation)
1-day rental fee of the mast (paid
during mobilization and installation) 17.077,00 TL
12.25" Drilling 1-day diesel fuel, mud chemicals and
rental fee of the mast 36.704,00 TL
8.5" Drilling 1-day diesel fuel, mud chemicals and
rental fee of the mast 37.558,00 TL
Mobilization-2
(Post-demobilization)
1-day rental fee of the mast (paid
during mobilization and installation) 17.077,00 TL

Social Sciences Research Journal, Volume 4, Issue 2, 11-22 (June 2015), ISSN: 2147-5237 19
T.C. Sağlık Bakanlığı Sağlık Hizmetleri Genel Müdürlüğü Mithatpaşa Cad. No:3 B Blok 06434
Sıhhiye/ANKARA, Tel: 0312 585 14 92-93, GSM: 0505 962 25 62, e-posta: [email protected]
As can be understood from Table 7, there is no crashing incentive cost due to the lack of
sources unused during the crashing of road and location construction also well completion
process activities.
The gradual crashing analysis of the F-200/3 project estimated to be completed in a mean
of 85,58 days with additional sources is made via WINQSB program.
In case that the relevant oil well starts production before the planned completion time, the
company would start earning earlier. Anticipating that the F-200/3 well would produce 150
barrels of oil on a daily basis, the Company would make a daily net earning of $13.189,50
(including $109,93/barrel average Brent oil price for the first 4 months of 2013 and
$22,00/barrel production cost). Since the dollar exchange rate was 1,79 TL on 15.04.2013, the
date on which the project planning was performed, it is assumed that the Company would
make a daily earning of 23.609,21 TL by the early production.
The net expected earnings were obtained taking into account the crashing costs resulting
from the crashing analyses conducted for each possible time point of the F-200/3 project as
well as the crashing incentive costs and the yield from early production. These values are
shown in Table 8.
Table 8
Cost analysis on the crashing of F-200/3 well
Crashed
time
Crashing
cost
Crashing
incentive cost
Earning from
early start on
oil production
Total
expected
earning
Net
expected
earning
85 1.341,33 - 13.693,34 13.693,34 12.352,01
84 3.680,53 - 37.302,54 37.302,54 33.622,01
83 6.019,73 - 60.911,75 60.911,75 54.892,02
82 8.358,92 - 84.520,95 84.520,95 76.162,03
81 10.698,12 - 108.130,16 108.130,16 97.432,04
80 19.506,00 21.535,76 131.739,36 153.275,12 133.769,12
79 33.126,28 59.093,76 155.348,57 214.442,33 181.316,05
78 46.746,57 96.651,76 178.957,77 275.609,53 228.862,96
77 60.366,84 134.209,76 202.566,98 336.776,74 276.409,90
76 73.987,13 171.767,76 226.176,18 397.943,94 323.956,81
75 87.607,41 209.325,76 249.785,39 459.111,15 371.503,74
74 101.227,70 246.883,76 273.394,59 520.278,35 419.050,65
73 119.286,00 283.952,07 297.003,80 580.955,87 461.669,87
72 145.370,88 309.401,95 320.613,00 630.014,95 484.644,07
71 177.787,47 326.478,95 344.222,21 670.701,16 492.913,69
70 228.131,27 333.764,00 367.831,41 701.595,41 473.464,14
69 290.253,27 333.764,00 391.440,62 725.204,62 434.951,35
68 316.754,00 333.764,00 401.356,49 735.120,49 418.366,49
Note: The above values are the monetary values are in Turkish Liras.
Social Sciences Research Journal, Volume 4, Issue 2, 11-22 (June 2015), ISSN: 2147-5237 20
T.C. Sağlık Bakanlığı Sağlık Hizmetleri Genel Müdürlüğü Mithatpaşa Cad. No:3 B Blok 06434
Sıhhiye/ANKARA, Tel: 0312 585 14 92-93, GSM: 0505 962 25 62, e-posta: [email protected]
As can be seen from Table 8, in case that the oil well project F-200/3 is completed in 71
days (on 23.07.2013), the Company would realize the optimal project planning and make a
profit of 492.913,69 TL.
As a result, in case that the oil well project F-200/3 is completed 14,5 days earlier than
expected, it is envisaged that the Company would make a profit up to 13,89% of the total
expected cost of project as a result of this crashing process.
Likewise, the analyses conducted for the oil well F-200/4 are as follows:
In the analysis conducted by the PERT technique, the expected completion time of the
project and its standard deviation was obtained as, respectively, 88,67 days and 3,06 days.
The expected total project cost obtained by entering to the program the costs of project
activities was found to be 4.873.156,00 TL.
F-200/4 well is expected to produce 150 barrels of oil with 35 API gravity on a daily basis.
Based on this production estimate, in case that the relevant well starts production prior to the
planned completion time, the Company would make a daily net profit of $12.838,50
(including $107,59/barrel average Brent oil price for the first 7 months of 2013 and
$22,00/barrel production cost). Since the dollar exchange rate was 1,96 TL on 05.07.2013, the
date on which the project planning was performed, it is assumed that the Company would
make a daily earning of 25.163,46 TL by the early production.
According to the results of the project completion analysis made on the WINQSB program,
the possibility of half-day early completion for the F-200/4 project with available sources is
17% while the possibility of a-day-and-a-half early completion is 8,5%.
According to the results of the project completion analysis, the petroleum company
planned to allocate a budget up to 220.000,00 TL for the crashing of the relevant well. And
the activities which can be crashed by expert engineers and the crashing costs of these
activities were determined. Then, the crashing analyses were conducted for each of its
possible time point.
The cost analyses for the F-200/3 well (Table 8) were also conducted for the F-200/4
well. As a result of these analyses; in case that the F-200/4 oil well is completed in 79 days,
the highest net expected profit of the company (358.580,78 TL) would be obtained and the
optimal project plan would be realized.
It is also envisaged that, in case that the F-200/4 oil well is completed about 10 days earlier
than the expected, the company is expected to make a profit up to 7,36% of the total expected
cost at the end of this crashing process.
Conclusion and Evaluation
In this study, the project plannings of the oil well projects F-200/3 and F-200/4 projected to
be opened by a petroleum company were established using PERT-CPM techniques and
analyses were made on how well costs will vary in different locations.
Primarily in the analysis, the cost estimations for each activity among the physical costs in
the well reports prepared by the company prior to the project were obtained. In the second
phase, the triple time estimations were made by PERT technique on the activities to be carried
out in the project in line with the views of Petroleum Engineers and the estimated project
times were calculated.
Since the F-200/4 well addressed in the study will be drilled directionally drilling, it was
envisaged that completion of this well would take longer than the F-200/3 well with higher
costs.

Social Sciences Research Journal, Volume 4, Issue 2, 11-22 (June 2015), ISSN: 2147-5237 21
T.C. Sağlık Bakanlığı Sağlık Hizmetleri Genel Müdürlüğü Mithatpaşa Cad. No:3 B Blok 06434
Sıhhiye/ANKARA, Tel: 0312 585 14 92-93, GSM: 0505 962 25 62, e-posta: [email protected]
After the cost and time estimations for the relevant projects, it was understood, as a result
of the project completion analysis conducted, that the projects cannot be completed earlier
than expected with the available sources and crashing budgets were determined by the
Company's project engineers for both wells. Because of the projects’ nature, the activities to
be crashed by those budgets were determined based on the experts' opinions. For each
possible crashing point, the incentive costs to be obtained from the sources unused by the
Company and the yields to be obtained from starting oil production earlier than expected were
calculated. As a result of these calculations, the crashing point which provides the highest
expected net profit to the Company was adopted as the optimal project planning.
As a result of the implementation of the crashed project plans; it was foreseen that the F-
200/3 well could be completed about 14,5 days earlier with a profit of 13,89% and the F-
200/4 well could be completed about 10 days earlier with a profit of 7,36%.
In projects, it was generally preferred to crash the activities with an abundance value in a
theoretically supported form. However, in this study, crashing of the installation activities
which have an abundance value was not considered possible and thus, crashing of the critical
activities determined in the view of experts' opinions was adopted.
Crashing of a critical activity usually causes an increase in the cost, but, provides a gain of
time. However, in this study; it was expected that crashing of the critical activities involved in
the oil well projects would provide the Company with a gain in terms of both the time and the
costs.
The use of new project plannings prepared based on the optimal crashing points during the
management and control phase of the project with higher costs and risks such as oil well
drilling projects is believed to be in favor of the companies.
References
Coşkun, O., Ekmekçi, İ. (2012). Bir İnşaat Projesinin Evreleri ile Zaman ve Maliyet
Analizinin Proje Yönetim Teknikleri Vasıtasıyla İncelenmesi. İstanbul Ticaret Üniversitesi
Fen Bilimleri Dergisi, 10(20).
Daigh, S. L. (2012). Helicopter Final Assembly Critical Path Analysis, MSc Thesis,
Massachusetts Institute of Technology Department of Mechanical Engineering,
Cambridge.
Gaither, N. (1980). Production and Operation Management: A Problem Solving and
Decision-Making Approach. New York: The Dryden Press, 297.
Gibbs, M., (1984). The Management of Operations. New York: John Wiley and Sons Inc.
Gür, İ., (2006). Proje Yönetiminde PERT-CPM’in Proses Modeli ile Simüle Edilmesi ve Bir
Uygulama. Yüksek Lisans Tezi, Gebze İleri teknoloji Enstitüsü/Sosyal Bilimler Enstitüsü,
Gebze.
Karadeniz, C. Ö. (2006). PERT-CPM ile Proje Planlama, Değerlendirme ve Bir İşletme
Uygulaması, Yüksek Lisans Tezi, Marmara Üniversitesi Sosyal Bilimler Enstitüsü,
İstanbul.
Kır, E., (2007), Yazılım Sektöründe Proje Yönetimi, Yüksek Lisans Tezi, Kadir Has
Üniversitesi, Sosyal Bilimler Enstitüsü.
Özkan, Ş., (2005). Yöneylem Araştırması Nicel Karar Teknikleri, Ankara: Nobel Yayın
Dağıtım.
Öztürk, A. (1987). Yöneylem Araştırması. Bursa: Uludağ Üniversitesi Yayınları, 189.
Rençber, B. A. (2011). Proje Yönetiminde PERT Tekniği ve Bir Uygulama.Gazi Üniversitesi
Endüstriyel Sanatlar Eğitim Fakültesi Dergisi, (27), 31.

Social Sciences Research Journal, Volume 4, Issue 2, 11-22 (June 2015), ISSN: 2147-5237 22
T.C. Sağlık Bakanlığı Sağlık Hizmetleri Genel Müdürlüğü Mithatpaşa Cad. No:3 B Blok 06434
Sıhhiye/ANKARA, Tel: 0312 585 14 92-93, GSM: 0505 962 25 62, e-posta: [email protected]
Sarıca, İ. (2006). CPM ve PERT Teknikleriyle Proje Planlama ve Bir İşletmede Uygulanması,
Yüksek Lisans Tezi, Uludağ Üniversitesi Sosyal Bilimler Enstitüsü, Bursa, 19-29.
Timör, M. (2010). Yöneylem Araştırması. İstanbul: Türkmen Kitabevi, 448.
Yamak, O. (1998). Proje Yönetim Teknikleri. İstanbul, 2.