analysis of numerical inferiority actions during the positional...
TRANSCRIPT

Dr. Manolo Montoya
Assistant Coach Qatar National Team
Analysis of numerical inferiority
actions during the positional attack
phase at the 2016 Rio Olympic
Games

Analysis of numerical inferiority actions during the positional attack phase at the 2016 Rio Olympic Games
Dr. Manolo Montoya. Page 2 Qatar Handball Association
Special thanks for his support to the Qatar Handball Association and especially
to Mr. Ahmed Al Shaabi (President), Mr. Mohamed Jabor Al Mulla (Secretary
General), Mr. Adel Al Enazi (Finantial Manager and Responsible of the
National Team, and also to Mr. Valero Rivera (Head Coach) and my
companions Mr. Ricard Franch and Mr. Veroljub Kosovacs (Assistants coaches)
Analysis of numerical inferiority actions during the positional attack phase at the 2016 Rio Olympic Games
Dr. Manolo Montoya. Page 3 Qatar Handball Association
INDEX
1 ABSTRACT ............................................................................................................. 3 2 INTRODUCTION ..................................................................................................... 5 3 METHOD ............................................................................................................... 6 3.1 Sample ............................................................................................................... 6 3.2 Variables ............................................................................................................ 6 3.3 Instrument .......................................................................................................... 8 4 PROCEDURE .......................................................................................................... 9 5 RESULTS ................................................................................................................ 9 6 DISCUSSION (In all cases referring to the offensive numerical inferiority situations) ... 9 6.1 Number and average of disciplinary penalties ....................................................... 9 6.2 Use of the new regulations................................................................................. 11 6.3 Shots into an empty goal ................................................................................... 13 6.4 Result of the numerical inferiority actions .......................................................... 16 6.5 Partial result at the time of registering the action ................................................. 21 6.6 Actions with or without warning of passive play ................................................. 22 6.7 Attacks and sub attacks for each exclusion period ............................................... 23 6.8 Play system used by teams that make the goalkeeper-player change ..................... 25 6.9 Finalization zone used ....................................................................................... 27 7.CONCLUSIONS ..................................................................................................... 29 8. ANNEX ............................................................................................................... 31 8.1 Results of the number and average of exclusions by team .................................... 32 8.2 Results according to use of new regulations ........................................................ 33 8.3 Results according to throws to empty goal .......................................................... 34 8.4 Results according to success of finalization ........................................................ 35 8.5 Results according to the partial scoreboard during the action ............................... 38 8.6 Results according to the actions with or without passive play warning .................. 42 8.7 Results according to the attacks and sub attacks of each exclusion period ............. 44 8.8 Results according to the play system used by the teams in numerical inferiority that
make the change GK-P ........................................................................................... 48
Analysis of numerical inferiority actions during the positional attack phase at the 2016 Rio Olympic Games
Dr. Manolo Montoya. Page 4 Qatar Handball Association
1 ABSTRACT
The aim of this study is to scientifically determine the influence that the
modification of the regulation in reference to the possibility of using a change of
goalkeeper for a field player without having to use different clothing from the
rest of the players has had on the game. This study focuses on the observational,
quantitative and relational analysis of all offensive actions in situations of
numerical inferiority during the positional attack phase that were carried out in
38 men's handball matches, which were played during the 2016 Olympic Games
in Rio de Janeiro.
For the conclusions of this study, we must emphasize that the number of
disciplinary sanctions involved in a situation of numerical inferiority have
increased in the Rio Olympic Games in comparison to the 2008 Beijing and
2012 London Olympic Games. There was no relationship between the greater or
lesser average of disciplinary sanctions of the teams and final classification
obtained. The use of the goalkeeper-player in situations of numerical inferiority
during the positional attack phase has been used in this competition
overwhelmingly (77.8%). The actions immediately following the loss of
possession by the teams the used the change does not involve an excessive risk
of receiving a goal in an empty goal (7%). The supposed defensive
disorganization resulting from the changes does not imply a high level of risk of
receiving a goal (4.1%) in the case of rapid attack after the loss of possession.
The actions with a positive result made by the teams that realized a goalkeeper-
player switch are 6.77% higher and in the specific case of goals obtained
represent 5.6% more. A pattern of use for the goalkeeper-player change
according to the partial result that is reflected in the scoreboard has not been
found. During the numerical inferiority attacks made with the goalkeeper-player
change, the referees show passive play warning 11.8% less. The number of
attacks during the exclusion duration period is approximately the same in both
cases, and sub attacks being greater if the goalkeeper-player change is not made.
The play system most utilized when the change occurs is 3:3. And the shots
zones tend to balance when the goalkeeper-player change happens.
Analysis of numerical inferiority actions during the positional attack phase at the 2016 Rio Olympic Games
Dr. Manolo Montoya. Page 5 Qatar Handball Association
2 INTRODUCTION
As can be seen on the website of the International Handball Federation (IHF)
("The Road to the New Rules of 2016"), this aims to increase the attrac tiveness
of the game. The first step to achieve this was made with the formation of a
working group in 2013 composed of Jürgen Scharoff, Hanspeter Knabenhans,
Heiner Brand, Manfred Prause and Ramón Gallego who began to work on
possible regulatory changes. In 2014 the IHF organized the II Forum for the
future of Hanball in Denmark with the aim of “to listen and analyse the position,
profile and current status of international handball from the different points of
view and discuss strategies and concerted measure concepts in the way of
spreading handball" . At that conference, a working group known as the "Game
Development Group", made up of IHF experts, coaches (such as Staffan Olsson,
Talant Dujshebaev, Gudmundur Gudmundsson, Ulrik Wilbek, Michael Biegler,
Heiner Brand) and IHF referees discussed the different aspects of the game.
Based on their proposals, different changes to the rules were tested during 2015
at the Junior Men's World Championship in Brazil and at the Youth Men's
World Championship in Russia. After receiving positive feedback at all levels
(coaches, referees and delegates), all of the changes were incorporated to the
regulations that came into force on 1 July 2016, applying them in high
competition for the first time at the 2016 Rio Olympic Games.
Any regulatory change that per se implies a change in the internal structure of
the game, the application of the new regulations will have followers and
detractors. Some of the "new images" that have been produced during the games,
such as shooting to an empty goal, seven players attacking six, or the scarce
presence of the actions in attacks in numerical inferiority, have surprised,
pleased, upset and even elicited rejection by some persons that initially were in
agreement with the changes.
According to the objective of our investigation, the two modifications to be
taken into account refer to the possibility of changing the goalkeeper for a field
player without distinguishing his equipment from the rest of the players (Rule
4:1; 4:4-4:7) and the maximum number of passes before the arbitrary penalty
warning for passive play (Rule 7:12 and clarification 4).
These modifications are fully described in the Game Regulations
(http://www.ihf.info/en-us/thegame/statutesandregulations.aspx?catid=5) of and
Analysis of numerical inferiority actions during the positional attack phase at the 2016 Rio Olympic Games
Dr. Manolo Montoya. Page 6 Qatar Handball Association
masterfully explained on the IHF website
(http://ihfeducation.ihf.info/REFEREES/Rule-Explanations/items.
3 METHOD
3.1 Sample
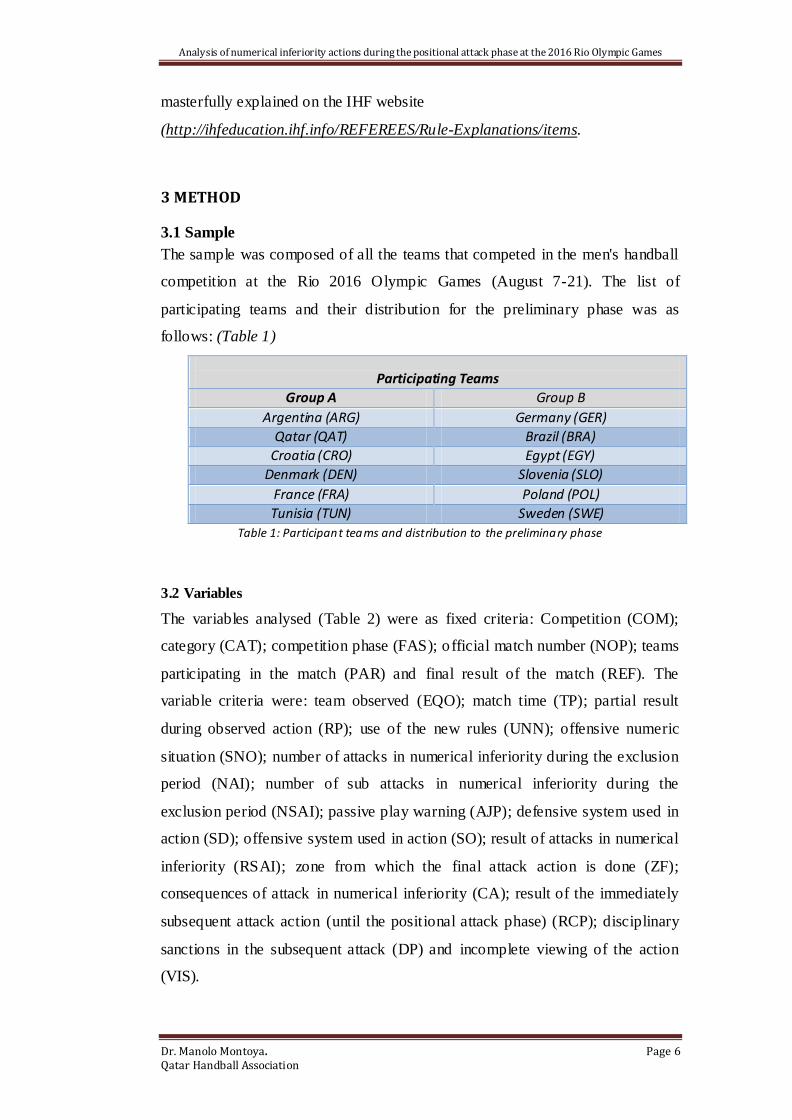
The sample was composed of all the teams that competed in the men's handball
competition at the Rio 2016 Olympic Games (August 7-21). The list of
participating teams and their distribution for the preliminary phase was as
follows: (Table 1)
Participating Teams
Group A Group B
Argentina (ARG) Germany (GER)
Qatar (QAT) Brazil (BRA)
Croatia (CRO) Egypt (EGY)
Denmark (DEN) Slovenia (SLO)
France (FRA) Poland (POL)
Tunisia (TUN) Sweden (SWE)
Table 1: Participant teams and distribution to the preliminary phase
3.2 Variables
The variables analysed (Table 2) were as fixed criteria: Competition (COM);
category (CAT); competition phase (FAS); official match number (NOP); teams
participating in the match (PAR) and final result of the match (REF). The
variable criteria were: team observed (EQO); match time (TP); partial result
during observed action (RP); use of the new rules (UNN); offensive numeric
situation (SNO); number of attacks in numerical inferiority during the exclusion
period (NAI); number of sub attacks in numerical inferiority during the
exclusion period (NSAI); passive play warning (AJP); defensive system used in
action (SD); offensive system used in action (SO); result of attacks in numerical
inferiority (RSAI); zone from which the final attack action is done (ZF);
consequences of attack in numerical inferiority (CA); result of the immediately
subsequent attack action (until the positional attack phase) (RCP); disciplinary
sanctions in the subsequent attack (DP) and incomplete viewing of the action
(VIS).

Analysis of numerical inferiority actions during the positional attack phase at the 2016 Rio Olympic Games
Dr. Manolo Montoya. Page 7 Qatar Handball Association
These observation criteria are complemented by the necessary categories that
generate the necessary exclusivity property and completeness that any
observational research must possess.
Tab
le 2
: C
rite
ria
an
d c
ate
go
ries
of
the
stu
dy

Analysis of numerical inferiority actions during the positional attack phase at the 2016 Rio Olympic Games
Dr. Manolo Montoya. Page 8 Qatar Handball Association
3.3 Instrument
The Dartfish TeamPro v.9 ConnectPlus software was used as a registering
instrument, using a tagging panel (Image 1 and 2), with the designed criteria and
categories (Table 2).
Image 1: Dartfish tagging panel. Fix criteria
Image 2: Dartfish tagging panel. Variable criteria 1
Analysis of numerical inferiority actions during the positional attack phase at the 2016 Rio Olympic Games
Dr. Manolo Montoya. Page 9 Qatar Handball Association
4 PROCEDURE
A total of 916 offensive actions in numerical inferiority situations were collected
by the author of the study, acting passively without influencing the behaviour of
the players. Of these 916 actions, 12 were discarded since the teams did not
show any intention of attacking when the recovery of the excluded player is
close and it is not a situation of passive play. From the data registered by the IHF
in its official statistics (public statistics, which can be found on the website of
this organization(0)), the exact time was identified in which the disciplinary
sanctions were produced that provoked the purpose of the study and the
mentioned variables were registered.
(0)http://www.ihf.info/en-us/ihfcompetitions/olympicgames/olympicgamesrio2016/fixturesandresults.aspx
5 RESULTS
For the statistical treatment of the data, these were transferred from the files
generated by the Dartfish program to the SPSS v.15 statistical program for
Windows. The data was subsequently analysed. The values obtained are
presented in the last point (8) as an annex, in order to facilitate the reading of
this study, even if it is not academically correct.
6 DISCUSSION (In all cases referring to the offensive numerical inferiority situations)
6.1 Number and average of disciplinary penalties
It is important to mention the increase in the disciplinary sanctions that have
been received completely by the teams during the 2016 Rio Olympic Games
when compared to the previous two Olympic Games. In Beijing 2008, 301
exclusions and 13 disqualifications were registered, in London 2012, 302
exclusions and 8 disqualifications, while in Rio a total of 367 exclusions (2) and
13 disqualifications were registered (Graph 1).
(1) From this point on and since our study focuses on the analysis of numerical inferiority
offensive play, we will use the term disciplinary sanctions referring to those that imply a
situation of numerical inferiority for the sanctioned team and that therefore will be limited to the
exclusions and to the disqualifications, thus avoiding warnings (yellow cards)

Analysis of numerical inferiority actions during the positional attack phase at the 2016 Rio Olympic Games
Dr. Manolo Montoya. Page 10 Qatar Handball Association
(2) If the data from this study is compared with the official statistics of the IHF, we can see two
data that do not coincide (number of disciplinary sanctions for the teams from Egypt and
Sweden), it is relevant to explain that these differences are due to one error in the official
statistics of the IHF. In the match played between Egypt and Sweden (EGY-SWE), at minute
48':47" the exclusion of player no. 3 from Sweden, J. Gottfridsonn was registered, when the
player sanctioned was actually Egyptian player no. 3 Aboubaid Mamdouh Taha.
Graph 1: Exclusions and disqualifications frequency at last Olympics meetings.
Without a doubt, the arbitral predisposition to reduce excessively hard or
unsportsmanlike behaviour has been increased during this time and the
application of disciplinary sanctions to combat this, has been emphasized, but,
and this is something that is objectively impossible to ascertain. As a result of
the data extracted in this study, in which we will see that the offensive efficiency
does not decrease a great deal after suffering an exclusion, we could pose the
first question to begin reflecting on the possible consequences of the
modifications to the regulations applied for the first time during the Olympic
tournament: Can there be less fear of suffering situations of numerical inferiority
and, therefore, is there a tendency to increase defensive hardness?
0
50
100
150
200
250
300
350
400
Beijing 2008 London 2012 Rio 2016
301 302 367
13 8
13
RC
2'
Analysis of numerical inferiority actions during the positional attack phase at the 2016 Rio Olympic Games
Dr. Manolo Montoya. Page 11 Qatar Handball Association
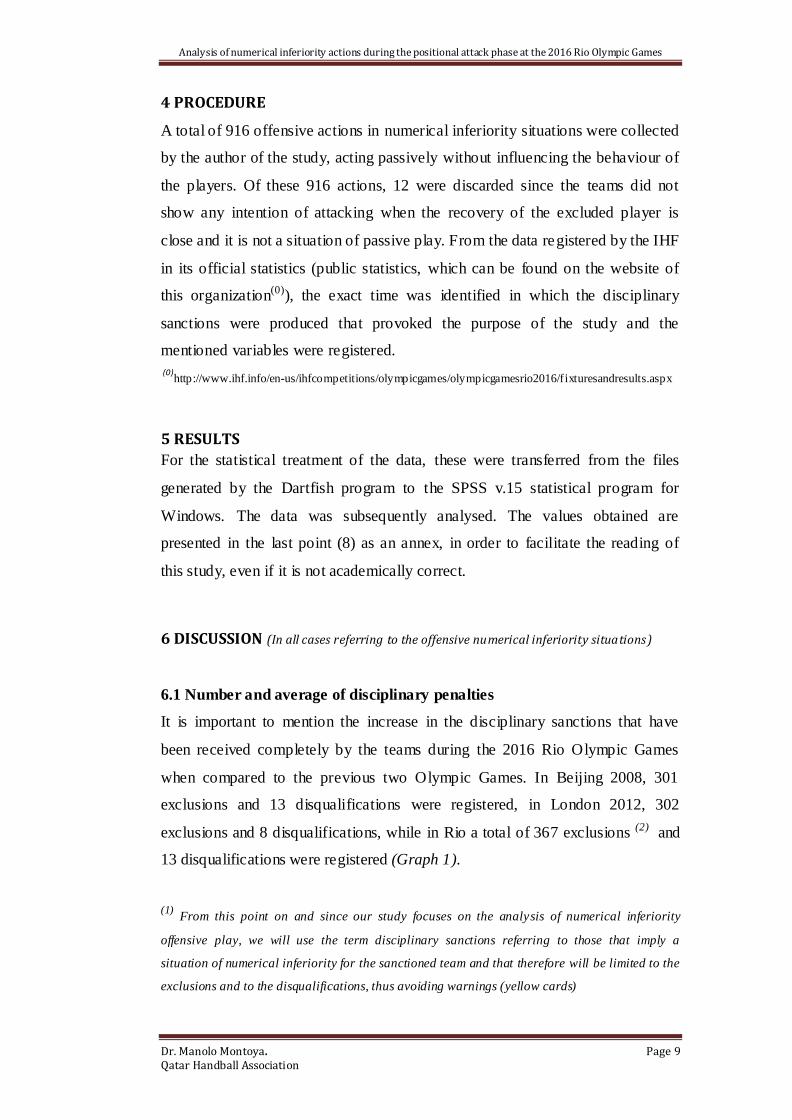
In terms of the sanctions average (Table 3 Graph 2) presented by the teams, we
can see that there is no relationship between a greater or lesser average of
disciplinary sanctions and the final ranking obtained in the competition.
Graph 2: Final classification obtained and exclusions average
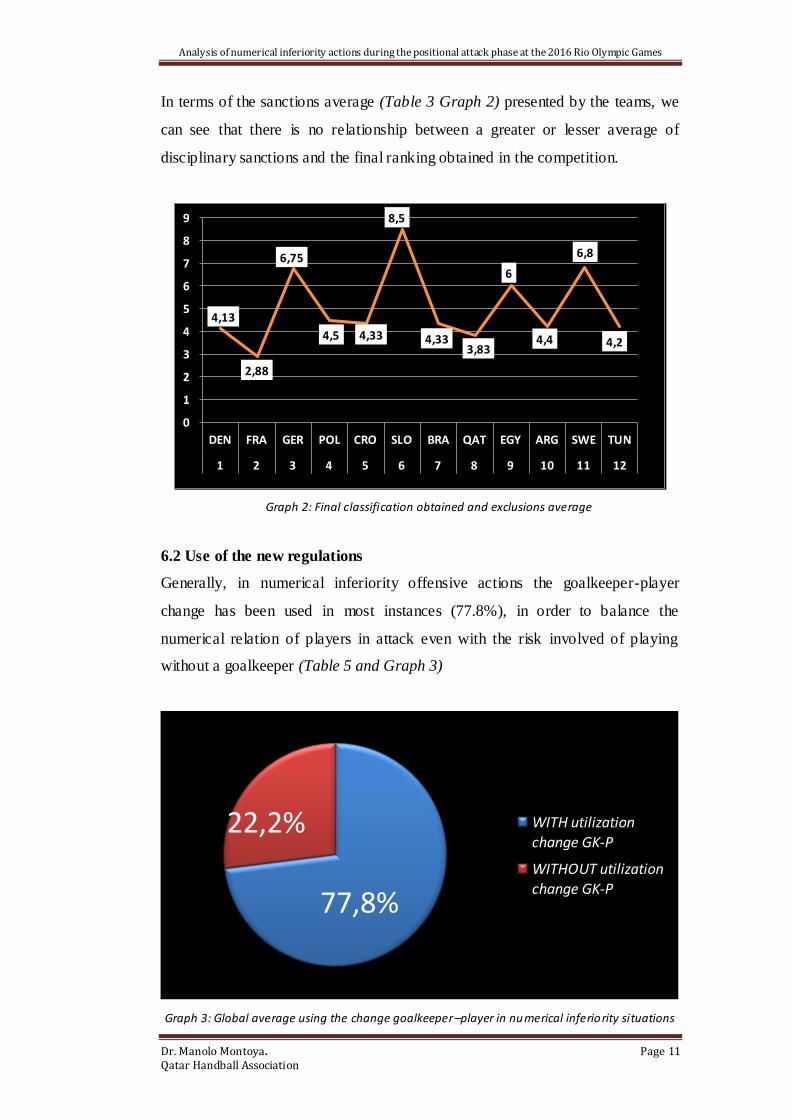
6.2 Use of the new regulations
Generally, in numerical inferiority offensive actions the goalkeeper-player
change has been used in most instances (77.8%), in order to balance the
numerical relation of players in attack even with the risk involved of playing
without a goalkeeper (Table 5 and Graph 3)
Graph 3: Global average using the change goalkeeper–player in numerical inferiority situations
4,13
2,88
6,75
4,5 4,33
8,5
4,33 3,83
6
4,4
6,8
4,2
0
1
2
3
4
5
6
7
8
9
DEN FRA GER POL CRO SLO BRA QAT EGY ARG SWE TUN
1 2 3 4 5 6 7 8 9 10 11 12
77,8%
22,2% WITH utilization change GK-P
WITHOUT utilization
change GK-P
Analysis of numerical inferiority actions during the positional attack phase at the 2016 Rio Olympic Games
Dr. Manolo Montoya. Page 12 Qatar Handball Association
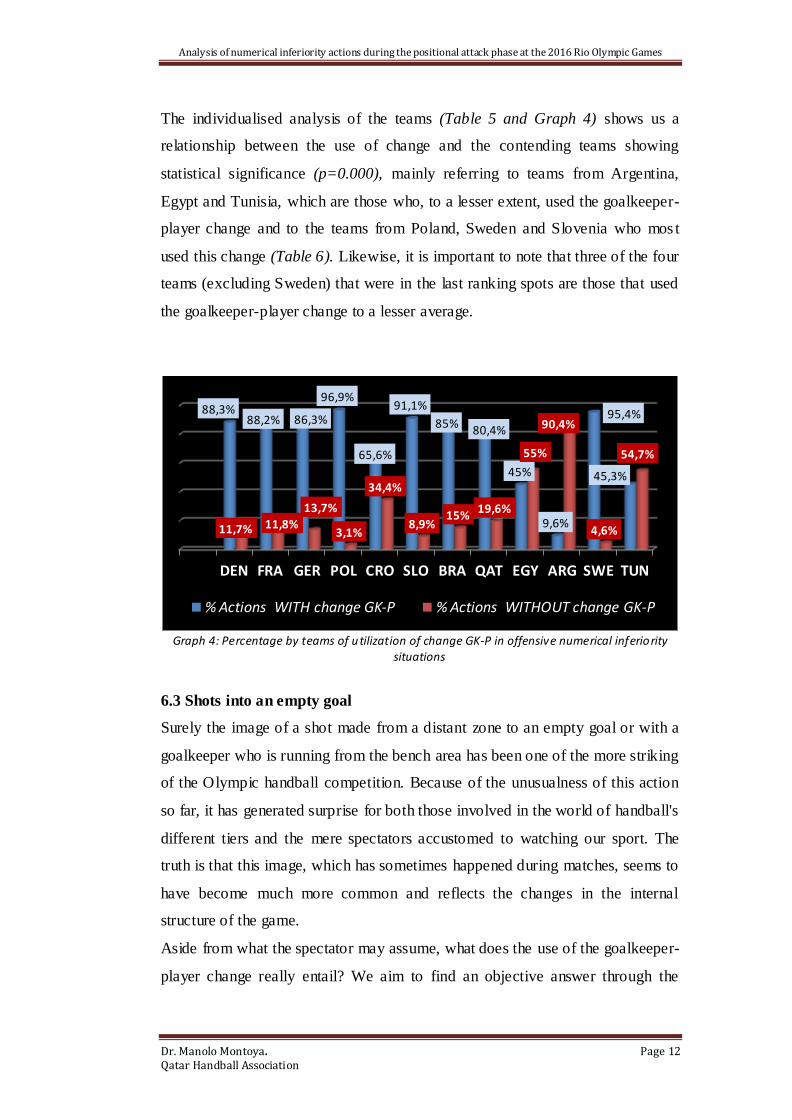
The individualised analysis of the teams (Table 5 and Graph 4) shows us a
relationship between the use of change and the contending teams showing
statistical significance (p=0.000), mainly referring to teams from Argentina,
Egypt and Tunisia, which are those who, to a lesser extent, used the goalkeeper-
player change and to the teams from Poland, Sweden and Slovenia who mos t
used this change (Table 6). Likewise, it is important to note that three of the four
teams (excluding Sweden) that were in the last ranking spots are those that used
the goalkeeper-player change to a lesser average.
Graph 4: Percentage by teams of utilization of change GK-P in offensive numerical inferiority situations
6.3 Shots into an empty goal
Surely the image of a shot made from a distant zone to an empty goal or with a
goalkeeper who is running from the bench area has been one of the more striking
of the Olympic handball competition. Because of the unusualness of this action
so far, it has generated surprise for both those involved in the world of handball's
different tiers and the mere spectators accustomed to watching our sport. The
truth is that this image, which has sometimes happened during matches, seems to
have become much more common and reflects the changes in the internal
structure of the game.
Aside from what the spectator may assume, what does the use of the goalkeeper-
player change really entail? We aim to find an objective answer through the
DEN FRA GER POL CRO SLO BRA QAT EGY ARG SWE TUN
88,3% 88,2% 86,3%
96,9%
65,6%
91,1%
85% 80,4%
45%
9,6%
95,4%
45,3%
11,7% 11,8%
13,7%
3,1%
34,4%
8,9% 15%
19,6%
55%
90,4%
4,6%
54,7%
% Actions WITH change GK-P % Actions WITHOUT change GK-P
Analysis of numerical inferiority actions during the positional attack phase at the 2016 Rio Olympic Games
Dr. Manolo Montoya. Page 13 Qatar Handball Association
analysis of the data collected and attempt to answer a series of questions that can
arise from the regulatory change.
Does it pose a great risk to those teams using it?
Statistically we can categorically answer: No.
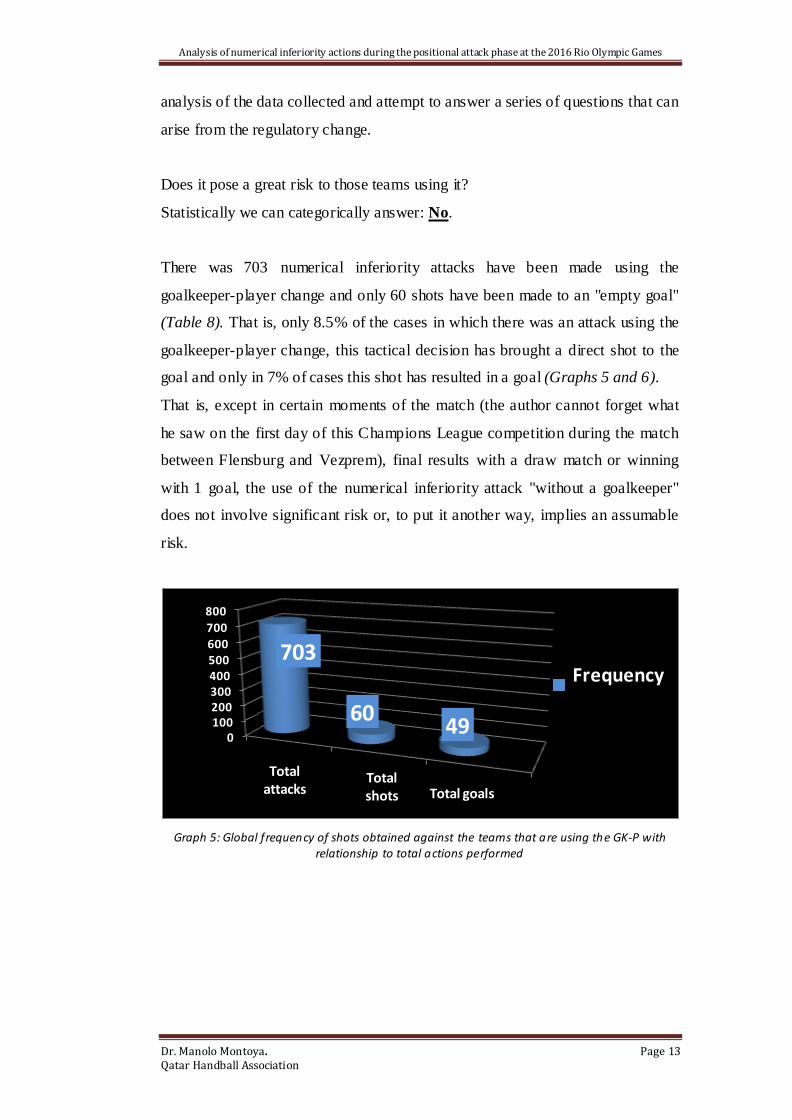
There was 703 numerical inferiority attacks have been made using the
goalkeeper-player change and only 60 shots have been made to an "empty goal"
(Table 8). That is, only 8.5% of the cases in which there was an attack using the
goalkeeper-player change, this tactical decision has brought a direct shot to the
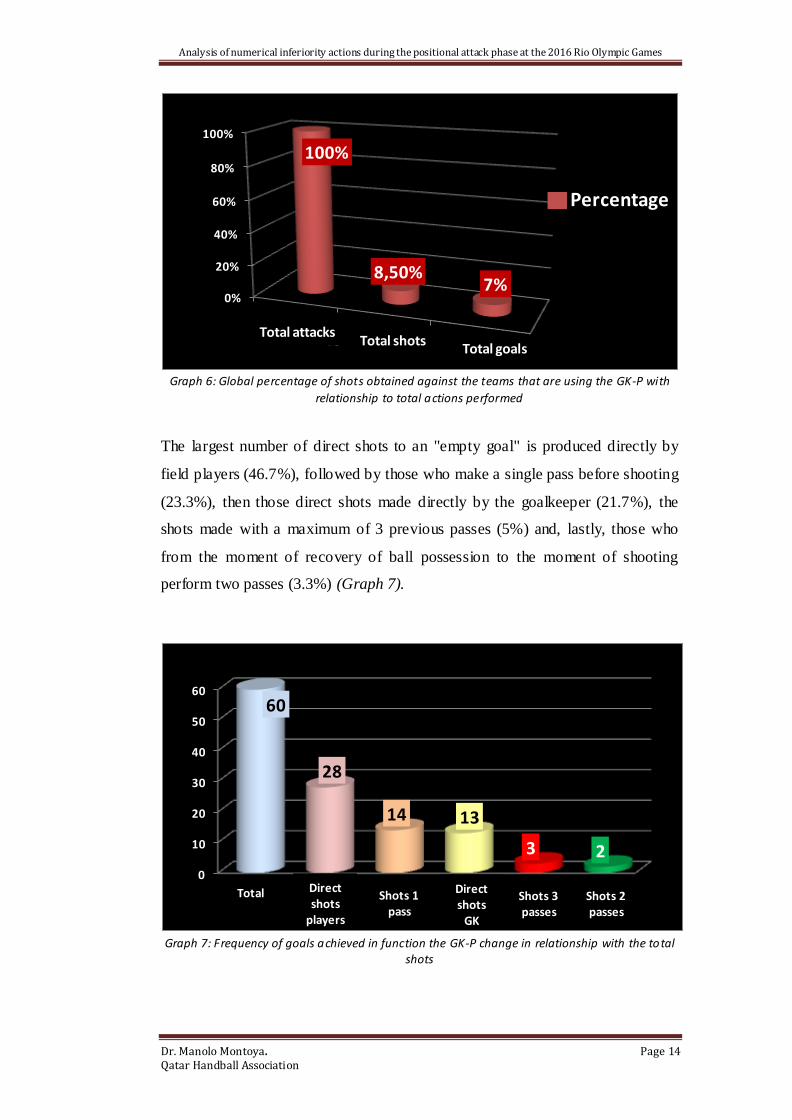
goal and only in 7% of cases this shot has resulted in a goal (Graphs 5 and 6).
That is, except in certain moments of the match (the author cannot forget what
he saw on the first day of this Champions League competition during the match
between Flensburg and Vezprem), final results with a draw match or winning
with 1 goal, the use of the numerical inferiority attack "without a goalkeeper"
does not involve significant risk or, to put it another way, implies an assumable
risk.
Graph 5: Global frequency of shots obtained against the teams that are using the GK-P with relationship to total actions performed
0 100 200 300 400 500 600
700
800
Total ataques Total
lanzamientos Total goles
703
60 49
Frequency
Total attacks Total goals
Total shots
Analysis of numerical inferiority actions during the positional attack phase at the 2016 Rio Olympic Games
Dr. Manolo Montoya. Page 14 Qatar Handball Association
Graph 6: Global percentage of shots obtained against the teams that are using the GK-P with
relationship to total actions performed
The largest number of direct shots to an "empty goal" is produced directly by
field players (46.7%), followed by those who make a single pass before shooting
(23.3%), then those direct shots made directly by the goalkeeper (21.7%), the
shots made with a maximum of 3 previous passes (5%) and, lastly, those who
from the moment of recovery of ball possession to the moment of shooting
perform two passes (3.3%) (Graph 7).
Graph 7: Frequency of goals achieved in function the GK-P change in relationship with the total
shots
0%
20%
40%
60%
80%
100%
Total ataques Total lanzamientos
Total goles
100%
8,50% 7%
Total attacks Total shots
Total goals
Percentage
0
10
20
30
40
50
60
60
28
14 13
3 2
Total Direct shots
players
Shots 1 pass
Direct shots
GK
Shots 3 passes
Shots 2 passes

Analysis of numerical inferiority actions during the positional attack phase at the 2016 Rio Olympic Games
Dr. Manolo Montoya. Page 15 Qatar Handball Association
The shots made without the opposite goalkeeper being in the goal mainly happen
when the attacking team makes a technical error (57.1%) and in the action
subsequent to the stationary shot (221.4%) (Table 7).
In terms of shots received and made (Graph 8), it is important to note the 14
made by the Polish team and the 13 received by the Slovenian team throughout
the championship. To further reinforce the idea of low risk that involves
attacking in an numerical inferiority situation without a goalkeeper, this figure
(maximum) of 13 shots received only represents 11.6% of the 112 attacks made
in numerical inferiority and in those that the mentioned team used the
goalkeeper-player change.
Graph 8: Goals by teams achieved in function of the use the change GK-P in relationship with
the total actions perfo rmed
We also point out in this section the possible consequences that the attack in
numerical inferiority -making the goalkeeper-player change- can involve
difficulties for the attacking team in terms of undoing the change and organising
at the moment when possession of the ball is lost and before the "fast" attacks
from the rival team, that is, facing situations of fast quick-off, direct fast break or
second wave fast break attacks. As in the case of shots to the empty goal, the
chances and percentages in which the opposing team scores a goal during any of
the fast break phases is extremely low (Graph 9). On the one hand, it
demonstrates the training of the teams so that the goalkeeper-player change and
defensive organisation is fast and effective, while, on the other hand, it reaffirms
that the risk of attacking without a goalkeeper and with numerical inferiority is
not high.
0
2
4
6
8
10
12
14
ARG BRA CRO DEN EGY FRA GER POL QAT SLO SWE TUN
1 2
6
4
0
5
9
7
2
13
9
2 3
9
5
3 4 4
6
14
4 5
2 1
Total shots recived Total shots perfomed

Analysis of numerical inferiority actions during the positional attack phase at the 2016 Rio Olympic Games
Dr. Manolo Montoya. Page 16 Qatar Handball Association
Graph 9: Frequency and percentage by teams of goals achieved using fast attack immediately after to lose the possession the teams that make change GK-P
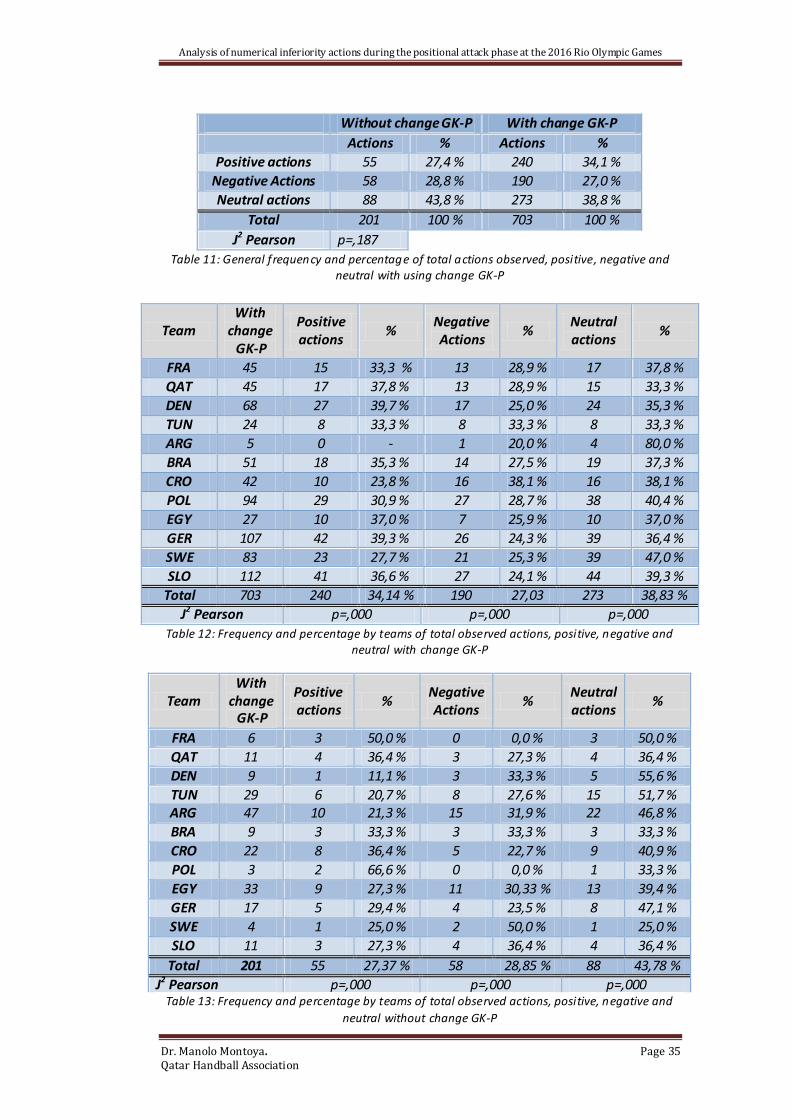
6.4 Result of the numerical inferiority actions
Of the categories designed and based on the final result of each recorded action,
three groups of actions have been drawn up: positives, negatives or neutrals. A
general calculation (Table 11) and another by team has been differentiated,
discriminating between those in which the teams opted to make the goalkeeper-
player change (Table 12) and in which the aforementioned change was not made
(Table 13).
“Positive actions” are the following categories registered within the criteria of
“Results of numerical inferiority action” (RSAI):
Goal achievement (GOL); goal achievement and exclusion (GOL+2’);
achievement of 7 mt. (C7M); achievement of 7 mt. and warning (C7MA);
achievement of 7 mt. and exclusion (C7M2); achievement of 7 mt. and
disqualification (C7MD): achievement of free throw and exclusion (CGF2) and
achievement of free throw and disqualification (CGFD).
“Negative actions” are the following categories registered within the criteria of
“Results of numerical inferiority action” (RSAI):
Regulatory mistake (ER); technical mistake without interception (ETSI):
technical mistake with interception (ETCI); saved shot (PRD); missed shot
(FUE); shot to the post (POS) and blocked shot (BLO) (provided that it involves
a definite loss of possession).
0
2
4
6
8
10
12
14
16
3 - 0,4 %
10 -1,42 %
16 - 2,27 %
Direct fast break Fast quick-off 2nd wawe fast break

Analysis of numerical inferiority actions during the positional attack phase at the 2016 Rio Olympic Games
Dr. Manolo Montoya. Page 17 Qatar Handball Association
“Neutral actions” are the following categories recorded within the criteria of
“Results of numerical inferiority action” (RSAI):
Achievement of free throw (CGF); achievement of free throw and warning;
(CGFA); recovery of player excluded from team observed (RCP_N); recovery of
player excluded from opposing team (RCP_N); blocked shot (BLO) (provided
that this does not involve a definite loss of possession) and others (Others)
From this grouping of variables, the results generally obtained (Table 11 and
Graph 10) indicate that these variables taken wholly do not present statistically
significant differences (p=0.187), whether or not the goalkeeper-player change
is used. Percentage-wise, we can confirm that when the goal-keeper change was
used, the positive actions are 6.77% greater, the negative actions 1.82% less and
4.95% less for the neutral actions when the aforementioned change was used
(Graph 10).
Therefore, if the increases of risk when implementing numerical inferiority
attacks without the goalkeeper only involves, as well have seen in the above
point, a minimum increase in risk in conceding a goal to the empty goal and
involves an almost 7% increase in positive actions, it is possible to argue that the
disciplinary sanctions that involving exclusion lose, if the modification to the
regulations is exploited, part of the disadvantage that they caused before the new
rules went into force.
Graph 10: General percentage using change GK-P in function of the result obtain
0,00%
5,00%
10,00%
15,00%
20,00%
25,00%
30,00%
35,00%
40,00%
45,00%
34,14%
27,03%
38,83%
27,37% 28,85%
43,78%
Positive actions
Negative actions
Neutral actions
WITH change
GK-P
WITHOUT
change GK-P

Analysis of numerical inferiority actions during the positional attack phase at the 2016 Rio Olympic Games
Dr. Manolo Montoya. Page 18 Qatar Handball Association
Our opinion as observers based on the data obtained can be justified according to
the belief that the attacks in which the goalkeeper-player change is not used, the
teams attempt to secure free throw situations in order to increase possession time
(neutral actions), risk little in their final attacks, which balances the errors in
each case (negative actions), and achieve fewer offensive successes (positive
actions) as a result of the previous circumstances
Therefore, after analysing the data obtained, we could say that there are no
excessive differences between teams in terms of positive actions with and
without the goalkeeper-player change (Graphs 11 and 12); that in terms of
negative actions, and with the exception of Argentina, there also are no
significant differences between teams, in the computation of neutral actions
where there is a greater percentage difference specifically for the teams of
Argentina, Egypt and Tunisia (those that are fewer use the goalkeeper-player
change). This circumstance could be attributed to the search by the team that
does not use the modification to the regulations to carry out positional attack
phases, which thorough the implementation of individual and collective actions
that lead to a free throw, to help maintenance of possession of the ball to a
greater extent, rather than achievement of a goal during the time in which the
team remains in an numerical inferiority situation.
Graph 11: Percentage by teams using the change GK-P in function of the result obtained
0%
10%
20%
30%
40%
50%
60%
70%
80%
90%
100%
FRA QAT DEN TUN ARG BRA CRO POL EGY GER SWE SLO
Acciones neutras Acciones negativas Acciones positivas Negative Actions Positive actions Neutral actions
Analysis of numerical inferiority actions during the positional attack phase at the 2016 Rio Olympic Games
Dr. Manolo Montoya. Page 19 Qatar Handball Association
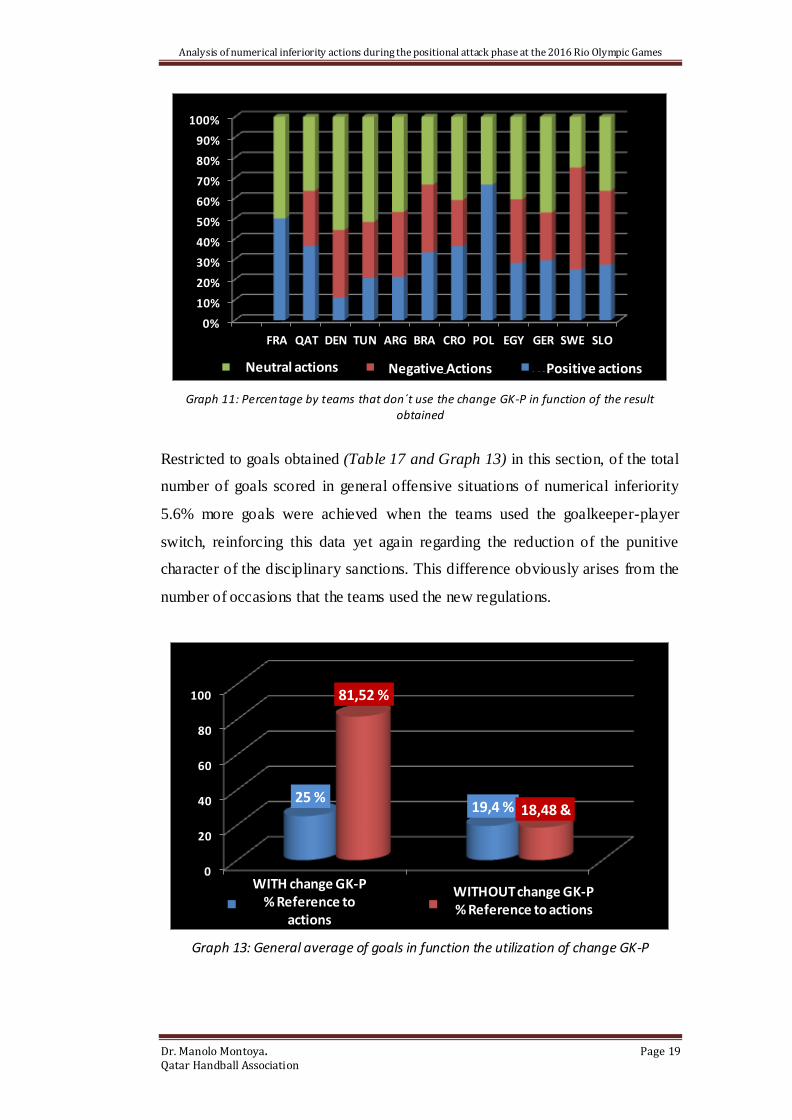
Graph 11: Percentage by teams that don´t use the change GK-P in function of the result obtained
Restricted to goals obtained (Table 17 and Graph 13) in this section, of the total
number of goals scored in general offensive situations of numerical inferiority
5.6% more goals were achieved when the teams used the goalkeeper-player
switch, reinforcing this data yet again regarding the reduction of the punitive
character of the disciplinary sanctions. This difference obviously arises from the
number of occasions that the teams used the new regulations.
Graph 13: General average of goals in function the utilization of change GK-P
0%
10%
20%
30%
40%
50%
60%
70%
80%
90%
100%
FRA QAT DEN TUN ARG BRA CRO POL EGY GER SWE SLO
Acciones neutras Acciones negativas Acciones positivas Negative Actions Positive actions Neutral actions
0
20
40
60
80
100
Con cambio Sin cambio
25 % 19,4 %
81,52 %
18,48 &
% Referencia acciones % Referencia a goles
WITH change GK-P % Reference to
actions
WITHOUT change GK-P % Reference to actions
Analysis of numerical inferiority actions during the positional attack phase at the 2016 Rio Olympic Games
Dr. Manolo Montoya. Page 20 Qatar Handball Association
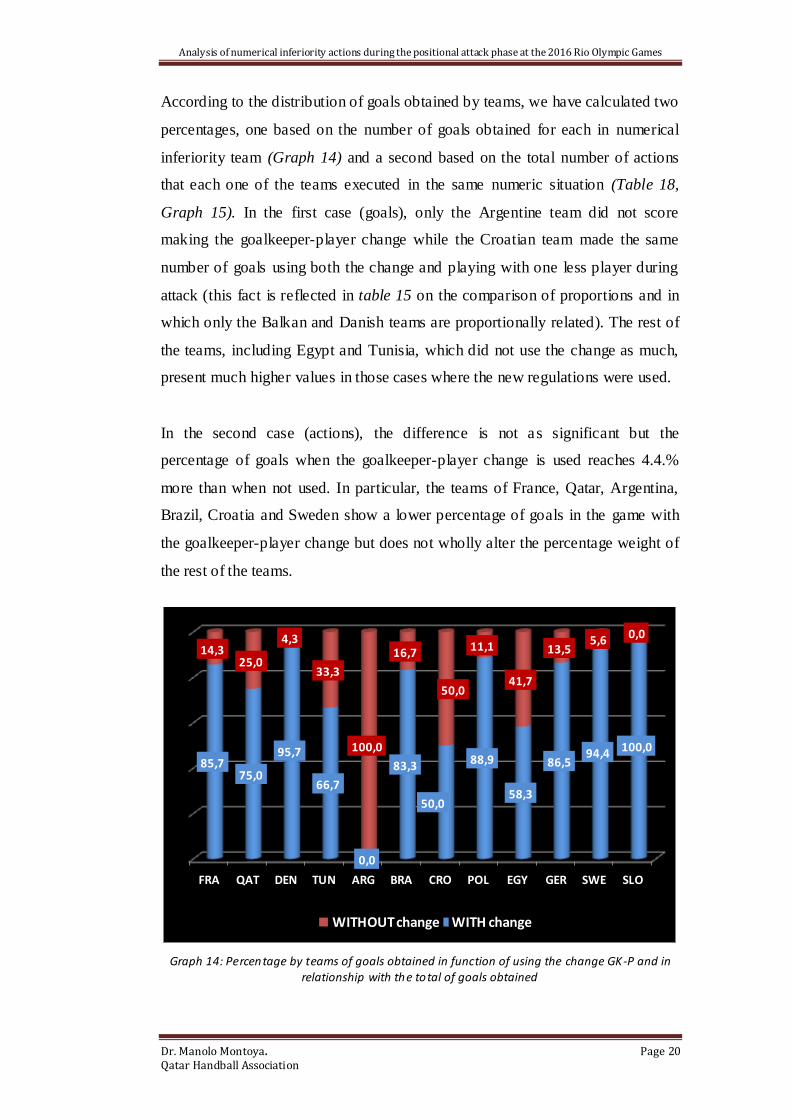
According to the distribution of goals obtained by teams, we have calculated two
percentages, one based on the number of goals obtained for each in numerical
inferiority team (Graph 14) and a second based on the total number of actions
that each one of the teams executed in the same numeric situation (Table 18,
Graph 15). In the first case (goals), only the Argentine team did not score
making the goalkeeper-player change while the Croatian team made the same
number of goals using both the change and playing with one less player during
attack (this fact is reflected in table 15 on the comparison of proportions and in
which only the Balkan and Danish teams are proportionally related). The rest of
the teams, including Egypt and Tunisia, which did not use the change as much,
present much higher values in those cases where the new regulations were used.
In the second case (actions), the difference is not as significant but the
percentage of goals when the goalkeeper-player change is used reaches 4.4.%
more than when not used. In particular, the teams of France, Qatar, Argentina,
Brazil, Croatia and Sweden show a lower percentage of goals in the game with
the goalkeeper-player change but does not wholly alter the percentage weight of
the rest of the teams.
Graph 14: Percentage by teams of goals obtained in function of using the change GK-P and in relationship with the total of goals obtained
FRA QAT DEN TUN ARG BRA CRO POL EGY GER SWE SLO
85,7 75,0
95,7
66,7
0,0
83,3
50,0
88,9
58,3
86,5 94,4 100,0
14,3 25,0
4,3
33,3
100,0
16,7
50,0
11,1
41,7
13,5 5,6 0,0
Sin cambio Con cambio WITHOUT change WITH change
Analysis of numerical inferiority actions during the positional attack phase at the 2016 Rio Olympic Games
Dr. Manolo Montoya. Page 21 Qatar Handball Association
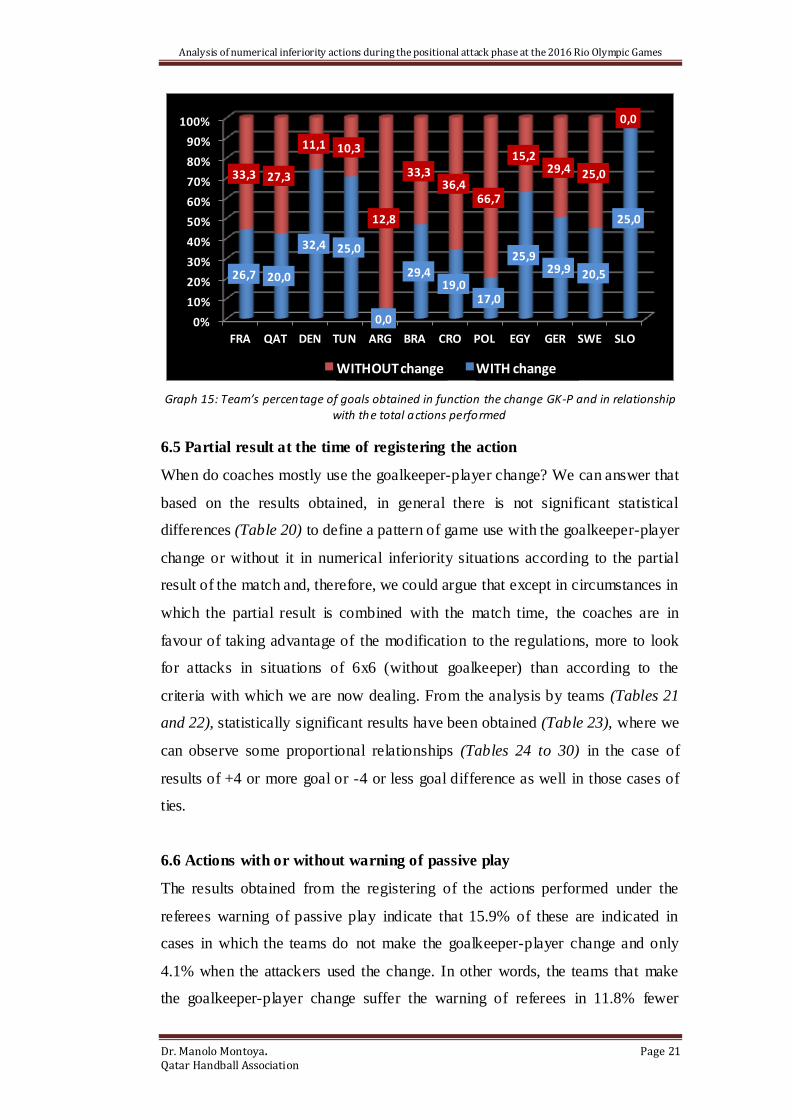
Graph 15: Team’s percentage of goals obtained in function the change GK-P and in relationship with the total actions performed
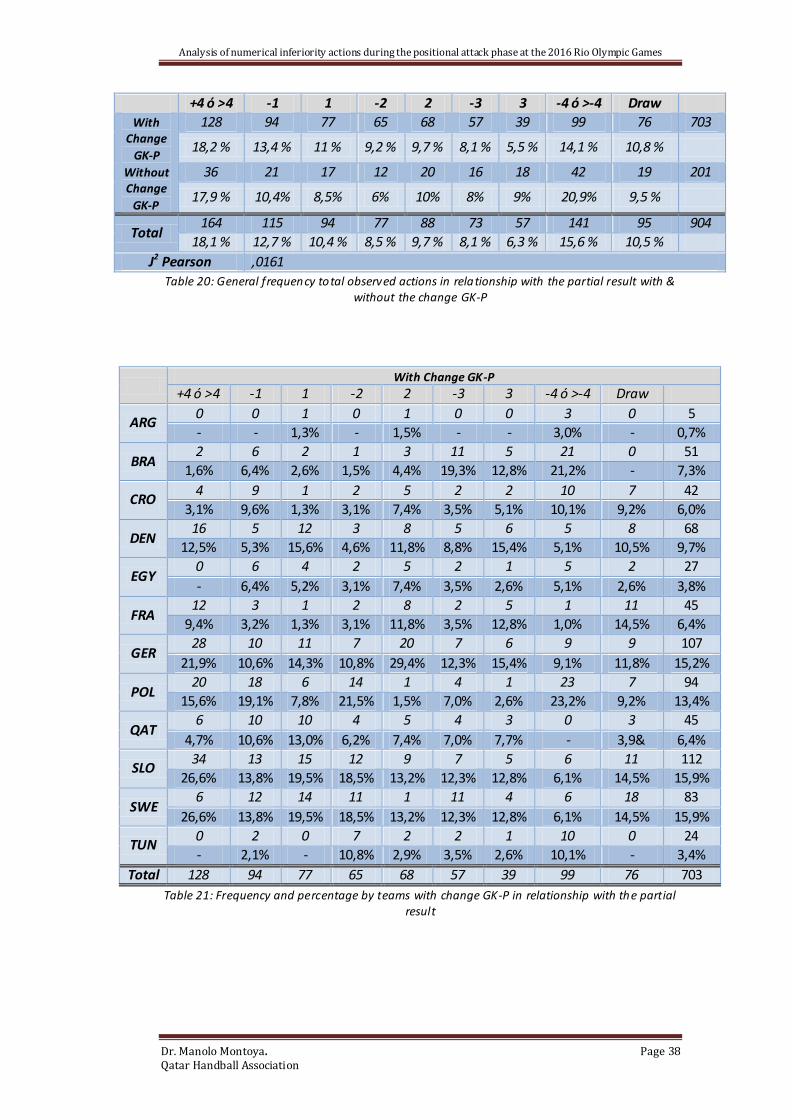
6.5 Partial result at the time of registering the action
When do coaches mostly use the goalkeeper-player change? We can answer that
based on the results obtained, in general there is not significant statistical
differences (Table 20) to define a pattern of game use with the goalkeeper-player
change or without it in numerical inferiority situations according to the partial
result of the match and, therefore, we could argue that except in circumstances in
which the partial result is combined with the match time, the coaches are in
favour of taking advantage of the modification to the regulations, more to look
for attacks in situations of 6x6 (without goalkeeper) than according to the
criteria with which we are now dealing. From the analysis by teams (Tables 21
and 22), statistically significant results have been obtained (Table 23), where we
can observe some proportional relationships (Tables 24 to 30) in the case of
results of +4 or more goal or -4 or less goal difference as well in those cases of
ties.
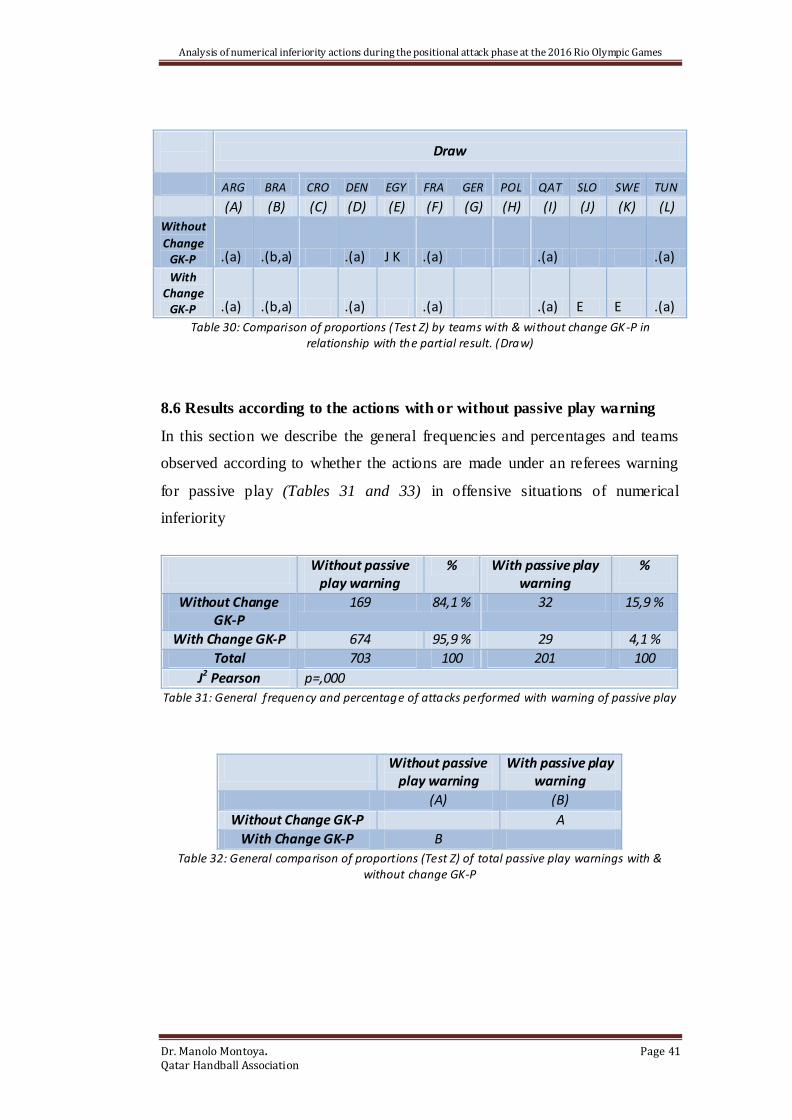
6.6 Actions with or without warning of passive play
The results obtained from the registering of the actions performed under the
referees warning of passive play indicate that 15.9% of these are indicated in
cases in which the teams do not make the goalkeeper-player change and only
4.1% when the attackers used the change. In other words, the teams that make
the goalkeeper-player change suffer the warning of referees in 11.8% fewer
0%
10%
20%
30%
40%
50%
60%
70%
80%
90%
100%
FRA QAT DEN TUN ARG BRA CRO POL EGY GER SWE SLO
26,7 20,0
32,4 25,0
0,0
29,4 19,0
17,0
25,9 29,9 20,5
25,0
33,3 27,3
11,1 10,3
12,8
33,3 36,4
66,7
15,2 29,4 25,0
0,0
Sin cambio Con cambio WITHOUT change WITH change

Analysis of numerical inferiority actions during the positional attack phase at the 2016 Rio Olympic Games
Dr. Manolo Montoya. Page 22 Qatar Handball Association
occasions than those who do not (Graph 15). Another piece of data to take into
account to demonstrate the advantages to the attacking in numerical inferiority
attacking team offered by the new regulations.
In view of the general proportionality tests, it can be stated that these
percentages are statistically significant. (Table 31)
Graf 15: Percentage by teams of goals obtained in function of the use the change GK-P & in relationship with total actions performed
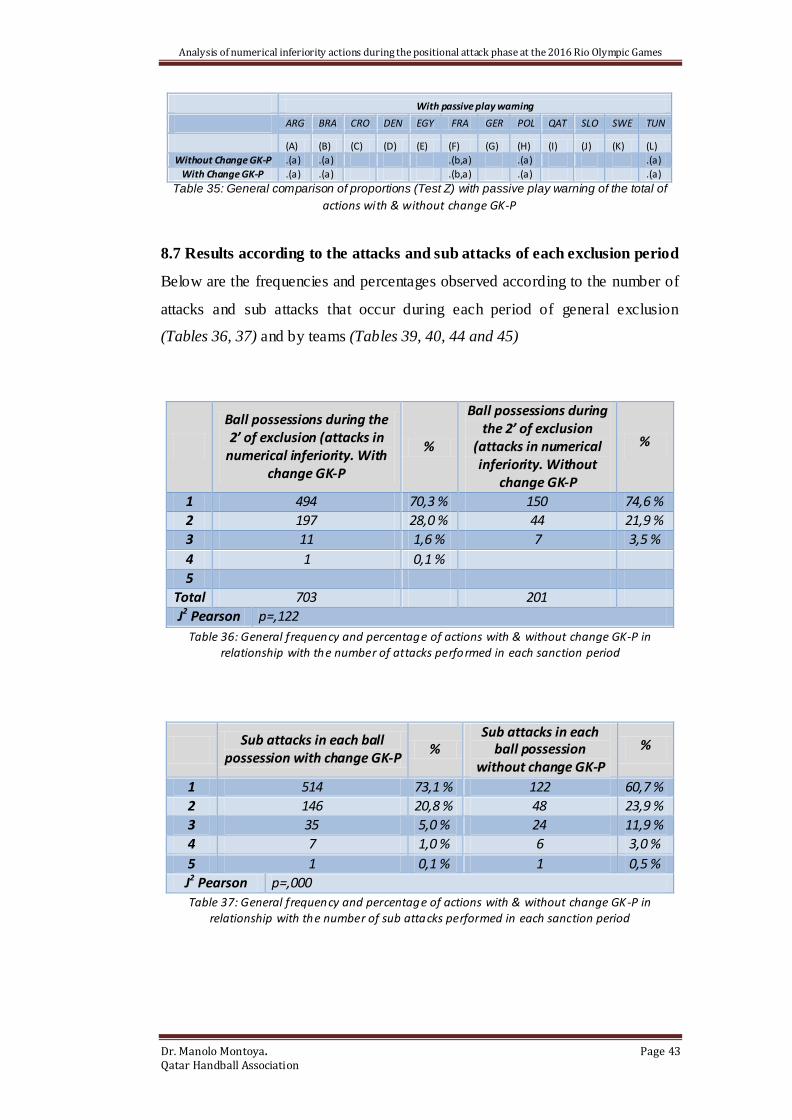
6.7 Attacks and sub attacks for each exclusion period
In this point, we analysed the data registered according to the number of attacks
and sub attacks that occur during each period of exclusion. (Tables 36, 37, 39
and 40). For clarification, the definitions of the terms attack and sub attack are
found below:
Attack:
Period from which the team in numerical inferiority (observed team) initiates
ball possession and until when it definitively loses possession of the ball
Example:
The goalkeeper save a ball and with intermediate actions in a positional
play, a player shot to the goal, either scoring or missing.
o Registered as “Attack 1 – Sub attack 1”
0
20
40
60
80
100
Sin aviso pasivo Con aviso pasivo
95,87%
4,13%
84,08%
15,92%
Con cambio P-JUG Sin cambio P-JUG WITHOUT change WITH change
WITHOUT passive warning WITH passive warning

Analysis of numerical inferiority actions during the positional attack phase at the 2016 Rio Olympic Games
Dr. Manolo Montoya. Page 23 Qatar Handball Association
If during the exclusion period the observed team performs a second similar
action (began with possession and final loss)
o Will be registered as “Attack 2 – Sub attack 1”
Sub attack:
Period from which the team in numerical inferiority (observed team) initiates
ball possession and until when it definitively loses possession of the ball or
when there is an action that temporarily interrupts the attack.
Example:
The goalkeeper save a ball and with intermediate actions in a positional play,
and a player has a free throw.
o Registered as “Attack 1 – Sub attack 1”
Play continues and after the free throw a player scores o shot out
o Registered as “Attack 1 – Sub attack 2” (and so on)
Once the concepts of attack and sub attack have been determined, we have
observed that there are no statistically significant differences between the
number of attacks that the team makes during the period that a disciplinary
sanction forces them to perform their action in numerical inferiority (Table 36
and Graph 16), with two attacks, at 98.3% (in the case of teams that make the
change) and 96.5% (in the case of teams that do not make it), the number of
occasions in which there is an attack in an outnumbered situation during the
period of exclusion.
Graph 16: Attacks percentage during the exclusion period
0,00%
10,00%
20,00%
30,00%
40,00%
50,00%
60,00%
70,00%
80,00%
1 2 3 4
70,30%
28%
1,60% 0,10%
74,60%
21,90%
3,50%
Con cambio P_JUG Sin Cambio P_JUG WITHOUT change WITH change
98,3%
96,5%

Analysis of numerical inferiority actions during the positional attack phase at the 2016 Rio Olympic Games
Dr. Manolo Montoya. Page 24 Qatar Handball Association
As for sub attacks, if differences can be established between the use of the
goalkeeper-player change. In the case of the teams that use it, in 73.1% of the
cases a sub attack is enough to complete the cycle of possession of each attack,
while the teams that do not use the change, this first sub attack only means
60.7%. If we add a second sub attack, the total number of teams that make the
change increases to 94% while those that do not amount to 84.6%, which is why
in 11.9% of instances, a third sub attack is added to complete the cycle of
possession (Table 37 and Graph 17)
Graph 17: Sub attack’s percentage in each attack
Therefore, interpretation of this data leads us to determine that the teams that do
not make the goalkeeper-player change attempt to slow their possession through
the pursuit of free throws in order to avoid more attacks in situations of
defensive inferiority, while the teams that use the change intend to carry out an
attack whose objective is more focused on obtaining a goal than allowing the
sanction time to be depleted.
6.8 Play system used by teams that make the goalkeeper-player change
With analysis of this situation, we intend to establish whether the teams that
make the goalkeeper-player change usually use some type of offensive system to
benefit both the attack and the change player-goalkeeper that they must do order
to facilitate a better and faster defensive organisation. In the cases of 6x6 and
0,00%
10,00%
20,00%
30,00%
40,00%
50,00%
60,00%
70,00%
80,00%
1 2 3 4 5
73,10%
21%
5,00% 1,00% 0,10%
60,70%
23,90%
11,90% 3,00% 0,50%
Con cambio P_JUG Sin Cambio P_JUG WITHOUT change WITH change

Analysis of numerical inferiority actions during the positional attack phase at the 2016 Rio Olympic Games
Dr. Manolo Montoya. Page 25 Qatar Handball Association
6x5 attack (in the latter case there are two teams with a player excluded and the
attacking team makes the goalkeeper-player change), we observe greater use of
traditional play with an offensive disposition 3:3, followed by the use of the
transformation of wings to second pivot and, finally, the actions of
transformation of the back court players to second pivot (Table 50).
We have kept from our analysis those systems that present a 2:3 and 3:2
arrangement (shown in table 50) when dealing with situation in which the teams
have two sanctioned players or other types of casuistry with low frequency.
(Graph 18)
Graph 18: Percentage of the systems used by teams that performed change GK-P in numerical
situation 6x6 & 6x5
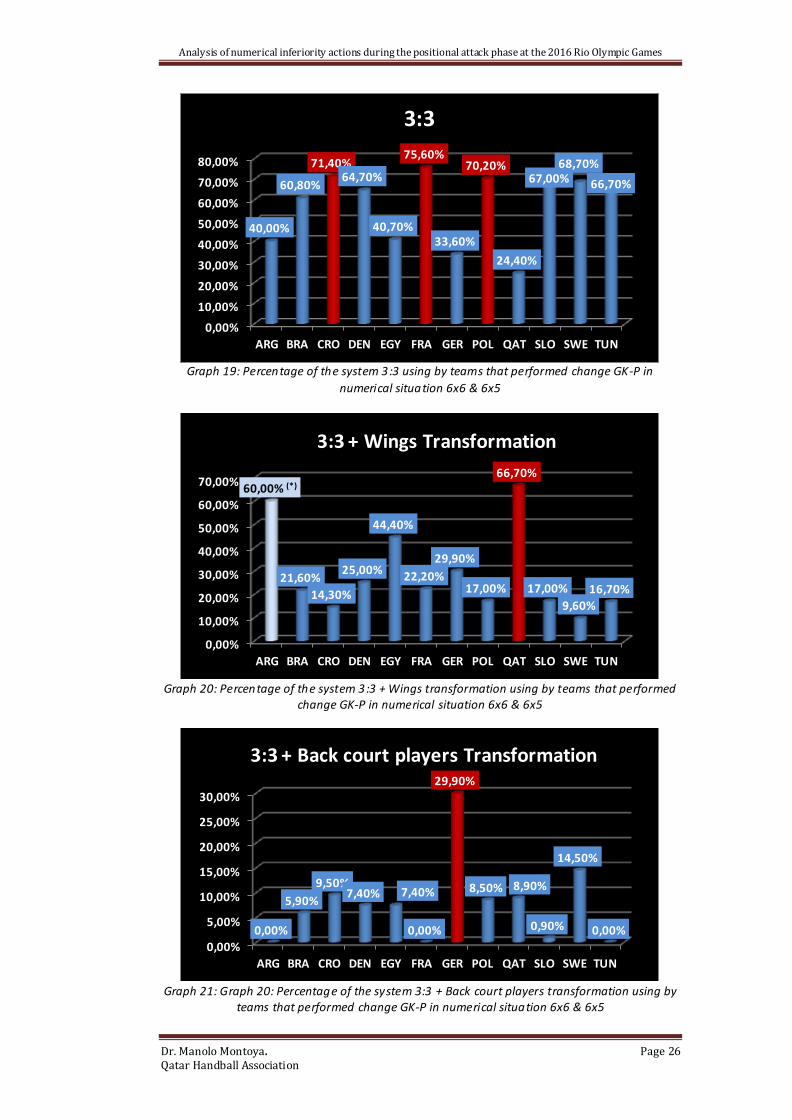
In terms of the preference for the systems used by the teams, the use of the 3:3
system is emphasized (>70%) by the national teams from Denmark, France and
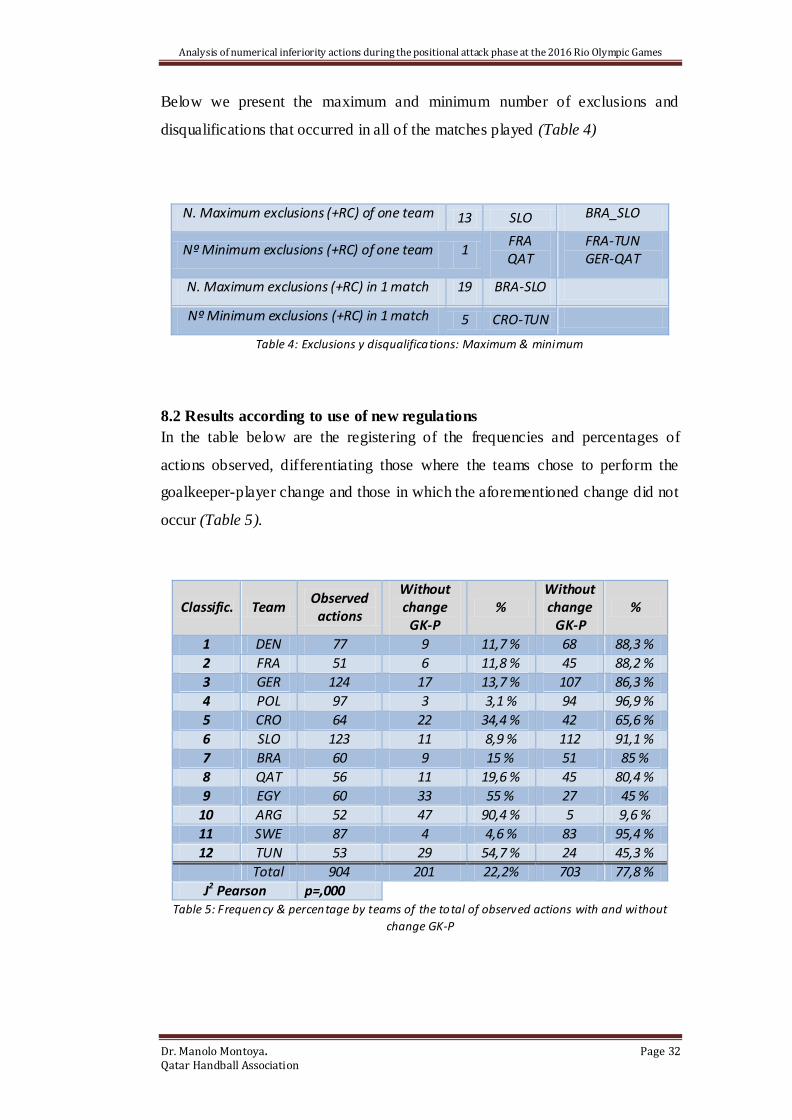
Poland (Graph 19); the transformation of wings to second pivot is led by Qatar
(66.7%) (the percentage of the Argentine team is 60% but the frequency is very
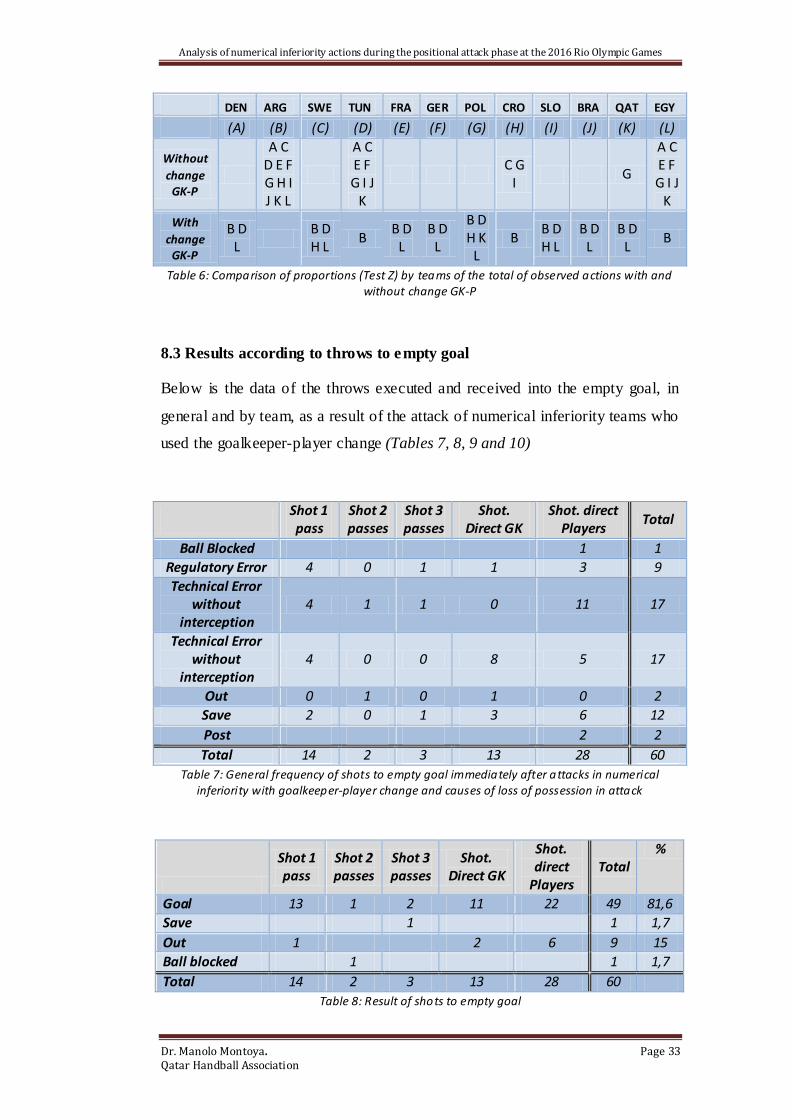
low therefore it cannot be taken into account too much) (Graph 20), while the
3:3 system with back court players transformation is mainly used by Germany
(29.9%).
0,00%
10,00%
20,00%
30,00%
40,00%
50,00%
60,00%
70,00%
3:3 3:3 + Tansf. Extremo
3:3 + Tranf 1a Línea
2:4 Pivots fijos
63,50%
4%
20,30%
12,20%
61,40%
27,80%
9,40% 1,40%
6x5 SP 6x6 SP
3:3 + Wings Transf
3:3 + 1st line p. Transf
2:4 Fix Pivots
6x5 Without GK 6x6 Without GK
Analysis of numerical inferiority actions during the positional attack phase at the 2016 Rio Olympic Games
Dr. Manolo Montoya. Page 26 Qatar Handball Association
Graph 19: Percentage of the system 3:3 using by teams that performed change GK-P in
numerical situation 6x6 & 6x5
Graph 20: Percentage of the system 3:3 + Wings transformation using by teams that performed
change GK-P in numerical situation 6x6 & 6x5
Graph 21: Graph 20: Percentage of the system 3:3 + Back court players transformation using by
teams that performed change GK-P in numerical situation 6x6 & 6x5
0,00%
10,00%
20,00%
30,00%
40,00%
50,00%
60,00%
70,00%
80,00%
ARG BRA CRO DEN EGY FRA GER POL QAT SLO SWE TUN
40,00%
60,80%
71,40% 64,70%
40,70%
75,60%
33,60%
70,20%
24,40%
67,00% 68,70%
66,70%
3:3
0,00%
10,00%
20,00%
30,00%
40,00%
50,00%
60,00%
70,00%
ARG BRA CRO DEN EGY FRA GER POL QAT SLO SWE TUN
60,00% (*)
21,60%
14,30%
25,00%
44,40%
22,20%
29,90%
17,00%
66,70%
17,00%
9,60%
16,70%
3:3 + Transf. Extremo 3:3 + Wings Transformation
0,00%
5,00%
10,00%
15,00%
20,00%
25,00%
30,00%
ARG BRA CRO DEN EGY FRA GER POL QAT SLO SWE TUN
0,00%
5,90%
9,50% 7,40% 7,40%
0,00%
29,90%
8,50% 8,90%
0,90%
14,50%
0,00%
3:3 + Transf 1a Línea 3:3 + Back court players Transformation

Analysis of numerical inferiority actions during the positional attack phase at the 2016 Rio Olympic Games
Dr. Manolo Montoya. Page 27 Qatar Handball Association
6.9 Finalization zone used
The finalization zones can be seen in the following graph (Graph 22)
Graph 22: Finalizations zones distribution’s
As seen (Table 55 and Graph 22), the percentages referring to shots zones do
not excessively differ whether or not the change of goalkeeper-player is used.
Graph 22: Percentage by zones of finalization
00
560 160
Z9
56 16
26 36 46
28 48 38
49 39
29
00
2,7%
8,2%
%
2,7%
14,7% 3,8%
19% 14,1%
8,7%
5,4% 4,3%
16,3%
%
5,3% 3,4%
5,9%
12,2%
4,4%
9,7%
21,1%
11,5%
10%
12,8%
3,7%
WITH Change GK-P WITHOUT change GK-P

Analysis of numerical inferiority actions during the positional attack phase at the 2016 Rio Olympic Games
Dr. Manolo Montoya. Page 28 Qatar Handball Association
Only a small percentage of inequality exists if we group the zones (Graph 23) so
that we wholly consider the shot zones in the wing, pivot and back court players.
In this case, we can underscore that in those teams in which the change is made,
the percentage in the shot zones of the wings increases 3.3% and in the
execution zone of the pivots (6 metre line) 4.8% at the expense of the shots of
the back court players, which logically decreases by 8.1%.
Obviously, the numerical inferiority play without a goalkeeper implies a
numerical situation of offensive-defensive equality that allows the game in width
(hence the increase in shooting percentage at the wings) and in depth (hence the
increase in spaces for play with pivot), which is difficult in 5x6 play situations
(without goalkeeper-player change) and that appears to tend to finish at a higher
percentage of back court players.
Graph 23: Distribution of percentage grouped by finalitation’s zones
As for the result by team (Tables 56 and 57), it is important to note that in the
situations where the teams use the goalkeeper-player change, the teams from
Denmark, Germany, Slovenia and Tunisia are above the average (8.7%) in
percentage of shots from the wings. Egypt, Germany, Poland and Slovenia have
higher values than the average (25.6%) in shots from the 6 metre line. Argentina,
WITH Change GK-P WITHOUT change GK-P
5,4%
%
20,8%
73,8%
8,7%
25,6%
65,7%

Analysis of numerical inferiority actions during the positional attack phase at the 2016 Rio Olympic Games
Dr. Manolo Montoya. Page 29 Qatar Handball Association
Brazil, Croatia, France, Qatar and Sweden surpass the average (65.7%) of the
shots made by back court players.
In the situations in which the goalkeeper-player change was not made, the
average of shots from the wings (5.40%) is surpassed by Argentina, Brazil,
Denmark, Germany, Qatar and Slovenia. Brazil, Egypt, France, Germany,
Poland and Qatar exceed the average (20.8%) in the 6 metre zone. And shots
made from the action area on the back court players come from the national
teams of Argentina, Croatia, Denmark, Slovenia, Sweden and Tunisia, topping
the average (73-8%).
7. CONCLUSIONS
The competition studied, the 2016 Olympic Games in Rio de Janeiro, the
number of disciplinary penalties that entail exclusion increased, in comparison to
the two previous Olympic competitions: Beijing 2008 and London 2012.
No relationship was found between the average of exclusions suffered by
each team in the matches played and the final ranking obtained
The goalkeeper-player change has been used mainly in the positional attack
phase in this competition, when the teams are in an offensive situation of
numerical inferiority.
In situations of numerical inferiority, the use of the goalkeeper-player change
results in an acceptable risk because of the small number of direct goals (to an
empty goal) that result.
The attacks immediately subsequent to the loss of possession by the team in
numerical inferiority in the form of a fast quick off, direct fast break or fast
break in second-wave pose low risk in terms of receiving a goal because of
possible defensive disorganisation caused by the necessary change of the
player by the goalkeeper.
The result of the actions in which the teams have made the goalkeeper-player
change, both in the so-called positive actions and exclusively limited to goals,
has resulted in a higher percentage, therefore the idea of a search for
offensive success is reinforced, which is the numeric relationship and
suitability of performing a substitution of a goalkeeper for a field player.

Analysis of numerical inferiority actions during the positional attack phase at the 2016 Rio Olympic Games
Dr. Manolo Montoya. Page 30 Qatar Handball Association
For the teams that did not make the goalkeeper-player change, the so-called
neutral actions were percentage-wise higher, since the willingness to perform
attacks, through the attainment of free throw, is lengthened in time to try to
reduce the number of defensive numerical inferiority actions.
There were not relationships between the use of the goalkeeper-player change
and the marker that was reflected at the moment when it was decided whether
or not to make the change.
The percentage of actions where there was warning of passive play to the
team that was attacking in a situation of numeric inferiority without making
the goalkeeper-player change was significantly higher than those teams who
made the change.
The number of attacks that the teams make in a situation of offensive
numerical inferiority in the positional phase during the exclusion period does
not present a significant percentage difference between the teams making the
goalkeeper-player change and those not making the change.
The teams that do not make the goalkeeper-player change in situations of
offensive numerical inferiority in the positional phase during the exclusion
period present a higher percentage of sub-attacks than those teams who make
the change.
The play systems used for the teams that make the goalkeeper-player change
are mostly 3:3, 3:3 with transformation of wings to double pivot and 3:3 with
transformation of back court players to double pivot.
The teams that make the goalkeeper-player change share better distribution
percentage-wise of the shot zones. The teams that do not make the change
present a greater percentage of shot centring on the central outer zones.
In light of these conclusions the author considers:
The use of the goalkeeper-player change in offensive situations of numerical
inferiority during the positional phase may be considered positive for the
teams that use it in that it offers more advantages than disadvantages.
The punishment reduction is at least questionable that those infracting teams
only suffer numerical inferiority in the defensive phase given that based on
the results, the risk of play without the goalkeeper during the offensive risk is
acceptable.

Analysis of numerical inferiority actions during the positional attack phase at the 2016 Rio Olympic Games
Dr. Manolo Montoya. Page 31 Qatar Handball Association
8. ANNEX
As we have explained in point 5 (Results), we have determined to show in point
8 (Annex) the results tables that have been obtained from the statist ical treatment
of the records collected. Our only interest is to offer the reader greater agility
when reading this study and to also offer, in the case that it interest him or her,
the possibility of reviewing the aforementioned data.
Clarifying note: As can be observed in some of the proportion comparison
tables, below there are some symbols, -.(a) y .(b), in which some of the variables
are not compared. This happens because the test used (test Z for variable
comparison) includes a series of conditions that in some cases are not fulfilled.
Their meaning is as follows:
.(a) This category is not used in comparisons because its column proportion is
equal to zero or one.
.(b) This category is not used in comparisons because the sum of case
considerations is less than two
In the cases where these symbols only appear within the comparison table, both
the size of the table and its interior will be reduced in size as it does not contain
valuable data.
8.1 Results of the number and average of exclusions by team
In this section the data regarding the total of exclusions and disqualifications
along with the average per match of each one of the participating teams in al of
the matches played at the 2016 Rio Olympic Games is reflected (Table 3)
Classific. Team Matches played
Number. exc+desq
Match aver. ( X )
2 FRA 8 23 2,88
8 QAT 6 23 3,83
1 DEN 8 33 4,13
12 TUN 5 21 4,2
10 ARG 5 22 4,4
7 BRA 6 26 4,33
5 CRO 6 26 4,33
4 POL 8 36 4,5 9 EGY 5 30 6
3 GER 6 54 6,75
11 SWE 5 34 6,8
6 SLO 6 51 8,5
Total 379 9,97 Table 3: Final classification, total exclusions, disqualifications & teams average by match .
Analysis of numerical inferiority actions during the positional attack phase at the 2016 Rio Olympic Games
Dr. Manolo Montoya. Page 32 Qatar Handball Association
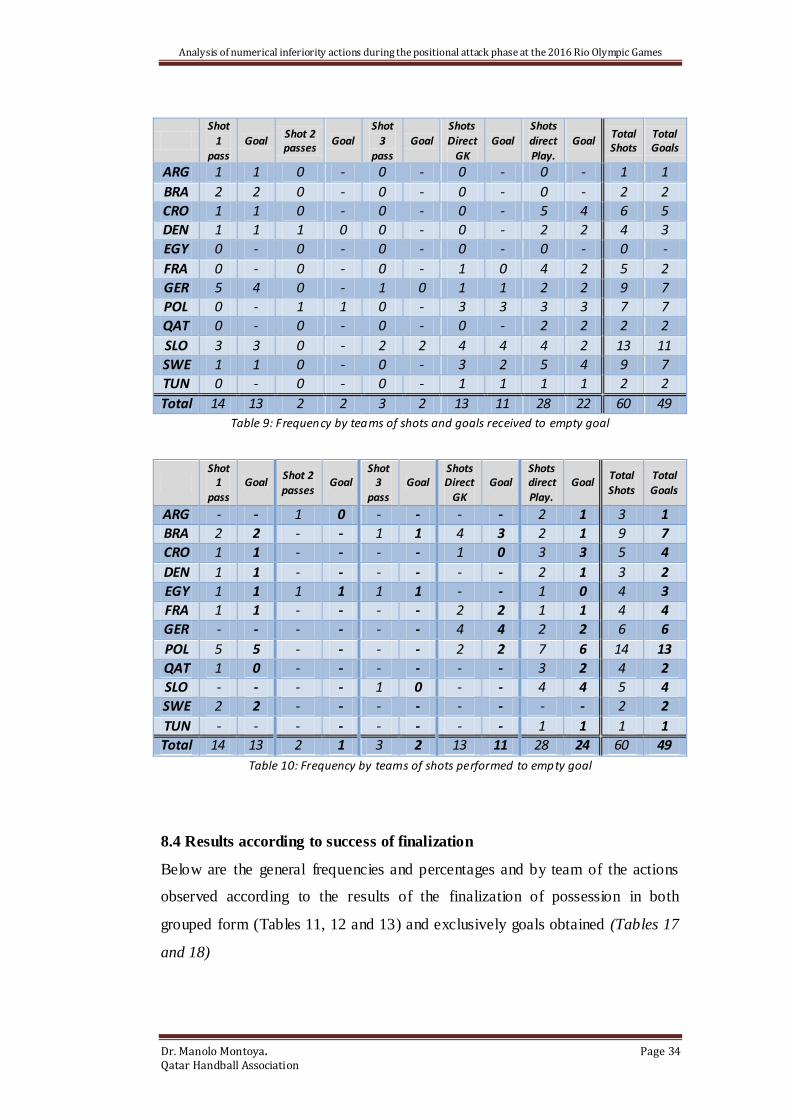
Below we present the maximum and minimum number of exclusions and
disqualifications that occurred in all of the matches played (Table 4)
N. Maximum exclusions (+RC) of one team 13 SLO BRA_SLO
Nº Minimum exclusions (+RC) of one team 1 FRA QAT
FRA-TUN GER-QAT
N. Maximum exclusions (+RC) in 1 match 19 BRA-SLO
Nº Minimum exclusions (+RC) in 1 match 5 CRO-TUN
Table 4: Exclusions y disqualifications: Maximum & minimum
8.2 Results according to use of new regulations
In the table below are the registering of the frequencies and percentages of
actions observed, differentiating those where the teams chose to perform the
goalkeeper-player change and those in which the aforementioned change did not
occur (Table 5).
Classific. Team Observed
actions
Without change
GK-P %
Without change
GK-P %
1 DEN 77 9 11,7 % 68 88,3 %
2 FRA 51 6 11,8 % 45 88,2 %
3 GER 124 17 13,7 % 107 86,3 %
4 POL 97 3 3,1 % 94 96,9 %
5 CRO 64 22 34,4 % 42 65,6 %
6 SLO 123 11 8,9 % 112 91,1 %
7 BRA 60 9 15 % 51 85 %
8 QAT 56 11 19,6 % 45 80,4 %
9 EGY 60 33 55 % 27 45 %
10 ARG 52 47 90,4 % 5 9,6 %
11 SWE 87 4 4,6 % 83 95,4 %
12 TUN 53 29 54,7 % 24 45,3 %
Total
904 201 22,2% 703 77,8 %
J2 Pearson j
p=,000 Table 5: Frequency & percentage by teams of the total of observed actions with and without
change GK-P
Analysis of numerical inferiority actions during the positional attack phase at the 2016 Rio Olympic Games
Dr. Manolo Montoya. Page 33 Qatar Handball Association
DEN ARG SWE TUN FRA GER POL CRO SLO BRA QAT EGY
(A) (B) (C) (D) (E) (F) (G) (H) (I) (J) (K) (L)
Without
change GK-P
A C D E F G H I J K L
A C E F G I J
K
C G
I G
A C E F G I J
K
With
change GK-P
B D L
B D H L
B B D
L B D
L
B D H K
L B
B D H L
B D L
B D L
B
Table 6: Comparison of proportions (Test Z) by teams of the total of observed actions with and without change GK-P
8.3 Results according to throws to empty goal
Below is the data of the throws executed and received into the empty goal, in
general and by team, as a result of the attack of numerical inferiority teams who
used the goalkeeper-player change (Tables 7, 8, 9 and 10)
Shot 1 pass
Shot 2 passes
Shot 3 passes
Shot. Direct GK
Shot. direct Players
Total
Ball Blocked 1 1
Regulatory Error 4 0 1 1 3 9
Technical Error without
interception 4 1 1 0 11 17
Technical Error without
interception 4 0 0 8 5 17
Out 0 1 0 1 0 2
Save 2 0 1 3 6 12
Post 2 2
Total 14 2 3 13 28 60
Table 7: General frequency of shots to empty goal immediately after attacks in numerical inferiority with goalkeeper-player change and causes of loss of possession in attack
Shot 1 pass
Shot 2 passes
Shot 3 passes
Shot. Direct GK
Shot. direct
Players Total
%
Goal 13 1 2 11 22 49 81,6
Save 1 1 1,7
Out 1 2 6 9 15
Ball blocked 1 1 1,7
Total 14 2 3 13 28 60
Table 8: Result of shots to empty goal
Analysis of numerical inferiority actions during the positional attack phase at the 2016 Rio Olympic Games
Dr. Manolo Montoya. Page 34 Qatar Handball Association
Shot
1 pass
Goal Shot 2 passes
Goal Shot
3 pass
Goal Shots Direct
GK Goal
Shots direct Play.
Goal Total Shots
Total Goals
ARG 1 1 0 - 0 - 0 - 0 - 1 1
BRA 2 2 0 - 0 - 0 - 0 - 2 2
CRO 1 1 0 - 0 - 0 - 5 4 6 5
DEN 1 1 1 0 0 - 0 - 2 2 4 3
EGY 0 - 0 - 0 - 0 - 0 - 0 -
FRA 0 - 0 - 0 - 1 0 4 2 5 2
GER 5 4 0 - 1 0 1 1 2 2 9 7
POL 0 - 1 1 0 - 3 3 3 3 7 7
QAT 0 - 0 - 0 - 0 - 2 2 2 2
SLO 3 3 0 - 2 2 4 4 4 2 13 11
SWE 1 1 0 - 0 - 3 2 5 4 9 7
TUN 0 - 0 - 0 - 1 1 1 1 2 2
Total 14 13 2 2 3 2 13 11 28 22 60 49
Table 9: Frequency by teams of shots and goals received to empty goal
Shot
1 pass
Goal Shot 2 passes
Goal Shot
3 pass
Goal Shots Direct
GK Goal
Shots direct Play.
Goal Total Shots
Total Goals
ARG - - 1 0 - - - - 2 1 3 1
BRA 2 2 - - 1 1 4 3 2 1 9 7
CRO 1 1 - - - - 1 0 3 3 5 4
DEN 1 1 - - - - - - 2 1 3 2
EGY 1 1 1 1 1 1 - - 1 0 4 3
FRA 1 1 - - - - 2 2 1 1 4 4
GER - - - - - - 4 4 2 2 6 6
POL 5 5 - - - - 2 2 7 6 14 13
QAT 1 0 - - - - - - 3 2 4 2
SLO - - - - 1 0 - - 4 4 5 4
SWE 2 2 - - - - - - - - 2 2
TUN - - - - - - - - 1 1 1 1
Total 14 13 2 1 3 2 13 11 28 24 60 49
Table 10: Frequency by teams of shots performed to empty goal
8.4 Results according to success of finalization
Below are the general frequencies and percentages and by team of the actions
observed according to the results of the finalization of possession in both
grouped form (Tables 11, 12 and 13) and exclusively goals obtained (Tables 17
and 18)
Analysis of numerical inferiority actions during the positional attack phase at the 2016 Rio Olympic Games
Dr. Manolo Montoya. Page 35 Qatar Handball Association
Without change GK-P With change GK-P
Actions % Actions %
Positive actions 55 27,4 % 240 34,1 %
Negative Actions 58 28,8 % 190 27,0 %
Neutral actions 88 43,8 % 273 38,8 %
Total 201 100 % 703 100 %
J2 Pearson p=,187
Table 11: General frequency and percentage of total actions observed, positive, negative and neutral with using change GK-P
Team With
change GK-P
Positive actions
% Negative Actions
% Neutral actions
%
FRA 45 15 33,3 % 13 28,9 % 17 37,8 %
QAT 45 17 37,8 % 13 28,9 % 15 33,3 %
DEN 68 27 39,7 % 17 25,0 % 24 35,3 %
TUN 24 8 33,3 % 8 33,3 % 8 33,3 %
ARG 5 0 - 1 20,0 % 4 80,0 %
BRA 51 18 35,3 % 14 27,5 % 19 37,3 %
CRO 42 10 23,8 % 16 38,1 % 16 38,1 %
POL 94 29 30,9 % 27 28,7 % 38 40,4 %
EGY 27 10 37,0 % 7 25,9 % 10 37,0 %
GER 107 42 39,3 % 26 24,3 % 39 36,4 %
SWE 83 23 27,7 % 21 25,3 % 39 47,0 %
SLO 112 41 36,6 % 27 24,1 % 44 39,3 %
Total 703 240 34,14 % 190 27,03%
273 38,83 %
J2 Pearson p=,000 p=,000 p=,000
Table 12: Frequency and percentage by teams of total observed actions, positive, negative and neutral with change GK-P
Team With
change GK-P
Positive actions
% Negative Actions
% Neutral actions
%
FRA 6 3 50,0 % 0 0,0 % 3 50,0 %
QAT 11 4 36,4 % 3 27,3 % 4 36,4 %
DEN 9 1 11,1 % 3 33,3 % 5 55,6 %
TUN 29 6 20,7 % 8 27,6 % 15 51,7 % ARG 47 10 21,3 % 15 31,9 % 22 46,8 %
BRA 9 3 33,3 % 3 33,3 % 3 33,3 %
CRO 22 8 36,4 % 5 22,7 % 9 40,9 %
POL 3 2 66,6 % 0 0,0 % 1 33,3 %
EGY 33 9 27,3 % 11 30,33 % 13 39,4 %
GER 17 5 29,4 % 4 23,5 % 8 47,1 %
SWE 4 1 25,0 % 2 50,0 % 1 25,0 %
SLO 11 3 27,3 % 4 36,4 % 4 36,4 %
Total 201 55 27,37 % %
58 28,85 % 88 43,78 %
J2 Pearson p=,000 p=,000 p=,000 Table 13: Frequency and percentage by teams of total observed actions, positive, negative and
neutral without change GK-P

Analysis of numerical inferiority actions during the positional attack phase at the 2016 Rio Olympic Games
Dr. Manolo Montoya. Page 36 Qatar Handball Association
Positive actions ARG BRA CRO DEN EGY FRA GER POL QAT SLO SWE TUN (A) (B) (C) (D) (E) (F) (G) (H) (I) (J) (K) (L)
Without Change .(a) D J
D H J K
With Change .(a) C E E C E E
Table 14: Comparison of proportions (Test Z) by teams of total positive actions with and without change GK-P
Negative actions ARG BRA CRO DEN EGY FRA GER POL QAT SLO SWE TUN (A) (B) (C) (D) (E) (F) (G) (H) (I) (J) (K) (L)
Without Change
B C D G I J K
G J K .(a) .(a)
With Change A A A .(a) A E .(a) A A E A E
Table 15: Comparison of proportions (Test Z) by teams of total negative actions with and without change GK-P
Neutral actions ARG BRA CRO DEN EGY FRA GER POL QAT SLO SWE TUN (A) (B) (C) (D) (E) (F) (G) (H) (I) (J) (K) (L)
Without Change
GK-P
B C D F G H I J K
H K G H J K
B D G H J K
With Change
GK-P A L A A L A
A E L
A C E L
A A E
L A C E L
Table 16: Comparison of proportions (Test Z) by teams of total neutral actions with and without
change GK-P
With Change GK-P Without Change
GK-P
Tot Goals Goals % Goals %
Goals 211 172 81,5 % 39 18,5 %
Total 211 172 81,5 % 39 18,5 %
Table 17: General frequency and percentage of total goals with & without using change GK -P

Analysis of numerical inferiority actions during the positional attack phase at the 2016 Rio Olympic Games
Dr. Manolo Montoya. Page 37 Qatar Handball Association
With Change GK-P Without Change GK-P
Team Total goals
inferior.
Total actions inferior.
Goals
% Goals
(Reference total
actions)
% Goals
(Reference total goals
Total actions inferior.
Goals
% Goals
(Reference total
actions)
% Goals
(Reference total goals
FRA 14 45 12 26,7 % 85,7 % 6 2 33,3 % 14,3 %
QAT 12 45 9 20,0 % 75,0 % 11 3 27,3 % 25,0 %
DEN 23 68 22 32,4 % 95,7 % 9 1 11,1 % 4,3 %
TUN 9 24 6 25,0 % 66,7 % 29 3 10,3 % 33,3 %
ARG 6 5 0 - - 47 6 12,8 % 100,0 %
BRA 18 51 15 29,4 % 83,3 % 9 3 33,3 % 16,7 % CRO 16 42 8 19,0 % 50,0 % 22 8 36,4 % 50,0 %
POL 18 94 16 17,0 % 88,9 % 3 2 66,7 % 11,1 %
EGY 12 27 7 25,9 % 58,3 % 33 5 15,2 % 41,7 %
GER 37 107 32 29,9 % 86,5 % 17 5 29,4 % 13,5 %
SWE 18 83 17 20,5 % 94,4 % 4 1 25,0 % 5,6 %
SLO 28 112 28 25,0 % 100,0 % 11 0 - -
Total 211 703 172 25,0 % 81,52%
201 39 29,4 % 18,48 %
J2 Pearson p=,000 Table 18: Frequency & percentage by teams total observed actions that finalize in goal with &
without using the change GK-P
Goals ARG BRA CRO DEN EGY FRA GER POL QAT SLO SWE TUN (A) (B) (C) (D) (E) (F) (G) (H) (I) (J) (K) (L)
Without Change
GK-P - D -
With Change
GK-P - C -
Table 19: Comparison of proportions (Test Z) by teams of goals with & without change GK-P
8.5 Results according to the partial scoreboard during the action
Below are the general frequencies and percentages and by team of the actions in
which the teams use and do not use the new regulations according to the team
goal difference during the positional attack phase reflected in the scoreboard
(Tables 20, 21 and 22)
Analysis of numerical inferiority actions during the positional attack phase at the 2016 Rio Olympic Games
Dr. Manolo Montoya. Page 38 Qatar Handball Association
+4 ó >4 -1 1 -2 2 -3 3 -4 ó >-4 Draw
With Change
GK-P
128 94 77 65 68 57 39 99 76 703
18,2 % 13,4 % 11 % 9,2 % 9,7 % 8,1 % 5,5 % 14,1 % 10,8 %
Without Change
GK-P
36 21 17 12 20 16 18 42 19 201
17,9 % 10,4% 8,5% 6% 10% 8% 9% 20,9% 9,5 %
Total 164 115 94 77 88 73 57 141 95 904
18,1 % 12,7 % 10,4 % 8,5 % 9,7 % 8,1 % 6,3 % 15,6 % 10,5 %
J2 Pearson ,0161
Table 20: General frequency total observed actions in relationship with the partial result with & without the change GK-P
With Change GK-P
+4 ó >4 -1 1 -2 2 -3 3 -4 ó >-4 Draw
ARG 0 0 1 0 1 0 0 3 0 5
- - 1,3% - 1,5% - - 3,0% - 0,7%
BRA 2 6 2 1 3 11 5 21 0 51
1,6% 6,4% 2,6% 1,5% 4,4% 19,3% 12,8% 21,2% - 7,3%
CRO 4 9 1 2 5 2 2 10 7 42
3,1% 9,6% 1,3% 3,1% 7,4% 3,5% 5,1% 10,1% 9,2% 6,0%
DEN 16 5 12 3 8 5 6 5 8 68
12,5% 5,3% 15,6% 4,6% 11,8% 8,8% 15,4% 5,1% 10,5% 9,7%
EGY 0 6 4 2 5 2 1 5 2 27
- 6,4% 5,2% 3,1% 7,4% 3,5% 2,6% 5,1% 2,6% 3,8%
FRA 12 3 1 2 8 2 5 1 11 45
9,4% 3,2% 1,3% 3,1% 11,8% 3,5% 12,8% 1,0% 14,5% 6,4%
GER 28 10 11 7 20 7 6 9 9 107
21,9% 10,6% 14,3% 10,8% 29,4% 12,3% 15,4% 9,1% 11,8% 15,2%
POL 20 18 6 14 1 4 1 23 7 94
15,6% 19,1% 7,8% 21,5% 1,5% 7,0% 2,6% 23,2% 9,2% 13,4%
QAT 6 10 10 4 5 4 3 0 3 45
4,7% 10,6% 13,0% 6,2% 7,4% 7,0% 7,7% - 3,9& 6,4%
SLO 34 13 15 12 9 7 5 6 11 112
26,6% 13,8% 19,5% 18,5% 13,2% 12,3% 12,8% 6,1% 14,5% 15,9%
SWE 6 12 14 11 1 11 4 6 18 83
26,6% 13,8% 19,5% 18,5% 13,2% 12,3% 12,8% 6,1% 14,5% 15,9%
TUN 0 2 0 7 2 2 1 10 0 24
- 2,1% - 10,8% 2,9% 3,5% 2,6% 10,1% - 3,4%
Total 128 94 77 65 68 57 39 99 76 703
Table 21: Frequency and percentage by teams with change GK-P in relationship with the partial result

Analysis of numerical inferiority actions during the positional attack phase at the 2016 Rio Olympic Games
Dr. Manolo Montoya. Page 39 Qatar Handball Association
Without Change GK-P +4 ó >4 -1 1 -2 2 -3 3 -4 ó >-4 Draw
ARG 5 4 2 2 3 9 3 17 2 47
13,9% 19,0% 11,8% 16,7% 15,0% 56,3% 16,7% 40,5% 10,5% 23,4%
BRA 4 0 1 0 1 1 1 1 0 9
11,1% - 5,9% - 5,0% 6,3% 5,6% 2,4% - 4,5%
CRO 12 2 1 1 2 0 1 1 2 22
33,3% 9,5% 5,9% 8,3% 10,0% - 5,6% 2,4% 10,5% 10,9%
DEN 3 2 2 0 0 0 2 0 0 9
8,3% 9,5% 11,8% - - - 11,1% - - 4,5%
EGY 0 5 4 2 4 3 0 9 6 33
- 23,8% 23,5% 16,7% 20,0% 18,8% - 21,4% 31,6% 16,4%
FRA 4 0 0 0 2 0 0 0 0 6
11,1% - - - 10,0% - - - - 3,0%
GER 1 4 0 2 3 1 4 0 2 17
2,8% 19,0% - 16,7% 15,0% 6,3% 22,2% - 10,5% 8,5%
POL 0 0 0 0 0 0 0 2 1 3
- - - - - - - 4,8% 5,3% 1,5%
QAT 2 1 3 0 1 0 4 0 0 11
5,6% 4,8% 17,6% - 5,0% - 22,2% - - 5,5%
SLO 3 1 2 0 0 0 2 2 1 11
8,3% 4,8% 11,8% - - - 11,1% 4,8% 5,3% 5,5
SWE 1 0 0 0 0 0 0 0 3 4
2,8% - - - - - - - 15,8% 2,0
TUN 1 2 2 5 4 2 1 10 2 29
2,8% 9,5% 11,8% 41,7% 20,0% 12,5% 5,6% 23,8% 10,5% 14,4%
Total 36 21 17 12 20 16 18 42 19 201
Table 21: Frequency and percentage by teams without change GK-P in relationship with the partial result.
+4 ó >4 -1 1 -2 2 -3 3 -4 ó >-4 Draw
J2 Pearson ,000 ,000 ,002 ,001 ,022 ,000 ,176 ,000 ,000
Table 23: J2 Pearson values of actions with & without change GK-P in relationship with the
partial result
+4 ó >4
ARG BRA CRO DEN EGY FRA GER POL QAT SLO SWE TUN (A) (B) (C) (D) (E) (F) (G) (H) (I) (J) (K) (L)
Without Change GK-P .(a) G J
D G J .(b,a) .(a) .(b,a)
With Change GK-P .(a) C .(b,a) B C .(a) B C .(b,a)
Table 24: Comparison of proportions (Test Z) by teams with & without change GK-P in relationship with the partial result (+4 ó >4).

Analysis of numerical inferiority actions during the positional attack phase at the 2016 Rio Olympic Games
Dr. Manolo Montoya. Page 40 Qatar Handball Association
-1
ARG BRA CRO DEN EGY FRA GER POL QAT SLO SWE TUN
(A) (B) (C) (D) (E) (F) (G) (H) (I) (J) (K) (L)
Without Change GK-P .(a) .(a) .(a) .(a) .(a)
With Change GK-P .(a) .(a) .(a) .(a) .(a)
Table 25: Comparison of proportions (Test Z) by teams with & without change GK-P in relationship with the partial result (-1)
1
ARG BRA CRO DEN EGY FRA GER POL QAT SLO SWE TUN
(A) (B) (C) (D) (E) (F) (G) (H) (I) (J) (K) (L)
Without Change GK-P .(b,a) .(a) .(a) .(a) .(a)
With Change GK-P .(b,a) .(a) .(a) .(a) .(a)
Table 26: Comparison of proportions (Test Z) by teams with & without change GK-P in relationship with the partial result. (1)
-2
ARG BRA CRO DEN EGY FRA GER POL QAT SLO SWE TUN
(A) (B) (C) (D) (E) (F) (G) (H) (I) (J) (K) (L)
Without Change GK-P .(a) .(b,a) .(a) .(a) .(a) .(a) .(a) .(a)
With Change GK-P .(a) .(b,a) .(a) .(a) .(a) .(a) .(a) .(a)
Table 27: Comparison of proportions (Test Z) by teams with & without change GK-P in relationship with the partial result. (-2)
-3
ARG BRA CRO DEN EGY FRA GER POL QAT SLO SWE TUN
(A) (B) (C) (D) (E) (F) (G) (H) (I) (J) (K) (L)
Without Change GK-P .(a) .(a) .(a) .(a) .(a) .(a) .(a) .(a)
With Change GK-P .(a) .(a) .(a) .(a) .(a) .(a) .(a) .(a)
Table 28: Comparison of proportions (Test Z) by teams with & without change GK-P in relationship with the partial result.(-3)
-4 ó >-4
ARG BRA CRO DEN EGY FRA GER POL QAT SLO SWE TUN (A) (B) (C) (D) (E) (F) (G) (H) (I) (J) (K) (L)
Without Change
GK-P
B C H J .(a) B H .(b,a) .(a) .(b,a) .(a) B H
With Change
GK-P A E L A .(a) .(b,a) .(a)
A E L .(b,a) A .(a)
Table 29: Comparison of proportions (Test Z) by teams with & without change GK-P in relationship with the partial result. (-4 ó >-4))
Analysis of numerical inferiority actions during the positional attack phase at the 2016 Rio Olympic Games
Dr. Manolo Montoya. Page 41 Qatar Handball Association
Draw
ARG BRA CRO DEN EGY FRA GER POL QAT SLO SWE TUN
(A) (B) (C) (D) (E) (F) (G) (H) (I) (J) (K) (L)
Without
Change GK-P .(a) .(b,a) .(a) J K .(a) .(a) .(a)
With Change
GK-P .(a) .(b,a) .(a) .(a) .(a) E E .(a)
Table 30: Comparison of proportions (Test Z) by teams with & without change GK-P in relationship with the partial result. (Draw)
8.6 Results according to the actions with or without passive play warning
In this section we describe the general frequencies and percentages and teams
observed according to whether the actions are made under an referees warning
for passive play (Tables 31 and 33) in offensive situations of numerical
inferiority
Without passive play warning
% With passive play warning
%
Without Change GK-P
169 84,1 % 32 15,9 %
With Change GK-P 674 95,9 % 29 4,1 %
Total 703 100 201 100
J2 Pearson p=,000
Table 31: General frequency and percentage of attacks performed with warning of passive play
Without passive play warning
With passive play warning
(A) (B)
Without Change GK-P A
With Change GK-P B
Table 32: General comparison of proportions (Test Z) of total passive play warnings with & without change GK-P
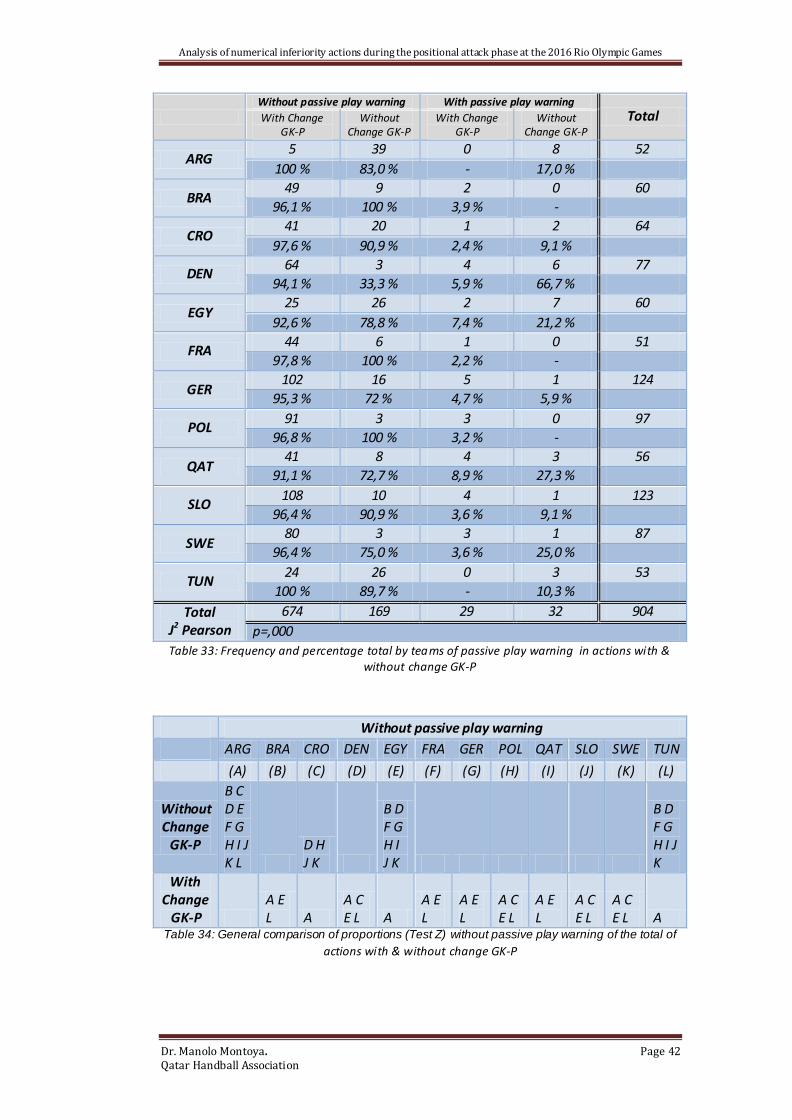
Analysis of numerical inferiority actions during the positional attack phase at the 2016 Rio Olympic Games
Dr. Manolo Montoya. Page 42 Qatar Handball Association
Without passive play warning With passive play warning
Total With Change GK-P
Without Change GK-P
With Change GK-P
Without Change GK-P
ARG 5 39 0 8 52
100 % 83,0 % - 17,0 %
BRA 49 9 2 0 60
96,1 % 100 % 3,9 % -
CRO 41 20 1 2 64
97,6 % 90,9 % 2,4 % 9,1 %
DEN 64 3 4 6 77
94,1 % 33,3 % 5,9 % 66,7 %
EGY 25 26 2 7 60
92,6 % 78,8 % 7,4 % 21,2 %
FRA 44 6 1 0 51
97,8 % 100 % 2,2 % -
GER 102 16 5 1 124
95,3 % 72 % 4,7 % 5,9 %
POL 91 3 3 0 97
96,8 % 100 % 3,2 % -
QAT 41 8 4 3 56
91,1 % 72,7 % 8,9 % 27,3 %
SLO 108 10 4 1 123
96,4 % 90,9 % 3,6 % 9,1 %
SWE 80 3 3 1 87
96,4 % 75,0 % 3,6 % 25,0 %
TUN 24 26 0 3 53
100 % 89,7 % - 10,3 %
Total J2 Pearson
674 169 29 32 904
p=,000
Table 33: Frequency and percentage total by teams of passive play warning in actions with & without change GK-P
Without passive play warning ARG BRA CRO DEN EGY FRA GER POL QAT SLO SWE TUN (A) (B) (C) (D) (E) (F) (G) (H) (I) (J) (K) (L)
Without Change
GK-P
B C D E F G H I J K L
D H J K
B D F G H I J K
B D F G H I J K
With Change
GK-P A E L A
A C E L A
A E L
A E L
A C E L
A E L
A C E L
A C E L A
Table 34: General comparison of proportions (Test Z) without passive play warning of the total of
actions with & without change GK-P
Analysis of numerical inferiority actions during the positional attack phase at the 2016 Rio Olympic Games
Dr. Manolo Montoya. Page 43 Qatar Handball Association
With passive play warning
ARG BRA CRO DEN EGY FRA GER POL QAT SLO SWE TUN
(A) (B) (C) (D) (E) (F) (G) (H) (I) (J) (K) (L)
Without Change GK-P .(a) .(a) .(b,a) .(a) .(a)
With Change GK-P .(a) .(a) .(b,a) .(a) .(a)
Table 35: General comparison of proportions (Test Z) with passive play warning of the total of
actions with & without change GK-P
8.7 Results according to the attacks and sub attacks of each exclusion period
Below are the frequencies and percentages observed according to the number of
attacks and sub attacks that occur during each period of general exclusion
(Tables 36, 37) and by teams (Tables 39, 40, 44 and 45)
Ball possessions during the 2’ of exclusion (attacks in
numerical inferiority. With change GK-P
%
Ball possessions during the 2’ of exclusion
(attacks in numerical inferiority. Without
change GK-P
%
1 494 70,3 % 150 74,6 %
2 197 28,0 % 44 21,9 %
3 11 1,6 % 7 3,5 %
4 1 0,1 %
5
Total 703 201
J2 Pearson p=,122
Table 36: General frequency and percentage of actions with & without change GK-P in relationship with the number of attacks performed in each sanction period
Sub attacks in each ball possession with change GK-P
% Sub attacks in each
ball possession without change GK-P
%
1 514 73,1 % 122 60,7 %
2 146 20,8 % 48 23,9 %
3 35 5,0 % 24 11,9 %
4 7 1,0 % 6 3,0 %
5 1 0,1 % 1 0,5 %
J2 Pearson p=,000
Table 37: General frequency and percentage of actions with & without change GK-P in relationship with the number of sub attacks performed in each sanction period

Analysis of numerical inferiority actions during the positional attack phase at the 2016 Rio Olympic Games
Dr. Manolo Montoya. Page 44 Qatar Handball Association
Sub attacks
1 2 3 4 5
(A) (B) (C) (D) (E)
Without changes A
With changes C
Table 38: General comparison of proportions (Test Z) of the total of observed actions with & without change GK-P in relationship of the number of sub attacks performed in each sanction
period.
NAI 1 NAI 2 NAI 3 NAI 4
Total Fr. % Fr. % Fr. % Fr. %
ARG 4 80,0 % 1 20,0 % 0 - 0 - 5
BRA 35 68,6 % 16 31,4 % 0 - 0 - 51
CRO 31 73,8 % 9 21,4 % 2 4,8 % 0 - 42
DEN 45 66,2 % 23 33,8 % 0 - 0 - 68
EGY 22 81,5 % 4 14,8 % 1 3,7 % 0 - 27
FRA 30 66,7 % 14 31,1 % 1 2,2 % 0 - 45
GER 73 68,2 % 33 30,8 % 1 0,9 % 0 - 107
POL 70 74,5 % 22 23,4 % 2 2,1 % 0 - 94
QAT 31 68,9 % 14 31,1 % 0 - 0 - 45
SLO 77 68,8 % 34 30,4 % 1 0,9 % 0 - 112
SWE 57 68,7 % 22 26,5 % 3 3,6 % 1 1,2 % 83
TUN 19 79,2 % 5 20,8 % 0 - 0 - 24
Total 494 70,3 % 197 28,0 % 11 1,6 % 1 0,1 % 703
Table 39: Frequency and percentage by teams in actions with change GK-P in relationship with
the number of sub attacks performed in each sanction period
NAI 1 NAI 2 NAI 3
Total Fr. % Fr. % Fr. %
ARG 42 89,4 % 5 10,6 % 0 - 1
BRA 5 55,6 % 3 33,3 % 1 11,1 % 47
CRO 11 50,0 % 10 45,4 % 1 4,55 % 9
DEN 8 88,9 % 1 11,1 % 0 - 22
EGY 25 75,8 % 5 15,2 % 3 9,1 % 9
FRA 3 50,0 % 3 50,0 % 0 - 33
GER 15 88,2 % 2 11,8 % 0 - 6
POL 2 66,7 % 1 33,3 % 0 - 17
QAT 8 72,7 % 3 27,3 % 0 - 3
SLO 6 54,5 % 4 36,4 % 1 9,1 % 11
SWE 2 50,0 % 1 25,0 % 1 25,0 % 11
TUN 23 79,3 % 6 20,7 % 0 - 4
Total 150 74,6 44 21,9 % 7 3,5 % 201
Table 40: Frequency and percentage by teams in actions without change GK-P in relationship with the number of sub attacks performed in each sanction period
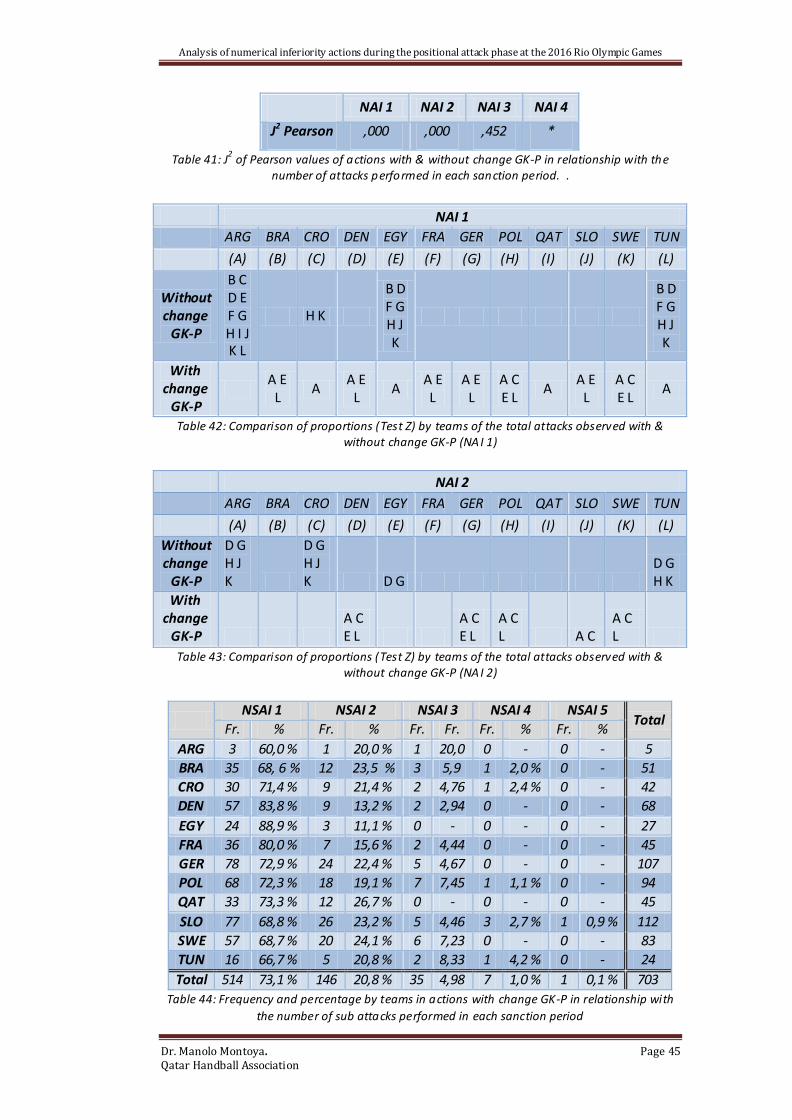
Analysis of numerical inferiority actions during the positional attack phase at the 2016 Rio Olympic Games
Dr. Manolo Montoya. Page 45 Qatar Handball Association
NAI 1 NAI 2 NAI 3 NAI 4
J2 Pearson ,000 ,000 ,452 *
Table 41: J2 of Pearson values of actions with & without change GK-P in relationship with the
number of attacks performed in each sanction period. .
NAI 1 ARG BRA CRO DEN EGY FRA GER POL QAT SLO SWE TUN (A) (B) (C) (D) (E) (F) (G) (H) (I) (J) (K) (L)
Without change
GK-P
B C D E F G H I J K L
H K
B D F G H J K
B D F G H J K
With change
GK-P
A E L
A A E
L A
A E L
A E L
A C E L
A A E
L A C E L
A
Table 42: Comparison of proportions (Test Z) by teams of the total attacks observed with & without change GK-P (NAI 1)
NAI 2 ARG BRA CRO DEN EGY FRA GER POL QAT SLO SWE TUN (A) (B) (C) (D) (E) (F) (G) (H) (I) (J) (K) (L)
Without change
GK-P
D G H J K
D G H J K D G
D G H K
With change
GK-P A C E L
A C E L
A C L A C
A C L
Table 43: Comparison of proportions (Test Z) by teams of the total attacks observed with & without change GK-P (NAI 2)
NSAI 1 NSAI 2 NSAI 3 NSAI 4 NSAI 5
Total Fr. % Fr. % Fr. Fr. Fr. % Fr. %
ARG 3 60,0 % 1 20,0 % 1 20,0 0 - 0 - 5
BRA 35 68, 6 % 12 23,5 % 3 5,9 1 2,0 % 0 - 51
CRO 30 71,4 % 9 21,4 % 2 4,76 1 2,4 % 0 - 42
DEN 57 83,8 % 9 13,2 % 2 2,94 0 - 0 - 68
EGY 24 88,9 % 3 11,1 % 0 - 0 - 0 - 27
FRA 36 80,0 % 7 15,6 % 2 4,44 0 - 0 - 45
GER 78 72,9 % 24 22,4 % 5 4,67 0 - 0 - 107
POL 68 72,3 % 18 19,1 % 7 7,45 1 1,1 % 0 - 94
QAT 33 73,3 % 12 26,7 % 0 - 0 - 0 - 45
SLO 77 68,8 % 26 23,2 % 5 4,46 3 2,7 % 1 0,9 % 112
SWE 57 68,7 % 20 24,1 % 6 7,23 0 - 0 - 83
TUN 16 66,7 % 5 20,8 % 2 8,33 1 4,2 % 0 - 24
Total 514 73,1 % 146 20,8 % 35 4,98 7 1,0 % 1 0,1 % 703
Table 44: Frequency and percentage by teams in actions with change GK-P in relationship with
the number of sub attacks performed in each sanction period
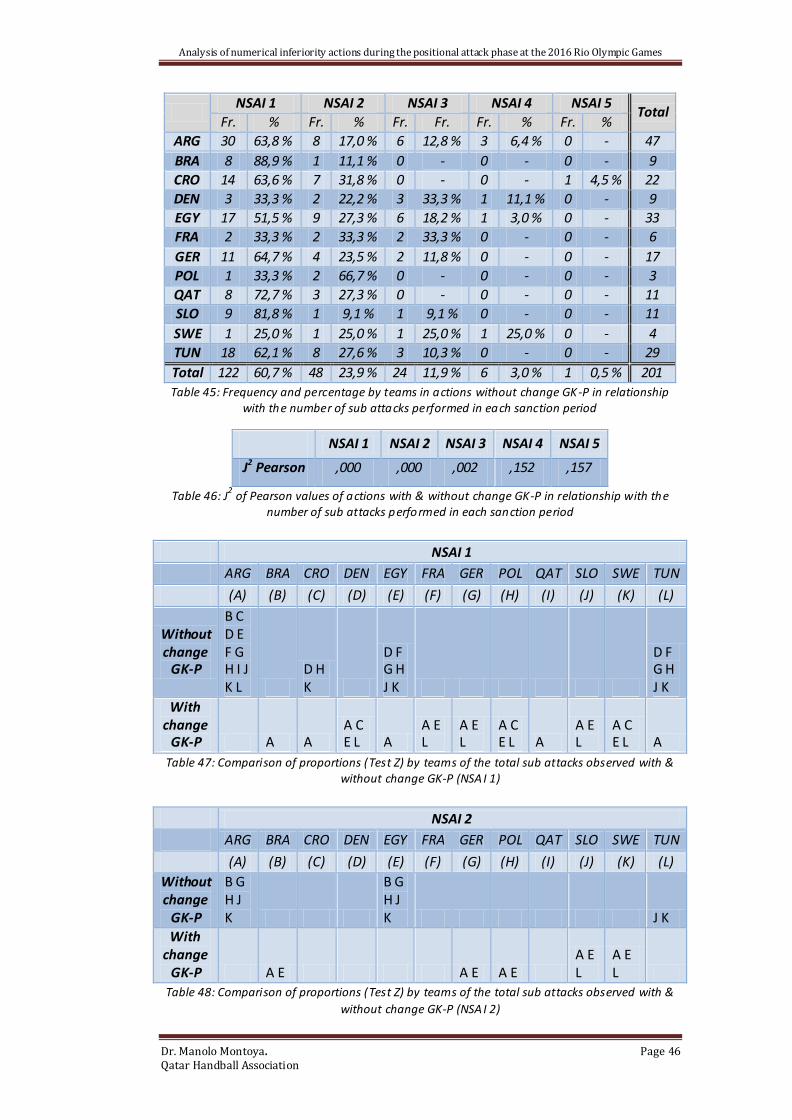
Analysis of numerical inferiority actions during the positional attack phase at the 2016 Rio Olympic Games
Dr. Manolo Montoya. Page 46 Qatar Handball Association
NSAI 1 NSAI 2 NSAI 3 NSAI 4 NSAI 5
Total Fr. % Fr. % Fr. Fr. Fr. % Fr. %
ARG 30 63,8 % 8 17,0 % 6 12,8 % 3 6,4 % 0 - 47
BRA 8 88,9 % 1 11,1 % 0 - 0 - 0 - 9
CRO 14 63,6 % 7 31,8 % 0 - 0 - 1 4,5 % 22
DEN 3 33,3 % 2 22,2 % 3 33,3 % 1 11,1 % 0 - 9
EGY 17 51,5 % 9 27,3 % 6 18,2 % 1 3,0 % 0 - 33
FRA 2 33,3 % 2 33,3 % 2 33,3 % 0 - 0 - 6
GER 11 64,7 % 4 23,5 % 2 11,8 % 0 - 0 - 17
POL 1 33,3 % 2 66,7 % 0 - 0 - 0 - 3
QAT 8 72,7 % 3 27,3 % 0 - 0 - 0 - 11
SLO 9 81,8 % 1 9,1 % 1 9,1 % 0 - 0 - 11
SWE 1 25,0 % 1 25,0 % 1 25,0 % 1 25,0 % 0 - 4
TUN 18 62,1 % 8 27,6 % 3 10,3 % 0 - 0 - 29
Total 122 60,7 % 48 23,9 % 24 11,9 % 6 3,0 % 1 0,5 % 201
Table 45: Frequency and percentage by teams in actions without change GK-P in relationship with the number of sub attacks performed in each sanction period
NSAI 1 NSAI 2 NSAI 3 NSAI 4 NSAI 5
J2 Pearson ,000 ,000 ,002 ,152 ,157
Table 46: J2 of Pearson values of actions with & without change GK-P in relationship with the
number of sub attacks performed in each sanction period
NSAI 1 ARG BRA CRO DEN EGY FRA GER POL QAT SLO SWE TUN (A) (B) (C) (D) (E) (F) (G) (H) (I) (J) (K) (L)
Without change
GK-P
B C D E F G H I J K L
D H K
D F G H J K
D F G H J K
With change
GK-P A A A C E L A
A E L
A E L
A C E L A
A E L
A C E L A
Table 47: Comparison of proportions (Test Z) by teams of the total sub attacks observed with & without change GK-P (NSAI 1)
NSAI 2 ARG BRA CRO DEN EGY FRA GER POL QAT SLO SWE TUN (A) (B) (C) (D) (E) (F) (G) (H) (I) (J) (K) (L)
Without change
GK-P
B G H J K
B G H J K J K
With change
GK-P A E A E A E A E L
A E L
Table 48: Comparison of proportions (Test Z) by teams of the total sub attacks observed with &
without change GK-P (NSAI 2)

Analysis of numerical inferiority actions during the positional attack phase at the 2016 Rio Olympic Games
Dr. Manolo Montoya. Page 47 Qatar Handball Association
NSAI 3
ARG BRA CRO DEN EGY FRA GER POL QAT SLO SWE TUN
(A) (B) (C) (D) (E) (F) (G) (H) (I) (J) (K) (L)
Without change GK-P .(a) .(a) .(a) .(a)
With change GK-P .(a) .(a) .(a) .(a)
Table 49: Comparison of proportions (Test Z) by teams of the total sub attacks observed with &
without change GK-P (NSAI 3)
8.8 Results according to the play system used by the teams in numerical
inferiority that make the change GK-P
In this section we describe the frequencies and percentages observed according
to the offensive arrangement that the teams adapt in offensive situations of
numerical inferiority that use the goalkeeper-player change in the positional
attack phase (Tables 50 and 52)
2:3 3:2 4:2 3:3 3:3 +
Transf. Wings
3:3+ Transf Back court
players
2:4 Fix Pivots
TOT
5x5 SP 0 4 0 0 0 0 0 4
5X6SP 1 24 0 0 0 0 0 24
6x4SP 0 0 0 1 0 0 0 1
6x5 SP 0 0 0 47 3 15 9 76
6x6 SP 0 0 5 365 165 56 8 597
Total 1 28 5 413 168 71 17 703
% 0,14% 3,98 % 0,71 % 58,75 % 23,90% 10,1% 2,42%
J2 Pearson p=,000
Table 50: General frequency and percentage in actions with change GK-P in relationship with the play systems used
2:2 2:3 2:4 Fix Pivots
3:2 3:3 3:3 +
Transf. Wing
3:3+ Transf Back court
players 4:2
(A) (B) (C) (D) (E) (F) (G) (H)
Without change GK-P
E F E F .(a) E F .(a) .(a)
With change GK-P
.(a) A B D A B D .(a) .(a)
Table 51: General comparison of proportions (Test Z) in actions with & without change GK-P in relationship with the play systems used
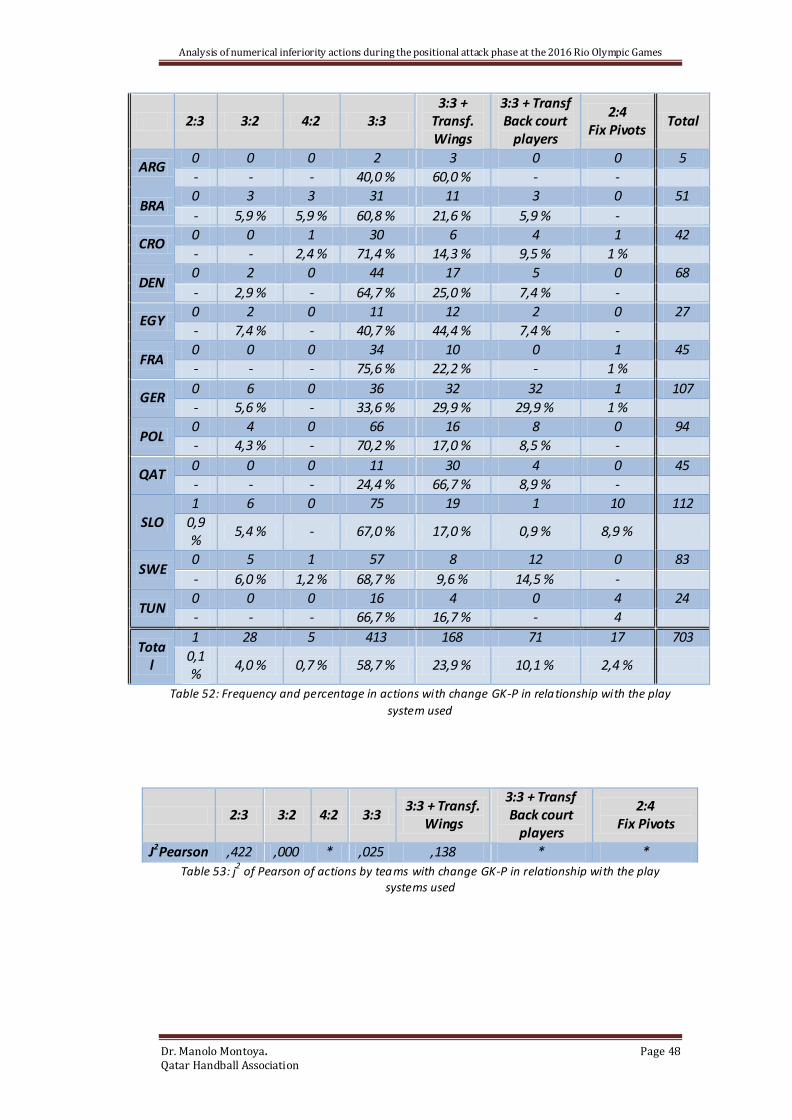
Analysis of numerical inferiority actions during the positional attack phase at the 2016 Rio Olympic Games
Dr. Manolo Montoya. Page 48 Qatar Handball Association
2:3 3:2 4:2 3:3 3:3 +
Transf. Wings
3:3 + Transf Back court
players
2:4 Fix Pivots
Total
ARG 0 0 0 2 3 0 0 5
- - - 40,0 % 60,0 % - -
BRA 0 3 3 31 11 3 0 51
- 5,9 % 5,9 % 60,8 % 21,6 % 5,9 % -
CRO 0 0 1 30 6 4 1 42
- - 2,4 % 71,4 % 14,3 % 9,5 % 1 %
DEN 0 2 0 44 17 5 0 68
- 2,9 % - 64,7 % 25,0 % 7,4 % -
EGY 0 2 0 11 12 2 0 27
- 7,4 % - 40,7 % 44,4 % 7,4 % -
FRA 0 0 0 34 10 0 1 45
- - - 75,6 % 22,2 % - 1 %
GER 0 6 0 36 32 32 1 107
- 5,6 % - 33,6 % 29,9 % 29,9 % 1 %
POL 0 4 0 66 16 8 0 94
- 4,3 % - 70,2 % 17,0 % 8,5 % -
QAT 0 0 0 11 30 4 0 45
- - - 24,4 % 66,7 % 8,9 % -
SLO
1 6 0 75 19 1 10 112
0,9 %
5,4 % - 67,0 % 17,0 % 0,9 % 8,9 %
SWE 0 5 1 57 8 12 0 83
- 6,0 % 1,2 % 68,7 % 9,6 % 14,5 % -
TUN 0 0 0 16 4 0 4 24
- - - 66,7 % 16,7 % - 4
Total
1 28 5 413 168 71 17 703
0,1 %
4,0 % 0,7 % 58,7 % 23,9 % 10,1 % 2,4 %
Table 52: Frequency and percentage in actions with change GK-P in relationship with the play
system used
2:3 3:2 4:2 3:3 3:3 + Transf.
Wings
3:3 + Transf Back court
players
2:4 Fix Pivots
J2Pearson ,422 ,000 * ,025 ,138 * *
Table 53: j2 of Pearson of actions by teams with change GK-P in relationship with the play
systems used

Analysis of numerical inferiority actions during the positional attack phase at the 2016 Rio Olympic Games
Dr. Manolo Montoya. Page 49 Qatar Handball Association
Offensive play systems (3:2)
ARG BRA CRO DEN EGY FRA GER POL QAT SLO SWE TUN
(A) (B) (C) (D) (E) (F) (G) (H) (I) (J) (K) (L)
Without change
GK-P .(a) .(a)
H J K
.(a) .(a) .(a)
With change
GK-P .(a) .(a) .(a) E .(a) E E .(a)
Table 54: Comparison of proportions (Test Z) by teams in actions with & without change GK -P in
relationship with the play systems used
8.9 Results according to finalization zone
In this section, we describe the frequencies and percentages observed according
to the finalization zone of the teams in an offensive situation of numerical
inferiority during the positional attack phase (Tables 55, 56 and 57)
16 26 28 29 36 38 39 46 48 49 56
Without
change GK-P
5 15 27 10 7 35 30 16 26 8 5
% 2,7% 8,2%
14,7%
5,4%
3,8%
19,0%
16,3%
8,7% 14,1
% 4,3%
2,7%
With change
GK-P 34 38 78 28 62 135 74 64 82 24 22
% 5,3% 5,9%
12,2%
4,4%
9,7%
21,1%
11,5%
10,0%
12,8%
3,7%
3,4%
J2 Pearson p=,245
Table 55: General frequency and percentage of the shot zones used in actions with & without change GK-P
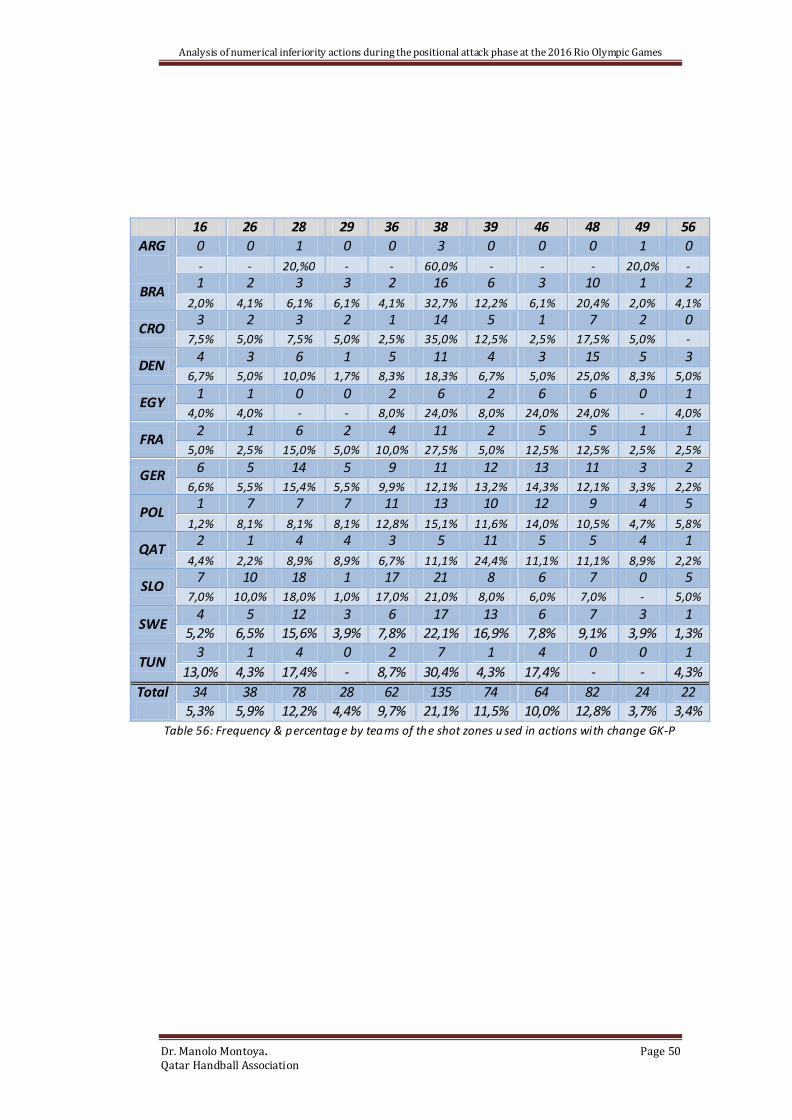
Analysis of numerical inferiority actions during the positional attack phase at the 2016 Rio Olympic Games
Dr. Manolo Montoya. Page 50 Qatar Handball Association
16 26 28 29 36 38 39 46 48 49 56
ARG
0 0 1 0 0 3 0 0 0 1 0
- - 20,%0 - - 60,0% - - - 20,0% -
BRA 1 2 3 3 2 16 6 3 10 1 2
2,0% 4,1% 6,1% 6,1% 4,1% 32,7% 12,2% 6,1% 20,4% 2,0% 4,1%
CRO 3 2 3 2 1 14 5 1 7 2 0
7,5% 5,0% 7,5% 5,0% 2,5% 35,0% 12,5% 2,5% 17,5% 5,0% -
DEN 4 3 6 1 5 11 4 3 15 5 3
6,7% 5,0% 10,0% 1,7% 8,3% 18,3% 6,7% 5,0% 25,0% 8,3% 5,0%
EGY 1 1 0 0 2 6 2 6 6 0 1
4,0% 4,0% - - 8,0% 24,0% 8,0% 24,0% 24,0% - 4,0%
FRA 2 1 6 2 4 11 2 5 5 1 1
5,0% 2,5% 15,0% 5,0% 10,0% 27,5% 5,0% 12,5% 12,5% 2,5% 2,5%
GER 6 5 14 5 9 11 12 13 11 3 2
6,6% 5,5% 15,4% 5,5% 9,9% 12,1% 13,2% 14,3% 12,1% 3,3% 2,2%
POL 1 7 7 7 11 13 10 12 9 4 5
1,2% 8,1% 8,1% 8,1% 12,8% 15,1% 11,6% 14,0% 10,5% 4,7% 5,8%
QAT 2 1 4 4 3 5 11 5 5 4 1
4,4% 2,2% 8,9% 8,9% 6,7% 11,1% 24,4% 11,1% 11,1% 8,9% 2,2%
SLO 7 10 18 1 17 21 8 6 7 0 5
7,0% 10,0% 18,0% 1,0% 17,0% 21,0% 8,0% 6,0% 7,0% - 5,0%
SWE 4 5 12 3 6 17 13 6 7 3 1
5,2% 6,5% 15,6% 3,9% 7,8% 22,1% 16,9% 7,8% 9,1% 3,9% 1,3%
TUN 3 1 4 0 2 7 1 4 0 0 1
13,0% 4,3% 17,4% - 8,7% 30,4% 4,3% 17,4% - - 4,3%
Total
34 38 78 28 62 135 74 64 82 24 22
5,3% 5,9% 12,2% 4,4% 9,7% 21,1% 11,5% 10,0% 12,8% 3,7% 3,4%
Table 56: Frequency & percentage by teams of the shot zones u sed in actions with change GK-P

Analysis of numerical inferiority actions during the positional attack phase at the 2016 Rio Olympic Games
Dr. Manolo Montoya. Page 51 Qatar Handball Association
16 26 28 29 36 38 39 46 48 49 56
ARG 3 4 10 3 1 10 6 2 4 0 1
6,82 9,1% 22,7% 6,8% 2,3% 22,7% 13,6% 4,5% 9,1% - 2,3%
BRA 0 1 1 0 1 1 1 1 0 0 1
- 14,3% 14,3% - 14,3% 14,3% 14,3% 14,3% - - 14,3%
CRO 0 2 2 2 1 6 2 0 3 1 0
- 10,5% 10,5% 10,5% 5,3% 31,6% 10,5% - 15,8% 5,3% -
DEN 0 0 1 1 0 0 1 0 2 1 1
- - 14,3% 14,3% - - 14,3% - 28,6% 14,3% 14,3%
EGY 0 3 6 0 2 5 4 4 5 2 0
- 9,7% 19,3% - 6,4% 16,1% 12,9% 12,9% 16,1% 6,4% -
FRA 0 0 0 0 0 1 1 3 0 0 0
- - - - - 20,0% 20,0% 60,0% - - -
GER 1 2 0 2 1 2 2 2 1 1 1
6,7% 13,3% - 13,3% 6,7% 13,3% 13,3% 13,3% 6,7% 6,7% 6,7%
POL 0 1 0 0 0 0 1 0 1 0 0
- 33,3% - - - - 33,3% - 33,3% - -
QAT 0 1 1 1 1 1 1 1 1 1 1
- 10,0% 10,0% 10,0% 10,0% 10,0% 10,0% 10,0% 10,0% 10,0% 10,0%
SLO 1 0 1 1 0 2 2 0 4 0 0
9,1% - 9,1% 9,1% - 18,2% 18,2% - 36,4% - -
SWE 0 0 0 0 0 1 2 0 1 0 0
- - - - - 25,0% 50,0% - 25,0% - -
TUN 0 1 5 0 0 6 7 3 4 2 0
- 3,6% 17,9% - - 21,4% 25,0% 10,7% 14,3% 7,1% -
Total 5 15 27 10 7 35 30 16 26 8 5
2,7% 8,1% 14,7% 5,43% 3,8% 19,0% 16,3% 8,7% 14,1% 4,3% 2,7%
Table 57: Frequency & percentage by teams of the shot zones used in actions without change GK-P
16 26 28 29 36 38 39 46 48 49 56 J
2 Pearson ,015 ,010 ,000 ,063 ,004 ,000 ,000 ,026 ,000 ,108 ,451
Table 58: J2 of Pearson values of actions by teams with & without change GK-P in relationship
with the shot zones
Finalization zone 28 ARG BRA CRO DEN EGY FRA GER POL QAT SLO SWE TUN (A) (B) (C) (D) (E) (F) (G) (H) (I) (J) (K) (L)
Without change
GK-P D J .(a) .(a) .(a) .(a) .(a)
With change
GK-P A .(a) .(a) .(a) .(a) A .(a) Table 59: Comparison of proportions (Test Z) by teams with & without change GK-P in
relationship with the shot zones (28)

Analysis of numerical inferiority actions during the positional attack phase at the 2016 Rio Olympic Games
Dr. Manolo Montoya. Page 52 Qatar Handball Association
Finalization zone 36
ARG BRA CRO DEN EGY FRA GER POL QAT SLO SWE TUN
(A) (B) (C) (D) (E) (F) (G) (H) (I) (J) (K) (L)
Without change GK-P .(b,a) .(a) .(a) .(a) .(a) .(a) .(a)
With change GK-P .(b,a) .(a) .(a) .(a) .(a) .(a) .(a)
Table 60: Comparison of proportions (Test Z) by teams with & without change GK-P in relationship with the shot zones (36)
Finalization zone 38 ARG BRA CRO DEN EGY FRA GER POL QAT SLO SWE TUN (A) (B) (C) (D) (E) (F) (G) (H) (I) (J) (K) (L)
Without change
GK-P B F J K .(a) .(a)
With change
GK-P A .(a) A .(a) A A Table 61: Comparison of proportions (Test Z) by teams with & without change GK-P in
relationship with the shot zones (38)
Finalization zone 39 ARG BRA CRO DEN EGY FRA GER POL QAT SLO SWE TUN (A) (B) (C) (D) (E) (F) (G) (H) (I) (J) (K) (L)
Without change
GK-P .(a) G H I K
With change
GK-P .(a) L L L L Table 62: Comparison of proportions (Test Z) by teams with & without change GK-P in
relationship with the shot zones (39)
Finalization zone 48
ARG BRA CRO DEN EGY FRA GER POL QAT SLO SWE TUN
(A) (B) (C) (D) (E) (F) (G) (H) (I) (J) (K) (L)
Without change GK-P .(a) .(a) .(a) .(a)
With change GK-P .(a) .(a) .(a) .(a)
Table 63: Comparison of proportions (Test Z) by teams with & without change GK-P in relationship with the shot zones (48)