analysis of non load bearing two component (2k) …
TRANSCRIPT

Clemson UniversityTigerPrints
All Theses Theses
7-2008
ANALYSIS OF NON LOAD BEARING TWOCOMPONENT (2K) ADHESIVES; UNDERTHE AUTOMOTIVE HEMMING PROCESSVARIATIONS; THERMOGRAVIMETRIC,CALORIMETRIC AND COMPOSITIONANALYSESKameswara NaraClemson University, [email protected]
Follow this and additional works at: https://tigerprints.clemson.edu/all_theses
Part of the Engineering Mechanics Commons
This Thesis is brought to you for free and open access by the Theses at TigerPrints. It has been accepted for inclusion in All Theses by an authorizedadministrator of TigerPrints. For more information, please contact [email protected].
Recommended CitationNara, Kameswara, "ANALYSIS OF NON LOAD BEARING TWO COMPONENT (2K) ADHESIVES; UNDER THEAUTOMOTIVE HEMMING PROCESS VARIATIONS; THERMOGRAVIMETRIC, CALORIMETRIC AND COMPOSITIONANALYSES" (2008). All Theses. 432.https://tigerprints.clemson.edu/all_theses/432

ANALYSIS OF NON LOAD BEARING TWO COMPONENT (2K) ADHESIVES;
UNDER THE AUTOMOTIVE HEMMING PROCESS VARIATIONS;
THERMOGRAVIMETRIC, CALORIMETRIC AND COMPOSITION ANALYSES
A Thesis
Presented to
the Graduate School of
Clemson University
In Partial Fulfillment
of the Requirements for the Degree
Master of Science
Mechanical Engineering
by
Kameswara R Nara
August 2008
Accepted by:
Dr. Mohammad Omar, Committee Chair
Dr. Mica Grujicic
Dr. Gang Li

ii
ABSTRACT
The work focuses on the analysis of non-load bearing, two component adhesives
used in joining the automotive closures. The study is concerned with the thermo-
gravimetric and the calorimetric attributes of the 2K adhesive. The study includes the
impact of the robotic applicators capability, in terms of the mixing ratio between the resin
and the hardener, and the mechanical mixing quality. A Fourier Transform Infrared
Spectroscopy (FTIR) procedure analyzes the adhesive chemical groups and tracks the
growth and decay of the hydroxyl and epoxy peaks. Additionally, the cure-rate based on a
reaction-type, is investigated through a Differential Scanning Calorimetry (DSC). The
variations in the Glass-Transition and Melting temperatures are also quantified. The
Thermo-Gravimetric Analysis (TGA) quantifies the impact of holding time duration and
conditions on the adhesive volatile content. Further, the final curing profile is
investigated through the volatile evaporation rates. Adhesive application and bead
placement is also evaluated using micrographs to ensure corrosion resistant and void free
joints. Results from FTIR and DSC analyses revealed that; FTIR peaks can be used to
determine mixing quality and curing behavior of two component adhesives qualitatively
whereas DSC can be used to quantify it.
Keywords: Fourier Transform Infrared spectroscopy, Differential Scanning Calorimetry,
Thermo Gravimetric analysis, Process audit control, Gel Point, Curing profiles
optimization, Micrographs.

iii
DEDICATION
Dedicated to my parents Sri N. Jagannadha Rao & Smt. N. V. Lakshmi, my sister
Smt. N.V.D. Sowjanya

iv
ACKNOWLEDGEMENTS
I would like to acknowledge Dr. Mohammad Omar for his continuous help and
support during this work. I would like to thank Dr. Laine Mears, Dr. Mica Grujicic and
Dr. Gang Li for their valuable suggestions and comments that helped in improving the
level of quality of this work.
Miss Kim Ivey and Mr. Suraj Sharma are greatly acknowledged for their help in
experimental set up and advice. Last but not the least I would like to thank my dearest
friends Rahul Akkineni, Rohit Parvataneni, Rupal R Shah, Sravanthi Dandumudi, Sindhu
Bobba, Eric Planting, Hemanth K Nallagatla, Sumalatha Yaski, Pavan Krishna
Seemakurthy, Ashwin Micheal Raj and Sundarrajan parthasarathy for their help in my
thesis review.

v
TABLE OF CONTENTS
Page
TITLE PAGE........................................................................................................................i
ABSTRACT ........................................................................................................................ ii
DEDICATION ................................................................................................................... iii
ACKNOWLEDGEMENTS ............................................................................................... iv
TABLE OF CONTENTS .................................................................................................... v
LIST OF FIGURES .......................................................................................................... vii
LIST OF TABLES .............................................................................................................. x
CHAPTER 1 ....................................................................................................................... 1
1.1 Introduction ............................................................................................... 1
1.2 Introduction of the different types of automotive joining methods .......... 2
1.3 Adhesive bonding compared to other joining methods ............................ 5
1.4 Polymeric adhesives and sealants ............................................................. 6
1.5 General classification of adhesives and sealants ....................................... 7
1.6 Classification of adhesives in the automotive industry ............................. 9
1.7 Factors that influence the selection of automotive adhesive or sealant .. 11
1.8 Formulation of adhesives or sealant ........................................................ 12
1.9 Types of stresses in adhesive joints......................................................... 14
CHAPTER 2 ..................................................................................................................... 16
2 Literature Survey ............................................................................................... 16
2.1 Basics adhesives and sealants ................................................................ 16
2.2 Curing ...................................................................................................... 16
2.3 Hemming ................................................................................................. 19
2.4 Thermal analysis techniques ................................................................... 19
CHAPTER 3 ..................................................................................................................... 20
3 Process flow ....................................................................................................... 20
3.1 Introduction ............................................................................................. 20
3.2 Theory of adhesion .................................................................................. 23
3.3 Surface Pretreatment ............................................................................... 24
3.4 Adhesive application processes ............................................................... 28
3.5 Curing ...................................................................................................... 30

vi
CHAPTER 4 ..................................................................................................................... 34
4 Laboratory tests .................................................................................................. 34
4.1 Sample preparation .................................................................................. 34
4.2 Fourier Transform Infrared Spectroscopy: .............................................. 35
4.3 Differential Scanning Calorimeter .......................................................... 41
4.4 Thermogravimetric analysis .................................................................... 49
4.5 E-coat oven curves .................................................................................. 58
4.6 Estimation of flange fill by using micrographs ....................................... 60
4.7 Determination of gel point of PVC based sealant ................................... 63
CHAPTER 5 ..................................................................................................................... 66
Conclusions and future work ............................................................................. 66
LIST OF REFERENCES .................................................................................................. 68

vii
LIST OF FIGURES
Figure Page
1-1: Resistance spot and tungsten arc spot welding ........................................................... 3
1-2: Hem joint ..................................................................................................................... 4
1-4: Clinch Joints ................................................................................................................ 4
1-3: Self piercing rivets ....................................................................................................... 4
1-5: Mechanical stresses in adhesive joint ........................................................................ 15
3-1: Material flow in automotive door manufacturing process ........................................ 20
3-2: Three stages of hemming process.............................................................................. 22
3-3: Contact angle of surface liquid .................................................................................. 24
3-4: Different layers on bare metal surface ....................................................................... 25
3-5: Pretreatment process flowchart ................................................................................. 26
3-6: Adhesive application process flow chart ................................................................... 28
3-10: Basic Representation of hardener .......................................................................... 32
3-11 FTIR spectra of hardener sample .............................................................................. 33
4-1: Flow chart of the FTIR process ................................................................................. 35
4-2: FTIR table top apparatus ........................................................................................... 36
4-3: FTIR spectrum of four laboratory prepared samples ................................................ 37
4-4: Variation in 3350 - 3500 cm-1 peak .......................................................................... 38
4-5: Variation in 911 cm-1
peak ........................................................................................ 39
4-6 : Peak growth between 1770-1620 cm-1 ................................................................... 40
4-7: Variation in 1296 cm-1
peak ...................................................................................... 41

viii
4-8: Power compensation Differential Scanning Calorimetry .......................................... 42
4-9: Heat flux DSC ........................................................................................................... 42
4-10: Hermetic pan and lid assembly................................................................................ 43
4-11: DSC curve of the 2K sample (Mix ratio= 3:1; Hold time=2 days) ......................... 45
4-12: DSC curve of 2K sample (Mix Ratio= 3:1; Hold time= 1 day) .............................. 46
4-13: DSC curve of environmentally conditioned sample ................................................ 47
4-14: Glass transition temperatures of laboratory prepared samples ................................ 48
4-15: DSC plot of PVC based sealant ............................................................................... 49
4-16: TGA analysis of sample Mix ratio (3.2:1), Summer conditioning .......................... 51
4-17: TGA of summer conditioned sample ramp up 20oC/min ........................................ 52
4-18: TGA of summer conditioned ramp up 30oC/min .................................................... 52
4-19: TGA analysis of winter conditioned samples subjected to ramp 10oC/min. ........... 53
4-20: TGA analysis of winter conditioned sample temperature ramp 20oC/min.............. 54
4-21: TGA analysis of winter conditioned sample,temperature ramp 30oC/min.............. 55
4-22: TGA analysis of 2K sample subjected to ramp up 10oC /min ................................. 56
4-23: TGA of 2K sample with temperature ramp up of 20 o
C/min ................................... 57
4-24: TGA of 2K sample with temperature ramp up of 30oC /min .................................. 57
4-25: E Coat oven conditions with different ramp up conditions (only adhesive) ........... 59
4-26: E coat oven conditions (% volatiles versus temperature) ........................................ 59
4-27: UBS oven conditions (Adhesive+ sealant) .............................................................. 60
4-28: Apparatus used to measure flange fill ..................................................................... 62
4-29: Hem flange showing various fill levels ................................................................... 62

ix
4-30: Sample micrograph of hem joint with fill rate of 100% .......................................... 62
4-31: Apparatus used to find gel point of PVC sealant .................................................... 63
4-32: Plot from FLIR un-cooled camera ........................................................................... 64
4-33: DSC cure of PVC based sealant .............................................................................. 64

x
LIST OF TABLES
Table Page
1-A: Comparison between various joining methods .......................................................... 5
3-A: Improvement in shear strength with pretreatment ................................................... 27
4-A: Volatiles release from summer condition samples .................................................. 52
4-B: Amount of volatile release from winter conditioned samples ................................. 55
4-C: Volatiles release rate of 2K sample with the variation of ramp up rates ................. 57
4-D: Skin forming temperatures at various ramp up rates ( Hot plate) ........................... 65

CHAPTER 1
1.1 Introduction
Adhesives and sealants are finding wide variety of applications in today’s
automotive industry. Non structural and structural adhesives are used in the various parts
of the automotive closures, exterior trims, interior trims and in various assemblies. Earlier
days adhesives were just used as a sealer to join various assemblies, later these were used
to prevent corrosion and also used in structural applications. The main reasons that
motivated the automotive industry towards a wider usage adhesives and sealants are [1]:
1. Existing joining methods such as welding, brazing and fastening have many
disadvantages such as, spot welding cannot be used to join aluminum,
mechanical fastening cannot damp vibration and may lead to disassembly
after few years of application
2. Demand to join various dissimilar materials
3. Joining light weight structures and components without compromising the
structural rigidity of an automotive
4. Use of materials like aluminum, plastics and composites.
5. Multifunctional ability (Ability to join and damp vibration at the same time)
Wide variety of adhesive formulations such as pressure sensitive, cross linking
and physical setting adhesives are being used in anti-flutter, hem flange bonding, glazing,
interior and exterior trims etc. To give a numeric example of how these are used in
today’s automotive industry: The 2005 Audi A6 had an increase of 86 meters of adhesive

2
bonding and a decrease of 1045 spot welds [3]. Adams [4] reported that some model
luxury vehicles have up to 100 meters of adhesive bonding in 2006 compared to 20
meters in 1999.
The primary focus of current research is to study the functionality of two
component (2K) non-load bearing automotive adhesives. Such functionalities are mainly
controlled and affected by the adhesives’ rheological properties, composition, glass
transition temperature (Tg), degree of cure while in storage, its sensitivity to humidity,
and lastly its volatile evaporation rates. To determine the above mentioned attributes
Fourier Transform Infrared Spectroscopy (FTIR), Thermo gravimetric analysis (TGA)
and Differential Scanning Calorimetry (DSC) procedures were used on the collected
resin, hardener and 2K mix from the production lines. To reflect the changes in the
mixing ratio during several shifts and between production lines; the mixing ratio of resin
and hardener are varied within ± 6% from nominal (recommended by vendor) and are
prepared in the laboratory for further testing.
1.2 Introduction of the different types of automotive joining methods
• Fusion- based Welding ( MIG, Spot, Laser beam and resistance seam)
• Adhesive bonding
• Mechanical fastening

3
Fusion-Welding:
Fusion welding relies on localized heating of the substrate material to form the
joint. In spot welding the current is caused to flow through electrodes and the separate
pieces of the metal to be joined. The resistance of the base metal to electric current flow
causes localized heating in the joint and the weld is made [7]. Earlier nearly 5300 spot
welds are used to join various parts in automotive body.
Figure 2-1: Resistance spot and tungsten arc spot welding [7]
Adhesive bonding
The adhesive bonding is gaining wide acceptance in the automotive industries
around the world, replacing some fusion methods such as mechanical fastening and
welding. Non-load bearing adhesives are used in hem flange bonding and as anti-flutters.
Hemming is the bending of the sheet metal edge itself or over other sheet to get the
nominal angle of 180o [6]. This joint finds its application in automotive closure panels
such as hoods, fenders, liftgates and doors. As shown in below figure 1-2 the blue region
indicates the polymer based adhesive, which is generally used to join the inner and outer
panel. The area shown in red is called the after-hem sealant, which is applied after the 2K
adhesive has been fully cured, to prevent any moisture or chemical ingress.

4
Figure 2-2: Hem joint
Mechanical joining:
Self piercing rivets and clinch joints are two types of fasteners [9] that are used to
join automotive bodies. Self piercing rivets do not pierce into two panels to be joined
instead it pierce into upper panel of the joint and rivet expands in the inner panel to create
mechanical interlock as in figure 1-3. Unlike self piercing rivets, clinch joints never use
rivets, instead both upper and lower panels are formed between the punch and a die as
shown in the figure 1.4 [9].
Figure 2-4: Clinch Joints
Figure 2-3: Self piercing rivets

5
1.3 Adhesive bonding compared to other joining methods
Welding Fastening Soldering Adhesive
bonding
Corrosion May corrode in
long term
Corrodes in
the regions
nearer to bolt
Can be eliminated
if corrosion
causing flakes are
removed
No or less
chance of
corrosion
Stress
distribution
stress due to
local stress
points
Stress are
concentrated
around single
point
Fairly good stress
distribution
Excellent stress
distribution
Vibration
damping
Cannot damp
vibration
vibration
loosens this
joint
Good vibration
damping ability
Acts as
excellent
vibration
dampers
Cost High cost
equipment and
energy costs
Fairly cheap
equipment
Manual
equipment is
cheaper than the
automatic
Cost depends
on application.
Resistance to
higher
temperatures
Offers good
resistance
Offers good
resistance
Depends on filler
material
Poor resistance
Permanence Permanent Not
permanent
permanent Permanent
Materials
joined
Only same kind
of materials
joined
Different kind
of materials
can be joined
Little bit capable Highly capable
of joining
dissimilar
materials
Joint
appearance
Some kind of
dressing is
necessary
Leads to
uneven
surface
Fairly good Joint generally
unseen
Surface
pretreatment
Little surface
pretreatment is
necessary
No surface
pretreatments
are necessary
No or little
surface
pretreatment
Surface
pretreatments
are necessary
Table 2-A: Comparison between various joining methods

6
1.4 Polymeric adhesives and sealants
According to Petrie [1]: “An adhesive is defined as a substance capable of
holding at least two surfaces together in a strong and permanent manner”, while a
sealant; “An sealant is a substance capable of attaching at least two surfaces, therby
filling the space between them to provide a barrier or protective coating”
In earlier days vegetable oils and fats, seed oils, starch, animal bone glues were
used to join two surfaces. With the advancements in the polymer science and technology
many properties of the polymers supporting adhesion came into light.
Polymer adhesives offers following advantages
1. Low cost and weight
2. Good appearance.
3. Excellect moisture and chemical resistance
4. High strength and toughness values
5. Good insulation properties
In addition to all the above advantages, polymeric adhesives offer viscoelastic
behaviour by virtue of which movement upon application of load is posssible. Desired
properties for example increased tack or ductility can be introduced into the polymeric
structure by adding additives such as tackifiers or plasticizers. Addition of additives
depends on the end properties required . A major disadvantage with the polymers is that
their physical properties are highly dependant on temperature. Strength of these materials
decreases with increase in temperature and lack stiffness when compared to metals [2] .
Typical applications of polymeric adhesive include transportation, medicine, paper amd

7
packaging sector. In automotive industry wide variety of adhesive formulations such as
pressure sensitive, cross linking, physical setting are used in lining of interior linings,
bonding at cabriolet soft tops,bonding of brake pads and shoes, hem flange bonding,anti
flutter bonding, direct glazing, outer trim parts, side projecters, name plates, direct
glazing, boot linings, sound, heat insulation parts etc [5].
1.5 General classification of adhesives and sealants
Adhesives can be classified based on their formulation source into; naturally
occurring adhesives and synthetic adhesives. The naturally occurring adhesives such as
Dextrin, cellulose, starch, animal glue, natural rubber and Casein are few examples of
non synthetic adhesives. While the Classification of synthetic or manmade adhesives
might be based on the load bearing capability as:
• Structural adhesives: Generally used in the application that requires resisting
huge loads
• Non-structural adhesives: These adhesives are generally used to hold two
substrates together. They fail when used for high load bearing applications or at
adverse climatic conditions such as extreme temperature and humidity. For
example, Epoxy based adhesives are generally classified as structural, Anti flutter
(rubber based adhesives) as semi-structural, screen bonding adhesives can be
classified as low or Non structural adhesives [4].

8
Other classifications include: The Chemical composition:
• Thermoplastic adhesives: Thermoplastic adhesives can be softened by the
application of heat (i.e. above their glass transition temperature (Tg). These kind
of adhesives generally have branched or linear molecules as backbone which can
be easily broken by the application of the heat.
• Thermosetting adhesives: Unlike thermoplastic adhesives these adhesives
become hard and brittle upon application of heat (i.e. above their glass transition
temperatures). Cross linked structure is formed by application of heat.
Overheating may lead to degradation due to the oxidation.
• Elastomeric adhesives: Elastomeric adhesives return to their original positions
once the deformation load is removed. These kinds of adhesives are generally
used for sealants (PVC), vibration dampers and sound insulators.
• Hybrid adhesives: As stated in section 1.2, here adhesive or sealant is generally
blended with the several additives or fillers to make it suitable for the required
application. For example fillers such as aluminum powder, carbon black, zinc and
silica are generally added to reduce the shrinkage of adhesive at high temperatures
[1]. Likewise, today’s research is much focused on developing the hybrid
adhesives to improve the adhesive properties such as toughness, ductility,
resilience, fatigue, peel strength and electrical conductivity.
The Physical form classification of adhesives or sealants includes:

9
• Liquid adhesives with solvent: Solvents such as water and ethanol are added to
the adhesive to control rheological properties thus making it spreadable on the flat
surface
• One component solvent-less adhesive: One component (1K) cures by either
application of heat or by the influence of external agents.
• Two component solvent-less adhesive: Unlike 1K, two component (2K) comes
with the base component resin and hardener or catalyst which influences the
former to cure at room temperature. Post cure methods such as induction curing
(discussed in chapter 3.5) may be employed to obtain the complete cure.
• Solid adhesive: Powder, crystal, form and tape adhesives fall under this category.
Sealants:
In terms of sealants; it is typically classified based on their hardening mechanisms
and physical forms. This Report discusses about two component (2K); Thermosetting,
non load bearing epoxy adhesive and heat cured one component (1K) elastomeric sealant.
1.6 Classification of adhesives in the automotive industry
Primary classification of automotive adhesives is according to type of cure
employed, place of application and the final strength requirements. Automotive adhesives
fall into following categories [5]:
(a) Rapid set at room temperature, which include Anaerobic and Cyanoacrylate adhesives
Applications include gaskets, bonding of electrical and electronic items, thread sealing,
bonding of caps in cylinder head covers and gear boxes. (b) Rapid set at high

10
temperature: Epoxides and phenolic adhesives fall into this category. The applications
include bonding of heat exchanger and hem flange adhesive. (c) Evaporation of moisture,
which comprise Synthetic resin sealants with applications include gaskets, Anti- flutter
and common sealing. Further types include; (d) Set under application of external pressure
such as Pressure sensitive tapes used in bonding of name plates, mirrors, reflectors etc.
Lastly, (e) Encapsulated adhesives, which cures anaerobically or with the bursting of
capsules and are used in fastener locking applications. Classifying the adhesives from the
intended application perspective can also include;
Anti Flutter adhesives: Anti flutter adhesives are generally applied to fill the wide gaps
between the inner and outer panels [4]. Secondary functions of anti flutter adhesive are to
damp vibration and noise and increase the stiffness of attached parts. Generally rubber
based butyls and epoxy modified polymers are used as anti flutter adhesives.
Adhesives for bonding of trim assemblies (Non structural adhesives); Non functional
metal or plastic moldings or other accessories, which are mounted to fully painted car are
generally called as trim assemblies e.g. bonding of screens, emblems etc. Generally
pressure sensitive tapes or cyanoacrylates are used for this purpose [4]. Polyurethanes,
silane polymers with a polyurethane backbone are generally used in the wind screen
bonding because of their good adhesion to the painted surfaces.
Power train adhesives; Anaerobic acrylates are generally used in shaft to hub
connections and silicones are used frequently to form gaskets.

11
Crash resistant adhesives; Research in this area showed that rubber particles dispersed in
the epoxy matrix showed good crash resistant behavior than the commercial epoxy [4].
Thermosetting polyurethanes and acrylics can be used to obtain required crash resistance.
1.7 Factors that influence the selection of automotive adhesive or sealant
1. Type of application.
2. Joint type
3. Nature and type of substrate
4. Curing methods employed
5. Cost
6. Type of stresses that it should sustain
7. Time frame between the application or curing process ( Holding time)
8. Handling strength (Time to attain green state)
9. Application type (Brush, trowel, Robot applicator etc,.)
10. Desired physical properties (Tough, Flexible etc.)
11. Surface pretreatment or preparation.
12. Used as such or used with other joining methods such as bolting, riveting etc.,
13. Storage time before application (Shelf life)
14. Washout stability if no immediate curing is applied.
15. Sag resistance values
16. Pot life or reaction time in case of 2K adhesives

12
17. Shelf life of adhesives. (Viscosity generally doubles once adhesive exceeds pot
life).
1.8 Formulation of adhesives or sealant
Present day adhesives and sealants need to perform special functions. So the
adhesive formulation and additives are decided according to the final application main
attributes, such as operating temperature, humidity, and force. The adhesives additives
influence its behavior through improving or modifying some of its attributes; such as:
reducing the thermal expansion, controlling its rheological properties, improving or
reducing the thermal and electrical conductivity based on the application, Improving its
tack and toughness, and lastly increasing its working temperature range. Additives are
typically classified into:
Primers: Primers form the thick layer of coating on the substrate surface to promote the
adhesion between the adhesive and its substrates. Through one of following
functionalities:
• Increases surface energy of the substrate
• Acts as corrosion inhibitor
• Helps in increasing the joint strength
• Primers provide required wettability for the adhesive.
• Keeps surface fresh if longer hours of storage before assembly is required.
Optimum thickness should be maintained to harness the desired properties of the primer.

13
Adhesion Promoters: Adhesion promoters may or may not be integral part of the
adhesive. It acts as a primer in some application. The only difference between the primer
and adhesion promoters is that the former forms a thick layer and the latter forms the
monolayer. It forms a strong covalent bond between the adhesive and the substrate
thereby preventing the water, oxygen or the salts ingress into the joints, when used under
adverse conditions. These are also called as coupling agents. Typical examples include
phosphorous containing compounds [10].
Accelerators: Accelerators increase or decrease the rate of reaction, curing rate, storage
and working time as per the application.
Solvents: Solvents such as ethanol, water, and acetone are generally used to decrease the
viscosity of the base resin thereby increasing its spreadability on the substrate surfaces.
Thixotrophic agents: Thixotrophic agents are generally introduced to enhance the sag
resistance of the adhesive so that the adhesive bead remains in position, when applied on
vertical substrates.
Diluents: Unlike solvents, diluents do not evaporate after application. Reactive diluents
react with the binder in the initial stages.
Tackifiers: Tackifiers are generally used to increase the green strength of the adhesive
thus improving the handling strength which is necessary in assembly shop before post
cure.
Fillers: Fillers improve the desired properties of an adhesive such as strength, working
properties, electrical conductivity and corrosion resistance

14
Plasticizers: The ductility of adhesive increases with the addition of plasticizers. These
are part of the ingredients that are added to the base resin.
Tougheners: Tougheners impart the required impact resistance and mitigate crack
propagation. 2K epoxy adhesive generally fails in peel (Discussed in detail in section
1.9). So, it is imperative to introduce tougheners into the base resin matrix of the adhesive
to improve its peel resistance, e.g. Nitrile rubbers. Other ingredients such as antioxidants
are used to delay the aging of the adhesive.
Sealants:
Solvents help to increase flowability or gunnability (Sealant guns are generally
used to apply sealant) of the sealant by reducing the viscosity. Hydrocarbons such as
Xylene, toluene, ketone are used for this purpose. Other additives such as thixotropic
agents, fillers, antioxidants. Plasticizers are used to modify the sealant physical and
chemical properties.
1.9 Types of stresses in adhesive joints
Thermal stresses: These stresses are generally created due to heat curing of adhesive.
When adhesive is cured and cooled, adhesive which has more coefficient of thermal
expansion (CTE) than metal substrates contracts more than the metals. Also, composite
Joints (materials with the different CTE’s) induce more stress than that of the material
with the same CTE’s.
Hygroscopic or swelling stresses: These stresses are generally introduced due to the
entrapment of moisture in the joint during mixing, holding or transportation.

15
Mechanical stresses in the joint:
Peel stress: Peel stresses in the adhesive joint arise due to the action of perpendicular
forces. Adhesive joint fail more in peel than that of shear
Shear stress: Shear stress in the adhesive joints is due to the action of parallel forces as
shown in the figure 1.5. Voids, bubbles and contaminants in the adhesive may also leads
to stresses in joints.
Figure 2-5: Mechanical stresses in adhesive joint

16
CHAPTER 2
2 Literature Survey
The present literature survey is focused on three main sections: the automotive
adhesives curing and its associated defectives, the hemming process, and the thermal
analysis techniques and studies.
2.1 Basics adhesives and sealants
Baldan et al in [2] discussed the different types of polymeric adhesives and
sealants to include polyurethanes, epoxies, silicones, acrylates, hot melts and anaerobic
adhesives. He also discussed the various application and specific properties of each kind.
Petrie et al [1], Adams [4] and Pizzi & Mittal [5] provided comprehensive surveys about
the different types of polymeric adhesives.
2.2 Curing
Wu et al [19] has provided a study covering the curing characteristics of
automotive two-component adhesives, when cured using induction coils. In [19] the
variations in the bonding strength with relation to variations in the industrial ovens are
also discussed. The study indicate that the ramp up rate control is important, maintaining
a steep rate (greater than 50oC) during initial stages is required to achieve rapid hardening
of adhesive. This might resolve some issues such bubbles oozing (popping) out.
However, these rates might also lead to incomplete cure. In the study, a low carbon steel
with 2K epoxy based adhesive is subjected to different ramp up rates of 10, 50 and

17
100oC/min for five seconds, which is enabled through an induction based curing. Results
showed that increasing the heating rate to 1000oC/min for a short span of time increased
the bonding strength. Increasing the holding time (inside the fixture) will increase the
bonding strength initially, but found to decrease at later stages. Regarding the curing peak
temperature, the prescribed bonding strength is attained at 80oC which is much lesser
than the vendor prescribed peak temperature. In regard to adhesive bubbling while
curing, the publicized literature provides three important reasons behind the bubble
formation in the adhesive bead.
1. Phase transformation of compounds from solid to gaseous
2. Thermal expansion of gas voids
3. Chemical reaction which leads to gas phase
Also, the literature provides some countermeasures to control the bubble
formation; through increasing the ramp up rates during the initial stages of curing, and by
increasing the holding time (while in fixture) to get the required bonding strength.
However, in regard to voids formation inside convection based curing; the rate of cure
(DSC and FTIR), the amount of contraction and expansion, and the denseness of the 2K
adhesive used (Viscosity tests) can be used to quantitatively describe this phenomenon.
The effect of curing on viscosity and mechanical properties is discussed by Laprique et al
in [18]. The objective of that study is to analyze the variations in the rheological and the
mechanical properties of the adhesive, when manipulating the curing peak temperature.
The study uses two-component adhesives (room temperature cured), which is then
subjected to different peak temperatures 23oC, 45
oC and 64
oC. Aging test is also

18
performed to study the properties of adhesive in the extreme weather conditions. The
findings from [18] can be summarized into:
1. If the 2K adhesive is cured below its glass transition temperature then its network
will vitrify thereby stopping further curing or reaction in an adhesive.
(Vitrification is the stage where mobility of the molecules ceases there by
stopping the further reaction)
2. Higher ramp up rates in the oven generally raises the glass transition temperatures
of adhesive.
3. Post curing at higher temperatures by external means such as induction heating or
oven curing increases the curing rate of adhesive.
4. Near gel point of the adhesive, its viscosity increases abruptly, which also
increases the molecular weight of the adhesive
5. Too much exposure to humidity conditions may soften the adhesive leading to
less rigid joint.
Chang et al [20] discussed advantages of post curing the adhesives. Main
observations are; post curing the 2K room temperature adhesive improved its
recoverability, while increasing its modulus, and upper yield limit and lower yield limit.
This is due to the increase in the relaxation ability. However, excessive post curing may
also lead to degradation and evaporation of volatile substances from the adhesive.
Petrie[1] in his report discussed the advantages of the electromagnetic curing when
compared to conventional methods.

19
2.3 Hemming
The basics of the hemming process and its different variations, and possible
defects are discussed in details in [21-23].
2.4 Thermal analysis techniques
References [1, 4 and 5] provide the fundamentals of the thermal analysis when
used for investigating the adhesives rheological properties. Additionally articles from
[25] provide further information in regard to available systems’ capabilities, samples
preparation and the general guidelines. Following provide the specific referenced work
for each one of the techniques utilized.
FTIR: Bhatia et al [17] investigated the epoxy characteristics of a resin blend,
using its specular, reflectance and the spectrometric, with focus on the 911 cm-1
peak.
Furthermore, Bhatia et al studied the variations in 1296 cm-1
peak with the epoxy reaction.
Sharma et al [15] analyzed the reaction kinetics and the non-thermal effects due to
ultrasonic curing methods of epoxy resin. In his report, main observations are based on
the variations in the 911 cm-1
epoxy group. He observed that as the reaction between resin
and hardener opened the epoxy ring; it raises the hydroxyl peaks 3350-3500 cm-1
. Also
the reaction mechanisms are further explained in reference [14]. According to
Bockenheimer et al [16] the peak growth in the region of 1770 to 1620 cm-1
can be a
good indicator of the epoxy group concentration. All the above mentioned peaks are
analyzed in this study.
Other literature covering the topic of structural adhesives is in [26, 27 and 28]
20
CHAPTER 3
3 Process flow
3.1 Introduction
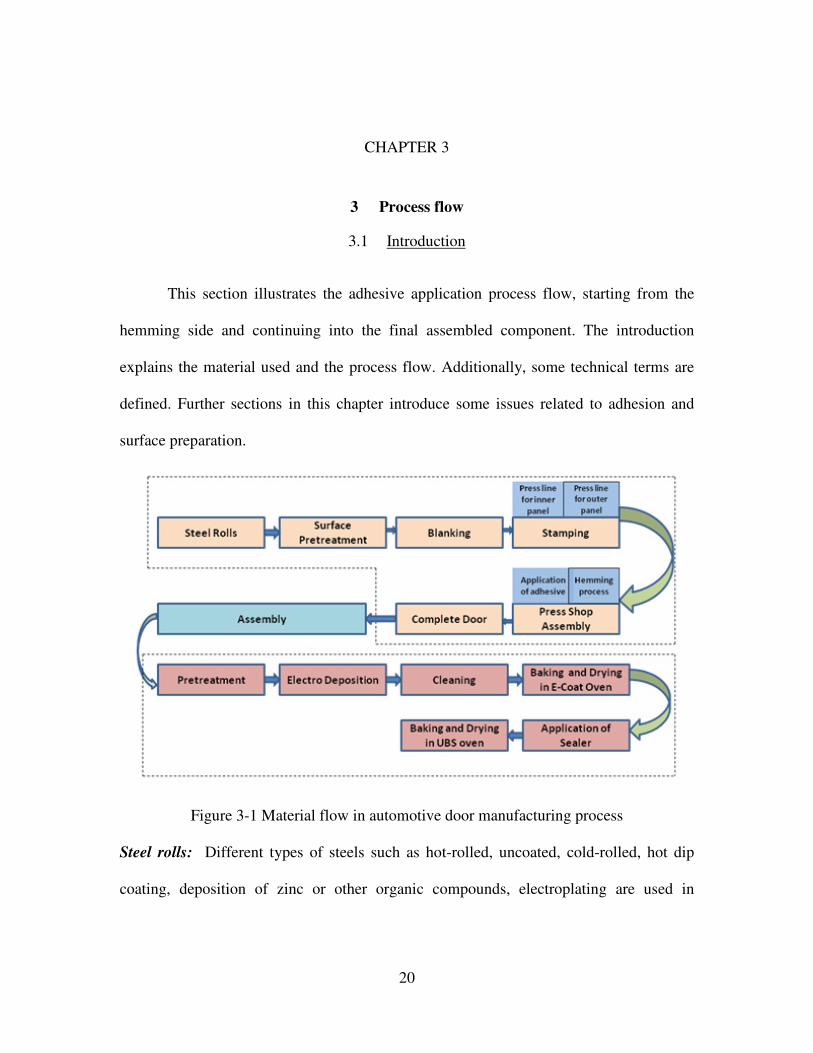
This section illustrates the adhesive application process flow, starting from the
hemming side and continuing into the final assembled component. The introduction
explains the material used and the process flow. Additionally, some technical terms are
defined. Further sections in this chapter introduce some issues related to adhesion and
surface preparation.
Figure 3-1 Material flow in automotive door manufacturing process
Steel rolls: Different types of steels such as hot-rolled, uncoated, cold-rolled, hot dip
coating, deposition of zinc or other organic compounds, electroplating are used in

21
automotive press shops for the production of inners and outers of automotive doors,
hoods and lift gates.
Surface pretreatments: Automotive lubes or Hydrocarbons mixed with water are
generally used to wash blanks, to remove dirt or contaminants that are deposited during
transport from steel mill or storage.
Blanking: Blanking is the process by which steel roll is straightened to remove residual
stress induced during rolling process in steel mill. Here blanks are dimensioned and
sliced according to final requirements. The blanking is followed by stamping, which is a
forming process that uses multiple press stations to perform trimming, piercing, bending,
etc., on sheet metal. Number of press stations depends upon the number of operations
needed to get the desired shape. Generally inner and outer panels are stamped on the
different press stations and stacked near assembly cell for assembly.
Application of adhesive: Two component (2K) adhesive will be metered and mixed
using static mixer. It is then applied using adhesive application robots as a circular bead
on the door outer flange. More details about the adhesive application step are in section
3.4.
Hemming station: Inner and outer panel with the adhesive bead are assembled in the
hemming station. This is done by bending the edge of sheet metal over itself or over other
sheet to get the nominal angle of 180o. This process is exclusive for joining inner and
outer panels of automotive closure panels such as doors, hood, lift gates, fenders etc,.
The primary function of this process is to: Join inner and outer panels and Provide
uniform and good appearance for final joints. The Hemming process sequence generally

22
involves three stages flanging, Pre hemming and hemming; Flanging bends the panels to
90o, followed by the pre-hemming stage, which further reduces the angle of the outer
panel flange. Lastly, the hemming bends the panels into 180o angle (figure 3-2).
Figure 3-2: Three stages of hemming process 1) flanging 2) Pre hemming 3) Hemming
Curing (Press shop): Doors are sent through the pre-curing oven where short exposure
(10 minutes) to temperatures of 100oC – 200
oC provides the sufficient handling strength
to the adhesive.
Assembly body shop: Completed doors from the assembly shop are assembled to form
the body in white structure.
Electro-deposition coating: Before entering into paint shop the Body in White (BIW) is
pretreated (through aqueous and acidic cleaning agents) to remove contamination, slug,
dust, press marks etc. This is important because if the surface is not clean, any surface
irregularities will be exaggerated through the paint (tele-graphing). Additionally, the
paint adhesion will be affected. After pretreatment and phosphating (conversion coating)
of the substrate; electrodeposition coat (E-Coat) is applied through immersion tanks. It
acts as a foundation for the subsequent coats (base coats and finish coats) and also it acts
as a good corrosion resistance.
1 2 3

23
E-Coat oven: E-coat oven is generally programmed to higher temperatures to cure not
only the E-coat but also the pre-hem adhesives. The E-coat curing profiles comprise three
steps; ramp-up, steady-state and cooling.
Sealer application: Generally elastomeric sealant is applied along edge of the hem joint
to make the joint air tight, moisture tight and to prevent the external contamination
entering into the joint. Finally the sealant oven is used to cure elastomeric sealant.
3.2 Theory of adhesion
Surface energy, surface tension and surface roughness of substrate are the main
factors, which affect the wettability of the adhesive. Wettability is defined according to
Baldan [2] as the thermodynamic work of adhesion (Wa) for the seperation of solid from
liquid, decribed in equation (3.1):
Wa = γsv+γlv-γsl (3.1)
Where γsv = Specific surface energies of solid vapor interface
γlv = specific surface energies of liquid vapor interface
γsl= Specific surace energies of solid liquid interface.
Young’s equation can also be used to correleate between the surface tension and
contact angle . As shown in the figure 3-3 below, and mathemtically in equation (3.2),
which is the result of balancing energies in all the directions
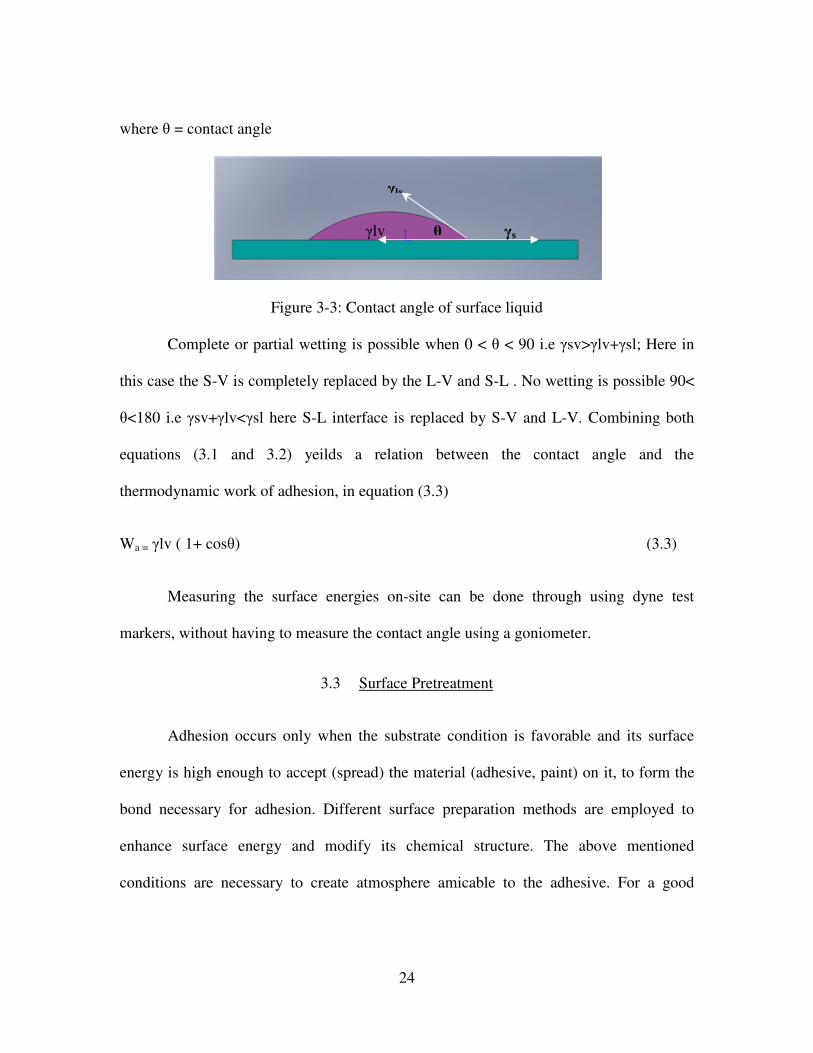
γlv cosθ + γsl = γlv (3.2)
24
where θ = contact angle
Figure 3-3: Contact angle of surface liquid
Complete or partial wetting is possible when 0 < θ < 90 i.e γsv>γlv+γsl; Here in
this case the S-V is completely replaced by the L-V and S-L . No wetting is possible 90<
θ<180 i.e γsv+γlv<γsl here S-L interface is replaced by S-V and L-V. Combining both
equations (3.1 and 3.2) yeilds a relation between the contact angle and the
thermodynamic work of adhesion, in equation (3.3)
Wa = γlv ( 1+ cosθ) (3.3)
Measuring the surface energies on-site can be done through using dyne test
markers, without having to measure the contact angle using a goniometer.
3.3 Surface Pretreatment
Adhesion occurs only when the substrate condition is favorable and its surface
energy is high enough to accept (spread) the material (adhesive, paint) on it, to form the
bond necessary for adhesion. Different surface preparation methods are employed to
enhance surface energy and modify its chemical structure. The above mentioned
conditions are necessary to create atmosphere amicable to the adhesive. For a good
γlv
θ γsγlv

25
adhesion surface free energy of the substrate (γsubstrate) should be more than that of the
adhesive (γadhesive) i.e., γsubstrate>> γadhesive
The surface energy value of galvanic zinc coated steels is approximated around
70.8 mJ/m2 when compared to epoxy 46 mJ/m
2 and PVC 41.5 mJ/m
2
Process oil/dust
Other adsorbed contaminants
Hydroxide and water
Metal oxide
Segregation layer
Bulk metal
Figure 3-4: Different layers on bare metal surface
Figure 3-4 gives the details of the layers that are present on the bulk metal, some
of which need to be removed to provide for good adhesion. These layers can be formed
during the production processes of metal, storage, atmospheric conditions, shipping and
handling of the metal substrates. Few of the surface preparation methods are [4]
1. Solvent degreasing
2. abrasion
3. Grit blasting
4. Chromic acid etching
5. Anodizing ( Chromic and phosphoric acid)
Physical methods
Chemical methods

26
Figure 3-5 : Pretreatment process flowchart
The above flow chart (3-5) is a general representation of a typical treatment
process. Some steps can be added or removed depending on the end usage of the
assembled product. Following factors greatly influence the sequence; Ultimate bond
strength, the type of material, surface, Service environment, and the Life cycle of the end
product. Following describe each one of the pretreatment steps.
Solvent degreasing: Oils, greases and other oxides can form weak layers which obstruct
the adhesion process. Hydrocarbons distillate (Major percentage) with the minor
percentage of corrosion inhibitors (also called as wash) can be used as solvents to remove
the grease and other dirt particles.
Abrasion: Abrasive or emery paper is used to roughen the surface thus increasing the
contact area of the adhesion. Utmost care should be taken that roughness values stay
within the specified values. Excessive roughness may lead to stress concentrations.
First Degreasing process is
performed to remove
Abrasion to make surface rough
Second degreasing process
Chemical treatment to alter the
properties of the substrate

27
Grit blasting: In this process highly accelerated abrasive or sand particles hit the surface
thereby preparing the surface for bonding and subsequent finishing.
Etching and anodizing: Etching and anodizing improve the surface chemistry, making
the surface chemistry more compatible to the adhesive formulation. The thickness of
metal oxide layers can also be controlled through this process.
The improvement in lap shear strength of the epoxy bonded, cold rolled steel substrates
due to surface pretreatment is shown below (Table 3-A) [1]
Type of treatment Lap shear strength (psi)
As received 2900
Vapor degreased 2910
Grit blast 4260
Acid etch 4470
Table 3-A: Improvement in shear strength with pretreatment

28
3.4 Adhesive application processes
Figure 3-6 : Adhesive application process flow chart
Viscosity of adhesive should be monitored and recorded to set the robotic mixers
and applicators accordingly. Additionally, to further control and maintain adhesives and
sealants viscosity, it should be stored in a controlled environment. Additionally, this
minimizes the volatile evaporation during storage. Care should be taken that the adhesive
barrel should be used within its shelf life. After the shelf life expires, the adhesive
viscosity doubles. Following text describes some of the issues associated with the
handling, mixing and application of the 2K adhesives within the automotive production
lines.

29
Pressure transfer of adhesive or sealant:
Pressure transfer of adhesives and sealants is a good method when compared to
mechanical transfer because if one component adhesive is transferred using latter method
the friction within the surfaces causes the flowing fluid to polymerize and cure. Transfer
distances should be maintained in such a way that it does not affect the rheological
properties of adhesive. Proper cleaning of hoses or flow pipes should be ensured before
application.
Measuring and mixing of a two component adhesive:
Accurate measurement of the two-component adhesive resin and hardener is vital
because if the catalyst or initiator percentiles are not accurate, it affect the adhesives
brittleness (catalyst too high) and its cure rate. For a sound joint it is necessary to mix
both initiator and resin in correct proportions. Utmost care should be taken while mixing
because any air entrapment may cause adhesive to foam after the E-coat or sealant ovens.
Degassing should be performed if adhesives are mixed in room temperatures and
humidity conditions.
Control of bead width and thickness:
Inline CCDs are used in assembly cells to track the variations in bead placement.
If any change in flow rates is found through destructive checks or a change in viscosity is
observed, the application speed is varied to compensate for the deviation. Several factors
should be considered before or during application of adhesive including; Lube oil or the
press hydrocarbon oil should not be present (concentration more than 3-4 grams/m2) on
substrate [4]. This influences the positional stability of bead and its adhesion strength.

30
Although the viscosity during application of adhesive is reduced for the ease of
application, the adhesive should be capable of regaining its viscosity to maintain bead
position and width. Also, to give sufficient handling strength and wash out resistance, the
adhesive should be pre-cured. The adhesive pumping distances should be within range to
keep rheology of the sealer within prescribed limits. And lastly, if the adhesive is applied
intermittently instead of continuous beads, phenomena such as stringing or tailing should
be monitored.
3.5 Curing
Final Curing: Traditional heating processes employ oven curing through one or a
combination of the three heat transfer modes, conduction, convection or radiation. A
typical problem in convection based ovens is the non-uniformity in the temperature
gradients across the substrate. Recent advancements in this field have paved the way for
new inventions. One such invention is electromagnetic curing as in Microwave chamber
curing. Also, induction heating, which employ variety of coils through which current is
passed generating eddy currents to act as a heat waves. Uniform heat distribution is
possible with this type of heating.
2K Adhesive chemistry:
Epoxy Resin:
Epoxy is available in single component heat cured adhesives or in multiple
component reaction cured adhesives. It is versatile because several formulations are
available to suit the application. Epoxy based adhesives have higher cross linking density
31
at higher temperatures. It has low surface energy value which allows it to adhere to
different types of substrates. Good adhesion may be due to the presence of hydrogen
bonds in its molecular structure and good wettability may be attributed to the presence of
hydroxyl groups. Because of its thermosetting nature, it has better tensile strength in
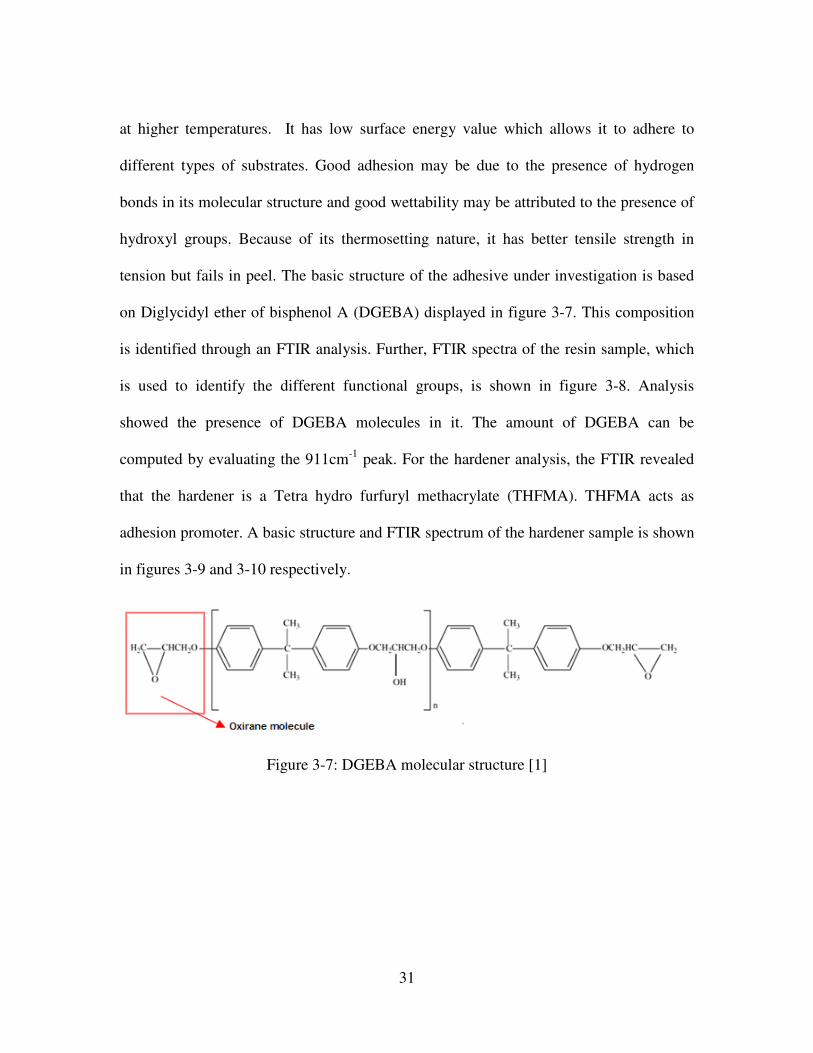
tension but fails in peel. The basic structure of the adhesive under investigation is based
on Diglycidyl ether of bisphenol A (DGEBA) displayed in figure 3-7. This composition
is identified through an FTIR analysis. Further, FTIR spectra of the resin sample, which
is used to identify the different functional groups, is shown in figure 3-8. Analysis
showed the presence of DGEBA molecules in it. The amount of DGEBA can be
computed by evaluating the 911cm-1
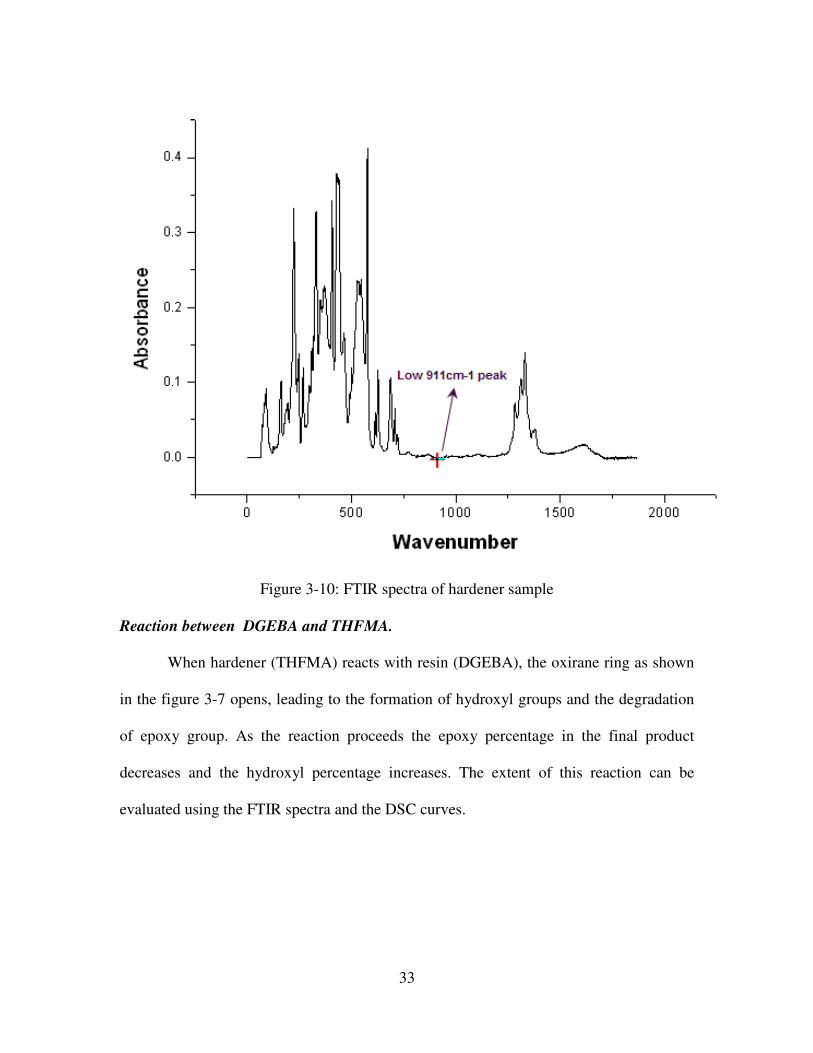
peak. For the hardener analysis, the FTIR revealed
that the hardener is a Tetra hydro furfuryl methacrylate (THFMA). THFMA acts as
adhesion promoter. A basic structure and FTIR spectrum of the hardener sample is shown
in figures 3-9 and 3-10 respectively.
Figure 3-7: DGEBA molecular structure [1]

32
Figure 3-8: FTIR spectra of resin sample
Figure 3-9: Basic Representation of hardener (Tetra Hydro Furfuryl Methacrylate
(THFMA) [11]
33
Figure 3-10: FTIR spectra of hardener sample
Reaction between DGEBA and THFMA.
When hardener (THFMA) reacts with resin (DGEBA), the oxirane ring as shown
in the figure 3-7 opens, leading to the formation of hydroxyl groups and the degradation
of epoxy group. As the reaction proceeds the epoxy percentage in the final product
decreases and the hydroxyl percentage increases. The extent of this reaction can be
evaluated using the FTIR spectra and the DSC curves.

34
CHAPTER 4
4 Laboratory tests
This chapter evaluated the impact of the process variations on the 2K adhesive,
rheological and mechanical attributes, and its impact on the final hemmed joint.
Following factors will be evaluated; Viscosity, Bead placement, Moisture entrapment,
Storage conditions, Surface contamination, Holding time, Curing rate, Presence of
solvents, and Mixing ratio of resin and hardener.
4.1 Sample preparation
As mentioned in section 1.1, upon studying four different production cells in an
automotive press shop, a fluctuation of ±6% is found in the adhesive mixing ratios. So
following samples are prepared in different mixing ratios on weight basis:
1. 3.5 ( Resin ): 1 ( Hardener)
2. 3.5 (Resin) : 0.75 (Hardener)
3. 3.0 (Resin) :1.0 (Hardener)
4. 3.5(Resin) : 1.5 (Hardener)
All the above mentioned samples are measured using table top digital tare balance
and are mixed using steel spatula and ceramic bowl. The two-component mixture should
be free from air. Entrapped air may cause voids in the adhesive and make it foam, when
the latter is exposed to higher temperatures. So when two component adhesives are mixed
in room temperature and conditions, vacuum degassing should be performed to remove
35
any entrapped air. To see the variations with holding time, the above mentioned samples
are closed in glass vials, which in turn stored in well conditioned laboratory environment.
The samples are post cured using convection oven to 150oC for 30 minutes to see the
variations in the prepared samples with post curing. Summer and winter conditioning is
also done. This is achieved through an environmental weathering chamber, with
temperature and humidity control.
Precautions:
1. Mixing Bowl is cleaned using laboratory cleaning solution to remove any dirt
2. Readings taken are accurate without any parallax errors.
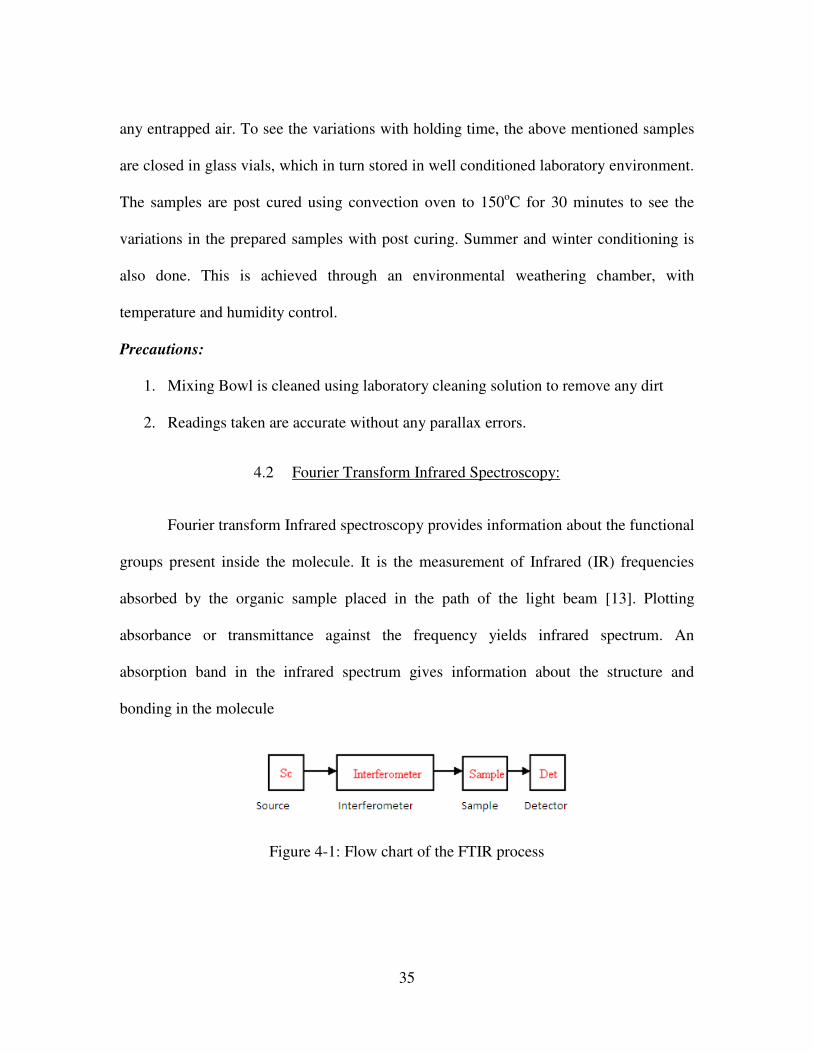
4.2 Fourier Transform Infrared Spectroscopy:
Fourier transform Infrared spectroscopy provides information about the functional
groups present inside the molecule. It is the measurement of Infrared (IR) frequencies
absorbed by the organic sample placed in the path of the light beam [13]. Plotting
absorbance or transmittance against the frequency yields infrared spectrum. An
absorption band in the infrared spectrum gives information about the structure and
bonding in the molecule
Figure 4-1: Flow chart of the FTIR process

36
Figure 4-2: FTIR table top apparatus [12]
The utilized FTIR system capabilities and specifications are as follows:
Resolution up to 0.125 cm-1 is possible, Spectra can be collected at 20 scans per second,
Spectral range :4000-400cm-1
, Detector: Deuterated triglycine sulfate (DGTS), Beam
Splitter: KBr, IR Source : Ever Glovmid IR to Far IR Source, Tungsten Halogen
FTIR Experiments: Figure. 4-3 displays the FTIR plots of all the four samples discussed
above (section 4.1). The FTIR apparatus used for this application is mounted with an
endurance swap top operation, to help maintaining a uniform contact between the sample
and the sampling surface.

37
Figure 4-5 shows enarged view of 911cm-1
peak Magnitude of 911 cm-1
indicates
the amount of unreacted epoxy present in the mixture [14, 15]. As DGEBA reacts with
the Hardener or initiator, its backbone is affected and epoxy ring opens to give hydroxyl
groups which ultimately leads to increase in 3350-3500 cm-1 peak (Figure 4-4) due to
increase in 2K reaction, which increases by increasing the mechanical quality between
the resin and hardener groups.
0 5 0 0 1 0 0 0 1 5 0 0 2 0 0 0 2 5 0 0 3 0 0 0 3 5 0 0 4 0 0 0 4 5 0 0
-0 .0 5
0 .0 0
0 .0 5
0 .1 0
0 .1 5
0 .2 0
0 .2 5
0 .3 0
911 E p o xy
H yd ro xyl p eaks
S am p le 1 (3 .5 :1 )
S am p le 2 (3 .5 :1 .5 )
S am p le 3 (3 .5 :0 .75 )
S am p le 4 (3 .0 :1 .0 )
Ab
so
rban
ce
W aven u m b er(cm -1 )
Figure 4-3: FTIR spectrum of four laboratory prepared samples

38
3000 3500 4000
0.00
0.05
Hydroxyl peaks
Sample 1 (3.5:1)
Sample 2 (3.5:1.5)
Sample 3 (3.5:0.75)
Sample 4 (3.0:1.0)
Ab
so
rban
ce
Wavenumber(cm-1)
Figure 4-4: Variation in 3350 - 3500 cm-1 peak

39
905 910 915
0.08
911 cm-1 Peak Sample 1 (3.5:1)
Sample 2 (3.5:1.5)
Sample 3 (3.5:0.75)
Sample 4 (3.0:1.0)
Ab
so
rban
ce
Wavenumber(cm-1)
Figure 4-5: Variation in 911 cm-1
peak
According to Bockenheimer et al [16] peak growth in wavenumber range 1770 to
1620 cm-1
may be attributed to degradation of epoxy groups (figure 4-6). The breaking of
many chemical bonds is considered to form new chemical groups such as C=O, C=N and
alkenes. All these bonds have absorption band in the range of 1700 cm-1
. As per the
following figure 4-6 the sample with higher hold time has higher magnitude peaks in this
region and the sample with lower hold time has lower magnitude peaks which indicate an
incomplete cure.

40
Figure 4-6: Peak growth between 1770-1620 cm-1
According to Bhatia et al [17], 1296 cm-1
peak is also a good indicator of the
degradation and formation of the functional groups with the reaction. Figure 4-7 shows
the variation in the 1296 cm-1
peak; the higher magnitude samples indicate that the
sample is not yet completely cured where as lower magnitude peak indicates the
completely cured sample. As per figure 4-7, the sample which is post cured using
convection oven has lower magnitude peak than the sample which is not post cured.
1600 1650 1700 1750 1800
0.00
0.05
0.10
0.15
0.20
0.25
0.30
Sample 1 (3.5:1)
Sample 2 (3.5:1.5)
Sample 3 (3.5:0.75)
Sample 4 (3.0:1.0)
Absorb
ance
Wavenumber(cm-1)

41
Figure 4-7: Variation in 1296 cm-1
peak
4.3 Differential Scanning Calorimeter
Basic Definition: This thermal analysis technique is used to measure the energy
difference between a reference material and a test sample; at a particular set temperature
and under identical temperature conditions, while being heated or cooled at a constant
and controlled rate. DSC equipment is divided into two types based on the mode of
energy input;
Power compensation DSC: Here the sample and the reference materials are controlled
using different furnaces. Temperatures are adjusted to nullify the temperature difference
1280 1320
0.04
0.08
1296 cm-1 peak1296 cm-1 peak1296 cm-1 peak1296 cm-1 peak
2K Sample
Summer condition sample
Winter condition sample
Post cured at 150 deg C
Ab
so
rba
nc
e
Wavenumbers(cm-1)

42
between the two furnaces and the energy spent to attain zero temperature is used to
determine the enthalpy or heat capacity of the sample against the reference [24].
Figure 4-8: Power compensation Differential Scanning Calorimetry
Heat flux DSC: Unlike power compensation DSC; the sample and the reference
materials are heated in the same chamber. The reference and the sample are mounted on a
metal disc. Temperature difference caused due to change in enthalpy or heat capacity is
noted and related to enthalpy change by calibration experiments [24].
Figure 4-9: Heat flux DSC

43
DSC thermographs provide following information: Glass transition temperature
(Tg), Melting temperature, Degree of cure with holding time, and the amount of anti
oxidants in adhesive (if any). However, following precautions should be noted; the
Samples which release large amounts of volatiles upon heating should not be loaded in
the chamber. Also, the table on which the DSC is mounted should not be disturbed during
loading of sample and experiment.
Sample preparation:
Samples that are to be loaded in DSC chamber are closed in the hermetic pans and
weighed using a sensitive weighing balance. Hermetic pan and lid assembly resembles
small flying saucer and can hold samples up to 20 milligrams, figure 4-10. Small hole is
pierced on the lid to vent any volatiles that are generated during heating. These pans are
generally made from aluminum and can withstand temperatures up to 600oC.
Figure 4-10: Hermetic pan and lid assembly
Experiment Objectives:
1. To determine the glass transition temperatures. This is to observe the point where
a sudden change in viscosity of the two-component adhesive (2K) changes.
Change in viscosity may lead to change in adhesive flow rate from the robot
dispenser, which in turn leads to changes in fill rate, bead shape and volume.

44
2. To determine the effect of holding time on the curing-rate of 2K adhesive. The
holding time is the time between application of adhesive bead and its final cure, in
the E-coat oven. It may be due to the travelling distance between press shop and
assembly shop, Die tooling changes and the production rate. Typically holding
time of 1-3 days is considered for this case study.
3. To observe the affect of storage conditions on the glass transition temperatures.
4. The influence of amount of elastomers in the PVC based sealant, on glass
transition temperature.
Apparatus:
Machine: TA Instruments Modular DSC 2920 Calorimetric device
Type of Purge: Nitrogen purge
Temperatures Range: 25 Deg C to 250 deg C
Ramp up rate : 10 deg C/min
Observations and discussions:
Determination of curing rate: To study this variation, two laboratory prepared samples
with the nominal mixing ratio of 3:1 (Resin: Hardener) are considered. The DSC curves
are generated to study the change in curing characteristics. DSC curve of the 2K sample
held for 20 hrs in the laboratory atmosphere is shown in the figure 4-12 and the
laboratory sample held for 48 hours is shown in the figure 4-11. From these figures,
changes in the endotherms and the exotherms are clearly observed, indicating a change in
the cure-rate. Furthermore, the sample with 20 hours holding is considered as a reference
for the un-cured rate. The cure-rate difference between the two samples is quantified,

45
through computing the enthalpy of reaction for each sample. This is done by integrating
the area under obtained DSC curves for both the samples. Equation 4.1 below gives the
formula to compute degree of cure [1].
� �∆������� ∆����
∆�������
(4.1)
Where ∆H un-cured = Area under the uncured sample (Curve 1), ∆H cured = Area
under the cured sample (Curve 2), and α= Degree of cure (%)
Figure 4-11: DSC curve of the 2K sample with 3:1 mixing ratio and hold time of two
days
-100 -50 0 50 100 150 200 250
-0.8
-0.6
-0.4
-0.2
0.0
0.2
0.4
0.6
165.24 deg C
131.89 deg C
14.28J/g
Sample Mix ratio 3:1
Holding time: Two days
He
at
Flo
w (
W/g
)
Temperature(deg C)

46
Figure 4-12: DSC curve of 2K sample with 3:1 mixing ratio and hold time of one day
Following observations can be made from above graphs (Figure 4-11 and Figure
4-12); Change in enthalpy of uncured sample (∆H uncured) = 43.64J/g, Change in enthalpy
of cured sample (∆H cured) = 14.28J/g, Substituting above values in equation 1 which
yields α = (∆H uncured -∆H cured)/ ∆H uncured = ((43.64-14.28)/43.64)*100= 67.27%. An
increase of 67.27% cure rate is observed is observed in the 48 hours sample than that of
20 hours sample due to increase in holding time of one day. The above method is
repeated for all the production line and the laboratory samples with the mixing ratios
(nominal ± 6%), resulting almost same cure rate value. The thermo-set cure rate
influences the hemmed joint strength and the spring back effects that arise after
hemming,
0 50 100 150 200 250 300
-1.0
-0.8
-0.6
-0.4
-0.2
0.0
0.2
0.4
Tg not observed
Sample started decomposing
Curing Curve
98.13 deg C
43.64 J/g
Sample Mix ratio: 3:1
Holding time: one dayH
eat Flo
w (W
/g)
Temperature(deg C)

47
Effect of humidity on glass transition temperature:
Laboratory prepared and production line samples are subjected to different
weather conditions that are based on data from the national weather center for local
conditions; summer (Temperature= 38odeg C, Relative Humidity= 85%) and winter
(Temperature= 25oC, Relative Humidity=50%). The samples are kept in environmental
chamber and then transferred to DSC chamber for testing. One of the environmentally
conditioned samples with the mixing ratio 3.2:1 tested in DSC chamber is shown in the
following figure 4-13. Results show that there is sharp endotherm which may be due to
the increase in volatiles release, because of weather conditioning.
Figure 4-13: DSC curve of environmentally conditioned sample
20 40 60 80 100 120 140 160
-1.0
-0.8
-0.6
-0.4
-0.2
0.0
0.2
0.4
0.6
0.8
Sharp endotherm observed
Sample ratio- 3.2:1
Summer condition sample
Heat
Flo
w(W
/g)
Temperature (deg C)

48
Effect of mixing ratios on glass transition temperature
Upon observing four different automotive door assembly lines, a fluctuations of
+/-6% in the two component adhesive mixing ratio is found, so four samples are prepared
with following mixing ratios (Resin: Hardener on weight basis), 3.5:1.0, 3.5:1.5, 3.5:0.75,
in addition to 3.0:1.0. All the four samples are loaded in the DSC chamber to observe the
variations in the glass transition temperature (figure 4-14). Results indicate that there is
only change of ±1oC variation in glass transition temperature (Tg) with the change in
mixing ratio.
Figure 4-14: Glass transition temperatures of laboratory prepared samples
0 20 40 60 80 100 120 140 160 180 200 220
-2.5
-2.0
-1.5
-1.0
-0.5
0.0
0.5
1.0
Tg=55.37 deg C
Tg= 54.64 deg C
Tg= 55.56 deg C
Tg = 54.73 deg C
3.5(R):1.0(H)
3.5(R):1.5(H)
3.5(R):0.75(H)
3.0(R):1.0(H)
Heat
flo
w (
W/g
)
Temperature (deg C)

49
Influence of elastomers on the Tg of sealant:
PVC based sealant is collected from the production and loaded into the DSC
chamber to observe the curing behavior and its glass transition temperature (figure 4-15).
The sealant curing is not observed when subjected to high temperatures, because of the
high percentage of plasticizers Di-Octyl phthalate present in it (from FTIR results). Also
no sharp glass transition temperature (Tg) is observed, which might be due to the same
reason.
Figure 4-15: DSC plot of PVC based sealant
4.4 Thermogravimetric analysis
Thermogravimetric analysis is a thermal analysis technique by which changes in
weight of specimen with time and temperature is measured and recorded. Unlike DSC,
while performing TGA experiments, there is no need to weigh the specimen separately,
TGA has its own inbuilt analytical balance with the crucible. This supports and guides
20 40 60 80 100 120 140
-10
-8
-6
-4
-2
0
2
Tg
PVC Sealant
Heat flow
(mW
)
Temperature (deg C)

50
the specimen to the electrical furnace. In built plotter plots the weight change of the
specimen with time and furnace temperature. Parameters that need to be considered while
performing the experiment are the type of purge gas and its flow rate. The TGA is
typically used to determine; Volatiles content, Moisture content, Effect of oven ramp up
conditions, and the Effect of reactive atmospheres on materials. TGA does not require
any special sample preparation
Experiment Objectives:
1. To determine effect of the environmental conditions (storage) on the volatiles
release rates. Volatiles, moisture and atmospheric contamination may be absorbed
by the adhesive in hem joint during storage or transportation. Volatiles can be a
quality concern after application and curing of post hem sealant.
2. To determine the effect of oven ramp-up on the volatiles release. This is to
identify the optimum oven conditions that may decrease the amount of volatiles
release.
Apparatus:
Machine: TA instruments AutoTGA 2950HR V5.4A, Type of purge: Air purge (To
simulate real time press shop conditions), Purge flow rate: 40 ml/min, Ramp up rate:
Different ramp up rates.
Observations and discussions:
Effect of environmental conditions on volatile release:

51
Summer condition:
Samples with mixing ratio of 3.2:1 are placed inside the environmental chamber,
where summer conditions are imitated. The temperature and humidity values are taken
from typical summer day in South Carolina; 38oC and 85% RH. The samples are then
transferred to the TGA chamber, to evaluate the volatiles release rate with different
storage conditions. It is observed that the percentage of volatiles release in this case is
almost equal to the volatiles release from the sample before storage. The plots of
volatiles release is shown in figures 4-16 through 4-18. Plots show that the storage of the
samples in these conditions has no influence on the volatiles release, detailed release rates
are indicated in table 4-A.
Figure 4-16: TGA analysis of sample with the mixing ratio of 3.2:1 and subjected to
summer conditioning

52
Figure 4-17: TGA of summer conditioned sample ramp up 20 C/min
Figure 4-18: TGA of summer conditioned ramp up 30 C/min
Mixing ratio Ramp up % Volatiles
3.2:1 10 7.28
3.2:1 20 6.85
3.2:1 30 4.096
Table 4-A: Volatiles release from summer condition samples

53
Winter condition:
Samples with the same mixing ratio are placed inside the environmental chamber
set to maintain winter conditions (25oC and 50% RH). A decrease in volatiles release is
observed in this case when compared to the summer storage scenario. This might be due
to the incomplete cure and the less absorption of moisture content from the atmosphere.
The percentage of volatiles release and plots are shown in figure 4-19 through 4-21, with
the results tabulated in table 4-B.
Figure 4-19: TGA analysis of winter conditioned samples subjected to ramp 10oC/min.

54
Figure 4-20: TGA analysis of winter conditioned sample subjected to temperature ramp
20oC/min

55
Figure 4-21: TGA analysis of winter conditioned sample subjected to temperature ramp
30oC /min
Mixing ratio Ramp up(C/min Volatiles(%)
3.2:1 10 6.5
3.2:1 20 4.792
3.2:1 30 0.6
Table 4-B: Amount of volatile release from winter conditioned samples
Observations:
It has been observed that there is a slight increase in the percentage of volatiles
released with the increase in the moisture content and the temperature when compared to
room temperature samples. There is tremendous decrease in the volatiles rates with the
decrease in the moisture content and temperature (winter condition sample). This
indicates that the surrounding atmosphere’s relative humidity affects the number of
volatiles release during curing

56
Effect of oven ramp up on volatiles release:
Samples with mixing ratio of 3.2:1 are considered for experiments. Temperatures
are raised up to 300oC, different ramp up conditions such as 10
oC/min, 20
oC /min and
30oC /min are used for the experiments. Figures 4-22, 4-23, and 4-24 are the
corresponding plots obtained from TGA apparatus.
Figure 4-22: TGA analysis of 2K sample subjected to ramp up 10oC /min

57
Figure 4-23: TGA of 2K sample with temperature ramp up of 20oC/min
Figure 4-24: TGA of 2K sample with temperature ramp up of 30oC/min
Mixing ratio Ramp up % Volatiles
3.2:1 10 7.632
3.2:1 20 5.66
3.2:1 30 4.05
Table 4-C: Volatiles release rate of 2K sample with the variation of ramp up rates

58
Inference from the above graphs is that when ramp up rate increases, the volatile
release depends upon the time that sample spends in the combustion chamber (Table 4-
C). Volatiles may be due to the evaporation of gases entrapped during mixing of resin
and hardener, chemical decomposition of the molecules [19].
4.5 E-coat oven curves
These TGA experiments are designed to simulate oven curves of E- coat and UBS
ovens. In figure 4-25 three stages; oven ramp up, hold and cool down are shown.
Experiment Objectives:
1. To determine the total volatile release from the 2K adhesive sample for each ramp
up cycle 10oC/min, 20
oC/min and 30
oC/min in E-coat oven
2. To determine percentage volatile release when PVC based sealant is applied over
2K adhesive. Here UBS oven conditions are simulated and volatile release is
computed for different ramp up conditions
Experimental conditions:
Conditions for the first stage of experiment; Type of purge: Oxygen purge, Oven:
E-coat oven, Peak Temperature: 160oC, Holding time: 30 Minutes
Conditions for second stage of experiment; Type of purge: Oxygen purge, Oven: sealant
oven, Peak temperature: 120oC, Holding time: 15 minutes.

59
Results and discussions:
First stage results:
Figure 4-25: E Coat oven conditions with different ramp up conditions (only adhesive)
Figure 4-26: E coat oven conditions (% volatiles versus temperature)
0
50
100
150
200
0 20 40 60 80
Te
mp
era
ture
(C
)
Time (mins)
Comprision b/w 10 C and 20 C and
30 C
10 C Ramp
20 C Ramp
30 C Ramp
92
94
96
98
100
102
0 50 100 150 200
% V
ola
tile
s
Temperature (C)
Comparision b/w 10 C, 20 C and
30 C
10 C Ramp
20 C ramp
30 C Ramp

60
Inspecting figures 4-25 and 4-26; Volatiles release during 10oC /min = 7.22%,
Volatiles release during 20oC /min = 4.59%, and Volatiles release during 30
oC/min =
3.24%. This leads to following conclusion;
As seen from the above trend as ramp up rate increases, volatiles release
decreases. This may be due to the fact at higher ramp up the adhesive cures faster there
by suppressing the volatiles release. [18]
Second stage results: It has been observed that; Percentage of volatiles release is almost
all the cases, Percentage of volatiles release is low at 30 C/min
Figure 4-27: UBS oven conditions (Adhesive+ sealant)
4.6 Estimation of flange fill by using micrographs
According to Adams [4] to achieve corrosion resistant and void free joint it is
necessary that the joint is completely filled by the adhesive as shown in the figure 4-29
below. Incomplete filled joints can act a buffer for the atmospheric air which expands
98
98.5
99
99.5
100
100.5
0 50 100 150
% V
ola
tile
s
Temperature (C)
Combined 10C,20C & 30C with Sealant
20C + Sealant
10C+ Sealant
30 C+ Sealant

61
when joint is cured in the curing oven. If expanded air does not find enough space to
escape it may lead to leakage and bubbles in the cosmetic sealer.
Following experiment is designed to monitor variation in the flange fill rates.
Apparatus Used:
Hand held microscope, Vernier calipers, Desktop computer with the Matlab code
running on it.
Experimental procedure:
Surface to be photographed must be held between the magnets without disturbing
the former. Capture the required image, measure pixel values of all the ten dimensions,
Note down all the dimensions, and Compare the observed dimension with the standards
to study capability.

62
Figure 4-28: Apparatus Used to measure flange fill
Figure 4-29: Hem flange showing various fill levels
Figure 4-30: Sample micrograph of hem joint with fill rate of 100%

63
4.7 Determination of gel point of PVC based sealant
To determine the gel point of PVC based sealant, which helps in predicting the
curing time and temperature inside the sealant oven. The gel point is where the viscosity
of the adhesive or sealant raises due to the increase in its average molecular weight. At
this point the sealant behaves as pseudo elastic, by virtue of which the sealant can no
longer be applied. While, the gel time is between the point of application of the sealant
and the gel state, where movement between the molecules ceases.
Experiments designed to determine the gel point:
Apparatus needed: FLIR uncooled micro-bolometric camera with tripod stand, Hot plate,
Acquisition software and PC.
Figure 4-31: Apparatus used to find gel point of PVC sealant

64
Figure 4-32: Plot from FLIR un-cooled camera
Figure 4-33: DSC cure of PVC based sealant
Above figure 4-32 shows the graph that is obtained from the thermal camera.
Basically a sealant layer (0.8 mm) is applied on the hot plate, which is calibrated
according to the sealant oven temperature profile. The time and the corresponding
20 40 60 80 100 120 140
-10
-8
-6
-4
-2
0
2
Tg
PVC Sealant
Heat
flo
w(m
W)
Temperature (deg C)

65
temperature are noted, when the first change of sealant is observed. The experiment is
repeated for different ramp up rates and the readings are tabulated, in table 4-D.
Ramp up Skin forming temp Skin forming time
30 C/min 55 1.83 min
40 C/min 70 3.16 min
50 C/min 80 2.33 min
Table 4-D : Skin forming temperatures at various ramp up rates (Hot plate)
Results:
Curves collected from hot plate experiment and from DSC chamber (Figure 4-33)
are compared with each other. Results show that the values are correlating.

66
CHAPTER 5
5 Conclusions and future work
This manuscript introduced the usage of the DSC, FTIR, and TGA analyses, to
investigate the process variations impact on non-load bearing adhesives, used for
automotive hem-flanges. The FTIR investigation provided information about the different
peaks indications; the 911 cm-1
is used to investigate the mixing ratio of the resin and
hardener; showing a resolution of ±6% in current epoxy ratio, while the 3350 – 3500 cm-1
peak is used to study the early cure using the hydroxyl group, and hence the mixing
quality. Changes of peak magnitudes in the region 1770 cm-1 to 1620 cm-1
is also
observed. It has been observed that 1296 cm-1
peak can be a good indicator of the
degradation of the various functional groups due to the reaction. Further, the DSC is used
to quantitatively decide on the cure rates for samples held at different holding times,
where a 67% cure-rate difference is computed between samples held for 1 and 2 days,
which is found to be independent of the mixing ratio. Lastly, the TGA curing provided
information about the adhesive sensitivity to the weather conditions and the relative
humidity levels. It has been observed that storage conditions do have impact on the
volatile content of the current automotive two-component adhesive. Less volatiles are
observed in the winter conditioned samples. Influence of flange fill rates is high on the
moisture entrapment and volatile evaporation rate. Additionally, new findings are
reported about the effect of the curing profiles on the adhesives’ volatile evaporation
rates, mainly the ramp-up region. Briefly, this manuscript introduced and discussed the

67
evaluation procedures and criteria that might be used, when discussing the impact of the
hemming process variations on a non-load bearing adhesive, especially those used for
automotive hemmed joints.
Future work include; the identification of the expansion or the contraction in the 2K
adhesive using ThermoMechanical analyzer (TMA), and the identification and analysis
of the viscoelastic behavior of two-component adhesive using Dynamic mechanical
analyzer (DMA). Also, the Thermal imaging techniques may be applied to detect the
adhesion problems due to the creation of the voids, bubbles inside the adhesive which are
responsible for the lack of adhesion. Furthermore, a full quantitative analysis of FTIR
graphs to determine the mixing ratios using FTIR peaks.
68
LIST OF REFERENCES
1. Petrie, E. M. (2007). Hand book of Adhesives and Sealants. New York: McGRaw-
Hill Companies, Inc. (Echard , Cordes H;, 2003) (Echard , Cordes H;, 2003)
2. Baldan, A. (2004). Review Adhesively- bonded Joints and repairs in metallic alloys,
polymers and composite materials: Adhesives, adhesion theories and surface
pretreatment. Journal of Materials Science , 1-47.
3. Mirdamadu, M., & Korchnak, G. (2004). Great Automotive designs enabled by
advances in adhesive bonding. Great desin in steel Seminar .
4. Adams, R. D. (2005). Adhesive Bonding: Science, Technology and applications.
Cambridge England: Woodhead publishing limited.
5. Echard , Cordes H;. (2003). Adhesives in Automotive Industry. In K. L. Mittal, &
A. Pizzi, Handbook of Adhesive Technology (pp. 999-1015). New York: Marcel Dekker,
Inc.
6. Lin, G., Iyer, K., Hu, S. J., Cai, W., & Marin, S. P. (2005). A computational design-
of-experiments study of hemming process for automotive aluminium alloys. Journal of
Engineering Manufacture , 711-715.
7. Miller. (July, 2005). Handbook for Resistance Spot welding. Retrieved October
2007, from Millerwelds: www.Millerwelds.com
8. Specialchem4adhesives. (n.d.). Retrieved from www. specialchem4adhesives.com

69
9. Barnes, T. A., & Pashby, I. R. (2000). Joining teqniques for aluminium spaceframes
used in automobiles part II- adhesive bonding and mechanical fasteners. Journal of
Materials processing technology , 99 (1-3), 72-79.
10. Patent No. 6660805. United States of America.
11. Sartomer. (n.d.). Product detail : SR203. Retrieved April 2007, from Sartomer:
http://www.sartomer.com/proddetail.asp?plid=1&sgid=2&prid=SR203
12. Rao, A. (2007, October 25). Infrared Spectroscopy (FTIR). Retrieved December
2007 , from Anderson materials: http://www.andersonmaterials.com/ftir.htm
13. Daniel, N., & Hon, S. (2003). Handbook of adhesive technology. In K. L. Mittal, &
A. Pizzi, Handbook of adhesive technology (pp. 293-324). New York: Marcel Dekker.
14. Kim, B., & Inoue, T. Dynamic Mechanical and fourier transform Infrared analyses
on the very late stage of the cure process in thermoset/thermoplastic blends; tri functional
epoxy/poly (ether sulfone. Polymer , 36 (10), 1985-1989.
15. Sharma, S., & Luzinov, I. (2006). Ultrasonic curing of one part epoxy resin.
American Chemical society
16. Bockenheimer, C., Fata, D., & W, P. New aspects of aging in Thermal Networks.
Journal of applied polymer science , 91 (1), 361-368.
17. Bhatia, D., Alam, M., & Sarkar, P. Specular reflectance and derivative
spectrometric resins on lac resin blends. Pigments and resin Technology , 36 (1), 18-29
18. Lapique, F., & Redford, K. (2002). Curing effects on viscosity and mechanical
properties of commercial epoxy resin adhesive. International journal of adhesion and
adhesives , 22, 337-346.

70
19. Wu, X., & Hao, H. (2005). The effect of adhesive curing condition on bonding
strength in auto body assembly. Journal of manufacturing and engineering , 127, 411-4
20. Chang, T. D., Carr, S. H., & Brittian, J. O. (1982). Studies of epoxy resin systems:
Part B; Effect of crosslinking on the physical properties of an epoxy resin. Polymer
Engineering and science , 22 (18), 1213-1220
21. Ivatyali, H., & Larris, S. J. (2004). Experimental investigation of forming defects in
flat surface- convex edge hemming: roll,recoil and wrap. Journal of materials processing
technology , 153-154, 913-919.
22. Zhang, G., Wu, X., & Hu, s. J. (2001). A study of fundamental mechanisms of warp
and recoil in hemming. Journal of engineering materials and technology , 436-441.
23. Lin, G., Iyer, K., Hu, S. J., Cal, W., & Marin, S. P. (2005). A computational design
of experiments study of hemming process for automotive aluminium alloys. Journal of
Enginering Manufacture , 711-715
24. Bhadesia, H. (n.d.). Differential scanning calorimetry. University of cambridge,
Material science and technology.
25. Petrie, M. E. (n.d.). Thermal analysis teqniques for adhesives. Retrieved February
14, 2007, from Specialchem4adhesives: www.specialchem4adhesives.com
26. Balkova, R., Holcnerova, V., & Cech, V. (2002). Testing of adhesives for binding
of polymer composites. International Journal of adhesion and adhesives , 22, 291-295.
27. Ahn, J. K., Eorn, S. Y., & Shim, Y. T. (1994). Characterization of structural
adhesives for load bearing composite structural adhesives. Composite structures, 27, 57-
64.

71
28. Maheri, M., & Adams, R. D. (2002). Determination of structural adhesives for
loading composites used in structural applications. International journal of adhesiona nd
adhesives , 22, 119-127.