analysis of light precipitation retrievals from a...
TRANSCRIPT
1
ANALYSIS OF LIGHT PRECIPITATION RETRIEVALS FROM A CONSTELLATION OF SPACEBORNE MICROWAVE SENSORS
F. Joseph Turk
Naval Research Laboratory, Marine Meteorology Division 7 Grace Hopper Avenue, Monterey, CA USA 93943
ABSTRACT Passive microwave radiometric observations of clouds from multi-channel imaging sensors onboard low Earth-orbiting (LEO) environmental satellites are now a vital operational dataset. The Special Sensor Microwave Imager (SSMI) is a seven-channel conically scanning radiometer onboard the Defense Meteorological Satellite Program (DMSP) satellites, which have been gathering hydrological data records since 1987. The SSMIS sensor onboard the DMSP F-16 satellite, launched in January 2003, is a 24-channel PMW radiometer designed to combine expanded imaging and sounding channels on a single conically-scanning radiometer. In this article, we compare SSMI and SSMIS precipitation screening capabilities and retrieved values of light precipitation (under 2 mm hr-1) for a three year period beginning in January 2004. For comparison with other satellite platforms with microwave-based precipitation retrieval capabilities, the statistical analysis is also carried out using precipitation datasets from the Tropical Rainfall Measuring Mission (TRMM) Microwave Imager (TMI) and precipitation radar (PR), the Advanced Microwave Scanning Radiometer (AMSR-E) onboard Aqua, WindSat onboard Coriolis, and the Advanced Microwave Sounding Unit (AMSU) sensors onboard the National Oceanic and Atmospheric Administration (NOAA) satellites. Both detection and quantification of light precipitation remain a key challenge for PMW-based retrieval algorithms, especially for land backgrounds and cold seasons. The analysis is subsetted by precipitation rate, background type (water or land), northern and southern hemisphere latitudal region (tropical, subtropical and middle latitudes), and local observation time. While the seasonal precipitation trends are noted by all satellites, differences in algorithm type and differing sensor channel capabilities lead to differences in the amount of zero and light rain detected as seasons, latitudes and backgrounds change. Development of techniques which merge multi-satellite precipitation estimates will be a key component of the future Global Precipitation Mission (GPM), and these analyses also complement ongoing light precipitation analyses from the recently deployed CloudSat W-band radar.
1. INTRODUCTION The Defense Meteorological Satellite Program (DMSP) began a program of operational passive microwave (PMW) imagery with the launch of the first Special Sensor Microwave Imager (SSMI) in 1987, and which continues today (early 2007) with three working sensors (F-13, F-14 and F-15 platforms). The SSMI is a 7-channel, conically scanning imager with a swath width of 1400-km, which was complemented by separate across-track scanning temperature and moisture sounding systems (SSM/T and SSM/T2) on several of the satellites [Lee95]. Imaging and expanded sounding capabilities were merged with the development of the SSMIS system, a 24-channel, conically scanning system with a 1700-km swath. The first SSMIS was launched in October 2003 on F-16, followed by F-17 in November 2006. Three more (F-18, F-19 and F-20) are slated over the next 2-7 years. While most of the imaging channels have the same center frequency and across-track sampling interval on both the SSMI and SSMI, the most notable changes are the difference in 85 GHz channel (85.5 GHz on SSMI and 91.65 GHz on SSMIS), and the availability of the 150 GHz imaging channel. The 50-60 GHz temperature and 183.3 GHz water vapor

2
sounding channels are provided at the same across-track sampling interval (37.5-km) as the 150 GHz channel (the SSM/T and SSM/T2 were much coarser scale compared to the SSMI), which eases combined imaging/sounding applications. The first two rows of Table 1 outline the SSMI-SSMIS channel differences. After the launch of the first SSMI, a multi-year calibration and validation effort was initiated to assess the absolute calibration and accuracy of the instrument and to implement initial algorithms, known as environmental data records (EDR) [Colton99]. The Shared Processing Program Algorithm Research Panel (ARP) [Colton94] was established as a bridge between the algorithm developers and the operational users, with responsibility to decide upon and implement new EDR algorithms (e.g., snow cover, sea ice, water vapor, etc.). For precipitation, the development and validation of the SSMI algorithms through the ARP served as the basis for newer algorithms developed for subsequent PMW systems, such as the joint US-Japan Tropical Rainfall Measuring Mission (TRMM) [Kummerow01]. During the 1990s, several multi-algorithm validation programs [Adler01][Ebert96][Smith98] took place to evaluate (and validate with surface gauge networks and radars) the performance of the various SSMI precipitation algorithms under development. Similar calibration and validation is ongoing for the SSMIS [Kunkee07][Swadley07]. As a result, the DMSP program has now accumulated an uninterrupted 20-year record of global hydrological products. Beginning in 1997 with the launch of the TRMM, the precipitation datasets from the DMSP satellites were augmented with the TRMM Microwave Imager (TMI) and its companion Precipitation Radar (PR). In 2001, TRMM was followed by the Advanced Microwave Scanning Radiometer (AMSR-E) onboard the Earth Observing System (EOS) Aqua satellite, followed by a similar AMSR onboard the Advanced Earth Observing System (ADEOS-2) in late 2002. The WindSat polarimetric radiometer was launched aboard the Coriolis spacecraft in 2003 [Gaiser04]. Along the way, additional DMSP systems were launched (F-13 in 1995, F-14 in 1997, F-15 in 1999), as well as operational National Oceanic and Atmospheric Administration (NOAA) satellites (NOAA-15 in 1998, NOAA-16 in 2000, NOAA-17 in 2002, NOAA-18 in 2005) and EUMETSAT’s METOP-1 satellite (2006). All of these platforms carry PMW sensors (the PR is a 13.8 GHz spaceborne radar system) and have channels in imaging and/or sounding channels sensitive to precipitation-sized hydrometeors, and operationally-managed precipitation retrieval algorithms. Table 1 lists the center channels frequencies of each PMW sensor, partitioned into commonly used imaging and sounding channel bands between 6 and 183 GHz which are sensitive to emission and scattering by precipitation-sized hydrometeors. In the years following the release of the TMI and PR swath-level (per-sample instantaneous estimates) precipitation datasets, increased attention was directed to methods and techniques that merge the instantaneous estimates from the SSMI and TMI sensors [Adler00]. Each release of a new microwave-based satellite precipitation dataset provides additional data for the merging type algorithms, and aids in reducing errors and uncertainties related to the different synchronous local sampling times of low Earth-orbiting (LEO) satellites (TRMM is the only non sun-synchronous satellite in Table 1). Since the primary goal of the merging techniques is to produce precipitation products at finer spatial scales representative of accumulated precipitation over sub-daily times scales, we refer to them as high resolution precipitation products (HRPP). The rapid development of HRPP’s post-TRMM was driven not only by the increase in the number of microwave-capable LEO satellites and near realtime availability of their associated instantaneous-level precipitation datasets, but also by successful deployments of next-generation geostationary visible/infrared (VIS/IR) imaging systems. Six launches of the Geostationary Operational Environmental Satellite (GOES) have taken places between 1994 and the present, with its 5-channel imager and 15-minute update schedule over the continental United States. In Europe, EUMETSAT launched the Meteosat Second Generation (MSG) in 2002 and 2005, with its 12-channel imager and 15-minute fulldisk update cycle. In Europe, the EURAINSAT program developed and tested several HRPP’s using MSG data [Levizzani07]. Other rapid-update geostationary satellite imagers with operational availability were launched by China (FY-2C in 2004) and Japan (MTSAT in 2005 and 2006).

3
The most well-supported and commonly requested HRPP are the Global Precipitation Climatology Program (GPCP) products [Adler03][Huffman01][Huffman97]. Many other HRPP techniques have been developed in either operational or research modes. The International Precipitation Working Group (IPWG) maintains an algorithm inventory of many of these HRPP techniques [TurkBauer05]. In general, these HRPP fall into two categories. The GPCP is an example of a calibration type HRPP, whereby PMW-based precipitation estimates and/or raingauge data are used to adjust or calibrate coincident-time geostationary VIS/IR data. In the merging process, the VIS/IR-based estimates are used to fill in the time periods between PMW satellite revisits. In calibration type HRPP’s the geostationary data are used as quantitative precipitation estimates. In contrast, advection-type HRPP’s use time-sequential geostationary VIS/IR imagery to transport PMW-based precipitation features from one PMW overpass to the next, advecting the precipitation between PMW satellite revisits. In advection-type HRPPs the geostationary data are used only as a transport mechanism. What all HRPP have in common is the quantitative dependence upon the PMW-based instantaneous precipitation estimates; these are the fundamental building blocks of all HRPP techniques. As more PMW sensors and precipitation datasets are added to the constellation of satellites, a HRPP must adapt to the different sensors, accomodating the satellite revisit schedule, different precipitation algorithms for different PMW sensors, each with varying capabilities and underlying error characteristics. For operational algorithms the data latency issue is also important in the satellite merging hierarchy (LEO satellite data typically arrive after geostationary data, but some LEO data arrive faster than others, and production of near realtime HRPP’s involves a tradeoff of preferred PMW datasets for improved HRPP latency.) Therefore, it is necessary to know a-priori the characteristics of each microwave-based precipitation dataset that contributes to the blending process in order to determine the overall characteristics of the HRPP. For example, one PMW satellite may be superior at the detection of light precipitation over land, whereas another may be best at estimating precipitation over-ocean in the tropical latitudes. Knowledge of how the individual PMW satellite datasets intercompare with one another over various conditions (seasons, surface backgrounds, precipitation intensity) provides information to inter-calibration or referencing techniques. Until fairly recently, there was no organized evaluation and validation program in place for HRPP techniques. In 2003, the IPWG established a program for validation of daily precipitation estimates from several near realtime HRPP techniques and numerical weather prediction (NWP) models against high-quality surface raingauge and radar networks [Ebert07]. One of the notable findings is the predominance of light precipitation. When the occurrence and accumulation of precipitation was disaggregated into precipitation intensity bins, the validation datasets showed that between 40 to 70 percent of the occurrence was associated with non-zero precipitation, and that half of the occurrences were associated with accumulations under 1 mm day-1. Since the various PMW precipitation datasets are the key input data to the HRPP techniques, this emphasizes the need to better examine their relative capabilities of each satellite in both the detection and estimation of light precipitation rates. Both detection and quantification of precipitation in this range remain a key challenge for PMW-based retrieval algorithms, especially for land backgrounds and cold seasons [Bennartz06]. In this manuscript, we compare precipitation screening capabilities and retrieved values of light precipitation (under 2 mm hr-1) for microwave sensors onboard eleven different microwave-based satellites (4 DMSP, 4 NOAA, TRMM, Aqua, Coriolis) for a three year period beginning in January 2004. The analysis is subsetted by precipitation rate, background type (water or land) northern and southern hemisphere latitudal region (tropical, subtropical and middle latitudes), and local observation time. For TRMM, the TMI and PR datasets are included. While the analysis presented here is purely an intercomparison and not a validation, it does provide information that will be needed by HRPP merging algorithms as well as to inter-satellite referencing techniques, a theme which will be important in the future Global Precipitation Mission (GPM). In addition, these

4
analyses will complement global light precipitation analysis from the recently launched CloudSat W-band radar [Lecuyer06]. 2. Dataset Preparation. The data used in this analysis was gathered from the operationally available precipitation datasets that are made available in near realtime for the eleven satellites mentioned in Section 1, beginning in January 2004. For SSMI and SSMIS, the precipitation algorithm devised by [Ferraro 97] at the NOAA National Environmental Satellite Data Information Service (NESDIS) has been in operational use at both NESDIS and at the US Navy Fleet Numerical Meteorology and Oceanography Center (FNMOC) since 1995. The primary algorithm used is an 85 GHz scattering-based algorithm over land, and a combined 85 GHz scattering and 19/37 GHz emission over ocean, both of which have been calibrated with ground-based radar data. F-13, F-14 and F-15 are included with F-16 data beginning in January 2006. For TRMM, the near realtime 2A12 and 2A25r1 datasets distributed by the TRMM Science and Data Information Service (TSDIS) were used for the TMI and PR, respectively. For the TRMM data, we note that Version 7 of the algorithms was put into place in early January 2005, replacing Version 6. For AMSR-E, the L2B global swath rain rate algorithm [Wilheit03] implemented by the NOAA Near Realtime Processing Environment (NRTPE) was used, beginning in March 2005. For WindSat, the output EDR dataset resampled to the 6.8 GHz swath coordinates was used, with the precipitation algorithm developed for the Physical Oceanography Distributed Active Archive Center (PO.DAAC) [WindSat06] beginning in May 2006. It is an adaptation of the GPROF algorithm developed for TRMM [Kummerow01], modified to accommodate the lack of 85 GHz channels on WindSat, and provides retrievals only over ocean backgrounds. For the NOAA satellites, the AMSU precipitation algorithm developed at NOAA-NESDIS [Weng03] and distributed operationally by the Microwave Surface and Precipitation Products System (MSPPS) [Ferraro05] is used. Since the lowest frequency on AMSU-B and MHS is 89 GHz, the AMSU precipitation algorithm is based upon a nonlinear rain-IWP (ice water path) relationship with the 89 and 150 GHz channels. Coefficients to this relation are based upon further classification of the scene with the 183 GHz water vapor sounding channels. While there are other promising AMSU-based precipitation estimation techniques available [Chen03], the data distributed by MSPPS are available operationally in near realtime. The instantaneous swath-level precipitation datasets from these datasets were binned into multidimensional histograms, binned into 0.2 mm hr-1 precipitation rate bins including zero, background type (water or land), latitude to the nearest degree, and hour of local observation time. For the purposes of this study, we will focus only on the first two precipitation bins, and analyze zero-rain and non-zero rain under 2 mm hr-1 under a variety of conditions. To avoid confusion, we will break up the following discussion into three groups of sensors, these being the DMSP F-13 through F-16 sensors (Section 3), the next four being the TMI, PR, AMSR-E and WindSat (Section 4), and the last four being NOAA-15 through NOAA-18 (Section 5). In all cases the presented figure format is consistent. The local observation times for each of these eleven satellites are depicted in Figure 1a-1c. Figure 1a is for an observer located at the equator (0N 100W), and Figures 1b and 1c are for observer locations at 35N and 60N latitude, respectively. In this figure, every overpass that provided an observation at this location during calendar year 2005 is plotted

5
with a color symbol representing each satellite (the sensor swath is taken into account.) The DMSP and Coriolis satellites are clustered between 18 and 21 (6 PM to 9 PM) ascending node time, and the otherwise long revisit between morning to evening is shortened by the local afternoon overpasses of Aqua, NOAA-16 and 18, and TRMM. TRMM’s asynchronous sampling pattern repeats every 28 day repeat in the tropics and 46 days at the middle latitudes [Negri02]. The NOAA satellites, with their 2200-km swath, substantially improve overall worst-case revisit times. At higher latitudes, the wide swath AMSU sensors increasingly cover what would otherwise be long revisit times and more observations are available from consecutive orbits. By differencing each crossing time from the previous crossing time, the overall sequence of revisit time is obtained. Using the data in Figure 1b (35N latitude), Figures 2 depicts the revisit time sequence for the case where the NOAA satellites are omitted (Figure 2a) and when they are added back in (Figure 2b). The reduction in worst case revisit time in dramatic (revisit times exceeding three hours are reduced from 30% of the year to 11 %.) In Figure 2b, both Aqua and NOAA-18 are largely responsible for maintaining the worst-case revisit to no more than six hours. The collection of TRMM points near 1.6 hours (TRMM orbit time) occurs when two or more consecutive TRMM orbits provide an observation. This happens at latitudes near the maximum latitude sampled by TRMM of 35N and can be noted by the clumps of TRMM observations Figure 1b, which are not present in Figure 1a. Ideally, therefore, satellite precipitation intercomparisons should be done with strict regard to the local satellite observation time. For example, NOAA-18 would never be compared with F-15, since their ascending or descending local observing time never intersect. This would be especially true if the underlying precipitation had a known daily cycle [Bell93][Salby97] and will be discussed more in Section 4b. However, since these satellite data are being averaged globally by latitude, various precipitation regimes are being averaged together, so therefore we have not separated the analysis into local time intervals. In principle, multi-satellite HRPP precipitation products prepared by merging intermittent time observations from a constellation of satellites should provide an improved quantification of the accumulated precipitation (over an accumulations period for a month, for example) than any one single satellite. However unless the inter-satellite characteristics are known, the merged products may be only marginally better than those from any one satellite type; the addition of more and more satellites may not necessarily lead to a substantial improvement in common precipitation validation metrics such as correlation and bias [Ebert07]. 3. Analysis of DMSP-based precipitation estimates. Despite the fact that the legacy SSMI and SSMIS sensors possess approximately the same on-Earth resolutions and nadir viewing angle for their imaging channels, there are several differences that render difficulties in several Environmental Data Records (EDR) as well as in normal image interpretation. The most notable is the 6 GHz difference between the SSMI 85 and SSMIS 91 GHz channels. One would expect that over clear scenes over water, that TB
85 - TB91 would be slightly negative (owing to increased water
vapor absorption at 91 GHz) and positive over precipitation (owing to increased 91 GHz scattering of the upwelling thermal emission within the frozen hydrometeors.) However, since these two channels are on different sensors and different platforms with different local crossing times, it is difficult to discern how this difference would be manifested in

6
EDRs that rely upon the 85 GHz scattering index (SI85) to identify scattering materials [Grody91]. The coefficients embedded in the SI85 of [Grody91] were tuned to the SSMI channels and may give slightly different results when applied without adaptation to the SSMIS.
a) Effect of 85/91 channel difference on DMSP precipitation screening. The SI85 is used as one of the main up-front tests during routine processing of SSMI and SSMIS data. Examples of surfaces and atmospheric constituents that significantly scatter microwave radiation are precipitation, dry snow, aged sea ice, glacial ice and deserts. As noted by [Grody91], in SSMI data these surfaces exhibit TB
22V > TB85V. Conversely,
absorbing materials include clouds, melting snow, new sea ice, vegetation and wet soil, where TB
22V < TB85V. Computation of the SI85 involves computing the non-scattering
contributions of the 85 GHz measurements (the term in parentheses in (1) and (2) below), and comparing that to the measured 85 GHz TB. The NESDIS algorithm uses the SI test as an up-front screen to determine whether the scene contains precipitation. The three term non-linear form developed by [Grody91] has been used for SSMI precipitation screening since the mid-1990s for all SSMI processing at the United States Naval Fleet Numerical Meteorology and Oceanographic Center (FNMOC), Ocean Background: SI85= (-174.4 + 0.715*TB
19v + 2.439*TB22v - 0.00504*TB
22v*TB22v) - TB
85v (1) Land Background: SI85= (451.9 - 0.44*TB
19v - 1.775*TB22v + 0.00574*TB
22v*TB22v) - TB
85v (2) In the current configuration for precipitation screening, SI85 values exceeding 10 are classified as scattering-based precipitation, which is representative of ice-phase precipitation and the majority of the rainrates exceeding 5 mm hr-1. For SI85 < 10, a series of emission tests are done on the 19, 22 and 37 GHz channels to capture light rainrates, typically from clouds exhibiting less mature or decaying, weaker ice phases, that go undetected by the SI85 [Ferraro98]. For the case of precipitation retrieval, the importance of this “up-front” SI-based screen cannot be underestimated. Since the SI determines the rain/no-rain threshold, subtle changes to the input channels, for example, could otherwise permit non-raining pixels to be flagged as light rain, or vice versa (a zero-rain observation is just as important as a non-zero rain observation.) As pointed out by [Ebert07], the majority of precipitation that falls at higher latitudes originates from light rainfall rates under 1 mm day-1, and the conditions that often accompany light precipitation (colder background surfaces, lower tropopause heights) and the systems (shallower clouds, extratropical cyclones) present the most challenging conditions to existing MW retrieval techniques.
(b) SSMI and SSMIS precipitation over ocean. We demonstrate the consistency of the DMSP precipitation records by referring to Figure 3. The upper left panel (a) depicts the fractional contribution of all DMSP SSMI (SSMIS on F-16) over-ocean pixels that were determined to be non-raining (zero rain), from F-13, F-14, F-15 and F-16 datasets, for three years beginning in January 2004, and covering only the tropical latitude belt between 5S to 5N degrees latitude. A ±15 day running mean was applied to allow trends to be noticed. Similarly, the upper right (Figure 3b) shows the fractional contribution of all non-zero rain that was less than 2 mm hr-1. Note that the

7
typical fractional contribution of zero rain is about 0.95 (that is, on a global basis it is raining about 5 % of the time in the tropics.) There is a weak seasonal trend towards more rain (i.e, less fractional zero rain contribution) in April-May, but general all SSMIs (F-13, F-14 and F-15) are well-matched, except for F-15 after August 2006 which detects slightly more zero-rain 1. F-16 follows the same trends, but detects about 2 % more zero-rain, which manifests itself in Figure 3b as about 2 % less rain under 2 mm hr-1. Figures 3c and 3d are of an identical format as Figures 3a and 3b, but cover the sub-tropical region in the northern hemisphere from 10N-20N latitude. Conversely, Figures 3e and 3f cover the sub-tropical region in the southern hemisphere, from 20S-10S latitude. Figure 3c shows a distinct seasonal trend in precipitation, especially in the northern hemisphere, ranging from 98 % no-rain conditions in March-April (spring) to 92% in September-October (autumn), with an opposite, less apparent behavior in the southern hemisphere. The SSMIs are again well-matched but F-16 overestimates by 2-3 % in both hemispheres. Figure 3g-3j are identical in style and layout to Figures 3c-3f, except that they depict the middle latitudes between 30N-40N and 40S-30S. The seasonal trends are markedly different than the sub-tropical ones, especially in the northern hemisphere. In the northern hemisphere, highest no-rain conditions exist in July-August (summer) and lowest in January-February (winter), with an more apparent opposite trend in the southern hemisphere. While this may seem counterintuitive (one would expect a higher probability of rain during the summer months), this is an over-ocean analysis only. The probability of oceanic precipitation at high latitudes is largest during the winter months owing to predominant low pressures systems situated in the Gulf of Alaska and near Iceland [Arkin07]. In fact, closer analysis of Figure 3g shows various shorter-period variations superimposed upon the seasonal trend (e.g., near December 2004), related to passage of individual low pressure systems during the winter months. Similar low pressure systems in the southern hemisphere latitudes are weaker and the inter-seasonal differences are less apparent. Overall, the SSMIS on F-16 overestimates the fractional contribution of zero-rain by 2-4 %, with the largest difference occuring in the winter months. Since the atmosphere emits slightly more at 91 GHz than it does at 85 GHz for clear scenes over water, the second term in (1) is slightly larger. Therefore it will take slightly more emission (first term of (1)) to exceed the SI85 threshold for precipitation. As a result, the SSMI classifies slightly more scenes as non-raining.
(c) SSMI and SSMIS precipitation over land. This section considers the same datasets and analysis as Section 1b, but considers DMSP over-land pixels only. Therefore the 10 panels that will be shown in Figure 4 are identical in layout and scaling to Figure 3, enabling ease of comparison to DMSP land/ocean background differences. In the tropical latitudes, the screening behavior (Figure 4a) appears to have a weak 6-month cycle, unlike the over-ocean data which showed a weak 12-month behavior. This may be due to combination of the data from 5N to 5S (any over-land seasonal behavior 1 We note that in August 2006 the RADCAL beacon was activated on DMSP F-15, which has been shown to cause noticeable interference in the SSMI 22 GHz channel. Hereafter F-15 data should not be interpreted after this date.

8
from one hemisphere is being superimposed with the other 6 months out of phase). The SSMI-SSMIS difference in screening (Figure 4a) and light rain (Figure 4b) is much less noticeable than for the corresponding over-ocean data. Since land surfaces are radiometrically warm, the 85/91 GHz difference due to the extra atmospheric emission at 91 GHz is less of an issue over land than over ocean. On average, about half as much light rain (2.5 %) falls over land as over-ocean (5 %) at these latitudes. Another way to state this is that for rain rates greater than 2 mm hr-1, the DMSP estimates about twice as much over land than it does over-ocean. The high and variable surface emissivity of land compared to ocean reduces the utility of the NESDIS algorithm to the scattering-based component only, which detects mainly convective precipitation which dominate the heaviest rain events over land (the increased reliance upon scattering is demonstrated in all panels of Figure 4, with the more noticeable F-15 RADCAL data artifacts.) For the sub-tropics (Figures 4c-4f), the most zero-rain occurrences in the both hemispheres in the winter months of each year. About twice as much light rain is estimated in the southern hemisphere summer months (4 % in Figure 4d) versus the summer months in the northern hemisphere (2 % in Figure 4f). As mentioned, the middle latitudes over-land (Figures 4g-4j) tend to be the most challenging situations for passive microwave precipitation retrievals. All DMSP sensors show about 98 % zero-rain occurrence, with a slight seasonal dependence. At these latitudes, light rain is estimated no more than about 2 % of the time.
4. Analysis of TRMM, Aqua and Coriolis precipitation estimates. The section above demonstrated the degree of consistency between the DMSP SSMI sensors in rain detection capability, and differences with similar capability of the SSMIS sensor. In this section, the DMSP detection and light precipitation characteristics of the previous section will be intercompared with three other existing (as of early 2007) microwave sensors, the TRMM TMI and PR, the AMSR-E from Aqua and the WindSat polarimetric radiometer onboard the Coriolis satellite. These other sensors are typical of satellites and sensors that will be a part of the future Global Precipitation Mission (GPM) satellite constellation, which willl fuse precipitation datasets from a central GPM core satellite and other satellites of opportunity (including the SSMIS)[NASreport]. A key scientific challenge for GPM is the establishment of techniques which combine the instantaneous nature of satellite observations into multi-satellite precipitation products. The overpass times, sensor channel capabilities and sensor swath of each of the constellation satellites will be different (and largely uncertain until closer to the mission deployment date.) For example, the WindSat sensor onboard the Coriolis satellite does not have an 85 GHz capability (and hence no SI85), but it does have 6 GHz channels, which is advantageous for extending the range of over-ocean precipitation compared to the lowest (19 GHz) channels on the SSMI and SSMIS sensors. Furthermore, the TMI/PR combination provides insight into the different capabilities of active vs. passive microwave precipitation retrieval from space.
(a) TMI, PR, AMSR-E and WindSat over-ocean. In an identical fashion to Figures 3 and 4, Figure 5 depicts the fractional contribution of zero-rain for all observations beginning in 2004, for the TMI, PR, AMSR-E and WindSat over-ocean precipitation retrievals. AMSR-E data begins in March 2005 and WindSat

9
begins in June 2006. For tropical latitudes between 5S and 5N, the percentage of no-rain observations from all SSMI sensors (Figure 3a) are in very close agreement with those from TMI and AMSR-E (Figure 5a). TMI and AMSR-E track each other nearly identically since the AMSR-E algorithm was built from a modification of the TRMM 2A12 [Wilheit03]. The TRMM PR shows a slightly higher percentage of no-rain than the TMI, which has been noted by previous comparisons of TMI and PR data over ocean, where PR was biased low by about 30% relative to ocean buoy raingauges [Bowman03]. WindSat closely tracks the same seasonal changes but detects about 2% less zero-rain events (i.e, it produces more light rain than AMSR-E), which has also been noted by WindSat-TMI rainfall comparisons [WindSat06]. For the sub-tropics (middle four panels of Figure 5), the fractional zero-rain and light precipitation estimation by the TMI and AMSR-E are nearly identical to those of the DMSP sensors, with the PR again assigning more zero-rain (and less light rain) than the TMI and AMSR-E. Note the improvement in the TMI and AMSR-E difference beginning in August 2005, when the AMSR-E precipitation datasets distributed by the NOAA NRTPE implemented the improved level B04 products. Also, the TRMM 2A25 and 2A12 realtime products were upgraded to Version 6 in early January 2005. Even though only eight months of WindSat data are presented, differences between it and the other three sensors are more noticeable in the tropical latitudes. In general it detects less zero-rain throughout (Figures 5c and 5e), and in the southern hemisphere winter season it estimates more light rain than the other three sensors (Figure 5f). Since WindSat does not have an 85 GHz channel capacity, its rain screen is based upon a cloud liquid water threshold test (emission test) which assigns more light rain for higher latitude wintertime conditions (colder seas surface temperatures and drier atmospheres compared to the tropics). In the middle latitudes, the fractional zero-rain and light precipitation estimated by the TMI and AMSR-E are again nearly identical to those of the DMSP sensors, with the PR again assigning about 2 % more zero-rain (and 2 % less light rain) than the TMI and AMSR-E. The WindSat characteristics that began to appear in the sub-tropical latitudes now are more apparent at the middle latitudes as well as contrasts between northern and southern hemispheres. WindSat is closer to the TMI and AMSR-E characteristics in the northern hemisphere summer months than in the southern hemisphere summer months (compare Figures 5g and 5h with Figures 5i and 5j). (b) TMI, PR, and AMSR-E over-land. The 10 panels of Figure 6 are again identical in layout and scaling to Figures 3-5, this time displaying TMI, PR and AMSR-E over-land precipitation retrieval characteristics (WindSat does not have an over-land precipitation algorithm). For the three latitude regimes examined here, the TMI and AMSR-E zero-rain and light rain characteristics are nearly identical to those from the SSMI and SSMIS sensors (all panels of Figure 4 compared with all panels of Figure 6). The TMI-PR difference over-land is less noticeable compared to over ocean. In the northern hemisphere middle latitudes (Figures 6g and 6h), an unusual weak oscillation with an approximate 45-day period is noted in the TMI precipitation detection. It

10
is less evident in the corresponding southern hemisphere panel (Figures 6i and 6j) and also less evident in the over-ocean TMI data (Figures 5g-5j). This effect is most likely related to the 46-day repeat cycle of the TRMM satellite at these latitudes [Negri02]. Referring to Figure 1b, the TRMM observation time drifts apart from the Aqua observation time, resetting itself every 46 days. Furthermore, samples are often obtained from two or three consecutive orbits (Figure 1b), which does not happen at tropical latitudes (Figure 1a.) The oscillation happens to show up most notably for over-land data, where local time-of-day characteristics (e.g., solar heating of land surfaces and more frequent afternoon precipitation) in regional precipitation are most likely to happen. In this global analysis, any regional local time maximums in precipitation are all averaged together, but enough residual remained so that we were able to notice it in the TRMM sampling characteristics. To demonstrate, we refer to Figure 7a. This figure shows the number of observations within a 10-degree box centered at 35N latitude and 100W longitude (central United States), for a ±15 day period centered on 1 July 2005, from the TMI (2A12 product), PR (2A25 product) and AMSR-E. These data are plotted as function of their local observation time (binned into 3-hour intervals.) We can use Figure 1b to estimate the local time of the TRMM observations at this location, which shows that the TRMM overpasses near this date occurred midnight local time. Figure 7a shows that the number of TRMM observations reached a minimum near 1200 local time, which is in accord with Figure 1b. Since Aqua’s local sampling time is always 0130 (morning) and 1330 (afternoon) each day, there are relatively few TRMM observations gathered near the time of the afternoon Aqua overpass. Therefore the local time alignment of the Aqua and TRMM data is optimized for the morning Aqua overpass. Figure 7b shows the average rainrate during this time, and as expected the agreement between the 2A12 and AMSR-E is much better for the 0130 Aqua overpass. Figure 7c shows the identical analysis where the ±15 day period is centered three weeks later, on 22 July 2005. From Figure 1b, the majority of the TRMM observations were centered near 1200 local time. Therefore the local time alignment of the Aqua and TRMM data is optimized for the afternoon Aqua overpass, and the agreement in the average rainrate (Figure 7d) is better for the 1330 Aqua overpass. However, if the precipitation has a predominant daily cycle as in this example (in the central United States, late afternoon precipitation is common in the summer months), the relative difference between the TMI and AMSR-E will oscillate throughout the year as TRMM’s orbit precesses, and explains the oscillatory nature of the 2A12 data in Figure 6g. This peculiarity of the TRMM orbit is discussed in further detail by [Negri02]. We discuss it here since it does complicate the merging of precipitation datasets from synchronous and asynchronous satellites. For example, if the satellite data are binned by local observation time, a threshold test could be performed on the number of observations in each 3-hour bin.
5. Analysis of NOAA-based precipitation estimates. The final set of satellite precipitation estimates that are examined here are from the NOAA satellites. NOAA-15 and NOAA-17 have local crossing times near 1030 and 2230, and NOAA-16 and NOAA-18 near 0200 and 1400. The precipitation estimates from the NOAA-15, 16 and 17 satellites are based upon the data from the AMSU-B sensors (MHS on NOAA-18; METOP data not available at this time) described by [Weng03], however the AMSU-A data are used in the up-front detection of snow and surface scattering conditions over land [Kongoli03].
11
(a) AMSU and MHS precipitation over-ocean.
The first set of data are the NOAA over-ocean data presented in the 10 panels of Figure 8, again in a format identical to previous figures. Over the tropical latitudes the precipitation is well-matched between all four satellites, and the fractional percentage of zero-rain (Figures 8a) is about 4 % higher than estimated by the DMSP sensors. However, the NOAA satellites detect no light rain detection over ocean (Figure 8b) at these latitudes (a glance at the right column of Figure 8 shows that no over-ocean light rain is estimated at any latitudes). This is largely due to the lack of low frequency channels on the AMSU-B sensors; they mainly respond to precipitation with a developed ice phase. This characteristic of the NOAA AMSU algorithm has been previously noted [Ferraro05]. We mention that recent adaptations to the algorithm have brought about notable improvements to the over-ocean light rain [Ferraro06] [Vila07]. In the sub-tropical latitudes (middle four panels of Figure 8), the relative behavior of the NOAA precipitation estimates again follows the trends of the DMSP satellites, but subtle differences are noticeable. In the northern hemisphere, the zero-rain percentage estimated by the DMSP and NOAA satellites is closer in the spring months (between 98-99 % for both in April) and most different in the autumn months (92 % for DMSP and 96 % for NOAA in September). For the middle latitudes, the seasonal changes noted by the DMSP, TRMM, AMSR-E and WindSat sensors is not manifested in the NOAA estimates. The percent of zero-rain detected remains near 98 % for all three years in both hemispheres (Figures 8g and 8i). As pointed out in Figure 11 of the IPWG validation study [Ebert07], the majority of precipitation at high latitudes occurs from daily totals under 1 mm day-1. At these latitudes the lack of any low frequency channels in the AMSU algorithm prevents the algorithm from picking up variations in the types of precipitation associated with, for example, the winter maximum in over-ocean precipitation (cold season, but less convective than tropical and sub-tropical precipitation).
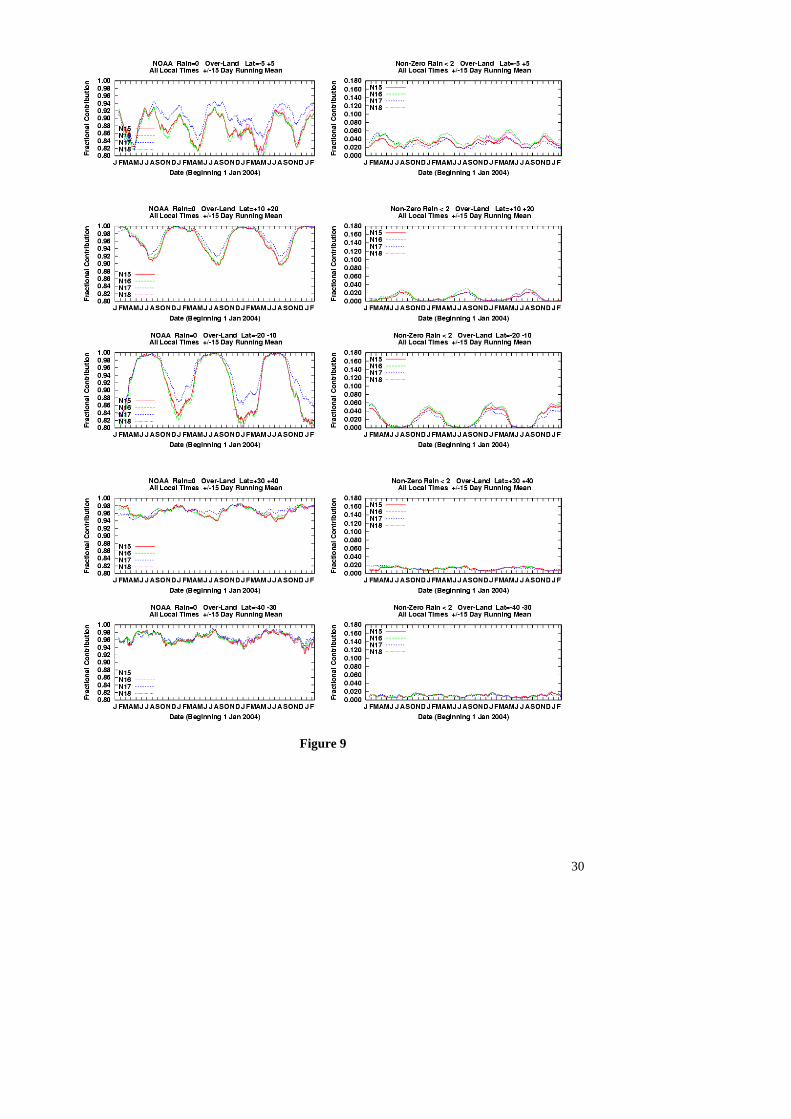
(b) AMSU and MHS precipitation over-land. The last set of data are the NOAA over-land data presented in the 10 panels of Figure 9, again in a format identical to previous figures. Over land and all latitudes, all NOAA satellites detect the seasonal changes much better than they do over-ocean (left column of Figure 9 vs. left column of Figure 8), and light precipitation under 2 mm hr-1 is estimated (right column of Figure 9). There are wider variations between winter and summer for zero-rain detection in the NOAA estimates than in the DMSP estimates. In the tropical latitudes, the difference in percentage zero-rain detection is about 10 % (82 % to 92%, Figure 9a) versus about 4 % for the DMSP (Figure 4a). The weak 6-month cycle noted and discussed for DMSP over-land (Figure 4a) is more evident in Figure 9a. Of all NOAA satellites, NOAA-17 stands out with about 2-3 % more zero-rain detection. This is related to the failure of the AMSU-A1 sensor (with the 50 and 89 GHz channels of Table 1) in 2003, which were used for surface screening [Kongoli03]. Without these channels, the detection from NOAA-17 allows more scattering surfaces to be classified as non-raining. In the tropical latitudes, this happens over the large desert areas in equatorial Africa.
12
Since the AMSU-B sensor is the most different from the other sensors (cross-track scanning, only the 85 GHz channel in common with the others), one may expect its light rain detection characteristics to be the most different when compared to the DMSP or TMI. However, inspection of the right column of Figure 9 indicates that the percent of light rain is very consistent with the SSMI and SSMIS estimates (right column of Figure 4) and the TMI, PR, AMSR-E estimates (right column of Figure 6), and for all latitudes. In the sub-tropics (middle four panels of Figure 9), the NOAA satellites assign more zero-rain in the summer months than any of the other sensors, as low as 82% in the southern hemisphere (Figure 9e), and the loss of the AMSU-A1 sensor on NOAA-17 appears to make a difference in zero-rain detection only in the summer months. But when moving to the middle latitudes (bottom four panels of Figure 9), the NOAA-17 estimates show only a very slight difference from the other three. As noted at the beginning of this section and as illustrated in Figure 1, the NOAA satellites examined here have distinct local observation times; NOAA-15 and NOAA-17 have local crossing times near 1030 and 2230 (the morning satellites), and NOAA-16 and NOAA-18 are near 0200 and 1400 (the afternoon satellites). One might therefore expect that a similar sort of oscillatory difference as noted between TMI and AMSR-E (Figures 6g and 6i) would be manifested between the morning and afternoon NOAA satellites. However, the NOAA satellites are all synchronous and there is no phasing of the crossing times as was the case for TRMM and Aqua; also the very wide swath of the AMSU-B sensor (2200-km vs. 830-km on TMI) provides observations from consecutive orbits 90-minutes apart, especially at higher latitudes. In Figures 9g and 9i, any differences in the zero-rain detection characteristics between the morning and afternoon satellites are difficult to pick out. However, as shown in Figure 7, if there is a known daily cycle to precipitation over certain regimes, the addition of the NOAA satellites (especially the afternoon satellites) with their wide-swath AMSU sensors substantially reduces the worst-case revisit time and provide more samples at different local times on any given day.
6. Conclusions. We have presented an intercomparison of precipitation screening and retrieval of light precipitation (less than 2 mm hr-1) for a three-year period beginning in January 2004, from a collection of 7 different microwave sensors (SSMI, SSMIS, TMI, PR, AMSR-E, WindSat, AMSU) onboard 11 different satellites (4 DMSP, TRMM, Aqua, Coriolis, 4 NOAA). The analysis was done on a global basis, where all data during this time was subsetted by precipitation rate, background type (water or land), northern and southern hemisphere latitude region (tropical, subtropical and middle latitudes), and local observation time. The motivation for this work was threefold. An important motivation for this undertaking is that both detection and quantification of light precipitation remain a key challenge for PMW-based retrieval algorithms, especially for land backgrounds, high latitudes and cold seasons. Secondly, methods and techniques that merge different the instantaneous estimates provided from a constellation of low Earth-orbiting satellites into longer time and space scale products (high resolution precipitation products, or HRPP) will be an important consideration for the future Global Precipitation Mission. Knowledge of the precipitation sensing capabilities and characteristics of the individual satellites/sensors will need to be known, and may change throughout the mission as new sensors are added and others are removed. The variety of satellite orbits and microwave sensor types that exist today (early 2007) is appropriate for examing these inter-satellite characteristics and assessing how

13
this information may benefit refinements to HRPP techniques. Lastly, these analysis will complement light precipitation analysis from the recently launched CloudSat W-band radar [Lecuyer06]. The SSMI precipitation datasets from DMSP F-13, F-14 and F-15 are all well-matched with each other throughout the three-year period examined here, over both land and ocean. Slight differences in precipitation screening were noted with the SSMIS onboard F-16 as a result of the 6 GHz difference in the high frequency channel (85 GHz on SSMI, 91 GHz on SSMIS), which was manifested in the behavior of the 85 GHz scattering index for up-front precipitation screening. The TMI and PR closely tracked seasonal trends over-land and over-ocean, but with slight offsets. Over ocean, the PR detected about 2-4 % more zero-rain (and 2-4 % less light rain) at all latitudes. Over land, the TMI and PR characteristics in zero-rain detection were similar, especially after the change to the Version 6 products in January 2005. After this change, we noted that the PR retrieved slightly more over-land precipitation in the summer months than the TMI. Owing to major similarities in the algorithm design, TMI and AMSR-E compared very closely in their over-ocean and over-land zero-rain and light rain estimates, especially after the change to the level B04 AMSR-E products in August 2005. In the over-land middle latitudes, the TMI zero-rain estimates were noted to have a slight oscillation on top of the seasonal trend. The period of the oscillation was traced to the 46-day repeat cycle of the asynchonous TRMM orbit at middle latitudes. The effect was less noticeable in this analysis since it was globally-based (separated only into three latitude regimes), but for regions where the precipitation has a notable daily cycle, the variation in local sampling times needs to be taken into consideration when merging data from asynchronous and synchronous orbiting satellites. WindSat compared closest to the TMI in the tropical latitudes, where it detected about 2 % less zero-rain. In the sub-tropics and middle latitudes, the WindSat-TMI differences became increasingly apparent. At the middle latitudes during winter months (cold season), WindSat detected about 14 % less zero-rain and (and therefore more light rain compared to TMI.) Over ocean, the four NOAA satellites (NOAA-15-18) were well-matched in their estimation of zero-rain percentage for all latitudes and seasons, but the AMSU-based technique was incapable of producing any estimated precipitation under 2 mm hr-1. Over land, the NOAA AMSU estimates of zero-rain percentage showed a much wider variability between summer and winter months than was noted from the DMSP or TMI. We note that there are other types of precipitation screens other than the SI-based one described here [Ferraro98]. However, nearly all of the PMW-based ones require an 85 GHz or equivalent channel, and the SSMI-developed coefficients in (1) and (2) could be modified for the SSMIS. Moreover, the SSMIS is capable of improved screening compared to the SSMI. The use of the 150 GHz channel on the SSMIS allows for the screening to be adaptable to weaker scattering conditions and lighter rainfall rates, and better discrimination of snowcover. Combined with the 183 GHz water vapor channels, the SSMIS should allow the screening methodology to be more adaptable to variability in the environmental temperature and moisture associated with changes in season and precipitation regime. Over-land precipitation detection should be improved owing to the greater surface opacity at 150 GHz and above. We note that the use of 150 and 183 GHz
14
channels from the AMSU sensors have been shown to benefit the detection and estimation of falling snow and cold season rainfall [Bennartz03][Chen03][Kongoli03]. With the planned capability of a 166 and 183 GHz channel capacity on the future GPM Microwave Imager (GMI), the use of sensors and techniques which combine expanded imaging and sounding capabilities is likely to expand. The DMSP program has produced a sequence of overlapping microwave imaging missions since 1987, and these data have produced an unprecedented 20-year record of hydrological records. Future research microwave imager launches will not currently bridge the gap that occurs when the current suite (TRMM, Aqua, and Coriolis) reach their end-of-life. As of early 2007, the GPM is now scheduled no later than 2013. A Japan-based sensor similar to an AMSR-E might be launched in a similar timeframe. The joint France-India Megha-Tropiques mission may occur near 2008, a satellite in an asynchronous low-inclination orbit similar to TRMM. This reduction in conically-scanning microwave imaging capabilities will force more usage of the operational microwave sounding instruments (similar to AMSU) for crucial climatological precipitation records. Refinement of techniques to merge datasets from disparate satellites and sensors remains a clear challenge for continuation of precipitation estimation from space. Acknowlegements We acknowledge the efforts of the Microwave Surface and Precipitation Products System (MSPPS) at NOAA/NESDIS for the AMSU-B precipitation datasets, the TRMM Science and Data Information System (TSDIS) for the TMI and PR rainfall datasets, the Fleet Numerical Meteorology and Oceanography Center (FNMOC) for the WindSat, SSMI and SSMIS datasets, and the NOAA Near Realtime Processing Environment (NRTPE) group for the AMSR-E data. Peter Gaiser and Mike Bettenhausen of NRL provided valuable assistance with WindSat data interpretation. The ongoing support of all participants in the International Precipitation Working Group (IPWG) is gratefully acknowledged.
15
REFERENCES Lee, T.F., 1995: Images of precipitation signatures from DMSP SSM/T-2, SSM/I and OLS. J. Appl. Meteor., 34, 788-793. Colton, M.C. and G.A. Poe, 1999: Intersensor calibration of DMSP SSMIs: F-8 to F-14, 1987-1997. IEEE Trans. Geosci. Rem. Sens., 37, 418-439. Colton, M.C. and G.A. Poe, 1994: Shared Processing Program, Defense Meteorological Satellite Program, Special Sensor Microwave/Imager Algorithm Symposium, June 8-10, 1993. Bull. Amer. Meteor. Soc. 75, 1663-1669. Kummerow, C.D., Y. Hong, W.S. Olson, S. Yang, R.F. Adler, J. McCollum, R. Ferraro, G. Petty, D.B. Shin, and T.T. Wilheit, 2001: The evolution of the Goddard Profiling Algorithm (GPROF) for rainfall estimation from passive microwave sensors. J. Appl. Meteor., 40, 1801-1817. Adler, R.F., C. Kidd, G. Petty, M. Morissey, H.M. Goodman, 2001: Intercomparison of global precipitation products: The Third Precipitation Intercomparison Project (PIP-3). Bull. Amer. Meteor. Soc., 82, 1377-1396. Ebert, E.E., M.J. Manton, P.A. Arkin, R.J. Allam, G.E. Holpin, A.J. Gruber, 1996: Results from the GPCP Algorithm Intercomparison Program. Bull. Amer. Meteor. Soc., 77, 2875-2887. Smith, E.A., J.E. Lamm, R.F. Adler, J. Alishouse, K. Aonashi, 1998: Results of theWetNet PIP-2 project. J. Atmos. Sci., 55, 1483-1536. D. Kunkee, S. Swadley, G. Poe, Y. Hong, and M. Werner, 2007: Special Sensor Microwave Imager Sounder Radiometric Calibration Anomalies. Part I. IEEE Trans. Geosci. Rem. Sens., this issue. S. Swadley, G. Poe, D. Kunkee, W. Bell, and Y. Hong, 2007: Special Sensor Microwave Imager Sounder (SSMIS) Radiometric Calibration Anomalies. Part II: Anomaly Descriptions and Mitigation Strategies for Radiance Assimilation. IEEE Trans. Geosci. Rem. Sens., this issue. Gaiser, P., E. M. Twarog, L. Li, K. M. St. Germain, G. A. Poe, and W. Purdy, 2004: The WindSat space borne polarimetric microwave radiometer: sensor description and mission overview. IEEE Trans. Geosci. Rem. Sens., 42, no. 11, 2347-2361. Adler, Robert F., George J. Huffman, David T. Bolvin, Scott Curtis, Eric J. Nelkin, 2000: Tropical Rainfall Distributions Determined Using TRMM Combined with Other Satellite and Rain Gauge Information. Journal of Applied Meteorology: Vol. 39, No. 12, pp. 2007-2023. Levizzani, V, 2007: Measuring Precipitation from Space: EURAINSAT and the Future. Springer Academic Publishers, V. Levizzani, Ed. Advances in Global Change Research 28, ISBN 978-1-4020-5834-9, 780 pp.

16
Adler, R.F., G.J. Huffman, A. Chang, R. Ferraro, P. Xie, J. Janowiak, B. Rudolf, U. Schneider, S. Curtis, D. Bolvin, A. Gruber, J. Susskind, P. Arkin, 2003: The Version 2 Global Precipitation Climatology Project (GPCP) Monthly Precipitation Analysis (1979-Present). J. Hydrometeor., 4,1147-1167.
Huffman, G.J., R.F. Adler, M. Morrissey, D.T. Bolvin, S. Curtis, R. Joyce, B McGavock, J. Susskind, 2001: Global Precipitation at One-Degree Daily Resolution from Multi-Satellite Observations. J. Hydrometeor., 2, 36-50.
Huffman, G.J., R.F. Adler, P. Arkin, A. Chang, R. Ferraro, A. Gruber, J. Janowiak, A. McNab, B. Rudolf, U. Schneider, 1997: The Global Precipitation Climatology Project (GPCP) Combined Precipitation Dataset. Bull. Amer. Meteor. Soc., 78, No. 1, pp. 5-20.
Turk, F.J and P. Bauer, 2005: Proc. 2nd International Precipitation Working Group, 25-28 October, Monterey, 355 pp. Available from EUMETSAT, Am Kavalleriesand 31, D-64295 Darmstadt, Germany, EUM P.44, ISBN 92-9110-070-6. Online at http://www.isac.cnr.it/~ipwg. Ebert, E.E., J.E. Janowiak, C. Kidd, 2007: Comparison of near real-time precipitation estimates from satellite observations and numerical models. Bull. Amer. Meteor. Soc., 88, 47-64. Report on the IPWG/GPM/GRP Workshop on Global Microwave Modeling and Retrieval of Snowfall, 11-13 October 2005, Madison, WI. R. Bennartz and R. Ferraro, eds. Available online at http://www.isac.cnr.it/~ipwg/meetings/madison/ipwg_snowfall_workshop_report.pdf L’Ecuyer, T., S. Miller, C. Mitrescu, J. Haynes, C. Kummerow, J. Turk, 2006 : A first look at the CloudSat precipitation dataset. Proc. 3rd Int. Precip. Working Group, 22-27 October, Melbourne. Available online at http://www.isac.cnr.it/~ipwg/meetings/melbourne/melbourne2006-pres.html. Ferraro, R.R., 1997: SSM/I derived global rainfall estimates for climatological purposes. J. Geophys. Res. 102, 16715-16735. Wilheit, T., C.D. Kummerow, and R. Ferraro, 2003: Rainfall algorithms for AMSR-E. IEEE Trans. Geosci. Rem. Sens., 41, 204-214. WindSat Data Products Users Manual, Sensor and Environmental Data Records, Version 3, January 2006, D-29825. Available from the Physical Oceanography Distributed Active Archive Center (PO.DAAC), Jet Propulsion Laboratory, Pasadena, CA, US. Weng, F., L. Zhao, R.R. Ferraro, G. Poe, X. Li, and N.C Grody, 2003: Advanced Microwave Sounding Unit (AMSU) cloud and precipitation algorithms. Radio Science, 38, 8086-8096. Ferraro, R., F. Weng, N. Grody, L. Zhao, H. Meng, C. Kongoli, P. Pellegrino, S. Qiu, C. Dean, 2005: NOAA operational products derived from the Advanced Microwave Sounding Unit (AMSU). IEEE Trans. Geosci. Rem. Sens., 43, 1036-1049.

17
Chen, F.W., and D.H. Staelin, 2003: AIRS/AMSU/HSB precipitation estimates. IEEE Trans. Geosci. Rem. Sens., 41, 410-417. Negri, A.J., T.L. Bell, and L. Xu, 2002: Sampling of the diurnal cycle of precipitation using TRMM. J. Atmos. Oceanic Technol., 19, 1333-1344. Bell, T.L and N. Reid, 1993: Detecting the diurnal cycle of rainfall using satellite observations. J. Appl. Meteor., 32, 311-322. Salby, M.L. and P. Callaghan, 1997: Sampling error in climate properties derived from satellite measurements: Consequences of undersampled diurnal variability. J. Climate, 10, 18-36. Grody, N.C, 1991: Classification of snow cover and precipitation using the Special Sensor Microwave Imager. J. Geophys. Res., 96, 7423-7435. Ferraro, R.R., E.A. Smith, W. Berg, G.J. Huffman, 1998: A screening methodology for passive microwave precipitation retrieval algorithms. J. Atmos. Sci., 55, 1583-1600. Arkin, P.A., H. Cullen, P. Xie, 2007: Oceanic precipitation variability and the North Atlantic Oscillation. In Section 1 of Measuring Precipitation from Space: EURAINSAT and Beyond, Springer Academic Publishers, V. Levizzani, Ed. Advances in Global Change Research 28, ISBN 978-1-4020-5834-9, pp. 37-48. National Research Council, 2006: NOAA’s role in space-based global precipitation estimation and application. Interim Report, The National Academies Press, Washington, D. C. Bowman, K.P., A.B. Phillips, G.R. North, 2003: Comparison of TRMM rainfall retrievals with rain gauge data from the TAO/TRITON buoy array. Geophys. Res. Letters, 30, doi:10.1029/2003GL017552. Kongoli, C., P. Pellegrino, R.R. Ferraro, N.C. Grody, H. Meng, 2003: A new snowfall detection algorithm over land using measurements from the AMSU. Geophys. Res. Letters, 30, 1756-1759. Ferraro, R., 2006: The status of the NOAA/NESDIS operational AMSU/MHS precipitation algorithm. Proc. 3rd Int. Precip. Working Group, 22-27 October, Melbourne. Available online at http://www.isac.cnr.it/~ipwg/meetings/melbourne/melbourne2006-pres.html. Vila, D., R. Ferraro and R. Joyce, 2007: Evaluation and Improvement of AMSU Precipitation Retrievals. Submitted to Int. Journal of Rem. Sens. Bennartz, R. and P. Bauer, 2003: Sensitivity of microwave radiances at 85-183 GHz to precipitating ice particles. Radio Sci., 38, 8075-8090.
Formatted: Font: Arial, English(U.S.)
Formatted: Font: Arial, Italic
Deleted: .
18
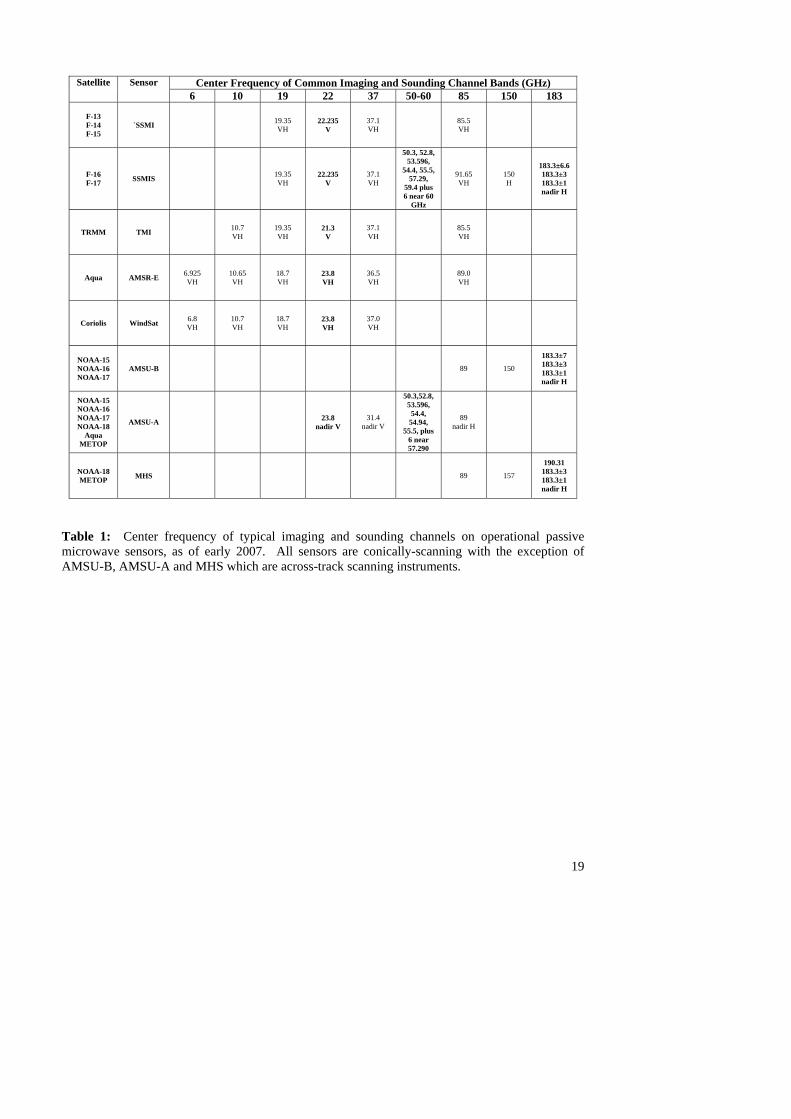
LIST OF TABLES Table 1: Center frequency of typical imaging and sounding channels on operational passive microwave sensors, as of early 2007. All sensors are conically-scanning with the exception of AMSU-B, AMSU-A and MHS which are across-track scanning instruments. LIST OF FIGURES
Figure 1: Local crossing times during calendar year 2005 for each of the 11 satellites examined in this manuscript. (a) For an observer located at a location of 0N 100 W. (b) Same as (a) but for a location of 35N 100W. (c) Same as (a) but for a location of 60N 100W. Figure 2: (a) Sequence of revisit time for calendar year 2005 when the NOAA satellites are omitted from the 11 satellites of Figure 1. (b) Same as (a), when all 11 satellites are considered. Figure 3. Plots of the fractional percentage of zero rain (left panels) and non-zero rain less than 2 mm hr-1 (right panels) for all DMSP over-ocean pixels, for three years beginning in January 2004. The SSMI sensor is onboard the F-13, F-15 and F-15 satellites and the SSMIS is onboard F-16. A ±15 day running average was applied to the data in order to smooth the data and identify seasonal trends. First row, left to right, (a) and (b): Fractional percentage of zero-rain estimated between the latitude range from 5S to 5N, and corresponding fractional percentage of non-zero rain less than 2 mm hr-1. Second row, left to right, (c) and (d): Same as first row, but latitude range from 10N-20N. Third row, left to right, (e) and (f): Same as first row, but latitude range from 20S-10S. Fourth row, left-to-right, (g) and (h): Same as first row, but latitude range from 30N-40N. Fifth row, left to right, (i) and (j): Same as first row, but latitude range from 40S-30S. Figure 4. Same format as Figure 3, but for SSMI and SSMIS data over land. Figure 5. Same format as Figure 3, but for TMI, PR, AMSR-E and WindSat data over ocean. Figure 6. Same format as Figure 3, but for TMI, PR, and AMSR-E data over land. Figure 7. (a) Number of observations from the TMI (2A12), PR (2A25) and AMSR-E precipitation datasets inside of a 10-degree box centered at 35N 100W, for a ±15 day period centered at 1 July 2005, and for each 3-hour local observation time (e.g, 12= all observations between 12 and 15 local). (b) Same as (a) but average precipitation rate is plotted for all three datasets. (c) Same as (a) but for a ±15 day period centered at 22 July 2005. (d) Same as (c) but for average precipitation rate for all three datasets. Figure 8. Same format as Figure 3, but for AMSU-B and MHS data over ocean. Figure 9. Same format as Figure 3, but for AMSU-B and MHS data over land.
19
Center Frequency of Common Imaging and Sounding Channel Bands (GHz) Satellite Sensor
6 10 19 22 37 50-60 85 150 183
F-13 F-14 F-15
`SSMI 19.35 VH
22.235 V
37.1 VH
85.5 VH
F-16 F-17 SSMIS 19.35
VH 22.235
V 37.1 VH
50.3, 52.8, 53.596,
54.4, 55.5, 57.29,
59.4 plus 6 near 60
GHz
91.65 VH
150 H
183.3±6.6 183.3±3 183.3±1 nadir H
TRMM TMI 10.7 VH
19.35 VH
21.3 V
37.1 VH
85.5 VH
Aqua AMSR-E 6.925 VH
10.65 VH
18.7 VH
23.8 VH
36.5 VH
89.0 VH
Coriolis WindSat 6.8 VH
10.7 VH
18.7 VH
23.8 VH
37.0 VH
NOAA-15 NOAA-16 NOAA-17
AMSU-B
89 150
183.3±7 183.3±3 183.3±1 nadir H
NOAA-15 NOAA-16 NOAA-17 NOAA-18
Aqua METOP
AMSU-A 23.8 nadir V
31.4 nadir V
50.3,52.8, 53.596,
54.4, 54.94,
55.5, plus 6 near 57.290
89 nadir H
NOAA-18 METOP MHS
89 157
190.31 183.3±3 183.3±1 nadir H
Table 1: Center frequency of typical imaging and sounding channels on operational passive microwave sensors, as of early 2007. All sensors are conically-scanning with the exception of AMSU-B, AMSU-A and MHS which are across-track scanning instruments.

20
Figure 1a

21
Figure 1b

22
Figure 1c

23
Figure 2a
Figure 2b

24
These two panels above, left to right: Figures 3a and 3b
These four panels above, left-to-right beginning in upper left: Figures 3c, 3d, 3e, 3f
These four panels above, left-to-right beginning in upper left: Figures 3g, 3h, 3i, 3j

25
Figure 4 (same layout as Figure 3)

26
Figure 5

27
Figure 6

28
Figure 7a and 7b
Figure 7c and 7d

29
Figure 8
30
Figure 9