analysis of lecturing room using computational fluid dynamics … · 2019-07-01 · analysis of...
TRANSCRIPT
Analysis of Lecturing Room using Computational
Fluid Dynamics
Natural and Forced Ventilation
1. Md Atiqur Rahman,
2. Narahari. G. A
1,2. Department of Mechanical Engineering,
BTL institution of Technology and Management, Bangalore,560099, India
Abstract--Investigating the main parameters contrite to the air
quality and thermal comfort has been highlighted by different
studies. Doing so will provide the suitable measure for
environmental quality that receive considerable attention by
building designers. It comes along with the different
international and regional standards intended to foster
environments that are acceptable to occupants. Although there
is considerable field data on thermal comfort, there is far less
data that assesses the level of thermal comfort in universities.
This has not been investigated in the literature, therefore, this
study aims at simulating the ventilations of lecturing room and
determining the number of people allow for a sufficient air
conditioning.
Computer simulations offer an exciting opportunity
for validating aspects of ventilation, smoke movement, natural
air flow and thermal comfort right at the design stage. In this
work CFD simulation of natural and force ventilation on
lecturing room was carried and thermal comfort of
the human
being is studied using ANSYS Fluent. Results shows that for 234
human load case the average Temperature contours in lecturing
room is approximately 301K (28 C) which is higher than
comfort temperature of 296K (23 C) due to the flow stagnant
zone
back side of the lecturing room. So the human load is
reduced to 198 to achieve the comfort zone for human being of
296 K (23C). Then the natural ventilations is simulated. It shows
average temperature of the flow stagnant zone back side of the
lecturing room is approximately 305 K (32 C) for 198 human
case, also shows that some areas of peak temperature of 308 K
due to stagnant region. Finally smoke simulation is carried out
from front door stack releases smoke that is dispersed into the
lecturing room with an oncoming side wind of 1 m/s. the total
time required to evacuate the smoke is approximately 3 min.
I.
INTRODUCTION
It is necessary to provide buildings with adequate ventilation
to ensure both removal of stale air and the supply of fresh air
for occupants. This can be provided in different ways, which
include: mechanical ventilation, in which fans and ducts are
used to move large volumes of air with or without heating the
air; air-conditioning, in which the temperature and humidity
of air, supplied via fans and ducts, is fully controlled; and
natural ventilation which harnesses the naturally occurring
driving forces of wind and buoyancy. It is also possible to
use a hybrid approach which uses both natural forces and
mechanical means (usually fans). These are known as mixed-
mode systems.
The main disadvantages of air-conditioning are: cost, in
terms of capital, running costs and maintenance; and the
large amount of space required to house the necessary
equipment. Furthermore, there is evidence to suggest that air-
conditioning systems are more likely to cause occupant
health complaints than natural or mechanical ventilation.
Given today’s efforts to reduce energy usage and CO2
emissions, there is an increasing trend to move away from
air-conditioned buildings. Consequently, many architects and
building designers have turned their attention towards
naturally ventilated or mixed mode techniques. Although
such buildings use innovative techniques, many have been
completed with a high degree of success. Due to the non-
predeterminate nature of natural ventilation systems, much
care is needed at the design stage to ensure that the
ventilation strategy will perform successfully under
foreseeable climatic and occupancy scenarios. In particular
that acceptable air change rates will be obtained. Predictions
of such parameters are much easier in a mechanically-driven
system since the designer knows, to a high degree of
accuracy, the volume flow rates produced by the various
components that make up the system. When designing
natural ventilation strategies however, the only way to predict
the flow rates is by means of either a physical or
mathematical model.
Since the advent of more powerful, affordable, desk-top
computers, another tool has become accessible to designers -
Computational Fluid Dynamics (CFD). This technique
considers the airflow in a space by dividing the space into
small cells and solving the equations which govern the
airflow and temperature distribution in each one. This offers
the immediate advantage over the salt bath modeling
approach of being able to provide information about the flow
at many positions throughout the domain of interest. It also
enables changes to the geometry and operating conditions to
be made more easily, offering an ideal tool for investigating
many ventilation options early in the design process.
M. Zajicek et.al [6] is focused on the numerical analysis of
ventilation of building for broilers during the summer period
653
Vol. 3 Issue 3, March - 2014
International Journal of Engineering Research & Technology (IJERT)
IJERT
IJERT
ISSN: 2278-0181
www.ijert.orgIJERTV3IS030146
with the use of computer fluid dynamics (CFD) software
from Fluent Inc. The summer period is particularly critical.
Rong Li et.al [7] investigated buoyancy-driven natural
ventilation of a room with large lower and higher level
openings by both theoretical analysis and CFD simulation
R. Ramponi et.al [8]validated based on detailed wind tunnel
experiments with Particle Image Velocimetry. The impact of
a wide range of computational parameters is investigated,
including the size of the computational domain, the
resolution of the computational grid, the inlet turbulent
kinetic energy profile of the atmospheric boundary layer, the
turbulence model, the order of the discretization schemes and
the iterative convergence criteria. Specific attention is given
to the problem of oscillatory convergence that was observed
during some of these coupled CFD simulations.
Frédéric Conte.et.al [9]studied "Early detection in rooms
with high ceilings". This project consists of the study of
smoke production, smoke detectors, and two problems
detecting fires and will be finished by full-scale experiments.
Jelena Srebric et.al [10]demonstrated how to use two
simplified methods, the box and momentum methods, to
simulate complex diffusers in room airflow modeling by
computational fluid dynamic
The main aims of the research were as follows:
to evaluate the accuracy of CFD for modeling buoyancy-
driven displacement ventilation flows by considering the
flows in simple geometries and comparing the results with
experimental and analytical predictions of bulk airflow
patterns, stratification, and vertical temperature gradients;
and
to provide guidance on the use and reliability of
CFD techniques for modeling buoyancy-driven
flows.
CFD simulation lecturing hall using ANSYS Fluent-
Natural ventilation
CFD simulation lecturing hall using ANSYS Fluent-
Forced ventilation
CFD Simulation smoke evaluation in lecturing hall
II. FORCED CONVECTION VALIDATION
STUDY
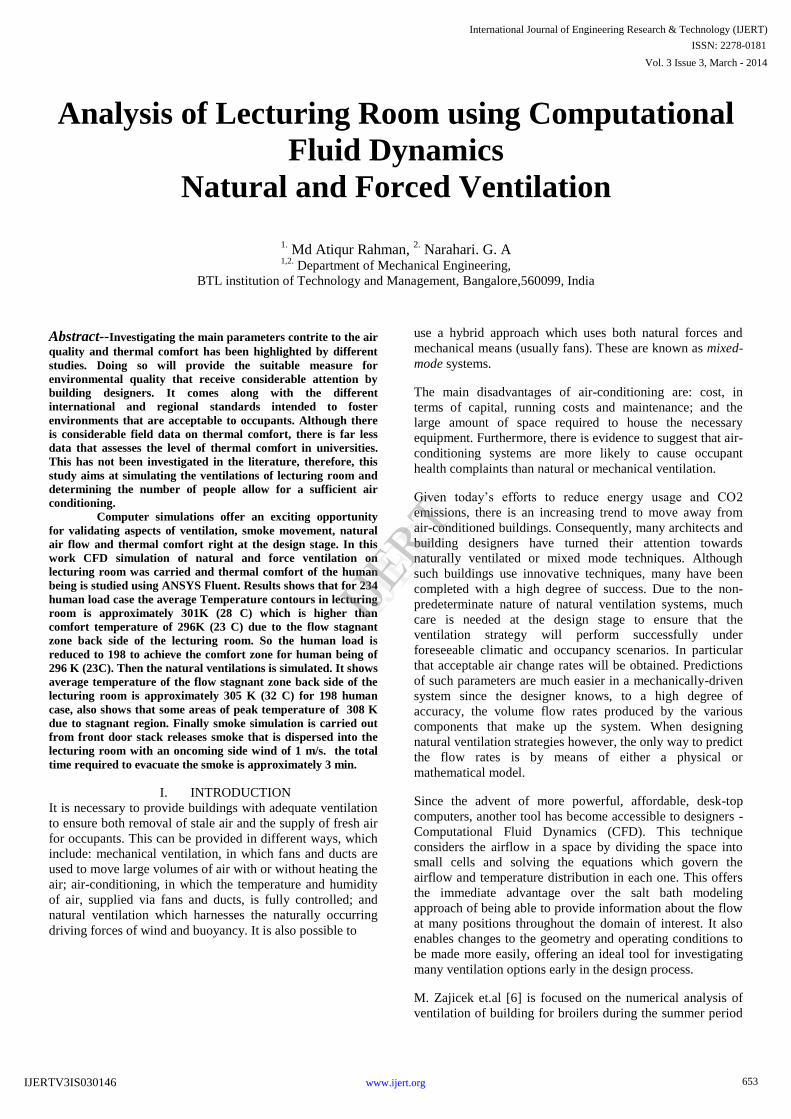
A well documented forced convection benchmark study by
Nielsen et al. [4][5](1978) is used herein to validate CFD
flow field predictions. Geometrical arrangement used in the
experiment is presented in Figure 3.1, where H=3m (height
in meters). The experiment was conducted in a room with a
single slot inlet/single slot outlet configuration. The inlet
velocity distribution was a uniform velocity profile with a
magnitude of 0.455 m/s (meters/second). The inlet and outlet
heights were 0.168 m and 0.48 m respectively. The air
velocity was measured by a laser Doppler anemometer along
the centerlines of the four cross sections as shown in Figure
2, namely x/H = 1, x/H = 2, y/H = 0.028, y/H = 0.972.
Numerical computations were performed using commercially
available. software package Fluent developed by ANSYS
.
Fig.1 Geometry and CFD domain of Forced Convection Validation Study
CFD Meshing
The whole computational domain has to be divided into
small control volumes, called grid cells in order to solve the
discretized transport equations. Constructing a computational
grid is a constant tradeoff between accuracy and CPU-time;
when a grid is coarse the systems that have to be solved are
small which implies short-CPU times. The downside is that a
coarse grid is unable to represent small velocity or pressure
gradients in the flow field. A very fine grid will be more
accurate but can take undesirably long CPU-times. An
additional disadvantage of a fine grid is that discretization
gives a small round off error for every grid cell; more grid
cells imply more round off errors
The computational grid used in this thesis can be found in
Fig.2 . The grid is created with the program “AMP”. This is a
standard mesh-generator compatible with several CFD
packages, including Fluent. The main advantages of this
program are the automatic mesh generator and the extended
options to adapt the model to user preferences. AMP defines
the model, grid and all boundary types.
654
Vol. 3 Issue 3, March - 2014
International Journal of Engineering Research & Technology (IJERT)
IJERT
IJERT
ISSN: 2278-0181
www.ijert.orgIJERTV3IS030146
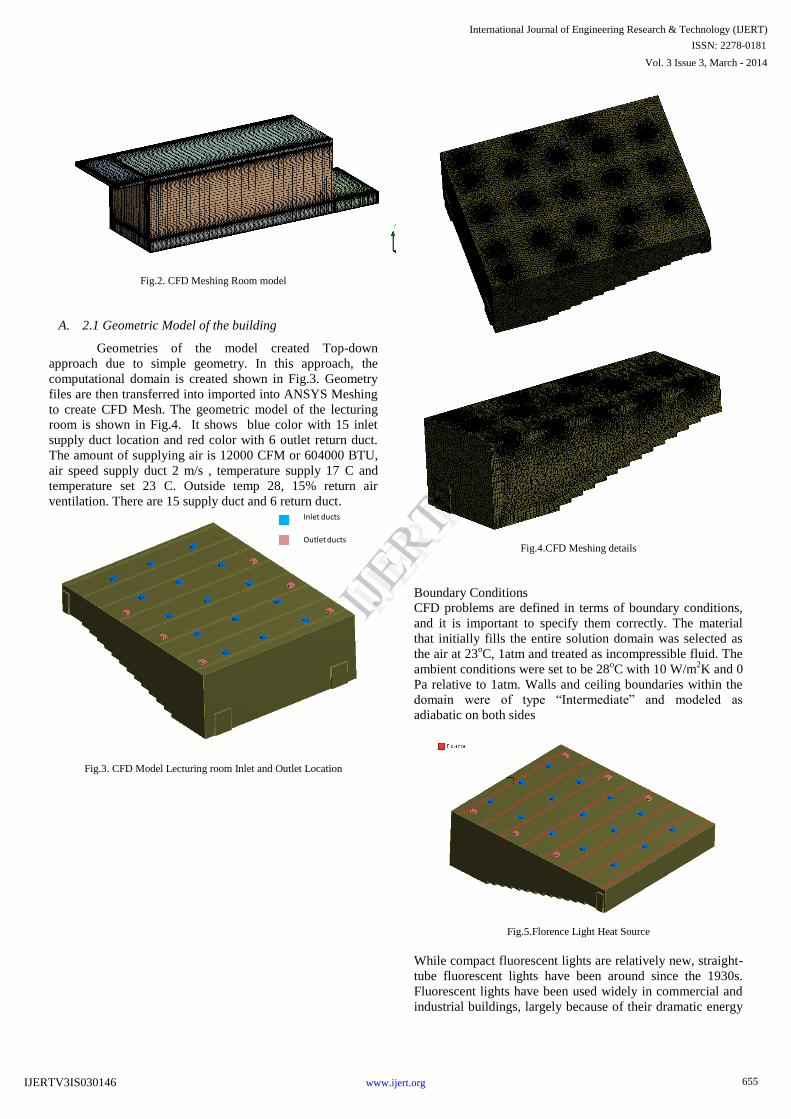
Fig.2. CFD Meshing Room model
A. 2.1 Geometric Model of the building
Geometries of the model created Top-down
approach due to simple geometry. In this approach, the
computational domain is created shown in Fig.3. Geometry
files are then transferred into imported into ANSYS Meshing
to create CFD Mesh. The geometric model of the lecturing
room is shown in Fig.4. It shows blue color with 15 inlet
supply duct location and red color with 6 outlet return duct.
The amount of supplying air is 12000 CFM or 604000 BTU,
air speed supply duct 2 m/s , temperature supply 17 C and
temperature set 23 C. Outside temp 28, 15% return air
ventilation. There are 15 supply duct and 6 return duct.
Fig.3. CFD Model Lecturing room Inlet and Outlet Location
Fig.4.CFD Meshing details
Boundary Conditions
CFD problems are defined in terms of boundary conditions,
and it is important to specify them correctly. The material
that initially fills the entire solution domain was selected as
the air at 23oC, 1atm and treated as incompressible fluid. The
ambient conditions were set to be 28oC with 10 W/m
2K and 0
Pa relative to 1atm. Walls and ceiling boundaries within the
domain were of type “Intermediate” and modeled as
adiabatic on both sides
Fig.5.Florence Light Heat Source
While compact fluorescent lights are relatively new, straight-
tube fluorescent lights have been around since the 1930s.
Fluorescent lights have been used widely in commercial and
industrial buildings, largely because of their dramatic energy
Inlet ducts
Outlet ducts
655
Vol. 3 Issue 3, March - 2014
International Journal of Engineering Research & Technology (IJERT)
IJERT
IJERT
ISSN: 2278-0181
www.ijert.orgIJERTV3IS030146
savings over incandescent lights and the fact that they
typically last ten to twenty times as long is [4].
Fig.5 shows the Florence Light Heat Source red color, here
each Florence light is modeled with 50 W applied as heat-
flux boundary conditions selected based on Fig.3.8. Then
total heat applied is 80*2*50 = 8000 W.
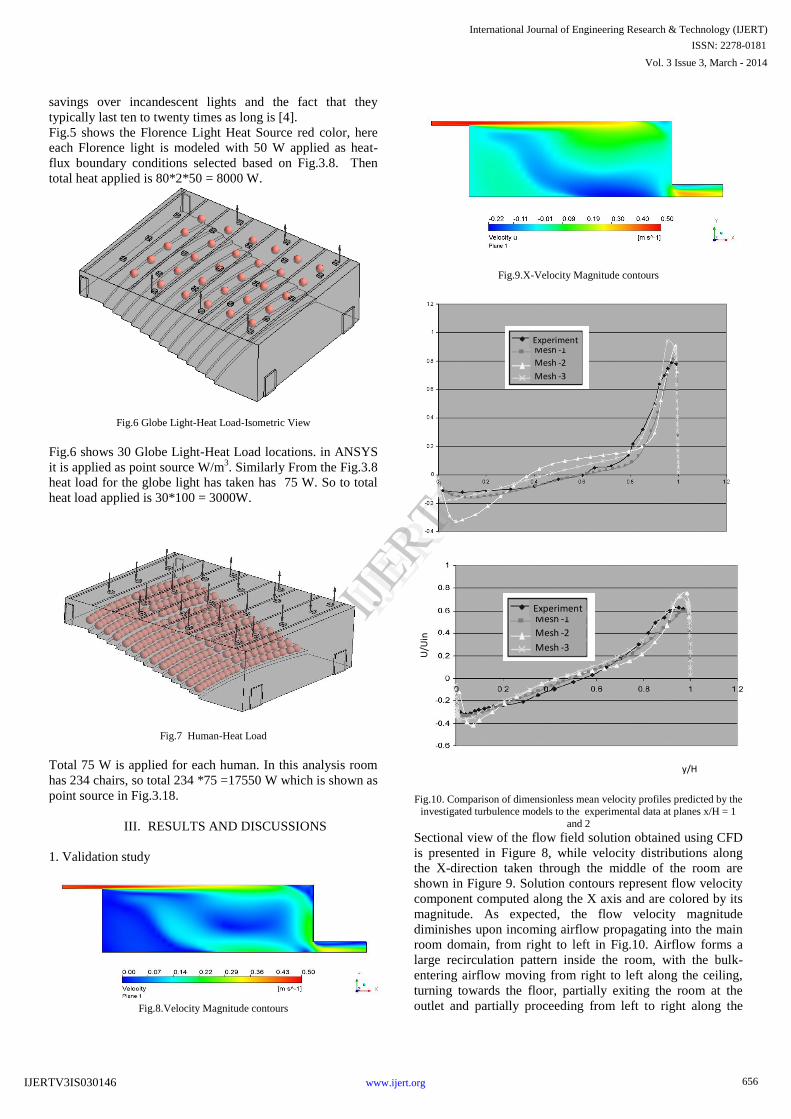
Fig.6 Globe Light-Heat Load-Isometric View
Fig.6 shows 30 Globe Light-Heat Load locations. in ANSYS
it is applied as point source W/m3. Similarly From the Fig.3.8
heat load for the globe light has taken has 75 W. So to total
heat load applied is 30*100 = 3000W.
Fig.7 Human-Heat Load
Total 75 W is applied for each human. In this analysis room
has 234 chairs, so total 234 *75 =17550 W which is shown as
point source in Fig.3.18.
III. RESULTS AND DISCUSSIONS
1. Validation study
Fig.8.Velocity Magnitude contours
Fig.9.X-Velocity Magnitude contours
Fig.10. Comparison of dimensionless mean velocity profiles predicted by the investigated turbulence models to the experimental data at planes x/H = 1
and 2
Sectional view of the flow field solution obtained using CFD
is presented in Figure 8, while velocity distributions along
the X-direction taken through the middle of the room are
shown in Figure 9. Solution contours represent flow velocity
component computed along the X axis and are colored by its
magnitude. As expected, the flow velocity magnitude
diminishes upon incoming airflow propagating into the main
room domain, from right to left in Fig.10. Airflow forms a
large recirculation pattern inside the room, with the bulk-
entering airflow moving from right to left along the ceiling,
turning towards the floor, partially exiting the room at the
outlet and partially proceeding from left to right along the
Mesh -1
Mesh -2
Mesh -3
Experiment
Mesh -1
Mesh -2
Mesh -3
Experiment
y/H
U/U
in
656
Vol. 3 Issue 3, March - 2014
International Journal of Engineering Research & Technology (IJERT)
IJERT
IJERT
ISSN: 2278-0181
www.ijert.orgIJERTV3IS030146
floor completing the recirculation pattern by turning upwards
at the right lower corner of the solution domain. An
important characteristic of the flow confirmed by
experimental results includes two secondary recirculation
regions, one in the upper left and one in the lower right
corners of solution domain. Normalized experimental and
numerical results are shown in Figure 3.7 for the two
measured cross sections. All numerical solutions show close
adherence to experimental measurements
CASE1:- Simulation of the ventilation for a lecturing
room with 234 humans
Fig.11.Velocity contours on inlet plane
The predicted velocity distribution is shown in 11 for three
inlet plane In this case the flow contains a free jet in the inlet
region and downstream a wall affected area.
Fig.12 Temperature contours on inlet plane
The Temperature contours on inlet plane is shown in Fig 12.
It shows average temperature of the flow stagnant zone back
side of the lecturing room is approximately 301K (28 C)
which is higher than comfort temperature of 296K (23 C).
CASE2:- Simulation of the ventilation for a lecturing
room with 198 humans
Based on earlier results the number of people allow to ensure
a sufficient air conditioning is reduced to 198 means last two
row of human loading is not considered for the simulations.
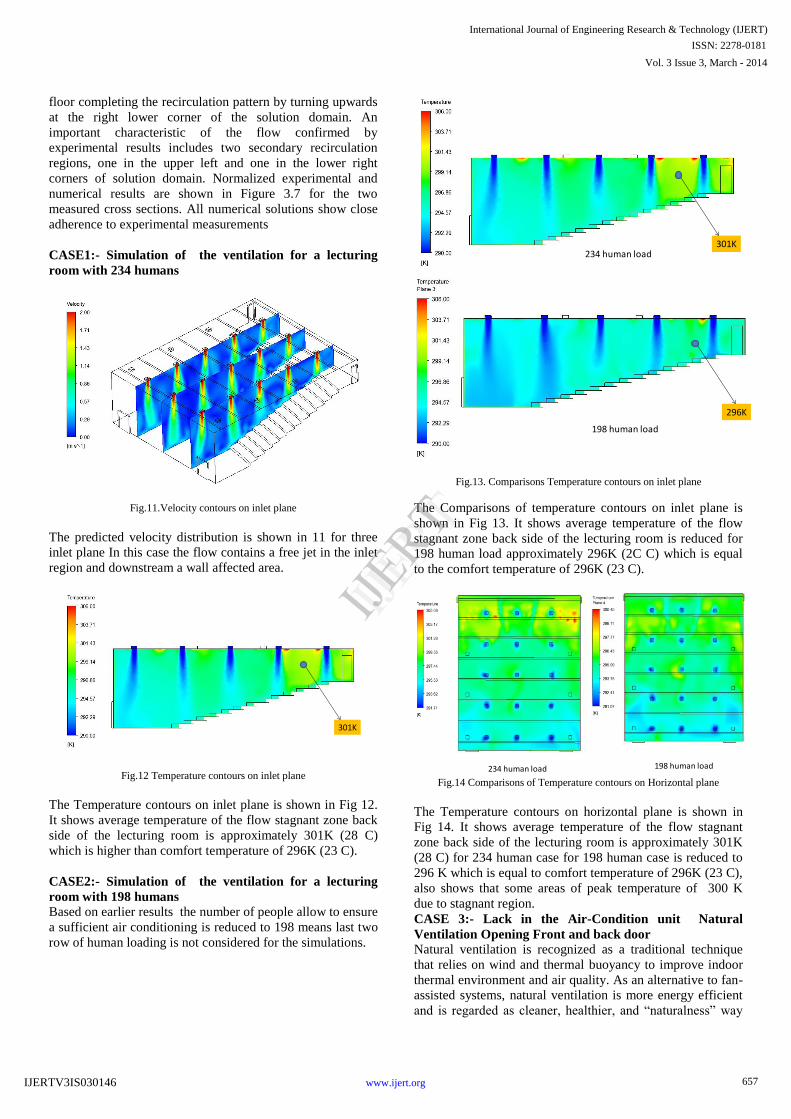
Fig.13. Comparisons Temperature contours on inlet plane
The Comparisons of temperature contours on inlet plane is
shown in Fig 13. It shows average temperature of the flow
stagnant zone back side of the lecturing room is reduced for
198 human load approximately 296K (2C C) which is equal
to the comfort temperature of 296K (23 C).
Fig.14 Comparisons of Temperature contours on Horizontal plane
The Temperature contours on horizontal plane is shown in
Fig 14. It shows average temperature of the flow stagnant
zone back side of the lecturing room is approximately 301K
(28 C) for 234 human case for 198 human case is reduced to
296 K which is equal to comfort temperature of 296K (23 C),
also shows that some areas of peak temperature of 300 K
due to stagnant region.
CASE 3:- Lack in the Air-Condition unit Natural
Ventilation Opening Front and back door
Natural ventilation is recognized as a traditional technique
that relies on wind and thermal buoyancy to improve indoor
thermal environment and air quality. As an alternative to fan-
assisted systems, natural ventilation is more energy efficient
and is regarded as cleaner, healthier, and “naturalness” way
301K
301K
296K
198 human load
234 human load
198 human load234 human load
657
Vol. 3 Issue 3, March - 2014
International Journal of Engineering Research & Technology (IJERT)
IJERT
IJERT
ISSN: 2278-0181
www.ijert.orgIJERTV3IS030146
for the connection with outside. In case 3 is lecturing room is
considered as natural convection and air flow inside to room
from front and back doors, in case of failure of AC and 198
human load is considered for the simulation.
Fig.15. Comparisons Temperature contours on inlet plane with and without
AC
The Comparisons of temperature contours on inlet plane is
shown in Fig 15 fro with and without AC. It shows average
temperature of the flow stagnant zone back side of the
lecturing room is reduced for 198 human load approximately
306K (33C) which is higher than comfort temperature of
296K (23 C), may be in this lights should be switched off to
feel more comfortable.
Case 4. Simulation of effects of dangerous aspects
considering smoke entering into the lecturing room from
front door.
In this case from front door stack releases smoke that is
dispersed into the lecturing room with an oncoming side
wind of 1 m/s. Initially, no smoke is being released.
Subsequently, the front door starts to release smoke is shown
in Fig.16 As can be seen, the smoke concentration rises to its
asymptotic value reaching 90% of its final value at around 7
seconds and releases until 30 seonds.
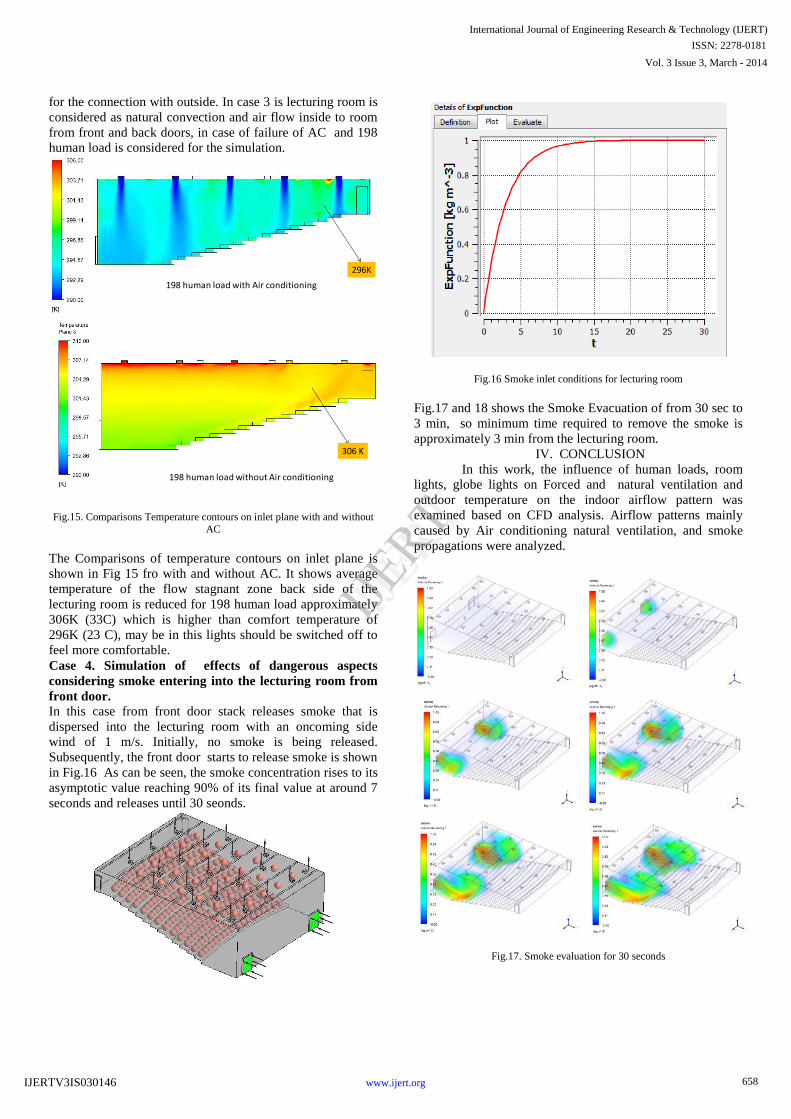
Fig.16 Smoke inlet conditions for lecturing room
Fig.17 and 18 shows the Smoke Evacuation of from 30 sec to
3 min, so minimum time required to remove the smoke is
approximately 3 min from the lecturing room.
IV. CONCLUSION
In this work, the influence of human loads, room
lights, globe lights on Forced and natural ventilation and
outdoor temperature on the indoor airflow pattern was
examined based on CFD analysis. Airflow patterns mainly
caused by Air conditioning natural ventilation, and smoke
propagations were analyzed.
Fig.17. Smoke evaluation for 30 seconds
306 K
296K
198 human load with Air conditioning
198 human load without Air conditioning
658
Vol. 3 Issue 3, March - 2014
International Journal of Engineering Research & Technology (IJERT)
IJERT
IJERT
ISSN: 2278-0181
www.ijert.orgIJERTV3IS030146

Fig.18. Smoke Evacuation of from 30 sec to 3 min
For 234 human load case the average Temperature
contours in lecturing room is approximately 301K
(28 C) which is higher than comfort temperature of
296K (23 C) due to the flow stagnant zone back side
of the lecturing room.
So the human load is reduced to 198 to achieve the
comfort zone for human being of 296 K (23C).
Then the natural ventilations is simulated. It shows
average temperature of the flow stagnant zone back
side of the lecturing room is approximately 305 K
(32 C) for 198 human case, also shows that some
areas of peak temperature of 308 K due to stagnant
region.
Finally smoke simulation is carried out from front
door stack releases smoke that is dispersed into the
lecturing room with an oncoming side wind of 1
m/s. the total time required to evacuate the smoke is
approximately 3 min.
REFERENCES [1] Frank P. Incropera, David P. DeWitt, Fundamentals of heat transfer,
Wiley, 1981
[1] Y.A. Cengel, Heat Transfer: A Practical Approach, 2nd ed., McGraw-Hill, New York, 2003.
[2] ASHRAE Handbook 2001 Fundamentals, American Society of
Heating, Refrigerating and Air-Conditioning Engineers, Atlanta, GA, 2001
[3] http://www.dmme.virginia.gov/DE/LinkDocuments/HandbookLi
ghting.pdf
[4] Nielsen, P. V., Restivo, A., & Whitelaw, J. H. (1978). The velocity
characteristics of ventilated rooms. Journal of Fluids Engineering, 100, 291-298.
[5] Nielsen, P. V. (1998). The selection of turbulence models for
prediction of room airflow. ASHRAE Transactions, 104(Part 1), 1119-1127
[6] M. Zajicek, and P. Kic, Improvement of the broiler house ventilation
using the CFD simulation, Agronomy Research Biosystem Engineering Special Issue 1, 235-242, 2012.
[7] Rong Li, Adrian Pitts, and Yuguo Li, Buoyancy-Driven Natural
Ventilation Of A Room With Large Openings, Proceedings: Building Simulation 2007.
[8] Ramponi R, Blocken B. 2012. CFD simulation of cross-ventilation for
a generic isolated building: impact of computational parameters. Building and Environment 53: 34-48.
[9] Frédéric Conte, CFD simulations of smoke detection in rooms with
high ceilings. SP AR 2002:30 Brandteknik Borås 2002 [10] Srebric, J. and Chen, Q. 2001. “A method of test to obtain diffuser data
for CFD modeling of room airflow,” ASHRAE Transactions, 107(2),
108-116. [11] Robert N. Meroney, CFD Prediction of Airflow in Buildings for
Natural Ventilation, 11th wind engineering conference.2009.
[12] Shafqat Hussain and Patrick H. Oosthuizen, Numerical Modeling of
Buoyancy-driven Natural Ventilation in a Simple Three Storey Atrium
Building, 20012.
[13] Ryoichi Kajiya1, Kodai Hiruta2, Koji Sakai1, Hiroki Ono1, Toshihiko Sudo Thermal Environment Prediction Using Cfd With A Virtual
Mannequin Model And Experiment With Subject In A Floor Heating
Room Proceedings of Building Simulation 2011: 12th Conference of International Building Performance Simulation Association, Sydney,
14-16 November
659
Vol. 3 Issue 3, March - 2014
International Journal of Engineering Research & Technology (IJERT)
IJERT
IJERT
ISSN: 2278-0181
www.ijert.orgIJERTV3IS030146