analysis of landsat 8 oli, landsat 7 etm+, oli … · • the sill is the height of the variogram...
TRANSCRIPT

Analysis of Landsat 8 OLI, Landsat 7 ETM+, OLI Required, ETM+ Simulated and OLI Compressed
using Variograms Curtis Woodcock, Boston University
1. Data: p12 r28
2. Location: Rockwood, ME
3. Size: 3000 X 3000 pixels
4. Sample size: 5%
5. 0% cloud coverage
6. Bands used
• Green
• Red
• NIR
Methodology
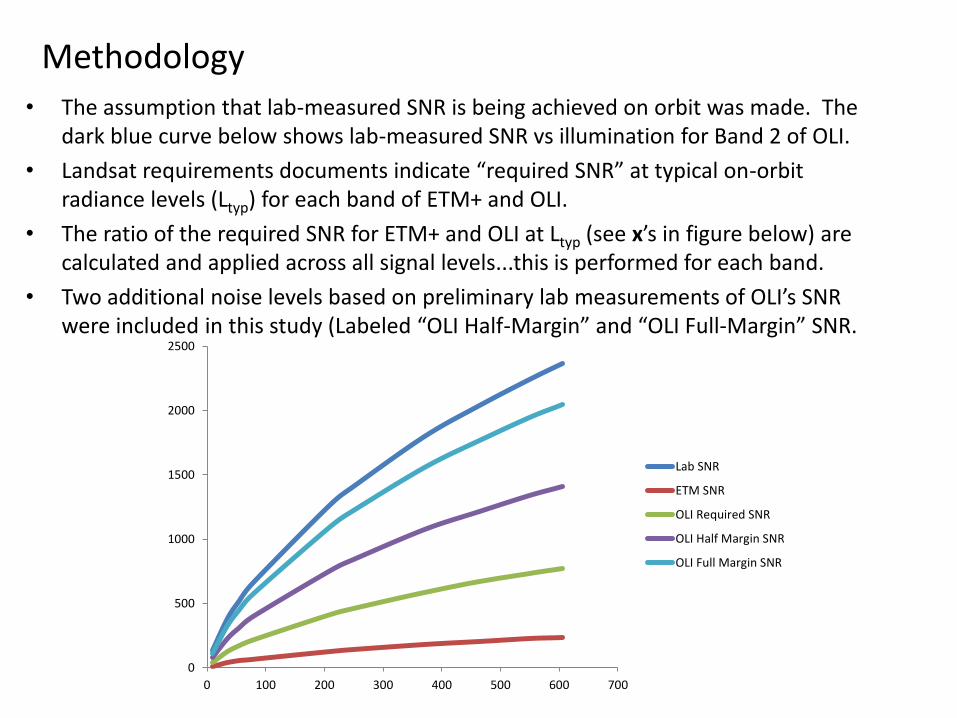
• The assumption that lab-measured SNR is being achieved on orbit was made. The dark blue curve below shows lab-measured SNR vs illumination for Band 2 of OLI.
• Landsat requirements documents indicate “required SNR” at typical on-orbit radiance levels (Ltyp) for each band of ETM+ and OLI.
• The ratio of the required SNR for ETM+ and OLI at Ltyp (see x’s in figure below) are calculated and applied across all signal levels...this is performed for each band.
• Two additional noise levels based on preliminary lab measurements of OLI’s SNR were included in this study (Labeled “OLI Half-Margin” and “OLI Full-Margin” SNR.
0
500
1000
1500
2000
2500
0 100 200 300 400 500 600 700
Lab SNR
ETM SNR
OLI Required SNR
OLI Half Margin SNR
OLI Full Margin SNR
Variograms
• Basically measure variance as a function of distance (average squared difference between observations as a function of distance)
• The sill is the height of the variogram at distances beyond any structure (or correlation in the image) and equals the variance of the image

Factors affecting variograms
• Noise increases the height of the variogram
• Smoothing (high pass filter, for example) lowers the variogram
• Coarser spatial resolution lowers the variogram

Green Band

Red Band
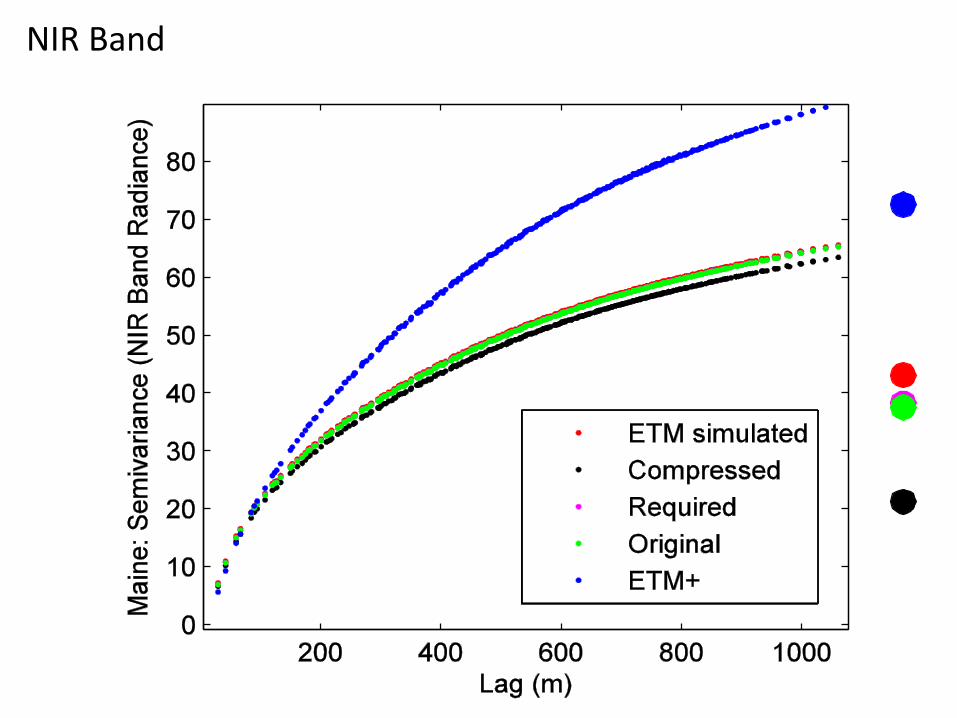
NIR Band
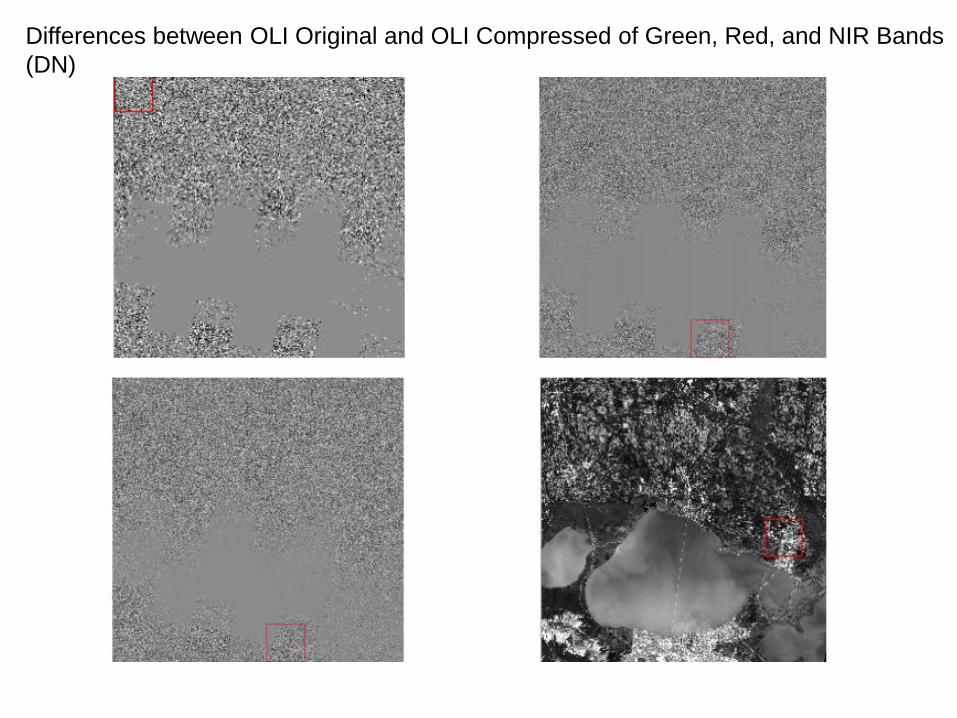
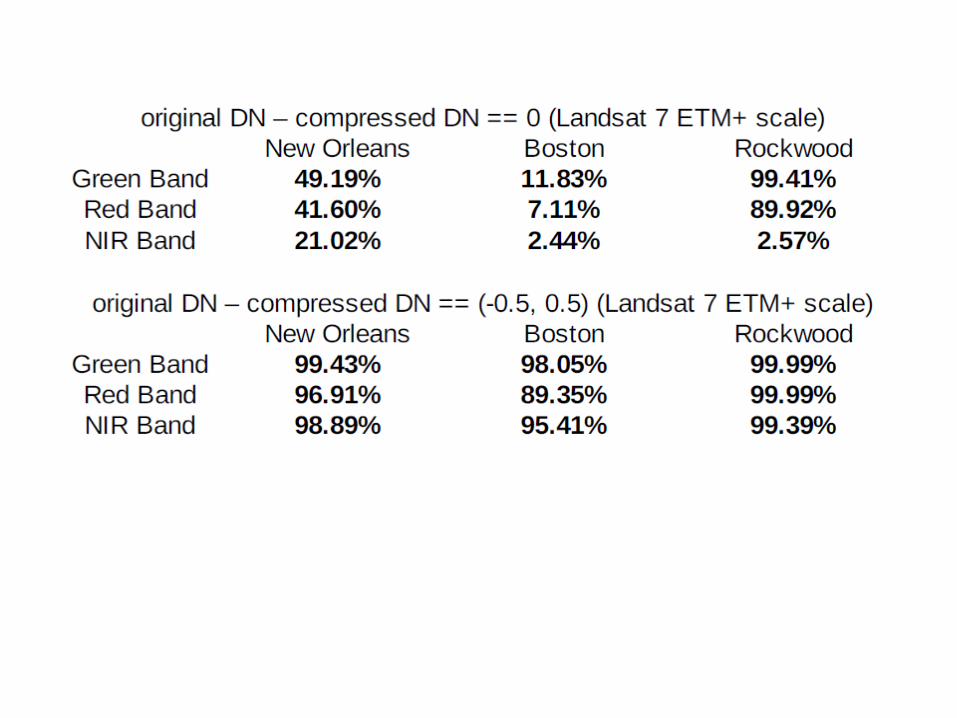
Differences between OLI Original and OLI Compressed of Green, Red, and NIR Bands
(DN)


Random Forest classification of Landsat 8 OLI Original, OLI Full, OLI Half, OLI Required, OLI Compressed, and ETM+
Simulated
• New Orleans, LA (p22 r39) • Boston, MA (p12 r31) • Rockwood, ME (p12 r28)

Accuracy Assessment on classification results that do not agree
New Orleans
Boston
%
% 0
10
20
30
40
50
60
70
80
ETM Original ETM Full ETM Half ETM Required ETM Comp
0
10
20
30
40
50
60
ETM Original ETM Full ETM Half ETM Required ETM Comp
% Rockwood
0
10
20
30
40
50
60
70
ETM Original ETM Full ETM Half ETM Required ETM Comp
Concluding thoughts
• Variograms of the original OLI image, and all the derivatives make sense -- as SNR decreases the sill of the variograms rises and compression reduces overall signal (and semivariance)
• Comparisons with ETM+ images is trickier as it may include effects related to changes in effective field of view (needs some more work and thought)
• Image classification is improved using OLI data compared to ETM+ (or, everything we do with OLI is going to work better than with prior Landsat sensors!!!)
• Compression reduces effective SNR, less than the shift to OLI requirements level (maybe closest to the “half” level) (based on classification results)