analysis of instrumentation failure data -...
TRANSCRIPT

Standards
Certification
Education & Training
Publishing
Conferences & Exhibits
Analysis of Instrumentation
Failure Data
A structured approach

2
Matthew F. (Matt) Murphy
Senior Consultant, DuPont Engineering
Electrical & Instruments Technology Group; Wilmington, DE
DuPont 25 years Industry 29 years
Instrumentation – Capital Projects and Plant Maintenance
Electrical – Capital Projects and Plant Maintenance
Process Automation – site system manager and corporate alliance manager
US Navy Officer
Certification: ISA Certified Automation Professional (CAP®)
Current role, Matt is working as a corporate leveraged resource to assist sites
in North America in implementing reliability programs for mission critical
electrical and instrument equipment.

Agenda
• What is Reliability?
– Reliability
– What is a Failure?
– Mean Time Between Failures
– Availability
• Using Reliability to eliminate Failures
– Predictive Maintenance
– Test and Inspection
– Calibration Verification
3

What is Reliability
• Reliability measures the likelihood of failure free
operation for a specific time period
• Reliability is always a function of time.
• Reliability calculation assumes no maintenance is
performed during the time cycle (t).
• Reliability is related to MTBF but they are not the same
R(t) = e-t/MTBF If MTBF = 365 days and t = 100 days
R(100) = .76 or 76% reliability
4

What is a Failure?
• Reliability is the key performance indicator for predictive
maintenance
• Starts with defining failures
• Failure is a loss of desired function
• Failure modes are important
• The definition of a failure is different depending on the
organization and application.
– Loss of function
– Loss of performance
– Noise or diagnostic indication of a failure
– Calibration verification outside of acceptable range.
• Reliability assumes that design/installation meets the
required performance
5

What is a Failure?
• Failure is an inability to perform a desired function
– Specific for the device and application
• ISO 14224:2006 Petroleum, Petrochemical, and Natural
Gas Industries
– Failure definitions and failure codes
– Standard format and terminology
– Facilitates the exchange of information between parties
– Requires every failure to use standard coding (work history)
• For functional safety need additional coding
– Dangerous or Safe Failures
– Detected or Undetected Failures
6

What is a Failure
7
Functional Safety Term Definition
Failure-Safe (Undetected/Detected) The failure does not have the potential to put the
safety-related system in a hazardous or fail-to-function
state.
Failure-Dangerous (Undetected/Detected) The failure prevents a safety instrumented function
from performing its automatic protection function.
Annunciation (Undetected/Detected) Enter this if the failure prevents automatic diagnostics
from detecting or annunciating that a failure has
occurred inside the equipment.
Undetected/Detected For each failure either detected or undetected must be
selected. If detected by automatic diagnostics performed in
the safety instrumented system or BPCS, select Detected. If
discovered during testing, inspection, troubleshooting,
observation, or incidents, select undetected.
Failures Dangerous-Undetected: Discovered by testing or demand
Reliability
8
0
20
40
60
80
100 Reliability (%)
R(t)
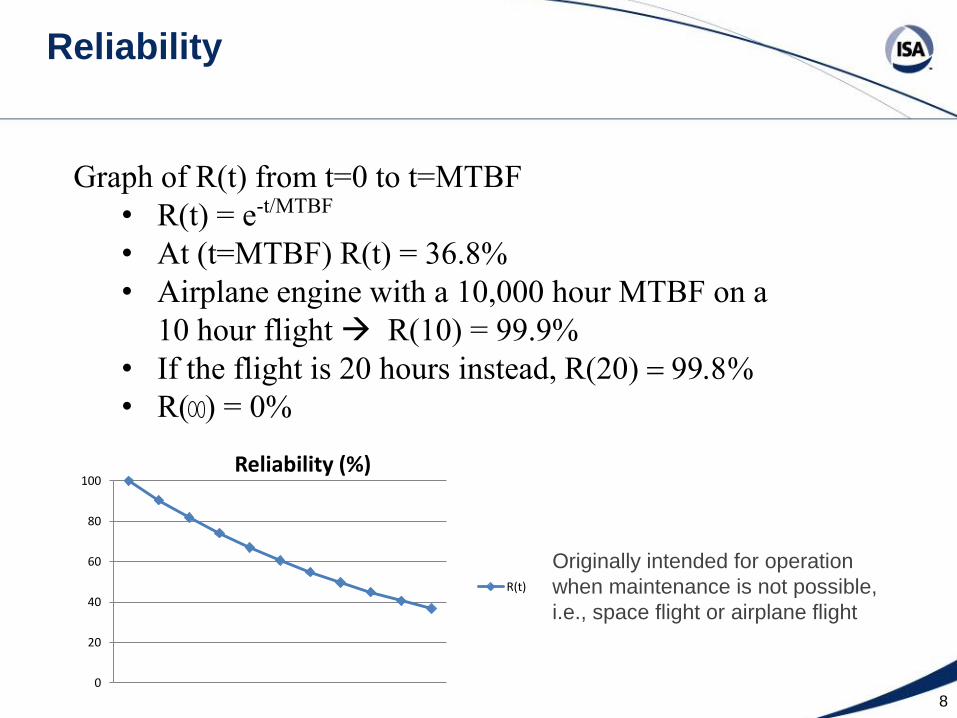
Graph of R(t) from t=0 to t=MTBF
• R(t) = e-t/MTBF
• At (t=MTBF) R(t) = 36.8%
• Airplane engine with a 10,000 hour MTBF on a
10 hour flight R(10) = 99.9%
• If the flight is 20 hours instead, R(20) = 99.8%
• R( ) = 0%
Originally intended for operation
when maintenance is not possible,
i.e., space flight or airplane flight

Mean Time Between Failure
• Mean Time Between Failure (MTBF) can be used
whether or not maintenance is performed between
failures.
• MTBF does not normally include end of life failures
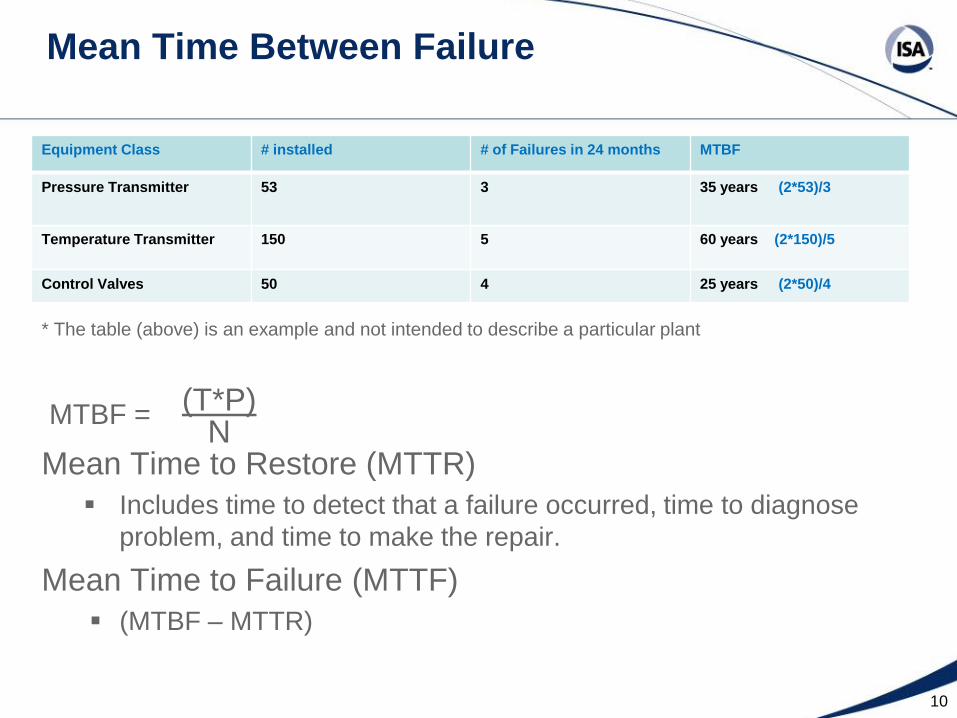
MTBF = (TxP) N
Where:
T = Observation Time
P = Population (number of units included in calculation)
N = Number of Failures
9
Mean Time Between Failure
* The table (above) is an example and not intended to describe a particular plant
MTBF = (T*P) N Mean Time to Restore (MTTR)
Includes time to detect that a failure occurred, time to diagnose
problem, and time to make the repair.
Mean Time to Failure (MTTF)
(MTBF – MTTR)
10
Equipment Class # installed # of Failures in 24 months MTBF
Pressure Transmitter
53 3 35 years (2*53)/3
Temperature Transmitter 150
5 60 years (2*150)/5
Control Valves 50 4 25 years (2*50)/4
Mean Time Between Failure
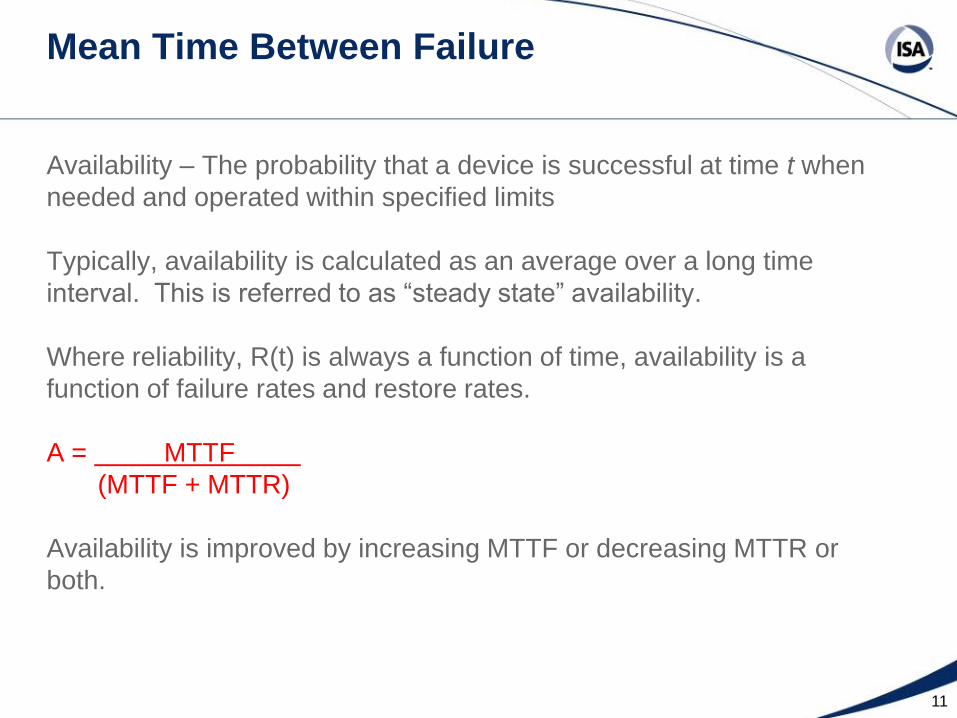
Availability – The probability that a device is successful at time t when
needed and operated within specified limits
Typically, availability is calculated as an average over a long time
interval. This is referred to as “steady state” availability.
Where reliability, R(t) is always a function of time, availability is a
function of failure rates and restore rates.
A = MTTF .
(MTTF + MTTR)
Availability is improved by increasing MTTF or decreasing MTTR or
both.
11

Mean Time Between Failure
A = MTTF .
(MTTF + MTTR)
• Availability is improved by increasing MTTF or decreasing MTTR or
both.
• Need to keep failure statistics to find opportunities to improve MTTF
• Need to record restore time to improve MTTR Time to diagnose / troubleshoot
Time to obtain necessary spare parts and tools
Time to perform the repair
Time to restore to service
• Redundancy could drive MTTR toward 0 and A toward
100% 12

Additional Failure Terms
• Wear Out – The failure mode of a device that has failed and shows signs of damage directly
from use
• Infant Mortality – Failure mode of a device that has failed due to manufacturer quality issues,
material faults, or poor assembly techniques.
• Random Failures – Failure mode where the time to failure is not uniform
• Distribution Analysis – A statistical method that describes reliability characteristics (e.g. Average)
13

Using Reliability Data to Eliminate Failures
• Predictive Maintenance
– Requires the ability to detect that equipment is deteriorating
– Requires sufficient time between detection of deteriorating and failure to allow
failure
– Acute failures are not candidates for predictive maintenance.
– Improves availability by minimizing MTTR and extending MTTF
– Need to collect and analyze data
14
Time
Equip
men
t P
erfo
rman
ce
Equipment Failure
Test/Inspection (predicts failure)
Test/Inspection Test/Inspection Peak
Performance
Test/Inspection (predicts failure)
Test/Inspection

Using Reliability Data to Eliminate Failures
• Predictive Maintenance
– Trend
Three consecutive data points in the same direction
– Statistically significant change (not data noise)
– Conditions with Logic
15
Time
Equip
men
t P
erfo
rman
ce
Equipment Failure
Test/Inspection (predicts failure)
Test/Inspection Test/Inspection Peak
Performance
Test/Inspection (predicts failure)
Test/Inspection
X > 100
Y > 50
AND
OR Z = ON
SP-123

Using Reliability Data to Eliminate Failures
• Set-up the Computerized Maintenance Management System (CMMS)
– Use Class information to manage population (P)
– Use ISO 14224 to log failures (N)
– Capture all test, inspections, calibrations, (including OK), failures, etc.
– Use Maintenance Plans to manage test schedules (T)
If condition based, the time could vary
– Manage work flow, authorizations, permits, and test equipment.
16
Build instrument list by class in the
CMMS to track the population

Using Reliability Data to Eliminate Failures
• Enter standard failure codes to document history
– Recommend using SO 14224 failure codes.
– Available by equipment class
– Automatic Valve (example)
17
DAMAGE CODES
0100 Acceptable / OK
1000 Corroded
1100 Cracked
1300 Damaged
1400 Defective
1500 Detached - disconnected
1700 Eroded
2000 Leaking
2300 Loose
3100 Moisture
3310 Open Circuit
3500 Plugged
4200 Short Circuit
4300 Sticking
4700 Worn
4900 Wrong Material
5100 Wrong Size
5200 Wrong Specification
5400 Wrong Type
FAILURE CODES
DOP Delayed operation
ELP External leakage - process
ELU External leakage - utility
FTC Fail to close on demand
FTO Fail to open on demand
FTR Fail to regulate
LCP Leakage in closed position
PLU Plugged / Choked

Using Reliability Data to Eliminate Failures
• Enter standard failure codes to document history.
– Pressure Transmitter (example)
– Use “Acceptable OK” to document test, inspections where no problems found
– Improve population validity
18
AOH Abnormal output - high
AOL Abnormal output - low
ELP External leakage - process
ERO Erratic output
FCH Fail to change
FTF Fail to function on demand
0100 Acceptable / OK
0900 Contaminated - dirty
1000 Corroded
1300 Damaged
1400 Defective
1500 Detached - disconnected
1700 Eroded
1750 Failed on Test
2000 Leaking
2300 Loose
3100 Moisture
3310 Open Circuit
3500 Plugged
4200 Short Circuit
5100 Wrong Size
5200 Wrong Specification
5400 Wrong Type

Using Reliability Data to Eliminate Failures
• To improve availability (using data)
– identify bad actors
– improve ability to detect deteriorating performance
– procedures, training and spare parts management to reduce MTTR
19
In this data set, Severe
service valves have
twice as many failures
as the next class
Using Reliability Data to Eliminate Failures
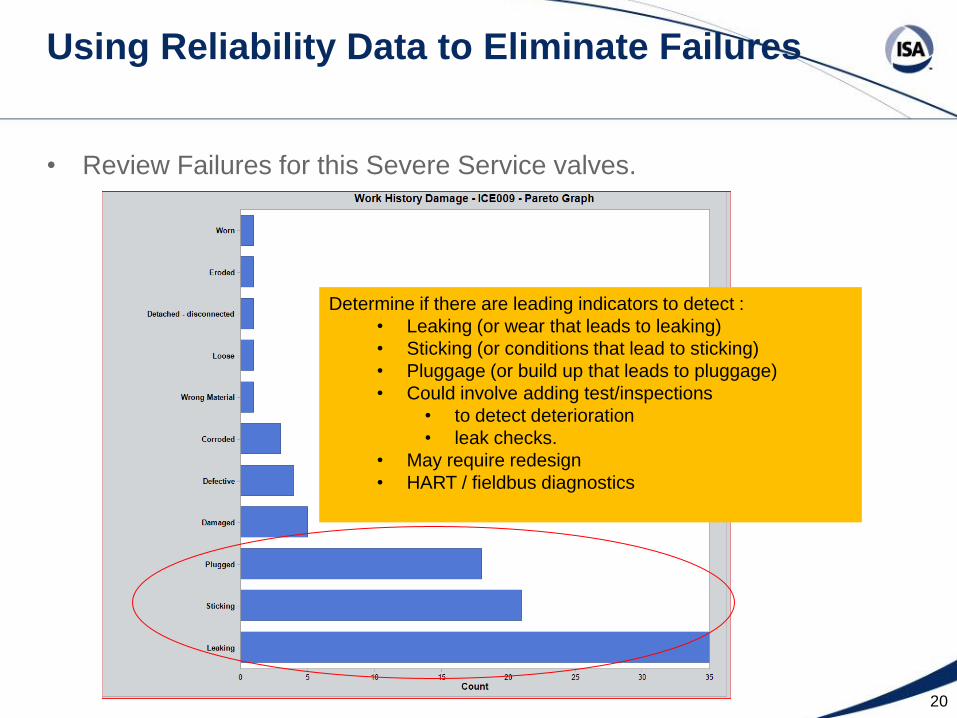
• Review Failures for this Severe Service valves.
20
Determine if there are leading indicators to detect :
• Leaking (or wear that leads to leaking)
• Sticking (or conditions that lead to sticking)
• Pluggage (or build up that leads to pluggage)
• Could involve adding test/inspections
• to detect deterioration
• leak checks.
• May require redesign
• HART / fieldbus diagnostics

Using Reliability Data to Eliminate Failures
• To improve availability (using data)
• Identify where predictions can anticipate failures
– AMS with HART or other fieldbus (continuous)
– Test and inspections (test interval)
• Calculate MTBF
– A large population improves the fidelity of the MTBF
– Need a long term strategy. MTBF fidelity improves with time.
MTBF = (T*P)
N
21

Using Reliability Data to Eliminate Failures
• Review Calibration As Found data
22

Using Reliability Data to Eliminate Failures
• Build a pivot table using the calibration data
23

Using Reliability Data to Eliminate Failures
24
C. below values, left
click to get the pop
up and select Value
Field Settings
• From the Pivot Table Field List a. Choose Tag Name b. Choose Overall_AF_Error_Max
Left click on the Value Field Settings
d. Select Var to calculate variability.

Using Reliability Data to Eliminate Failures
• If the variability approaches 0, the calibration results are similar for the
included calibrations.
• As variability increases, the results are changing each time
25

Using Reliability Data to Eliminate Failures
• Failure can be predicted and prevented.
• Failure could not be predicted at this test interval. Consider a shorter
test interval
26

Summary
• Reliability
• Failures
• Mean Time Between Failures
• Predictive Maintenance
• Analyzing Data
27