analysis of heat, mass and pressure ‘ikansfer in starch
TRANSCRIPT

8/13/2019 Analysis of Heat, Mass and Pressure ‘Ikansfer in Starch
http://slidepdf.com/reader/full/analysis-of-heat-mass-and-pressure-ikansfer-in-starch 1/16
ELSEVIER
Journal of Food Enginerrirzg 29 1996) 399-414
Copyrig ht 0 1996 Else&r Science Limi ted
Printed in Great Britain. All rights reserved
0260~8774/96/ 15.00 +O.OO
PII: SO260-8774(96)OOOOg-8
Analysis of Heat, Mass and Pressure ‘Ikansfer in StarchBased Food Systems
Yun Wu” & Joseph Irudayaraj”‘”
“‘Agricultural and Bioresource Engineering, University of Saskatchewan, Saskatoon,
Saskatchewan S7N OWO, Canada
“Biological and Irrigation Engineering, Utah State University, Logan, Utah 84322-4105, USA
(Received 26 September 1994; accepted 5 February 1996)
ABSTRACT
A set of coupled heat , mass and pressure t ransfer equat i ons proposed by Lui kov
(1975, Heat and mass t ransfer in capil l ary -porous bodies, Pergamon, UK) w as
empl oyed t o model t he heat , mass and pressure t ransfer phenomenon in a
composi t e food syst em duri ng dryi ng. A tw o-di mensional fi ni t e el ement model
w as developed t o solve t he coupled equati ons w i t h non-l i near mat eri alpropert i es. The fi ni t e el ement result s w ere val i dat ed by compari ng w i t h exact
solut i ons. The val i dat ed fi ni t e element model w as t hen used t o predi ct t he
t emperat ure and moi sture hi story in hydr at ed composit e st arch syst ems.
Compari son of predi cti ons fr om t he coupled and uncoupl ed heat and mass
t ransfer models, w hi ch assumed t hat pressure i s a const ant , w i t h t he
experi ment al dat a showed a mark ed di fl erence. Simul at ion result s i ndi cated
t hat predi cti ons from t he heat , mass and pressure t ransfer model agreed w el l
w it h t he avai l able experi ment al dat a. Copyri ght 0 1996 El sevi er Science
Limited
NOTATION
a ?I Mass diffusion coefficient (m2/s)
c, Specific moisture capacity (kg,,i,t”,,/kgd~ybody)
CP Air capacity (kgm’/kg.N)
5Heat capacity (J/kg%)
Jm Specific mass flux (kgmoistU,Jm2s)
L, Specific heat flux (W/m’)k N I Coefficient of moisture conductivity (kg/m.h.“M)
*Author to whom correspondence should be addressed.
399

8/13/2019 Analysis of Heat, Mass and Pressure ‘Ikansfer in Starch
http://slidepdf.com/reader/full/analysis-of-heat-mass-and-pressure-ikansfer-in-starch 2/16
Yun Wu, J. Ir udayaraj
P
t
Moisture filtration coefficient (kg.m/s.N)Thermal conductivity (W/m”K)
Moisture content (% kg water/kg solid)Moisture potential (“M)
Number of nodes in elementPressure (kN/m2)Time (s)
Temperature (“C)
Greek letters
I Convective mass transfer coefficient (kg moisture/m*s)
a4 Convective heat transfer coefficient (W/m*OK)
6 Thermo-gradient coefficient (l/“K)A Latent heat (J/kg)
R
PO
Domain of interest (m31
Dry body density (kg/m )
:
Surface boundary (m2)
Vector of unknowns [T M P]’
E Ratio of vapor diffusion coefficient to the coefficient of total moisture
diffusion
Subsctipts
a Ambient
m Mass
Prescribed
9 Heat
INTRODUCTION
The analysis of heat and mass transfer in a food system is very important becausefood properties change with temperature and moisture movement during drying.Various models have been proposed to predict the temperature and moisture
movement in food grains (Irudayaraj et al ., 1992). Kinetic models have been used inwater excess food system (Wirakartakusumah, 1981). Keey (1972) pointed out thatsuch kinetic models may be unduly restrictive because of the complex nature of
starch based systems. Whitaker et al. (1969) recognized that moisture diffusionequation is not adequate for describing the moisture movement process. The
transfer of moisture and heat must be considered simultaneously. The interrelationbetween heat and mass transfer was described by Luikov’s coupled system of partialdifferential equation (Luikov, 1975). Luikov conducted a large number ofinvestigations to validate the theory and determine experimentally the value of theparameters for a number of materials.
Most of previous studies on capillary materials were based on Luikov’s two term
(temperature term and moisture term) model which assumed that pressure wasconstant throughout the domain (Irudayaraj et al , 1992). Recent studies by Lewis &Ferguson (1990) and Irudayaraj & Wu (1994), based. on Luikov’s three term
(temperature, moisture and pressure) model revealed that, during an intense dryingprocess, a pressure gradient develops inside the capillary porous body, which causes

8/13/2019 Analysis of Heat, Mass and Pressure ‘Ikansfer in Starch
http://slidepdf.com/reader/full/analysis-of-heat-mass-and-pressure-ikansfer-in-starch 3/16
Analysis of starch based food systems 401
moisture transfer by filtration, in addition to moisture transfer by diffusion. Previous
studies focussed either on a one-dimensional system or the model predictions werenot verified with experimental results. Applicability of the coupled model to acomposite starch-based system has not been done.
Sakai & Hayakawa (1992) presented a mathematical model to predict the heatand moisture transfer in a composite food system. In their study, the temperatureand moisture dependent transport properties were considered, and the moisture
transfer potential was replaced by the chemical potential of water. However, in theexperimental validation, the thermal dependency of mass transfer (Dufour effect)and mass dependency of heat transfer (Soret effect) were neglected. The presentstudy will focus on applying Luikov’s coupled three term (temperature, moisture
and pressure term) model to study the transport process in a composite food systemand to evaluate the effect of the inter-dependency of heat and mass transfer and theeffect of pressure gradient on temperature and moisture movement.
The objectives of this study are to: (1) present a two-dimensional finite element
formulation of a set of coupled heat, mass and pressure transfer equations; (2)validate the model by comparing the model predictions with exact solutions for asimplified system; (3) apply the validated finite element model to predict the
temperature, moisture and pressure variation in a hydrated composite food systemand compare with the available experimental data, and predictions from theuncoupled and coupled heat and mass transfer models.
THEORETICAL ANALYSIS
Governing equations
The coupled system of partial differential equations (Luikov, 1975) for temperature,moisture potential and pressure can be simplified (Lewis & Ferguson, 1990) andpresented as:
C, ; = K,, V2T+K,2V2M+K ,3V2P
aMC, - = K2,V2T+K22V2M+K23V2P
at
C, ; = KJ72T+K 32V2M +K33V2P
(1)
(2)
(3)
where moisture content was expressed by the moisture potential as, (m = cJ4). The
coefficients C,, C,, C,, K,,, K12, K13, K2,, K22, K23, Kjl, K32 and &J are functions oftemperature and moisture transfer properties and are given by
C, = p0c,6/c,; C, = &pOc,,,; C, = -E~poc,k,lk,
K,, = (k,+.zlk,, Vc,; K,2 = Eik,, c,,; K2, = Elk, ,,,K22 = k,,; K,3 = ~1kp61c,,; Kj, = Elk z,,,

8/13/2019 Analysis of Heat, Mass and Pressure ‘Ikansfer in Starch
http://slidepdf.com/reader/full/analysis-of-heat-mass-and-pressure-ikansfer-in-starch 4/16
402 Yun Wu, J. I rudayaraj
Kx = - i b( - c)k;/k,; Kz3 = dk,; K32 = dkp
The boundary conditions associated with this system of equation was written in a
generalised form as
(k,+d.p& z,) g+Jz = 0 (4)
where
and
hf-+ J: = 0
am n
J;=A,(T- T,) +A ,:(M -M ,) +Jq (6)
J*, =A ,(T-T ,)+A ,(M -M ,)+J, (7)
A,: = + (1 -r)(k,+dp,& z,)
4
A,=& -amakp .lp (1 _E)
4
Jq=k, + .zRpOa,,,
k
J =J”_-a Sj
PO kq
FINITE ELEMENT FORMULATION
The governing differential equations [eqn (1)eqn (2)eqn (3)] were transformed intoelement equations by using the Galerkin’s weighted residual method. Thedependent variables T, A4 and P were approximated in terms of the respective nodalvalues Tj , M j and Pj by interpolating functions as:
T= i Nj@,Y)q(t)j=l
(8)

8/13/2019 Analysis of Heat, Mass and Pressure ‘Ikansfer in Starch
http://slidepdf.com/reader/full/analysis-of-heat-mass-and-pressure-ikansfer-in-starch 5/16
Analysis of starch based food systems 403
IME : Nj x,Y)Mj (t) (9)j=l
p= i Nj x,Y)Pj t)
j=l
where Nj is the weighting function and n is the number of nodes in the element.Using the Galerkin weighted residual method and setting the residual of theweighted errors to zero, eqns (l-3) can be written as
s [j V- K,,V~)+V. K,,vQ)+V. ~,~V~)-Cam-1a = 0 11)R
s [ aA2Nj v~(K*,VT)+V*(K,,VM)+V*(K,,VP)-Cm - da=0 (12)
R at 1
V. K,,V~)+V. K,,Vn;l)+V. K,,VP)-C, E dR = 0-1 13)
Applying Green’s theorem (integration by parts) and introducing the generalized
boundary conditions (eqns (4-7)) and further simplifying, the above expressions canbe written in a matrix form (Irudayaraj & Wu, 1994) as
[C(~)]{~>+[K(~)]{~}+{F} = (01 (14)
where
(4)’ = [TM P]C(4) = global capacitance matrixK 4) = global conductance matrix
{F} = global force vector.Equation (14) can be solved using Lees three level scheme (Comini et al., 1976;
Comini et af., 1974; Irudayaraj et al., 1990).
VALIDATION OF THE FINITE ELEMENT MODEL
The two dimensional finite element predictions were compared with the exactsolutions for the values of coefficients in eqn (l-3) as given in Table 1. The exact
solution for this system was given by:T(xy,t) = eX+y+‘+C, (15)

8/13/2019 Analysis of Heat, Mass and Pressure ‘Ikansfer in Starch
http://slidepdf.com/reader/full/analysis-of-heat-mass-and-pressure-ikansfer-in-starch 6/16
404 YunWu, J, Ir udayaraj
TABLE 1
Coefficient Matrix
Coefticient
C,
KI1
Value
5.25
;:g
2-o
Coeficient
CWI
K12
Value
10.5
1.01.01.0
Coejficient
23K23
K33
Value
21-o
;::
0.5
M(xy,t) = O-S*~+y+‘+C, (16)
P(xy,t) = 0. 25*ex+y+ +C3 (17)The constants C,, C,, and C3 can be determined using the initial conditions. The
two dimensional finite element grid (O-14 x 0.15 m cross section) was discretized into14 x 14 uniform nine-noded Lagrangian elements. Figure 1 is a comparison of finiteelement predictions (dimensionless) with the exact solution at the correspondinglocation (X = 0.06 m, y = 0.07 m). It can be seen that the temperature, moisture, andpressure predictions agree well with the exact solutions.
Fig. 1
0 0.2 0.4 0.6 0.6 1
Fo
Comparison of finite element predicted temperature, moisture and pressure(solid line) with exact solution (symbols) at x = O-06 m and y = O-07 m).
ratio
8/13/2019 Analysis of Heat, Mass and Pressure ‘Ikansfer in Starch
http://slidepdf.com/reader/full/analysis-of-heat-mass-and-pressure-ikansfer-in-starch 7/16
Anal ysis of starch based ood syst ems 405
Application
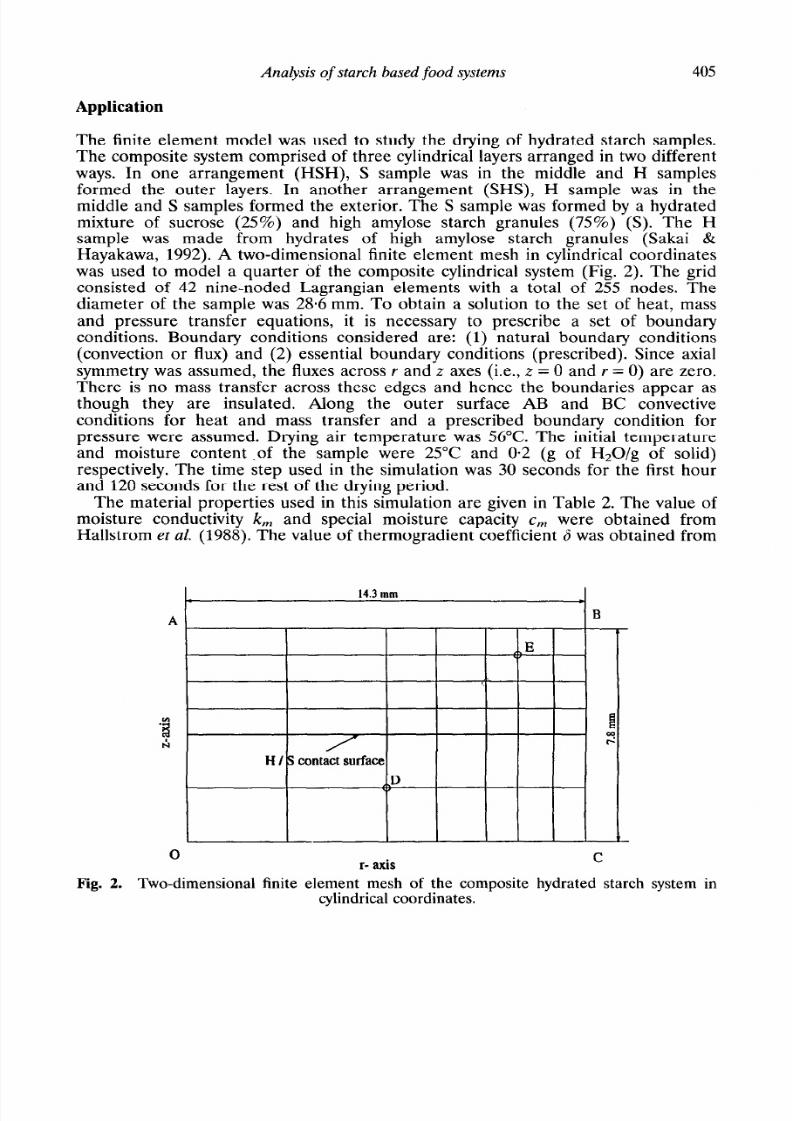
The finite element model was used to study the drying of hydrated starch samples.The composite system comprised of three cylindrical layers arranged in two different
ways. In one arrangement (HSH), S sample was in the middle and H samplesformed the outer layers. In another arrangement (SHS), H sample was in the
middle and S samples formed the exterior. The S sample was formed by a hydratedmixture of sucrose (25%) and high amylose starch granules (75%) (S). The Hsample was made from hydrates of high amylose starch granules (Sakai &Hayakawa, 1992). A two-dimensional finite element mesh in cylindrical coordinateswas used to model a quarter of the composite cylindrical system (Fig. 2). The gridconsisted of 42 nine-noded Lagrangian elements with a total of 255 nodes. The
diameter of the sample was 28.6 mm. To obtain a solution to the set of heat, massand pressure transfer equations, it is necessary to prescribe a set of boundaryconditions. Boundary conditions considered are: (1) natural boundary conditions
(convection or flux) and (2) essential boundary conditions (prescribed). Since axialsymmetry was assumed, the fluxes across Y and .z axes (i.e., t = 0 and r = 0) are zero.There is no mass transfer across these edges and hence the boundaries appear asthough they are insulated. Along the outer surface AI3 and BC convective
conditions for heat and mass transfer and a prescribed boundary condition forpressure were assumed. Drying air temperature was 56°C. The initial temperatureand moisture content .of the sample were 25°C and 0.2 (g of HzO/g of solid)respectively. The time step used in the simulation was 30 seconds for the first hourand 120 seconds for the rest of the drying period.
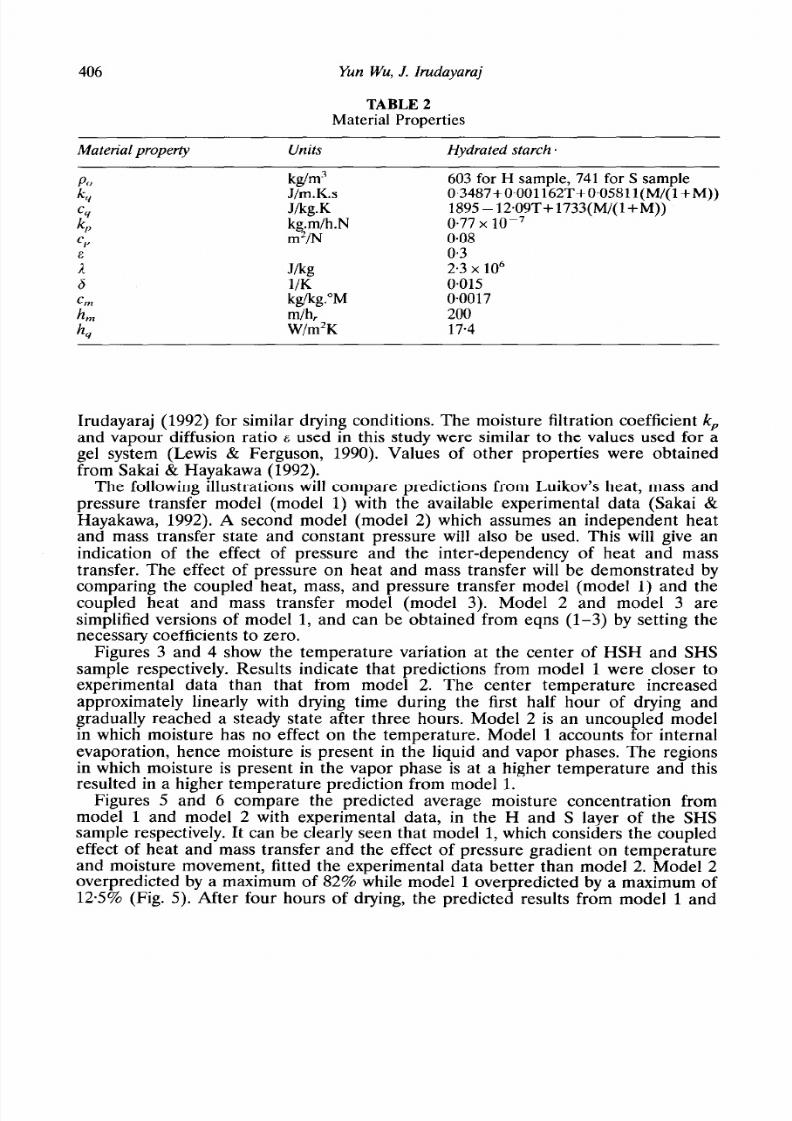
The material properties used in this simulation are given in Table 2. The value ofmoisture conductivity k,,, and special moisture capacity c, were obtained fromHallstrom et al. (1988). The value of thermogradient coefficient 6 was obtained from
0r- axis
C
Fig. 2. Two-dimensional finite element mesh of the composite hydrated starch system incylindrical coordinates.
8/13/2019 Analysis of Heat, Mass and Pressure ‘Ikansfer in Starch
http://slidepdf.com/reader/full/analysis-of-heat-mass-and-pressure-ikansfer-in-starch 8/16
406 Yun Wu, J. Ir udayaraj
TABLE2
Material Properties
Material property Uni t s Hy drated st arch -
kg/m’J/m.K.sJ/kg.Kkg.m/h.Nm*/N
J/kg
1/Kkg/kg.“Mm/h,W/m2K
6 3 or H sample, 741 for S sample0~3487+0~001162T+0~05811(M/(1+M))1895%12.09T+1733(M/(l+M))0.77 x lo-’0.080.32.3 x lo6O*OlS0.001720017.4
Irudayaraj (1992) for similar drying conditions. The moisture filtration coefficient k ,
and vapour diffusion ratio E used in this study were similar to the values used for agel system (Lewis & Ferguson, 1990). Values of other properties were obtained
from Sakai & Hayakawa (1992).The following illustrations will compare predictions from Luikov’s heat, mass and
pressure transfer model (model 1) with the available experimental data (Sakai &Hayakawa, 1992). A second model (model 2) which assumes an independent heat
and mass transfer state and constant pressure will also be used. This will give anindication of the effect of pressure and the inter-dependency of heat and mass
transfer. The effect of pressure on heat and mass transfer will be demonstrated bycomparing the coupled heat, mass, and pressure transfer model (model 1) and thecoupled heat and mass transfer model (model 3). Model 2 and model 3 aresimplified versions of model 1, and can be obtained from eqns (l-3) by setting the
necessary coefficients to zero.Figures 3 and 4 show the temperature variation at the center of HSH and SHS
sample respectively. Results indicate that predictions from model 1 were closer toexperimental data than that from model 2. The center temperature increased
approximately linearly with drying time during the first half hour of drying andgradually reached a steady state after three hours. Model 2 is an uncoupled modelin which moisture has no effect on the temperature. Model 1 accounts for internalevaporation, hence moisture is present in the liquid and vapor phases. The regionsin which moisture is present in the vapor phase is at a higher temperature and thisresulted in a higher temperature prediction from model 1.
Figures 5 and 6 compare the predicted average moisture concentration frommodel 1 and model 2 with experimental data, in the H and S layer of the SHSsample respectively. It can be clearly seen that model 1, which considers the coupledeffect of heat and mass transfer and the effect of pressure gradient on temperatureand moisture movement, fitted the experimental data better than model 2. Model 2
overpredicted by a maximum of 82% while model 1 overpredicted by a maximum of125% (Fig. 5). After four hours of drying, the predicted results from model 1 and

8/13/2019 Analysis of Heat, Mass and Pressure ‘Ikansfer in Starch
http://slidepdf.com/reader/full/analysis-of-heat-mass-and-pressure-ikansfer-in-starch 9/16
Anal ysis of st arch based food syst ems 407
Time h)
Fig. 3. Comparison of predicted central (Point 0) temperature histories of HSH sample bymodel 1 (solid line) and model 2 (dashed line) with measured values (symbols), Sakai &
Hayakawa (1992).
i
Time (h)
Fig. 4. Comparison of predicted central (Point 0) temperature histories of SHS sample bymodel 1 (solid line) and model 2 (dashed line) with measured values (symbols), Sakai &
Hayakawa (1992).

8/13/2019 Analysis of Heat, Mass and Pressure ‘Ikansfer in Starch
http://slidepdf.com/reader/full/analysis-of-heat-mass-and-pressure-ikansfer-in-starch 10/16
408 Yun W u, J. Ir udayaraj
0 1 2 3 4
Time h)
Fig. 5. Comparison of predicted average moisture histories of H layer of the SHS sample
by model 1 (solid line) and model 2 (dashed line) with measured values (symbols), Sakai &Hayakawa (1992).
.
o lo 1.00 2.00 3.00 . lo
Time h)
Fig. 6. Comparison of predicted average moisture histories of S layer of the SHS sample by
model 1 (solid line) and model 2 (dashed line) with measured values (symbols), Sakai &Hayakawa (1992).

8/13/2019 Analysis of Heat, Mass and Pressure ‘Ikansfer in Starch
http://slidepdf.com/reader/full/analysis-of-heat-mass-and-pressure-ikansfer-in-starch 11/16
Anal ysis of st arch based food syst ems 409
model 2 were O-315 and 0.445 respectively while the measured moisture value was
0.28. Comparison of model predictions in the S layer (Fig. 6) indicated that model1 and model 2 deviated by a maximum of 0.1 and 0.25 from the experimental dataafter two hours of drying.
Figures 7 and 8 present the predicted average moisture concentration in H and Slayer of the HSH sample with experimental data. The maximum deviation of
prediction (after two hours of drying) from model 2 was 0.17 while that from model1 had a fair agreement with the experimental results (maximum deviation was 0.06).This could be attributed to the fact that the effect of pressure gradient and the
inter-dependency of heat and mass transfer was not considered in model 2. Figure8 shows a similar trend in model predictions. The deviation of moisture content
predictions from the measured values could be due to the change of water activityin S layer because it was made from a mixture of 25% sucrose and 75% highamylose starch. The sudden change in temperature (Figs 3 and 4) and moisturecontent (Figs 5-8) during the initial stages (1 h) of drying indicates an increased
temperature and moisture gradient, which contributes to a faster drying rate. Oncethe temperature gradients are established their dependence on moisture transferdecreases, hence during the later stages drying occurs mostly due to the presence ofmoisture gradient. As the moisture gradient decreases drying rate decreases and themoisture content in the sample approaches an equilibrium state.
Figures 9 and 10 show the respective pressure profile in the HSH and SHSsample at location D (r = 7.15 mm, z = 1.95 mm), and E (r = 11.92 mm,z = 6.925 mm) as pointed out in Fig. 2. The pressure gradient gives rise to additional
moisture transfer due to filtration effect. It can be seen that pressure varies morerapidly at the surface that the center. Increased variation at the surface, gives rise tolarger gradients in regions closer to the surface than the centre. Hence. the
1 2 3
Time h)
Fig. 7. Comparison of predicted average moisture histories of H layer of the HSH sample
by model 1 (solid line) and model 2 (dashed line) with measured values (symbols), Sakai &Hayakawa (1992).

8/13/2019 Analysis of Heat, Mass and Pressure ‘Ikansfer in Starch
http://slidepdf.com/reader/full/analysis-of-heat-mass-and-pressure-ikansfer-in-starch 12/16
410 Yun W u, J. Ir udayaraj
Time (h)
Fig. 8. Comparison of predicted average moisture histories of S layer of the HSH sampleby model 1 (solid line) and model 2 (dashed line) with measured values (symbols), Sakai &
Hayakawa (1992).
contribution of pressure gradient to moisture transfer is larger at the surface, while
this effect may be negligible in the inner regions.Figures 11 and 12 present the effect of pressure on the predicted mass average
moisture ratio of the SHS and HSH samples using model 1 (coupled heat, mass and
Time (h)
Fig. 9. Pressure variation at point D (r = 7-15 mm, .z = 1.95 mm) and point E(r = 11.92 mm, z = 6-925 mm) in HSH sample.

8/13/2019 Analysis of Heat, Mass and Pressure ‘Ikansfer in Starch
http://slidepdf.com/reader/full/analysis-of-heat-mass-and-pressure-ikansfer-in-starch 13/16
Anal ysis of starch based ood syst ems
Time h)
Fig. 10. Pressure variation at point D (r = 7.15 mm, z = 1.95 mm)
0.8
0.6
P
0.4
Fig. 11. Comparison of
model 1 (solid line) and
0
411
0 1 2 3 4
Time h)
predicted mass average moisture histories of the SHS sample by
model 3 (dashed line) with measured values (symbols), Sakai &Hayakawa (1992).

8/13/2019 Analysis of Heat, Mass and Pressure ‘Ikansfer in Starch
http://slidepdf.com/reader/full/analysis-of-heat-mass-and-pressure-ikansfer-in-starch 14/16
412 Yun Wu, J. hdayaraj
0.8
0.8
P
0.2
0 1 2 3 4
Time h)
Fig. 12. Comparison of predicted mass average moisture histories of the HSH sample by
model 1 (solid line) and model 3 (dashed line) with measured values (symbols), Sakai &
Hayakawa (1992).
pressure transfer) and model 3 (coupled heat and mass transfer model with constantpressure) for a drying temperature of 56°C. The deviation of moisture prediction by
model 3, from experimental data (Sakai & Hayakawa, 1992) was significantly greaterthan that from model 1. Model 1 considers the additional moisture movementcaused by pressure gradient and model 3 does not account for this additionalmoisture transfer. The excess moisture movement that can be attributed to the
effect of the pressure was 25% and 2.2% for the SHS (Fig. 11) and HSH (Fig. 12)sample. Under such circumstances, omission of the pressure term will result in an
over prediction of moisture content. There was no noticeable difference intemperature prediction between the two models. Hence the comparison fortemperature prediction was not presented.
Figure 13 shows the effect of drying temperature on the average moisture contentof HSH sample. Model 1 was used in this simulation because of its better fit (Figs
3-8) with the experimental data. to the initial moisture content of HSH sample was0.185 for the drying temperature of 70°C while the ratio was 0.22 and O-325 fordrying temperatures of 56°C and 40°C respectively. The predicted results for SHSsample were similar to those for HSH sample hence were not reported.
CONCLUSIONS
The temperature, moisture and pressure distribution in a composite food system
during drying was described by a set of coupled non-linear heat, mass and pressuretransfer equations. The finite element method was used to solve the system of

8/13/2019 Analysis of Heat, Mass and Pressure ‘Ikansfer in Starch
http://slidepdf.com/reader/full/analysis-of-heat-mass-and-pressure-ikansfer-in-starch 15/16
Anal ysis of st arch based food syst ems 413
Time h)
Fig. 13. Effect of drying temperature on the average moisture variation of HSH sample.
equations. A two dimensional cylindrical coordinate system was used. The finite
element predictions were in excellent agreement with the exact solutions.The simulation study in the composite starch food system showed that the finite
element predictions from Luikov’s heat, mass and pressure transfer mode1 agreed
well with the experimental data. However, prediction from the uncoupled heat andmass transfer model showed a considerable difference with the experimental results.This was due to the fact that the inter-dependency of heat transfer and mass
transfer and the effect of pressure gradient on moisture movement were not takeninto account in the uncoupled heat and mass transfer model. Comparison ofpressure dependent (mode1 1) and pressure independent (model 3) coupled modelsindicated that pressure gradient causes additional moisture transfer. Hence, theapplication of Luikov’s coupled transfer equations to complex food systems, whichneglected the dependency of heat and mass transfer or assumed a constant pressure,
should be used with caution.
REFERENCES
Comini, G. & Lewis, R. W. (1976). A numerical solution of two-dimensional problems
involving heat and mass transfer. ht. J. Heat M ass Transfer, 19, 1387-9.2
Comini, G., Guidice, D. S., Lewis, R. W. & Zienkiewicz, 0. C. (1974). Finite element
solution of nonlinear heat conduction problems with special reference to phase change.
I nt . J. h& m. M eth. i n Eng., 8, 613-24.
Hallstrom, B., Skjoldebrand, C. & Tragardh, C. (1988). Heat transfer and food products,
19-22, Elsevier Applied Science, London and New York.
Irudayaraj, J., Haghighi, K. & Stroshine, R. L. (1990). Nonlinear finite element analysis of
coupled heat and mass transfer problems with an application to timber drying. Drying
Technofogy, 8 (4), 731-49.

8/13/2019 Analysis of Heat, Mass and Pressure ‘Ikansfer in Starch
http://slidepdf.com/reader/full/analysis-of-heat-mass-and-pressure-ikansfer-in-starch 16/16
414 Yun Wu, J. I rudayaraj
Irudayaraj, J., Haghighi, K. & Stroshine, R. L. (1992). Finite element analysis of drying with
application to cereal grains. .I. Agri c. Engng. Res., 53 (4), 209-29.
Irudayaraj, J. & Wu, Y. (1994). Finite element solution of coupled heat, mass and pressure
transfer in porous biomaterials. I nt . J. of Numeri cal Heat Transfer, 26(Z)
Keey, R. B. (1972). Dyi ng: Pri ncipl es andpract i ce, NY. Pergamon Press, New York.
Lewis, R. W. & Ferguson, W. J. (1990). The effect of temperature and total gas pressure onthe moisture content in a capillary porous body. I nt. J. For Numeri cal M et hods I n
Engineeri ng, 29, 35749.
Luikov, A. V. (1975). Heat and M ass Transfer i n Capil lar y-Porous Bodies, Pergamon Press,
Oxford, UK.
Sakai, N. & Hayakawa, K. I. (1992). Two dimensional simultaneous heat and moisture
transfer in composite food. J. Food Science, 57 (2), 475-80.
Whitaker, T. B., Barre, H. J. & Hamdy, M. Y. (1969). Theoretical and experimental studies
of diffusion in spherical bodies with a variable diffusion coefficient. Transactions of The
A&E, 12 (5), 668-72.
Wirakartakusumah, M. A. (1981). Kinetics of starch gelatinization and water absorption in
rice. Ph.D. Dissertation. Dep. Food Sci. University of Wisconsin, Madison.