analysis of germline stem cell differentiation following ... · mentally equivalent. proliferative...
TRANSCRIPT

GENETICS | INVESTIGATION
Analysis of Germline Stem Cell DifferentiationFollowing Loss of GLP-1 Notch Activity in
Caenorhabditis elegansPaul M. Fox1 and Tim Schedl2
Department of Genetics, Washington University School of Medicine, St. Louis, Missouri 63110
ABSTRACT Stem cells generate the differentiated progeny cells of adult tissues. Stem cells in the Caenorhabditis elegans hermaph-rodite germline are maintained within a proliferative zone of �230 cells, �20 cell diameters in length, through GLP-1 Notch signaling.The distal tip cell caps the germline and supplies GLP-1-activating ligand, and the distal-most germ cells that occupy this niche are likelyself-renewing stem cells with active GLP-1 signaling. As germ cells are displaced from the niche, GLP-1 activity likely decreases, yetmitotically cycling germ cells are found throughout the proliferative zone prior to overt meiotic differentiation. Following loss of GLP-1activity, it remains unclear whether stem cells undergo transit-amplifying (TA) divisions or more directly enter meiosis. To distinguishbetween these possibilities we employed a temperature-sensitive (ts) glp-1 mutant to manipulate GLP-1 activity. We characterizedproliferative zone dynamics in glp-1(ts) mutants at permissive temperature and then analyzed the kinetics of meiotic entry of pro-liferative zone cells after loss of GLP-1. We found that entry of proliferative zone cells into meiosis following loss of GLP-1 activity islargely synchronous and independent of their distal-proximal position. Furthermore, the majority of cells complete only a single mitoticdivision before entering meiosis, independent of their distal-proximal position. We conclude that germ cells do not undergo TAdivisions following loss of GLP-1 activity. We present a model for the dynamics of the proliferative zone that utilizes cell cycle rateand proliferative zone size and output and incorporates the more direct meiotic differentiation of germ cells following loss of GLP-1activity.
KEYWORDS stem cells; germline; Caenorhabditis elegans; GLP-1 Notch; meiosis; differentiation; proliferation
IN polarized adult tissues, differentiated progeny cell typesare produced by renewable stem cell systems. Variations in
the demand for differentiated cells, for example, based onspecies-specific requirements, lead to differences in stem cellsystems including features such as the stem cell populationsize, quiescence, cell cycle rate, and the extent of utilizationof transit-amplifying (TA) cells. Understanding the regulationof stem cell systems requires a synthesis of these features.
The Caenorhabditis elegans germline is an important modelfor the study of stem cell biology (Kimble 2011; Hansen and
Schedl 2013; Hubbard et al. 2013). The adult hermaphroditegermline contains stem cells based on their ability to producegametes over an extended portion of life span (�10 days)(Hughes et al. 2007), their ability to regenerate the adult germ-line following environmental perturbation (Angelo and VanGilst 2009; Seidel and Kimble 2011), and their multipotency(being able to generate either female or male gametes) (Ellisand Schedl 2007). The germline is a polarized tube-shapedtissue that is an assembly line designed for the rapid produc-tion of gametes under optimal growth conditions. The stemcells reside at the distal end of the germline within a largepopulation of�230 stem/progenitor cells covering an�20-celldiameter region called the proliferative zone (PZ) or mitoticzone (Figure 1A), as M-phase cells can be observed throughoutthe region (Hansen et al. 2004a; Crittenden et al. 2006). Justproximal to the PZ is the meiotic entry region where germcells undergo overt differentiation including assembly ofthe meiotic chromosome axes and homolog pairing associ-ated with the leptotene/zygotene stage of meiotic prophase
Copyright © 2015 by the Genetics Society of Americadoi: 10.1534/genetics.115.178061Manuscript received May 25, 2015; accepted for publication July 1, 2015; publishedEarly Online July 8, 2015.Supporting information is available online at www.genetics.org/lookup/suppl/doi:10.1534/genetics.115.178061/-/DC11Present address: Wellcome Trust/Cancer Research UK Gurdon Institute, Universityof Cambridge, Cambridge CB2 1QN, United Kingdom.
2Corresponding author: Department of Genetics, Campus Box 8232, WashingtonUniversity School of Medicine, 4566 Scott Ave., St. Louis, MO 63110.E-mail: [email protected]
Genetics, Vol. 201, 167–184 September 2015 167
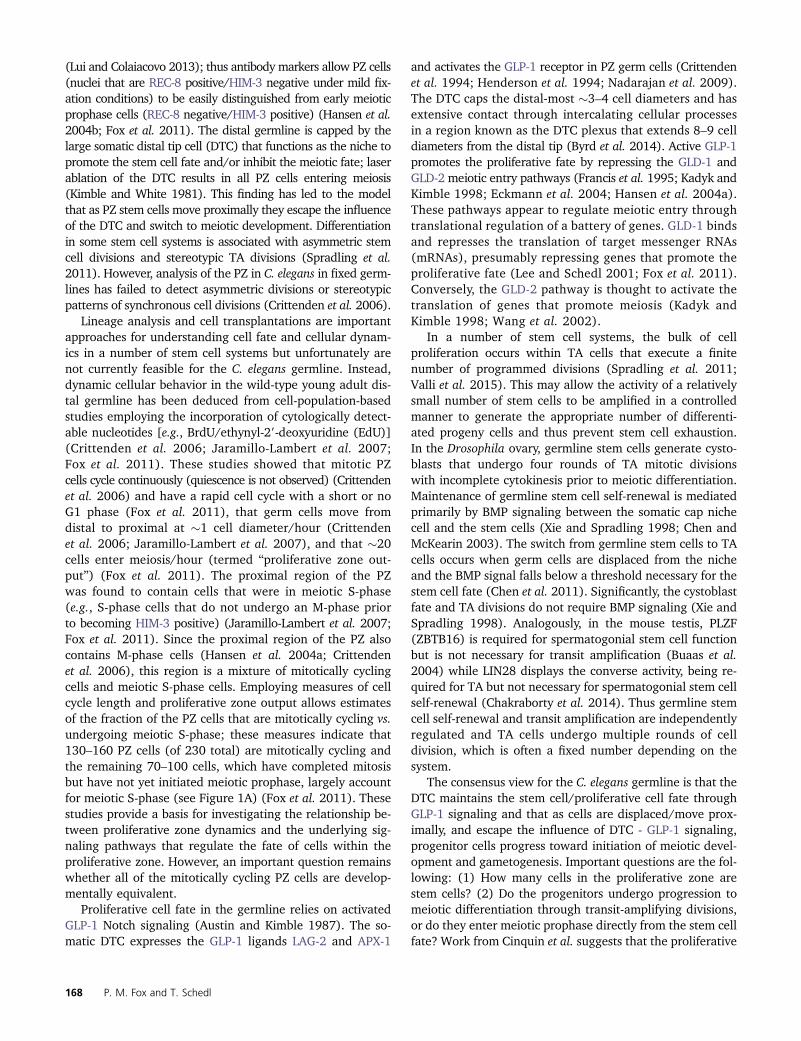
(Lui and Colaiacovo 2013); thus antibody markers allow PZ cells(nuclei that are REC-8 positive/HIM-3 negative under mild fix-ation conditions) to be easily distinguished from early meioticprophase cells (REC-8 negative/HIM-3 positive) (Hansen et al.2004b; Fox et al. 2011). The distal germline is capped by thelarge somatic distal tip cell (DTC) that functions as the niche topromote the stem cell fate and/or inhibit the meiotic fate; laserablation of the DTC results in all PZ cells entering meiosis(Kimble and White 1981). This finding has led to the modelthat as PZ stem cells move proximally they escape the influenceof the DTC and switch to meiotic development. Differentiationin some stem cell systems is associated with asymmetric stemcell divisions and stereotypic TA divisions (Spradling et al.2011). However, analysis of the PZ in C. elegans in fixed germ-lines has failed to detect asymmetric divisions or stereotypicpatterns of synchronous cell divisions (Crittenden et al. 2006).
Lineage analysis and cell transplantations are importantapproaches for understanding cell fate and cellular dynam-ics in a number of stem cell systems but unfortunately arenot currently feasible for the C. elegans germline. Instead,dynamic cellular behavior in the wild-type young adult dis-tal germline has been deduced from cell-population-basedstudies employing the incorporation of cytologically detect-able nucleotides [e.g., BrdU/ethynyl-29-deoxyuridine (EdU)](Crittenden et al. 2006; Jaramillo-Lambert et al. 2007;Fox et al. 2011). These studies showed that mitotic PZcells cycle continuously (quiescence is not observed) (Crittendenet al. 2006) and have a rapid cell cycle with a short or noG1 phase (Fox et al. 2011), that germ cells move fromdistal to proximal at �1 cell diameter/hour (Crittendenet al. 2006; Jaramillo-Lambert et al. 2007), and that �20cells enter meiosis/hour (termed “proliferative zone out-put”) (Fox et al. 2011). The proximal region of the PZwas found to contain cells that were in meiotic S-phase(e.g., S-phase cells that do not undergo an M-phase priorto becoming HIM-3 positive) (Jaramillo-Lambert et al. 2007;Fox et al. 2011). Since the proximal region of the PZ alsocontains M-phase cells (Hansen et al. 2004a; Crittendenet al. 2006), this region is a mixture of mitotically cyclingcells and meiotic S-phase cells. Employing measures of cellcycle length and proliferative zone output allows estimatesof the fraction of the PZ cells that are mitotically cycling vs.undergoing meiotic S-phase; these measures indicate that130–160 PZ cells (of 230 total) are mitotically cycling andthe remaining 70–100 cells, which have completed mitosisbut have not yet initiated meiotic prophase, largely accountfor meiotic S-phase (see Figure 1A) (Fox et al. 2011). Thesestudies provide a basis for investigating the relationship be-tween proliferative zone dynamics and the underlying sig-naling pathways that regulate the fate of cells within theproliferative zone. However, an important question remainswhether all of the mitotically cycling PZ cells are develop-mentally equivalent.
Proliferative cell fate in the germline relies on activatedGLP-1 Notch signaling (Austin and Kimble 1987). The so-matic DTC expresses the GLP-1 ligands LAG-2 and APX-1
and activates the GLP-1 receptor in PZ germ cells (Crittendenet al. 1994; Henderson et al. 1994; Nadarajan et al. 2009).The DTC caps the distal-most �3–4 cell diameters and hasextensive contact through intercalating cellular processesin a region known as the DTC plexus that extends 8–9 celldiameters from the distal tip (Byrd et al. 2014). Active GLP-1promotes the proliferative fate by repressing the GLD-1 andGLD-2 meiotic entry pathways (Francis et al. 1995; Kadyk andKimble 1998; Eckmann et al. 2004; Hansen et al. 2004a).These pathways appear to regulate meiotic entry throughtranslational regulation of a battery of genes. GLD-1 bindsand represses the translation of target messenger RNAs(mRNAs), presumably repressing genes that promote theproliferative fate (Lee and Schedl 2001; Fox et al. 2011).Conversely, the GLD-2 pathway is thought to activate thetranslation of genes that promote meiosis (Kadyk andKimble 1998; Wang et al. 2002).
In a number of stem cell systems, the bulk of cellproliferation occurs within TA cells that execute a finitenumber of programmed divisions (Spradling et al. 2011;Valli et al. 2015). This may allow the activity of a relativelysmall number of stem cells to be amplified in a controlledmanner to generate the appropriate number of differenti-ated progeny cells and thus prevent stem cell exhaustion.In the Drosophila ovary, germline stem cells generate cysto-blasts that undergo four rounds of TA mitotic divisionswith incomplete cytokinesis prior to meiotic differentiation.Maintenance of germline stem cell self-renewal is mediatedprimarily by BMP signaling between the somatic cap nichecell and the stem cells (Xie and Spradling 1998; Chen andMcKearin 2003). The switch from germline stem cells to TAcells occurs when germ cells are displaced from the nicheand the BMP signal falls below a threshold necessary for thestem cell fate (Chen et al. 2011). Significantly, the cystoblastfate and TA divisions do not require BMP signaling (Xie andSpradling 1998). Analogously, in the mouse testis, PLZF(ZBTB16) is required for spermatogonial stem cell functionbut is not necessary for transit amplification (Buaas et al.2004) while LIN28 displays the converse activity, being re-quired for TA but not necessary for spermatogonial stem cellself-renewal (Chakraborty et al. 2014). Thus germline stemcell self-renewal and transit amplification are independentlyregulated and TA cells undergo multiple rounds of celldivision, which is often a fixed number depending on thesystem.
The consensus view for the C. elegans germline is that theDTC maintains the stem cell/proliferative cell fate throughGLP-1 signaling and that as cells are displaced/move prox-imally, and escape the influence of DTC - GLP-1 signaling,progenitor cells progress toward initiation of meiotic devel-opment and gametogenesis. Important questions are the fol-lowing: (1) How many cells in the proliferative zone arestem cells? (2) Do the progenitors undergo progression tomeiotic differentiation through transit-amplifying divisions,or do they enter meiotic prophase directly from the stem cellfate? Work from Cinquin et al. suggests that the proliferative
168 P. M. Fox and T. Schedl

zone of the adult hermaphrodite contains at least two dis-tinct populations of cells: a distal pool of �35–70 stem cellsand a proximal pool of �150 differentiated, likely transit-amplifying cells (Cinquin et al. 2010). This hypothesis wassupported by the observation that distal vs. proximal cellpopulations show distinct responses to two forms of experi-mental manipulation: cell cycle arrest and induced meioticentry through loss of GLP-1 signaling. When mitotic cellcycle progression was blocked, proximal but not distal PZcells entered meiosis, and when meiotic entry was experi-mentally induced, proximal PZ cells displayed signs ofmeiotic differentiation earlier (Cinquin et al. 2010). Theseresults were used to provide support for a model that a prox-imal pool of cells within the PZ has differentiated from thestem cell state and therefore represents a pool of TA cells(see Figure 1B, model 1: GLP-1 independent transit ampli-fication). Nonetheless, the extent of GLP-1 activity withinthe proliferative zone and whether TA divisions occur afterloss of GLP-1 activity remain unknown. Furthermore, theDTC plexus is large, displaying intimate contact with germcells up to 8–9 cell diameters from the distal tip (Byrd et al.2014). Thus, an alternative model is that the stem cell pop-ulation is large and that all mitotically cycling cells in the PZare dependent on GLP-1 signaling (see Figure 1C, model 2:Equivalent proliferative zone cells) (Hansen and Schedl2013).
The two above models make distinct predictions for howPZ cells would respond to experimentally manipulated lossof GLP-1 activity using a glp-1 temperature sensitive (ts)mutant in terms of (1) the spatial and temporal patternof meiotic differentiation of the PZ cells and subsequentcell divisions and (2) the extent of mitotic proliferationprior to entry into meiosis (Figure 1, B and C). If there isGLP-1-dependent stem cell self-renewal followed by GLP-1independent transit amplification (model 1), loss of GLP-1activity should lead to (1) a proximal to distal wave ofdifferentiation that reflects the initial underlying develop-mental status of PZ cells (distal germ cells would be lessmature germline stem cells and differentiate last whereasproximal cells would be progressively more mature TA cellsand differentiate first) and (2) multiple rounds of mitoticdivision among the distal-most germ cells following glp-1(ts)temperature-shift-induced conversion of the stem cellsinto TA cells (Figure 1B, see also Cinquin et al. 2010).Alternatively, if the stem cell population is large andGLP-1-independent TA divisions are not present (model 2),we expect that loss of GLP-1 activity should lead to (1)relatively synchronized and spatially uniform meiotic entrythroughout the proliferative zone and (2) limited mitoticdivision prior to meiotic differentiation that is not spatiallyrestricted (Figure 1C). To test these predictions, we used theglp-1(bn18) ts mutant to manipulate glp-1 activity, REC-8and HIM-3 as molecular markers to determine the developmen-tal status of individual germ cells, and a variety of phospho-Histone 3-Ser10 (pH3, an M-phase marker) and EdU-basedassays to examine cell cycle behavior. To better understand
steady-state dynamics, we provide estimates for cell cyclelength and structure, meiotic entry kinetics (proliferativezone output), and the total number of mitotically cyclingPZ cells vs. those undergoing meiotic S-phase in glp-1(bn18)at permissive temperature. Ultimately, we show that, after lossof GLP-1 activity, PZ cells (1) progress to meiotic prophaserelatively synchronously with spatial uniformity and (2) thatmost PZ cells complete a single mitotic division prior tomeiotic differentiation. Based on these observations, we con-clude that the PZ contains a large stem cell population thatdoes not undergo GLP-1-independent TA divisions prior todifferentiation. Taking into account our estimates for thenumber of mitotically cycling cells, their proliferation rate,and the PZ output, we present a model of proliferative zonedynamics that accounts for the absence of GLP-1-independenttransit amplification.
Materials and Methods
Nematode maintenance and strains
Animals were propagated at 15� under standard conditions.The following strains were used: wild type (N2 Bristol),glp-1(bn18), glp-1(e2141), glp-1(q224), gld-1(q485); glp-1(bn18),gld-2(q497); glp-1(bn18), gld-3(q730); glp-1(bn18), nos-3(oz231); glp-1(bn18), and fbf-2(q738); glp-1(bn18). Thesealleles are described on the WormBase web site (https://www.wormbase.org), where gld-1, gld-2, gld-3, nos-3, andfbf-2 mutations are likely null.
Temperature shift and EdU labeling
For all temperature-shift experiments, animals grown at 15�were synchronized to 24 hr past L4 and then shifted toplates pre-incubated at 25�. Animals were transferred bypick, �50 animals at a time, with the entire transfer processtypically lasting ,3 min. Plates with EdU-labeled bacteriawere prepared as described (Fox et al. 2011). Pulse-chaseexperiments were performed as previously described underconditions where the chase was effective in eliminating newEdU labeling (Fox et al. 2011).
Immunohistochemistry and microscopy
Germlines were dissected and processed as described pre-viously (Jones et al. 1996). The following antibodies wereused: rat anti-REC-8 (1:100) from Joseph Loidl (Universityof Vienna); rabbit anti-HIM-3 (1:100) from Monique Zetka(McGill University); rabbit anti-phospho-(Ser10)-Histone 3(pH3) (1:400) from Upstate. EdU labeling was performedusing a kit (Life Technologies) as described (Fox et al. 2011).Germlines were stained with 49,6-dianmidino-2-phenylindole(DAPI) (Sigma). Secondary antibodies (Molecular Probes) werediluted 1:500. Germlines were imaged with a PerkinElmerspinning disk confocal microscope, and images were pro-cessed with Adobe Photoshop. Confocal stacks were ana-lyzed using Volocity software. Cells were manuallycounted using a cell counter tool. For scoring individual
Germline Stem Cell Differentiation 169

nuclei, EdU, REC-8, or HIM-3 were assayed in multiplefocal planes.
Calculation of cell cycle length, proliferative zoneoutput, and number of mitotically cycling cells
Since mitotic cycling in the proliferative zone is continuous(no quiescent cells) (Crittenden et al. 2006; Fox et al. 2011),the relative length of individual phases of the cell cycle canbe determined by their frequency among PZ cells. The mi-totic index (number of pH3-positive nuclei/number of REC-8-positive nuclei) provides the relative length of M-phaseand the S-phase index (number of EdU-positive nuclei ina 30-min pulse/total number of REC-8-positive nuclei) pro-vides the relative length of S-phase. As we have previouslyprovided evidence that G1 phase is either very short or non-existent in the adult hermaphrodite germline (Fox et al.2011), we assume that the remaining pH3/EdU-negativecells are in G2. Two methods were used to calculate cellcycle length. First, the length of G2+M+G1 is determinedby the minimum EdU pulse required to label all PZ cells(Crittenden et al. 2006). The total cell cycle length is thenextrapolated from the length of G2+M+G1 based on itsrelative length to the total cell cycle, which is determinedby the percentage of cells that remain unlabeled after a30-min EdU pulse. Since the assay to determine G2+M+G1is limited by the slowest cycling cells, this method likelydescribes the maximum length of the cell cycle. The secondmethod is based on extrapolating the total cell cycle fromthe length of G2 (Fox et al. 2011). The length of G2 wasdetermined according to the time by which EdU-labeledcells reach M-phase. Since M-phase cells can be scored onan individual basis, this assay provides a distribution of val-ues. Therefore, we can extrapolate the total cell cycle lengthfrom the median length of G2 (time when 50% of M-phasecells are EdU-positive after administering a continuous pulse).Proliferative zone output was determined by counting thenumber of EdU-labeled nuclei that enter meiosis (HIM-3positive, REC-8 negative) after 10 hr of EdU feeding. Underthe assumption that at steady state each mitotic division isbalanced by a cell entering meiosis, the output of the pro-liferative zone should equal the number of mitotically di-viding cells multiplied by their division rate (Fox et al.2011). Therefore, to solve for the number of mitotically
Figure 1 Alternative models for organization of the proliferative zone.(A) The germline PZ is capped by the somatic DTC (yellow) niche andcontains �230 REC-8-positive, HIM-3-negative PZ cells (green). Thisincludes 130–160 mitotically cycling cells and 70–100 premeiotic cells(largely undergoing meiotic S-phase). We refer to all REC-8-positive cellsas PZ cells. In the meiotic entry region, both PZ cells and meiotic prophaseHIM-3 positive; REC-8 negative cells (red) are observed, which are fol-lowed more proximally by cells that are all in meiotic prophase. (B) Onemodel of PZ dynamics proposes that there are distal GLP-1-signaling-dependent stem cells (blue) followed more proximally by GLP-1-signaling-independent transit amplification (gray); as daughters of the stem cellsmove proximally, GLP-1 signaling falls, germ cells switch to transit ampli-fication undergoing multiple rounds of mitotic division, and progress to-ward meiotic differentiation. This model predicts that shifting glp-1(ts)mutant hermaphrodites to the restrictive temperature (resulting in rapidloss of GLP-1 activity throughout the PZ) would lead to a proximal-to-distal wave of induced meiotic entry, reflecting developmental differencesbetween the distal stem cells and the proximal TA cells with respect tomaturation toward meiosis. Furthermore, the model predicts that the final
rounds of mitosis would be spatially restricted to the distal-most regionwhere the stem cells had been converted to TA divisions as a consequenceof the temperature shift. (C) An alternative model is that the DTC niche islarge, resulting in a large stem cell pool where germ cells do not undergoGLP-1-independent transit amplification, but instead more immediatelyenter meiosis. This model implies that PZ cells are developmentallyequivalent in terms of GLP-1 activity and maturation toward meiosis(indicated by blue color throughout). Experimentally, rapid loss of GLP-1activity following the temperature shift is predicted to result in roughlysynchronized meiotic entry, reflecting developmental equivalency. Inaddition, the transition from PZ cell to meiosis would not involve multiplerounds of intervening mitoses, and any cell divisions that occurred wouldbe randomly distributed.
170 P. M. Fox and T. Schedl

dividing cells, we divided the output (cells/hour) by thedivision rate (divisions/hour).
Results
GLP-1 regulates the size of the proliferation zone
To investigate how PZ cells in the adult hermaphroditerespond to loss of GLP-1, we used the temperature-sensitiveloss-of-function mutant glp-1(bn18) (Kodoyianni et al. 1992)to manipulate GLP-1 activity. First, we addressed whetherglp-1(bn18) mutants at the permissive temperature (15�)are comparable to wild type in terms of cell cycle andmeiotic entry kinetics. Previous work has characterized sev-eral important aspects of the proliferative zone in wild-typegermlines at 20�: (1) the proliferative zone contains �230cells and extends �20 cell diameters, (2) the DTC fails tocontact most cells beyond the distal-most 8–9 cell diameters,(3) 60–70% of the proliferative zone is actively mitoticallycycling (quiescence is absent), and (4) the remaining 30–40% of the PZ cells have switched from the mitotic cell cycleto meiotic S-phase but have not begun overt meiotic differ-entiation (Fox et al. 2011). glp-1(ts) mutants at the per-missive temperature have been widely used as sensitizedbackgrounds to identify or test for genes acting in Notchsignaling and/or promoting the proliferative fate (Qiaoet al. 1995; Hansen et al. 2004b; Korta et al. 2012). Thuswe predicted that GLP-1 activity in glp-1(bn18) mutants atthe permissive temperature is reduced compared to wildtype, causing a decrease in proliferative zone size. UsingREC-8 and HIM-3 antibodies to distinguish PZ cells vs. cellsin meiotic prophase (Hansen et al. 2004a), we found thatglp-1(bn18) mutants indeed have fewer PZ cells at permis-sive temperature (15�) and that the size of the proliferativezone in glp-1(bn18) varies inversely with temperature (Fig-ure 2, A–C, and Table 1).
We next analyzed cell cycle progression in glp-1(bn18)mutants. Using pH3 antibody and EdU incorporation for cellcycle analysis, we found that both M-phase and S-phase in-dices are equivalent in glp-1(bn18) and wild type at 15� and20� (Figure 2, D and E). We next measured the length ofG2+M+G1 using an assay in which we determined the shortestcontinuous EdU pulse required to label all PZ cells (Crittendenet al. 2006; Fox et al. 2011). In both wild-type and glp-1(bn18)animals at 15�, we found that a 4.5- to 5-hr EdU pulse wassufficient to label all PZ cells (Figure 2F), thus indicatingthat the maximum length of time between subsequentS-phases (G2+M+G1) is �5 hr. Similarly, �3 hr was de-termined for the median length of G2 alone for both wild-type and glp-1(bn18) animals (Supporting Information,Figure S1), which extrapolates to a cell cycle time of �9 hr(see Materials and Methods). Based on this analysis ofwild-type and glp-1(bn18) mutants at 15� we deducethe following: (1) PZ cells do not enter quiescence and(2) the length of the cell cycle is �9–12 hr (see Materialsand Methods). Finally, we determined the output of the pro-liferative zone, which subsequently allows us to calculate
how many PZ cells are mitotically cycling vs. premeiotic(Table 2). We find that in glp-1(bn18) at 15�, 107 6 19cells enter meiosis over a 10-hr period, corresponding toan output of 10.7 cells/hour. For wild-type germlines, weobserve that 154 6 31 cells enter meiosis over a 10-hrperiod (15.4 cells/hour). The output of the proliferativezone suggests that in both glp-1(bn18) and wild type, 60–80% of the PZ cells are mitotically cycling (97–128 of�165 in glp-1(bn18) vs. 139–185 of �230 in wild type).
Figure 2 GLP-1 does not affect cell cycle kinetics. Proliferative zone ofwild-type N2 (A) and glp-1(bn18) (B) germlines stained with DAPI (blue),REC-8 antibody (green), and HIM-3 antibody (red). Arrowheads in A in-dicate an early meiotic prophase cell (top, red) based on HIM-3-positive,REC-8-negative staining with homogenous DAPI staining (bottom, blue)that does not display a crescent-shaped DAPI morphology. Proliferativezone size (C) was determined by counting REC-8-positive nuclei. Mitoticindex (D) was calculated by normalizing the number of pH3-positive nu-clei to the number of PZ cells. S-phase index was calculated by normal-izing the number of EdU-positive nuclei (following a 30-min pulse) to thenumber of PZ cells. The graph in F plots the percentage of PZ cells that areEdU positive vs. length of EdU feeding. The length of G2+M+G1 corre-sponds to the time after which all PZ cells incorporate EdU. All experiments,except where indicated, were performed at 15�, permissive temperaturefor the glp-1(bn18) mutant. (C) N2, n = 18 germlines; glp-1(bn18), n = 20.(D) N2, n = 49; glp-1(bn18), n = 54. (E) N2, n = 18; glp-1(bn18), n = 20.(F) For all time points, at least eight germlines were scored. All experi-ments performed at 15�. Error bars indicate standard deviation.
Germline Stem Cell Differentiation 171

Since mitotic cell cycle progression is continuous, we con-clude that the remaining 20–40% of the PZ cells (35–67 inglp-1(bn18) vs. 45–90 in wild type) are in meiotic S-phase.Based on the above results (summarized in Table 3), weconclude that reduced GLP-1 activity in glp-1(bn18) atpermissive temperature affects the size of the proliferativezone but does not affect mitotic cell cycle kinetics.
Cells throughout the proliferative zone rapidly andsynchronously respond to loss of GLP-1 activity
To begin testing the two models of proliferative zoneregulation, we next analyzed meiotic entry kinetics inglp-1(bn18) after shift to restrictive temperature (Figure 1)(Cinquin et al. 2010). As discussed above, if the PZ containsGLP-1-signaling dependent stem cells in the distal regionfollowed by GLP-1-independent TA divisions in the proximalregion of the proliferative zone, induced loss of GLP-1 activitywould lead to a proximal-to-distal wave of meiotic entry(Figure 1B). This wave model is based on the assumptionthat proximally located TA cells would have matured be-yond the status of the distally located stem cells and thattheir earlier meiotic differentiation would reflect their ad-vanced developmental progression. If the PZ contains a largepool of stem cells and lacks GLP-1-independent TA divisions,we predict that induced loss of GLP-1 activity should causea roughly synchronized progression of PZ cells to meiosisregardless of their distal-proximal location (Figure 1C). Thissynchronized differentiation is based on the assumption thatin the absence of GLP-1 independent transit amplification,all PZ cells rely on GLP-1 activity and are developmentallyequivalent.
To experimentally manipulate GLP-1 activity, we raisedglp-1(bn18) mutants at permissive temperature (15�) andshifted synchronized adult animals to restrictive tempera-ture (25�). Using REC-8 and HIM-3 antibody staining asmarkers, we analyzed the timing of meiotic entry amongproliferative zone cells during a time course at the restrictivetemperature (see Materials and Methods). Whereas therewas no appreciable change in wild-type controls, in glp-1(bn18)
mutants all PZ cells lost proliferative fate and initiatedmeiotic prophase within 10 hr at restrictive temperature(Figure 3A). We observed differentiation of PZ cells (becom-ing REC-8 negative, HIM-3 positive) in three phases. Duringthe initial 4 hr, there was a moderate decrease of PZ cells.This was followed by a significant decrease between hours4–6, when most of the PZ cells lose proliferative fate.Finally, between hours 6–8, a small subset of PZ cells re-mained REC-8 positive, completing entry to meiosis by hour10. The glp-1(bn18) molecular missense lesion maps to anintracellular ankyrin repeat (Kodoyianni et al. 1992) andthus likely affects GLP-1 activity downstream of ligand-dependent cleavage and translocation to the nucleus. Simi-lar time courses of meiotic entry were observed with twoadditional glp-1 temperature-sensitive loss-of-function alleles(q224 and e2141) that contain different missense mutationswithin the ankyrin repeats (Figure S2) (Kodoyianni et al.1992), indicating that the kinetics of meiotic entry at restric-tive temperature are not allele specific. We chose to furtherexamine the bn18 mutant as it has the largest proliferativezone and therefore should be more comparable to wild type(Table 1). Currently, there is no direct readout for GLP-1activity and reporters for GLP-1 transcriptional targets arejust being developed (Kershner et al. 2014). Instead, weused changes in GLD-1 levels as an indirect readout becauseGLP-1 signaling indirectly inhibits accumulation of GLD-1protein in distal germ cells (Hansen et al. 2004b); followingshift of glp-1(bn18) to 25�, distal GLD-1 levels are elevatedat the 2-hr time point (P. Fox and T. Schedl, unpublishedresults), indicating that GLP-1 activity has decreased signifi-cantly before the 2-hr point, which is propagated to alterGLD-1 protein levels through changes in translational regu-lation of the gld-1 mRNA (Lee and Schedl 2010).
To analyze the spatial pattern of meiotic entry within thecontext of the model predictions, we scored the percentageof cells that were REC-8 positive on a per-row basis, where“row 1” includes the germ cells at the distal tip and “row 20”is 20 cell diameters proximal from the distal tip (Figure 4).In glp-1(bn18)mutants at permissive temperature (15�), thelength of the proliferative zone (distance in cell diametersfrom the distal tip to the first meiotic prophase cell) was13.6 6 1.3 cell diameters (Figure 4A). The proliferative
Table 2 Proliferative zone output
Genotype 10-hr outputaActively cyclingpopulationb
Wild type 154 6 31 (n = 9) 140–185glp-1(bn18) 107 6 19 (n = 11) 100–128glp-1(bn18); gld-2(q497) 133 6 28 (n = 9) 117–156glp-1(bn18); gld-3(q730) 42 6 14 (n = 10) Unknownc
a The 10-hr output was obtained by counting the number of EdU-positive, HIM-3-positive nuclei per gonad after 10 hr of EdU feeding.
b Actively cycling population was calculated by dividing the output (cells/hr) by thedivision rate (divisions/hr) (see Materials and Methods).
c The size of the actively cycling population in glp-1(bn18); gld-3(q730) is not avail-able since the division rate has not been determined.
Table 1 Proliferative zone size
Genotype Temperature (�C) PZ size (cells)a n
Wild type 15 235 6 19 820 232 6 23 725 214 6 12 7
glp-1(bn18) 15 165 6 26 2620 116 6 9 1222 84 6 13 10
glp-1(e2141) 15 144 6 16 2020 103 6 7 10
glp-1(q224) 15 110 6 11 10glp-1(bn18); nos-3(oz231) 15 149 6 29 10glp-1(bn18); gld-1(q485) 15 106 6 7 8glp-1(bn18); gld-2(q497) 15 339 6 30 8glp-1(bn18); gld-3(q730) 15 243 6 21 8glp-1(bn18); fbf-2(q738) 15 198 6 28 10a PZ size was determined by counting REC-8-positive cells 24 hr past L4.
172 P. M. Fox and T. Schedl
zone is followed by the meiotic entry region (Hansen et al.2004a), which contains a mixture of PZ and meiotic pro-phase cells extending as far as 23 cell diameters from thedistal tip. At hours 2 and 4, the length of the proliferativezone was nearly identical to the initial size (13.5 6 1.4 celldiameters at 2 hr, 11.1 6 1.1 cell diameters at 4 hr); how-ever, the percentage of PZ cells decreased in the rows withinthe meiotic entry region (Figure 4, B, C, B9, and C9). Fromhours 4 to 6, the majority of cells in rows 1–13 have com-pleted progression to meiosis, and at hour 6, cells in meioticprophase were observed at the distal tip and throughout theregion previously occupied by the proliferative zone (Figure4, D and D9). The remaining PZ cells (REC-8 positive, HIM-3negative) at the 6- and 8-hr time points were distributedthroughout the distal 1–13 rows of the germline (Figure 4,D, E, D9, and E9). We made three important observationsregarding these data. First, the PZ cells that enter meiosisduring the first 4 hr at restrictive temperature were mostlylocated in the proximal-most rows or in the meiotic entryregion. Second, the majority of PZ cells enter meiosis rela-tively synchronously between hours 4 and 6, and these cellsare located throughout the proliferative zone and the mei-otic entry region. Finally, the last PZ cells to enter meiosis(hours 6–10) were located throughout the distal-proximal�13-cell diameters of the former proliferative zone and were notrestricted to the distal-most region. We interpret these results toindicate that progression to meiosis occurs relatively synchro-nously throughout the proliferative zone, consistent with thepredictions from model 2: Equivalent PZ cells (Figure 1C).
Our results and interpretation have important differencesin comparison with a similar study performed by Cinquinet al. (2010), which are largely related to the means ofassessing whether a cell has entered meiosis or is still a PZcell. Cinquin et al. (2010) used DAPI staining and crescent-shaped morphology of some leptotene/zygotene nuclei asan indicator of induced meiotic entry kinetics in their analysisof glp-1(q224) mutants shifted to restrictive temperature.Between hours 0 and 5 they reported a proximal-to-distalwave of meiotic entry in rows 5–12, and the final cells toenter meiosis, in rows 1–5, entered synchronously betweenhours 5 and 6. The authors interpreted the synchronouspopulation of cells in rows 1–5 to contain the germlinestem cells and rows 5–12 to contain TA cells. However, theuse of DAPI staining in this study did not allow detection of
PZ cells remaining at hours 6–8 (Figure 4) because chromo-some morphology does not allow an unambiguous classifi-cation of individual germ-cell fate [see also Figure S2 inwhich we analyze glp-1(q224)]. In contrast, the use ofREC-8/HIM-3 costaining can distinguish between PZ cellsand meiotic prophase cells, even when they are intermixed,as often occurs in the meiotic entry region in wild type andin certain incompletely penetrant germline tumor mutants(MacQueen and Villeneuve 2001; Hansen et al. 2004a; Foxet al. 2011; Gupta et al. 2015). To illustrate the distinctionbetween antibody markers and DAPI morphology, Figure 2A(arrowhead) shows a cell that has entered meiosis (HIM-3positive; REC-8 negative) whose nucleus shows spherical-rather than crescent-shaped DAPI morphology. This provesto be a key difference since REC-8/HIM-3 staining revealedthat the final cells to enter meiosis at 6–8 hr were not lim-ited to the distal end (rows 1–5) but rather distributedthroughout the proliferative zone region (rows 1–13).
In addition to the wave of differentiation, a secondprediction of model 1 is that after loss of GLP-1 activityand conversion of stem cells into TA cells, mitotic divisionshould become spatially restricted to the distal-most regionwhere the stem cells were located (rows 1–5) because thesecells would go through rounds of transit amplification,which more proximal cells would have already initiated orcompleted. However, analysis of the spatial distribution ofcells in M-phase over the temperature-shift time courseshowed a random distribution of pH3-positive cells alongthe distal-proximal PZ position (Figure S3).
Most PZ cells undergo a single cell division followingloss of GLP-1 activity
If germline stem cells convert to TA cells, then we wouldexpect these TA cells to undergo multiple rounds of mitoticdivision. To investigate this, we sought to determine howmany cell divisions occur within the proliferative zonefollowing loss of GLP-1 activity. We began by analyzingM-phase and S-phase at a population level during the tem-perature-shift time course (Figure 3, B and C). As expected,the loss of proliferative fate coincides with a steady decreasein both M-phase and S-phase. By 6 hr at restrictive tem-perature, essentially no cells were dividing. Similarly, DNAreplication occurred until 8 hr. The late period of DNAreplication from 6 to 8 hr occurs after completion of mitosis
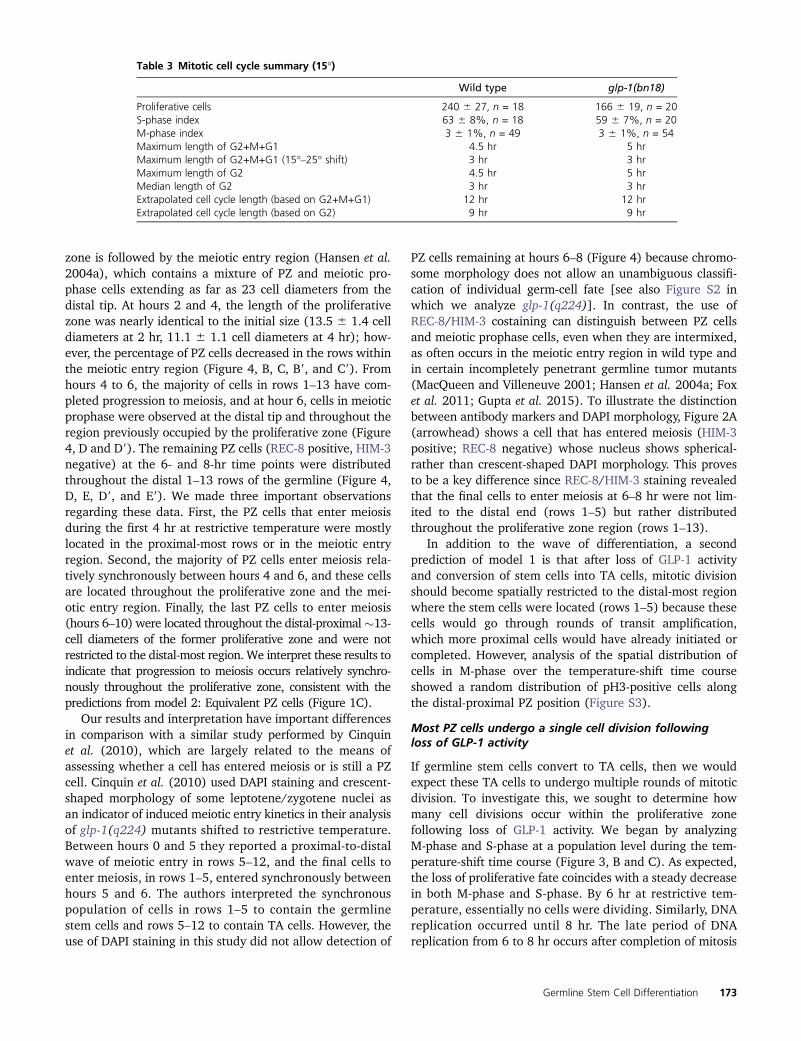
Table 3 Mitotic cell cycle summary (15�)
Wild type glp-1(bn18)
Proliferative cells 240 6 27, n = 18 166 6 19, n = 20S-phase index 63 6 8%, n = 18 59 6 7%, n = 20M-phase index 3 6 1%, n = 49 3 6 1%, n = 54Maximum length of G2+M+G1 4.5 hr 5 hrMaximum length of G2+M+G1 (15�–25� shift) 3 hr 3 hrMaximum length of G2 4.5 hr 5 hrMedian length of G2 3 hr 3 hrExtrapolated cell cycle length (based on G2+M+G1) 12 hr 12 hrExtrapolated cell cycle length (based on G2) 9 hr 9 hr
Germline Stem Cell Differentiation 173

and likely corresponds to meiotic S-phase among theremaining PZ cells. Therefore, while significant cell divisionoccurs subsequent to the shift to the restrictive temperature,these divisions are completed within 6 hr.
To estimate the total number of cell divisions on apopulation level, we employed an EdU incorporation assaywhereby the expansion of cells could be quantified basedon an increase of EdU-labeled cells (Figure 5). Animalswere first given EdU for 5 hr at 15�, a feeding regimensufficient to label all PZ cells (Figure 2F). Following this 5-hrEdU pulse, animals were then shifted to restrictive temper-ature while maintaining EdU feeding. Since all PZ cells are
EdU positive after the initial 5-hr pulse, a subsequent in-crease in the number of EdU-positive cells (including bothPZ cells and meiotic cells) can be directly attributed to mi-totic division. In wild-type germlines shifted to 25�, thenumber of EdU-positive cells increases continuously overa 10-hr time course (Figure 5D). However, in glp-1(bn18)mutants, the number of EdU-positive cells initially increasesbut then reaches a plateau by 6 hr (Figure 5D). Consistentwith our previous results, the timing of this plateau corre-sponds to the termination of cell division as assayed by pH3staining above (Figure 3C). Based on the increase of EdU-positive cells in glp-1(bn18) from the start of the shift(227 6 23) until 6 hr (340 6 31), we deduce that �110divisions occur on a population-wide level. As shown above,glp-1(bn18) mutants contain 97–128 mitotically cyclingcells at steady state (15�) (Table 2). Therefore, the totalnumber of divisions that occur after shift to the restrictivetemperature corresponds closely to the number of cells thatwere initially mitotically cycling. The simplest explanationfor this correlation is that, on average, each of the mitoti-cally cycling cells completes a single division following theloss of GLP-1 activity.
How do the kinetics of progression to meiosis comparewith cell cycle length and does this comparison agree withour assessment that most PZ cells undergo a single division?Previous work has shown that cell cycle length in thegermline varies with temperature (Fox et al. 2011). To in-vestigate the effect of the temperature shift and whether lossof GLP-1 activity affects cell division, we analyzed cell cyclekinetics during the initial period of the temperature shifttime course. We measured G2+M+G1 after shift from 15�to 25� (see Materials and Methods). Both wild-type andglp-1(bn18) mutants show �100% EdU incorporation fol-lowing a 3-hr pulse (Figure 2F). Based on this, we concludethat temperature, but not loss of GLP-1 activity, affects mi-totic cell cycle kinetics during this time interval. In addition,we can extrapolate a maximum cell cycle length under theseconditions. Based on G2+M+G1 lasting a maximum of 3 hrand corresponding to 40% of the cell cycle (Figure 2 andTable 3), the maximum length estimate for the total cellcycle is 7.5 hr (see Materials and Methods). Since most PZcells enter meiosis within 6–8 hr of loss of GLP-1 activity, thiscell cycle estimate is consistent with our conclusion that, onaverage, each of the actively cycling PZ cells divides onceand completes the ongoing mitotic cell cycle during this timecourse.
Timing of meiotic entry following loss of GLP-1 activitydepends on mitotic cell cycle position
Since entry into meiosis following loss of GLP-1 activity islargely independent of distal-proximal position and sinceprogression to meiotic prophase involves completion of mi-tosis, we hypothesized that the variation in meiotic entrytiming among PZ cells depends on the distribution of PZcells in different stages of the cell cycle. To determinewhether mitotic cell cycle position correlates with the
Figure 3 Time course of meiotic entry and cell cycle progression follow-ing loss of GLP-1 activity. glp-1(bn18) mutants were shifted to restrictivetemperature (25�) for the indicated time. The graphs show the followingvalues plotted vs. time at restrictive temperature: (A) number of REC-8-positive PZ cells per germline, (B) number of pH3-positive PZ cells pergermline (blue axis) and M-phase index (red axis), and (C) number ofEdU-positive cells per germline (blue axis) and S-phase index (red axis).To analyze S-phase index, animals were given an EdU pulse for the final30 min at restrictive temperature. (A) 0 hr, n = 49 germlines; 2 hr, n = 49;4 hr, n = 53; 6 hr, n = 40; 8 hr, n = 28; 10 hr, n = 34. (B) 0 hr, n = 37; 2 hr,n = 30; 4 hr, n = 33; 6 hr, n = 45; 8 hr, n = 42. (C) 0 hr, n = 12; 2 hr, n = 9;4 hr, n = 9; 6 hr, n = 12; 8 hr, n = 11; 10 hr, n = 25.
174 P. M. Fox and T. Schedl

meiotic entry kinetics of individual cells, we first askedwhether cells in different phases of the cell cycle enter mei-osis at different times following loss of GLP-1 activity. Weperformed a pulse-chase experiment in which cells in S-phaseat the start of the temperature shift were labeled with abrief EdU pulse, thus distinguishing them from unlabeledcells in G2/M, followed by a non-EdU chase (Figure 6A).Most PZ cells enter meiosis by 6 hr at 25�; however, weobserved that EdU-negative cells were overrepresentedamong PZ cells remaining during the final 6–8 hr of the timecourse (Figure 6, B–D, D9, and D99). Based on this, we con-clude that the cell cycle position affected the kinetics ofmeiotic entry following loss of GLP-1 and that a subset ofcells in G2/M at the start of the temperature shift retainedproliferative fate longer than the surrounding cells inS-phase.
When during the mitotic cell cycle does the decision toenter meiosis occur and how does this affect the timing ofmeiotic entry? Previous studies in yeast and in mammalssuggest that a switch to meiosis occurs prior to meioticS-phase (Honigberg and Purnapatre 2003; Baltus et al. 2006).
However, cells in mitotic G2 (4N) in theory could divert tomeiosis without an intervening mitotic division or furtherDNA replication. To test this, we analyzed glp-1(bn18)shifted to restrictive temperature while simultaneously ini-tiating continuous EdU feeding. If PZ cells already in mitoticG2 directly switch to meiotic prophase, these cells wouldinitiate meiotic prophase (become HIM-3 positive) whileremaining EdU negative. Cells in G2 are observed through-out the proliferative zone (Fox et al. 2011); however, wefailed to observe EdU-negative/HIM-3-positive cells withinthe distal-most 15 cell rows of the temperature shiftedglp-1(bn18) germlines after 10 hr at restrictive temperature(Figure S4). Instead, all cells within this region were bothHIM-3 and EdU positive. We conclude that, consistent withother organisms, cells in mitotic G2 are unable to switchdirectly to meiotic prophase.
Next we investigated whether in glp-1(bn18) tempera-ture-shifted germlines PZ cells could switch from mitoticS-phase to meiotic S-phase. To explore the outcomes of cellsin S-phase after loss of GLP-1 activity, we further analyzedthe pulse-chase experiment above in which we labeled PZ
Figure 4 Distribution of proliferative zone cells duringand after loss of GLP-1 activity. glp-1(bn18) mutantswere shifted to the restrictive temperature (25�) andharvested at the indicated times. (A–F) Distal region ofthe germline stained with DAPI (blue), REC-8 antibody(green), and HIM-3 antibody (red). The average lengthof the proliferative zone in cell diameters (from distaltip until the first meiotic prophase cell) is indicatedin the lower left corner. Representative images areshown. (A9–E9) Graphs show the percentage of cellsthat are REC-8 positive (green) or HIM-3 positive (red)within cell rows defined by distance from the distal tip.The bulk of PZ cells enter meiotic prophase between hours4 and 6 (C, C9, D, and D9), with the remaining minority ofREC-8-positive, HIM-3-negative cells PZ cells at hour 6 dis-tributed across an �13-distal-proximal-cell-diameter regionor at hour 8 across an�10-cell-diameter region. 0 hr, n = 10germlines, scoring�250 germ cells for each; 2 hr, n = 8;4 hr, n = 9; 6 hr, n = 10; 8 hr, n = 9.
Germline Stem Cell Differentiation 175

cells in S-phase with a short EdU pulse at the start of thetemperature shift (Figure 6A). Specifically, we asked whendo the EdU-labeled cells enter meiosis and is there an in-crease of EdU-labeled cells that would indicate mitotic di-vision? EdU-labeled cells began entering meiosis (becomingREC-8 negative, HIM-3 positive) within 2 hr at restrictivetemperature, but between 4 and 6 hr, the majority of EdU-pulse-labeled cells became HIM-3 positive REC-8 negative(Figure 6C). We also observed that the number of EdU-labeled cells increased from 105 6 18 initially to 160 6 28at hour 4, just before most of the labeled cells enter meiosis(Figure 6C). Since this pulse-chase experiment labels cells inboth meiotic S-phase and mitotic S-phase, the earliest cellsto enter meiosis were likely in meiotic S-phase and the latercells to enter meiosis were in mitotic S-phase. Importantly,the increase in number of EdU pulse-chased labeled cellsover the time course indicates that a subset of these cells,presumably those in mitotic S-phase, underwent mitoticdivision prior to entering meiosis. These results indicatethat shifting glp-1(bn18) to restrictive temperature did notswitch cells in mitotic S-phase to meiotic S-phase beforecompletion of mitosis.
To determine the timing when these EdU pulse-labeledcells divide, we analyzed the mitotic divisions that occurafter the shift to restrictive temperature. As above, glp-1(bn18)and wild-type controls were subjected to a pulse-chaseexperiment and given a pulse of EdU at the start of thetemperature shift (Figure 7). Animals were then dissected at1-hr intervals to stain for EdU and M-phase (pH3). As wehave shown previously (Fox et al. 2011), this pulse-chaseexperiment allows us to observe the progression of labeledvs. unlabeled cells through M-phase. In both wild type andglp-1(bn18), the temperature shift appears to cause eitheran initial cell cycle delay or acceleration of M-phase progres-sion, observed as a temporary decrease in M-phase obser-vance. Following this, whereas wild type displays divisionthroughout, glp-1(bn18) displays a steady decrease in totalM-phase (both EdU positive and EdU negative), consistent
with our results above. As expected, in both wild type andglp-1(bn18) the first cells to enter M-phase (hour 1) were inG2 at the time of the pulse and thus are EdU negative. Sub-sequently, during hours 2–4 EdU-positive cells are observedin M-phase, and specifically at hour 3 nearly all M-phasecells in both glp-1(bn18) and control are EdU positive. Fol-lowing this, at hours 4–6, EdU-negative cells enter M-phaseagain, indicating a second division of these unlabeled cellsduring this time course. We conclude that cells in mitoticS-phase at the start of the temperature shift divide duringhours 2–4 and then enter meiosis during hours 4–6. Basedon this, loss of GLP-1 activity does not cause cells to switchfrom mitotic to meiotic S-phase. Instead, we can observethat these cells execute mitosis prior entering meiosis.
We propose that, on average, each of the mitoticallycycling cells in the proliferative zone will divide once fol-lowing restrictive-temperature-mediated loss of GLP-1 ac-tivity. Our observations also suggest that a small fractionof proliferative zone cells complete two divisions duringour glp-1(bn18) temperature shift experiment. In thepulse-chase experiment above (Figure 7), we observed thatsome EdU-negative cells executed two rounds of cell divi-sion: initially during hours 1–2 and subsequently at hours 4–5. This second round indicates that a subset of EdU-negativecells divide twice. In addition, we note that the last PZ cellsto enter meiosis after the temperature shift are usually EdUnegative (hours 6 and 8, Figure 6, B and D). These finalremaining PZ cells often appear as clusters of four (Figure4E; Figure 6, D, D9, and D99), suggesting that they arelineage-related siblings with similar meiotic entry kinetics.Taken together, these observations suggest that a smallnumber of cells in G2/M at the start of the temperature shiftdivide twice before entering meiosis, and these cells repre-sent the final cells to complete entry into meiosis. Impor-tantly, we note that the presumptive daughters of these celldivisions are not spatially restricted to the very distal pro-liferative zone region, but can be observed over an �13-celldiameter region (Figure 4E). We further investigated this by
Figure 5 Cell division in glp-1(bn18) at restrictive tem-perature. (A) Wild-type and glp-1(bn18) adults weregiven a 5-hr pulse of EdU (pink line) at 15� and sub-sequently shifted to 25� with continuing EdU labeling(pink line). (B) Number of EdU-positive nuclei per germ-line vs. time at 25�. In wild-type N2, there is a con-tinuous increase whereas in glp-1(bn18), the number ofEdU-positive nuclei reaches a plateau by 6 hr. N2: 0 hr,n = 10 germlines; 2 hr, n = 10; 4 hr, n = 10; 6 hr, n = 6;8 hr, n = 10; 10 hr, n = 10. glp-1(bn18): 0 hr, n = 11;2 hr, n = 10; 4 hr, n = 10; 6 hr, n = 12; 8 hr, n = 7; 10 hr,n = 7. Error bars indicate standard deviation. (C and D)Representative image of glp-1(bn18) proliferative zoneafter 5 hr of EdU pulse at 15� (C) and after 10 hr at 25�(D) stained with DAPI (blue), REC-8 (green), HIM-3(red), and EdU (pink).
176 P. M. Fox and T. Schedl

analyzing the distribution of cell division during theglp-1(bn18) temperature-shift time course (Figure S3). Indeed,at 4 hr after the temperature shift, we observed M-phasesthroughout the 13 distal-most rows. We suggest thatwhether a cell divides once or twice before entering meiosisdepends on the timing by which GLP-1 activity falls belowa threshold relative to cell cycle progression. Our resultsindicate that cells in either mitotic S-phase or G2 are com-mitted to completing the ongoing mitotic cell cycle; there-fore, GLP-1 activity must drop below this threshold prior toinitiating S-phase to begin meiotic S-phase. We suspect thatGLP-1 activity falls below this threshold during the course ofmitotic cell cycle progression and the subsequent daughtercells begin meiotic S-phase. In the glp-1(bn18) temperature-shift experiment, for the majority of mitotically dividing cellsthis occurs during the concurrent mitotic cell cycle and onlya single division occurs. For the minority of cells that un-dergo two divisions, we propose that GLP-1 activity persistsabove this threshold until after their first division and mi-totic S-phase begins again, thus committing them to a seconddivision. Evidently, this occurs only among cells already latein the cell cycle (G2/M).
Recovery of proliferative fate in glp-1(bn18) by returnto permissive temperature
We next investigated when during the GLP-1 inactivationtime-course germ cells become irreversibly committed tomeiotic development. glp-1(bn18) mutants were shifted torestrictive temperature for varying lengths of time and sub-
sequently returned to permissive temperature (Figure 8A).After 3 hr at restrictive temperature followed by growthat permissive temperature, .95% of germlines recover tosteady-state growth. When returned to permissive tempera-ture, these recovering germlines undergo a brief periodwhere the number of PZ cells falls until hours 3–12, fol-lowed by recovery to preshift size (Figure 8B). The prolifer-ative zone in these recovering germlines always maintainsa population of REC-8-positive, HIM-3-negative cells at thedistal tip, and meiotic entry is not observed such that PZcells would be displaced from the DTC niche by cells inmeiosis. In mutants incubated for 4 hr or longer at restrictivetemperature, all PZ cells enter meiosis and PZ recovery failsto occur. This loss of recovery ability corresponds with thedecrease in mitotic cell division that we observed above(Figure 3B). Although the precise dynamics of GLP-1 activityduring restrictive/permissive temperature shifts are unclear,our results are consistent with commitment to meiotic dif-ferentiation occurring in the same time frame as completionof mitotic division and the initiation of meiotic S-phase.
Effect of disruption of the GLD-1 and GLD-2 pathwaygenes on meiotic entry timing
The GLD-1 and GLD-2 pathways act downstream of GLP-1 toredundantly promote entry into meiosis. While eliminationof a single pathway does not prevent meiotic entry, singlemutants that disrupt either pathway have been reported toaffect the steady-state proliferative zone size (Eckmann et al.2004). To analyze how these pathways may affect the
Figure 6 Timing of meiotic entry following loss ofGLP-1 depends on cell cycle position. Experimentalsetup is illustrated in A. glp-1(bn18) mutants wereshifted to 25� while simultaneously initiating a 30-minpulse of EdU. This was followed by a non-EdU chaseperiod that continued at 25�. Dissected germlineswere analyzed with REC-8, HIM-3, EdU, and DAPIstains. (B) Graphs show the percentage of PZ cells(REC-8 positive) that were labeled with EdU. In un-shifted controls, this ratio remains constant whereasin shifted germlines, the ratio dramatically decreases at6 and 8 hr. At 6 and 8 hr, there are very few REC-8-positive cells remaining (see also Figure 3 and Figure4), and the majority of these cells were EdU negative(�30% EdU positive at 6 hr,�20% EdU positive at 8 hr).(C) The total number of EdU nuclei were categorizedbased on HIM-3 and REC-8 staining. Overall, the numberof EdU-positive nuclei increases during the time course.Representative images of distal region stained with DAPI(D), for EdU (D9) and HIM-3 and REC-8 (D$) following6 hrs at 25�. REC-8-positive, HIM-3-negative PZ cells(12 total, some in lower focal plane) are EdU negativewhile surrounding EdU-positive nuclei have already en-tered meiosis (REC-8 negative, HIM-3 positive). We notethat the REC-8+ cells remaining at 6 hr (and 8 hr) arereminiscent of a clonal population of cells (see also Figure4). (B) glp-1(bn18) 15�: 1 hr, n = 12 germlines; 2 hr, n =9; 6 hr, n = 7; 8 hr, n = 11. glp-1(bn18) 25�: 1 hr, n = 11;2 hr, n = 8; 3 hr, n = 7, 4 hr, n = 10; 5 hr, n = 10; 6 hr n =13; 8 hr, n = 11. (C) 1 hr, n = 10; 2 hr, n = 8; 3 hr, n = 8;4 hr, n = 10; 5 hr, n = 10; 6 hr, n = 12; 8 hr, n = 12.
Germline Stem Cell Differentiation 177

timing of meiotic entry following loss of GLP-1 activity,we constructed double mutants with glp-1(bn18) andeach of the GLD-1 and GLD-2 pathway members: gld-1,nos-3, gld-2, and gld-3. In addition, we also analyzeda fbf-2; glp-1(bn18) double mutant as fbf-2 has beenshown to regulate proliferative zone size (Lamont et al.2004). These double mutants display a range of prolifer-ative zone sizes at 15� (Table 3). In general, the respec-
tive proliferative zone sizes paralleled what has beenobserved for the single mutants (Eckmann et al. 2004),albeit with glp-1(bn18) causing a decrease in size.
As described above, these double mutants were shifted torestrictive temperature (25�) as staged adults 24 hr past L4(Figure 9). For gld-2; glp-1(bn18) or fbf-2; glp-1(bn18), weobserved a few hours delay or no overall delay in the com-pletion of meiotic entry. Interestingly, glp-1(bn18); gld-2double mutants had a significantly larger proliferative zonethan glp-1(bn18); however, the spatial pattern of meioticentry following temperature shift was highly similar (FigureS5). For gld-1; glp-1(bn18), nos-3; glp-1(bn18), and gld-3;glp-1(bn18), we observed a significant delay or failure ofgerm cells to enter meiosis, even after 48 hr at restrictivetemperature. In gld-3 and nos-3, the inhibition of meioticentry was stochastic. After 12 hr at restrictive temperature,3/15 gld-3; glp-1(bn18) germlines displayed a completeGlp phenotype (no PZ cells observed) and 4/14 nos-3;glp-1(bn18) germlines displayed a complete Glp phenotype.In addition, the gld-3; glp-1(bn18) non-Glp germlines at12 hr displayed a large range of sizes (2–194 PZ cells, stan-dard deviation 64). In gld-1; glp-1(bn18), the failure of mei-otic entry was more consistent: 0/16 germlines displayeda complete Glp phenotype even after as long as 48 hr atrestrictive temperature. Therefore, the effect of the variousmutations on glp-1(bn18) induced-meiotic entry did not cor-relate with the original size of the proliferative zone at thestart of the shift, whereas gld-2 had the largest initial pro-liferative zone size, it did not cause a significant delay inmeiotic entry. In contrast, the gld-1- or nos-3-containingmutants had relatively smaller proliferative zone sizes butcaused significant meiotic entry delay or inhibition. gld-1;glp-1(bn18) germlines displayed the smallest germline, butdisplayed the most penetrant inhibition of temperature-shift-induced meiotic entry.
Why do the gld-1, nos-3, and gld-3 mutations delay orinhibit entry into meiosis? Previous work has shown thatgld-1 represses glp-1 (Francis et al. 1995; Marin and Evans2003); we hypothesized that elevated GLP-1 activity withinthese mutants suppresses glp-1(bn18), such that the activityof glp-1(bn18) at 25� remains above a threshold for prolif-erative fate. To test this, we further reduced the activity ofGLP-1 in gld-1; glp-1(bn18) and nos-3; glp-1(bn18) mutantswith glp-1 RNAi feeding (Table 4). Indeed, addition of glp-1RNAi increased the induced meiotic entry phenotype,suggesting that gld-1; glp-1(bn18) and nos-3; glp-1(bn18)mutants contain elevated GLP-1 activity that suppresses theglp-1(bn18) mutation.
Since the timing of meiotic entry in glp-1(bn18) singlemutants depends at least in part on cell cycle position, itstands to reason that the delays in meiotic entry could alsobe partially caused by changes in cell cycle kinetics. There-fore, we analyzed mitotic cell cycle progression in the dou-ble mutants by measuring S-phase index, M-phase index,and G2+M+G1 length at 15� (Figure S6). For nearly allthe double mutants, all three cell cycle parameters
Figure 7 Division of proliferative zone cells following loss of GLP-1activity. (A) Illustrates the experimental setup. Wild-type control (B) andglp-1(bn18) mutants (C) were shifted to 25� while simultaneously initiatinga 30-min pulse of EdU. This was followed by a non-EdU chase period thatcontinued at 25�. Dissected germlines were analyzed with pH3, EdU, andDAPI stains. pH3-positive PZ cells were counted and scored as EdU pos-itive or negative. Stacked bar graphs show the average number of EdU-positive or -negative M-phase cells per germline. Time indicates the du-ration at 25�. Early cell divisions are of mostly EdU-negative cells (hour 1),followed by a round of EdU-positive cells (hours 2–4) and a final round ofEdU-negative cells (hour 5). The final round of EdU-negative cells is likelycompleting a second division following the shift to 25�. We note an initialdepression of M-phase frequency in control and glp-1(bn18) at 1 hr, likelya consequence of the temperature shift. Whereas our other estimate ofcell cycle length following shift from 15� to 25� based on G2+M+G1analysis (see Figure 2F) indicates a maximum cell time of 7.5 hr, theanalysis of pulse-labeled cells through M-phase here is consistent witha cell cycle time of 4–5 hr. This difference is likely due to an overestimateof cell cycle time on account of the G2+M+G1 assay providing a maxi-mum length (see also Fox et al. 2011). (B) 1 hr, n = 25 germlines; 2 hr, n =28; 3 hr, n = 24; 4 hr, n = 19; 5 hr, n = 23; 6 hr, n = 18. (C) 1 hr, n = 27; 2hr, n = 26; 3 hr, n = 19; 4 hr, n = 23; 5 hr, n = 21; 6 hr, n = 20. Error barsindicate standard deviation.
178 P. M. Fox and T. Schedl

correlated well with values obtained with both wild-type andglp-1(bn18) single mutants. However, gld-3; glp-1(bn18)mutants displayed a lower S-phase index and longerG2+M+G1 length, suggesting that increased cell cyclelength may contribute to the delay in meiotic entry inthe gld-3; glp-1(bn18) mutants shifted to restrictivetemperature.
As a measure of PZ function, the expectation is thatmutants with a larger PZ should result in a proportionalincrease in the number of germ cells that enter meiosis (PZoutput), as is observed comparing wild type and glp-1(bn18)at 15� (Table 1 and Table 2). We therefore determined theoutput of gld-2; glp-1(bn18) and gld-3; glp-1(bn18) doublemutants (Table 2). Surprisingly, relative to wild-type germ-lines, the proliferative zone output of these double mutantswas not proportional to their respective proliferative zonesize; for example, the PZ in wild type is 235 cells with anoutput of 155 cells per 10 hr while for gld-2; glp-1(bn18) thePZ is larger, 339 cells, but with an output of only 133 cellsper 10 hr. The reason for this is unclear; one possibility isthat there is a delay in the transition from mitotic cycling to
overt meiotic differentiation (becoming HIM-3 positive),which may not be surprising given the role of GLD-2 in pro-moting meiotic entry.
Discussion
This study was designed to distinguish between two modelsfor the organization of the stem cell meiotic entry system inthe C. elegans germline: (1) whether there is a proliferativezone containing GLP-1-signaling-dependent distal stem cellsfollowed by GLP-1-signaling-independent proximal TA divi-sions or (2) a proliferative zone containing stem andprogenitor cells that are all GLP-1-signaling-dependent/developmentally equivalent (Figure 1). The two models pre-dicted distinct phenotypic outcomes for PZ cells after lossof GLP-1 activity through manipulation of a temperature-sensitive loss-of-function mutant. Following loss of GLP-1activity, we found that entry into meiosis was largelysynchronous and independent of distal-proximal positionand that the location of the last cells to undergo mitoticdivision was also independent of distal-proximal position.These results are not consistent with the model of GLP-1-independent TA divisions (model 1), which predicts that,
Figure 8 Recovery of the proliferative zone in glp-1(bn18) followingexposure to the restrictive temperature. (A) glp-1(bn18) mutants wereshifted to restrictive temperature for the indicated length of time andthen returned to permissive temperature. Animals were allowed to re-cover for 48 hr and subsequently scored for Glp (all PZ cells havingentered meiotic prophase) phenotype. (B) Animals were shifted to 25�for 3 hr and subsequently returned to permissive temperature to allowrecovery. Animals were harvested at the indicated time points, and thetotal number of REC-8-positive PZ cells were counted. The time indicateshours after returning to permissive temperature (15�). (A) 0 hr, n = 92germlines; 2 hr, n = 37; 2.5 hr, n = 68; 3 hr, n = 101; 3.5 hr, n = 94; 4 hr,n = 90. (B) unshifted control: 0 hr, n = 17; 72 hr, n = 16. 3 hr, 25� pulse:0 hr, n = 18; 3 hr, n = 19; 6 hr, n = 18; 12 hr, n = 10; 20 hr, n = 20; 48 hr,n = 16; 72 hr, n = 16. Error bars indicate standard deviation.
Figure 9 Effect of meiotic entry pathway gene mutations on the timecourse of meiotic entry following glp-1(bn18) temperature shift. Doublemutants of glp-1(bn18) and likely null alleles of GLD-1/GLD-2 pathwaygenes were shifted to restrictive temperature and analyzed for number ofPZ cells (REC-8 positive). Graph shows the number of PZ cells per germlinevs. time at 25�. (A) glp-1(bn18): 0 hr, n = 14 germlines; 2 hr, n = 9; 4 hr,n = 10; 6 hr, n = 11; 8 hr, n = 7; 10 hr, n = 8. fbf-2; glp-1(bn18): 0 hr,n = 10; 2 hr, n = 10; 4 hr, n = 10; 6 hr, n = 10; 8 hr, n = 10; 10 hr, n = 14.gld-2; glp-1(bn18): 0 hr, n = 7; 2 hr, n = 6; 4 hr, n = 7; 6 hr, n = 6; 8 hr,n = 8; 10 hr, n = 12; 12 hr, n = 14. (B) nos-3; glp-1(bn18): 0 hr, n = 10;2 hr, n = 10; 4 hr, n = 10; 6 hr, n = 9; 8 hr, n = 10; 10 hr, n = 10; 12 hr,n = 8. gld-1; glp-1(bn18): 0 hr, n = 12; 6 hr, n = 10; 12 hr, n = 10. gld-3;glp-1(bn18): 0 hr, n = 8; 2 hr, n = 7; 4 hr, n = 8; 6 hr, n = 8; 8 hr, n = 8;10 hr, n = 10; 12 hr, n = 11.
Germline Stem Cell Differentiation 179

following loss of GLP-1 activity, meiotic entry would occur ina proximal-to-distal temporal progression and that the lastcell divisions would be spatially restricted to the distal-mostregion where the stem cells have converted to TA cells.Furthermore, we found that following shift of the glp-1(ts)mutant to the restrictive temperature, the majority of cellsundergo a single mitotic division and complete the ongoingmitotic cell cycle prior to entry into meiosis based on kineticstudies showing (1) that there is an approximate doubling incell number relative to the initial number of mitotically cy-cling cells, (2) that the estimated maximum cell cycle length(5–7.5 hr) is similar in timing to when the majority of germcells entered meiosis (6–8 hr), and (3) that mitotic S-phaseand G2 phase cells are not able to enter meiosis without anintervening mitotic division.
Model of proliferative zone dynamics
To begin to provide an understanding of how all of themitotically cycling cells display GLP-1-signaling depen-dence, we present a population-based model of proliferativezone dynamics in the wild-type adult hermaphrodite germ-line. The model is based on the finding that the niche DTCplexus is large (Byrd et al. 2014) and could support a largestem cell population (see below) and that, when GLP-1 ac-tivity is lost, proliferative zone cells complete the ongoingmitotic cell cycle and begin meiotic development. Our modelof the proliferative zone contains three distinct pools of cellsthat represent three sequential stages of PZ cell develop-ment: (1) self-renewing stem cells; (2) progenitors under-going a final mitotic division; and (3) meiotic S-phase,which precedes overt meiotic differentiation. According tothis model, the switch from pool 1 to 2 occurs when GLP-1-signaling activity falls below a threshold and is interpretedby the cell. As cell cycling is continuous among the PZ cells(no quiescent cells), this switch occurs during the course ofmitotic cell cycle progression, and the resulting symmetricdaughter cells both begin meiotic S-phase (enter pool 3).
The model incorporates cell cycle rate and overallproliferative zone output to estimate the size of each distinctpool and their individual output to describe the proliferativezone at steady state (Figure 10; wild type at 20�). For eachpool of cells, the output is determined by the number ofmitotically cycling cells (n), their rate of division (divisions/hour) (r), and the fate of the daughter progeny (whether
each daughter cells remains within or exits the pool). Forpool 1 (green, Figure 10B), steady-state self-renewal re-quires that for each division that occurs, on a populationlevel, one daughter remains and one daughter exits thepool. Accordingly, each division yields an output of one cell.Therefore the output of pool 1 can be represented as
output1 5 n1r (1)
where n1 is the number of dividing cells in pool 1 and r is thedivision rate (divisions/hour). For pool 2 (teal, Figure 10B),where GLP-1 activity is lost prior to division, both daughtercells exit the pool (differentiate). Therefore, as opposed topool 1 where a single division yields an output of one cell, inpool 2 each division yields an output of two cells. The outputof pool 2 can be represented as follows:
output25 2n2r: (2)
At steady state, the output of pool 1 and pool 2 areinterrelated since each cell that exits pool 1 (and enterspool 2) will eventually divide within pool 2 to generate twodaughter cells that exit pool 2. Therefore, the output of pool2 is twice the output of pool 1. Since cell division does notoccur in pool 3 cells, the output of pool 2 and the overalloutput of the proliferative zone (output3) are equal. There-fore, the output of pool 1 and pool 2 relate to the overalloutput of the proliferative zone as follows:
2ðoutput1Þ5 output25 output3: (3)
Previously, we have described that the wild-type cell cyclelength at 20� is 6–8 hr and the overall output of the pro-liferative zone is 20 cells/hour (Fox et al. 2011). Therefore,under steady state, we predict that the output of pool 1 ina wild-type germline is 10 cells/hour and the output of pool2 is 20 cells/hour. A total of 60–80 cells, each dividing onceevery 6–8 hr, would generate an output of 10 cells/hour inpool 1, and an equal number of cells with an equal divisionrate would generate an output of 20 cells/hour in pool 2.Pool 3 (orange, Figure 10B) is composed of cells in meioticS-phase, which will progress to meiotic prophase in the mei-otic entry region. This pool of cells is included within theproliferative zone population-based EdU/BrdU incorpora-tion studies that place all germline S-phase cells withinthe REC-8-positive/HIM-3-negative proliferative zone(Crittenden et al. 2006; Jaramillo-Lambert et al. 2007; Foxet al. 2011). Direct measure of the length of meiotic S-phasewould allow one to estimate the size of this pool by relatingflux of cells through this stage with the overall output rate of20 cells/hour. For example, a meiotic S-phase length of 1 hrwould suggest that 20 cells are in meiotic S-phase at anygiven time, whereas a length of 10 hr would suggest 200cells. Previous measurements indicate that mitotic S-phase is�50–60% or 3–5 hr of the total mitotic cell cycle, whichwould correspond to 70–100 cells in meiotic S-phase, givenan equivalent length (Fox et al. 2011). Although direct
Table 4 glp-1 RNAi enhances glp-1(bn18) in nos-3 and gld-1mutants
Genotype RNAi % Glpa n
glp-1(bn18) gfp 100 21glp-1 100 26
glp-1(bn18); nos-3 gfp 61 74glp-1 96 71
glp-1(bn18); gld-1 gfp 0 43glp-1 33 47
a Adult animals were shifted to RNAi plates at 25� for 24 hr. Glp indicates theabsence of PZ cells as determined by REC-8 staining.
180 P. M. Fox and T. Schedl

measure of meiotic S-phase length remains technically diffi-cult, our previous work allowed us to estimate the numberof nondividing cells within the proliferative zone. Since celldivision is continuous among the mitotically dividing cells inpools 1 and 2, these nondividing cells correspond to pool 3.We previously estimated this to be 30–40% of the total pro-liferative zone (or 70–100 cells) (Fox et al. 2011). This es-timate of 70–100 cells in meiotic S-phase is consistent witha length of meiotic S-phase of 3–5 hr, which, as discussedabove, corresponds to the length of mitotic S-phase. There-fore, we propose that pool 3 contains 70–100 cells mostlyundergoing meiotic S-phase. Together, our estimates for thesize of pools 1–3 predict that the wild-type proliferative zonecontains 190–260 cells. Indeed, this agrees with the exper-imental average of �230 PZ cells that we observe whencounting REC-8-positive/HIM-3-negative cells.
Our model framework can be used to describe otherconditions where there is a steady state of proliferation and
meiotic entry, measured PZ cell number, cell cycle time andPZ output (Figure S7). For wild type at 15�, 20�, and 25�,measured cell cycle time and output scale with increasingtemperature resulting in the predicted stem cell pool, as wellas the pool 2 size, being remarkably constant between tem-peratures (�60–90 cells). In contrast, glp-1(bn18), whilehaving the same cell cycle time as wild type at 15�, hasa smaller proliferative zone output leading to a smaller pre-dicted stem cell pool (49–65 cells, Figure S7), likely as a con-sequence of decreased GLP-1 signaling at the permissivetemperature. Importantly, the model predicts a glp-1(bn18)proliferative zone (pool 1–3) of 133–195 cells, which is com-parable to the experimentally measured size of 1656 26. Weare not able to apply the model framework to gld-2 and gld-3mutant germlines with larger PZs, given the finding that thePZ output was not proportional to the increased PZ size; thisis possibly due to a delayed transition to overt meiotic entryin these mutants, which is consistent with the known func-tion of GLD-2 and GLD-3 in meiotic entry.
Relating the activity of GLP-1 and the GLD-1/GLD-2pathways to proliferative zone size
Detailed cytological analysis of the adult hermaphroditeDTC plexus reveals that short processes from the DTCintercalate between germ cells extending as far as 8–9 celldiameters from the distal tip (Byrd et al. 2014). Theseobservations are consistent with the possibility of ligand-dependent GLP-1 signaling occurring as far 8–9 cell diametersfrom the distal tip, although it remains unknown how rap-idly GLP-1 signaling is lost after germ cells move away fromthe membrane-bound ligand. Thus the DTC plexus niche islarge and can accommodate a large stem cell population.The size of pool 1 in our model is 60–80 cells (Figure 10),and, interestingly, we find that the distal most 8–9 cell diam-eters in wild type contain �70–90 cells. As pool 1 cells aredisplaced proximally through distal cell divisions, they losecontact with the ligand containing DTC plexus processes andpass below threshold GLP-1 activity necessary for self-renewal and complete the ongoing mitotic cell cycle beforeinitiation of meiotic S-phase. Thus cells in pool 2 are un-dergoing GLP-1-dependent mitosis as a consequence of com-pleting the cell cycle that was ongoing when the thresholdwas passed. However, it is unlikely that all cells transitionfrom pool 1 to pool 2 precisely at this 8- to 9-cell-diameterboundary. Stochastic differences in GLP-1-signaling activityrelated to the extent of the intercalating DTC process couldcause individual cells to drop below the threshold earlier orlater. Another important variable is the cell cycle position ofPZ cells as they exit the DTC plexus, especially if the switchto undergoing a final division occurs only during a criticalwindow of the cell cycle. For example, a drop in GLP-1activity may cause a cell at an early stage of the cell cycleto undergo its final division while a cell at a later stage of thecell cycle may have passed this window, after which thissignal is not interpreted until the next cell cycle. These var-iables may account for the few scattered cells that show late
Figure 10 Model of proliferative zone composition and dynamics for thewild-type adult hermaphrodite. The proliferative zone in wild type ismodeled based on our findings from analysis of meiotic entry behaviorand mitotic cell cycle properties of germ cells following loss of GLP-1activity (see text for details), which likely correspond to loss of the activityof the downstream transcriptional targets of GLP-1 signaling. The pro-liferative zone contains three pools (A and B), self-renewing stem cells(green) at the distal end, cells undergoing the final mitotic division (teal),and cells in meiotic S-phase (orange), which exist in partially overlappingregions (A). From measured proliferative zone output and division rate (r)in wild type at 20�, and the predicted behaviors of the cells in the threepools, the size of each pool can be estimated (B). Estimates for output anddivision rate are taken from Fox et al. (2011). As stem cell (pool 1)daughters progress proximally and escape the influence of the DTCplexus, they pass below a hypothesized threshold of GLP-1 activity (C),which results in loss of self-renewal activity, completion of the ongoingmitotic cell cycle (pool 2), and then meiotic S-phase (pool 3).
Germline Stem Cell Differentiation 181

overt meiotic entry in the meiotic entry region and the inter-mixing of M-phase and meiotic S-phase among PZ cells(Hansen et al. 2004a; Crittenden et al. 2006). The predictedstem cell pool size for glp-1(bn18) at 15� is 45–60 cells(Figure S7), which would appear to be smaller than thenumber of cells that are in intimate contact with the DTCplexus. This difference can be explained by the reducedactivity of glp-1(bn18) and the likely possibility that thedensity of the GLP-1 ligand falls with distance from thedistal tip cap, which together result in cells passing throughthe threshold of GLP-1 activity before cells leave the 8- to9-cell-diameter DTC plexus.
Downstream of GLP-1 signaling, the GLD-1 and GLD-2pathways act in parallel to regulate entry into meiosis. Dis-ruption of these genes affects PZ size, suggesting that thedecision to enter meiosis may be an interplay of the fall/threshold of GLP-1 activity and the rise/threshold of GLD-1and GLD-2 meiotic entry activity (Hansen and Schedl 2013).We observed distinct meiotic entry phenotypes when thesegenes were disrupted in the glp-1(bn18) temperature-shiftexperiment. gld-2 and fbf-2 mutants had germlines withlarger PZs; however, they did not cause a significant delayin shift-up meiotic entry kinetics. In contrast, gld-1 and gld-3mutations, and to a lesser extent nos-3, significantly inhibitedmeiotic entry in the glp-1(bn18) temperature-shift experiment.These phenotypes did not correlate with the steady-state sizeof the proliferative zone, whereas gld-1 caused a decrease inproliferative zone size and gld-3 resulted in a larger prolifera-tive zone. For both of these mutants, complete meiotic entrywas variable or observed only when glp-1(bn18) temperatureshift was combined with glp-1 RNAi. Therefore, we suggestthat disruption of gld-1 and gld-3 causes an increase in GLP-1-signaling activity or alters the threshold by which germ cellsrespond to GLP-1 activity, such that glp-1(bn18) retains func-tion at restrictive temperature.
Mutants and conditions that disrupt animal physiology(e.g., dietary restriction) have a smaller adult proliferativezone, at least in part through decreased expansion of thestem cell pool during larval development (Michaelson et al.2010; Dalfo et al. 2012; Korta et al. 2012); maintain asmaller stem cell pool; and likely have a small proliferativezone output at steady state in adulthood. Physiological path-ways are likely to be largely acting in parallel to GLP-1signaling in the control of the stem cell pool size (Hubbardet al. 2013). Our model may provide a useful framework forexamining how the adult proliferative zone responds tochanges in physiological conditions.
Comparison to other stem cell systems
In many stem cell systems, number and activity of stem cellsand TA cells determine the output of differentiated celltypes. In mammalian spermatogenesis, correlated differ-ences in stem cell number and TA divisions achieve the sameoutput of sperm; in mice, �0.03% of the germ-cell popula-tion are probably stem cells, and TA cells undergo up to 10rounds of division prior to entry into meiosis whereas in
monkeys�3%of the germ-cell population are probable stem cells,and TA cells undergo only four rounds of division (Tegelenboschand de Rooij 1993; Hermann et al. 2009). The C. elegans her-maphrodite germline is thus at the extreme end of this distri-bution with �10% of germ cells (50% of mitotically cyclingcells) functioning as stem cells, based on our analysis.
Should proliferative zone cells completing the proposedfinal mitotic cycle be considered TA cells? TA cells, incontrast to stem cells, are defined as possessing a finiteability to proliferate. Direct tests of self-renewal capacity ofindividual PZ cells within the germline have not yet beenachieved. In many stem cell systems, the switch from stemcells to TA cells is accompanied by changes in morphology,distribution within a tissue, gene expression, and regulationby distinct signaling pathways, and the proliferative expan-sion of TA cells continues for multiple divisions. Cells in pool2, while not displaying an obvious difference in morphology,are different in distribution than the stem cells, as they lieproximal to pool 1 and show differences in gene expression;for example, GLD-1 levels are rising compared to low levelsin pool 1 stem cells (Hansen et al. 2004b; Cinquin et al. 2010).However, they lack key features of TA cells: multiple mitoticdivisions that amplify the progenitor population and that thesedivisions are controlled by a regulartory process [e.g., LIN28 inmouse spermatogonial transit amplifying cells (Chakrabortyet al. 2014)] separate from that for stem cells. Thus we feelthat categorizing pool 2 cells as TA cells is misleading as totheir cellular behavior and the regulatory processes that areoccurring. We suggest that PZ cells displaced from the DTCniche and undergoing a final division should instead be re-ferred to as “progenitor cells.” Since we cannot directly testself-renewal capability among these cells, we use the term“progenitor cell,” which we define as encompassing all germcells that have not initiated meiosis.
Why does the C. elegans germline generate meiotic germcells/gametes from a large stem cell population rather thanfrom a small number of stem cells that undergoes multiplerounds of TA divisions before differentiation? We speculatethat it is a consequence of C. elegans having two (and pos-sibly more) condition-induced mechanisms that extend re-productive competence in aging adult hermaphrodites,which must rapidly generate numerous meiotic germ cellsin response to new optimal conditions. The first is adultreproductive diapause, where in response to total food dep-rivation the germline undergoes atrophy/autophagy of es-sentially all meiotic germ cells with only a proliferative zonewith as few as �35 germ cells remaining; following return tofood the distal-proximal germline gametogenesis pattern isreestablished rapidly and progeny are generated (Angeloand Van Gilst 2009; Seidel and Kimble 2011). The secondis a recently described mechanism that maintains a relativelylarge proliferative zone to extend reproductive competencein mid-aged hermaphrodites that have exhausted their self-sperm (and presumably in females of related male/femalenematodes species) in anticipation of progeny productionfollowing mating (Qin and Hubbard 2015). In response to
182 P. M. Fox and T. Schedl

mating, the germline needs to produce large numbers ofmeiotic prophase germ cells to generate oocytes and/ornurse cells for progeny production. In both cases, meioticgerm cells can be more rapidly generated from a large stemcell population that undergoes essentially direct differentia-tion than from a small pool of stem cells that must undergosequential TA divisions, thus delaying the time of theirdifferentiation.
Coordination of the switch from mitosis to meiosis
Research from other model organisms indicates that meioticS-phase is a prerequisite for meiosis. Therefore, to allowmeiotic S-phase to occur, the decision to enter meiosisshould occur either during G1 or during a prior mitotic cellcycle. Due to G1 phase being either very short or absent (Foxet al. 2011) and according to the concept that a drop in GLP-1-signaling activity provides the primary signal to enter mei-osis, our results are consistent with the switch to meiosisoccurring during a germ cell’s final mitotic cell cycle. WhenGLP-1-signaling activity was lost during mitotic S-phase orG2, under normal conditions the mother cell appears tocomplete the concurrent mitotic cycle, and the initiation ofmeiotic prophase occurs within the daughter cells. The de-cision to enter meiosis may occur at a similar cellular stagein other organisms. In the Drosophila male germline, accu-mulation of Bam protein terminates TA division within sper-matogonia and initiates spermatocyte differentiation (Inscoet al. 2009). Interestingly, Bam protein reaches peak accu-mulation in 8-cell cysts, prior to their final mitotic division,and this accumulation pattern is thought to permit the ini-tiation of meiotic S-phase within progeny cells. For theC. elegans germline, this makes an interesting prediction. Ifthe activity of GLP-1 within the mother cell determineswhether the daughter cells differentiate, all mitotic divisionwithin the germline should be symmetric in terms of theoutcome of the immediate progeny.
Conclusion
Unlike other stem cell systems, where distinct pathwaysregulate stem vs. TA precursors, we propose that the pro-liferative zone contains developmentally equivalent stem/progenitor cells that respond primarily to the GLP-1 Notchsignal. We suggest that GLP-1 signaling is directly responsi-ble for driving all stages of proliferation in the wild-typegermline, and loss of GLP-1 activity causes differentiationwithout intervening, distinctly regulated TA divisions. Testsof the model await the development of lineaging and long-term live-imaging technologies for the distal germline. Ourmodel should provide a framework for integrating the ge-netic pathways that regulate proliferative/meiotic fate withthe cell dynamics of the germline.
Acknowledgments
We thank Dave Hansen, Eleanor Maine, and John Brennerfor comments on the manuscript. Work in the Schedl
laboratory was supported by National Institutes of Healthgrant R01 GM100756. We thank WormBase, funded byNational Human Genome Research Institute, and theCaenorhabditis Genetics Center, funded by the NationalInstitutes of Health Office of Research Infrastructure, forresources.
Literature Cited
Angelo, G., and M. R. Van Gilst, 2009 Starvation protects germ-line stem cells and extends reproductive longevity in C. elegans.Science 326: 954–958.
Austin, J., and J. Kimble, 1987 glp-1 is required in the germ linefor regulation of the decision between mitosis and meiosis inC. elegans. Cell 51: 589–599.
Baltus, A. E., D. B. Menke, Y. C. Hu, M. L. Goodheart, A. E. Carpenteret al., 2006 In germ cells of mouse embryonic ovaries, the de-cision to enter meiosis precedes premeiotic DNA replication.Nat. Genet. 38: 1430–1434.
Buaas, F. W., A. L. Kirsh, M. Sharma, D. J. McLean, J. L. Morriset al., 2004 Plzf is required in adult male germ cells for stemcell self-renewal. Nat. Genet. 36: 647–652.
Byrd, D. T., K. Knobel, K. Affeldt, S. L. Crittenden, and J. Kimble,2014 A DTC niche plexus surrounds the germline stem cellpool in Caenorhabditis elegans. PLoS One 9: e88372.
Chakraborty, P., F. W. Buaas, M. Sharma, E. Snyder, D. G. de Rooijet al., 2014 LIN28A marks the spermatogonial progenitor pop-ulation and regulates its cyclic expansion. Stem Cells 32: 860–873.
Chen, D., and D. McKearin, 2003 Dpp signaling silences bamtranscription directly to establish asymmetric divisions of germ-line stem cells. Curr. Biol. 13: 1786–1791.
Chen, S., S. Wang, and T. Xie, 2011 Restricting self-renewal sig-nals within the stem cell niche: multiple levels of control. Curr.Opin. Genet. Dev. 21: 684–689.
Cinquin, O., S. L. Crittenden, D. E. Morgan, and J. Kimble,2010 Progression from a stem cell-like state to early differen-tiation in the C. elegans germ line. Proc. Natl. Acad. Sci. USA107: 2048–2053.
Crittenden, S. L., E. R. Troemel, T. C. Evans, and J. Kimble,1994 GLP-1 is localized to the mitotic region of the C. elegansgerm line. Development 120: 2901–2911.
Crittenden, S. L., K. A. Leonhard, D. T. Byrd, and J. Kimble,2006 Cellular analyses of the mitotic region in the Caenorhab-ditis elegans adult germ line. Mol. Biol. Cell 17: 3051–3061.
Dalfo, D., D. Michaelson, and E. J. Hubbard, 2012 Sensory regu-lation of the C. elegans germline through TGF-beta-dependentsignaling in the niche. Curr. Biol. 22: 712–719.
Eckmann, C. R., S. L. Crittenden, N. Suh, and J. Kimble,2004 GLD-3 and control of the mitosis/meiosis decision inthe germline of Caenorhabditis elegans. Genetics 168: 147–160.
Ellis, R., and T. Schedl, 2007 Sex determination in the germ line,WormBook, ed. The C. elegans Research Community, WormBook,doi/10.1895/wormbook.1.82.2, http://www.wormbook.org.
Fox, P. M., V. E. Vought, M. Hanazawa, M. H. Lee, E. M. Maineet al., 2011 Cyclin E and CDK-2 regulate proliferative cell fateand cell cycle progression in the C. elegans germline. Develop-ment 138: 2223–2234.
Francis, R., E. Maine, and T. Schedl, 1995 Analysis of the multipleroles of gld-1 in germline development: interactions with thesex determination cascade and the glp-1 signaling pathway. Ge-netics 139: 607–630.
Gupta, P., L. Leahul, X. Wang, C. Wang, B. Bakos et al.,2015 Proteasome regulation of the chromodomain proteinMRG-1 controls the balance between proliferative fate and
Germline Stem Cell Differentiation 183

differentiation in the C. elegans germ line. Development 142:291–302.
Hansen, D., and T. Schedl, 2013 Stem cell proliferation vs. mei-otic fate decision in Caenorhabditis elegans. Adv. Exp. Med. Biol.757: 71–99.
Hansen, D., E. J. Hubbard, and T. Schedl, 2004a Multi-pathwaycontrol of the proliferation vs. meiotic development decision inthe Caenorhabditis elegans germline. Dev. Biol. 268: 342–357.
Hansen, D., L. Wilson-Berry, T. Dang, and T. Schedl,2004b Control of the proliferation vs. meiotic developmentdecision in the C. elegans germline through regulation ofGLD-1 protein accumulation. Development 131: 93–104.
Henderson, S. T., D. Gao, E. J. Lambie, and J. Kimble, 1994 lag-2may encode a signaling ligand for the GLP-1 and LIN-12 recep-tors of C. elegans. Development 120: 2913–2924.
Hermann, B. P., M. Sukhwani, D. R. Simorangkir, T. Chu, T. M.Plant et al., 2009 Molecular dissection of the male germ celllineage identifies putative spermatogonial stem cells in rhesusmacaques. Hum. Reprod. 24: 1704–1716.
Honigberg, S. M., and K. Purnapatre, 2003 Signal pathway inte-gration in the switch from the mitotic cell cycle to meiosis inyeast. J. Cell Sci. 116: 2137–2147.
Hubbard, E. J., D. Z. Korta, and D. Dalfo, 2013 Physiological controlof germline development. Adv. Exp. Med. Biol. 757: 101–131.
Hughes, S. E., K. Evason, C. Xiong, and K. Kornfeld, 2007 Geneticand pharmacological factors that influence reproductive agingin nematodes. PLoS Genet. 3: e25.
Insco, M. L., A. Leon, C. H. Tam, D. M. McKearin, and M. T. Fuller,2009 Accumulation of a differentiation regulator specifiestransit amplifying division number in an adult stem cell lineage.Proc. Natl. Acad. Sci. USA 106: 22311–22316.
Jaramillo-Lambert, A., M. Ellefson, A. M. Villeneuve, and J. Engebrecht,2007 Differential timing of S phases, X chromosome replica-tion, and meiotic prophase in the C. elegans germ line. Dev.Biol. 308: 206–221.
Jones, A. R., R. Francis, and T. Schedl, 1996 GLD-1, a cytoplasmicprotein essential for oocyte differentiation, shows stage- andsex-specific expression during Caenorhabditis elegans germlinedevelopment. Dev. Biol. 180: 165–183.
Kadyk, L. C., and J. Kimble, 1998 Genetic regulation of entry intomeiosis in Caenorhabditis elegans. Development 125: 1803–1813.
Kershner, A. M., H. Shin, T. J. Hansen, and J. Kimble,2014 Discovery of two GLP-1/Notch target genes that accountfor the role of GLP-1/Notch signaling in stem cell maintenance.Proc. Natl. Acad. Sci. USA 111: 3739–3744.
Kimble, J., 2011 Molecular regulation of the mitosis/meiosis de-cision in multicellular organisms. Cold Spring Harb. Perspect.Biol. 3: a002683.
Kimble, J. E., and J. G. White, 1981 On the control of germ celldevelopment in Caenorhabditis elegans. Dev. Biol. 81: 208–219.
Kodoyianni, V., E. M. Maine, and J. Kimble, 1992 Molecular basisof loss-of-function mutations in the glp-1 gene of Caenorhabditiselegans. Mol. Biol. Cell 3: 1199–1213.
Korta, D. Z., S. Tuck, and E. J. Hubbard, 2012 S6K links cell fate,cell cycle and nutrient response in C. elegans germline stem/progenitor cells. Development 139: 859–870.
Lamont, L. B., S. L. Crittenden, D. Bernstein, M. Wickens, and J.Kimble, 2004 FBF-1 and FBF-2 regulate the size of the mitoticregion in the C. elegans germline. Dev. Cell 7: 697–707.
Lee, M. H., and T. Schedl, 2001 Identification of in vivo mRNAtargets of GLD-1, a maxi-KH motif containing protein requiredfor C. elegans germ cell development. Genes Dev. 15: 2408–2420.
Lee, M. H., and T. Schedl, 2010 C. elegans star proteins, GLD-1and ASD-2, regulate specific RNA targets to control develop-ment. Adv. Exp. Med. Biol. 693: 106–122.
Lui, D. Y., and M. P. Colaiacovo, 2013 Meiotic development inCaenorhabditis elegans. Adv. Exp. Med. Biol. 757: 133–170.
MacQueen, A. J., and A. M. Villeneuve, 2001 Nuclear reorga-nization and homologous chromosome pairing during mei-otic prophase require C. elegans chk-2. Genes Dev. 15:1674–1687.
Marin, V. A., and T. C. Evans, 2003 Translational repression ofa C. elegans Notch mRNA by the STAR/KH domain proteinGLD-1. Development 130: 2623–2632.
Michaelson, D., D. Z. Korta, Y. Capua, and E. J. Hubbard,2010 Insulin signaling promotes germline proliferation inC. elegans. Development 137: 671–680.
Nadarajan, S., J. A. Govindan, M. McGovern, E. J. Hubbard, and D.Greenstein, 2009 MSP and GLP-1/Notch signaling coordi-nately regulate actomyosin-dependent cytoplasmic streamingand oocyte growth in C. elegans. Development 136: 2223–2234.
Qiao, L., J. L. Lissemore, P. Shu, A. Smardon, M. B. Gelber et al.,1995 Enhancers of glp-1, a gene required for cell-signaling inCaenorhabditis elegans, define a set of genes required for germ-line development. Genetics 141: 551–569.
Qin, Z., and E. J. Hubbard, 2015 Non-autonomous DAF-16/FOXOactivity antagonizes age-related loss of C. elegans germlinestem/progenitor cells. Nat. Commun. 6: 7107.
Seidel, H. S., and J. Kimble, 2011 The oogenic germline starva-tion response in C. elegans. PLoS One 6: e28074.
Spradling, A., M. T. Fuller, R. E. Braun, and S. Yoshida,2011 Germline stem cells. Cold Spring Harb. Perspect. Biol.3: a002642.
Tegelenbosch, R. A., and D. G. de Rooij, 1993 A quantitativestudy of spermatogonial multiplication and stem cell renewalin the C3H/101 F1 hybrid mouse. Mutat. Res. 290: 193–200.
Valli, H., B. T. Phillips, K. Gassei, M. C. Nagano, and K. E. Orwig,2015 Spermatogonial stem cells and spermatogenesis, pp.595–635 in Knobil and Neill’s Physiology of Reproduction, editedby T. M. Plant, and A. J. Zeleznik. Elsevier, San Diego.
Wang, L., C. R. Eckmann, L. C. Kadyk, M. Wickens, and J. Kimble,2002 A regulatory cytoplasmic poly(A) polymerase in Caeno-rhabditis elegans. Nature 419: 312–316.
Xie, T., and A. C. Spradling, 1998 decapentaplegic is essential forthe maintenance and division of germline stem cells in the Dro-sophila ovary. Cell 94: 251–260.
Communicating editor: D. I. Greenstein
184 P. M. Fox and T. Schedl

GENETICSSupporting Information
www.genetics.org/lookup/suppl/doi:10.1534/genetics.115.178061/-/DC1
Analysis of Germline Stem Cell DifferentiationFollowing Loss of GLP-1 Notch Activity in
Caenorhabditis elegansPaul M. Fox and Tim Schedl
Copyright © 2015 by the Genetics Society of AmericaDOI: 10.1534/genetics.115.178061

2 SI P. M. Fox and T. Schedl
Figure S1 Analysis of G2 length in glp‐1(bn18). Animals were fed EdU labelled bacteria for the indicated length of time at 15° and subsequently harvested and dissected. Germlines were stained to detect EdU incorporation and with pH3 antibody to detect PZ cells in M‐phase. The graph displays the percentage of M‐phase cells that were EdU positive versus length of EdU pulse. Since EdU is incorporated during S‐phase, the length of time required for EdU labelled cells to reach M‐phase provides an estimate of the length of G2. At ~3 hours, 50% of M‐phase cells in both wild type N2 and glp‐1(bn18) were EdU positive, and at 5 hours, 100% were EdU positive. This indicates that for both N2 and glp‐1(bn18) the median and maximum length of G2 is 3 and 5 hours, respectively. For each time point, at least 10 germlines were scored. Error bars show standard deviation.

P. M. Fox and T. Schedl 3 SI
Figure S2 Comparison of meiotic entry kinetics of glp‐1(ts) mutants shifted to restrictive temperature (25°). Adults were raised at permissive temperature (15°), staged to be 24 hours past L4 and shifted to restrictive temperature (25°). Animals were harvested after the indicated period at restrictive temperature and stained with REC‐8 and HIM‐3 antibody to detect PZ cells versus meiotic prophase cells. The number of PZ cells was counted and the average per germline plotted versus time. Although e2141 and q224 mutants had fewer proliferative zone cells at permissive temperature steady state than bn18, they displayed similar kinetics of proliferative zone differentiation following shift to restrictive temperature. For each time point, at least eight germlines were scored. Error bars indicate standard deviation.

4 SI P. M. Fox and T. Schedl
Figure S3 Distribution of M‐phase in glp‐1(bn18) shifted to restrictive temperature. glp‐1(bn18) animals were shifted from 15° to 25° and dissected germlines were stained with pH3 to label M‐phase. The position of M‐phase cells were scored based on position, in cell diameters, from the distal tip. The histogram plots the average number of M‐phase cells per row. 0 hours, n=23; 2 hours, n=30; 4 hours, n=33; 6 hours, n=35 (germlines).

P. M. Fox and T. Schedl 5 SI
Figure S4 PZ cells in mitotic G2 undergo mitosis and meiotic S‐phase prior to meiotic entry. (A) glp‐1(bn18) mutants were shifted to restrictive temperature and simultaneously given a continuous EdU labelling, as indicated. (B) Representative image of the distal region of a germline after the 10 hour EdU labelling at restrictive temperature. Note that all germ cells have entered meiosis and all germ cells within ~15 cell diameters of the distal tip are EdU positive.

6 SI P. M. Fox and T. Schedl
Figure S5 Distribution of PZ cells in glp‐1(bn18); gld‐2 double mutants shifted to restrictive temperature. glp‐1(bn18); gld‐2 mutants were shifted to the restrictive temperature (25°) for the indicated time. (A‐G) Distal region of representative germlines stained with DAPI (blue), REC‐8 antibody (green) and HIM‐3 antibody (red). (A’‐F’) Graphs show the percentage of cells that are REC‐8 positive (green) or HIM‐3 positive (red) within cell rows defined by distance from the distal tip.
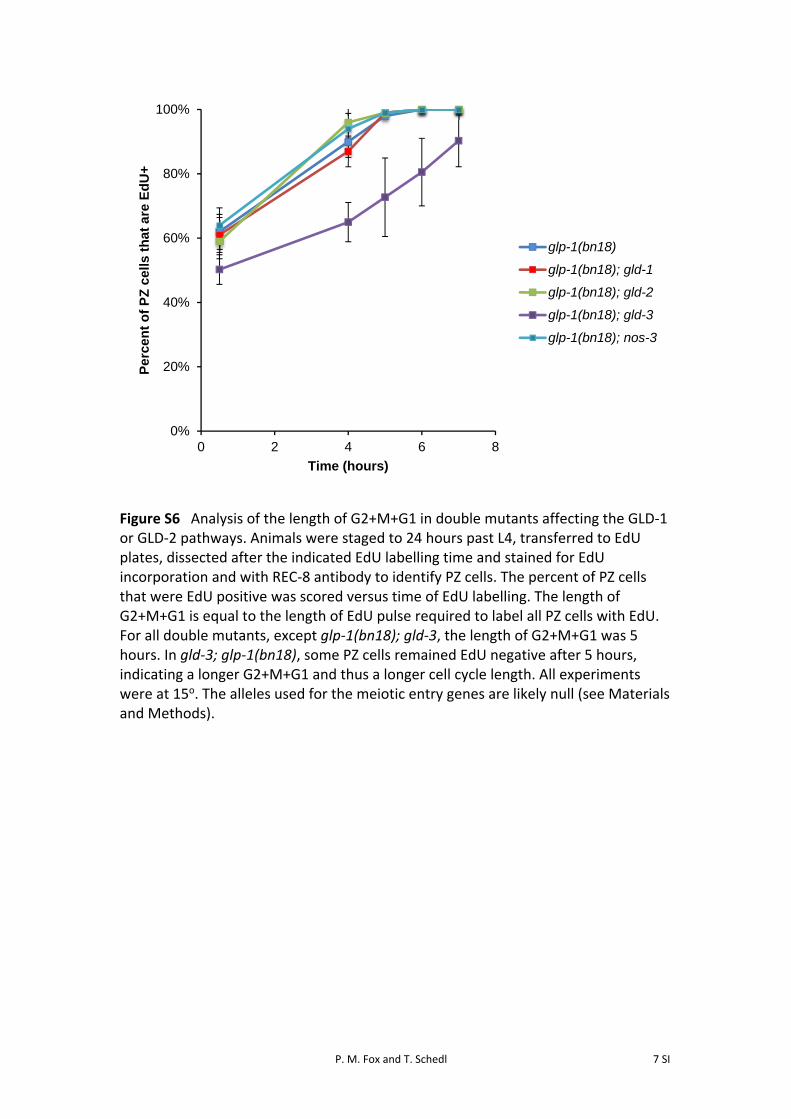
P. M. Fox and T. Schedl 7 SI
Figure S6 Analysis of the length of G2+M+G1 in double mutants affecting the GLD‐1 or GLD‐2 pathways. Animals were staged to 24 hours past L4, transferred to EdU plates, dissected after the indicated EdU labelling time and stained for EdU incorporation and with REC‐8 antibody to identify PZ cells. The percent of PZ cells that were EdU positive was scored versus time of EdU labelling. The length of G2+M+G1 is equal to the length of EdU pulse required to label all PZ cells with EdU. For all double mutants, except glp‐1(bn18); gld‐3, the length of G2+M+G1 was 5 hours. In gld‐3; glp‐1(bn18), some PZ cells remained EdU negative after 5 hours, indicating a longer G2+M+G1 and thus a longer cell cycle length. All experiments were at 15o. The alleles used for the meiotic entry genes are likely null (see Materials and Methods).
0%
20%
40%
60%
80%
100%
0 2 4 6 8
Per
cen
t o
f P
Z c
ells
th
at a
re E
dU
+
Time (hours)
glp-1(bn18)
glp-1(bn18); gld-1
glp-1(bn18); gld-2
glp-1(bn18); gld-3
glp-1(bn18); nos-3

8 SI P. M. Fox and T. Schedl
Figure S7 Models of proliferative zone dynamics in wild type at different temperatures and for the glp‐1(bn18) mutant at 15o. (A) Proliferative zone cells (green) can be assigned to three separate pools: a self renewal pool, final mitosis pool and meiotic S‐phase pool (see Discussion, Figure 10). Based on the model of proliferative zone dynamics presented in the Discussion, we assign predicted pool sizes for the adult wild type proliferative zone at 15°, 20° and 25° (B‐D) and glp‐1(bn18) mutant at 15° (E) based on the observed output and division rate. The observed output and division rate of wild type at 20° and 25° (C‐D) is based on Fox et al 2011.