analysis of failure mechanisms and hybrid effects in carbon - lirias
TRANSCRIPT
ANALYSIS OF FAILURE MECHANISMS AND HYBRID EFFECTS IN CARBON FIBRE REINFORCED THERMOPLASTIC COMPOSITES
Ichiro TAKETA
Dissertation presented in partial fulfilment of the requirements for the degree of Doctor of Engineering
March 2011
Supervisor: Prof. I. Verpoest Prof. S.V. Lomov Dr. L. Gorbatikh Members of the Examination Committee: Prof. P. Sas Prof. D. Vandepitte Prof. B. Verlinden Prof. M. Wevers Prof. J. Degrieck Prof. J. Takahashi

© 2009 Katholieke Universiteit Leuven, Groep Wetenschap & Technologie, Arenberg Doctoraatsschool, W. de Croylaan 6, 3001 Heverlee, België Alle rechten voorbehouden. Niets uit deze uitgave mag worden vermenigvuldigd en/of openbaar gemaakt worden door middel van druk, fotokopie, microfilm, elektronisch of op welke andere wijze ook zonder voorafgaandelijke schriftelijke toestemming van de uitgever. All rights reserved. No part of the publication may be reproduced in any form by print, photoprint, microfilm, electronic or any other means without written permission from the publisher. ISBN 978-94-6018-328-7 D/2011/7515/30
I
Preface
As an employee of Toray Industries, Inc. in Japan, I had an opportunity to go for my doctorate study abroad. I started my academic life at Katholieke Universiteit Leuven as a pre-doctoral student in June 2008 and enrolled in the PhD program in March 2009. I owe my deepest gratitude to my supervisor, Professor Ignaas Verpoest. All the procedures were new to me, but he always organized the appropriate courses for me with his strong leadership. I was attracted to Leuven in the first place by a favorable impression of his approach to “Process characterization.” His presentations at technical meetings and lectures always provided me with new insights. I am also grateful to my co-supervisor, Professor Stepan Lomov. He imparted his wide range of knowledge to me through lectures. I really respect his attitude of endeavouring to build up systematized theories in areas where engineers gave up quantitative characterization. I would like to thank my other co-supervisor, Dr. Larissa Gorbatikh. She kindly takes the first role of courteously correcting my manuscripts. Her scientific approaches differ from mine and stimulate me; she sincerely confronted experimental phenomena with her many theoretical methodologies. I appreciate Dr. Gehard Kalinka in Bundesanstalt für Materialforschung und -prüfung. He performed a series of technically difficult experiments that played an important role in this thesis. In addition, his kind explanation led to my comprehension of the quintessence behind the experiments. This thesis would not have been possible without Professor Tomonaga Okabe of Tohoku University. When I was struggling with various complicated problems related to composite materials as a company engineer and “missed the forest for the trees,” he clearly demonstrated that most of the phenomena could be explained using unified physical models. His educational attitude instilled many theoretical methodologies in me, including one related to the main subject of this thesis. These experiences laid the foundation for me becoming a researcher. Professor Masaaki Nishikawa of Tohoku University is a man of wisdom; he always gave me appropriate recognition as I asked questions. Professor Keiji Ogi of Ehime University and Professor Shigeki Yashiro of Shizuoka University constantly encouraged me from my company days. A part of their experimental results was kindly provided for this thesis. Professor Nobuo Takeda of the University of Tokyo led me to the research field of composite materials. He inspired me with the potential of carbon fibre reinforced plastics and dreams of all composite aircraft (actually realized). He was the godfather of “Experimental Micromechanics,” and I may catch a glimpse of its essence through this study. I would like to express my gratitude to the General Manager of the Composite Materials Research Laboratories, Dr. Akihiko Kitano. He provided me numerous opportunities to look

II
around outside my company and abroad from when I was first employed by the company. My stay in Leuven was planned for two years, but his arrangement enabled an extraordinary extension of five months. I respect his insight as a researcher to see through to the essence at a glance. Mr. Kenichi Yoshioka in the laboratories and Mr. Eisuke Wadahara in Soficar, my former supervisor, always supported me from afar, including material supplies. Talks with them always refocused me on what I should seek as a company researcher. My warm thanks are due to all of the staff members, technicians, and secretaries of the Department of Metallurgy and Materials. Since my work is based on experiments, I asked technicians for various support, from mold design to preparation for mechanical testing. Mr. Kris van de Staey and Mr. Bart Pelgrims were especially kind, guiding me and taking care of my work in the Big Hall. Mr. Danny Winnant spent a lot of time on my thermal analysis that needed to be performed under special conditions. I wish to thank the following companies who kindly provided up-to-date materials required for this thesis: Soficar; Toray Industries, Inc.; Jonam Composites, Ltd.; Ticona GmbH; and Propex Fabrics GmbH. I also wish to thank my students, Ms. Bettina Fabich, Mr. Yuxuan Hu and Mr. Michiel Van Coninckxloo. I had great fun working with them due to their positive attitudes towards their subjects. They even encouraged my work itself. I am indebted to my many colleagues in the Department and Toray who supported me. Mr. Jon Ustarroz, a former colleague, guided me, especially at the introduction of this study. My dear office mates, Ms. Lina Osorio, Mr. Eduardo Trujillo, Mr. Carlos Fuentes and Mr. Ngoc Tran, always produced a comfortable and friendly atmosphere. My colleagues in Toray, Mr. Nobuyuki Tomioka, Mr. Toshiya Kamae, Mr. Fumihiko Tanaka, Mr. Narumichi Sato, and Mr. Masahiro Hashimoto, discussed many scientific issues with me by e-mail, enhancing my motivation. Lastly, I owe my loving thanks to my wife Yasuko and my son Naoki who was born in Belgium during this study. Without her support, patience, and understanding and without his smile, it would have been impossible for me to finish this work. I dedicate this thesis to them. Leuven, Belgium, September 2010 Ichiro Taketa

III
Abstract
Carbon fibre reinforced polymer composites have become widely used in many engineering fields where high mechanical properties and light weight are required. In recent years, thermoplastic polymers have attracted a lot attention as matrix material due to the benefit of omitting the curing process, to a less hazardous chemical composition and to their better recyclability, in comparison with conventional thermoset resins. While short fibre systems have been widely applied for injection and compression moulding, continuous fibre systems are required in order to utilize the carbon fibre potential. Through this thesis, the important features of continuous carbon fibre reinforced thermoplastic composite are investigated. Useful indications for achieving further weight saving and mechanical improvement in future structural design are presented. This thesis studies two main subjects, failure mechanisms and novel hybrid designs of the continuous carbon fibre reinforced thermoplastic composites. First, the tensile failure of unidirectional laminates, which are basic constituents of composite materials, is investigated to reveal the potential of carbon fibre reinforced thermoplastic composites. Global mechanical properties (such as 0° and 90° tensile strength), and microscopic mechanical properties (such as work of adhesion, matrix modulus, matrix residual stress, interfacial shear strength and interlaminar fracture toughness in mode II) are experimentally evaluated. Comparison of various prepreg systems using the same carbon fibre illustrates the characteristics of semi-crystalline polymer matrices including polypropylene, polyamide 6 and polyphenylene sulfide and their interfaces with carbon fibre. In addition, the impact of process conditions related to matrix crystallinity on each mechanical property is evaluated. Constitutive models, which describe the failure mechanisms of unidirectional laminates, are constructed using existent techniques, and contributions of fibre and matrix/interface related parameters are clarified. In addition, explanations to fill the gap between experiment and prediction of tensile strength are presented. They are comprised of a revised carbon fibre strength distribution in the range of small fibre length, the decrease of the matrix shear yield stress under tension and the generation of splitting prior to final failure. As a conclusion, for the optimized tensile strength in the fibre direction, matrices having a good adhesion with carbon fibres and a high toughness such as PA6 and PEEK can be the best candidates for the CFRTP system. Process conditions do not have a strong influence on the tensile strength. On the contrary, the tensile strength in the transverse direction is mainly controlled by the matrix properties as well as the interface. Processing conditions, especially cooling rates, are fairly important here.
IV
Second, the tensile and impact properties of interply hybrids combining high modulus/strength carbon fibre reinforced polypropylene and tough self-reinforced polypropylene are studied. The hybrids achieve simultaneously high modulus/strength and excellent energy absorption under static tension. Further improvements in tensile properties are, in principle, possible as a result of the accumulation of compressive residual stresses in carbon fibre reinforced polypropylene induced by shrinkage of self-reinforced polypropylene during hot compaction. However, the study shows that this strategy brings little improvement of the properties. A synergy effect is observed in the initial modulus increase of self-reinforced polypropylene, which is induced by the suppression of its Poisson contraction by the carbon fibres. Furthermore, improvement of the Izod impact strength is achieved by changing the amount of tough self-reinforced polypropylene in the hybrids and with a modification of the interlayer. However in the Izod impact test, the compression side is always critical due to the extremely low compressive strength of the polypropylene matrix composite. To utilize the material potential of the hybrids in terms of energy absorption, an appropriate design for the structure subjected to tension, not to flexure, is required.

V
List of abbreviations
0 0º carbon fibre prepreg 90 90º carbon fibre prepreg 2D Two dimensional 3D Three dimensional AFP Automatic fibre placement ASTM American society for testing and materials B.C. Boundary condition CF Carbon fibre CFRP Carbon fibre reinforced plastics CFRPP Carbon fibre reinforced polypropylene CFRTP Carbon fibre reinforced thermoplastics CTE Coefficient of thermal expansion CV Coefficient of variance DSC Differential scanning calorimetry DMTA Dynamic mechanical thermal analysis ENF End notched flexure FEM Finite element model GF Glass fibre GFRP Glass fibre reinforced plastics GLS Global load sharing HVD Hedgepeth and Van Dyke IFSS Interfacial shear strength ISO International Standards Organization JIS Japanese industrial standards LLS Local load sharing PA12 Polyamide 12 PA6 Polyamide 6 PAN Polyacrylonitryl PEEK Polyether ether ketone PET Polyethylene terephthalate PP Polypropylene PPS Polyphenylene sulfide PSF Polysulfone S Self-reinforced polypropylene woven sheet

VI
St Self-reinforced polypropylene tape SEM Scanning electron microscope, spring element model SRPP Self-reinforced polypropylene VaRTM Vacuum assisted resin transfer moulding
VII
List of symbols
A Composite cross-section area Av Interface area between matrix and reinforcements a Cluster cross-section area, distance variant, thickness of SRPP a1, a2 Distance variant a0 Initial crack length ac Propagated crack length aiN Izod impact strength (notched, edgewise) aiU Izod impact strength (unnotched, flatwise) b Thickness of CFRPP, width bN Width removing notch height C0 Compliance of initial slope C1 Constants for permeability Cc Compliance at critical load Cm matrix modulus for squared strain c Constants for permeability, distance between CFRPP surface and neutral axis D Discounting factor d Shortest distance between fibres E0 Young’s modulus of 0º unidirectional composite E1 Young’s modulus E2 Transverse modulus in thickness direction E90 Young’s modulus of 90º unidirectional composite Ea Young’s modulus of SRPP Eb Young’s modulus of CFRPP Ef Fibre Young’s modulus EfL Fibre modulus in longitudinal direction EfN Flexural modulus of notched coupon in edgewise direction EfT Fibre modulus in transverse direction EfU Flexural modulus of unnotched coupon in flatwise direction EHY Young’s modulus of hybrid composite EHY1, EHY2, EHY3 Young’s modulus of Hybrid 1, 2 and 3 Ei Young’s modulus of i layer EL Composite Young’s modulus in longitudinal direction Em Matrix Young’s modulus

VIII
ES Young’s modulus of SRPP EI Flexural rigidity F Applied load Fi Crack initiation load Fmax Maximum load Fp Crack propagation load g Function G Effective matrix shear modulus, energy release rate for splitting growth G12 Out-plane shear modulus GIIc Interlaminar fracture toughness in mode II GIIci Interlaminar fracture toughness in mode II for initiation GIIcp Interlaminar fracture toughness in mode II for propagation Gc Shear fracture toughness against splitting growth Gm Matrix shear modulus h Height, thickness hi Thickness of i layer I Bending moment of inertia of coupon Ii Bending moment of inertia of i layer J2 Second stress invariant K Coefficient of permeability KL Coefficient of permeability of unidirectionally arrayed fibres in longitudinal direction KT Coefficient of permeability of unidirectionally arrayed fibres in transverse direction L Span length, projected length, Model length L0 Span length when determining Weibull parameters LB Span length of dry bundle l Fibre spring length, coupon length, representative length lf Push-out length li Foil insert length lz Model length in longitudinal direction m Weibull modulus N Number of tests Nb Number of broken fibre spring elements NL Number of fibre spring elements Ns Number of fibre spring elements in 2δ NT Number of matrix shear spring elements Nx Number of model fibre in x axis Nx Number of model fibre in y axis Nx Number of model split in longitudinal direction
IX
n Number of links, number of layers P Probability P0 Injection pressure Pa Pressure inside of reinforcements Pf Fibre failure probability Pf Interface failure probability p Unit link failure probability Q Total discharge of polymer q Flow velocity R1 Radius of loading nose R2 Radius of support r Axis fibre radius direction rf Fibre radius S Shear load s Circumference of cluster area Tc Crystallization temperature under cooling Tm Melting temperature t Thickness of coupon, time t90 Thickness of 90º CFRPP ts Thickness of SRPP U0 Total strain energy of 0º CFRPP U1, U2 Strain energy in certain region U90 Total strain energy of 90º CFRPP UHY1, UHY2, UHY3 Total strain energy of Hybrid 1, 2 or 3 UHY1i, UHY3i Strain energy of Hybrid 1 or 3 at failure strain of 0º CFRPP US Total strain energy of SRPP USi Strain energy of SRPP at failure strain of 0º CFRPP u Side of debonding line, deformation VCFRPP Volume fraction of carbon fibre reinforced polypropylene Vf Volume fraction of fibre (carbon fibre) Vfmax Theoretically maximum faction of fibre v Distance between fibre centres W Izod input work by hummer Wa Thermodynamic work of adhesion Wf Weight fraction of fibre w Width of coupon x Axis in compression moulding y Axis in curvature direction, axis in thickness direction yi_l Distance from neutral axis to lower position of layer yi_u Distance from neutral axis to upper position of layer

X
z Axis in longitudinal direction α Scaling parameter α90 Coefficient of thermal expansion of 90º unidirectional composite αfT Coefficient of thermal expansion of fibre in transverse direction αm Coefficient of thermal expansion of matrix β Scaling parameter γf Surface tension (energy) of fibre γf
d Surface tension (energy) of fibre in dispersive component γf
p Surface tension (energy) of fibre in polar component γm Surface tension (energy) of matrix γm
d Surface tension (energy) of matrix in dispersive component γm
p Surface tension (energy) of matrix in polar component ΔPγ Capillary pressure ΔT Temperature difference between crystallization temperature and room temperature δ Ineffective length ε0
* Failure strain of 0º CFRPP ε90
* Failure strain of 90º CFRPP εHY
* Strain at maximum stress of hybrid composite εHY1
*, εHY2*, εHY3
* Strain at maximum stress of Hybrid 1, 2 and 3 εL Composite strain in longitudinal direction εS
* Failure strain of SRPP θ Wetting angle λ Holding rate of composite modulus μ Viscosity ν0 Poisson ratio of 0º unidirectional composite ν90 Poisson ratio of 90º unidirectional composite νfTT Poisson ratio of fibre in transverse direction νm Poisson ratio of matrix νS Poisson ratio of SRPP ρ Curvature of unbalanced laminate σ Axial fibre stress, applied pressure σ0 Weibull scaling parameter σ0
* Strength of 0º CFRPP σ1 Stress parameter for Curtin’s GLS model, axial stress σ11 Matrix stress in fibre direction σ2 Transverse stress in thickness direction σ90 Residual stress of 90º unidirectional composite σ90
* Strength of 90º CFRPP σav Fibre average stress in broken fibre
XI
σB* Dry bundle strength
σf Fibre stress (intact) σf
* Fibre strength σGLS Composite stress in longitudinal direction predicted from GLS model σHY
* Maximum stress of hybrid composite σHY1
*, σHY2*, σHY3
* Maximum stress of Hybrid 1, 2 and 3 σL Composite stress in longitudinal direction σL
* Composite strength in longitudinal direction σm Matrix residual stress σr Fibre average recovery stress in broken fibre, residual stress in SRPP σr_HY
* Strength improvement of hybrid composite by residual stress of SRPP σS
* Strength of SRPP σSi Stress of SRPP at the failure strain of 0º CFRPP σy Von Mises yield stress τ0 Weibull scaling parameter for interfacial shear strength τ12 Matrix shear stress, out-plane shear stress τy Decreasing matrix shear yield stress τy Matrix shear yield stress (interfacial shear strength) χ Critical cluster geometry ÑP Pressure gradient <L> Representative distance between breakage and bundle centre Γ Gamma function f Force K90 Stiffness matrix of 90º CFRPP KHY2 Stiffness matrix of Hybrid 2 KL Stiffness matrix of fibre spring element KS Stiffness matrix of SRPP KT Stiffness matrix of matrix shear spring element u Displacement
XII
Table of contents
Preface…………………………………………………………………………………….... Abstract…………………………………………………………………………………….. List of abbreviations……………………………………………………………………….. List of symbols……………………………………………………………………………... Table of contents…………………………………………………………………………… Chapter 1 Introduction…………………………………………………….....
1.1 General introduction…………………………………………………………………... 1.2 Literature review………………………………………………………………………
1.2.1 Manufacturing……………………………………………………………………. 1.2.2 Thermoplastic polymer…………………………………………………………… 1.2.3 Carbon fibre………………………………………………………………………. 1.2.4 Unidirectional composite…………………………………………………………. 1.2.5 Self-reinforced polypropylene composite………...………………………………. 1.2.6 Hybrid effect………………………………………………………………………
1.3 Problem statement……………………………………………………………………… Chapter 2 Failure mechanisms in carbon fibre reinforced
thermoplastic composites………………………………………... 2.1 Introduction……………………………………………………………………………… 2.2 Materials………………………………………………………………………………. 2.3 Fabrication…………………………………………………………………………….. 2.4 Tensile properties of unidirectional composites………………………………………….
2.4.1 0° tensile strength…………………………………………………………………… 2.4.2 90° tensile strength…………………………………………………………………..
2.5 Characterization of matrix and interface……………………………………………… 2.5.1 Work of adhesion……………………………………………………………………. 2.5.2 Matrix modulus……………………………………………………………………… 2.5.3 Matrix residual stress……………………………………………………………... 2.5.4 Interfacial shear strength………………………………………………………..... 2.5.5 Interlaminar fracture toughness in mode II……………………………………….
2.6 Constitutive models predicting 0° tensile strength…………………………………… 2.6.1 Modelling principles………………………………………………………………. 2.6.2 Global load sharing model………………………………………………………...
I III V
VII XII
1 1 2 3 8
13 19 34 37 38
40 40 41 46 51 51 64 71 71 73 76 83 92
101 101 104
XIII
2.6.3 Local load sharing model………………………………………………………… 2.6.4 Parametric study………………………………………………………………….. 2.6.5 Comparison between experiment and prediction…………………………………
2.7 Mechanisms explaining the gap between experiment and prediction….……………... 2.7.1 Scaling effect on Weibull distribution.…………………………………………….. 2.7.2 Decrease of matrix shear yield stress………………………..……………………. 2.7.3 Dispersed failure…………………………………………………………………..
2.8 Conclusion………........……………………………………………………………… Chapter 3 Hybrid effects in carbon fibre reinforced polypropylene
combined with self-reinforced polypropylene………………….. 3.1 Introduction…………………………………………………………………………… 3.2 Materials………………………………………………………………………………. 3.3 Fabrication…………………………………………………………………………….. 3.4 Characterization of self-reinforced polypropylene……………………………………
3.4.1 Visco-elastic behaviour…………………………………………………………… 3.4.2 Tensile properties…………………………………………………………………. 3.4.3 Residual stress…………………………………………………………………….
3.5 Tensile properties of hybrid composites………………………………………………. 3.5.1 First demonstrations……………………………………………………………… 3.5.2 Second demonstrations……………………………………………………………
3.6 Impact strength of hybrid composites………………………………………………… 3.6.1 Izod testing……………………………………………………………………….. 3.6.2 Edgewise impact with notched laminates………………………………………… 3.6.3 Flatwise impact with unnotched laminates……………………………………….. 3.6.4 Strength improvement…………………………………………………………….
3.7 Conclusion…………….……………………………………………………………… Chapter 4 General conclusion……………………………………………….. References……………………………………………………………………….…………... Curriculum vitae…………………………………………………………………………… List of Publications…………………………………………………………………….…
107 109 116 119 120 127 131 143
150 150 151 156 157 157 161 163 167 167 172 182 182 185 192 197 200
203
209 220 221
1
Chapter 1
Introduction
1.1 General introduction Carbon fibre reinforced polymer composites (CFRP) have become distributed in many engineering fields where high mechanical properties and light weight are required. Conventionally, epoxy or other thermoset resins were chosen as matrix polymer. However in recent years, thermoplastic polymers have attracted a lot attention as matrix material due to the benefit of omitting the curing process, to a less hazardous chemical composition and to its better recyclability. While short fibre systems are widely applied for injection and compression moulding, continuous fibre systems are needed in order to utilize the full carbon fibre (CF) potential, and to achieve further weight saving and mechanical improvement in structural design. This research focuses on the mechanical properties of continuous carbon fibre reinforced thermoplastic composites (CFRTP). Unidirectional laminates, basic constituents of composite materials, are investigated to clarify the connection between the global properties and the microscopic mechanical features, especially related to matrix and interface, which are strongly influenced by the process conditions. The study reveals the dominant factors affecting the global composite properties, that are critical for the future material development.
2
Among various thermoplastic polymers, polypropylene (PP) is preferably used in automobile industries, especially for its outstanding low density. Carbon fibre reinforced polypropylene (CFRPP), the combination of high stiffness/strength CF and light weight PP has a possibility to achieve high specific stiffness and strength. Moreover, highly oriented PP is known to exhibit much higher mechanical properties including extraordinarily high impact resistance compared to isotropic PP. The CF composites combined with not only simply PP but also highly oriented PP may compensate the brittleness of CF or may demonstrate synergistic effects. This research uses self-reinforced polypropylene (SRPP), which is solely made of PP but reinforced by highly oriented PP, and investigates the hybrid composites of CFRPP and SRPP. This thesis is mainly constituted of two subjects corresponding to Chapter 2 and 3. Chapter 2 focuses on the micromechanics of unidirectional laminates of CFRTP. Global tensile strength and microscopic mechanical properties are experimentally characterized under various process conditions. Moreover, several models to predict the tensile strength are proposed. Chapter 3 addresses the characteristics of SRPP as well as the tensile and impact properties of its hybrid composites with CFRPP. In addition, Chapter 1 reviews the literature related to the materials and theories used in this study, and Chapter 4 summarizes the scientific outputs from these investigations. 1.2 Literature review The subjects of this research are continuous CFRTP as introduced in the previous section. Even though the mechanical properties of the continuous CFRTP are attractive, it is not widely used. This may be because of the difficulties associated with the manufacturing process, especially impregnation. Subsection 1.2.1 introduces the theories and problems of the CFRTP manufacturing. While thermoplastic polymers have not been often used as a partner of CF, few reports investigate matrix and interface features in CFRTP. Subsection 1.2.2 illustrates examples of microscopic mechanical properties on matrix and interface, which are strongly related to global tensile strength. The CF is a very special reinforcement in the aspects of stiffness response and strength distribution. Without knowing these features, micromechanics of CFRTP cannot be explored. Subsection 1.2.3 describes the characteristics of CF. Unidirectional laminate is the basic constitution of composite materials and its tensile strength identifies the material potential. Subsection 1.2.4 reviews the current studies of modelling tensile failure of unidirectional laminates. Then, as a constituent of the hybrid concept, Subsection 1.2.5 introduces how to produce SRPP and its characteristics. Subsection 1.2.6 illustrates the conventional studies about the hybrid effect.
3
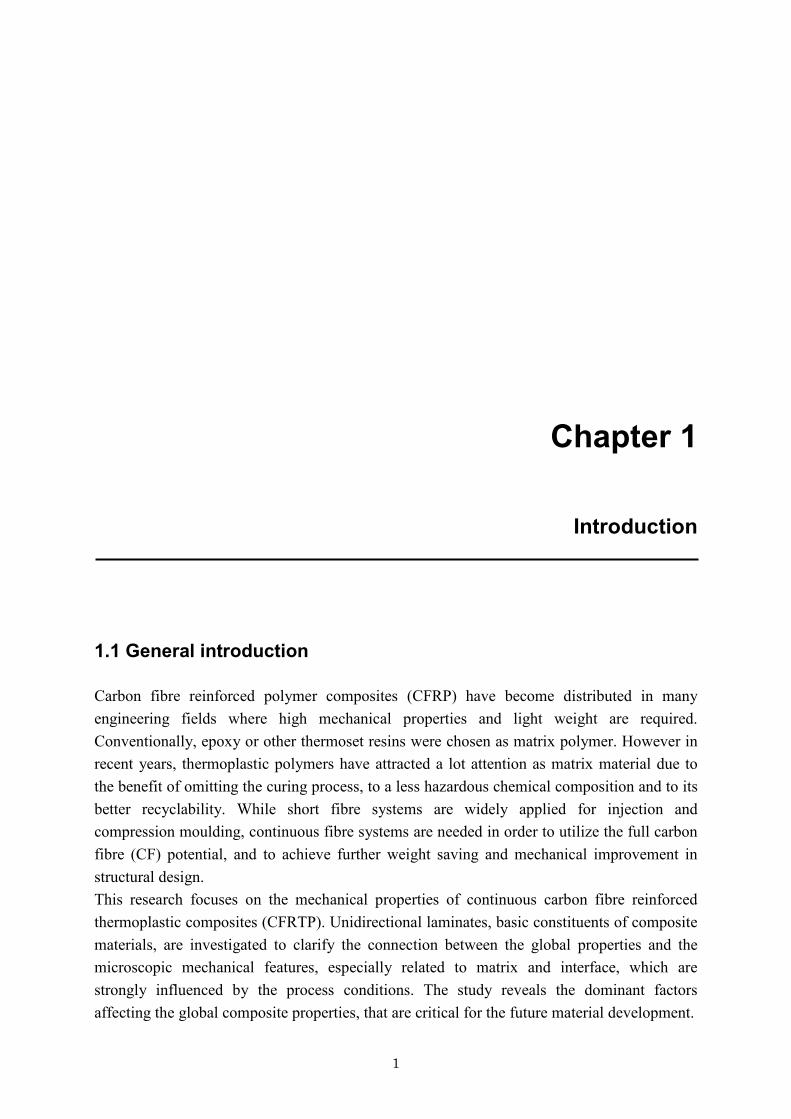
1.2.1 Manufacturing Thermoplastic composites are not easy to make because of the difficult impregnation of continuous fibre tows. Fig.1-1 illustrates the cross-section of carbon fibre woven fabric impregnated with polypropylene (PP) using a film stacking method [1]. A non-impregnated area appears at the centre part of the yarns because viscous PP cannot reach this area.
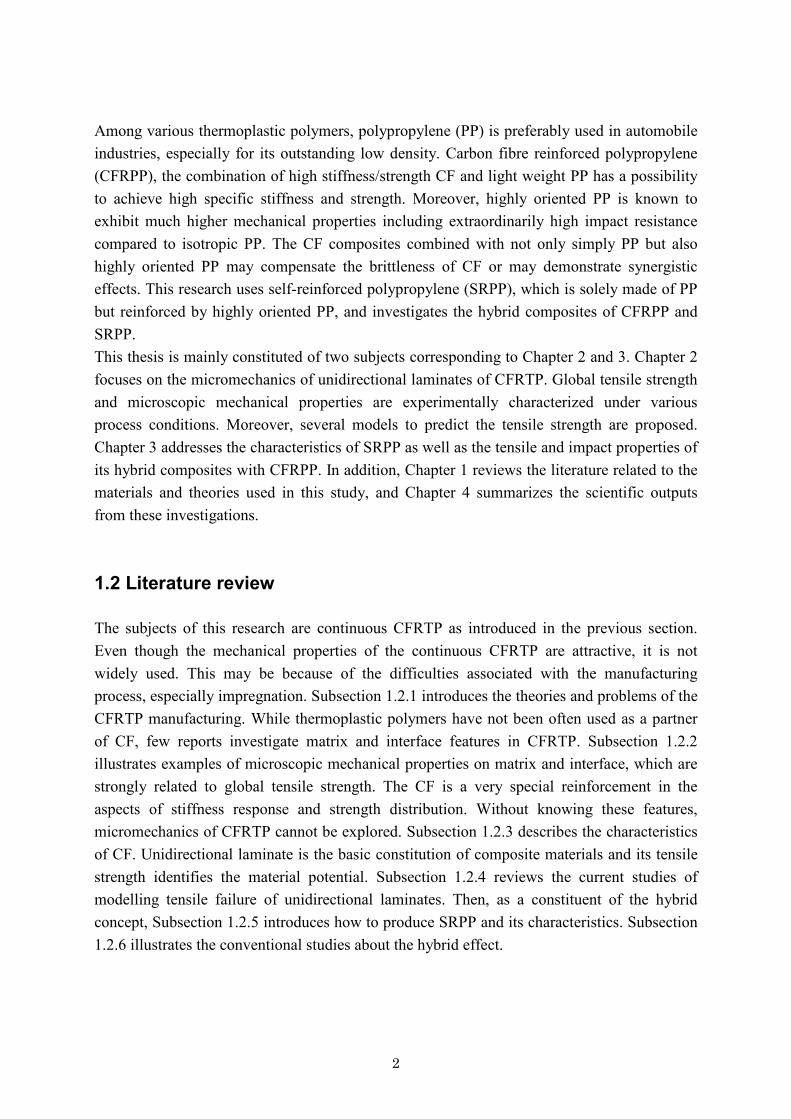
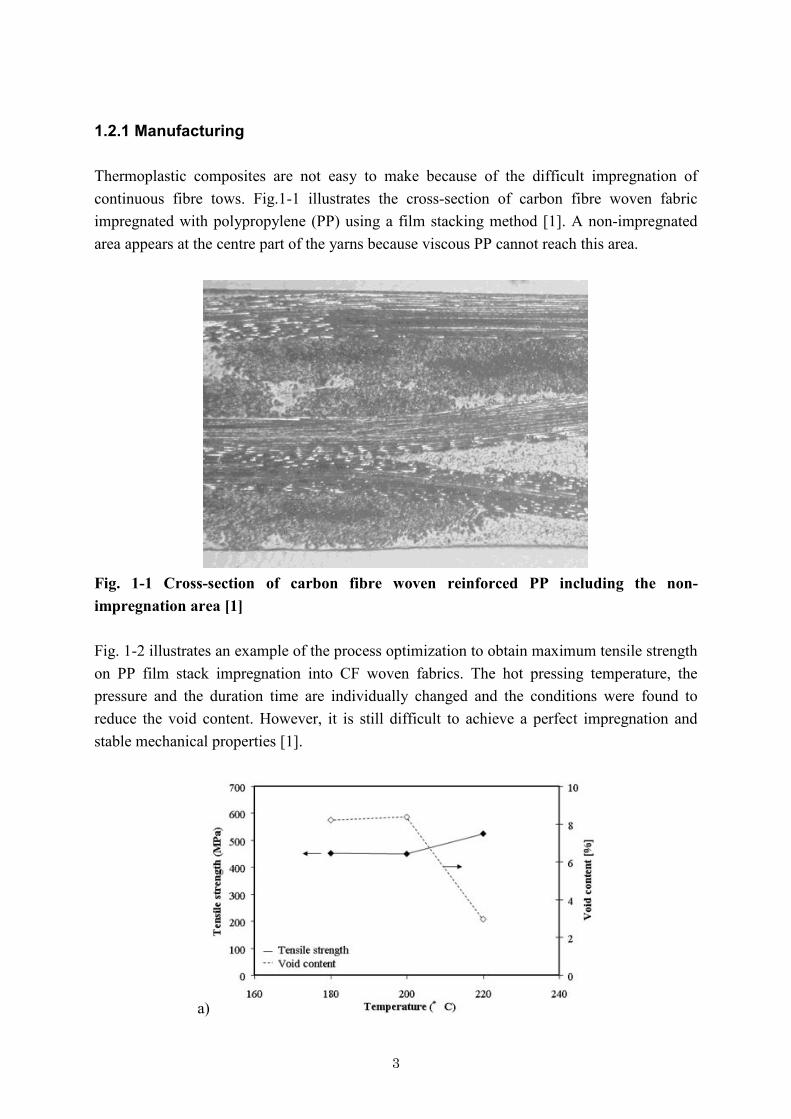
Fig. 1-1 Cross-section of carbon fibre woven reinforced PP including the non-impregnation area [1] Fig. 1-2 illustrates an example of the process optimization to obtain maximum tensile strength on PP film stack impregnation into CF woven fabrics. The hot pressing temperature, the pressure and the duration time are individually changed and the conditions were found to reduce the void content. However, it is still difficult to achieve a perfect impregnation and stable mechanical properties [1].
a)
4
b)
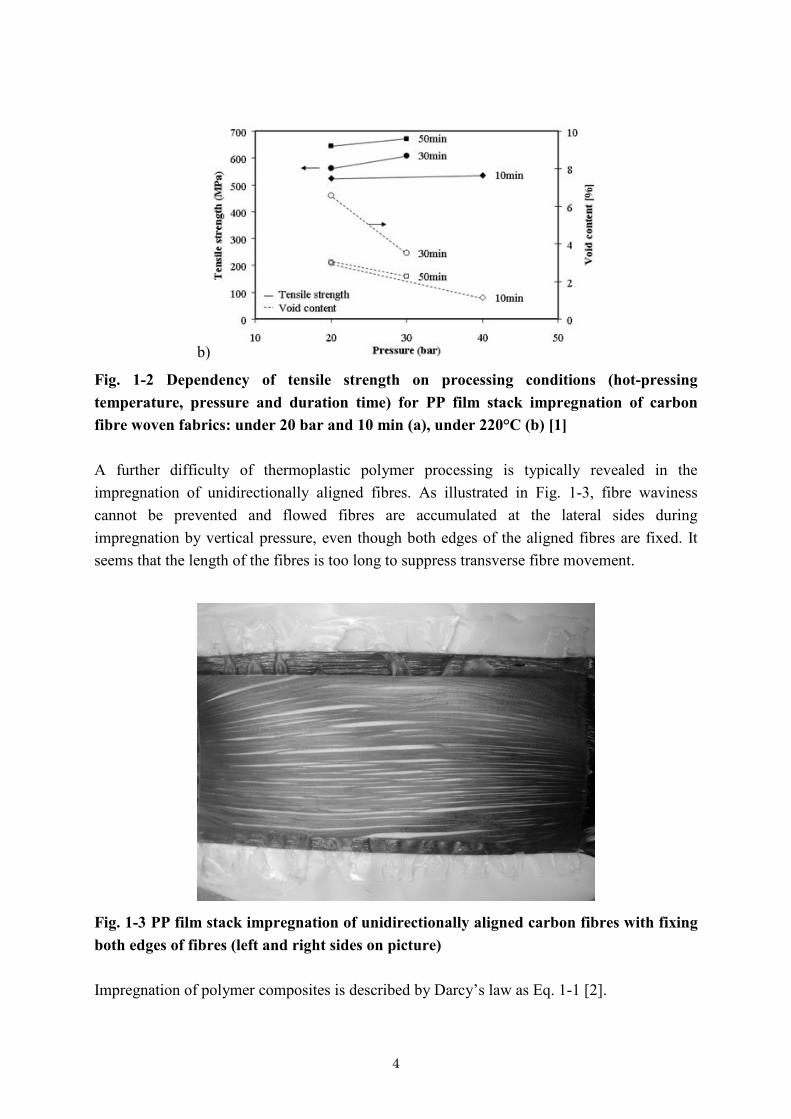
Fig. 1-2 Dependency of tensile strength on processing conditions (hot-pressing temperature, pressure and duration time) for PP film stack impregnation of carbon fibre woven fabrics: under 20 bar and 10 min (a), under 220°C (b) [1] A further difficulty of thermoplastic polymer processing is typically revealed in the impregnation of unidirectionally aligned fibres. As illustrated in Fig. 1-3, fibre waviness cannot be prevented and flowed fibres are accumulated at the lateral sides during impregnation by vertical pressure, even though both edges of the aligned fibres are fixed. It seems that the length of the fibres is too long to suppress transverse fibre movement.
Fig. 1-3 PP film stack impregnation of unidirectionally aligned carbon fibres with fixing both edges of fibres (left and right sides on picture) Impregnation of polymer composites is described by Darcy’s law as Eq. 1-1 [2].

5
PKq Ñ-=m
(1-1)
The flow velocity q is proportional to the pressure gradient ÑP and inversely proportional to the viscosity μ. K denotes the coefficient of permeability. The total volume of polymer Q which is impregnated into the reinforcements can be expressed by the flow velocity q times the time t. Longer flow distance requires a higher Q and hence more time, while diffusion routes such as simple rectangular flow or radial flow strongly influences the impregnation time according to conservation of polymer mass. Fig. 1-4 summarizes viscosities for various materials [3]. This reveals how difficult it is to impregnate with a thermoplastic polymer; thermoplastic polymer has 3 to 5 order of magnitude higher viscosity than thermoset resins during infiltration.
Fig. 1-4 Viscosities of various materials [3] Thepermeability coefficient K can be identified only from the package state of the fibres. Solving the flow through a fibre array with the Navier-Stokes equation, the coefficients of permeability of unidirectionally aligned fibres in longitudinal direction KL and in transverse direction KT are analytically expressed with Eq. 1-2 and 3, respectively [4].
( )2
32 18
f
ffL V
Vcr
K-
= (1-2)

6
2
2/5
max1 1 f
f
fT r
VV
CK÷÷
ø
ö
çç
è
æ-= (1-3)
rf is the fibre radius, Vf is the volume fraction of fibre, Vfmax is the theoretically maximum volume fraction of fibre, c and C1 are constants. Both coefficients of permeability are proportional to rf
2, hence smaller fibre radius dramatically reduces the impregnation velocity. The diameter of CF for structural usage is about 3 to 7 μm; it is smaller than that of the other reinforcements such as glass fibres (GF), making impregnation more difficult even under the same Vf. Moreover, fibre waviness may be increased due to the small bending moment of inertia of the fibre. In addition, the coefficient of permeability in the transverse direction is lower than that in the longitudinal direction. The high flow resistance in the transverse dirction enhances the fibre waviness. Since higher Vf reduces the permeability as indicated in Eq. 1-2 and 3, mechanical properties and processability are in a trade-off relation. Not only Darcy’s law but also wettability may influence the impregnation. As illustrated in Fig. 1-5 [3], the capillary pressure ΔPγ is needed to wet the fibre surface and it reduces the pressure gradient between injection P0 and inside reinforcements Pa.
Fig. 1-5 Schematic of a capillary pressure drop at the flow front [3] The capillary pressure ΔPγ can be described as in Eq. 1-4 [3],
)1(cos
f
mv
VAP
-=D
qgg (1-4)
where Av is the interface area between matrix and reinforcements, γm is the surface tension of the matrix and θ is the wetting angle. Fig. 1-6 summarizes γm for various matrices [3].

7
Fig. 1-6 Surface tension values of various matrices [3] In Eq. 1-4, ΔPγ > 0 indicates a non-wetting system, whereas ΔPγ < 0 indicates a wetting system. Knowing that cos θ is generally close to one, the surface tension of the liquid matrix therefore provides a measure of the potential magnitude of the capillary pressure drop [3]. Due to the large surface tension of metals, metal matrices require huge capillary pressure to wet the fibre surface, typically in the MPa order. On the contrary, polymers require up to kPa [3]. Most of thermoplastic polymer impregnation applies high pressure typically in the MPa order, while thermoset polymers often can be impregnated by vacuum only, resulting in a pressure gradient up to 0.1 MPa. Therefore, the capillary pressure can be disregarded in CFRTP impregnation. Another key issue for thermoplastic impregnation is the compaction of the reinforcements leading to a higher Vf. Fig. 1-7 schematizes the impregnation procedure under compression; reinforcements are compacted at the beginning of impregnation, then the matrix gradually impregnates inside the reinforcements with spring back of the reinforcements [5].
Fig. 1-7 Schematic of impregnation procedure under compression [5]

8
To design the impregnation process, a reinforcement compaction test is performed to obtain the relation between spring back stress and Vf [6]. Then the relation is combined with Darcy’s law and mass conservation law, finally a constitutive equation to describe the impregnation under compression is deduced [7]. Higher pressure is not always the solution because it causes significantly higher Vf of reinforcements and sometimes leads to fibre waviness. High performance CFRTP requires high Vf. This directly reduces the coefficient of permeability K. Generally, CF diameter is smaller than the other reinforcement. This also results in lower K. In addition, thermoplastic polymers intrinsically have higher viscosity μ than thermoset resins. As a conclusion, it can be stated that not only mechanical properties themselves but also difficulties in processing might delay the increased use of CFRTP. New strategies for thermoplastic impregnation, like in-situ polymerization [8-10] and commingled yarns [11-14] have been recently proposed as a solution to the described issues. The in-situ polymerization has the benefit of reducing the viscosity during impregnation by using monomers or oligomers. However, the polymerization takes a relatively long time, which makes it difficult to be applied to continuous processes, such as prepreging; the usage is limited at this moment to batch processes such as vacuum assisted resin transfer moulding (VaRTM). In addition, more developments are required to guarantee uniform properties. Commingled yarns have the benefit of reducing the impregnation distance. However, it is difficult to combine thermoplastic fibre with CF which easily causes fuzz. Furthermore, fibres tend to disturb the alignment during the drafting process, reducing their mechanical properties. Since the aim of using continuous CF is to obtain high performance, a unidirectional prepreg would be the mainstream of continuous CFRTP preforms. The fact that automatic fibre placement (AFP) becomes a popular technique in aircraft industry may support the increasing use of unidirectional CFRTP prepreg. In summary, the impregnation process of continuous CFRTP for structural usage easily causes voids, non-impregnated areas and fibre waviness. The reasons are the high Vf needed from the design requirements or from preform compaction by vertical pressure, the small CF diameter and the high viscosity of the thermoplastics. The wettability is not significant for the CFRTP impregnation. In order not to lose the mechanical properties, the prevention of fibre waviness would be the key of CFRTP impregnation. 1.2.2 Thermoplastic polymer The general specifications of thermoplastic polymers, which are often combined with CF, are shown in Table 1-1[15]. Epoxy resins HexPlyTM M10 and F593 (Hexcel) are also added for comparison [16]. Tg, Tm and CTE denote the glass transition temperature, the melting temperature and the coefficient of thermal expansion, respectively.

9
Table 1-1 Specifications of thermoplastic polymers: polypropylene (PP), thermoplastic polyurethane (TPU), polyamide 12 (PA12), polyamide 6 (PA6), polyetherimide (PEI), polyphenylene sulfide (PPS), polyether ether ketone (PEEK) [15] and epoxy resins from Hexcel [16]
T g T m Density CTEModulus Strength Failure strain
(ºC) (ºC) (g/cm3) (10-6/K) (Gpa) (MPa) (%)PP -20 165 0.90-0.91 81-100 1.15-1.57 31.0-41.9 100-600TPU amorphous 1.20-1.22 62-76 1.33-2.17 49.6-69.6 60-180PA12 190 1.01-1.02 61-100 0.25-1.40 35.2-69.9 120-350PA6 60 220 1.12-1.14 50-83 2.65-3.25 41.4-167.6 20-100PEI 215 amorphous 1.26-1.27 47-56 2.72-4.02 62.1-150.2 5-90PPS 90 285 1.34-1.35 27-49 3.28-3.42 48.3-87.3 1-4PEEK 145 335 1.30-1.32 40-47 3.63 70.3-104.8 15-30EpoxyHexPlyTM M10 110-135 1.2 3.2 85 3.75HexPlyTM F593 172 1.22 2.96 60.4 2
MatrixTensile properties
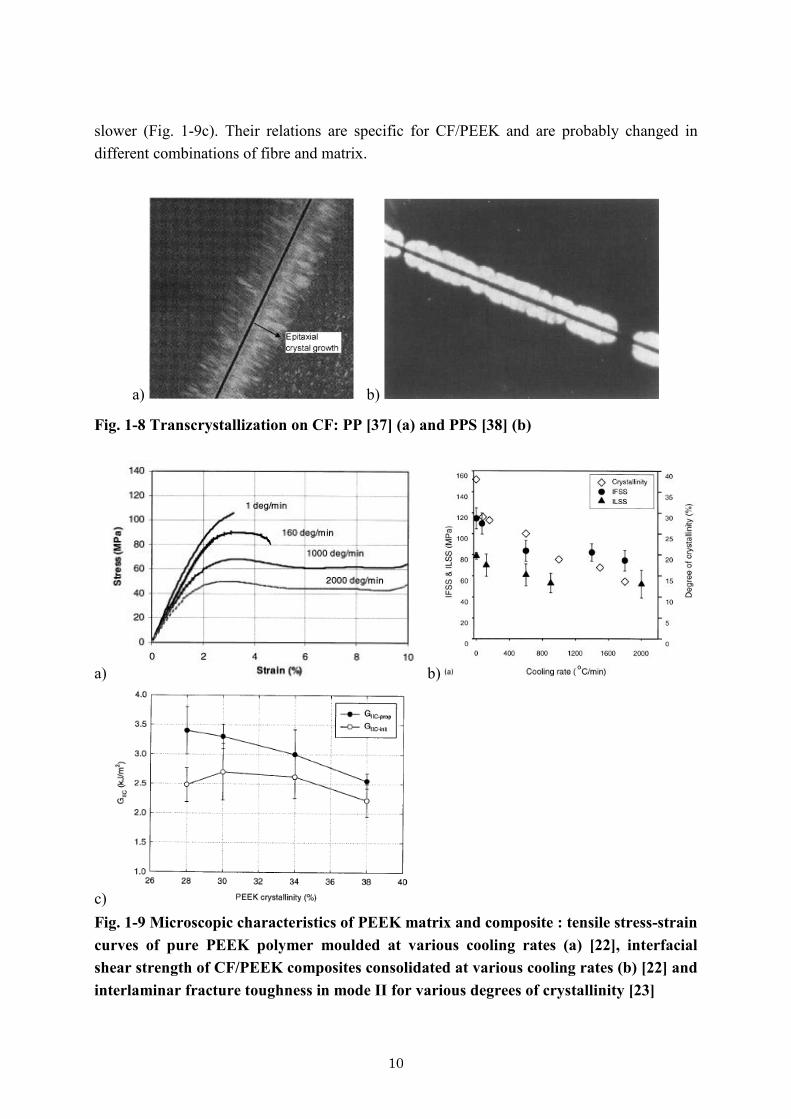
Most of research using commodity polymers such as PP and PA6 is performed in short fibre composites, especially for injection moulding [17-19]. On the contrary, PEEK in combination with continuous CF was widely investigated [20-23] because PEEK had been a final candidate to compete with epoxy resin as the matrix source for aircraft structures. Recently, investigations about PPS [24-28] have increased because continuous CF woven/PPS laminates were certificated for use in commercial aircraft primary structures after long time and patient developments. As listed in Table 1-1, most of the polymers used together with CF are semi-crystalline thermoplastics. They are known to have better mechanical properties and thermal stability than amorphous ones. Semi-crystalline thermoplastics tend to induce transcrystallization from nucleation sites on the fibre. The crystallinity is known to influence the properties of the interface [29-36]. For example, a single fibre is embedded into polymer to characterize transcrystallization. Fig. 1-8 illustrates the crystal growth of PP [37] and PPS [38] around a CF observed by polarization microscope. Most of the research suggests that the trancrystallization improves interfacial strength [30, 32, 33, 35] although the influences are strongly dependent on the combination of fibre and matrix. Crystal growth around fibre arrays is difficult to observe; existence of a number of fibres may change the direction, size and degree of crystallinity. The crystallinity is strongly affected by the process conditions. Especially the cooling rate dramatically changes the matrix/interface mechanical properties. The results of a study on CF/PEEK composite are illustrated in Fig. 1-9 [22, 23]. Slower cooling rate, which leads to higher crystallinity, makes PEEK polymer stiffer and more brittle (Fig. 1-9a). The interfacial shear strength increases as the cooling rate becomes slower (Fig. 1-9b), but shear interlaminar fracture toughness in Mode II decreases as crystallinity goes up, namely cooling rate becomes
10
slower (Fig. 1-9c). Their relations are specific for CF/PEEK and are probably changed in different combinations of fibre and matrix.
a) b)
Fig. 1-8 Transcrystallization on CF: PP [37] (a) and PPS [38] (b)
a) b)
c) Fig. 1-9 Microscopic characteristics of PEEK matrix and composite : tensile stress-strain curves of pure PEEK polymer moulded at various cooling rates (a) [22], interfacial shear strength of CF/PEEK composites consolidated at various cooling rates (b) [22] and interlaminar fracture toughness in mode II for various degrees of crystallinity [23]

11
The cooling rate also influences the matrix residual stress in a composite. Fig. 1-10 compares polymer volume during heating and cooling between amorphous and semi-crystalline thermoplastics [39]. In the case of the amorphous thermoplastics, temperature drop simply leads to volumetric shrinkage. On the contrary, in the case of the semi-crystalline thermoplastics, not only temperature drop but also densification upon crystallisation causes intensive shrinkage. Therefore, the matrix residual stress is more significant in the semi-crystalline thermoplastic composite than in the amorphous one. In the amorphous phase, faster cooling accelerates shrinkage as well as residual stress [40]. In the crystal phase, faster cooling brings lower crystallization temperature [40-42]. Since the residual stress accumulates below the crystallization temperature, faster cooling generates lower residual stress. Semi-crystalline polymers include both phases. Consequently, the relation between residual stress and cooling rate is different for each polymer system [43].
Fig. 1-10 Change in volume of polysulfone (PSF) amorphous polymer and polyethylene terephthalate (PET) semi-crystalline polymer during heating and cooling In combinations of CF with a thermoplastic matrix, chemical interaction is more difficult than with a thermoset matrix. Thus, stress transfer mechanisms are roughly divided into thermodynamic work of adhesion and mechanical interlocking. The former can be calculated from the surface tension (energy) of fibre and matrix [44]. However, this cannot be connected to mechanical interfacial properties quantitatively. Therefore, the two mechanisms cannot be

12
fairly compared, unfortunately. Qualitatively, the work of adhesion and the interfacial shear strength are compared in Fig. 1-11 [44].
Fig. 1-11 Relation between interfacial shear strength τIFSS and thermodynamic work of adhesion Wa
x (higher values indicate good adhesion) for CF/epoxy system: x = g and h indicate different methods to predict Wa [44] On the contrary, some researchers suggest that a higher matrix residual stress increases the load transfer capability, because matrix residual stress constricts fibre and enhances friction between fibre and matrix [45, 46]. As a proof, the matrix residual stress and interfacial shear strength are compared as illustrated in Fig. 1-12 [45].
Fig. 1-12 Relation between interfacial shear strength τa and matrix residual stress σr [45] A positive influence is reasonable in the case of the 90º tensile test because the direction of matrix shrinkage and the tensile load is opposite. However in the case of the 0º tensile test, matrix residual stress is induced not only in the radial direction but also in the longitudinal direction and may influence interfacial shear strength in a complicated way; the interfacial

13
shear strength affects load transfer efficiency from the broken fibres to the other fibres. Hence, matrix residual stress influences should be investigated for each combination of constituents and for each loading direction. In the case of semi-crystalline polymer matrix, crystallization is the key for both of matrix and interface properties. The microscopic mechanical properties such as matrix residual stress and interfacial shear strength are strongly influenced by process conditions especially cooling rates, and the influence is characteristic to each matrix system. 1.2.3 Carbon fibre Carbon fibre (CF) is not an advanced material anymore; the mass production technologies are well developed and it is now one of the strongest materials commercially available at a reasonable cost. Polyacrylonitrile (PAN) and pitch are mainly used as precursor materials for producing CF. Especially PAN based CF with more stable properties and higher strength is the mainstream. Fig. 1-13 plots the modulus and strength of PAN based CF from Toray Industries [47]. A wide range of properties can be achieved with changing precursor, carbonization temperature and so on. As the comparison, aramid fibre and glass fibre (GF) production of which is the largest in the field of reinforcement fibres are also positioned in Fig. 1-13.
Aramidfibre
S-glassfibre
E-glassfibre
Fig. 1-13 Modulus and strength range of PAN based CF from Toray [47]

14
Partially isotropic carbon fibres exist, but most of the high performance CF possesses a laminate structure, with lamina consisting of graphite crystals aligned in the longitudinal direction as schematized in Fig. 1-14 [48]. This characteristic is the critical difference with isotropic glass fibres and ceramic fibres such as Tyranno and alumina fibres. Surface flaws, inner structural irregularity, void, etc. control the strength of brittle fibres, as can be learned from fracture mechanics. Crack deflection, branching and local plasticity at amorphous phase and the division of the laminate structured CF in transverse direction increase the fracture toughness in comparison with simply isotropic fibres.
Fig. 1-14 Schematic of inner structure of CF [48] Due to the oriented micro-structure, the CF stiffness is extremely anisotropic. Few reports characterize transverse and torsional modulus as summarized in Table 1-2 [47, 49-51]. Table 1-2 Anisotropic moduli of CF [47, 49-51]
Density Young's modulus Transverse modulus Torsional modulus Poisson ratio(g/cm3) (GPa)* (GPa)** (GPa)*** ****
T300 1.76 230 13.9 16.7 0.22T800 1.81 294 17.6T1000G 1.80 294 12.7M40 1.75 377 11.6 15.7M50 1.88 485 9.1M60 1.93 588 6.9
* [47]; ** [49]; *** [50]; **** [51] Carbon fibres have another remarkable characteristic regarding stiffness, namely the non-linear elastic behaviour. The stiffness increases under tensile load as the graphite crystals are re-orienting [52-56]. In addition, at unloading the same stress-strain curve is followed, hence no hysteresis is observed. Fig. 1-15 [55] and 16 [56] illustrate measurements of stiffness increase of single fibre and unidirectional composite under tension. Generally 1 % tensile strain gives more than 20 % stiffness increase.

15
Fig. 1-15 Stiffness increase of various CF [55]
Fig. 1-16 Stiffness increase of T800H/epoxy unidirectional composites [56]
16
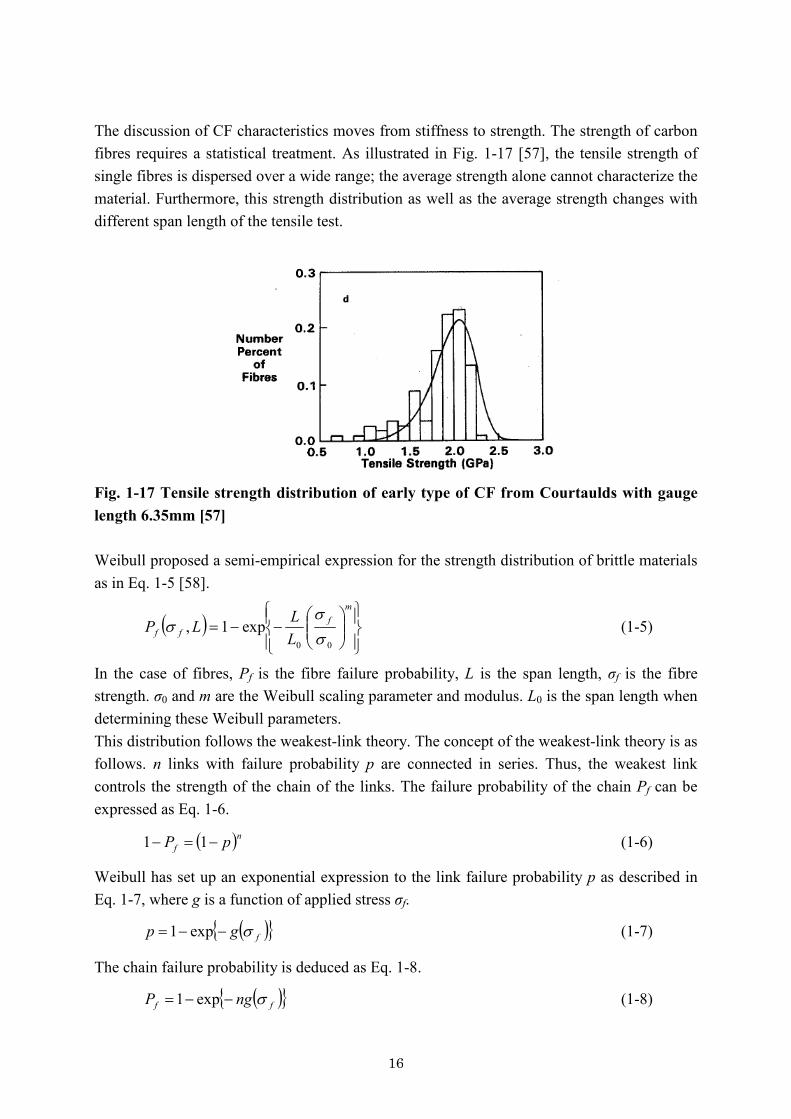
The discussion of CF characteristics moves from stiffness to strength. The strength of carbon fibres requires a statistical treatment. As illustrated in Fig. 1-17 [57], the tensile strength of single fibres is dispersed over a wide range; the average strength alone cannot characterize the material. Furthermore, this strength distribution as well as the average strength changes with different span length of the tensile test.
Fig. 1-17 Tensile strength distribution of early type of CF from Courtaulds with gauge length 6.35mm [57] Weibull proposed a semi-empirical expression for the strength distribution of brittle materials as in Eq. 1-5 [58].
( )ïþ
ïýü
ïî
ïíì
÷÷ø
öççè
æ--=
mf
ff LLLP
00
exp1,ss
s (1-5)
In the case of fibres, Pf is the fibre failure probability, L is the span length, σf is the fibre strength. σ0 and m are the Weibull scaling parameter and modulus. L0 is the span length when determining these Weibull parameters. This distribution follows the weakest-link theory. The concept of the weakest-link theory is as follows. n links with failure probability p are connected in series. Thus, the weakest link controls the strength of the chain of the links. The failure probability of the chain Pf can be expressed as Eq. 1-6.
( )nf pP -=- 11 (1-6)
Weibull has set up an exponential expression to the link failure probability p as described in Eq. 1-7, where g is a function of applied stress σf.
( ){ }fgp s--= exp1 (1-7)
The chain failure probability is deduced as Eq. 1-8.
( ){ }ff ngP s--= exp1 (1-8)
17
In the case of fibres, n is reasonably transformed into a normalized length as in Eq. 1-9.
0LLn = (1-9)
Weibull empirically decided the function g as the power law of applied stress indicated as Eq. 1-10.
( )m
fg ÷÷ø
öççè
æ=
0ss
s (1-10)
Finally Eq. 1-5 is obtained. The Weibull distritution is known to fit to high aspect ratio materials, especially fibres. Currently, most of CF strength characterizations use the Weibull distribution. To measure the Weibull parameters from single fibre tensile tests, Eq. 1-5 is transformed into Eq. 1-11.
( )00
lnlnln1
1lnln ss -+=÷÷ø
öççè
æ
- ff
mLL
P (1-11)
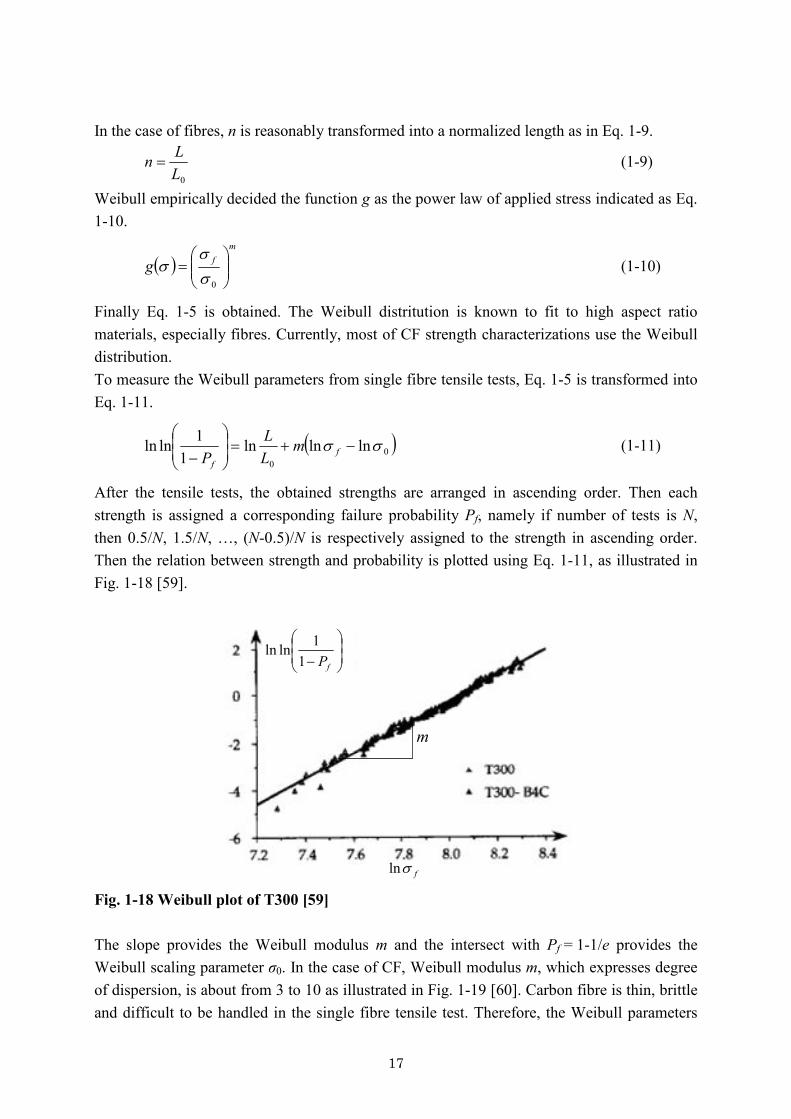
After the tensile tests, the obtained strengths are arranged in ascending order. Then each strength is assigned a corresponding failure probability Pf, namely if number of tests is N, then 0.5/N, 1.5/N, …, (N-0.5)/N is respectively assigned to the strength in ascending order. Then the relation between strength and probability is plotted using Eq. 1-11, as illustrated in Fig. 1-18 [59].
÷÷ø
öççè
æ
- fP11lnln
fsln
m
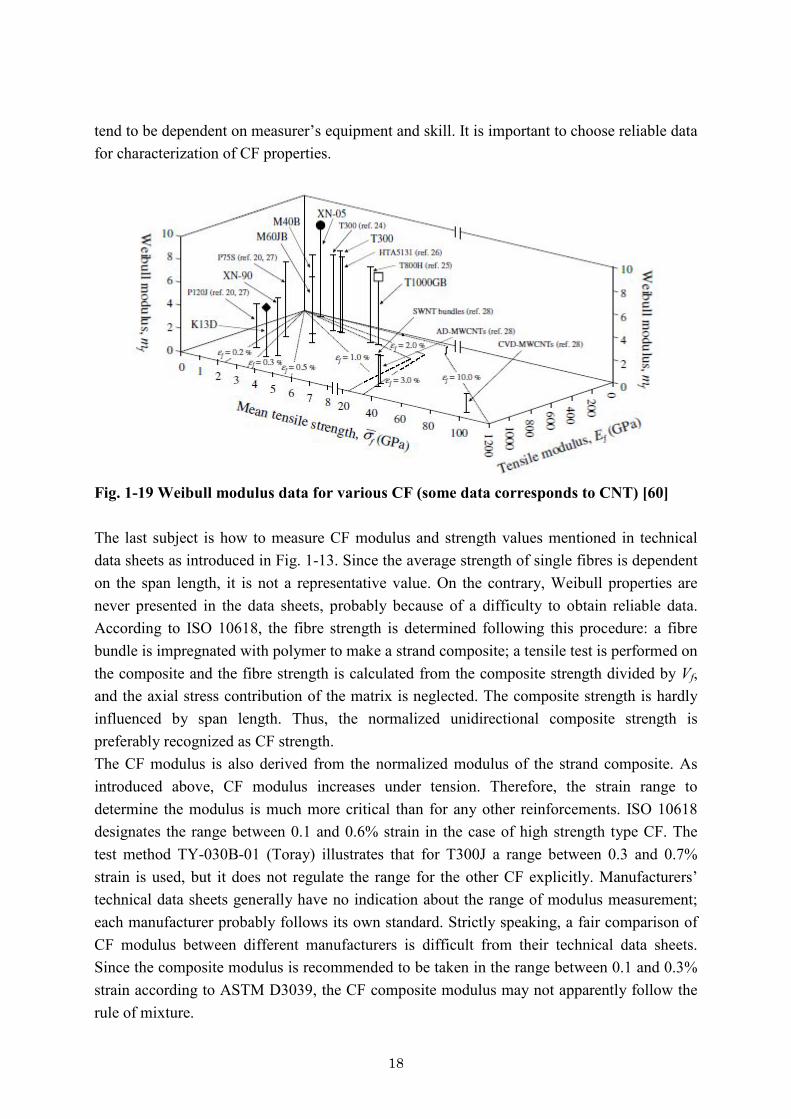
Fig. 1-18 Weibull plot of T300 [59] The slope provides the Weibull modulus m and the intersect with Pf = 1-1/e provides the Weibull scaling parameter σ0. In the case of CF, Weibull modulus m, which expresses degree of dispersion, is about from 3 to 10 as illustrated in Fig. 1-19 [60]. Carbon fibre is thin, brittle and difficult to be handled in the single fibre tensile test. Therefore, the Weibull parameters
18
tend to be dependent on measurer’s equipment and skill. It is important to choose reliable data for characterization of CF properties.
Fig. 1-19 Weibull modulus data for various CF (some data corresponds to CNT) [60] The last subject is how to measure CF modulus and strength values mentioned in technical data sheets as introduced in Fig. 1-13. Since the average strength of single fibres is dependent on the span length, it is not a representative value. On the contrary, Weibull properties are never presented in the data sheets, probably because of a difficulty to obtain reliable data. According to ISO 10618, the fibre strength is determined following this procedure: a fibre bundle is impregnated with polymer to make a strand composite; a tensile test is performed on the composite and the fibre strength is calculated from the composite strength divided by Vf, and the axial stress contribution of the matrix is neglected. The composite strength is hardly influenced by span length. Thus, the normalized unidirectional composite strength is preferably recognized as CF strength. The CF modulus is also derived from the normalized modulus of the strand composite. As introduced above, CF modulus increases under tension. Therefore, the strain range to determine the modulus is much more critical than for any other reinforcements. ISO 10618 designates the range between 0.1 and 0.6% strain in the case of high strength type CF. The test method TY-030B-01 (Toray) illustrates that for T300J a range between 0.3 and 0.7% strain is used, but it does not regulate the range for the other CF explicitly. Manufacturers’ technical data sheets generally have no indication about the range of modulus measurement; each manufacturer probably follows its own standard. Strictly speaking, a fair comparison of CF modulus between different manufacturers is difficult from their technical data sheets. Since the composite modulus is recommended to be taken in the range between 0.1 and 0.3% strain according to ASTM D3039, the CF composite modulus may not apparently follow the rule of mixture.
19
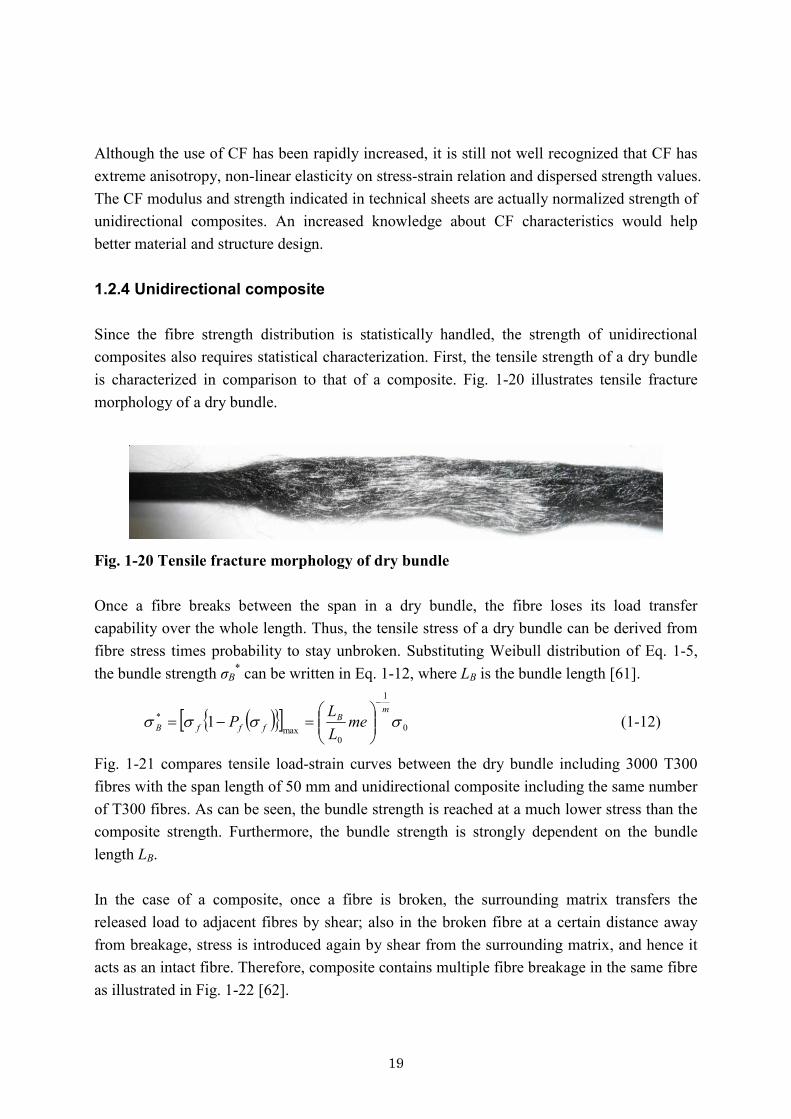
Although the use of CF has been rapidly increased, it is still not well recognized that CF has extreme anisotropy, non-linear elasticity on stress-strain relation and dispersed strength values. The CF modulus and strength indicated in technical sheets are actually normalized strength of unidirectional composites. An increased knowledge about CF characteristics would help better material and structure design. 1.2.4 Unidirectional composite Since the fibre strength distribution is statistically handled, the strength of unidirectional composites also requires statistical characterization. First, the tensile strength of a dry bundle is characterized in comparison to that of a composite. Fig. 1-20 illustrates tensile fracture morphology of a dry bundle.
Fig. 1-20 Tensile fracture morphology of dry bundle Once a fibre breaks between the span in a dry bundle, the fibre loses its load transfer capability over the whole length. Thus, the tensile stress of a dry bundle can be derived from fibre stress times probability to stay unbroken. Substituting Weibull distribution of Eq. 1-5, the bundle strength σB
* can be written in Eq. 1-12, where LB is the bundle length [61].
( ){ }[ ] 0
1
0max
* 1 ssssm
BfffB me
LLP
-
÷÷ø
öççè
æ=-= (1-12)
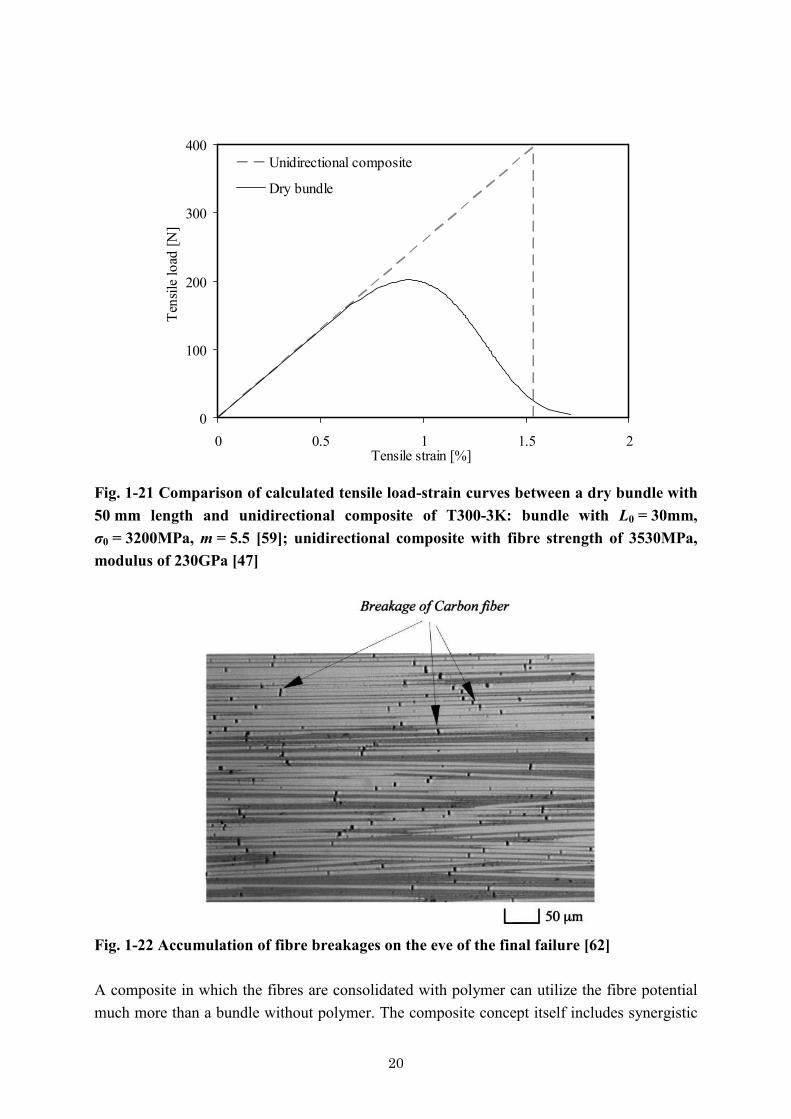
Fig. 1-21 compares tensile load-strain curves between the dry bundle including 3000 T300 fibres with the span length of 50 mm and unidirectional composite including the same number of T300 fibres. As can be seen, the bundle strength is reached at a much lower stress than the composite strength. Furthermore, the bundle strength is strongly dependent on the bundle length LB. In the case of a composite, once a fibre is broken, the surrounding matrix transfers the released load to adjacent fibres by shear; also in the broken fibre at a certain distance away from breakage, stress is introduced again by shear from the surrounding matrix, and hence it acts as an intact fibre. Therefore, composite contains multiple fibre breakage in the same fibre as illustrated in Fig. 1-22 [62].
20
0
100
200
300
400
0 0.5 1 1.5 2Tensile strain [%]
Tens
ile lo
ad [N
]Unidirectional composite
Dry bundle
Fig. 1-21 Comparison of calculated tensile load-strain curves between a dry bundle with 50 mm length and unidirectional composite of T300-3K: bundle with L0 = 30mm, σ0 = 3200MPa, m = 5.5 [59]; unidirectional composite with fibre strength of 3530MPa, modulus of 230GPa [47]
Fig. 1-22 Accumulation of fibre breakages on the eve of the final failure [62] A composite in which the fibres are consolidated with polymer can utilize the fibre potential much more than a bundle without polymer. The composite concept itself includes synergistic
21
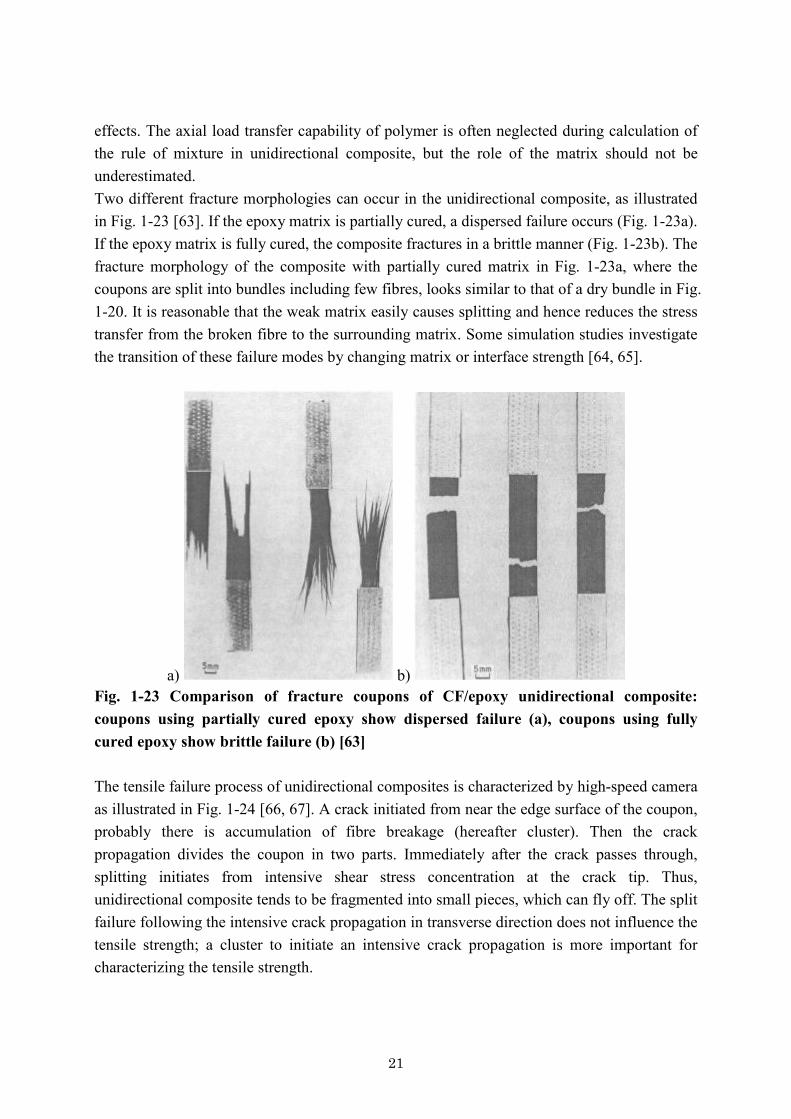
effects. The axial load transfer capability of polymer is often neglected during calculation of the rule of mixture in unidirectional composite, but the role of the matrix should not be underestimated. Two different fracture morphologies can occur in the unidirectional composite, as illustrated in Fig. 1-23 [63]. If the epoxy matrix is partially cured, a dispersed failure occurs (Fig. 1-23a). If the epoxy matrix is fully cured, the composite fractures in a brittle manner (Fig. 1-23b). The fracture morphology of the composite with partially cured matrix in Fig. 1-23a, where the coupons are split into bundles including few fibres, looks similar to that of a dry bundle in Fig. 1-20. It is reasonable that the weak matrix easily causes splitting and hence reduces the stress transfer from the broken fibre to the surrounding matrix. Some simulation studies investigate the transition of these failure modes by changing matrix or interface strength [64, 65].
a) b) Fig. 1-23 Comparison of fracture coupons of CF/epoxy unidirectional composite: coupons using partially cured epoxy show dispersed failure (a), coupons using fully cured epoxy show brittle failure (b) [63] The tensile failure process of unidirectional composites is characterized by high-speed camera as illustrated in Fig. 1-24 [66, 67]. A crack initiated from near the edge surface of the coupon, probably there is accumulation of fibre breakage (hereafter cluster). Then the crack propagation divides the coupon in two parts. Immediately after the crack passes through, splitting initiates from intensive shear stress concentration at the crack tip. Thus, unidirectional composite tends to be fragmented into small pieces, which can fly off. The split failure following the intensive crack propagation in transverse direction does not influence the tensile strength; a cluster to initiate an intensive crack propagation is more important for characterizing the tensile strength.

22
a) b) Fig. 1-24 Crack propagation at final failure of unidirectional composite: high speed camera observation (a) and schematic (b) [66] The tensile strength predictions for 0º unidirectional composites considering statistical accumulation of fibre breakages are derived as follows. Rosen [68] introduced the weakest-link theory into the prediction of the unidirectional composite strength σL
*, namely the “chain of bundles” model. He represented the unidirectional composite as a chain of bundles in series as illustrated in Fig. 1-25; once one of the unit bundles is broken, the unidirectional composite would be immediately broken. This is a reasonable hypothesis, if the unidirectional composite fails in a brittle manner, namely one major crack propagates through the whole coupon width. Therefore, the strength of the bundle corresponds to that of unidirectional composite. The fibre stress recovers away from the fibre breakage and becomes the same as in the intact fibre. This distance is called the ineffective length δ. Rosen defines twice of the ineffective length δ as the unit bundle length as indicated in Fig. 1-25.

23
Fig. 1-25 Schematic of Rosen’s chain of bundles model [68] Substituting LB into 2δ in Eq. 1-12 and multiplying the bundle strength by Vf, the composite strength σL
*can be derived as Eq. 1-13.
0
1
0
* 2 sdsm
fL meL
V-
÷÷ø
öççè
æ= (1-13)
Therefore, the strength of the unidirectional composite is independent on the span length, while that of a dry bundle reduces as span length becomes longer as indicated in Eq. 1-12; the strength of the composite dramatically improves from that of the dry bundle. The ineffective length and stress distribution around the broken fibres can be estimated using for instance Cox’s shear-lag model [69]. However, intensive stress concentration at the tip of a broken fibre initiates shear yielding of the matrix. Kelly and Tyson have simply modelled that the matrix within the ineffective length surrounding a broken fibre is already perfect-plastic [70].
Fig. 1-26 Schematic of fibre stress recovery from breakage in Kelly-Tyson model [70]
24
Hence the perfect-plastic matrix transfers the load by shear, namely by a constant shear yield stress τy. The ineffective length δ can be derived from the balance between the axial fibre load and matrix shear load within δ as Eq. 1-14.
y
ff rt
sd
2= (1-14)
The axial fibre stress σ recoveries as a linear function of distance from breakage z as described in Eq. 1-15.
( ) zr
zf
yts2
= (1-15)
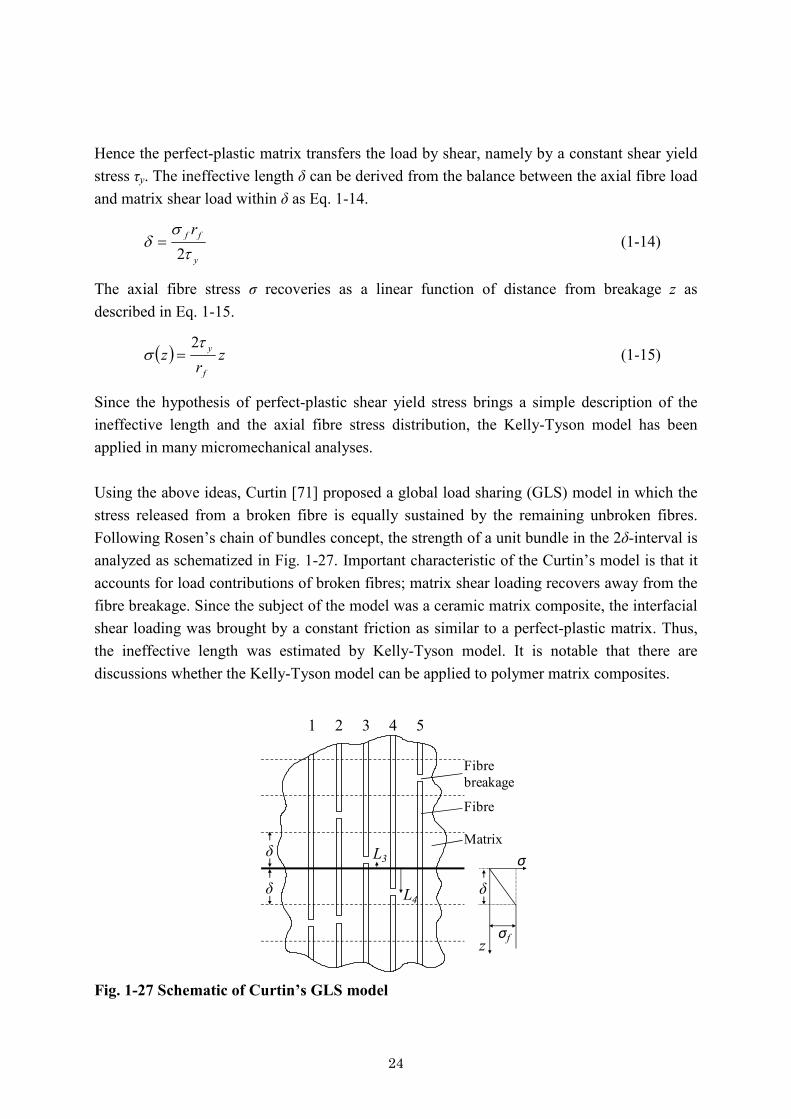
Since the hypothesis of perfect-plastic shear yield stress brings a simple description of the ineffective length and the axial fibre stress distribution, the Kelly-Tyson model has been applied in many micromechanical analyses. Using the above ideas, Curtin [71] proposed a global load sharing (GLS) model in which the stress released from a broken fibre is equally sustained by the remaining unbroken fibres. Following Rosen’s chain of bundles concept, the strength of a unit bundle in the 2δ-interval is analyzed as schematized in Fig. 1-27. Important characteristic of the Curtin’s model is that it accounts for load contributions of broken fibres; matrix shear loading recovers away from the fibre breakage. Since the subject of the model was a ceramic matrix composite, the interfacial shear loading was brought by a constant friction as similar to a perfect-plastic matrix. Thus, the ineffective length was estimated by Kelly-Tyson model. It is notable that there are discussions whether the Kelly-Tyson model can be applied to polymer matrix composites.
1 2 3 4 5
δ
δ δ
σf
σ
z
Fibrebreakage
Fibre
MatrixL3
L4
Fig. 1-27 Schematic of Curtin’s GLS model
25
The analytical derivation of the GLS model is introduced as follows. First, the matrix axial stress is neglected, namely composite stress σL can be derived as Vf times fibre sustained stress. The fibre sustained stress can be divided into two components of intact fibres and broken fibres as indicated in Eq. 1-16.
( ){ } ( )úúû
ù
êêë
é><+-= ds
tdsss 2,
22,1 ff
f
yffffL PL
rPV
( )þýü
îíì
÷øö
çèæ ><--= ds
ds 2,11 ffff PLV (1-16)
The former component of Eq. 1-16 (corresponding to fibre 1, 2 and 5 in Fig. 1-27) is the intact fibre stress σf times the probability to stay unbroken (1-Pf) and the latter component (corresponding to fibre 3 and 4 in Fig. 1-27) is the average recovery stress times probability to be broken Pf. The average recovery stress in a broken fibre can be described with Eq. 1-15; <L> is introduced as a representative distance from breakage point. The distance between the average breakage point to the centre of the bundle (bold solid line in Fig. 1-27) <L> is hypothesized to be a half of ineffective length δ as Eq. 1-17.
2d
>@< L (1-17)
To simplify the Weibull equation, a Maclaurin series expansion is applied and approximated under the hypothesis that the inside of the exponential is much less than 1, as described in Eq. 1-18.
( )m
fm
fff LL
P ÷÷ø
öççè
æ@
ïþ
ïýü
ïî
ïíì
÷÷ø
öççè
æ--=
0000
22exp12,ssd
ssdds (1-18)
Finally, combining Eq. 1-14, 16, 17 and 18, a constitutive equation for the composite stress σL is described as in Eq. 1-19, where σ1 is expressed as Eq. 1-20.
ïþ
ïýü
ïî
ïíì
÷÷ø
öççè
æ-=
+1
1211
mf
ffL Vss
ss (1-19)
11
001
+
÷÷ø
öççè
æ=
m
f
ym
rL ts
s (1-20)
If the composite strain εL is equivalent to intact fibre strain, Eq. 1-21 can apply.
Lff E es @ (1-21)
By substituting Eq. 1-21 into Eq. 1-19, the tensile stress-strain relation of unidirectional composite can be calculated. The composite strength σL
* should be the maximal values of Eq. 1-19. Therefore, the solution of Eq. 1-22 is required.
26
0=¶¶
L
L
es
(1-22)
By using Eq. 1-21, Eq. 1-22 can be replaced by Eq. 1-23
0=¶¶
f
L
ss
(1-23)
The solution of σf in Eq. 1-23 can be derived as Eq. 1-24.
11
1 22 +
÷øö
çèæ
+=
m
f mss (1-24)
Eq. 1-24 is substituted into Eq. 1-19 and the composite strength σL* is deduced as Eq. 1-25.
÷øö
çèæ
++
÷øö
çèæ
+==
+
÷øö
çèæ
++
21
22 1
1
12
2*
11
1 mm
mV
m
fm
LL m ssss
(1-25)
Curtin’s GLS model hence describes the tensile strength of a 0º unidirectional composite with an analytical equation. It reveals the contribution of each microscopic mechanical parameter as illustrated in Eq. 1-26.
11
11
10
* ,,, +-
++µ mf
my
mm
fL rV tss (1-26)
Not only the fibre strength (σ0, m) but also the matrix/interface (τy) contributions are clear. As introduced in Subsection 1.2.3, the “fibre strength” as quoted in technical data sheets is determined by the normalized strength of a unidirectional strand composite. Thus, even if the fibre properties are equivalent, the “fibre strength” can be changed by applying different polymers, sizing agents, fibre treatments in the strand tensile tests. The composite strength may not follow the rule of mixture using “fibre strength” mentioned in manufactures’ technical data sheets due to the difference of the applied matrix/interface. A smaller fibre radius rf clearly leads to a higher strength. Most recent high strength fibres possess a small diameter (for example 3 μm), while less surface flaws and temperature homogenisation in the radius direction during carbonization process may also give positive influences. On the contrary, as introduced in Subsection 1.2.1, the permeability is proportional to rf
2. Since intrinsically thermoplastic polymer has high viscosity, the small diameter of fibres is sometimes restrictive for impregnation process. In addition, fibres with small diameters may present health risks, for example mineral wool having around 1 μm diameter is known to cause mesothelioma. Therefore, the fibre diameter should be carefully designed. As mentioned above, the GLS model accounts for the situation that stress distribution is not disturbed by the other fibres. Unless the influence of fibre breakage to the adjacent fibres is accounted for, the strength prediction model may not be persuasive. Fibre breakage brings
27
two types of stress concentrations. The first one is intensive matrix shear loading, and the second one is a stress singularity at the tip of a matrix crack initiated from fibre breakage. The second issue is critical for ceramics matrix composite. In the case of a high modulus matrix, the axial load sustained by the matrix cannot be neglected. In addition, brittle matrix causes a sharp crack tip. Since the matrix crack cuts the reinforcement, sometimes a weak interface is intentionally applied to change the direction of crack propagation [72, 73]. In the case of polymer matrix composites, on the other hand, the matrix sustains small load in the longitudinal direction and crack tip is rounded due to plasticity. Thus, the influence of matrix cracks is simply neglected and only matrix shear loading is discussed below. Some researchers have suggested that a very strong interface reduces composite strength [64, 65]. If this is true, the real situation may not fit to the assumption of the GLS model, which suggests that higher interfacial shear strength as well as higher matrix shear yield stress τy always results in higher composite strength. Therefore, a model which can account for interaction between adjacent fibres, named as a local load sharing (LLS) model is needed [74]. Hedgepeth and Van Dyke analytically derived the stress concentration factor around single broken fibre [75]. Other researchers also solved the stress concentration factor in various situations such as in the presence of multiple broken fibres [76-80]. However statistical strength distribution of CF and randomly positioned fibre breakage clusters are preferably solved by simulation rather than by analytical means. On the other hand, few researchers tried three dimensional finite element model (3D FEM) [81-83]. To statistically assign the fibre strength, a large number of fibres needs to be modelled. In addition, matrix yield plays an important role in shear loading; matrix elastic-plastic relation requires intensive iterative calculations. 3D FEM is not a suitable candidate for this model due to too high calculation cost. Okabe [84-86] has proposed a model, called spring element model (SEM), which can simulate a large number of fibres with low calculation cost as well as fibre stress distribution equivalent to that in 3D FEM. The fibre strength is assigned to follow a Weibull distribution. Then, a Monte Carlo simulation judging fibre breakage and calculating stress re-distribution is performed with an incremental strain. The model designs and procedures are explained as follows. First, a spring element unit cell is designed using only dominant parameters for composite strength. As illustrated in Fig. 1-28, one fibre is surrounded by six other fibres. The unit cell consists of fibre axial springs in the longitudinal direction and matrix shear springs in transverse direction. Fibre elongation and matrix shear are the mechanisms of load transfer through unidirectional composites. Thus, they are the minimum constituents for describing tensile failure of unidirectional composites. The distance between the fibres is defined as the shortest distance between fibre surfaces described in Eq. 1-27.
÷÷
ø
ö
çç
è
æ-º 2
32
ff V
rd p (1-27)

28
Fig. 1-28 Schematic of spring element unit cell [84] The stiffness matrices of fibre spring element KL and matrix shear spring element KT are defined as Eq. 1-28 and 29, respectively, where l is fibre spring length, Ef is fibre Young’s modulus and G is effective matrix shear modulus.
úû
ùêë
é-
-=
11112
lrE ffp
LK (1-28)
úû
ùêë
é-
-=
1111
3dlrG fp
TK (1-29)
The unit cells are built up as three dimensionally illustrated in Fig. 1-29. This enables enough simulation size (number of fibres and fibre length) to ensure equivalence to the coupon size in terms of the calculated tensile strength.
Fig. 1-29 Schematic of SEM slot by spring element unit cells [84]
29
As one of the characteristics of this model, the fibre stress distribution around a broken fibre is solved analytically by an iterative calculation, taking into account the non-linear matrix shear behaviour. Concretely, the ineffective length δ and the distribution of fibre stress σ within δ are determined from analytical equations (Eq. 1-31 - 33). Eq. 1-30 is the constitutive equation to reveal the relation between load f and displacement u of each node in SEM. NL is a number of fiber spring elements, NT is a number of matrix shear spring elements, Nb is a number of broken fiber spring elements and Ns is a number of fiber spring elements in 2δ.
fuKK TL =úûù
êëé-+ú
û
ùêë
é+ å òå å
--
dzll
RssbL T NNNN N
spd
T
10
2
1 1
11 (1-30)
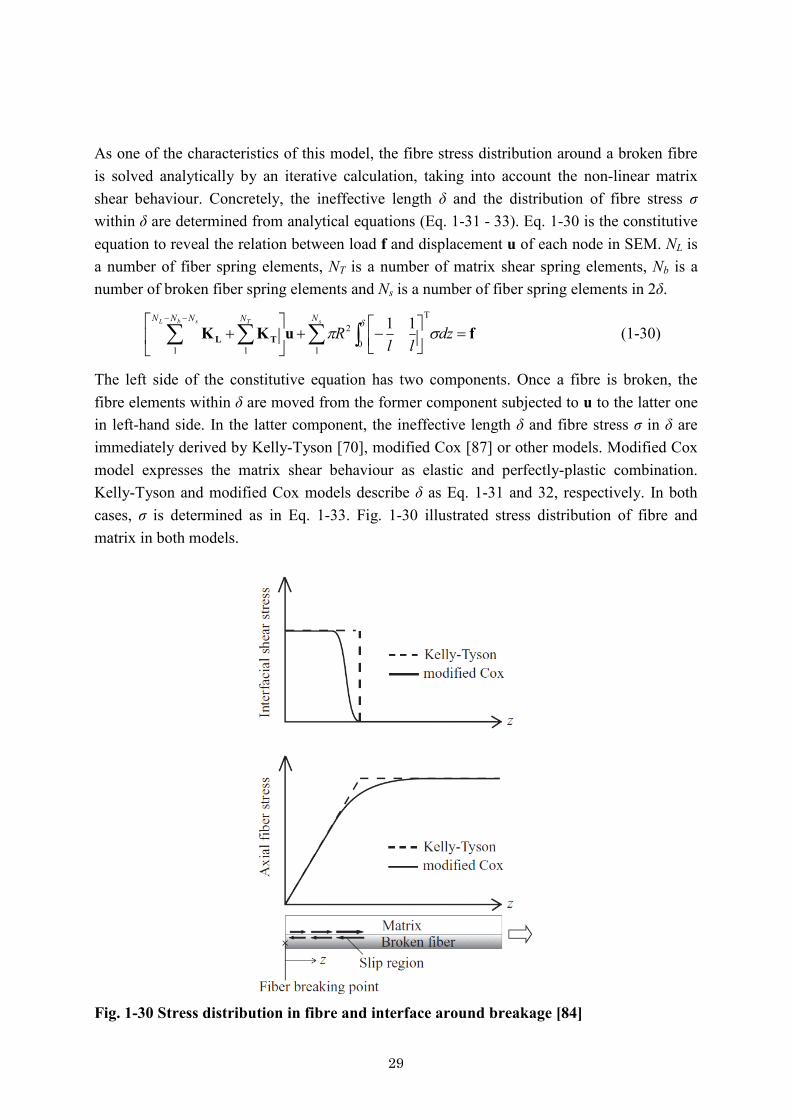
The left side of the constitutive equation has two components. Once a fibre is broken, the fibre elements within δ are moved from the former component subjected to u to the latter one in left-hand side. In the latter component, the ineffective length δ and fibre stress σ in δ are immediately derived by Kelly-Tyson [70], modified Cox [87] or other models. Modified Cox model expresses the matrix shear behaviour as elastic and perfectly-plastic combination. Kelly-Tyson and modified Cox models describe δ as Eq. 1-31 and 32, respectively. In both cases, σ is determined as in Eq. 1-33. Fig. 1-30 illustrated stress distribution of fibre and matrix in both models.
Fig. 1-30 Stress distribution in fibre and interface around breakage [84]

30
y
Lff Erte
d2
= (Kelly-Tyson model) (1-31)
÷÷ø
öççè
æ-=
f
f
y
Lff
GrdEEr
22
2 te
d (Modified Cox model) (1-32)
zr f
yts2
= )( dd ££- z (1-33)
To confirm whether the stress distributions predicted by the analytical equations are appropriate, 3D FEM is modelled as illustrated in Fig. 1-31 [82, 86].
Rrzu z >== ,0on00on0 == rur
°=°== 30/0on0 qqquLzLuz == one
Fig. 1-31 3D FEM of unidirectional composite around broken fibre [86] Fig. 1-32a illustrates that the fibre stress distribution in broken fibre predicted by SEM reasonably agrees with that by 3D FEM. Since SEM artificially sets up six springs to express the matrix surrounding the fibre, the effective matrix shear modulus G is different from the matrix shear modulus. Thus, G value is selected by fitting the stress concentration around broken fibres to that predicted by 3D FEM as illustrated in Fig. 1-32b.
31
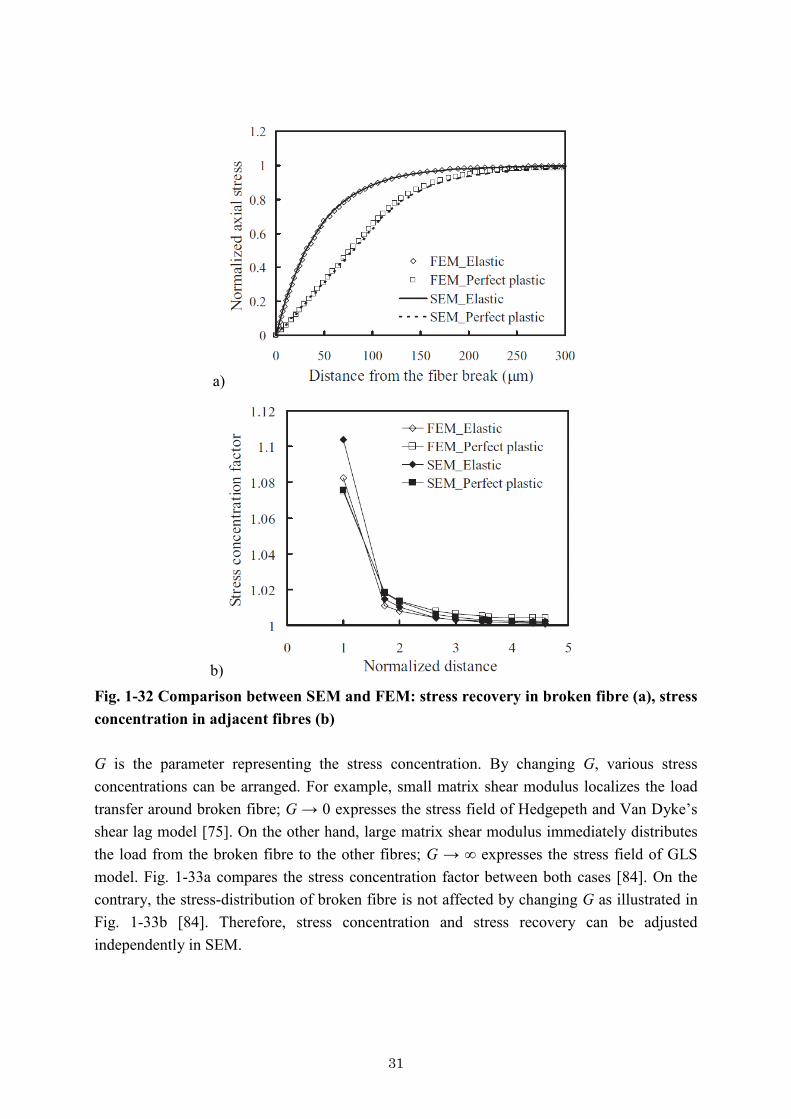
a)
b) Fig. 1-32 Comparison between SEM and FEM: stress recovery in broken fibre (a), stress concentration in adjacent fibres (b) G is the parameter representing the stress concentration. By changing G, various stress concentrations can be arranged. For example, small matrix shear modulus localizes the load transfer around broken fibre; G → 0 expresses the stress field of Hedgepeth and Van Dyke’s shear lag model [75]. On the other hand, large matrix shear modulus immediately distributes the load from the broken fibre to the other fibres; G → ∞ expresses the stress field of GLS model. Fig. 1-33a compares the stress concentration factor between both cases [84]. On the contrary, the stress-distribution of broken fibre is not affected by changing G as illustrated in Fig. 1-33b [84]. Therefore, stress concentration and stress recovery can be adjusted independently in SEM.

32
a)
Broken fibre
b)
Fig. 1-33 Comparison of stress concentration of adjacent fibres next to broken fibre between Hedgepeth and Van Dyke (HVD) model and global load shearing (GLS) model (a) and influence on axial stress in broken fibre under Kelly-Tyson model (b) [84] The Monte Carlo simulation procedure is performed using SEM. Each fibre spring element is assigned a fibre strength σf
* following a Weibull distribution as depicted in Eq. 1-34. For Pf , a random number between 0 and 1 is applied. Fibre breakage and stress distribution are iteratively calculated with strain increment.
( ) 0
1
0* 1ln ssm
ff Pl
Lþýü
îíì --= (1-34)
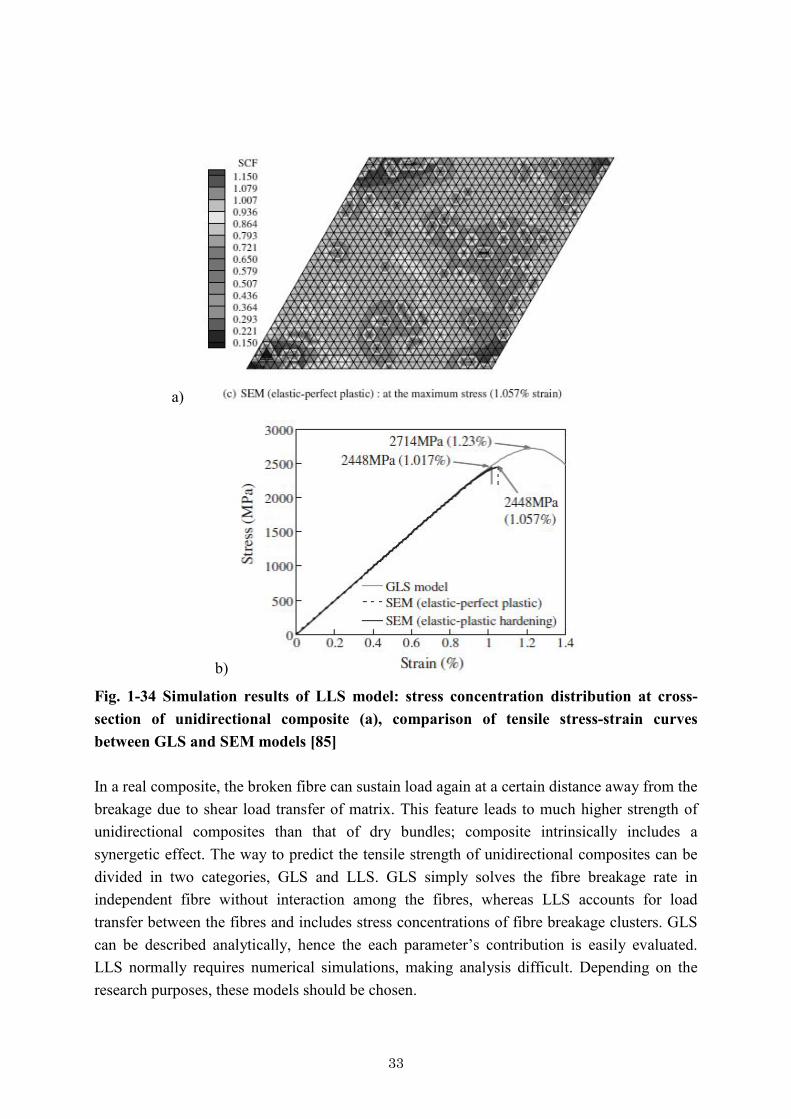
Fig. 1-34 illustrates the stress concentration distribution at certain cross-section and the predicted stress-strain curves. SEM as well as LLS model predicted less strength than GLS model. This difference comes from the stress concentration of fibre breakage cluster; the intensive crack from the cluster immediately divides the composite in a perpendicular direction to the fibre, hence decides the strength.
33
a)
b)
Fig. 1-34 Simulation results of LLS model: stress concentration distribution at cross-section of unidirectional composite (a), comparison of tensile stress-strain curves between GLS and SEM models [85] In a real composite, the broken fibre can sustain load again at a certain distance away from the breakage due to shear load transfer of matrix. This feature leads to much higher strength of unidirectional composites than that of dry bundles; composite intrinsically includes a synergetic effect. The way to predict the tensile strength of unidirectional composites can be divided in two categories, GLS and LLS. GLS simply solves the fibre breakage rate in independent fibre without interaction among the fibres, whereas LLS accounts for load transfer between the fibres and includes stress concentrations of fibre breakage clusters. GLS can be described analytically, hence the each parameter’s contribution is easily evaluated. LLS normally requires numerical simulations, making analysis difficult. Depending on the research purposes, these models should be chosen.
34
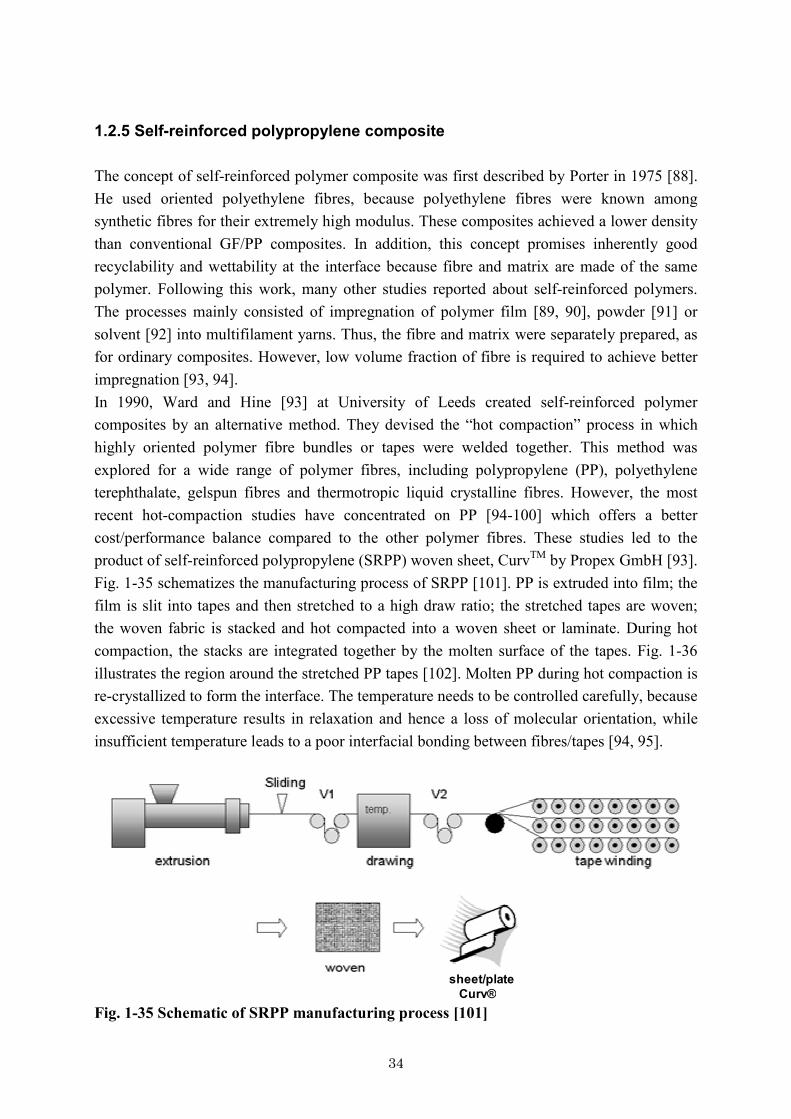
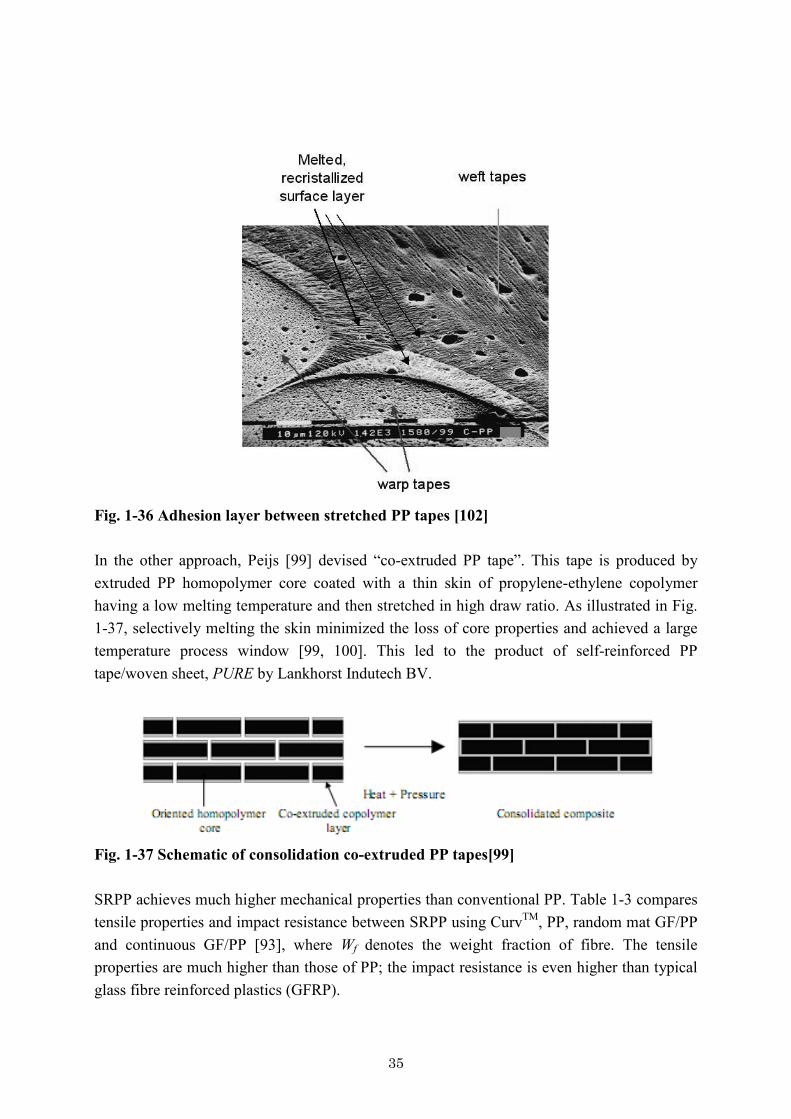
1.2.5 Self-reinforced polypropylene composite The concept of self-reinforced polymer composite was first described by Porter in 1975 [88]. He used oriented polyethylene fibres, because polyethylene fibres were known among synthetic fibres for their extremely high modulus. These composites achieved a lower density than conventional GF/PP composites. In addition, this concept promises inherently good recyclability and wettability at the interface because fibre and matrix are made of the same polymer. Following this work, many other studies reported about self-reinforced polymers. The processes mainly consisted of impregnation of polymer film [89, 90], powder [91] or solvent [92] into multifilament yarns. Thus, the fibre and matrix were separately prepared, as for ordinary composites. However, low volume fraction of fibre is required to achieve better impregnation [93, 94]. In 1990, Ward and Hine [93] at University of Leeds created self-reinforced polymer composites by an alternative method. They devised the “hot compaction” process in which highly oriented polymer fibre bundles or tapes were welded together. This method was explored for a wide range of polymer fibres, including polypropylene (PP), polyethylene terephthalate, gelspun fibres and thermotropic liquid crystalline fibres. However, the most recent hot-compaction studies have concentrated on PP [94-100] which offers a better cost/performance balance compared to the other polymer fibres. These studies led to the product of self-reinforced polypropylene (SRPP) woven sheet, CurvTM by Propex GmbH [93]. Fig. 1-35 schematizes the manufacturing process of SRPP [101]. PP is extruded into film; the film is slit into tapes and then stretched to a high draw ratio; the stretched tapes are woven; the woven fabric is stacked and hot compacted into a woven sheet or laminate. During hot compaction, the stacks are integrated together by the molten surface of the tapes. Fig. 1-36 illustrates the region around the stretched PP tapes [102]. Molten PP during hot compaction is re-crystallized to form the interface. The temperature needs to be controlled carefully, because excessive temperature results in relaxation and hence a loss of molecular orientation, while insufficient temperature leads to a poor interfacial bonding between fibres/tapes [94, 95].
sheet/plateCurv®
Fig. 1-35 Schematic of SRPP manufacturing process [101]
35
Fig. 1-36 Adhesion layer between stretched PP tapes [102] In the other approach, Peijs [99] devised “co-extruded PP tape”. This tape is produced by extruded PP homopolymer core coated with a thin skin of propylene-ethylene copolymer having a low melting temperature and then stretched in high draw ratio. As illustrated in Fig. 1-37, selectively melting the skin minimized the loss of core properties and achieved a large temperature process window [99, 100]. This led to the product of self-reinforced PP tape/woven sheet, PURE by Lankhorst Indutech BV.
Fig. 1-37 Schematic of consolidation co-extruded PP tapes[99] SRPP achieves much higher mechanical properties than conventional PP. Table 1-3 compares tensile properties and impact resistance between SRPP using CurvTM, PP, random mat GF/PP and continuous GF/PP [93], where Wf denotes the weight fraction of fibre. The tensile properties are much higher than those of PP; the impact resistance is even higher than typical glass fibre reinforced plastics (GFRP).
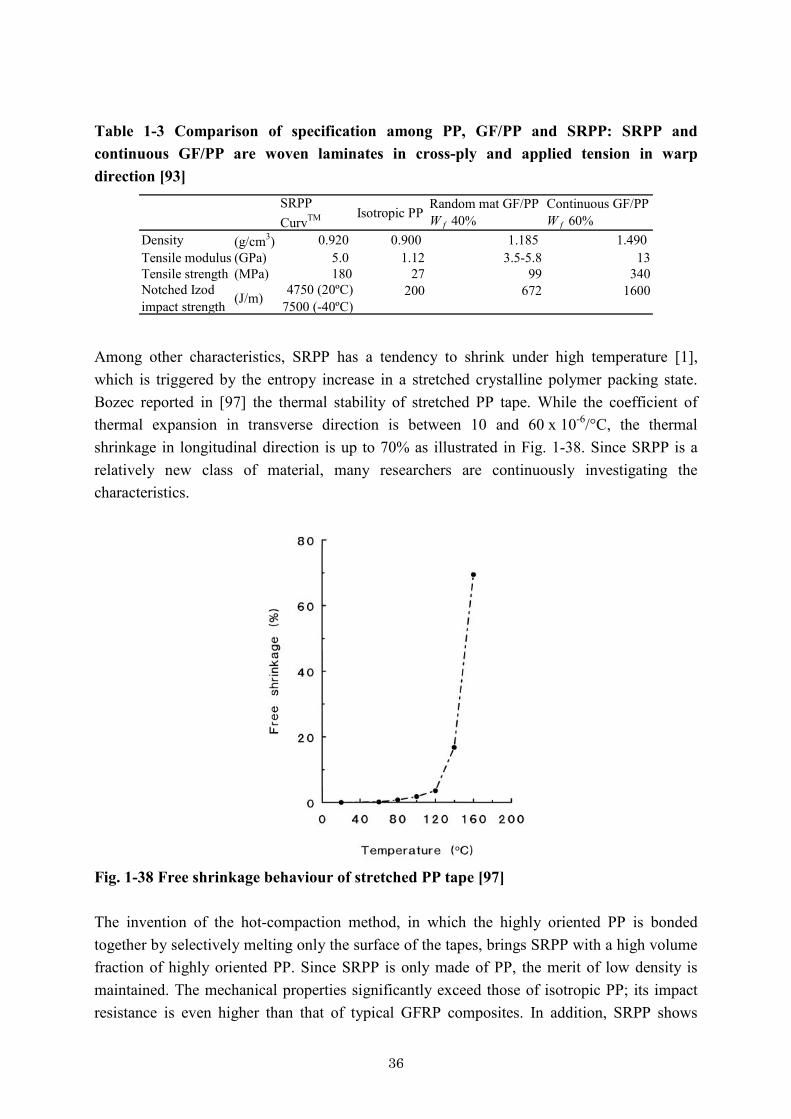
36
Table 1-3 Comparison of specification among PP, GF/PP and SRPP: SRPP and continuous GF/PP are woven laminates in cross-ply and applied tension in warp direction [93]
SRPPCurvTM Isotropic PP
Random mat GF/PPW f 40%
Continuous GF/PPW f 60%
Density (g/cm3) 0.920 0.900 1.185 1.490Tensile modulus (GPa) 5.0 1.12 3.5-5.8 13Tensile strength (MPa) 180 27 99 340Notched Izodimpact strength (J/m) 4750 (20ºC)
7500 (-40ºC)200 672 1600
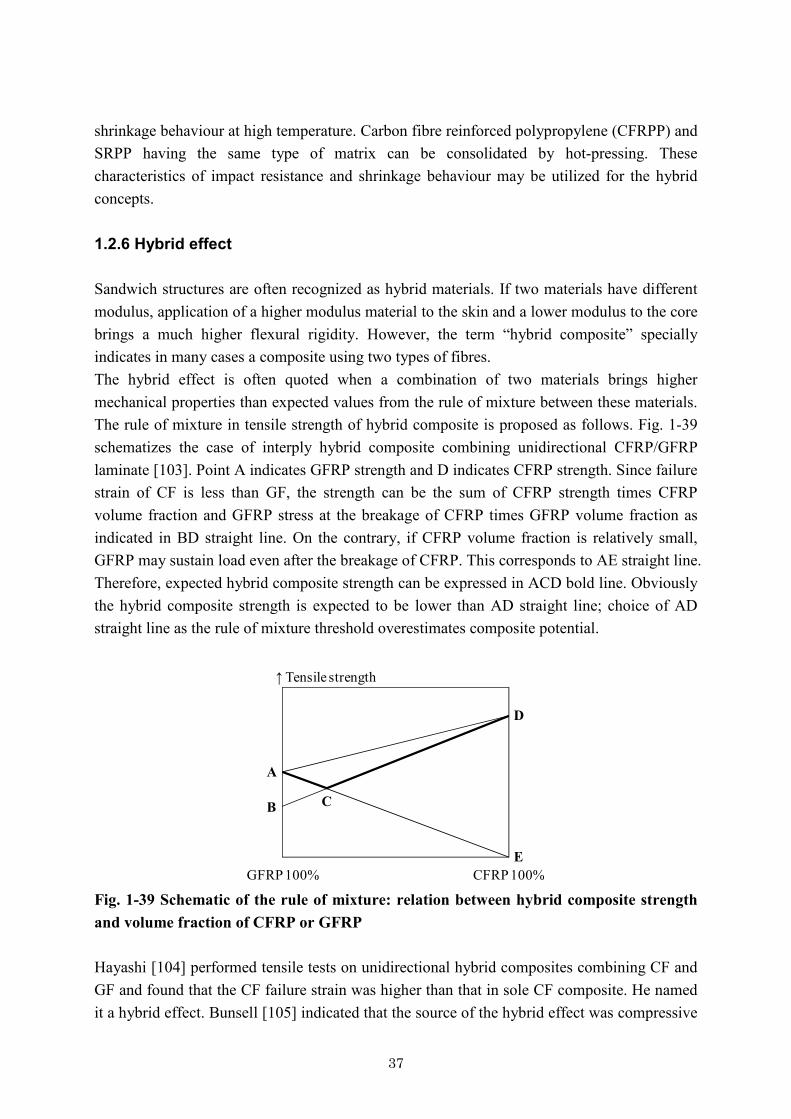
Among other characteristics, SRPP has a tendency to shrink under high temperature [1], which is triggered by the entropy increase in a stretched crystalline polymer packing state. Bozec reported in [97] the thermal stability of stretched PP tape. While the coefficient of thermal expansion in transverse direction is between 10 and 60 x 10-6/°C, the thermal shrinkage in longitudinal direction is up to 70% as illustrated in Fig. 1-38. Since SRPP is a relatively new class of material, many researchers are continuously investigating the characteristics.
Fig. 1-38 Free shrinkage behaviour of stretched PP tape [97] The invention of the hot-compaction method, in which the highly oriented PP is bonded together by selectively melting only the surface of the tapes, brings SRPP with a high volume fraction of highly oriented PP. Since SRPP is only made of PP, the merit of low density is maintained. The mechanical properties significantly exceed those of isotropic PP; its impact resistance is even higher than that of typical GFRP composites. In addition, SRPP shows
37
shrinkage behaviour at high temperature. Carbon fibre reinforced polypropylene (CFRPP) and SRPP having the same type of matrix can be consolidated by hot-pressing. These characteristics of impact resistance and shrinkage behaviour may be utilized for the hybrid concepts. 1.2.6 Hybrid effect Sandwich structures are often recognized as hybrid materials. If two materials have different modulus, application of a higher modulus material to the skin and a lower modulus to the core brings a much higher flexural rigidity. However, the term “hybrid composite” specially indicates in many cases a composite using two types of fibres. The hybrid effect is often quoted when a combination of two materials brings higher mechanical properties than expected values from the rule of mixture between these materials. The rule of mixture in tensile strength of hybrid composite is proposed as follows. Fig. 1-39 schematizes the case of interply hybrid composite combining unidirectional CFRP/GFRP laminate [103]. Point A indicates GFRP strength and D indicates CFRP strength. Since failure strain of CF is less than GF, the strength can be the sum of CFRP strength times CFRP volume fraction and GFRP stress at the breakage of CFRP times GFRP volume fraction as indicated in BD straight line. On the contrary, if CFRP volume fraction is relatively small, GFRP may sustain load even after the breakage of CFRP. This corresponds to AE straight line. Therefore, expected hybrid composite strength can be expressed in ACD bold line. Obviously the hybrid composite strength is expected to be lower than AD straight line; choice of AD straight line as the rule of mixture threshold overestimates composite potential.
GFRP 100% CFRP 100%
↑ Tensile strength
A
D
B
E
C
Fig. 1-39 Schematic of the rule of mixture: relation between hybrid composite strength and volume fraction of CFRP or GFRP Hayashi [104] performed tensile tests on unidirectional hybrid composites combining CF and GF and found that the CF failure strain was higher than that in sole CF composite. He named it a hybrid effect. Bunsell [105] indicated that the source of the hybrid effect was compressive

38
residual stress in carbon fibre accumulated by the difference of thermal expansion coefficients of CF and GF. Zweben [106] also tried to explain it from the micromechanics point of view and other researchers [107] followed to join the discussions. In preliminary research [1], carbon fibre woven reinforced polypropylene (CFRPP) was combined with SRPP woven sheet to make interply hybrid composites as illustrated the cross-section in Fig. 1-40. As introduced in Subsection 1.2.5, SRPP has an intrinsic behaviour of shrinkage at high temperature. During consolidation between CFRPP and SRPP, the shrinkage might accumulate compressive residual stress in CFRPP. The concept of tensile strength improvement with compressive residual stress was similar to the original work for CF/GF hybridization. Tensile tests revealed improvement in failure strain, however modulus and strength were slightly lost. Moreover, the woven fabric made it difficult to analyze the pure effect of axial shrinkage.
Fig. 1-40 Cross-section of interply hybrid composite with CFRPP and SRPP [1] Another interesting aspect is the impact behaviour of hybrid composites. The high impact resistance of SRPP is attractive to modify the toughness of relatively brittle CF composites, but so far few works are known that investigated the hybrid effect under impact loading [108]. The preliminary research [1] is the only example of hybrid concepts combining CFRPP and SRPP. In addition, hybrid concepts in the aspect of impact resistance are rarely reported, maybe because impact normally causes complex phenomena and is difficult to be analyzed. 1.3 Problem statement Even though the manufacturing of continuous CFRTP is difficult especially in the impregnation process, its merits such as high production rate and recyclability would push forward a wide range of applications. Therefore, it is important for future material development to clarify the micromechanics of the unidirectional laminates, which govern the
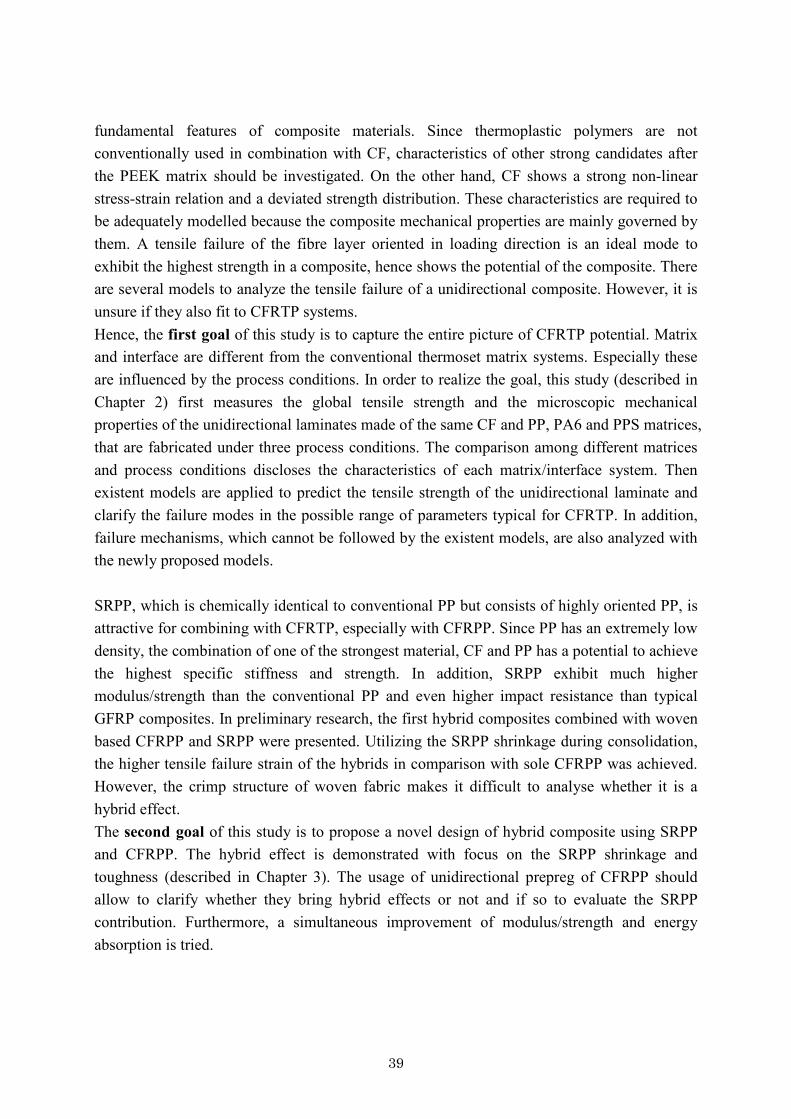
39
fundamental features of composite materials. Since thermoplastic polymers are not conventionally used in combination with CF, characteristics of other strong candidates after the PEEK matrix should be investigated. On the other hand, CF shows a strong non-linear stress-strain relation and a deviated strength distribution. These characteristics are required to be adequately modelled because the composite mechanical properties are mainly governed by them. A tensile failure of the fibre layer oriented in loading direction is an ideal mode to exhibit the highest strength in a composite, hence shows the potential of the composite. There are several models to analyze the tensile failure of a unidirectional composite. However, it is unsure if they also fit to CFRTP systems. Hence, the first goal of this study is to capture the entire picture of CFRTP potential. Matrix and interface are different from the conventional thermoset matrix systems. Especially these are influenced by the process conditions. In order to realize the goal, this study (described in Chapter 2) first measures the global tensile strength and the microscopic mechanical properties of the unidirectional laminates made of the same CF and PP, PA6 and PPS matrices, that are fabricated under three process conditions. The comparison among different matrices and process conditions discloses the characteristics of each matrix/interface system. Then existent models are applied to predict the tensile strength of the unidirectional laminate and clarify the failure modes in the possible range of parameters typical for CFRTP. In addition, failure mechanisms, which cannot be followed by the existent models, are also analyzed with the newly proposed models. SRPP, which is chemically identical to conventional PP but consists of highly oriented PP, is attractive for combining with CFRTP, especially with CFRPP. Since PP has an extremely low density, the combination of one of the strongest material, CF and PP has a potential to achieve the highest specific stiffness and strength. In addition, SRPP exhibit much higher modulus/strength than the conventional PP and even higher impact resistance than typical GFRP composites. In preliminary research, the first hybrid composites combined with woven based CFRPP and SRPP were presented. Utilizing the SRPP shrinkage during consolidation, the higher tensile failure strain of the hybrids in comparison with sole CFRPP was achieved. However, the crimp structure of woven fabric makes it difficult to analyse whether it is a hybrid effect. The second goal of this study is to propose a novel design of hybrid composite using SRPP and CFRPP. The hybrid effect is demonstrated with focus on the SRPP shrinkage and toughness (described in Chapter 3). The usage of unidirectional prepreg of CFRPP should allow to clarify whether they bring hybrid effects or not and if so to evaluate the SRPP contribution. Furthermore, a simultaneous improvement of modulus/strength and energy absorption is tried.
40
Chapter 2 Failure mechanisms in carbon fibre reinforced
thermoplastic composites
2.1 Introduction This study aims to disclose the micromechanics of carbon fibre reinforced thermoplastic composites (CFRTP) and to extract hints of utilizing their material potential to further improve their mechanical properties. Properties of unidirectional laminates govern the fundamental features of composite materials, even quasi-isotropic laminates or sheet moulding compounds. Therefore, this study focuses on unidirectional laminates using CFRTP prepreg. First, the microscopic mechanical properties, such as the interfacial strength and the residual stress, which probably contribute to the global mechanical properties of 0º and 90º unidirectional laminates, are discussed. Matrix/interface dominated parameters and process dependencies are investigated. Methods for deducing these properties are proposed. In the next step, constitutive models connecting the microscopic properties to the 0º tensile strength are proposed. Conventional methods which are seemingly suitable for this research approach are chosen and partially modified. Parameter studies using CFRTP properties reveal the 0º tensile failure characteristics and matrix/interfacial contributions.
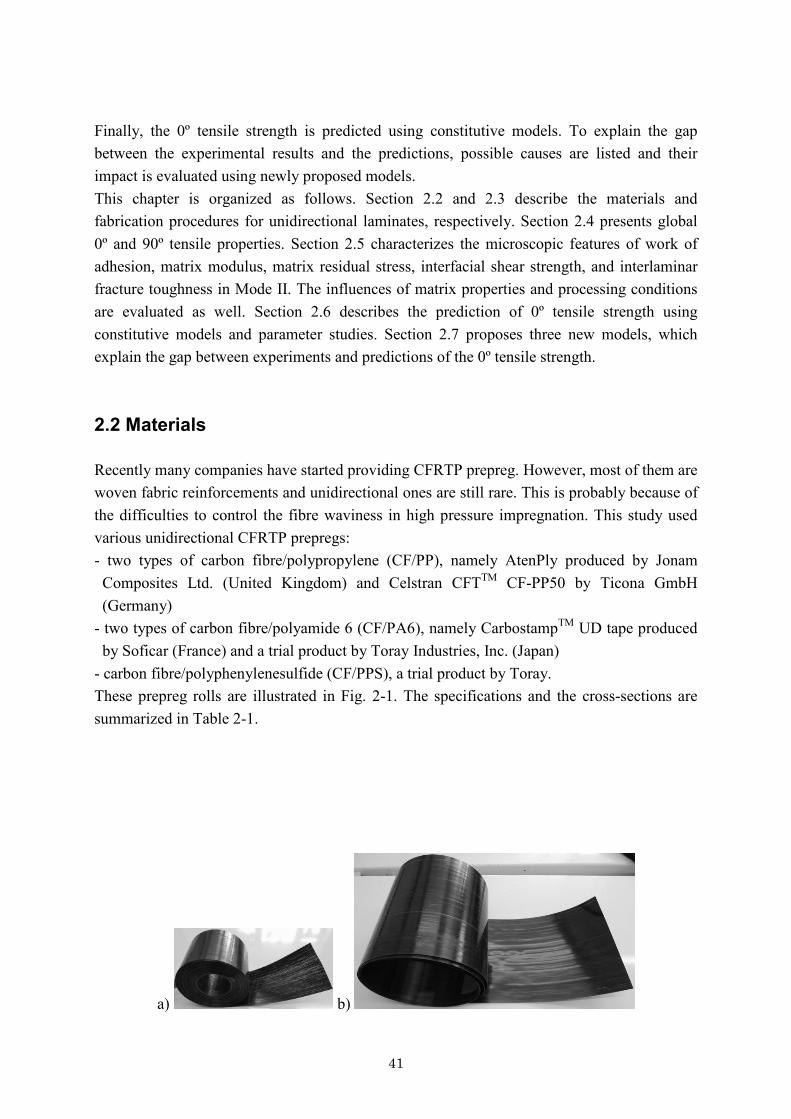
41
Finally, the 0º tensile strength is predicted using constitutive models. To explain the gap between the experimental results and the predictions, possible causes are listed and their impact is evaluated using newly proposed models. This chapter is organized as follows. Section 2.2 and 2.3 describe the materials and fabrication procedures for unidirectional laminates, respectively. Section 2.4 presents global 0º and 90º tensile properties. Section 2.5 characterizes the microscopic features of work of adhesion, matrix modulus, matrix residual stress, interfacial shear strength, and interlaminar fracture toughness in Mode II. The influences of matrix properties and processing conditions are evaluated as well. Section 2.6 describes the prediction of 0º tensile strength using constitutive models and parameter studies. Section 2.7 proposes three new models, which explain the gap between experiments and predictions of the 0º tensile strength. 2.2 Materials Recently many companies have started providing CFRTP prepreg. However, most of them are woven fabric reinforcements and unidirectional ones are still rare. This is probably because of the difficulties to control the fibre waviness in high pressure impregnation. This study used various unidirectional CFRTP prepregs: - two types of carbon fibre/polypropylene (CF/PP), namely AtenPly produced by Jonam
Composites Ltd. (United Kingdom) and Celstran CFTTM CF-PP50 by Ticona GmbH (Germany)
- two types of carbon fibre/polyamide 6 (CF/PA6), namely CarbostampTM UD tape produced by Soficar (France) and a trial product by Toray Industries, Inc. (Japan)
- carbon fibre/polyphenylenesulfide (CF/PPS), a trial product by Toray. These prepreg rolls are illustrated in Fig. 2-1. The specifications and the cross-sections are summarized in Table 2-1.
a) b)

42
c) d)
Fig. 2-1 CFRTP prepreg rolls: CF/PP (Jonam) (a), CF/PP (Ticona) (b), CF/PA6 (Soficar) (c) and CF/PPS (Toray) (d) Table 2-1 CFRTP prepreg specifications and cross-sections
Manufacturar Matrix Fibre Density(g/cm3)
T m
(ºC)T c
(ºC)V f
(%)Thickness(mm)
Cross-section
AtenPly JonamComposites
PP CFT700S
1.26 142 107 40(40.4*1)
0.15
Celstran CFTTM
PP-CF50Ticona PP CF 1.20 164 119 33
(34.0*1)0.25
CarbostampTM
UD TapeSoficar PA6 CF
T700S1.46 216 183 50
(53.8*1)0.15
Trial product TorayIndustries
PA6 CFT700S
1.53 219 185 60(58.6*1)(60.7*2)
0.15
Trial product TorayIndustries
PPS CFT700S
1.61 279 229 60(62.1*2)
0.15
*1 matrix burning-off*2 image processing
As references, a unidirectional prepreg of carbon fibre/polyamide 12 (CF/PA12) and two unidirectional carbon fibre/epoxy composites (CF/Epoxy) of pultruded laminate produced by Soficar and an autoclaved laminate made of TORAYCATM prepreg P3252S-15 (experimental data was provided by Dr. K. Ogi and Dr. S. Yashiro in Ehime university) were prepared. The epoxy resin used for Soficar’s material had a low viscosity for pultrusion and was not so tough. The Toray’s resin #2521R (Toray) was much more ductile and tough. The specifications are summarized in Table 2-2.
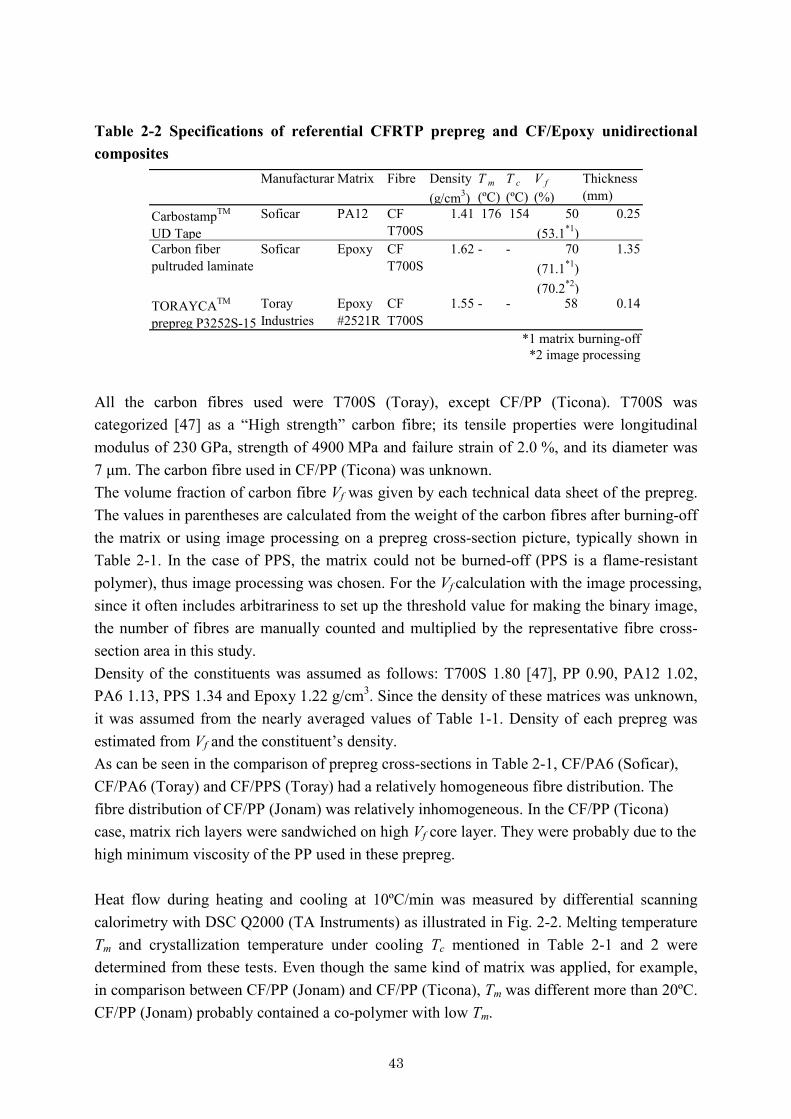
43
Table 2-2 Specifications of referential CFRTP prepreg and CF/Epoxy unidirectional composites
Manufacturar Matrix Fibre Density(g/cm3)
T m
(ºC)T c
(ºC)V f
(%)Thickness(mm)
CarbostampTM
UD TapeSoficar PA12 CF
T700S1.41 176 154 50
(53.1*1)0.25
Carbon fiberpultruded laminate
Soficar Epoxy CFT700S
1.62 - - 70(71.1*1)(70.2*2)
1.35
TORAYCATM
prepreg P3252S-15TorayIndustries
Epoxy#2521R
CFT700S
1.55 - - 58 0.14
*1 matrix burning-off*2 image processing
All the carbon fibres used were T700S (Toray), except CF/PP (Ticona). T700S was categorized [47] as a “High strength” carbon fibre; its tensile properties were longitudinal modulus of 230 GPa, strength of 4900 MPa and failure strain of 2.0 %, and its diameter was 7 μm. The carbon fibre used in CF/PP (Ticona) was unknown. The volume fraction of carbon fibre Vf was given by each technical data sheet of the prepreg. The values in parentheses are calculated from the weight of the carbon fibres after burning-off the matrix or using image processing on a prepreg cross-section picture, typically shown in Table 2-1. In the case of PPS, the matrix could not be burned-off (PPS is a flame-resistant polymer), thus image processing was chosen. For the Vf calculation with the image processing, since it often includes arbitrariness to set up the threshold value for making the binary image, the number of fibres are manually counted and multiplied by the representative fibre cross-section area in this study. Density of the constituents was assumed as follows: T700S 1.80 [47], PP 0.90, PA12 1.02, PA6 1.13, PPS 1.34 and Epoxy 1.22 g/cm3. Since the density of these matrices was unknown, it was assumed from the nearly averaged values of Table 1-1. Density of each prepreg was estimated from Vf and the constituent’s density. As can be seen in the comparison of prepreg cross-sections in Table 2-1, CF/PA6 (Soficar), CF/PA6 (Toray) and CF/PPS (Toray) had a relatively homogeneous fibre distribution. The fibre distribution of CF/PP (Jonam) was relatively inhomogeneous. In the CF/PP (Ticona) case, matrix rich layers were sandwiched on high Vf core layer. They were probably due to the high minimum viscosity of the PP used in these prepreg. Heat flow during heating and cooling at 10ºC/min was measured by differential scanning calorimetry with DSC Q2000 (TA Instruments) as illustrated in Fig. 2-2. Melting temperature Tm and crystallization temperature under cooling Tc mentioned in Table 2-1 and 2 were determined from these tests. Even though the same kind of matrix was applied, for example, in comparison between CF/PP (Jonam) and CF/PP (Ticona), Tm was different more than 20ºC. CF/PP (Jonam) probably contained a co-polymer with low Tm.
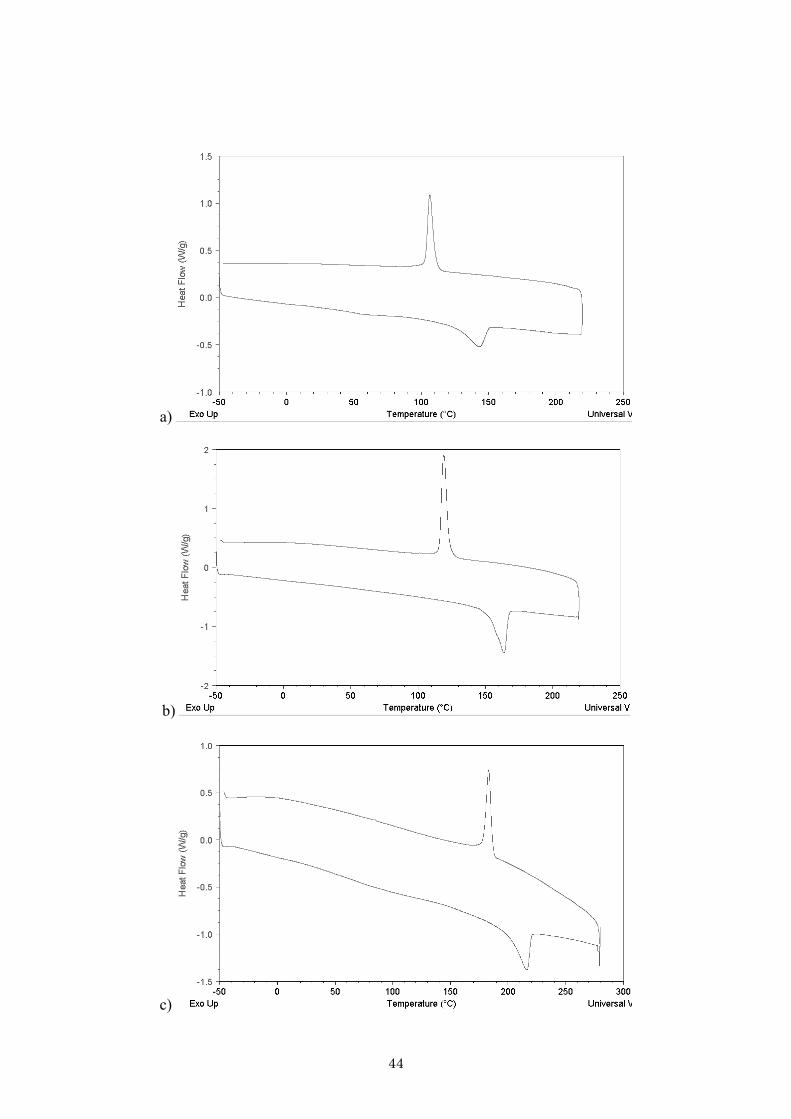
44
a)
b)
c)
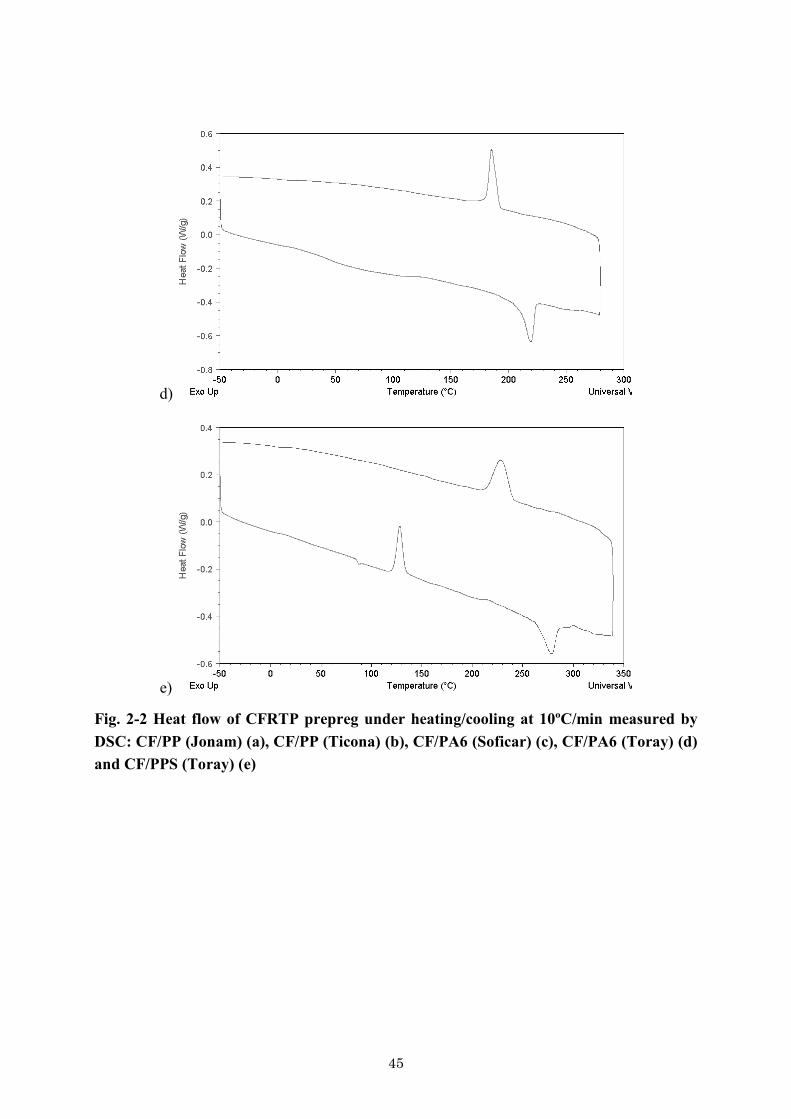
45
d)
e)
Fig. 2-2 Heat flow of CFRTP prepreg under heating/cooling at 10ºC/min measured by DSC: CF/PP (Jonam) (a), CF/PP (Ticona) (b), CF/PA6 (Soficar) (c), CF/PA6 (Toray) (d) and CF/PPS (Toray) (e)

46
2.3 Fabrication Unidirectional laminates used in 0º and 90º tensile tests and end notched flexure (ENF) tests were fabricated with the hot pressing machine Zenith 2 (Pinette Emidecau Industries) as shown in Fig. 2-3.
Fig. 2-3 Hot-pressing machine Two moulds shown in Fig. 2-4 were designed for 15 mm and 25 mm wide coupons, respectively. Six slender channels provided the individual coupons, avoiding cutting the coupons from the moulded plates. This was a countermeasure against the fact that sticky thermoplastic polymer, especially PP, made the diamond saw dull. Therefore, prepregs were cut into the length and width as needed for the coupons. Thickness of the coupons was controlled by spacers at both edges of the slender channels between upper and lower mould. The cut plies were stacked in designated stacking sequences and filled into the mould. Then, the mould was placed into the hot-pressing machine, pre-heated at the designated temperature.
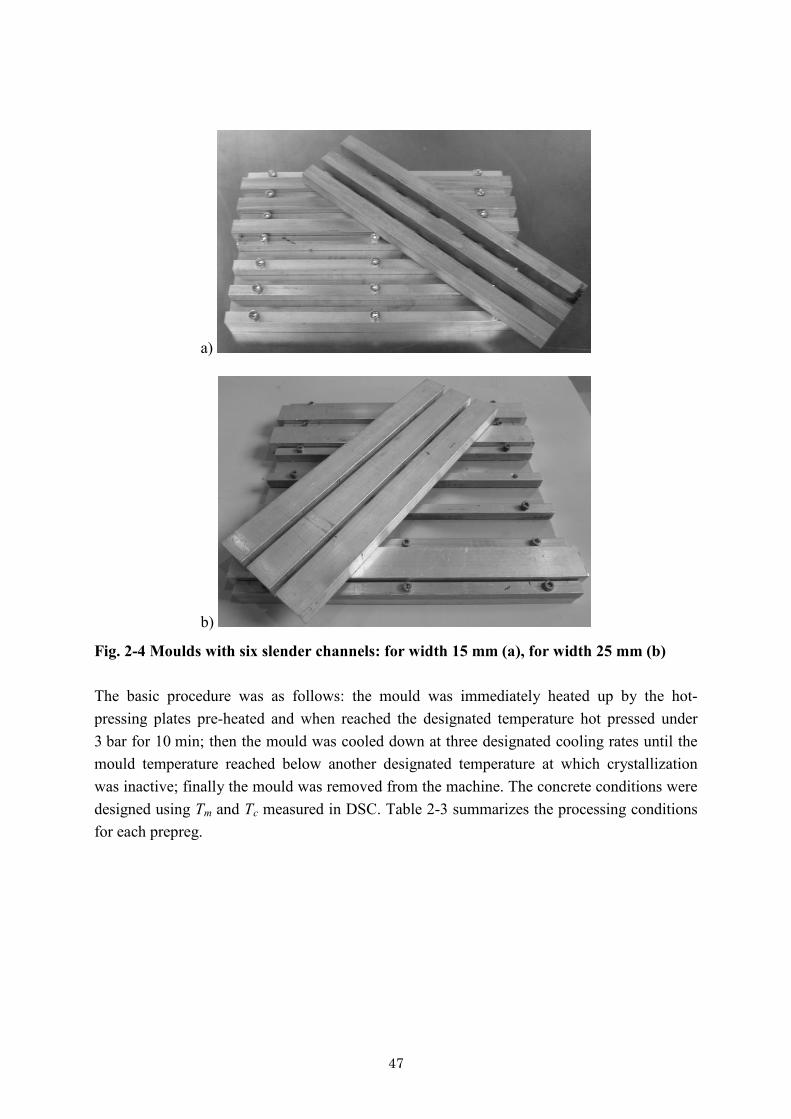
47
a)
b)
Fig. 2-4 Moulds with six slender channels: for width 15 mm (a), for width 25 mm (b) The basic procedure was as follows: the mould was immediately heated up by the hot-pressing plates pre-heated and when reached the designated temperature hot pressed under 3 bar for 10 min; then the mould was cooled down at three designated cooling rates until the mould temperature reached below another designated temperature at which crystallization was inactive; finally the mould was removed from the machine. The concrete conditions were designed using Tm and Tc measured in DSC. Table 2-3 summarizes the processing conditions for each prepreg.

48
Table 2-3 Process conditions for making unidirectional laminates Stacking condition Cooling Heating Dwelling Cooling Demolding V f
Thickness Ply num rate Rate Temperature Pressure Time Rate Temperature(mm) (°C/min) (°C) (bar) (min) (°C/min) (°C) (%)
CF/PP(Jonam)
0.15 8 Medium 25 165 3 10 4 50 39.7*1
0.25 4 Fast 25 175 3 10 50 50 33.8*1
Medium 25 175 3 10 4 50 33.8*1
Slow 25 175 3 10 1 50 34.0*1
CF/PA12(Soficar)
0.25 4 Medium 30 190 3 10 6 100 54.3*1
0.15 8 Fast 40 240 3 10 80 120 50.3*1
Medium 40 240 3 10 7 120 51.9*1
Slow 40 240 3 10 1 120 52.9*1
CF/PA6(Toray)
0.15 8 Medium 40 240 3 10 7 120 59.8*1
0.15 8 Fast 50 300 3 10 100 150 59.7*2
Medium 50 300 3 10 10 150 60.2*2
Slow 50 300 3 10 1 150 58.4*2
*1 matrix burning-off*2 image processing
CF/PP(Ticona)
CF/PA6(Soficar)
CF/PPS(Toray)
For the prepregs, CF/PP (Ticona), CF/PA6 (Soficar) and CF/PPS (Toray) three different cooling rates, namely “Fast”, “Medium” and “Slow”, were applied to evaluate the influence of the processing conditions, because properties of semi-crystalline thermoplastic polymers are sensitive to the crystal growth. “Fast” cooling means that the mould was moved to a cold press at room temperature under the same pressure immediately after hot pressing. The hot pressing machine used in this study (Fig. 2-3) had two compression zones in series; the upper one was at the designated hot-pressing temperature, while the lower one was always cooled at room temperature. This system easily allowed an immediate transfer from the hot press (upper part) to the cold press (lower part) under the same pressure. “Medium” means that the mould was cooled down in the upper zone as fast as possible while keeping the pressure. “Slow” means the mould was cooled down inside the upper part at 1ºC/min while keeping the pressure. The real temperature profiles in the mould, which were different from the programmed ones for the hot-pressing machine, were checked with a thermocouple. The thermocouple was placed on the wall of the channel, where it was not directly in contact with the upper hot-pressing plate and the middle position of the mould. Fig. 2-5 illustrates the temperature profile of CF/PPS (Toray). Heating and cooling rates are apparently not constant. In this study, heating rates were averaged during heating procedures and cooling rates were chosen around Tc, which was the most important for crystallization. These values were not stable depending on machine conditions or room temperature; Table 2-3 shows them as indicative rounded values.

49
0
50
100
150
200
250
300
350
0 5 10 15 20 25 30 35Processing time (min)
Tem
pera
ture
(ºC
)
FastMedium
Slow
Demolding Demolding
Pressing
Heating Dwelling Cooling
Fig. 2-5 Processing temperature procedures of CF/PPS (Toray) observed by thermocouple In order to quantify these fabrication procedures, Vf was calculated from the weight of the carbon fibres after burning-off the matrix or by image processing on the laminate cross-section picture in the same manner as in section 2-2, and summarized in Table 2-3. Measured Vf of the unidirectional laminates was more or less the same as that of the prepreg. This confirmed that only a small amount of matrix polymer was squeezed out during the above mentioned fabrication. Since the density of the matrix polymers was unsure, Vf calculated from the matrix burning-off method, except for CF/PPS, might not be very accurate. Furthermore, each coupon may have scattered Vf from the representative coupons measured their Vf. Therefore, hereafter Vf was assigned the figure which is given by each technical data sheet of the prepreg as described in Table 2-1 and 2 for calculations performed below. The 0º and 90º unidirectional laminates for the tensile tests were fabricated as follows. The 0° coupons had 230 mm length, 15 mm width and around 1 mm thickness. The 90° coupons had 80 mm length, 15 mm width and around 1 mm thickness. 0º unidirectional laminates for ENF tests were fabricated as 140 mm length, 25 mm width and around 3 mm thickness. Aluminium foils with 20 μm thickness, and treated with release agent ChemleaseTM, were cut into 40 mm length and 25 mm width and inserted into the symmetry plane of the stacks at one edge before moulding to produce a pre-crack. Cross-sections of the laminates for the 0º tensile tests are compared in Fig. 2-6. No voids are found inside. This implies that the processing conditions were appropriate for each system. Both CF/PP (Jonam) and CF/PP (Ticona) have a biased fibre distribution; a “bundle” like fibre agglomeration can be found. CF/PA6 (Soficar and Ticona) and CF/PPS (Toray) still contain thin resin rich interlayers. These come from the resin coated prepreg. As compared
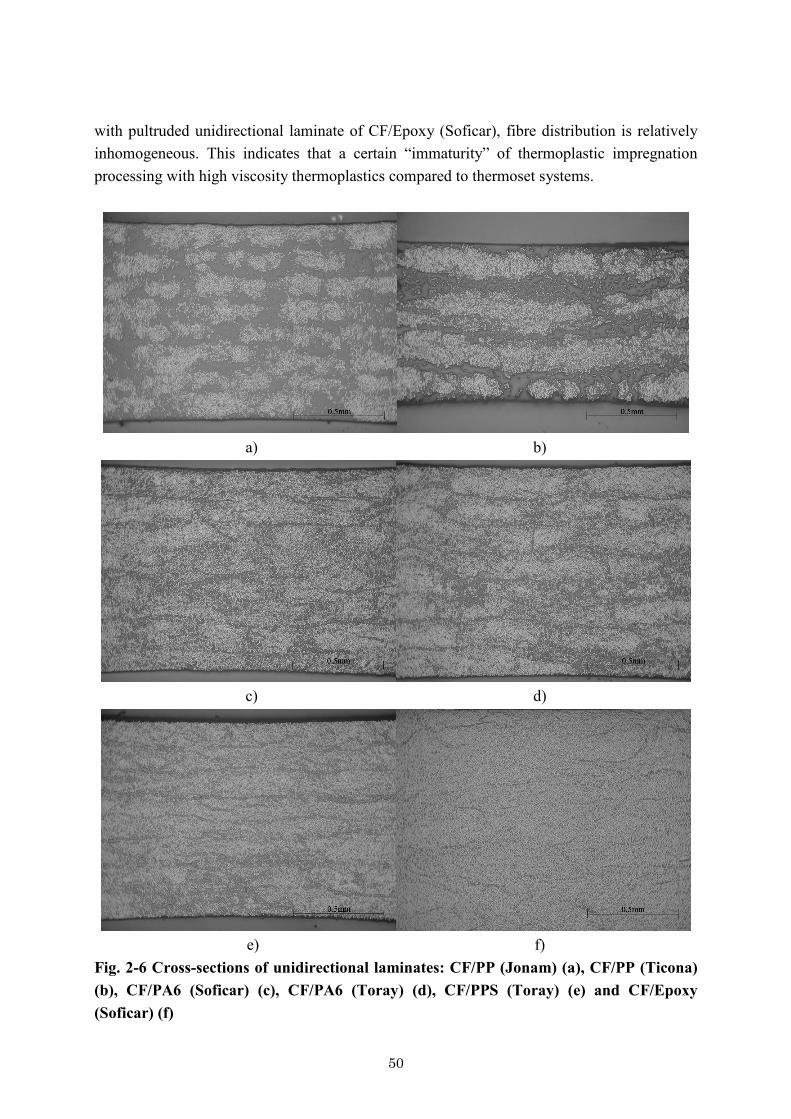
50
with pultruded unidirectional laminate of CF/Epoxy (Soficar), fibre distribution is relatively inhomogeneous. This indicates that a certain “immaturity” of thermoplastic impregnation processing with high viscosity thermoplastics compared to thermoset systems.
a) b)
c) d)
e) f)
Fig. 2-6 Cross-sections of unidirectional laminates: CF/PP (Jonam) (a), CF/PP (Ticona) (b), CF/PA6 (Soficar) (c), CF/PA6 (Toray) (d), CF/PPS (Toray) (e) and CF/Epoxy (Soficar) (f)

51
2.4 Tensile properties of unidirectional composites The tensile properties of 0° and 90° unidirectional laminates were measured. Influences of matrix (PP, PA12, PA6, PPS and Epoxy) and cooling rates (Fast, Medium and Slow) on these global mechanical properties were quantitatively analyzed. 2.4.1 0° tensile strength Seven kinds of thermoplastic prepregs and two epoxy unidirectional composites were investigated in parallel. The coupons had 230 mm length and 15 mm width (span length is 150 mm). Tabs made of glass fibre woven/epoxy prepregs stacked in 45º direction with 1.5 mm thickness were cut in 40 mm length and 15 mm width (without taper) and bonded to the sand-blasted surface of the coupon with Araldite 2011TM epoxy glue. The coupons were put between two press plates and compressed at room temperature for 1 day. Tensile tests were performed according to ASTM D3039 with Instron 4505 tensile testing machine equipped with hydraulic grips. Cross-head speed was 2 mm/min, corresponding to a strain rate of 80 %/h. An extensometer with a gauge length of 50 mm was attached to the coupons by means of two rubber bands. To avoid damage to the device at failure of the coupons, the extensometer was removed at 0.5 % strain. The computer connected to the machine registered the extensometer strain first, and then the measured displacement of the grips after the removal. After the tests, adjustment of the stiffness slopes measured from the extensometer and the grip displacement around 0.5 % corrected the grip displacement into the true strain. Sometimes, compliance of the machine and tabs changed throughout the tests. Therefore, the “calculated” failure strain was sometimes not so accurate. The modulus was calculated on the average slope of the stress-strain curves in the range of 0.1 - 0.3 % strain. The number of coupons was twelve each for CF/PP (Ticona), CF/PA6 (Soficar) and CF/PPS (Toray) at three different cooling rates. The other tests were three each except four for CF/Epoxy (Soficar). Stress-strain curves of CF/Epoxy (Toray) were measured in Ehime University by Dr. K. Ogi and Dr. S. Yashiro; the true strain was measured by strain gauge. Table 2-4 summarizes the tensile testing results. Due to the inaccuracy of the calculated strain, strain at maximum stress is shown only as averaged value for reference. Figs. 2-7 to 10 illustrate the representative stress-strain curves for each test and Figs. 2-11 to 14 show the representative fracture coupons. CF/PA12 (Soficar) failed in compression due to sudden load release following the tab slippage as the fracture coupon illustrated in Fig. 2-14b. Probably the shear yield stress of PA12 was too small to cause shear failure at the composite surface bonded to the tab; the strength was limited to much lower value than the material potential. Thus, CF/PA12 was removed from further analysis.
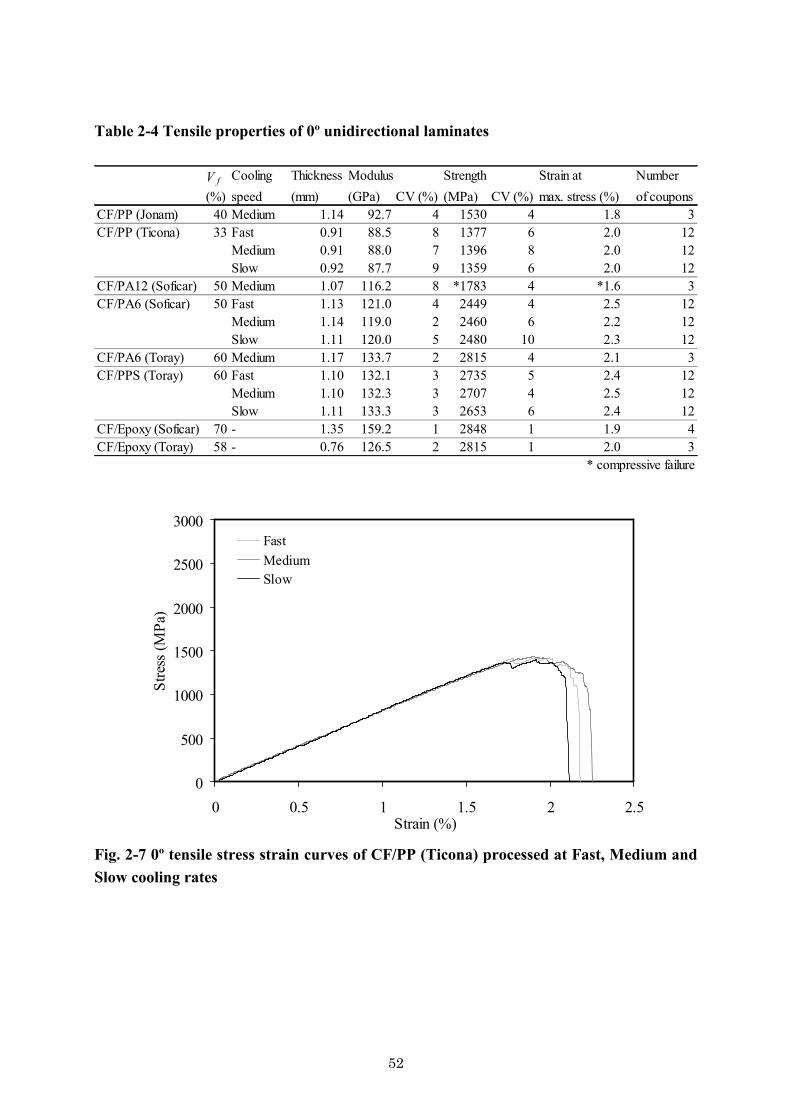
52
Table 2-4 Tensile properties of 0º unidirectional laminates
V f Cooling Thickness Strain at Number(%) speed (mm) (GPa) CV (%) (MPa) CV (%) max. stress (%) of coupons
CF/PP (Jonam) 40 Medium 1.14 92.7 4 1530 4 1.8 3CF/PP (Ticona) 33 Fast 0.91 88.5 8 1377 6 2.0 12
Medium 0.91 88.0 7 1396 8 2.0 12Slow 0.92 87.7 9 1359 6 2.0 12
CF/PA12 (Soficar) 50 Medium 1.07 116.2 8 *1783 4 *1.6 3CF/PA6 (Soficar) 50 Fast 1.13 121.0 4 2449 4 2.5 12
Medium 1.14 119.0 2 2460 6 2.2 12Slow 1.11 120.0 5 2480 10 2.3 12
CF/PA6 (Toray) 60 Medium 1.17 133.7 2 2815 4 2.1 3CF/PPS (Toray) 60 Fast 1.10 132.1 3 2735 5 2.4 12
Medium 1.10 132.3 3 2707 4 2.5 12Slow 1.11 133.3 3 2653 6 2.4 12
CF/Epoxy (Soficar) 70 - 1.35 159.2 1 2848 1 1.9 4CF/Epoxy (Toray) 58 - 0.76 126.5 2 2815 1 2.0 3
* compressive failure
Modulus Strength
0
500
1000
1500
2000
2500
3000
0 0.5 1 1.5 2 2.5Strain (%)
Stre
ss (M
Pa)
FastMediumSlow
Fig. 2-7 0º tensile stress strain curves of CF/PP (Ticona) processed at Fast, Medium and Slow cooling rates

53
0
500
1000
1500
2000
2500
3000
0 0.5 1 1.5 2 2.5Strain (%)
Stre
ss (M
Pa)
FastMediumSlow
Fig. 2-8 0º tensile stress strain curves of CF/PA6 (Soficar) processed at Fast, Medium and Slow cooling rates
0
500
1000
1500
2000
2500
3000
0 0.5 1 1.5 2 2.5Strain (%)
Stre
ss (M
Pa)
FastMediumSlow
Fig. 2-9 0º tensile stress strain curves of CF/PPS (Toray) processed at Fast, Medium and Slow cooling rates

54
a)
0
500
1000
1500
2000
2500
3000
0 0.5 1 1.5 2 2.5Strain (%)
Stre
ss (M
Pa)
b)
0
500
1000
1500
2000
2500
3000
0 0.5 1 1.5 2 2.5Strain (%)
Stre
ss (M
Pa)
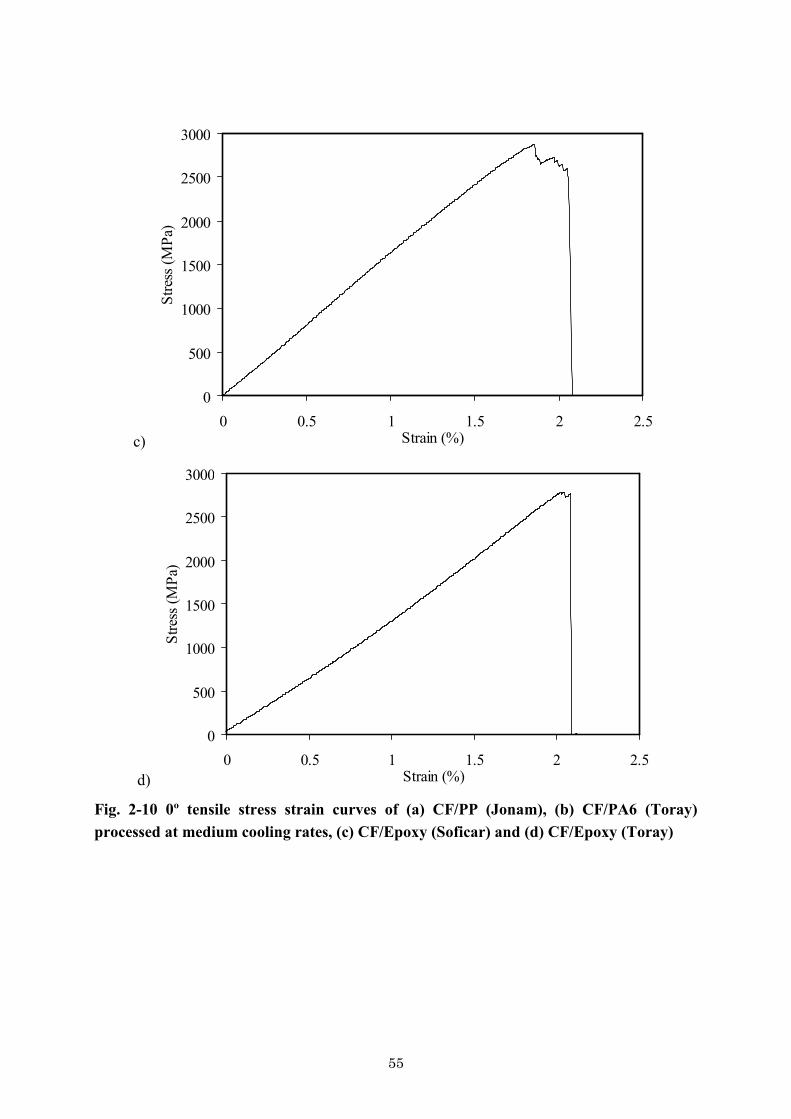
55
c)
0
500
1000
1500
2000
2500
3000
0 0.5 1 1.5 2 2.5Strain (%)
Stre
ss (M
Pa)
d)
0
500
1000
1500
2000
2500
3000
0 0.5 1 1.5 2 2.5Strain (%)
Stre
ss (M
Pa)
Fig. 2-10 0º tensile stress strain curves of (a) CF/PP (Jonam), (b) CF/PA6 (Toray) processed at medium cooling rates, (c) CF/Epoxy (Soficar) and (d) CF/Epoxy (Toray)

56
a)
b)
c)
Fig. 2-11 0º tensile fracture coupons of CF/PP (Ticona) processed at (a) Fast, (b) Medium and (c) Slow cooling rates
a)
b)
c) Fig. 2-12 0º tensile fracture coupons of CF/PA6 (Soficar) processed at (a) Fast, (b) Medium and (c) Slow cooling rates
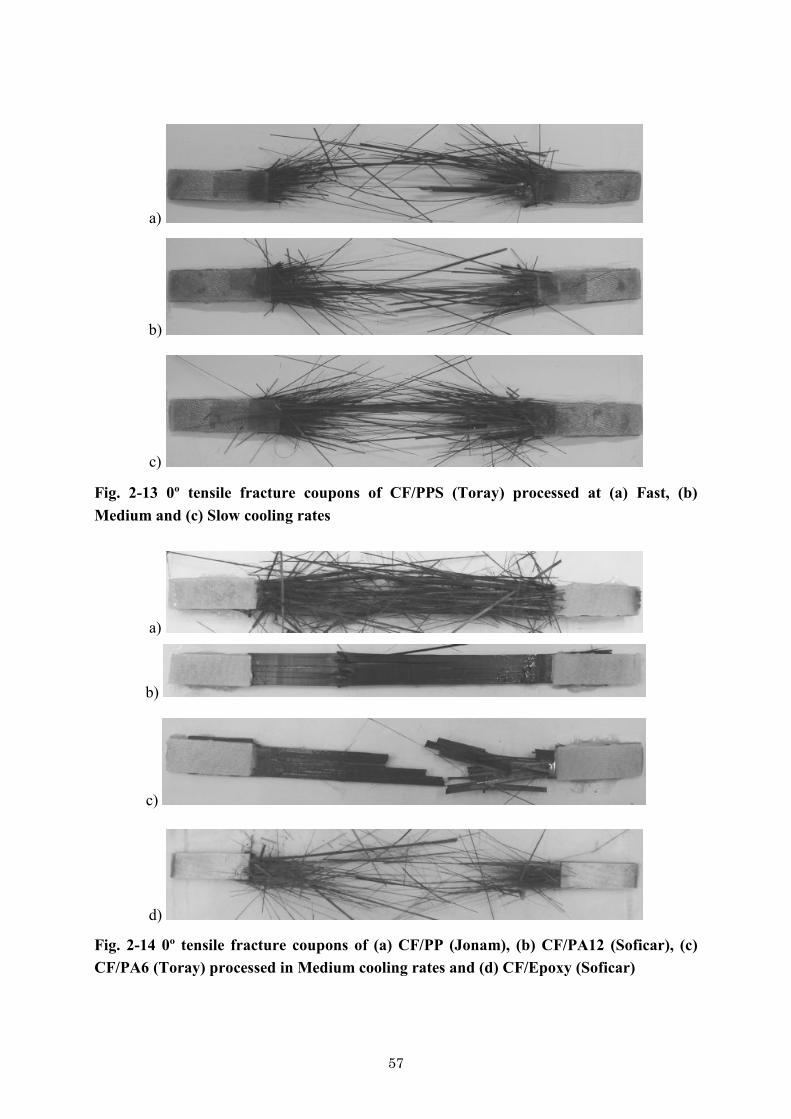
57
a)
b)
c)
Fig. 2-13 0º tensile fracture coupons of CF/PPS (Toray) processed at (a) Fast, (b) Medium and (c) Slow cooling rates
a)
b)
c)
d)
Fig. 2-14 0º tensile fracture coupons of (a) CF/PP (Jonam), (b) CF/PA12 (Soficar), (c) CF/PA6 (Toray) processed in Medium cooling rates and (d) CF/Epoxy (Soficar)
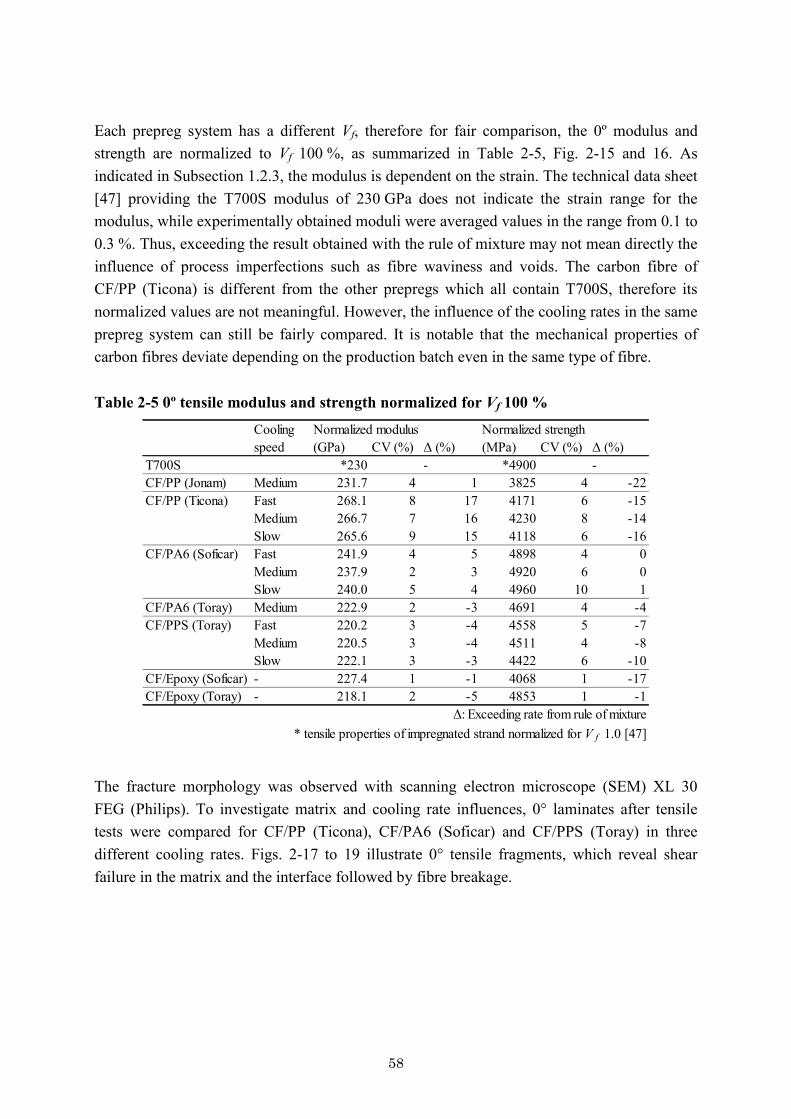
58
Each prepreg system has a different Vf, therefore for fair comparison, the 0º modulus and strength are normalized to Vf 100 %, as summarized in Table 2-5, Fig. 2-15 and 16. As indicated in Subsection 1.2.3, the modulus is dependent on the strain. The technical data sheet [47] providing the T700S modulus of 230 GPa does not indicate the strain range for the modulus, while experimentally obtained moduli were averaged values in the range from 0.1 to 0.3 %. Thus, exceeding the result obtained with the rule of mixture may not mean directly the influence of process imperfections such as fibre waviness and voids. The carbon fibre of CF/PP (Ticona) is different from the other prepregs which all contain T700S, therefore its normalized values are not meaningful. However, the influence of the cooling rates in the same prepreg system can still be fairly compared. It is notable that the mechanical properties of carbon fibres deviate depending on the production batch even in the same type of fibre. Table 2-5 0º tensile modulus and strength normalized for Vf 100 %
Coolingspeed (GPa) CV (%) Δ (%) (MPa) CV (%) Δ (%)
T700S *230 - *4900 -CF/PP (Jonam) Medium 231.7 4 1 3825 4 -22CF/PP (Ticona) Fast 268.1 8 17 4171 6 -15
Medium 266.7 7 16 4230 8 -14Slow 265.6 9 15 4118 6 -16
CF/PA6 (Soficar) Fast 241.9 4 5 4898 4 0Medium 237.9 2 3 4920 6 0Slow 240.0 5 4 4960 10 1
CF/PA6 (Toray) Medium 222.9 2 -3 4691 4 -4CF/PPS (Toray) Fast 220.2 3 -4 4558 5 -7
Medium 220.5 3 -4 4511 4 -8Slow 222.1 3 -3 4422 6 -10
CF/Epoxy (Soficar) - 227.4 1 -1 4068 1 -17CF/Epoxy (Toray) - 218.1 2 -5 4853 1 -1
Δ: Exceeding rate from rule of mixture* tensile properties of impregnated strand normalized for V f 1.0 [47]
Normalized modulus Normalized strength
The fracture morphology was observed with scanning electron microscope (SEM) XL 30 FEG (Philips). To investigate matrix and cooling rate influences, 0° laminates after tensile tests were compared for CF/PP (Ticona), CF/PA6 (Soficar) and CF/PPS (Toray) in three different cooling rates. Figs. 2-17 to 19 illustrate 0° tensile fragments, which reveal shear failure in the matrix and the interface followed by fibre breakage.
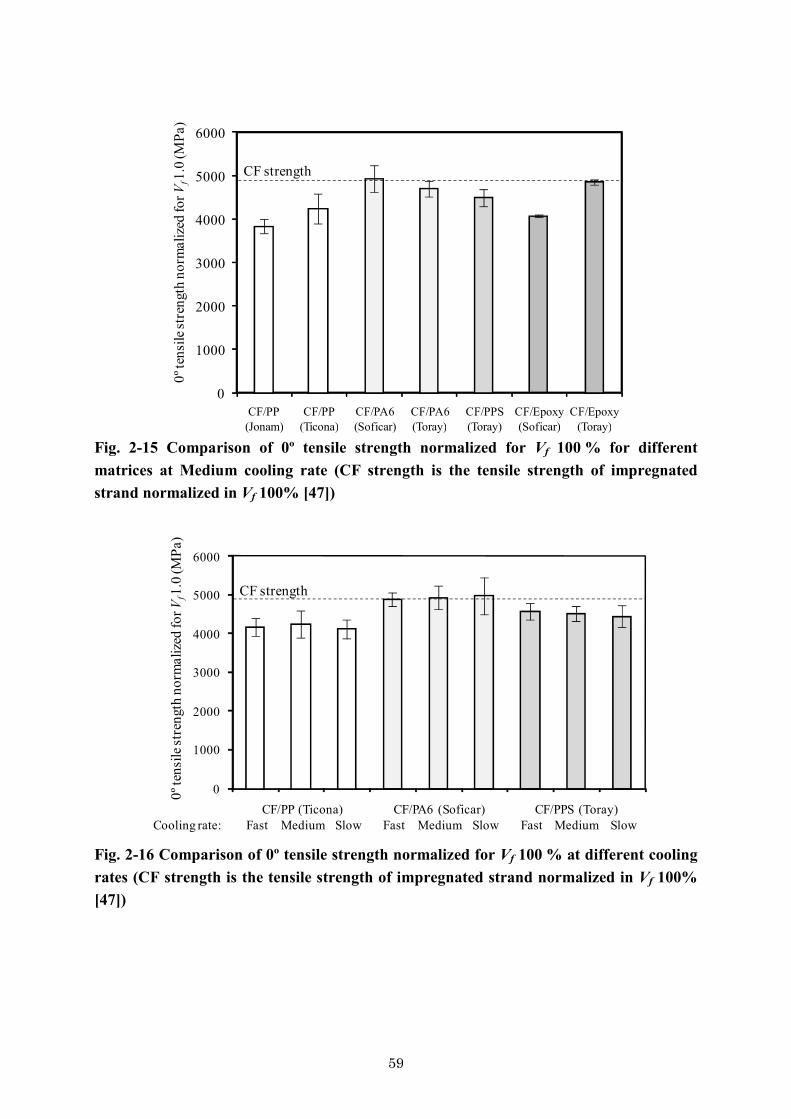
59
0
1000
2000
3000
4000
5000
6000
CF/PP(Jonam)
CF/PP(Ticona)
CF/PA6(Soficar)
CF/PA6(Toray)
CF/PPS(Toray)
CF/Epoxy(Soficar)
CF/Epoxy(Toray)
0º te
nsile
stre
ngth
nor
mal
ized
for V
f1.0
(MPa
)CF strength
Fig. 2-15 Comparison of 0º tensile strength normalized for Vf 100 % for different matrices at Medium cooling rate (CF strength is the tensile strength of impregnated strand normalized in Vf 100% [47])
FastCF/PP (Ticona)
Medium Slow FastCF/PA6 (Soficar)
Medium Slow FastCF/PPS (Toray)
Medium SlowCooling rate:
0º te
nsile
stre
ngth
nor
mal
ized
for V
f1.0
(MPa
)
0
1000
2000
3000
4000
5000
6000
CF strength
Fig. 2-16 Comparison of 0º tensile strength normalized for Vf 100 % at different cooling rates (CF strength is the tensile strength of impregnated strand normalized in Vf 100% [47])

60
a)
b)
c) Fig. 2-17 Fracture morphologies of CF/PP (Ticona) in 0º tensile tests observed by SEM: (a) Fast, (b) Medium and (c) Slow cooling rate
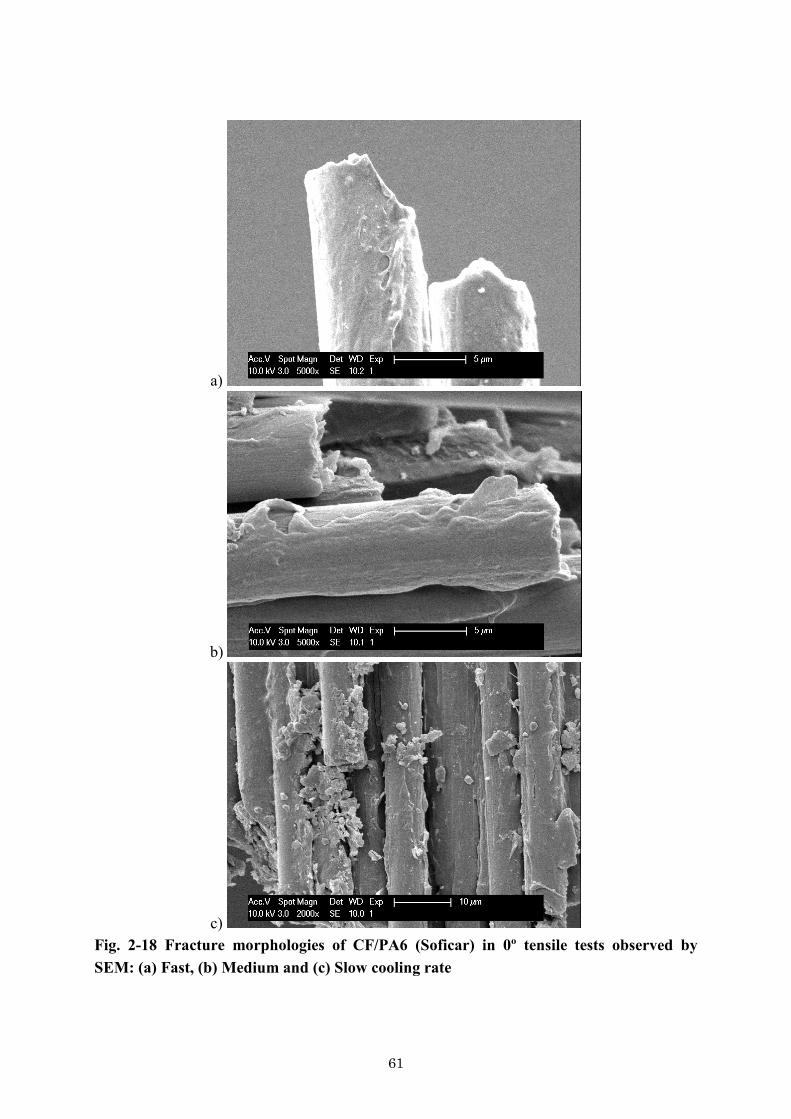
61
a)
b)
c) Fig. 2-18 Fracture morphologies of CF/PA6 (Soficar) in 0º tensile tests observed by SEM: (a) Fast, (b) Medium and (c) Slow cooling rate

62
a)
b)
c) Fig. 2-19 Fracture morphologies of CF/PPS (Toray) in 0º tensile tests observed by SEM: (a) Fast, (b) Medium and (c) Slow cooling rate
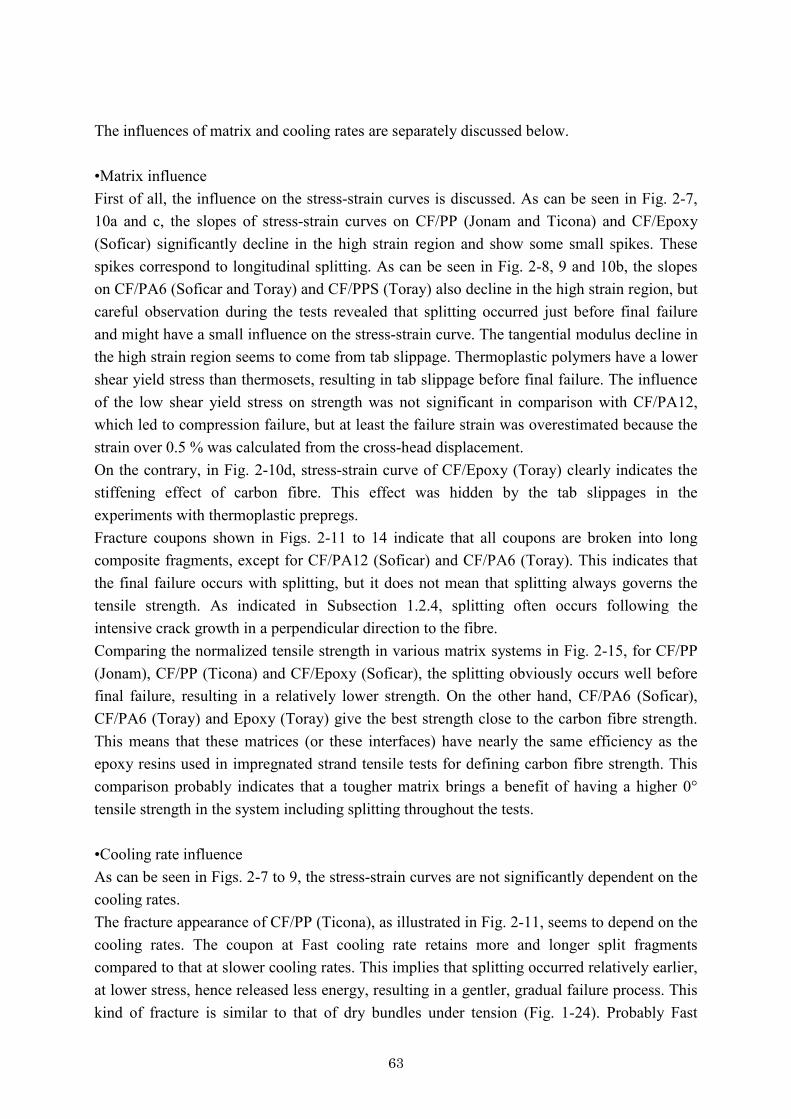
63
The influences of matrix and cooling rates are separately discussed below. •Matrix influence First of all, the influence on the stress-strain curves is discussed. As can be seen in Fig. 2-7, 10a and c, the slopes of stress-strain curves on CF/PP (Jonam and Ticona) and CF/Epoxy (Soficar) significantly decline in the high strain region and show some small spikes. These spikes correspond to longitudinal splitting. As can be seen in Fig. 2-8, 9 and 10b, the slopes on CF/PA6 (Soficar and Toray) and CF/PPS (Toray) also decline in the high strain region, but careful observation during the tests revealed that splitting occurred just before final failure and might have a small influence on the stress-strain curve. The tangential modulus decline in the high strain region seems to come from tab slippage. Thermoplastic polymers have a lower shear yield stress than thermosets, resulting in tab slippage before final failure. The influence of the low shear yield stress on strength was not significant in comparison with CF/PA12, which led to compression failure, but at least the failure strain was overestimated because the strain over 0.5 % was calculated from the cross-head displacement. On the contrary, in Fig. 2-10d, stress-strain curve of CF/Epoxy (Toray) clearly indicates the stiffening effect of carbon fibre. This effect was hidden by the tab slippages in the experiments with thermoplastic prepregs. Fracture coupons shown in Figs. 2-11 to 14 indicate that all coupons are broken into long composite fragments, except for CF/PA12 (Soficar) and CF/PA6 (Toray). This indicates that the final failure occurs with splitting, but it does not mean that splitting always governs the tensile strength. As indicated in Subsection 1.2.4, splitting often occurs following the intensive crack growth in a perpendicular direction to the fibre. Comparing the normalized tensile strength in various matrix systems in Fig. 2-15, for CF/PP (Jonam), CF/PP (Ticona) and CF/Epoxy (Soficar), the splitting obviously occurs well before final failure, resulting in a relatively lower strength. On the other hand, CF/PA6 (Soficar), CF/PA6 (Toray) and Epoxy (Toray) give the best strength close to the carbon fibre strength. This means that these matrices (or these interfaces) have nearly the same efficiency as the epoxy resins used in impregnated strand tensile tests for defining carbon fibre strength. This comparison probably indicates that a tougher matrix brings a benefit of having a higher 0° tensile strength in the system including splitting throughout the tests. •Cooling rate influence As can be seen in Figs. 2-7 to 9, the stress-strain curves are not significantly dependent on the cooling rates. The fracture appearance of CF/PP (Ticona), as illustrated in Fig. 2-11, seems to depend on the cooling rates. The coupon at Fast cooling rate retains more and longer split fragments compared to that at slower cooling rates. This implies that splitting occurred relatively earlier, at lower stress, hence released less energy, resulting in a gentler, gradual failure process. This kind of fracture is similar to that of dry bundles under tension (Fig. 1-24). Probably Fast

64
cooling provides a weak matrix or interface. On the contrary, CF/PA6 (Soficar) and CF/PPS (Toray) illustrated in Fig. 2-8 and 9 indicate no significant difference in fracture of coupons produced at different cooling rates. The normalized strength for different cooling rates is summarized in Fig. 2-16. Comparison was done using two sided Student t tests, which judge whether the difference of the average values was statistically significant or not. Even though twelve data were obtained for each test, significant difference could not be found under the probability P < 0.1 or 0.05. One can conclude that the cooling rate has less influence on the 0° tensile strength than the type of the matrix. As can be seen in the SEM pictures of Fig. 2-17, the fracture morphology of CF/PP (Ticona) is strongly dependent on the cooling rates. In the case of Fast cooling rate, the matrix fails in shear and the fibre surface is covered with matrix. On the contrary, Slow cooling exhibits interfacial debonding and a clean fibre surface. As cooling rate becomes slower, the “adhesion” looks worse. The matrix at Fast cooling rate is weak due to low degree of crystallinity, resulting in matrix cohesion failure. Slower cooling rate enhances crystal growth and leads to high matrix shear yield stress; the matrix shear yield stress becomes relatively stronger than the interfacial shear strength. Hence, failure mode is shifted from matrix cohesion failure to interfacial failure. As can be seen in the morphology of CF/PA6 (Soficar) illustrated in Fig. 2-18, the fibre surface is completely covered by matrix for all cooling rates. This implies good adhesion between CF and PA6. Fig. 2-19 illustrates the morphology of CF/PPS (Toray) where fibre surface looks clean for all cooling rates. First explanation is bad adhesion between CF and PPS. Second explanation is that the matrix itself is segmented and flied off due to brittleness of PPS (failure strain is around 1 %). 2.4.2 90° tensile strength Five kinds of thermoplastic prepreg and one epoxy unidirectional composites were investigated in parallel. The dimensions of the coupons were 80 mm length and 15 mm width (span length was 50 mm). Tensile tests were performed according to ASTM D3039 with Instron 4505 tensile testing machine equipped with pneumatic grips. Cross-head speed was 0.67 mm/min (same strain rate of 80 %/h as 0° tensile tests). An extensometer with a gauge length of 12.5 mm was attached to the coupons by means of two rubber bands. It measured strain until final failure. The modulus was calculated on the average slope of the stress-strain curves in the range of 0.1 - 0.3 % strain except CF/PP (Jonam and Ticona). The 90° laminates of CF/PP were often broken under 0.3 %, therefore the range for calculating the modulus was set as 0.0 - 0.1 %. The number of specimens was ten for each material system, CF/PP (Ticona), CF/PA6 (Soficar), CF/PPS (Toray) at three different cooling rates and CF/Epoxy (Soficar). The other tests were three each.
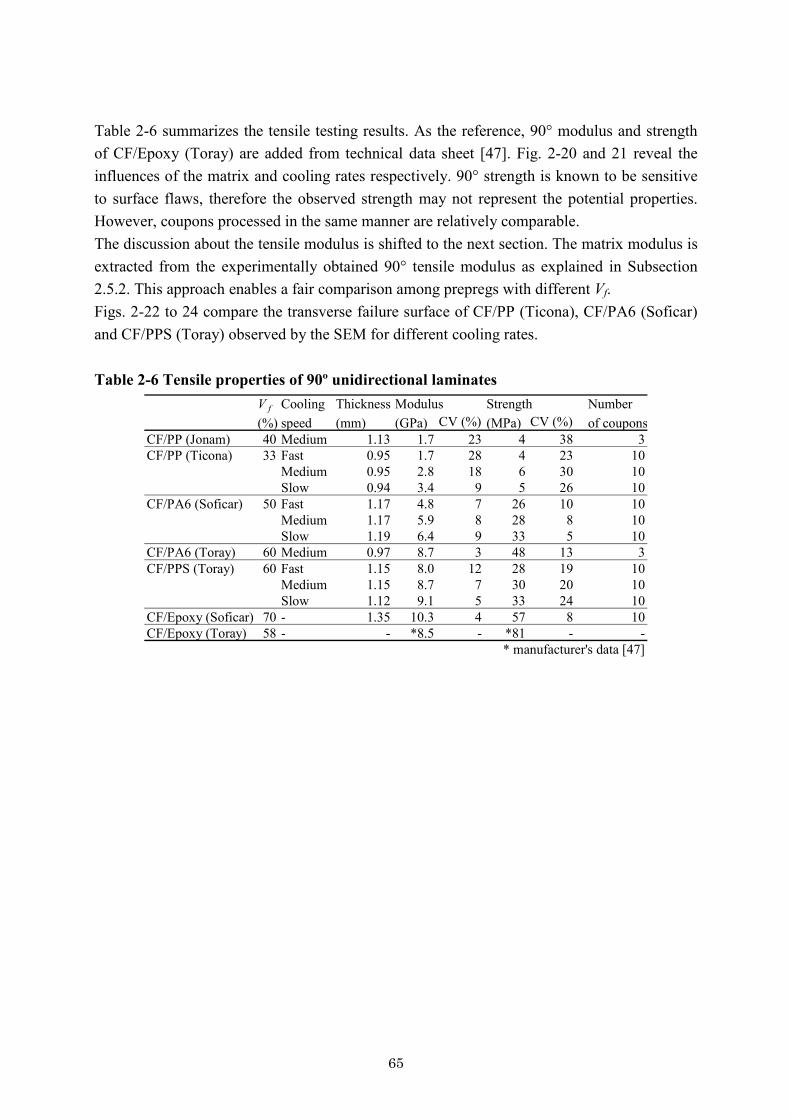
65
Table 2-6 summarizes the tensile testing results. As the reference, 90° modulus and strength of CF/Epoxy (Toray) are added from technical data sheet [47]. Fig. 2-20 and 21 reveal the influences of the matrix and cooling rates respectively. 90° strength is known to be sensitive to surface flaws, therefore the observed strength may not represent the potential properties. However, coupons processed in the same manner are relatively comparable. The discussion about the tensile modulus is shifted to the next section. The matrix modulus is extracted from the experimentally obtained 90° tensile modulus as explained in Subsection 2.5.2. This approach enables a fair comparison among prepregs with different Vf. Figs. 2-22 to 24 compare the transverse failure surface of CF/PP (Ticona), CF/PA6 (Soficar) and CF/PPS (Toray) observed by the SEM for different cooling rates. Table 2-6 Tensile properties of 90º unidirectional laminates
V f Cooling Thickness Number(%) speed (mm) (GPa) CV (%) (MPa) CV (%) of coupons
CF/PP (Jonam) 40 Medium 1.13 1.7 23 4 38 3CF/PP (Ticona) 33 Fast 0.95 1.7 28 4 23 10
Medium 0.95 2.8 18 6 30 10Slow 0.94 3.4 9 5 26 10
CF/PA6 (Soficar) 50 Fast 1.17 4.8 7 26 10 10Medium 1.17 5.9 8 28 8 10Slow 1.19 6.4 9 33 5 10
CF/PA6 (Toray) 60 Medium 0.97 8.7 3 48 13 3CF/PPS (Toray) 60 Fast 1.15 8.0 12 28 19 10
Medium 1.15 8.7 7 30 20 10Slow 1.12 9.1 5 33 24 10
CF/Epoxy (Soficar) 70 - 1.35 10.3 4 57 8 10CF/Epoxy (Toray) 58 - - *8.5 - *81 - -
* manufacturer's data [47]
Modulus Strength
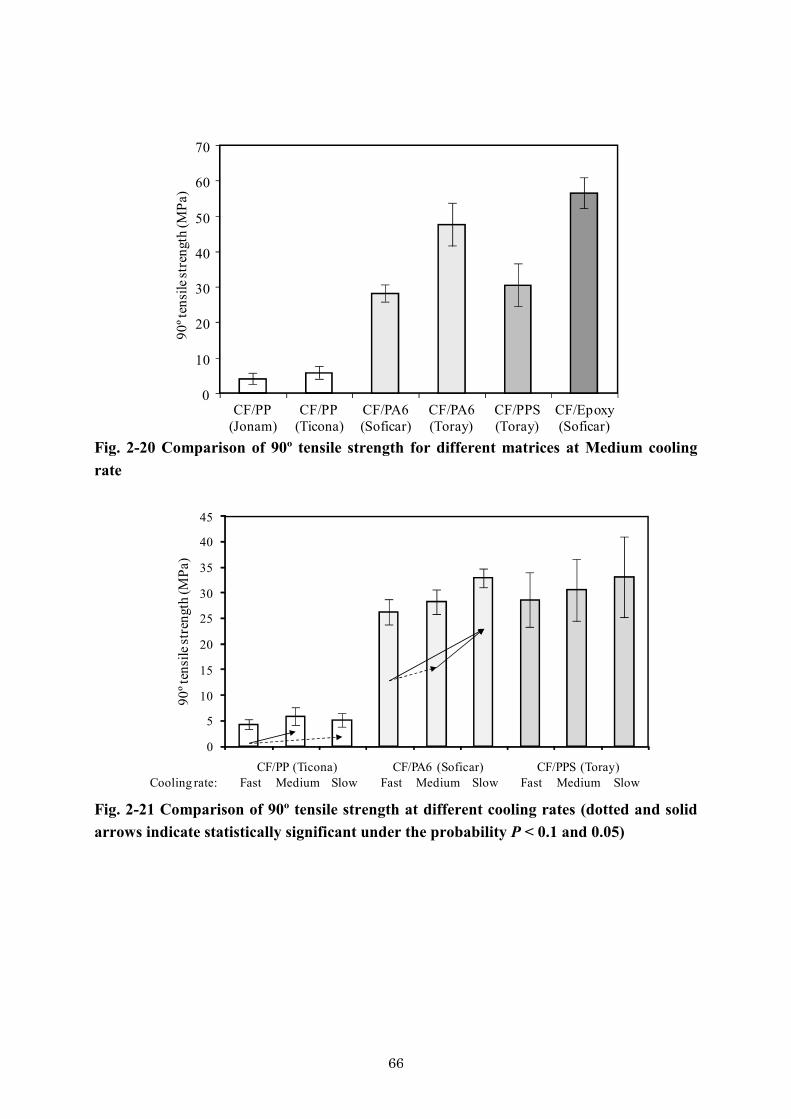
66
0
10
20
30
40
50
60
70
CF/PP(Jonam)
CF/PP(Ticona)
CF/PA6(Soficar)
CF/PA6(Toray)
CF/PPS(Toray)
CF/Epoxy(Soficar)
90º t
ensi
le st
reng
th (M
Pa)
Fig. 2-20 Comparison of 90º tensile strength for different matrices at Medium cooling rate
FastCF/PP (Ticona)
Medium Slow FastCF/PA6 (Soficar)
Medium Slow FastCF/PPS (Toray)
Medium SlowCooling rate:
90º t
ensi
le st
reng
th (M
Pa)
0
5
10
15
20
25
30
35
40
45
Fig. 2-21 Comparison of 90º tensile strength at different cooling rates (dotted and solid arrows indicate statistically significant under the probability P < 0.1 and 0.05)
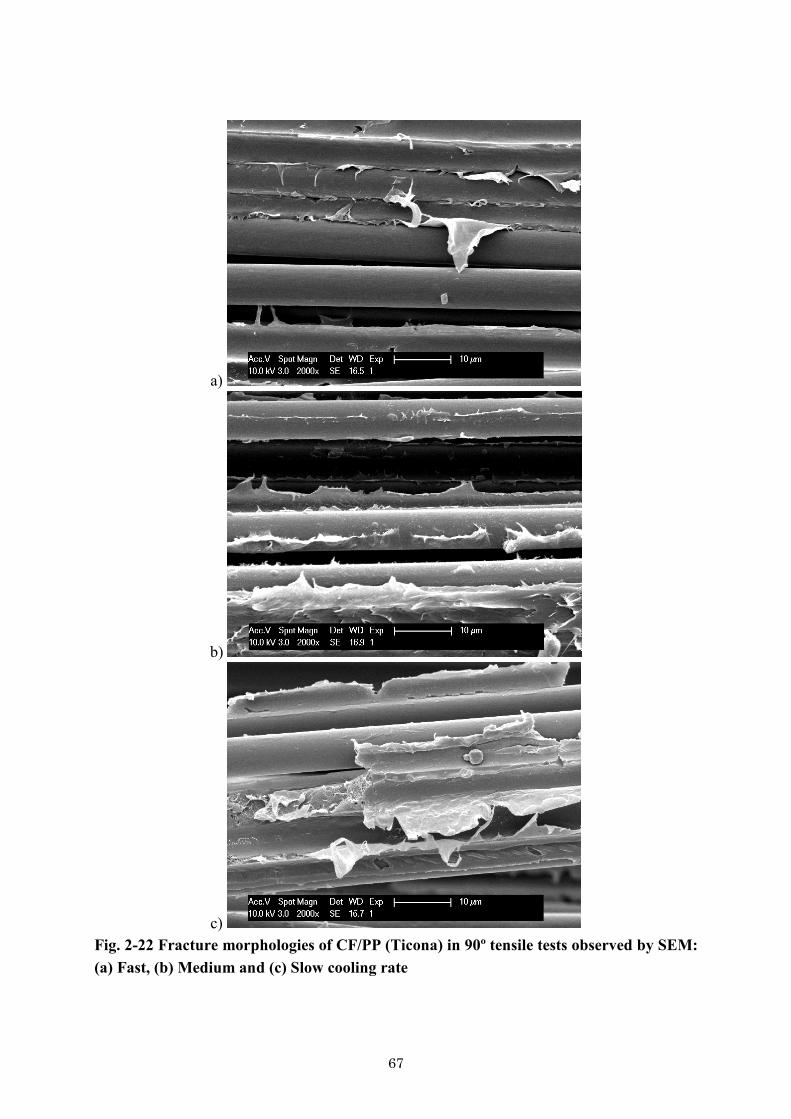
67
a)
b)
c) Fig. 2-22 Fracture morphologies of CF/PP (Ticona) in 90º tensile tests observed by SEM: (a) Fast, (b) Medium and (c) Slow cooling rate

68
a)
b)
c) Fig. 2-23 Fracture morphologies of CF/PA6 (Soficar) in 90º tensile tests observed by SEM: (a) Fast, (b) Medium and (c) Slow cooling rate

69
a)
b)
c) Fig. 2-24 Fracture morphologies of CF/PPS (Toray) in 90º tensile tests observed by SEM: (a) Fast, (b) Medium and (c) Slow cooling rate
70
The influences of matrix and cooling rates are separately discussed below. •Matrix influence As illustrated in Fig. 2-20, CF/PP exhibits a significantly lower strength than CF/PA6, PPS and Epoxy. The matrix or interfacial strength seems to be weak. Potential strength of CF/PPS may be higher because PPS matrix is very brittle so it is sensitive to surface flaws. This also affected a big scatter of 90° strength of CF/PPS. •Cooling rate influence As illustrated in Fig. 2-21, the slower cooling rate apparently led to a higher 90º strength in all systems (CF/PP, PA6 and PPS). Two sided Student t tests suggested a statistical difference in CF/PP and PA6 under the probability P < 0.1 (dotted arrow) or 0.05 (solid arrow) but did not suggest a difference in CF/PPS case. Consequently, the cooling rate influences the 90° tensile strength in the CF/PP and PA6 systems at least. Fig. 2-22 illustrates the fracture morphology of CF/PP (Ticona). The fibre surface looks clean and the matrix apparently sustains the applied load at all cooling rates. Matrix strength improvement probably results in a higher 90° strength, because the coupon cannot be divided without cutting the matrix anyway. From the view point of mechanics of elastic solids, stress concentration on the cylindrical surface of fibre in 90° laminate subjected tension takes a finite value, while that at the tip of a fibre breakage in a 0° laminate subjected tension goes to infinite. Even though the stress concentration at interface is less intensive than in the 0° tensile tests, interface failure occurred at Fast cooling rate (matrix cohesion failure in the case of 0° tensile tests). This implies that the interface between CF and PP is weaker under stress normal to fibre surface than under shear. Fig. 2-23 illustrates the fracture morphology of CF/PA6 (Soficar). The fibre surface is covered with matrix in the same manner as in the 0° tensile tests. Therefore, matrix strength improvement due to higher degree of crystallinity with slower cooling directly leads to an increase of the 90° tensile strength. Fig. 2-24 illustrates the morphology of CF/PPS (Toray). The fibre surface is partially covered with matrix. Stress concentration at interface in 90° tensile tests is smaller than that in 0° tensile tests, matrix may be able to stay on fibre.
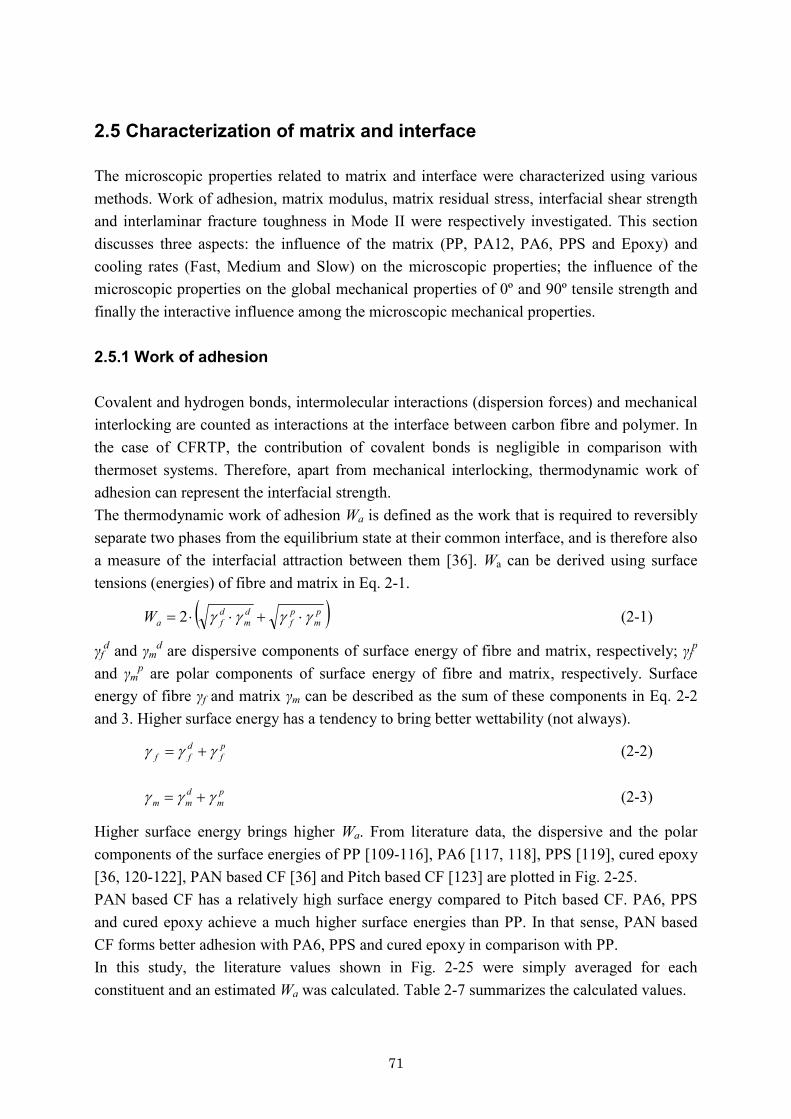
71
2.5 Characterization of matrix and interface The microscopic properties related to matrix and interface were characterized using various methods. Work of adhesion, matrix modulus, matrix residual stress, interfacial shear strength and interlaminar fracture toughness in Mode II were respectively investigated. This section discusses three aspects: the influence of the matrix (PP, PA12, PA6, PPS and Epoxy) and cooling rates (Fast, Medium and Slow) on the microscopic properties; the influence of the microscopic properties on the global mechanical properties of 0º and 90º tensile strength and finally the interactive influence among the microscopic mechanical properties. 2.5.1 Work of adhesion Covalent and hydrogen bonds, intermolecular interactions (dispersion forces) and mechanical interlocking are counted as interactions at the interface between carbon fibre and polymer. In the case of CFRTP, the contribution of covalent bonds is negligible in comparison with thermoset systems. Therefore, apart from mechanical interlocking, thermodynamic work of adhesion can represent the interfacial strength. The thermodynamic work of adhesion Wa is defined as the work that is required to reversibly separate two phases from the equilibrium state at their common interface, and is therefore also a measure of the interfacial attraction between them [36]. Wa can be derived using surface tensions (energies) of fibre and matrix in Eq. 2-1.
( )pm
pf
dm
dfaW gggg ×+××= 2 (2-1)
γfd and γm
d are dispersive components of surface energy of fibre and matrix, respectively; γfp
and γmp are polar components of surface energy of fibre and matrix, respectively. Surface
energy of fibre γf and matrix γm can be described as the sum of these components in Eq. 2-2 and 3. Higher surface energy has a tendency to bring better wettability (not always).
pf
dff ggg += (2-2)
pm
dmm ggg += (2-3)
Higher surface energy brings higher Wa. From literature data, the dispersive and the polar components of the surface energies of PP [109-116], PA6 [117, 118], PPS [119], cured epoxy [36, 120-122], PAN based CF [36] and Pitch based CF [123] are plotted in Fig. 2-25. PAN based CF has a relatively high surface energy compared to Pitch based CF. PA6, PPS and cured epoxy achieve a much higher surface energies than PP. In that sense, PAN based CF forms better adhesion with PA6, PPS and cured epoxy in comparison with PP. In this study, the literature values shown in Fig. 2-25 were simply averaged for each constituent and an estimated Wa was calculated. Table 2-7 summarizes the calculated values.
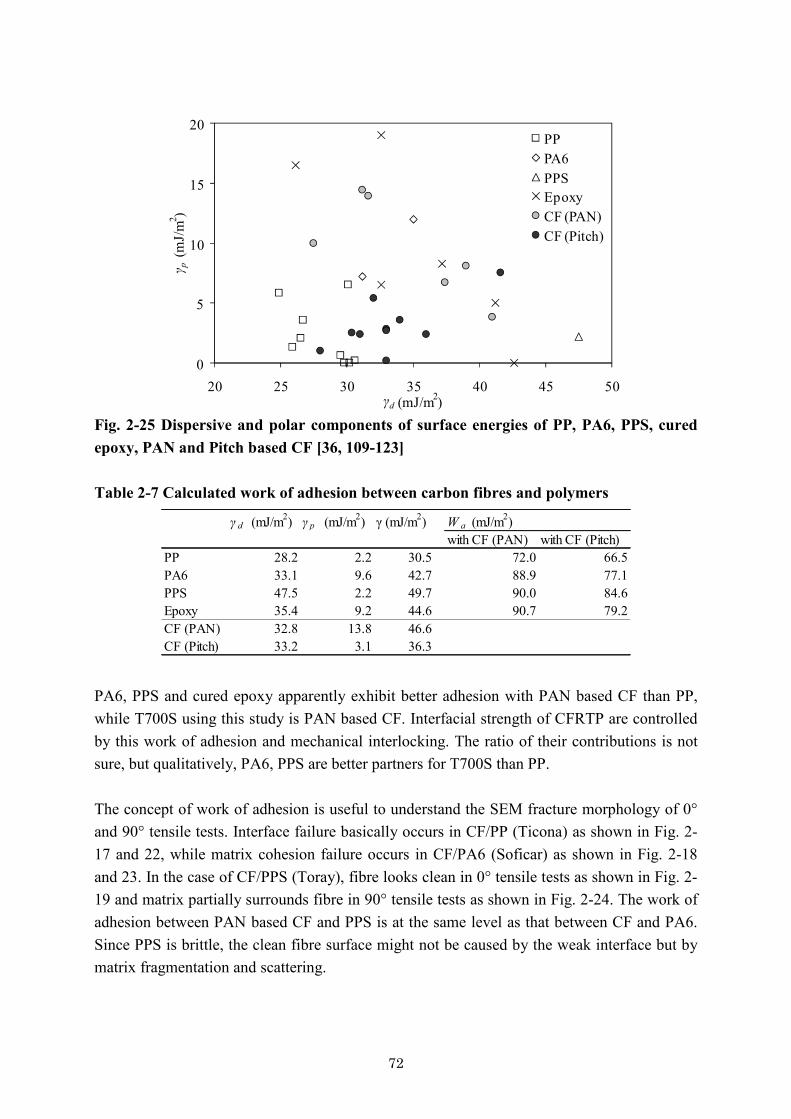
72
0
5
10
15
20
20 25 30 35 40 45 50γd (mJ/m2)
γ p(m
J/m
2 )
PPPA6PPSEpoxyCF (PAN)CF (Pitch)
Fig. 2-25 Dispersive and polar components of surface energies of PP, PA6, PPS, cured epoxy, PAN and Pitch based CF [36, 109-123] Table 2-7 Calculated work of adhesion between carbon fibres and polymers
γ d (mJ/m2) γ p (mJ/m2) γ (mJ/m2) W a (mJ/m2)with CF (PAN) with CF (Pitch)
PP 28.2 2.2 30.5 72.0 66.5PA6 33.1 9.6 42.7 88.9 77.1PPS 47.5 2.2 49.7 90.0 84.6Epoxy 35.4 9.2 44.6 90.7 79.2CF (PAN) 32.8 13.8 46.6CF (Pitch) 33.2 3.1 36.3
PA6, PPS and cured epoxy apparently exhibit better adhesion with PAN based CF than PP, while T700S using this study is PAN based CF. Interfacial strength of CFRTP are controlled by this work of adhesion and mechanical interlocking. The ratio of their contributions is not sure, but qualitatively, PA6, PPS are better partners for T700S than PP. The concept of work of adhesion is useful to understand the SEM fracture morphology of 0° and 90° tensile tests. Interface failure basically occurs in CF/PP (Ticona) as shown in Fig. 2-17 and 22, while matrix cohesion failure occurs in CF/PA6 (Soficar) as shown in Fig. 2-18 and 23. In the case of CF/PPS (Toray), fibre looks clean in 0° tensile tests as shown in Fig. 2-19 and matrix partially surrounds fibre in 90° tensile tests as shown in Fig. 2-24. The work of adhesion between PAN based CF and PPS is at the same level as that between CF and PA6. Since PPS is brittle, the clean fibre surface might not be caused by the weak interface but by matrix fragmentation and scattering.
73
2.5.2 Matrix modulus The matrix modulus can be an important factor of the matrix/interfacial characteristics. The properties of the neat resin used in prepregs are often difficult to get due to confidentiality issues. In addition, the mechanical properties of semi-crystalline polymer inside the fibre array are different from those obtained from pure polymer coupons. The fibre tends to be a nucleation site for crystal growth. In addition, direction of the crystal growth is limited by the fibre existence. Thus, the type and packing state of the fibres strongly affect the crystal size and degree of crystallinity. Micro-indentation is one candidate to detect the modulus around fibres, but this study proposes the extraction of the matrix modulus from the tensile modulus of 90° laminates. Ishikawa [124] proposed an approximated solution for the 90° modulus using only transverse fibre modulus EfT, matrix modulus Em and Vf. He modelled the fibre cross-section in hexagonal shape and empirically designed packing state of fibres as shown in Fig. 2-26, deducing Eq. 2-4.
( )( )( )
( )( ) ( )ffTfm
fmfT
mfTffT
fmfT
mfT
mfT
VEVE
VEE
EEVE
VEEEE
EEE
-++
-+
ïþ
ïýü
ïî
ïíì
+--
--
-=
1221
)1231
23
1ln
690 (2-4)
2
÷øö
çèæ=
baV f
Fig. 2-26 Model for predicting 90º modulus [124]
The 90° modulus E90 was experimentally obtained in Subsection 2.4.2. Transverse modulus of T700S EfT was assumed as 13.9 GPa, same as T300 [49], of which longitudinal modulus is equivalent to T700S’s (230 GPa) [47]. Vf value was applied for each prepreg. The matrix modulus Em was back-calculated from Eq. 2-4 as summarized in Table 2-8.
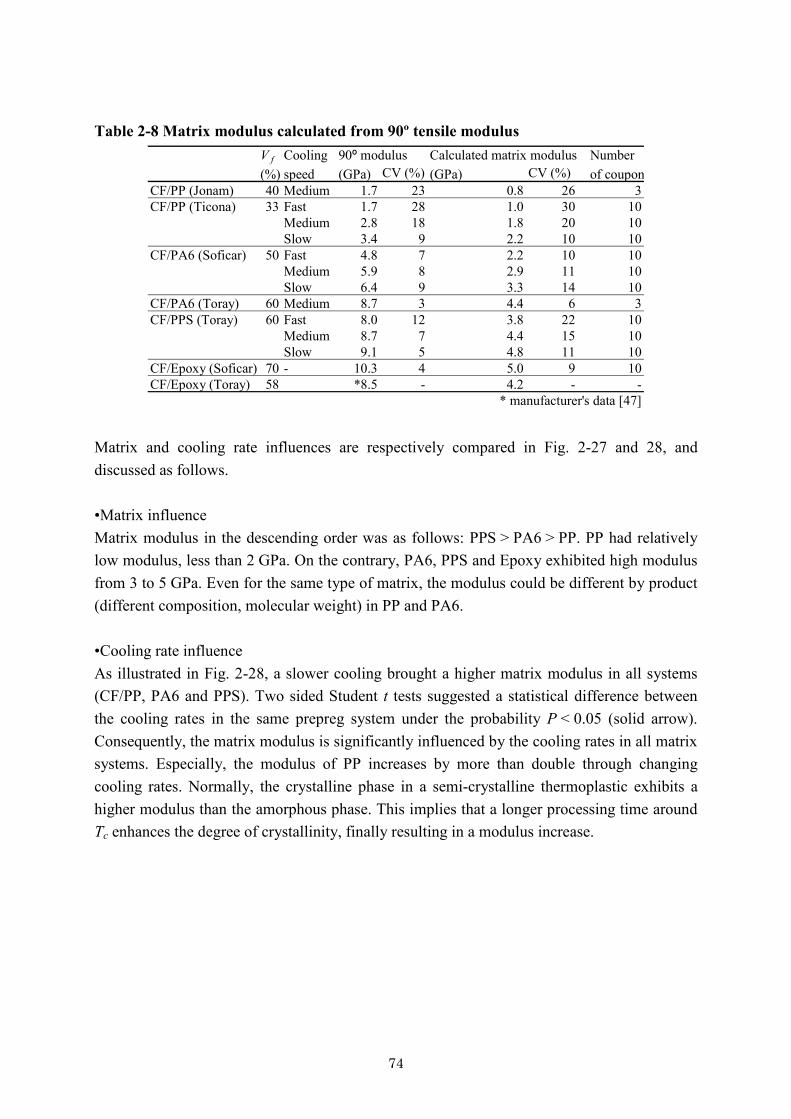
74
Table 2-8 Matrix modulus calculated from 90º tensile modulus V f Cooling Number(%) speed (GPa) CV (%) (GPa) CV (%) of coupons
CF/PP (Jonam) 40 Medium 1.7 23 0.8 26 3CF/PP (Ticona) 33 Fast 1.7 28 1.0 30 10
Medium 2.8 18 1.8 20 10Slow 3.4 9 2.2 10 10
CF/PA6 (Soficar) 50 Fast 4.8 7 2.2 10 10Medium 5.9 8 2.9 11 10Slow 6.4 9 3.3 14 10
CF/PA6 (Toray) 60 Medium 8.7 3 4.4 6 3CF/PPS (Toray) 60 Fast 8.0 12 3.8 22 10
Medium 8.7 7 4.4 15 10Slow 9.1 5 4.8 11 10
CF/Epoxy (Soficar) 70 - 10.3 4 5.0 9 10CF/Epoxy (Toray) 58 *8.5 - 4.2 - -
* manufacturer's data [47]
90º modulus Calculated matrix modulus
Matrix and cooling rate influences are respectively compared in Fig. 2-27 and 28, and discussed as follows. •Matrix influence Matrix modulus in the descending order was as follows: PPS > PA6 > PP. PP had relatively low modulus, less than 2 GPa. On the contrary, PA6, PPS and Epoxy exhibited high modulus from 3 to 5 GPa. Even for the same type of matrix, the modulus could be different by product (different composition, molecular weight) in PP and PA6. •Cooling rate influence As illustrated in Fig. 2-28, a slower cooling brought a higher matrix modulus in all systems (CF/PP, PA6 and PPS). Two sided Student t tests suggested a statistical difference between the cooling rates in the same prepreg system under the probability P < 0.05 (solid arrow). Consequently, the matrix modulus is significantly influenced by the cooling rates in all matrix systems. Especially, the modulus of PP increases by more than double through changing cooling rates. Normally, the crystalline phase in a semi-crystalline thermoplastic exhibits a higher modulus than the amorphous phase. This implies that a longer processing time around Tc enhances the degree of crystallinity, finally resulting in a modulus increase.
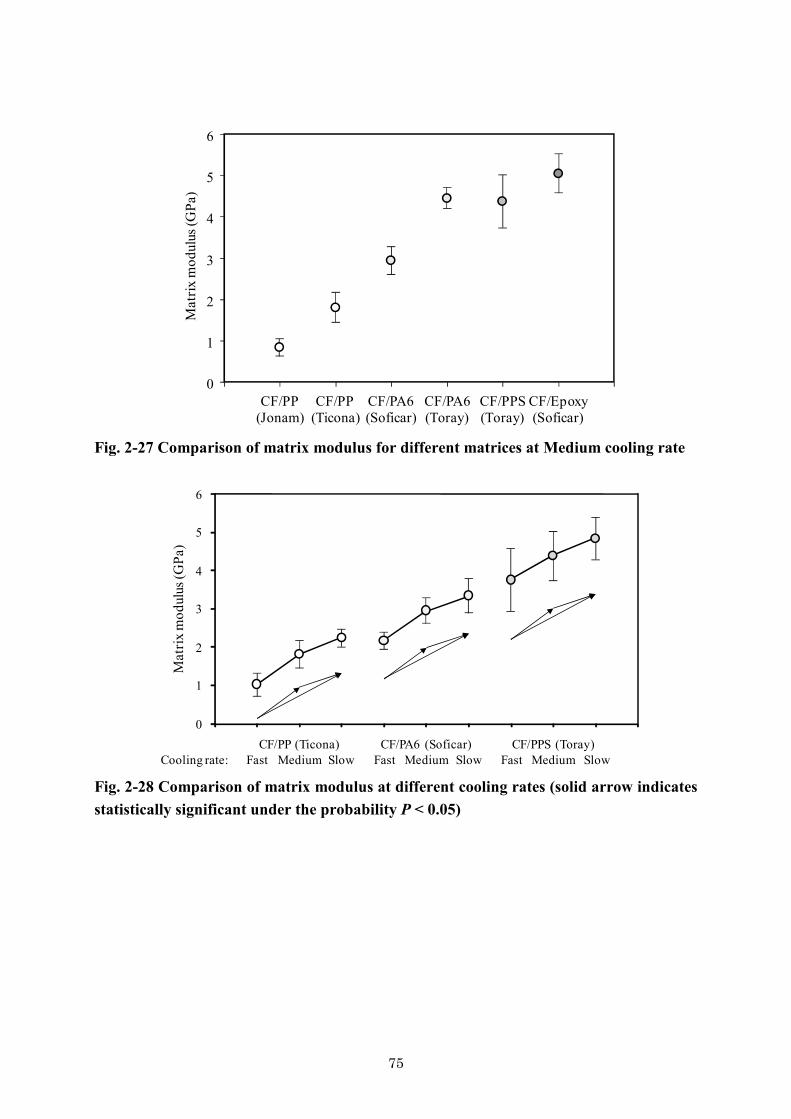
75
0
1
2
3
4
5
6
Mat
rix m
odul
us (G
Pa)
CF/PP(Jonam)
CF/PP(Ticona)
CF/PA6(Soficar)
CF/PA6(Toray)
CF/PPS(Toray)
CF/Epoxy(Soficar)
Fig. 2-27 Comparison of matrix modulus for different matrices at Medium cooling rate
0
1
2
3
4
5
6
FastCF/PP (Ticona)
Medium Slow FastCF/PA6 (Soficar)
Medium Slow FastCF/PPS (Toray)
Medium SlowCooling rate:
Mat
rix m
odul
us (G
Pa)
Fig. 2-28 Comparison of matrix modulus at different cooling rates (solid arrow indicates statistically significant under the probability P < 0.05)

76
2.5.3 Matrix residual stress Due to a difference between the coefficient of thermal expansion of fibre and matrix, matrix residual stress accumulates during cooling from the processing temperature. Some researchers suggest that this compressive stress normal to the fibre contributes as friction force between fibre and matrix, enhancing the interfacial strength [45, 46]. This stress compresses the fibre in the radius direction, may resulting in positive contribution to the normal interfacial strength, which is important for tensile strength of a 90° unidirectional laminate. However under an assumption that fibre and matrix are two-dimensionally arrayed in series, the residual stress in transverse direction can be neglected. On the other hand, the matrix residual stress in the longitudinal direction of the fibre may influence in a complex way the interfacial shear strength, which is important for tensile strength of a 0° unidirectional laminate. In this study, the matrix residual stress in fibre direction σmL was extracted from residual stress in 90° layers σ90. σ90 measured from the curvature of an unbalanced cross-ply laminate [0n/90n] [125-129]. The curvature ρ was calculated from the deformation of an unbalanced laminate in Eq. 2-5, where h and L were height and projected length of the unbalanced laminate placed on a flat plate as shown in Fig. 2-29.
÷÷ø
öççè
æ+= h
hL42
1 2
r (2-5)
t
Fig. 2-29 Geometry of warped unbalanced laminate The bimetallic strip model of Timoshenko estimates the curvature ρ as describing in Eq. 2-6 by considering one major direction only [125],
( )( )2
9090020
090900
14241
EEEEtTEE
++D-
=aa
r (2-6)
where E0 and E90 represent the 0° and 90° modulus, α0 and α90 represent the 0° and 90° coefficient of thermal expansion, and ΔT (positive value) is the temperature difference between crystallization temperature Tc and room temperature respectively.
77
On the other hand, the 90° residual stress in a balanced cross-ply laminate σ90 (0° and 90° layers are in the same thickness) can be calculated from Eq. 2-7, which is simply derived from equilibrium of force inside the laminate in the longitudinal direction.
( ) TEE
EED-
+= 090
900
90090 aas (2-7)
Combining Eq. 2-6 and 7, Eq. 2-8 is derived, and so σ90 can be determined from experimentally obtained curvature ρ [125, 127, 129],
÷÷ø
öççè
æ++
+=
90
0
0
90
900
90090 14
24 EE
EE
EEEEt
rs (2-8)
where t is the thickness of the unbalanced laminate. The matrix residual stress σmL can be described with the matrix modulus Em and coefficient of thermal expansion αm as in Eq. 2-9.
( ) TE mmmL D-= 0aas (2-9)
α0 can be described in Eq. 2-10 by using simple rule of mixture in the 0° laminate,
( )( )fmffL
fmmffLfL
VEVEVEVE
-+
-+=
11
0
aaa (2-10)
where EfL and αfL denotes fibre modulus and coefficient of thermal expansion in longitudinal direction, respectively. Combining Eq. 2-9 and 10, σmL can be described as in Eq. 2-11 with using the coefficient of thermal expansion of matrix αm.
( )( ) T
VEVEVE
EfmffL
fLmffLmmL D
-+-
=1aa
s (2-11)
Shapery proposed Eq. 2-12 to predict the coefficient of thermal expansion in 90° layer α90 from microscopic properties of constituents [130],
( )( ) ( )( ) ( )fmffT
fmffL
fffLmfLTmmfL VVVEVE
VVEE-++
-+
---= 1
11
90 aaaann
a (2-12)
where αfT, νfTT, νm are coefficient of thermal expansion of fibre in transverse direction, Poisson ratio of fibre in transverse direction and that of matrix, respectively. Substituting Eq. 2-10 and 12, Eq. 2-7 can be rewritten as in Eq. 2-13.
( ) ( )
( ) ( ) ( ) ( ) TVVVVEVE
EEEE
EEffLfTfffLm
fmffL
fTTmmfL Dïþ
ïýü
ïî
ïíì
-+---+
+-+
+= aaaa
nns 1
111
900
90090 (2-13)
Solving Eq. 2-11 and 13 to eliminate αm, σmL can be determined with σ90 as in Eq. 2-14.

78
( )
( ) ( )T
EEV
VTEE
EE
E
fTfL
mmf
ffLfT
mmL D
ïþ
ïýü
ïî
ïíì
+-+-
--D
+
=
nn
aas
s111
90
900
900
(2-14)
First, σ90 was experimentally determined with Eq. 2-8, and then σmL was calculated using σ90 value with Eq. 2-14. Some references [127, 128, 131] describe that first balanced laminate is fabricated, then removed a half thickness of the laminate by polishing. A good point of this method is that it simulates a real product and process. Temperature distribution during cooling makes “core-shell” residual stress distribution in thickness direction. Careful removing of a half laminate may preserve this real residual stress inside of the laminate. On the other hand, polishing easily relaxes the residual stress itself. The reference [128] finally decides to apply the same temperature cycle again to recover the residual stress. In addition, removing layers in completely parallel from warped laminate is extremely difficult. Therefore in this study, “as moulded” unbalanced laminates were used. Unbalanced laminates of [02/902] in the case of CF/PP (Ticona) and [04/904] in the case of CF/PP (Jonam), CF/PA6 (Soficar and Toray) and CF/PPS (Toray) were moulded in the same manner as 0° tensile coupons described in Section 2.3. Basic dimension of the laminate was 230 mm length, 25 mm width and around 1 mm thickness. Number of coupons was four each for CF/PP (Ticona), CF/PA6 (Soficar) and CF/PPS (Toray) at three different cooling rates, and the others were three. Fig. 2-30 illustrates of unbalanced laminates of CF/PA6 (Soficar) at different cooling rates. In this case, slower cooling rate led to more warp.
a)
b)
c) Fig. 2-30 Warped unbalanced laminates of CF/PA6 (Soficar) in (a) Fast, (b) Medium and (c) Slow cooling rate
79
L and h were measured from each coupon to calculate ρ from Eq. 2-5. Then t and ρ were substituted into Eq. 2-8 to obtain σ90. In this study, E0 is estimated from Eq. 2-15, not from the experiment previously explained.
( )fmffL VEVEE -+= 10 (2-15)
For E90, the values experimentally obtained for each prepreg system were used (Subsection 2.4.2, Table. 2-6). Then σ90 was substituted into Eq. 2-14; finally σmL was calculated. EfL for T700S was 230 GPa. αfL for T700S was -0.38×10⁻⁶ [47]. αfT was not available, but the radial coefficient of thermal expansion of T300, measured as 17.6×10⁻⁶ was used [51]. νfTT was also not available, but the Poisson ratio in longitudinal direction of T300 is 0.22 [51]; transverse direction also applied 0.22. νm seems to disagree in different matrices, but in this study simply set as 0.40. For Em the calculated value in Subsection 2.5.2 was used. ΔT was calculated on the difference between Tc and room temperature 20°C. Tc is dependent on cooling rate; fast cooling rate brings lower Tc for semi-crystalline thermoplastic, often resulting in lower residual stress [40-42]. Tc was measured at different cooling rates by DSC Q2000 (TA Instruments). DSC simulated five different cooling rates including the same cooling rates as in the real processing. The coupon was heated up as fast as possible and dwelled for 10 min at the processing temperature, then cooled down at the designated cooling rate. Number of coupons was three each. Table 2-9 summarizes the observed Tc of CF/PP (Ticona), CF/PA6 (Soficar) and CF/PPS (Toray) for each cooling rate. Tc was also plotted against cooling rates in logarithmic scale. As can be seen in Fig. 2-31, Tc linearly decreases in proportion to the logarithm of the cooling rate. Table 2-9 Cooling rate dependency of crystallization temperature
Cooling rate"Fast" 20ºC/min "Medium" 3ºC/min "Slow"
CF/PP (Ticona) 114 (50ºC/min) 118 124 (4ºC/min) 125 130 (1ºC/min)CF/PA6 (Soficar) 169 (80ºC/min) 179 185 (7ºC/min) 191 195 (1ºC/min)CF/PPS (Toray) 218 (100ºC/min) 235 241 (10ºC/min) 249 257 (1ºC/min)
Table 2-10 summarizes the experimentally obtained residual stress in the 90° layer σ90, temperature difference from crystallization temperature ΔT and calculated matrix residual stress in the longitudinal direction σmL.

80
100
150
200
250
300
1 10 100Cooling rate (ºC/min)
Cry
stalli
zatio
n te
mpe
ratu
re (º
C)
.CF/PP (Ticona)CF/PA6 (Soficar)CF/PPS (Toray)
Fig. 2-31 Relation between crystallization temperature and cooling rate Table 2-10 Matrix residual stress calculated from curvature of unbalanced laminates
V f Cooling E m ΔT Number(%) speed (MPa) CV (%) (GPa) (K) (MPa) CV (%) of coupons
CF/PP (Jonam) 40 Medium 6.3 4 0.8 87 3.2 4 3CF/PP (Ticona) 33 Fast 3.3 24 1.0 94 1.8 3 4
Medium 3.3 7 1.8 104 1.2 8 4Slow 4.2 21 2.2 110 1.2 19 4
CF/PA6 (Soficar) 50 Fast 21.9 8 2.2 149 10.8 11 4Medium 25.9 13 2.9 165 13.3 19 4Slow 30.3 15 3.3 175 14.5 24 4
CF/PA6 (Toray) 60 Medium 35.1 3 4.4 165 20.0 6 3CF/PPS (Toray) 60 Fast 41.6 12 3.8 198 23.1 19 4
Medium 43.0 17 4.4 221 22.9 32 4Slow 44.9 13 4.8 237 23.7 25 4
90º residual stress Calculated matrix residual stress
Matrix and cooling rate influences are respectively compared in Fig. 2-32 and 33, and discussed as follows.

81
Mat
rix re
sidu
al st
ress
(MPa
)
CF/PP(Jonam)
CF/PP(Ticona)
CF/PA6(Soficar)
CF/PA6(Toray)
CF/PPS(Toray)
0
10
20
30
40
Fig. 2-32 Comparison of matrix residual stress for different matrices at Medium cooling rate
0
10
20
30
40
FastCF/PP (Ticona)
Medium Slow FastCF/PA6 (Soficar)
Medium Slow FastCF/PPS (Toray)
Medium SlowCooling rate:
Mat
rix re
sidu
al st
ress
(MPa
)
Fig. 2-33 Comparison of matrix residual stress at different cooling rates (dotted and solid arrows indicate statistically significant under the probability P < 0.1 and 0.05) •Matrix difference Matrix residual stress in the longitudinal direction σmL in the descending order was as follows: CF/PPS > CF/PA6 >> CF/PP. Matrix modulus Em and temperature difference ΔT also followed the same order as illustrated in Fig. 2-34 and 35. Em and ΔT both directly enhanced the matrix residual stress, therefore this tendency was quite reasonable.

82
0
10
20
30
40
0 1 2 3 4 5Matrix modulus Em (GPa)
Mat
rix re
sidu
al st
ress
(MPa
)
CF/PPCF/PPA6CF/PPS
Fig. 2-34 Relation between matrix residual stress and matrix modulus
0
10
20
30
40
0 50 100 150 200 250Temperature difference ΔT (ºC)
Mat
rix re
sidu
al st
ress
(MPa
)
CF/PPCF/PPA6CF/PPS
Fig. 2-35 Relation between matrix residual stress and temperature difference ΔT •Cooling rate difference The matrix residual stress in the longitudinal direction σmL increased as the cooling rate became slower in CF/PA6 and decreased in CF/PP. The two sided Student t tests suggested a statistical difference between cooling rates in CF/PA6 and PP under the probability at least P < 0.1. The matrix modulus Em increased as the cooling rate became slower as shown in Fig. 2-27 and temperature difference ΔT also increased as cooling rate became slower as shown in Fig. 2-30. Even so, the increase of σmL along a decrease in the cooling rate was not significant for CF/PP and CF/PPS. In the case of CF/PP, σmL decreased. First possibility is that the degree of
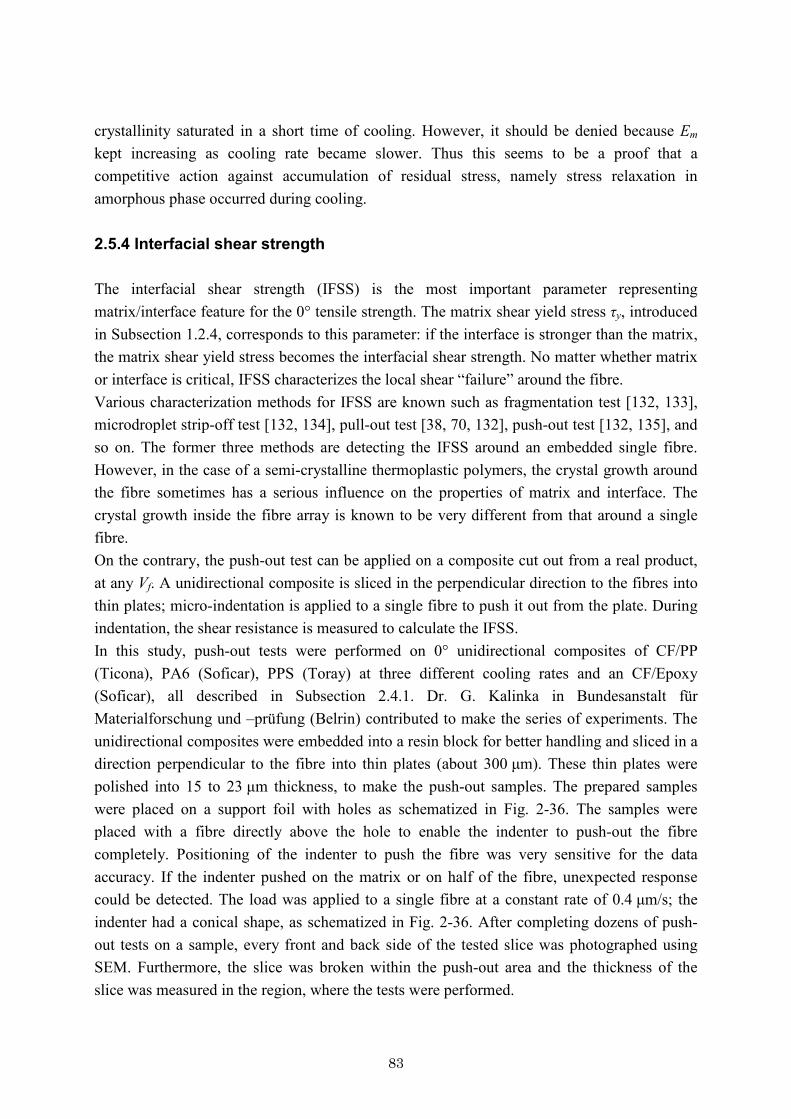
83
crystallinity saturated in a short time of cooling. However, it should be denied because Em kept increasing as cooling rate became slower. Thus this seems to be a proof that a competitive action against accumulation of residual stress, namely stress relaxation in amorphous phase occurred during cooling. 2.5.4 Interfacial shear strength The interfacial shear strength (IFSS) is the most important parameter representing matrix/interface feature for the 0° tensile strength. The matrix shear yield stress τy, introduced in Subsection 1.2.4, corresponds to this parameter: if the interface is stronger than the matrix, the matrix shear yield stress becomes the interfacial shear strength. No matter whether matrix or interface is critical, IFSS characterizes the local shear “failure” around the fibre. Various characterization methods for IFSS are known such as fragmentation test [132, 133], microdroplet strip-off test [132, 134], pull-out test [38, 70, 132], push-out test [132, 135], and so on. The former three methods are detecting the IFSS around an embedded single fibre. However, in the case of a semi-crystalline thermoplastic polymers, the crystal growth around the fibre sometimes has a serious influence on the properties of matrix and interface. The crystal growth inside the fibre array is known to be very different from that around a single fibre. On the contrary, the push-out test can be applied on a composite cut out from a real product, at any Vf. A unidirectional composite is sliced in the perpendicular direction to the fibres into thin plates; micro-indentation is applied to a single fibre to push it out from the plate. During indentation, the shear resistance is measured to calculate the IFSS. In this study, push-out tests were performed on 0° unidirectional composites of CF/PP (Ticona), PA6 (Soficar), PPS (Toray) at three different cooling rates and an CF/Epoxy (Soficar), all described in Subsection 2.4.1. Dr. G. Kalinka in Bundesanstalt für Materialforschung und –prüfung (Belrin) contributed to make the series of experiments. The unidirectional composites were embedded into a resin block for better handling and sliced in a direction perpendicular to the fibre into thin plates (about 300 μm). These thin plates were polished into 15 to 23 μm thickness, to make the push-out samples. The prepared samples were placed on a support foil with holes as schematized in Fig. 2-36. The samples were placed with a fibre directly above the hole to enable the indenter to push-out the fibre completely. Positioning of the indenter to push the fibre was very sensitive for the data accuracy. If the indenter pushed on the matrix or on half of the fibre, unexpected response could be detected. The load was applied to a single fibre at a constant rate of 0.4 μm/s; the indenter had a conical shape, as schematized in Fig. 2-36. After completing dozens of push-out tests on a sample, every front and back side of the tested slice was photographed using SEM. Furthermore, the slice was broken within the push-out area and the thickness of the slice was measured in the region, where the tests were performed.

84
Fig. 2-36 Schematics of push-out test: basic concept (a) and sample arrangement on equipment (b) [135]
a)
A Indenter not yet in contact
B Sample not yet in full contact
C Full contact
E Sliding, friction
F Contact indenter-matrix
D Debonding
b) Displacement
Load
0A
B
C
D
E
F
Fig. 2-37 Interpretation from load-displacement curve of push-out test: indenter positions (a) and load-displacement curve (b) Fig. 2-37 explains the experimental interpretation using a typical load-displacement curve. Each event during the push-out test is schematized with positioning of the indenter and corresponds to a point on the load-displacement curve. As seen in Fig. 2-37a, at position A the indenter is not in contact with the sample surface so the load is zero. At stage position B, the indenter comes into contact with the sample, but the sample is not in full contact with the support. Therefore, the slope of the load-displacement curve is lower in segment B. The causes are speculated that thin coupon itself may be warped, or heterogeneities such as dust or already tested fibres may come between the slice and the support. In such cases more
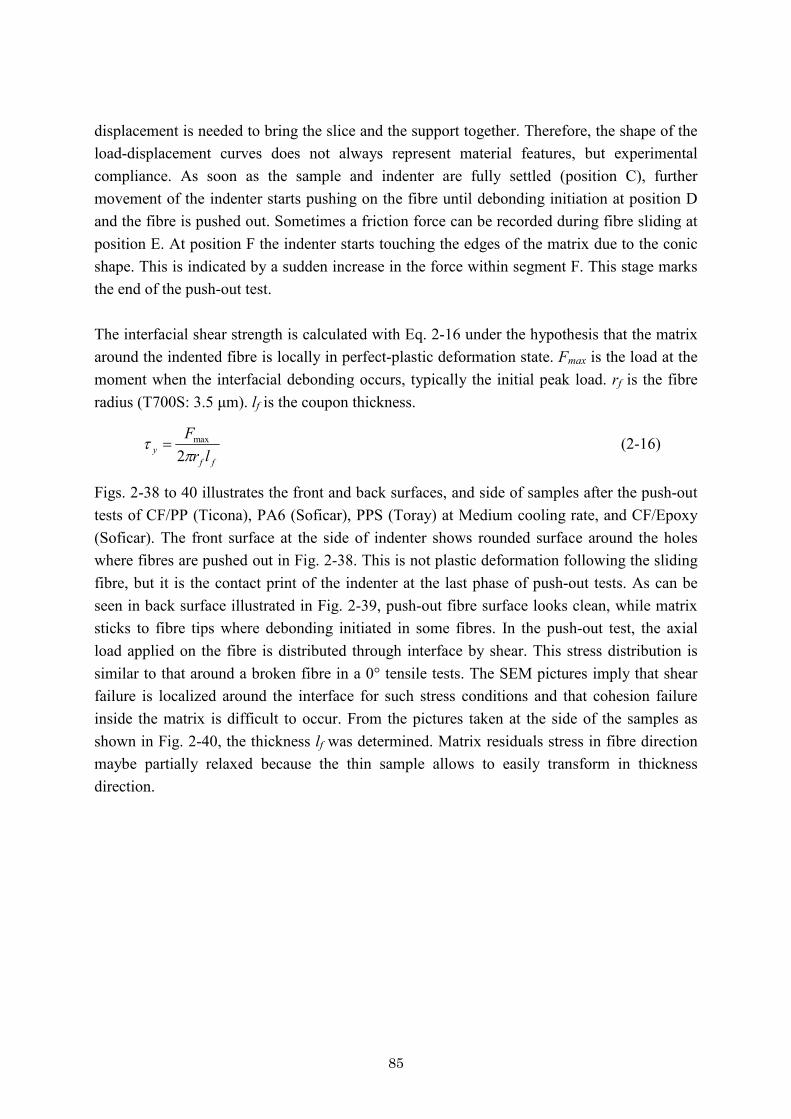
85
displacement is needed to bring the slice and the support together. Therefore, the shape of the load-displacement curves does not always represent material features, but experimental compliance. As soon as the sample and indenter are fully settled (position C), further movement of the indenter starts pushing on the fibre until debonding initiation at position D and the fibre is pushed out. Sometimes a friction force can be recorded during fibre sliding at position E. At position F the indenter starts touching the edges of the matrix due to the conic shape. This is indicated by a sudden increase in the force within segment F. This stage marks the end of the push-out test. The interfacial shear strength is calculated with Eq. 2-16 under the hypothesis that the matrix around the indented fibre is locally in perfect-plastic deformation state. Fmax is the load at the moment when the interfacial debonding occurs, typically the initial peak load. rf is the fibre radius (T700S: 3.5 μm). lf is the coupon thickness.
ffy lr
Fp
t2
max= (2-16)
Figs. 2-38 to 40 illustrates the front and back surfaces, and side of samples after the push-out tests of CF/PP (Ticona), PA6 (Soficar), PPS (Toray) at Medium cooling rate, and CF/Epoxy (Soficar). The front surface at the side of indenter shows rounded surface around the holes where fibres are pushed out in Fig. 2-38. This is not plastic deformation following the sliding fibre, but it is the contact print of the indenter at the last phase of push-out tests. As can be seen in back surface illustrated in Fig. 2-39, push-out fibre surface looks clean, while matrix sticks to fibre tips where debonding initiated in some fibres. In the push-out test, the axial load applied on the fibre is distributed through interface by shear. This stress distribution is similar to that around a broken fibre in a 0° tensile tests. The SEM pictures imply that shear failure is localized around the interface for such stress conditions and that cohesion failure inside the matrix is difficult to occur. From the pictures taken at the side of the samples as shown in Fig. 2-40, the thickness lf was determined. Matrix residuals stress in fibre direction maybe partially relaxed because the thin sample allows to easily transform in thickness direction.
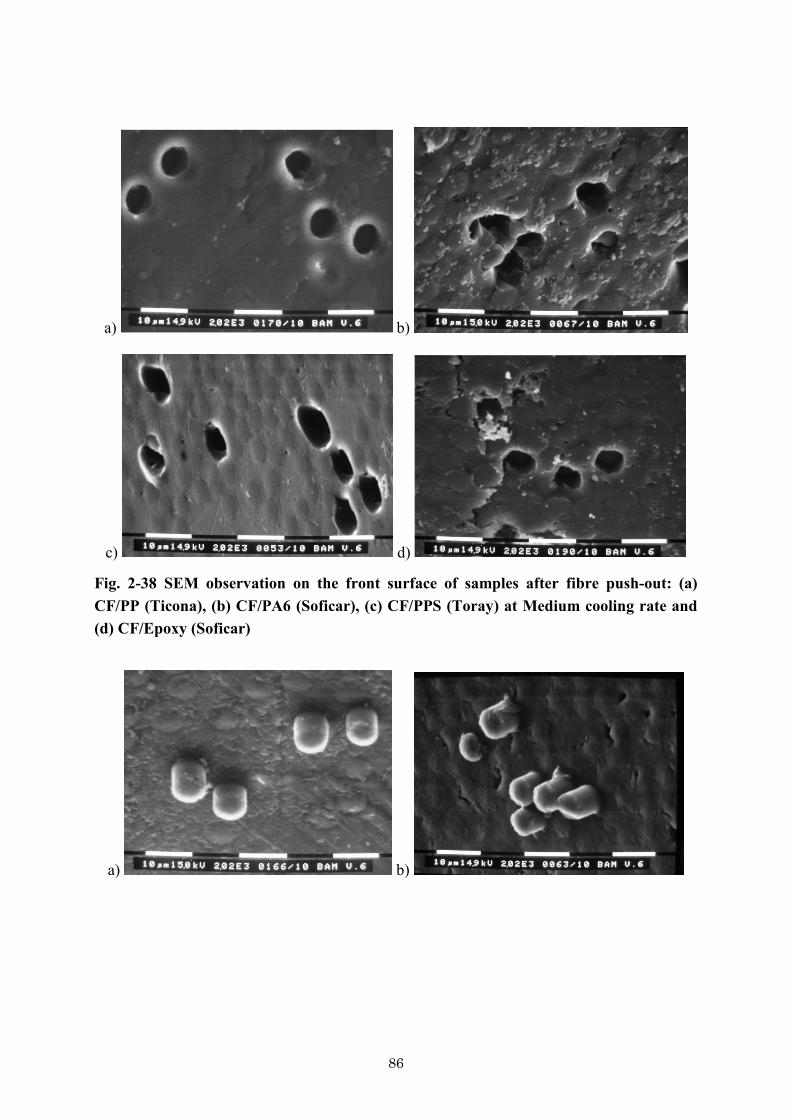
86
a) b)
c) d)
Fig. 2-38 SEM observation on the front surface of samples after fibre push-out: (a) CF/PP (Ticona), (b) CF/PA6 (Soficar), (c) CF/PPS (Toray) at Medium cooling rate and (d) CF/Epoxy (Soficar)
a) b)

87
c) d)
Fig. 2-39 SEM observation on the back surface of samples after fibre push-out: (a) CF/PP (Ticona), (b) CF/PA6 (Soficar), (c) CF/PPS (Toray) at Medium cooling rate and (d) CF/Epoxy (Soficar)
a) b)
c) d)
Fig. 2-40 SEM observation on the side of samples after fibre push-out: (a) CF/PP (Ticona), (b) CF/PA6 (Soficar), (c) CF/PPS (Toray) at Medium cooling rate and (d) CF/Epoxy (Soficar) Typical load-displacement curves most likely observed are compared for different matrix systems in Fig. 2-41a and for different cooling rates for CF/PP, PA6 and PPS in Figs. 2-41b to
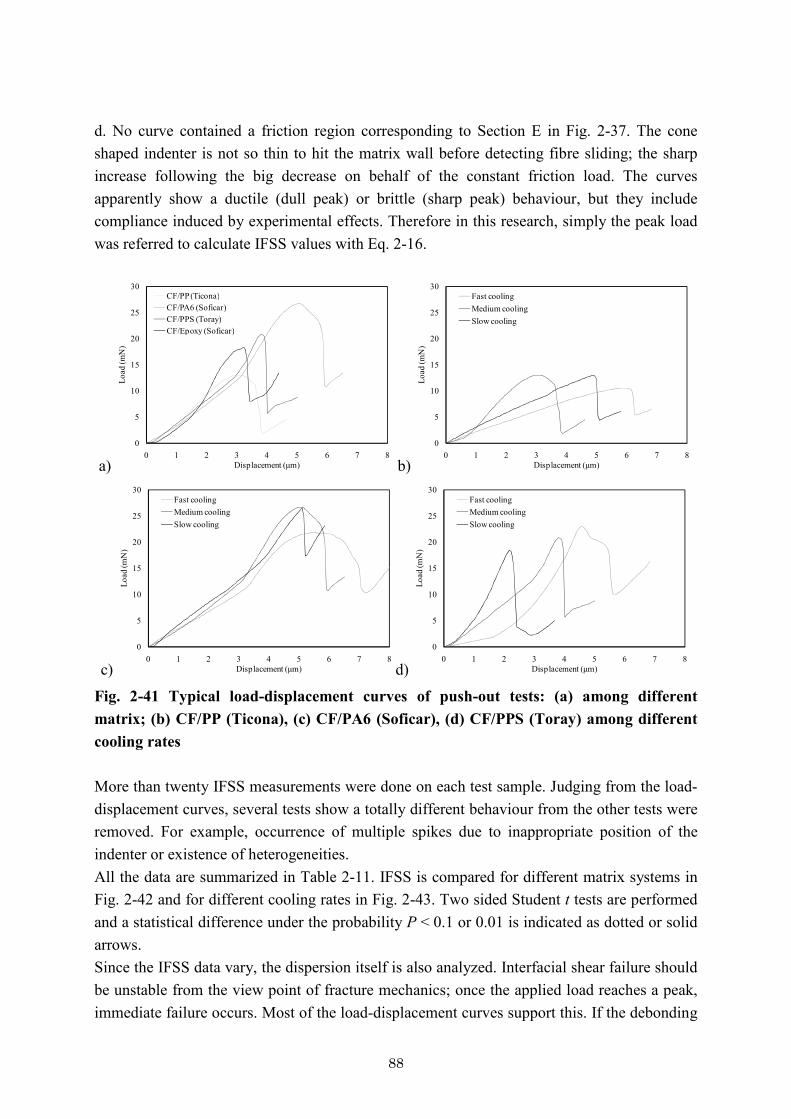
88
d. No curve contained a friction region corresponding to Section E in Fig. 2-37. The cone shaped indenter is not so thin to hit the matrix wall before detecting fibre sliding; the sharp increase following the big decrease on behalf of the constant friction load. The curves apparently show a ductile (dull peak) or brittle (sharp peak) behaviour, but they include compliance induced by experimental effects. Therefore in this research, simply the peak load was referred to calculate IFSS values with Eq. 2-16.
a) 0
5
10
15
20
25
30
0 1 2 3 4 5 6 7 8
Load
(mN
)
Displacement (μm)
CF/PP (Ticona)CF/PA6 (Soficar)CF/PPS (Toray)CF/Epoxy (Soficar)
b) 0
5
10
15
20
25
30
0 1 2 3 4 5 6 7 8
Load
(mN
)
Displacement (μm)
Fast coolingMedium coolingSlow cooling
c) 0
5
10
15
20
25
30
0 1 2 3 4 5 6 7 8
Load
(mN
)
Displacement (μm)
Fast coolingMedium coolingSlow cooling
d) 0
5
10
15
20
25
30
0 1 2 3 4 5 6 7 8
Load
(mN
)
Displacement (μm)
Fast coolingMedium coolingSlow cooling
Fig. 2-41 Typical load-displacement curves of push-out tests: (a) among different matrix; (b) CF/PP (Ticona), (c) CF/PA6 (Soficar), (d) CF/PPS (Toray) among different cooling rates More than twenty IFSS measurements were done on each test sample. Judging from the load-displacement curves, several tests show a totally different behaviour from the other tests were removed. For example, occurrence of multiple spikes due to inappropriate position of the indenter or existence of heterogeneities. All the data are summarized in Table 2-11. IFSS is compared for different matrix systems in Fig. 2-42 and for different cooling rates in Fig. 2-43. Two sided Student t tests are performed and a statistical difference under the probability P < 0.1 or 0.01 is indicated as dotted or solid arrows. Since the IFSS data vary, the dispersion itself is also analyzed. Interfacial shear failure should be unstable from the view point of fracture mechanics; once the applied load reaches a peak, immediate failure occurs. Most of the load-displacement curves support this. If the debonding
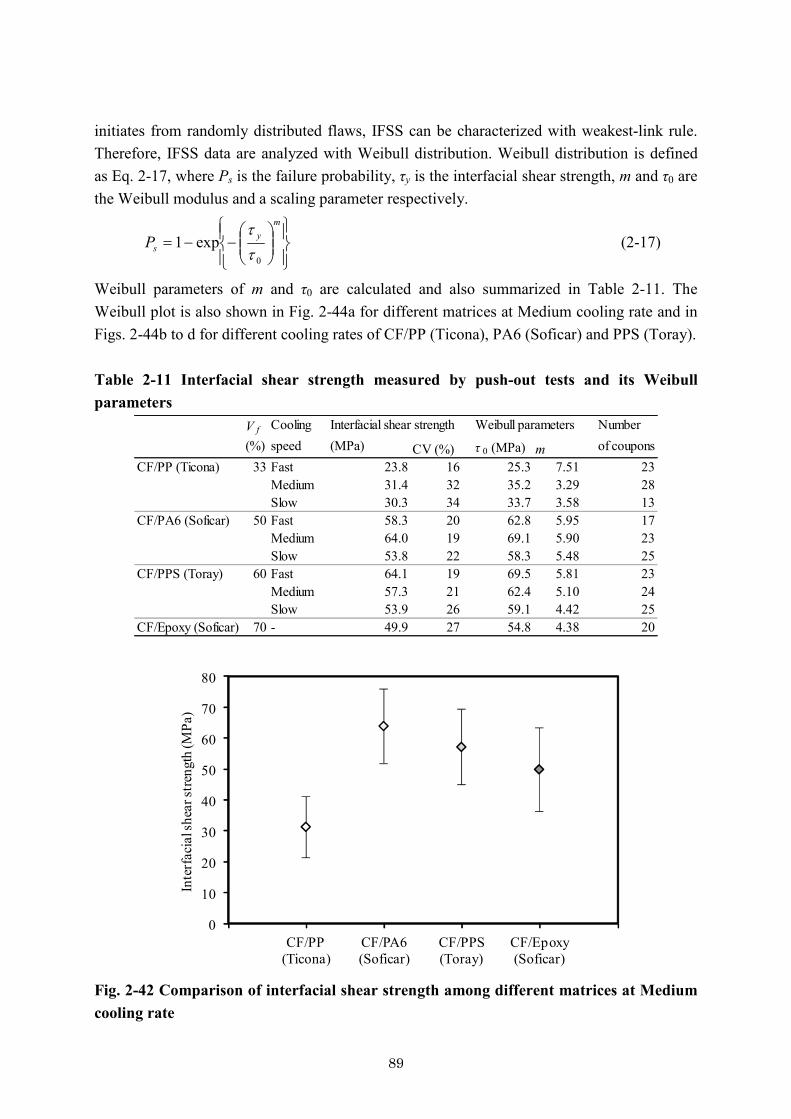
89
initiates from randomly distributed flaws, IFSS can be characterized with weakest-link rule. Therefore, IFSS data are analyzed with Weibull distribution. Weibull distribution is defined as Eq. 2-17, where Ps is the failure probability, τy is the interfacial shear strength, m and τ0 are the Weibull modulus and a scaling parameter respectively.
ïþ
ïýü
ïî
ïíì
÷÷ø
öççè
æ--=
my
sP0
exp1tt
(2-17)
Weibull parameters of m and τ0 are calculated and also summarized in Table 2-11. The Weibull plot is also shown in Fig. 2-44a for different matrices at Medium cooling rate and in Figs. 2-44b to d for different cooling rates of CF/PP (Ticona), PA6 (Soficar) and PPS (Toray). Table 2-11 Interfacial shear strength measured by push-out tests and its Weibull parameters
V f Cooling Number(%) speed (MPa) CV (%) τ 0 (MPa) m of coupons
CF/PP (Ticona) 33 Fast 23.8 16 25.3 7.51 23Medium 31.4 32 35.2 3.29 28Slow 30.3 34 33.7 3.58 13
CF/PA6 (Soficar) 50 Fast 58.3 20 62.8 5.95 17Medium 64.0 19 69.1 5.90 23Slow 53.8 22 58.3 5.48 25
CF/PPS (Toray) 60 Fast 64.1 19 69.5 5.81 23Medium 57.3 21 62.4 5.10 24Slow 53.9 26 59.1 4.42 25
CF/Epoxy (Soficar) 70 - 49.9 27 54.8 4.38 20
Interfacial shear strength Weibull parameters
0
10
20
30
40
50
60
70
80
CF/PP(Ticona)
CF/PA6(Soficar)
CF/PPS(Toray)
CF/Epoxy(Soficar)
Inte
rfac
ial s
hear
stre
ngth
(MPa
)
Fig. 2-42 Comparison of interfacial shear strength among different matrices at Medium cooling rate
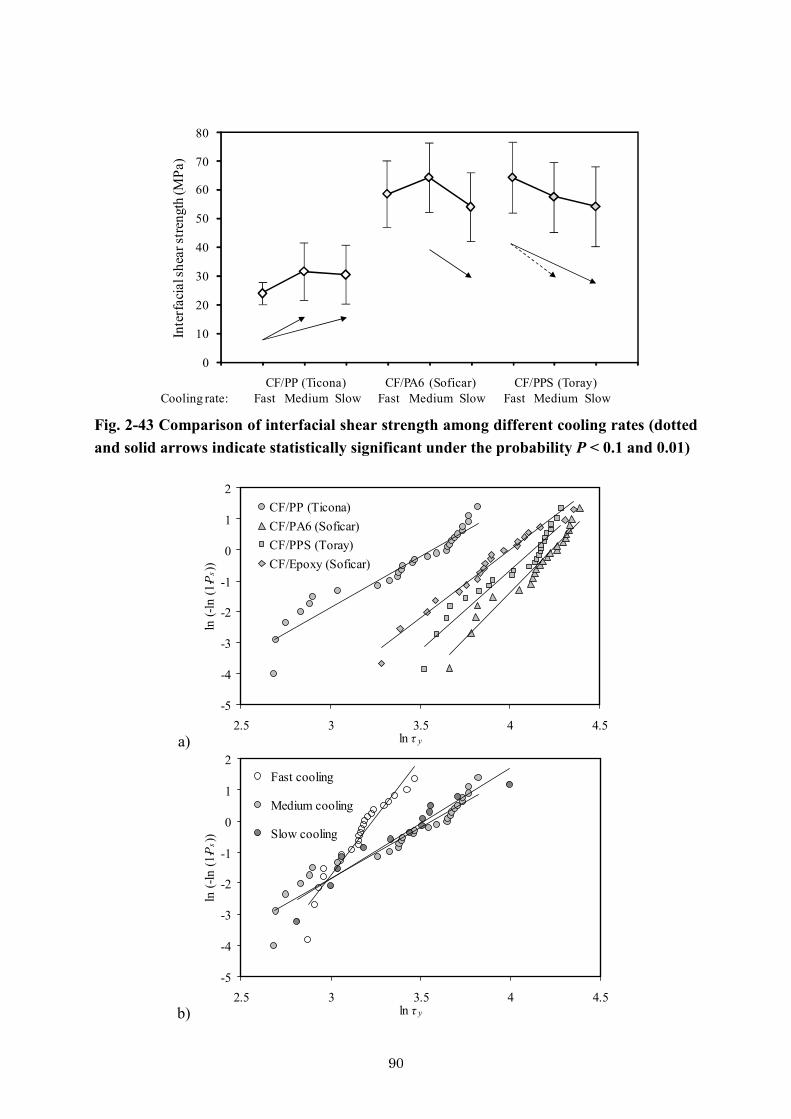
90
0
10
20
30
40
50
60
70
80
FastCF/PP (Ticona)
Medium Slow FastCF/PA6 (Soficar)
Medium Slow FastCF/PPS (Toray)
Medium SlowCooling rate:
Inte
rfac
ial s
hear
stre
ngth
(MPa
)
Fig. 2-43 Comparison of interfacial shear strength among different cooling rates (dotted and solid arrows indicate statistically significant under the probability P < 0.1 and 0.01)
a)
-5
-4
-3
-2
-1
0
1
2
2.5 3 3.5 4 4.5ln τ y
ln (-
ln (1
-Ps)
)
CF/PP (Ticona)CF/PA6 (Soficar)CF/PPS (Toray)CF/Epoxy (Soficar)
b)
-5
-4
-3
-2
-1
0
1
2
2.5 3 3.5 4 4.5ln τ y
ln (-
ln (1
-Ps)
)
Fast cooling
Medium cooling
Slow cooling

91
c)
-5
-4
-3
-2
-1
0
1
2
2.5 3 3.5 4 4.5ln τ y
ln (-
ln (1
-Ps)
)
Fast cooling
Medium cooling
Slow cooling
d)
-5
-4
-3
-2
-1
0
1
2
2.5 3 3.5 4 4.5
ln (-
ln (1
-Ps))
ln τy
Fast cooling
Medium cooling
Slow cooling
Fig. 2-44 Weibull plots of interfacial shear strength: (a) for different matrix at Medium cooling rate; (b) CF/PP (Ticona), (c) CF/PA6 (Soficar), (d) CF/PPS (Toray) at different cooling rates The IFSS characteristics are now discussed to understand the influence of the matrix and of the cooling rate, respectively. •Matrix influence As can be seen in Fig. 2-42 or 44a, the IFSS values of CF/PA6, PPS and Epoxy were much higher than those of CF/PP. This tendency was the same as the work of adhesion in Subsection 2.5.1. •Cooling rate influence In the case of CF/PP, the IFSS increased as the cooling rate became slower. Matrix properties enhancement due to higher degree of crystallinity increased IFSS. As can be seen in Fig. 2-44b, the slope of the linear fitting at Fast cooling rate, namely Weibull modulus m was very
92
different from slower cooling rates. This might indicate a different failure mechanism. The matrix was weak enough to limit IFSS to matrix shear yield stress at Fast cooling rate. On the contrary, the matrix became stronger than the interface at slower cooling rates, resulting in interfacial failure, which probably includes much dispersion. In the case of CF/PA6, the IFSS increased first and then decreased again as the cooling rate became slower. Since PA6 had a good adhesion and the Weibull modulus m was similar at all cooling rates, the matrix shear yield stress seemed to be critical for all cooling rates. From Fast to Medium cooling rate, increase of degree of crystallinity probably enhances matrix shear yield stress. However, at Slow cooling rate, the lack of ductility due to too high degree of crystallinity probably lead to low matrix shear yield stress again. As the cooling rate became slower, the matrix residual stress increased in the case of CF/PA6. A too high matrix residual stress could also decrease the ILSS at the slow cooling rate. However, the matrix residual stress in fibre direction might be partially relaxed because the thin sample allowed to easily transform in thickness direction. In the case of CF/PPS, IFSS decreased as the cooling rate became slower. Since PPS had a good adhesion and the Weibull modulus m was similar at all cooling rates, the matrix shear yield stress seemed to be critical for all the cooling rates. Probably a higher crystallinity decreased the ductility of matrix, resulting in a lower matrix shear yield stress. 2.5.5 Interlaminar fracture toughness in mode II Interlaminar fracture toughness in mode II was measured using the End Notched Flexure (ENF) test. There are two reasons to investigate this parameter in addition to the interfacial shear strength IFSS. The first reason is that shear interfacial properties should be characterized not only in terms of stress but also in energy terms. A fair comparison is not easy because the interlaminar fracture toughness represents a mixture of properties of matrix and interface, while interfacial shear strength obtained in the push-out test detects more localized properties mostly controlled by the interface. The second reason is the dispersed failure as described in Subsection 2.4.1. Splitting initiates from a fibre breakage clusters during 0° tensile tests. From the fracture mechanics point of view, splitting growth is controlled by toughness against shear load among matrix and interface. Therefore, the interlaminar fracture toughness in mode II is suitable to characterize the dispersed failure process. Since the interlayer between the prepreg plies in a unidirectional laminate tends to be resin rich as shown in the laminate cross-section in Fig. 2-6, it may be criticized for the direct application of the interlaminar fracture toughness in mode II to splitting growth among homogeneously distributed fibres. The ENF test preparation and procedure followed the Japanese Industrial Standards (JIS) K7086, because ASTM and ISO do not authorize the test. The dimensions of the specimen were as follows: length l 140 mm, width w 25 mm, thickness t around 3 mm and aluminium foil insert length li 40 mm. The shape of crack tip strongly influences the measured initial

93
fracture toughness. Thus, a pre-crack was propagated at interlayer from the tip of aluminium foil (20 μm thickness) inserted before the tests, by means of inserting a wedge from the coupon edge. Three-point flexure test set up is used as schematized in Fig. 2-45. The radius of the loading nose R1 and support R2 were 5 mm, span length between loading and support L was 50 mm. The initial crack length a0 was around 25 mm including a pre-crack of around 5 mm.
t
w
lLL
R2
R1
Fa0
li
Pre-crackAluminum-foil insert
a)
b)
Fig. 2-45 Schematics of ENF test coupon and set-up: (a) top view, (b) side view According to JIS K7086, the interlaminar fracture toughness in mode II GIIc is calculated from the load, either at the intersection between the load-displacement curve and 5 % off-set line from initial slope of load-displacement curve, or at initial peak load. However, the obtained load-displacement curves in this study showed strong non-linearity; most of GIIc was calculated from the intersection with 5 % off-set line. To utilize the data of the peak load, two values for interlaminar fracture toughness were defined, namely interlaminar fracture toughness corresponding to initiation GIIci and propagation GIIcp according to reference [23].
Displacement δ
Load
F
Unstable crackgrowth
1% off-set
Fi
Fp
Elastic
Fig. 2-46 Interpretation of a load-displacement curve in an ENF test Fig. 2-46 explains the interpretation of the load-displacement curves. Interlaminar fracture toughness for initiation was calculated from the intersection load between load-displacement
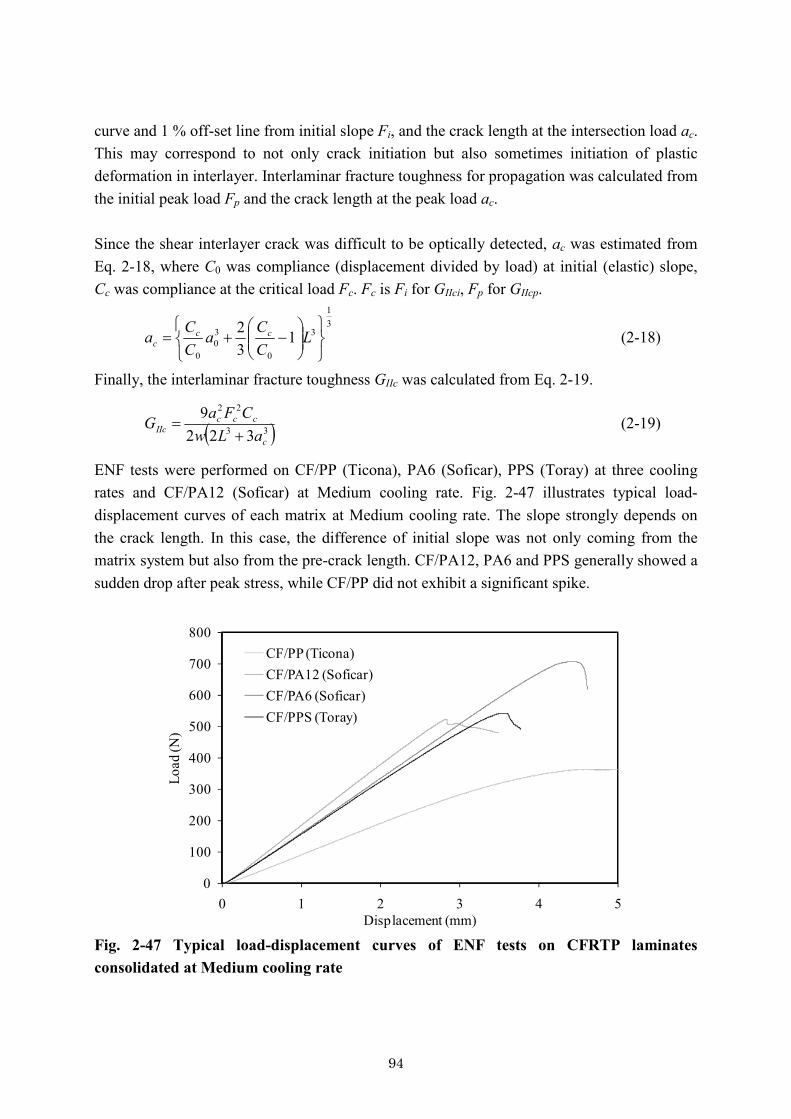
94
curve and 1 % off-set line from initial slope Fi, and the crack length at the intersection load ac. This may correspond to not only crack initiation but also sometimes initiation of plastic deformation in interlayer. Interlaminar fracture toughness for propagation was calculated from the initial peak load Fp and the crack length at the peak load ac. Since the shear interlayer crack was difficult to be optically detected, ac was estimated from Eq. 2-18, where C0 was compliance (displacement divided by load) at initial (elastic) slope, Cc was compliance at the critical load Fc. Fc is Fi for GIIci, Fp for GIIcp.
31
3
0
30
0
132
þýü
îíì
÷÷ø
öççè
æ-+= L
CCa
CCa cc
c (2-18)
Finally, the interlaminar fracture toughness GIIc was calculated from Eq. 2-19.
( )33
22
3229
c
cccIIc aLw
CFaG+
= (2-19)
ENF tests were performed on CF/PP (Ticona), PA6 (Soficar), PPS (Toray) at three cooling rates and CF/PA12 (Soficar) at Medium cooling rate. Fig. 2-47 illustrates typical load-displacement curves of each matrix at Medium cooling rate. The slope strongly depends on the crack length. In this case, the difference of initial slope was not only coming from the matrix system but also from the pre-crack length. CF/PA12, PA6 and PPS generally showed a sudden drop after peak stress, while CF/PP did not exhibit a significant spike.
0
100
200
300
400
500
600
700
800
0 1 2 3 4 5
Load
(N)
Displacement (mm)
CF/PP (Ticona)CF/PA12 (Soficar)CF/PA6 (Soficar)CF/PPS (Toray)
Fig. 2-47 Typical load-displacement curves of ENF tests on CFRTP laminates consolidated at Medium cooling rate
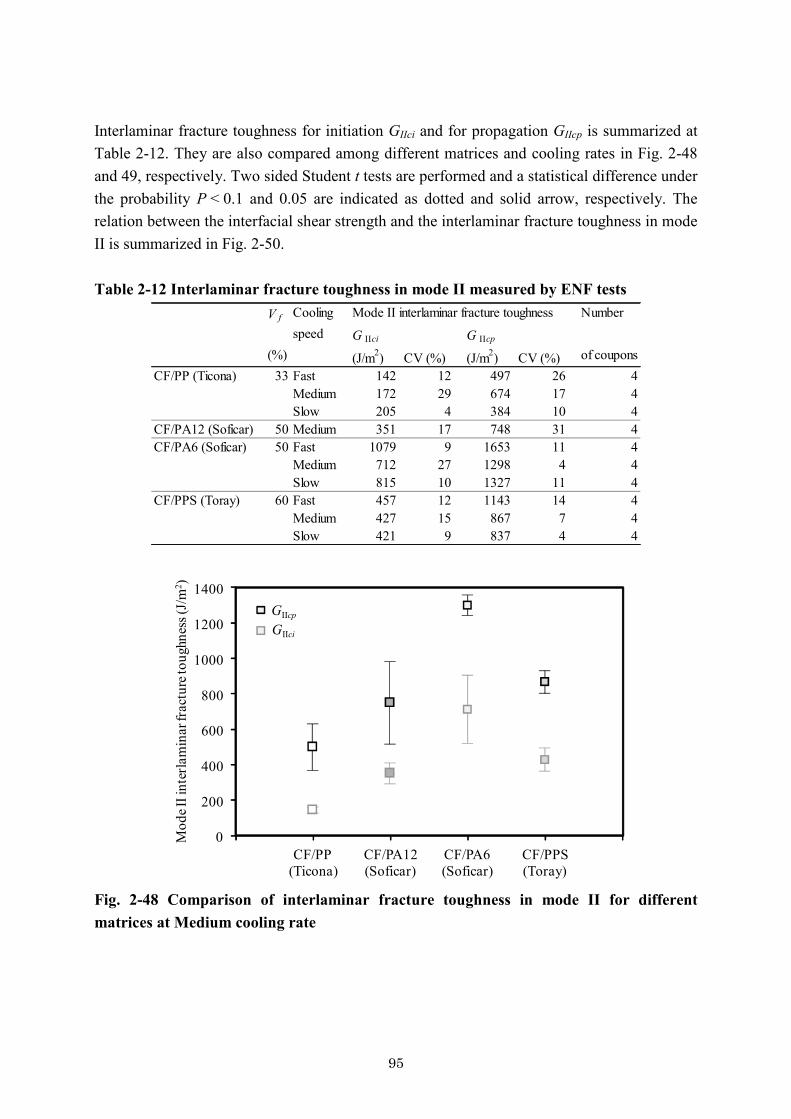
95
Interlaminar fracture toughness for initiation GIIci and for propagation GIIcp is summarized at Table 2-12. They are also compared among different matrices and cooling rates in Fig. 2-48 and 49, respectively. Two sided Student t tests are performed and a statistical difference under the probability P < 0.1 and 0.05 are indicated as dotted and solid arrow, respectively. The relation between the interfacial shear strength and the interlaminar fracture toughness in mode II is summarized in Fig. 2-50. Table 2-12 Interlaminar fracture toughness in mode II measured by ENF tests
V f Cooling Numberspeed G IIci G IIcp
(%) (J/m2) CV (%) (J/m2) CV (%) of couponsCF/PP (Ticona) 33 Fast 142 12 497 26 4
Medium 172 29 674 17 4Slow 205 4 384 10 4
CF/PA12 (Soficar) 50 Medium 351 17 748 31 4CF/PA6 (Soficar) 50 Fast 1079 9 1653 11 4
Medium 712 27 1298 4 4Slow 815 10 1327 11 4
CF/PPS (Toray) 60 Fast 457 12 1143 14 4Medium 427 15 867 7 4Slow 421 9 837 4 4
Mode II interlaminar fracture toughness
0
200
400
600
800
1000
1200
1400
CF/PP(Ticona)
CF/PA6(Soficar)
CF/PPS(Toray)
CF/PA12(Soficar)
Mod
e II i
nter
lam
inar
frac
ture
toug
hnes
s (J/
m2 )
GIIcp
GIIci
Fig. 2-48 Comparison of interlaminar fracture toughness in mode II for different matrices at Medium cooling rate
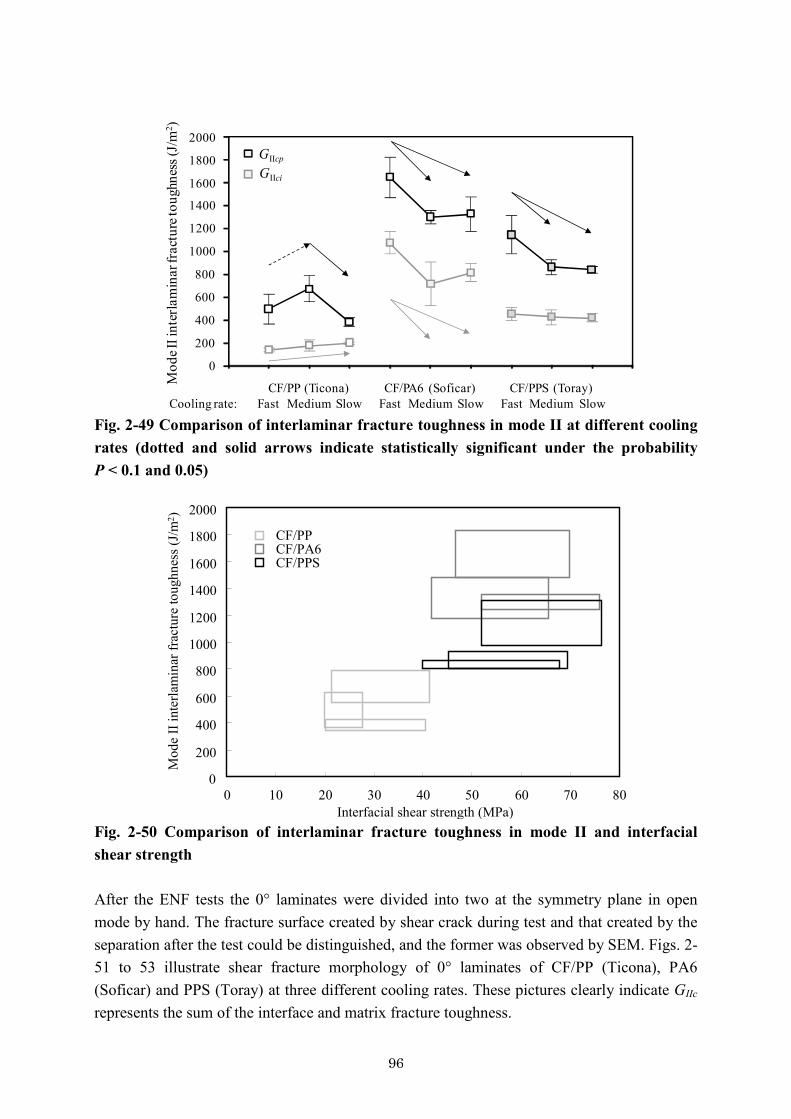
96
0
200
400
600
800
1000
1200
1400
1600
1800
2000
FastCF/PP (Ticona)
Medium Slow FastCF/PA6 (Soficar)
Medium Slow FastCF/PPS (Toray)
Medium SlowCooling rate:
Mod
e II i
nter
lam
inar
frac
ture
toug
hnes
s (J/
m2 )
GIIcp
GIIci
Fig. 2-49 Comparison of interlaminar fracture toughness in mode II at different cooling rates (dotted and solid arrows indicate statistically significant under the probability P < 0.1 and 0.05)
0
200
400
600
800
1000
1200
1400
1600
1800
2000
0 10 20 30 40 50 60 70 80Interfacial shear strength (MPa)
Mod
e II
inte
rlam
inar
frac
ture
toug
hnes
s (J/m
2 )
CF/PPCF/PA6CF/PPS
Fig. 2-50 Comparison of interlaminar fracture toughness in mode II and interfacial shear strength After the ENF tests the 0° laminates were divided into two at the symmetry plane in open mode by hand. The fracture surface created by shear crack during test and that created by the separation after the test could be distinguished, and the former was observed by SEM. Figs. 2-51 to 53 illustrate shear fracture morphology of 0° laminates of CF/PP (Ticona), PA6 (Soficar) and PPS (Toray) at three different cooling rates. These pictures clearly indicate GIIc represents the sum of the interface and matrix fracture toughness.

97
a)
b)
c) Fig. 2-51 Fracture morphologies of CF/PP (Ticona) in ENF tests observed by SEM: (a) Fast, (b) Medium and (c) Slow cooling rate
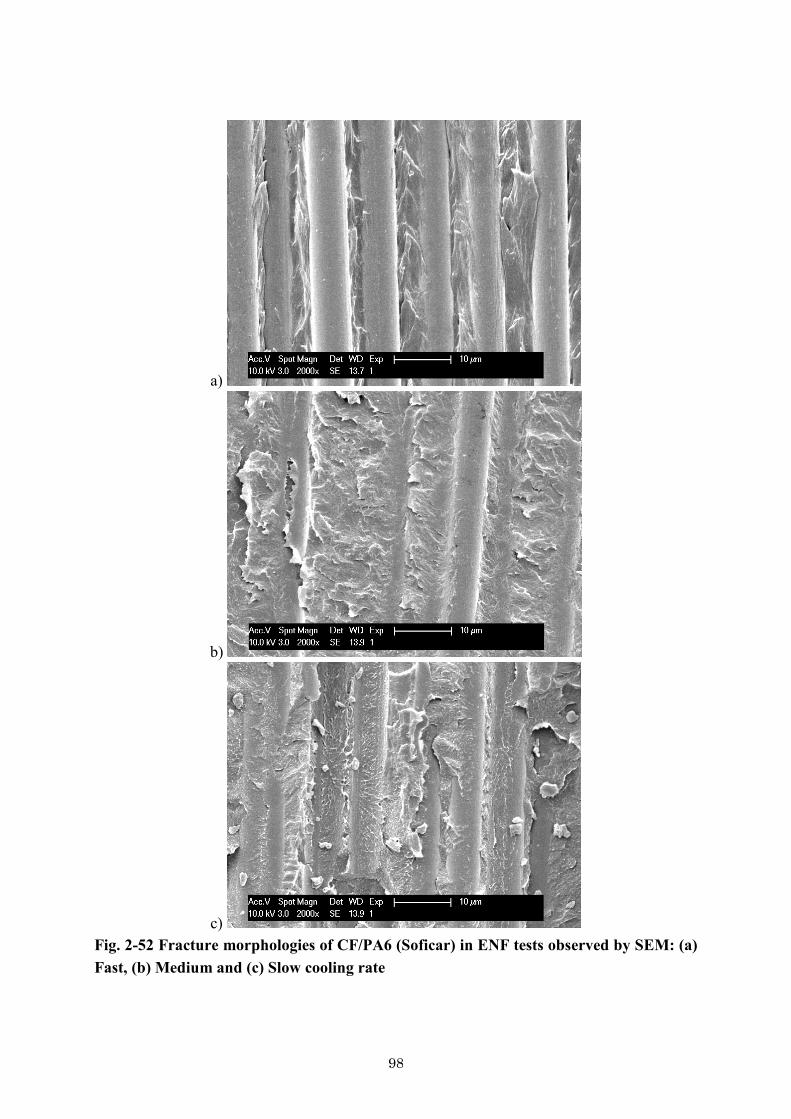
98
a)
b)
c) Fig. 2-52 Fracture morphologies of CF/PA6 (Soficar) in ENF tests observed by SEM: (a) Fast, (b) Medium and (c) Slow cooling rate
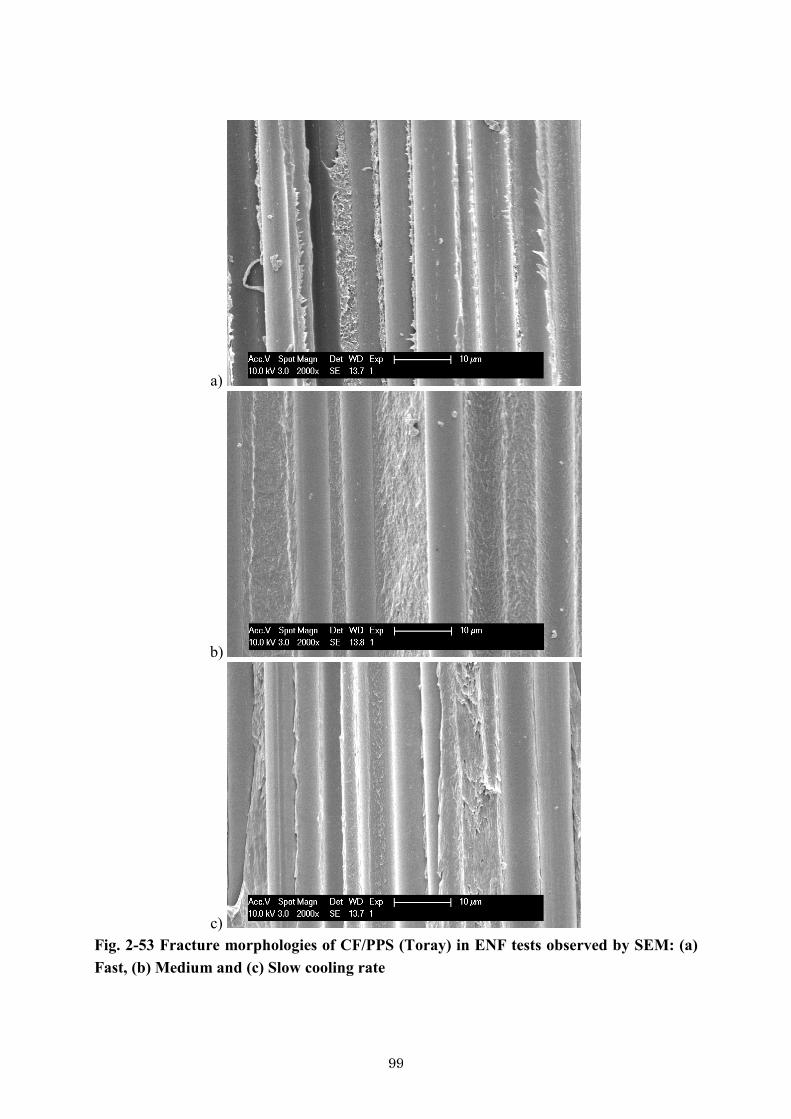
99
a)
b)
c) Fig. 2-53 Fracture morphologies of CF/PPS (Toray) in ENF tests observed by SEM: (a) Fast, (b) Medium and (c) Slow cooling rate
100
Matrix and cooling rate influences are respectively discussed as follows. •Matrix difference As shown in Fig. 2-48, the descending order of interlaminar fracture toughness for initiation and propagation was as follows: CF/PA6 > PPS > PA12 > PP. Although the interfacial shear strength of CF/PA6 and PPS was similar, fracture toughness of CF/PA6 was much higher than that of CF/PPS. Hence, the difference in fracture toughness came from matrix ductility because shear load in interlayer caused not only interface but also matrix failure. In any way, the interlaminar fracture toughness globally has a good correlation with the interfacial shear strength as illustrated in Fig. 2-50. •Cooling rate difference In the case of CF/PP, GIIci increased as cooling rate became slower, but GIIcp first increased and decreased again as cooling rate became slower, as shown in Fig. 2-49. The interfacial shear stress IFSS followed the same tendency as GIIci. Enhancement of matrix properties improved IFSS, and GIIci, but at the Slow cooling rate, PP might lose ductility and resistance against crack propagation. As can be seen in the fracture morphology of CF/PP at different cooling rates in Fig. 2-51a, a thin layer of matrix covered the fibres at Fast cooling rate, but clean fibre surface was exposed and matrix was torn at slower cooling rates. At Fast cooling rate, matrix was so weak that it exhibited low GIIc. At Slow cooling rates, ductility loss reduced the contribution of matrix energy absorption, leading to the reduction of GIIcp. In the case of CF/PA6, GIIci and GIIcp had the same tendency as shown in Fig. 2-49. The highest GIIc achieved at Fast cooling rate, then it decreased as cooling rate became slower. As can be seen in the fracture morphology of CF/PA6 at different cooling rates in Fig. 2-52, Fast cooling provided a cleaner fibre surface than slower cooling rates. The fact that IFSS at Fast cooling rates was lower than that at slower cooling rates supported this phenomenon. On the contrary, matrix looked more ductile than those at slower cooling rates. This ductility probably brought higher energy absorption during shear crack propagation, leading to the highest GIIc at Fast cooling rate. In the cases of CF/PPS, GIIci and GIIcp had the same tendency, as shown in Fig. 2-49. CF/PPS decreased as the cooling rate became slower, the same tendency as for the IFSS. As can be seen in fracture morphology of CF/PPS at different cooling rates in Fig. 2-53, the fibre surface looked clean at all cooling rates. The way of fracture of matrix indicated that the matrix ductility significantly declined as cooling rate became slower. This probably caused the decrease of energy absorption during shear at slower cooling rates, leading to the reduction of GIIc.
101
2.6 Constitutive models predicting 0° tensile strength Material development for improving the mechanical properties of composites requires the understanding of micromechanics. Especially, the tensile strength of 0° unidirectional laminate represents the composite material potential. In this section, existing models to connect microscopic mechanical properties to global 0° tensile strength are presented, and they are partially modified. Then, a parametric study is carried out within the possible range of fibre/matrix parameters of CFRP. This reveals the characteristics of tensile failure in unidirectional CFRP composites. Finally, the 0° tensile strength is predicted using the microscopic mechanical properties measured in Section 2.5, and this predicted value is compared to the experimentally obtained strength in Subsection 2.4.1 2.6.1 Modelling principles Constitutive models describing the tensile failure in 0° unidirectional composites are selected from conventional studies, which embody three principles proposed as follows. •Neglecting the matrix axial stress When the modulus of 0° unidirectional composites is calculated from the rule of mixture, the matrix component is often neglected in polymer composites. In the same manner, this study considers only shear loading of the matrix. This also means that the matrix crack influence is neglected on tensile failure of 0° unidirectional composites. In the case of ceramic matrix composites, indeed the load sustained by high stiffness matrix cannot be neglected and the brittle matrix provides sharp crack tips to cut the fibres. Therefore, strength improvement is sometimes obtained by weak interface to deviate the crack direction parallel to the fibres [72, 73]. In the case of polymer matrix composites, however, the modulus of the matrix is maximum about 5 GPa. The contribution to axial load transfer is insignificant and the crack tip is rounded due to local yield of the polymer. Noda [136, 137] proved that transverse crack inside of a 90° layer does not influence the 0° layer failure. Even though numbers of 90° layers were stacked next to 0° layer in CFRP cross-ply laminate, the strength was exactly proportional to the volume fraction of the 0° layer. Since a transverse crack in a 90° layer is obviously much more intensive than a matrix crack initiated from fibre breakages, neglecting the existence of the matrix crack is reasonable in the case of predicting the 0° tensile strength. •Kelly-Tyson approximation For the stress distribution around fibre breakage the Kelly-Tyson hypothesis is applied. In the ineffective length δ, the matrix (or interface) around the fibre yields in perfect-plastic manner and the fibre axial stress σf linearly recoveries away from the fibre breakage. Although the Kelly-Tyson hypothesis is known to characterize the stress distribution around fibre breakage not perfectly, this study intentionally uses this hypothesis for constructing a model as simple

102
as possible. The final purpose of constitutive modelling is to extract the strength improvement by clarifying the contribution of each parameter. By introducing this hypothesis, the interface contribution can be summarized into only one parameter, namely the matrix shear yield stress (or interfacial shear stress) τy. As shown in Fig. 2-54, complicated mechanisms influence the stress distribution, such as debonding, precise matrix shear behaviour. They are different from each fibre, matrix and the combination. This study approximates the real stress distribution with the Kelly-Tyson hypothesis as indicated with dotted line in Fig. 2-54. Therefore, τy is a kind of fitting parameter and may not be identical to the interfacial shear strength obtained by some types of experiments. Constitutive models using this simple approximation for tensile failure of 0° unidirectional composite are set up first in this section and then detailed mechanisms for closing the gap between experiment and the models are discussed for each material system in the next section.
σf
Kelly-Tyson approximation
Debonding
Fibre breakage
τy
ElasticPlastic hardeningFriction
Precise stress distribution(supposition)
Fibre
Matrix next to interface
Ineffective length δ
Fig. 2-54 Schematic of Kelly-Tyson approximation •Localized shear failure around broken fibre Excluding the matrix contribution in axial load, the shear load is transferred from broken fibre to adjacent fibres through the matrix. As can be seen Fig. 2-55a, about six fibres surround a broken fibre. The shear stress in the matrix reduces from the broken fibre to the surrounding fibres, because the shear plane area increases as moving away from the broken fibre surface,
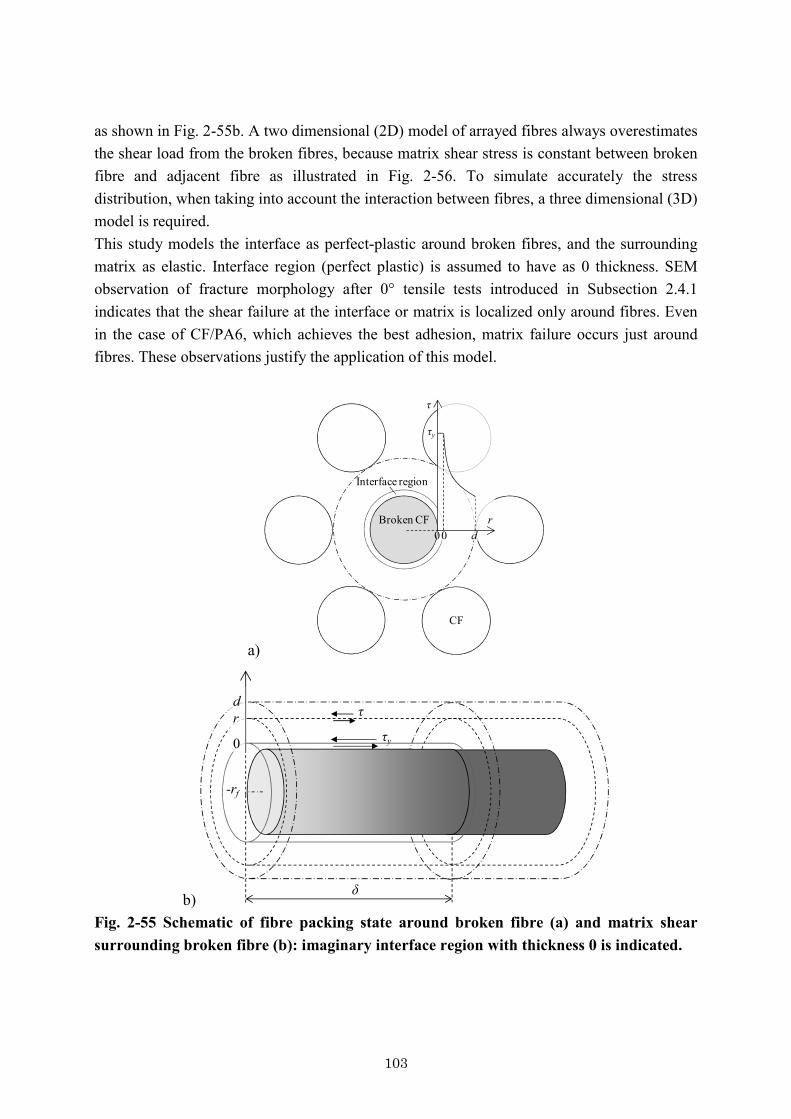
103
as shown in Fig. 2-55b. A two dimensional (2D) model of arrayed fibres always overestimates the shear load from the broken fibres, because matrix shear stress is constant between broken fibre and adjacent fibre as illustrated in Fig. 2-56. To simulate accurately the stress distribution, when taking into account the interaction between fibres, a three dimensional (3D) model is required. This study models the interface as perfect-plastic around broken fibres, and the surrounding matrix as elastic. Interface region (perfect plastic) is assumed to have as 0 thickness. SEM observation of fracture morphology after 0° tensile tests introduced in Subsection 2.4.1 indicates that the shear failure at the interface or matrix is localized only around fibres. Even in the case of CF/PA6, which achieves the best adhesion, matrix failure occurs just around fibres. These observations justify the application of this model.
a)
r00 d
τ
τy
CF
Broken CF
Interface region
b)
τ
τy
δ
rd
0
-rf
Fig. 2-55 Schematic of fibre packing state around broken fibre (a) and matrix shear surrounding broken fibre (b): imaginary interface region with thickness 0 is indicated.
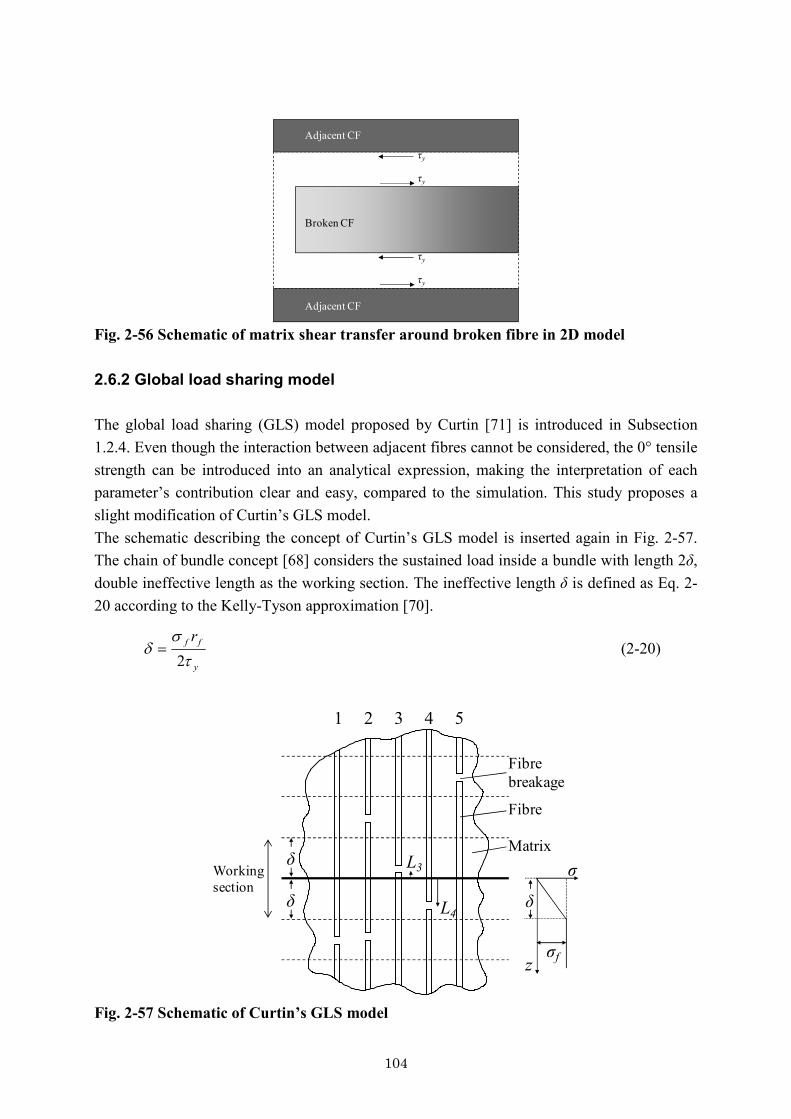
104
τy
τy
τy
τy
Broken CF
Adjacent CF
Adjacent CF
Fig. 2-56 Schematic of matrix shear transfer around broken fibre in 2D model 2.6.2 Global load sharing model The global load sharing (GLS) model proposed by Curtin [71] is introduced in Subsection 1.2.4. Even though the interaction between adjacent fibres cannot be considered, the 0° tensile strength can be introduced into an analytical expression, making the interpretation of each parameter’s contribution clear and easy, compared to the simulation. This study proposes a slight modification of Curtin’s GLS model. The schematic describing the concept of Curtin’s GLS model is inserted again in Fig. 2-57. The chain of bundle concept [68] considers the sustained load inside a bundle with length 2δ, double ineffective length as the working section. The ineffective length δ is defined as Eq. 2-20 according to the Kelly-Tyson approximation [70].
y
ff rt
sd
2= (2-20)
1 2 3 4 5
δ
δ δ
σf
σ
z
Fibrebreakage
Fibre
MatrixL3
L4
Workingsection
Fig. 2-57 Schematic of Curtin’s GLS model

105
The average fibre stress in the section is defined as the sum of stress in the intact fibre times the probability of not fractured fibres and the recovery stress in the broken fibre times the probability of failure. Then, the constitutive expression of composite stress σL can be written in Eq. 2-21 (Refer to Subsection 1.2.4, Eq. 1-16).
( )þýü
îíì
÷øö
çèæ ><--= ds
dss 2,11 ffffL PLV (2-21)
σf is the stress in intact fibre, Pf(σf,2δ) is the probability of fibre breakage as a function of σf and 2δ, and is governed by Weibull equation (Eq. 1-15). In this model, the Weibull equation is approximated as described in Eq. 2-22, where σ0, m, L0 are the Weibull scaling parameter, the Weibull modulus and the span length to determine the Weibull parameters, respectively.
( )m
fm
fff LL
P ÷÷ø
öççè
æ@
ïþ
ïýü
ïî
ïíì
÷÷ø
öççè
æ--=
0000
22exp12,ssd
ssdds (2-22)
<L> is the parameter governing stress recovery rate in broken fibre. Following the Kelly-Tyson approximation, the stress recoveries linearly away from the breakage point. Curtin hypothesizes that the average distance from the fibre breakage to the bold solid line at the centre of a bundle shown in Fig. 2-57 is a half of δ as described in Eq. 2-23.
d21
>@< L (2-23)
This study improves this hypothesis by taking into account the possible positions of the fibre fracture in the range of 2δ. Fig. 2-58 illustrates stress distribution around a broken fibre under the Kelly-Tyson approximation. The fibre stress reaches the stress in intact fibre σf at a distance more than δ away from breakage point. The bundle contains many fibres and many fibre fractures are randomly distributed in the working section. Therefore, iso-strain condition can be applied to this working section.
σf
Zδ δ
Working section 2δa
Fibre breakage
Fig. 2-58 Fibre stress distribution around breakage under Kelly-Tyson approximation (imaginary interface region with 0 thickness surrounding fibre is intentionally indicated)
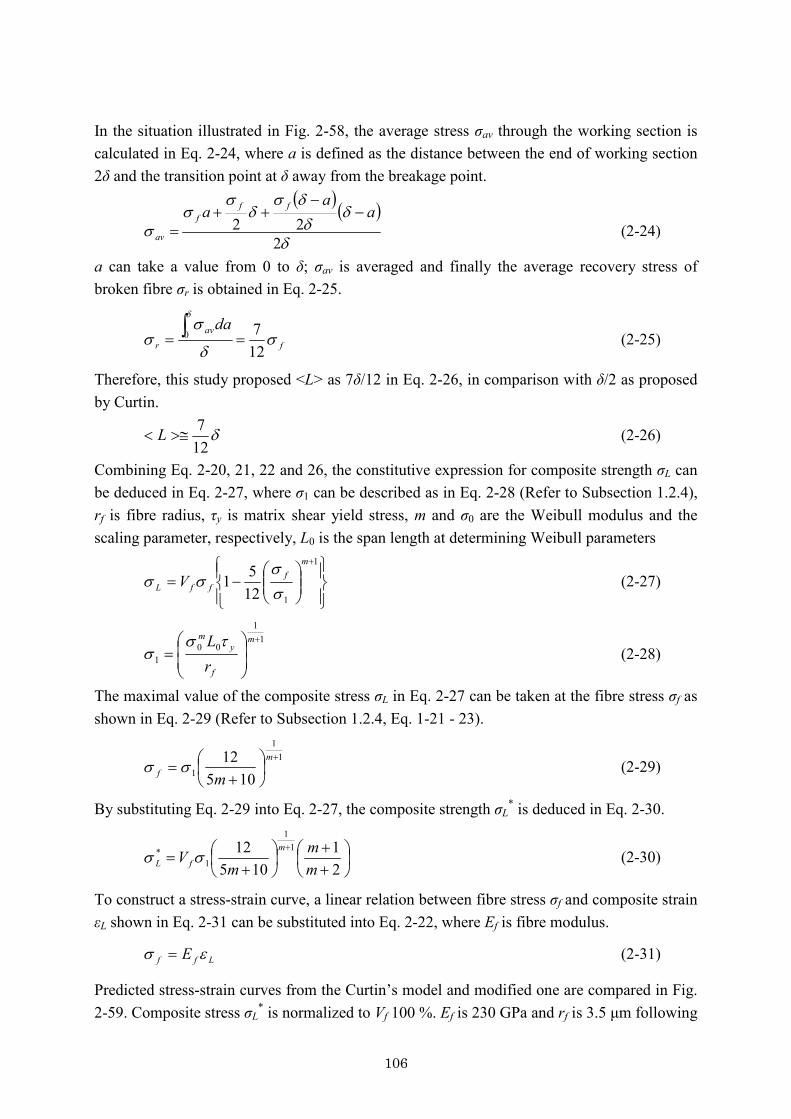
106
In the situation illustrated in Fig. 2-58, the average stress σav through the working section is calculated in Eq. 2-24, where a is defined as the distance between the end of working section 2δ and the transition point at δ away from the breakage point.
( ) ( )d
ddds
ds
ss
222
aa
a fff
av
--
++= (2-24)
a can take a value from 0 to δ; σav is averaged and finally the average recovery stress of broken fibre σr is obtained in Eq. 2-25.
fav
r
das
d
ss
d
1270 == ò (2-25)
Therefore, this study proposed <L> as 7δ/12 in Eq. 2-26, in comparison with δ/2 as proposed by Curtin.
d127
>@< L (2-26)
Combining Eq. 2-20, 21, 22 and 26, the constitutive expression for composite strength σL can be deduced in Eq. 2-27, where σ1 can be described as in Eq. 2-28 (Refer to Subsection 1.2.4), rf is fibre radius, τy is matrix shear yield stress, m and σ0 are the Weibull modulus and the scaling parameter, respectively, L0 is the span length at determining Weibull parameters
ïþ
ïýü
ïî
ïíì
÷÷ø
öççè
æ-=
+1
11251
mf
ffL Vss
ss (2-27)
11
001
+
÷÷ø
öççè
æ=
m
f
ym
rL ts
s (2-28)
The maximal value of the composite stress σL in Eq. 2-27 can be taken at the fibre stress σf as shown in Eq. 2-29 (Refer to Subsection 1.2.4, Eq. 1-21 - 23).
11
1 10512 +
÷øö
çèæ
+=
m
f mss (2-29)
By substituting Eq. 2-29 into Eq. 2-27, the composite strength σL* is deduced in Eq. 2-30.
÷øö
çèæ
++
÷øö
çèæ
+=
+
21
10512 1
1
1*
mm
mV
m
fL ss (2-30)
To construct a stress-strain curve, a linear relation between fibre stress σf and composite strain εL shown in Eq. 2-31 can be substituted into Eq. 2-22, where Ef is fibre modulus.
Lff E es = (2-31)
Predicted stress-strain curves from the Curtin’s model and modified one are compared in Fig. 2-59. Composite stress σL
* is normalized to Vf 100 %. Ef is 230 GPa and rf is 3.5 μm following

107
T700S data sheets. Weibull parameters are set as follows: L0 = 25 mm, σ0 = 5000 MPa, m = 7. τy is 50 MPa. The modified model always provides a higher strength than Curtin’s model.
0
1000
2000
3000
4000
5000
6000
7000
0 1 2 3 4 5Strain (%)
Nor
mal
ized
stre
ss fo
r Vf 1
.0 (M
Pa)- GLS (Curtin)
GLS (Taketa)
Fig. 2-59 Comparison of stress-strain curves between Curtin and modified GLS model 2.6.3 Local load sharing model The GLS model considers only the stress distribution in the broken fibre. To account for the stress re-distribution from the broken fibre to the adjacent fibres, the local load sharing (LLS) model proposed by Okabe [84-86] is adequate for this research. The model concentrates on the matrix shear loading with neglecting the axial matrix stress; it can use the Kelly-Tyson approximation for the fibre stress recovery from the breakage; especially the perfect-plastic interface region and the elastic matrix region can be separately set up to reproduce the localized shear stress around the broken fibre. To achieve simultaneously a 3D model and a statistical simulation requiring many fibres, Okabe has constructed a spring element unit cell only with axial fibre springs and shear matrix springs, for reducing the calculation cost, as illustrated in Fig. 2-60. Equilibrium of force is formulated to solve for unknown load and displacement. The ineffective length and stress recovery at both sides of the fibre breakage are calculated by an analytical equation and –a priori applied to the model to count for the non-linear shear behaviour of matrix without iterative calculation. Fibre strength is applied to each fibre spring following the Weibull distribution at the beginning of the simulation and Monte Carlo approach with increasing longitudinal strain is implemented. At each strain step, fibre fracture is searched for and if fibre fracture occurred, the stress re-distribution is calculated again at the same strain. Finally, the full stress-strain curve is simulated.
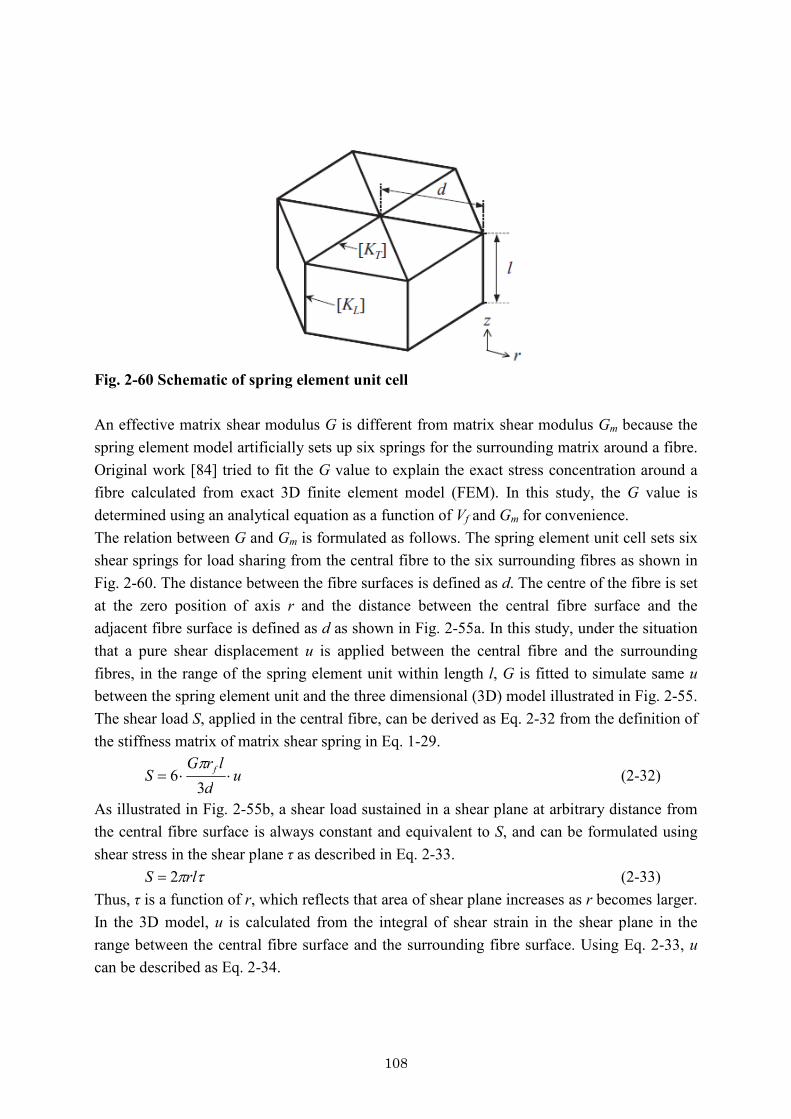
108
Fig. 2-60 Schematic of spring element unit cell An effective matrix shear modulus G is different from matrix shear modulus Gm because the spring element model artificially sets up six springs for the surrounding matrix around a fibre. Original work [84] tried to fit the G value to explain the exact stress concentration around a fibre calculated from exact 3D finite element model (FEM). In this study, the G value is determined using an analytical equation as a function of Vf and Gm for convenience. The relation between G and Gm is formulated as follows. The spring element unit cell sets six shear springs for load sharing from the central fibre to the six surrounding fibres as shown in Fig. 2-60. The distance between the fibre surfaces is defined as d. The centre of the fibre is set at the zero position of axis r and the distance between the central fibre surface and the adjacent fibre surface is defined as d as shown in Fig. 2-55a. In this study, under the situation that a pure shear displacement u is applied between the central fibre and the surrounding fibres, in the range of the spring element unit within length l, G is fitted to simulate same u between the spring element unit and the three dimensional (3D) model illustrated in Fig. 2-55. The shear load S, applied in the central fibre, can be derived as Eq. 2-32 from the definition of the stiffness matrix of matrix shear spring in Eq. 1-29.
ud
lrGS f ××=
36
p (2-32)
As illustrated in Fig. 2-55b, a shear load sustained in a shear plane at arbitrary distance from the central fibre surface is always constant and equivalent to S, and can be formulated using shear stress in the shear plane τ as described in Eq. 2-33.
tprlS 2= (2-33) Thus, τ is a function of r, which reflects that area of shear plane increases as r becomes larger. In the 3D model, u is calculated from the integral of shear strain in the shear plane in the range between the central fibre surface and the surrounding fibre surface. Using Eq. 2-33, u can be described as Eq. 2-34.

109
÷÷ø
öççè
æ+== ò
+
fm
dr
rm r
dlGSdr
Gu f
f1ln
2pt (2-34)
Combining Eq. 2-32 and 34, G is derived using Gm and d as in Eq. 2-35.
mf
f
f
Gdr
rrdG ÷
÷ø
öççè
æ
+= ln (2-35)
d is a function of Vf as described in Eq. 2-36, therefore G is determined not only as a matrix related feature but also as a geometrical feature.
÷÷
ø
ö
çç
è
æ-= 2
32
ff V
rd p (2-36)
This study investigated only a hexagonal packing state, but packing state of randomly distributed fibres can also be simulated by changing G, because G reflects the influence of the distance between fibres. 2.6.4 Parametric study A parametric study on global load sharing (GLS) and local load sharing (LLS) models was done using possible properties for carbon fibre reinforced polymer composites. The source code for the LLS model used in this study was developed in University of Tokyo by Dr. T. Okabe, Dr. Nishikawa and Mr. K. Ishii. The diameter of carbon fibres for mechanical reinforcement of polymers is around 3 - 7 μm. In addition, possible Weibull modulus is assumingly not less than 3 and not more than 10, even though Weibull parameters tend to vary depending on researchers. Simulation specifications using this study are listed in Table 2-13. Underline indicates the default combination of the properties, namely rf = 3.5 μm, G = 1.2 GPa (only for LLS model), Vf = 60 %, σ0 = 5000 MPa. Two parameters took three values in parallel: m = 3, 7 or 11, τy = 10, 50 or 90 MPa. When changing Vf values, G should be linked to change using Eq. 2-35 and 36. Influence of each parameter was investigated by changing the parameter kept at the other parameters of the default combination. In the case of the LLS model, the number of fibres and fibre length were preliminarily studied and made big enough to achieve stable results. 30 (Nx) times 30 (Ny) fibres were arrayed in 2 mm length (lz), which was sectioned into 200 (Nz). Thus, the number of fibres was 900, the length of unit fibre springs was 10 μm. They assigned artificial strength following a Weibull distribution to the unit fibre springs at the beginning of the Monte Carlo simulation. Composite size influences the global tensile strength [138], but this model size was big enough to provide the close results to those of the coupon size applied in the experiments.

110
Table 2-13 Simulation parameters applied to parametric study
N x 30
N y 30
N z 200
l z (mm) 2.0
r f (μm) 1.5 2.5 3.5G (GPa) 0.1 1.2 2.3 3.4V f (%) 40 50 60
σ 0 (MPa) 2000 5000 8000m 3 7 11 15 19 23 27τ y (MPa) 10 50 90 130 170 210 250
underline: default value
Simulation parametersModelsize
Properties
The tensile strength was predicted from analytical equation in Eq. 2-31 for the GLS model and from simulation based LLS model, with changing parameter values listed in Table 2-13. LLS results represented average values of five simulations. First set of predictions were changing m and τy while the basic parameters were default values as rf = 3.5 μm, G = 1.2 GPa, Vf = 60 % and σ0 = 5000 MPa. Fig. 2-61 and 62 summarize influences of m and τy on the tensile strength, normalized to Vf = 100 %. τy represents the shear load transfer efficiency; a higher τy normally increases tensile strength, but simultaneously causes stress concentration. Higher m means that dispersion of the fibre strength becomes smaller.
4000
6000
8000
10000
12000
14000
16000
0 50 100 150 200 250τy (MPa)
Nor
mal
ized
stre
ngth
for V
f1.0
(MPa
) LLS (m=3)LLS (m=7)LLS (m=11)LLS (m=27)
GLS (m=3)GLS (m=7)GLS (m=11)GLS (m=27)
Fig. 2-61 Relation between tensile strength normalized for Vf 100 % predicted by LLS and GLS models and matrix shear yield stress τy in different Weibull modulus m

111
4000
6000
8000
10000
12000
14000
16000
0 5 10 15 20 25m
Nor
mal
ized
stre
ngth
for V
f1.0
(MPa
) LLS (τy=10MPa)LLS (τy=50MPa)LLS (τy=90MPa)LLS (τy=250MPa)GLS (τy=10MPa)GLS (τy=50MPa)GLS (τy=90MPa)GLS (τy=250MPa)
Fig. 2-62 Relation between tensile strength normalized for Vf 100 % predicted by LLS and GLS models and Weibull modulus m in different matrix shear yield stress τy As illustrated in Fig. 2-61, as τy increases, the composite tensile strength (or more precisely, the composite strength normalized to Vf = 100%, hence the “effective” fibre strength) increased, and saturated in the case of large m. Possible τy in carbon fibre reinforced polymer composites (CFRP) is at most 100 MPa. In this region, tensile strength never decreases as τy increases under a constant σ0. At a lower m (such as 3), the tensile strength always increases, because fibre strength distribution is deviated and stronger fibres continuously sustain load. As illustrated in Fig. 2-62, the tensile strength dramatically increases as m decreases. Possible m for CFRP seems to be from 3 to 10. Therefore, in the case of CFRP, m strongly influences the tensile strength, while m measured from single fibre tests tends to vary depending on researcher’s equipment and skill. The GLS theory indicates that the tensile strength is proportional to τy
1/(m+1). At least in the range of CFRP, namely τy is less than 100 MPa, m is 3 to 10, GLS and LLS results are almost equivalent. Therefore, the GLS model has enough accuracy to predict tensile strength of CFRP, even though it does not account for interaction between adjacent fibres. This also implies that stress concentrations around fibre fractures do not intensively reduce the tensile strength of 0° unidirectional laminates, due to the wide strength distribution of carbon fibre (3 < m < 10) and the relatively low matrix shear loading capability (τy < 100 MPa). Generally the GLS and LLS results exhibited a good agreement in the range of the CFRP parameters. However, in the case of low m and low τy, the tensile strength predicted by the LLS model tends to exceed that of the GLS model, especially with high σ0. On the contrary, in the case of high m and high τy, tensile strength of LLS model tends to be lower than that of GLS model, especially with low σ0. Stress-strain curves of both extreme cases and the
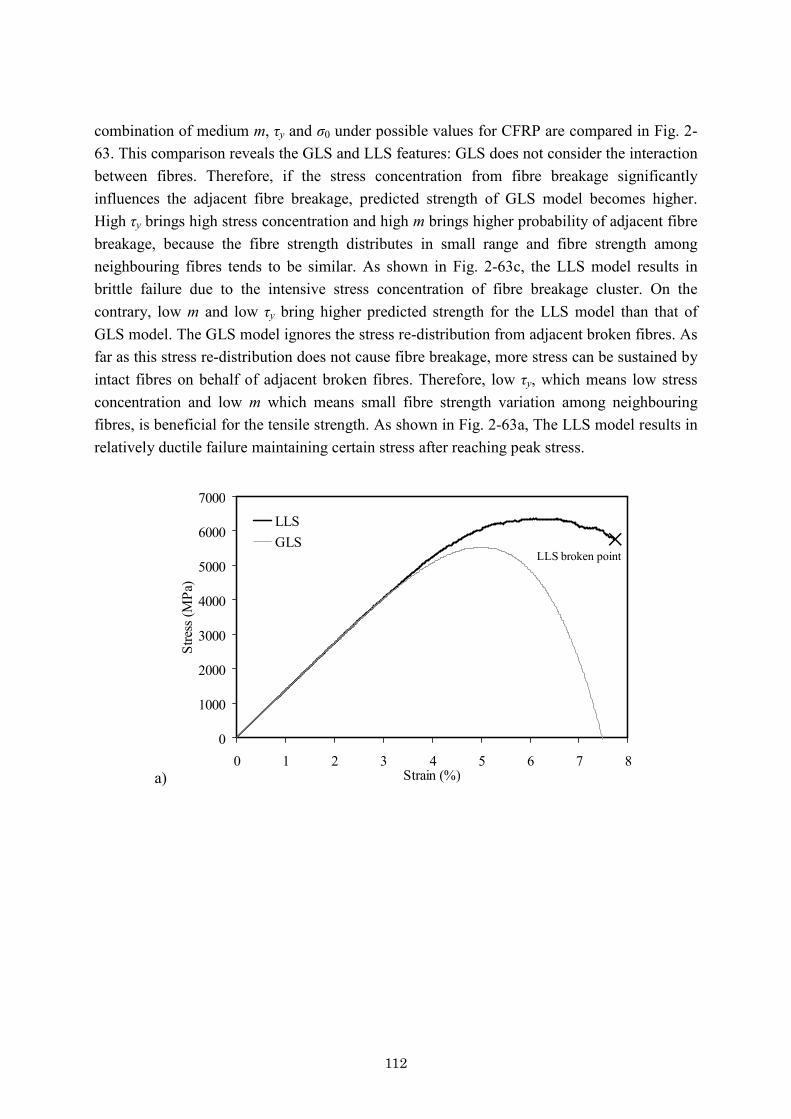
112
combination of medium m, τy and σ0 under possible values for CFRP are compared in Fig. 2-63. This comparison reveals the GLS and LLS features: GLS does not consider the interaction between fibres. Therefore, if the stress concentration from fibre breakage significantly influences the adjacent fibre breakage, predicted strength of GLS model becomes higher. High τy brings high stress concentration and high m brings higher probability of adjacent fibre breakage, because the fibre strength distributes in small range and fibre strength among neighbouring fibres tends to be similar. As shown in Fig. 2-63c, the LLS model results in brittle failure due to the intensive stress concentration of fibre breakage cluster. On the contrary, low m and low τy bring higher predicted strength for the LLS model than that of GLS model. The GLS model ignores the stress re-distribution from adjacent broken fibres. As far as this stress re-distribution does not cause fibre breakage, more stress can be sustained by intact fibres on behalf of adjacent broken fibres. Therefore, low τy, which means low stress concentration and low m which means small fibre strength variation among neighbouring fibres, is beneficial for the tensile strength. As shown in Fig. 2-63a, The LLS model results in relatively ductile failure maintaining certain stress after reaching peak stress.
a)
0
1000
2000
3000
4000
5000
6000
7000
0 1 2 3 4 5 6 7 8Strain (%)
Stre
ss (M
Pa)
LLSGLS
LLS broken point
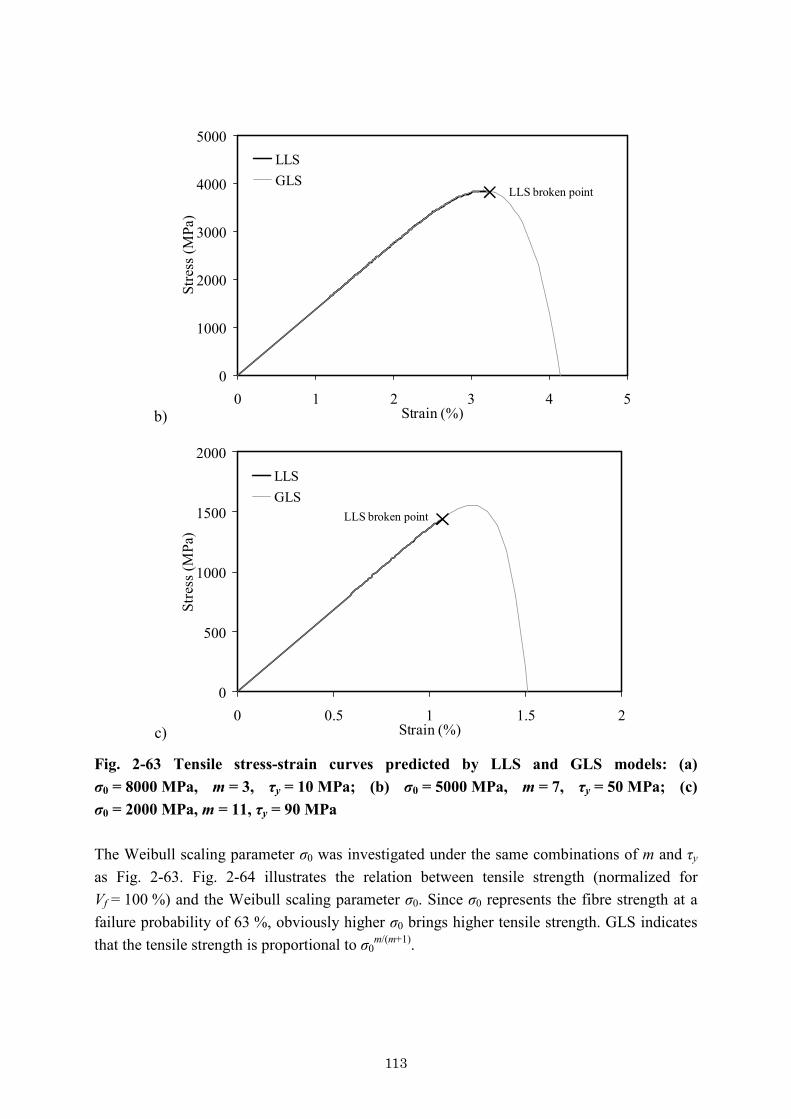
113
b)
0
1000
2000
3000
4000
5000
0 1 2 3 4 5Strain (%)
Stre
ss (M
Pa)
LLSGLS
LLS broken point
c)
0
500
1000
1500
2000
0 0.5 1 1.5 2Strain (%)
Stre
ss (M
Pa)
LLSGLS
LLS broken point
Fig. 2-63 Tensile stress-strain curves predicted by LLS and GLS models: (a) σ0 = 8000 MPa, m = 3, τy = 10 MPa; (b) σ0 = 5000 MPa, m = 7, τy = 50 MPa; (c) σ0 = 2000 MPa, m = 11, τy = 90 MPa The Weibull scaling parameter σ0 was investigated under the same combinations of m and τy as Fig. 2-63. Fig. 2-64 illustrates the relation between tensile strength (normalized for Vf = 100 %) and the Weibull scaling parameter σ0. Since σ0 represents the fibre strength at a failure probability of 63 %, obviously higher σ0 brings higher tensile strength. GLS indicates that the tensile strength is proportional to σ0
m/(m+1).
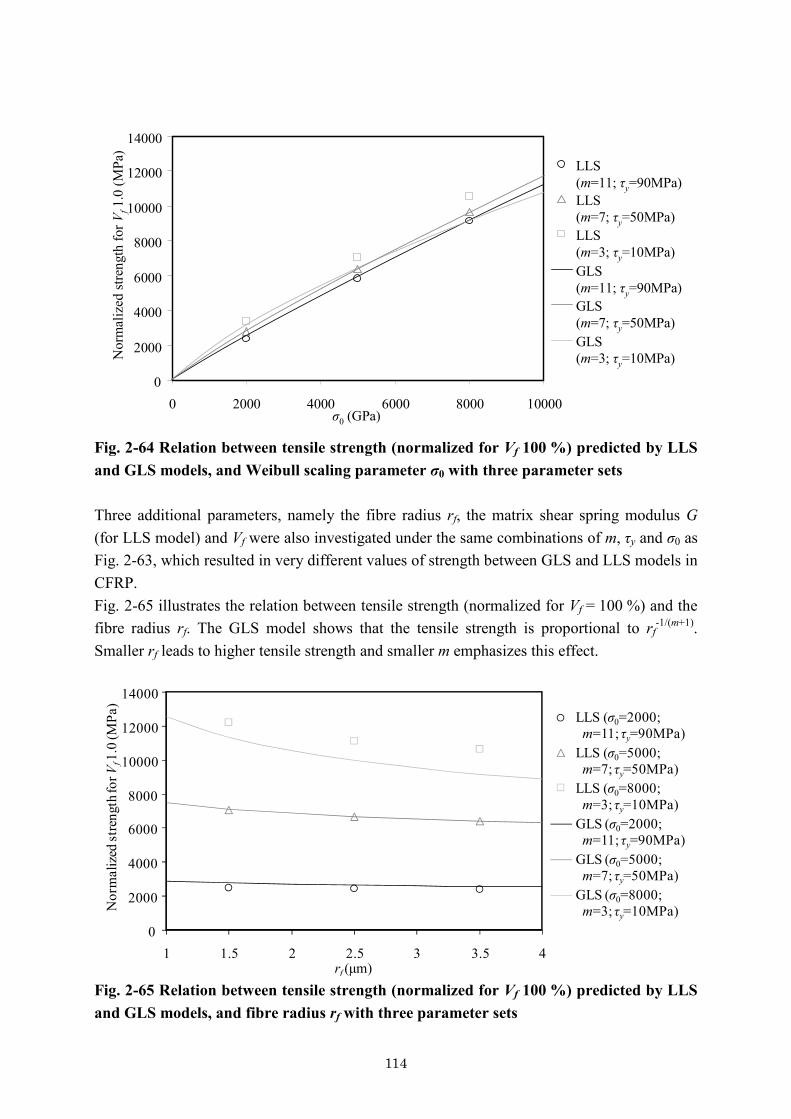
114
0
2000
4000
6000
8000
10000
12000
14000
0 2000 4000 6000 8000 10000σ0 (GPa)
Nor
mal
ized
stre
ngth
for V
f1.
0 (M
Pa)
LLS(m=11; τy=90MPa)LLS(m=7; τy=50MPa)LLS(m=3; τy=10MPa)GLS(m=11; τy=90MPa)GLS(m=7; τy=50MPa)GLS(m=3; τy=10MPa)
Fig. 2-64 Relation between tensile strength (normalized for Vf 100 %) predicted by LLS and GLS models, and Weibull scaling parameter σ0 with three parameter sets Three additional parameters, namely the fibre radius rf, the matrix shear spring modulus G (for LLS model) and Vf were also investigated under the same combinations of m, τy and σ0 as Fig. 2-63, which resulted in very different values of strength between GLS and LLS models in CFRP. Fig. 2-65 illustrates the relation between tensile strength (normalized for Vf = 100 %) and the fibre radius rf. The GLS model shows that the tensile strength is proportional to rf
-1/(m+1). Smaller rf leads to higher tensile strength and smaller m emphasizes this effect.
0
2000
4000
6000
8000
10000
12000
14000
1 1.5 2 2.5 3 3.5 4rf (μm)
Nor
mal
ized
stre
ngth
for V
f1.0
(MPa
)
LLS (σ0=2000;m=11; τy=90MPa)
LLS (σ0=5000;m=7; τy=50MPa)
LLS (σ0=8000;m=3; τy=10MPa)
GLS (σ0=2000;m=11; τy=90MPa)
GLS (σ0=5000;m=7; τy=50MPa)
GLS (σ0=8000;m=3; τy=10MPa)
Fig. 2-65 Relation between tensile strength (normalized for Vf 100 %) predicted by LLS and GLS models, and fibre radius rf with three parameter sets

115
Fig. 2-66 illustrates the relation between the tensile strength (normalized for Vf 100 %) and the matrix shear spring modulus for LLS model G. GLS model does not include parameter G (constant). The LLS model reveals that lower G slightly decreases the tensile strength. G represents the stress concentration around a broken fibre as introduced in Subsection 1.2.4. However, the influence of G is not significant compared to the other parameters. Since G represents not only matrix modulus but also distance between fibres, packing state of fibres, even not regularly arrayed. They all do not influence the strength significantly.
G (GPa)
Nor
mal
ized
stre
ngth
for V
f1.0
(MPa
)
0
2000
4000
6000
8000
10000
12000
0 1 2 3 4
LLS (σ0=2000;m=11; τy=90MPa)
LLS (σ0=5000;m=7; τy=50MPa)
LLS (σ0=8000;m=3; τy=10MPa)
GLS (σ0=2000;m=11; τy=90MPa)
GLS (σ0=5000;m=7; τy=50MPa)
GLS (σ0=8000;m=3; τy=10MPa)
Fig. 2-66 Relation between tensile strength (normalized for Vf 100 %) predicted by LLS and GLS models, and matrix shear spring modulus G with three parameter sets Fig. 2-67 illustrates a relation between tensile strength (normalized for Vf 100 %) and Vf. Since the normalized tensile strength is discussed, Vf does not influence tensile strength in the GLS model (constant). In the LLS model, G was assigned different values as Vf changed (Eq. 2-35 and 36), namely 1.43 GPa for Vf = 40 %, 1.30 GPa for Vf = 50 %, 1.2 GPa for Vf = 60 %. In the same manner as parameter G, Vf does not influence the normalized tensile strength to a large extent.
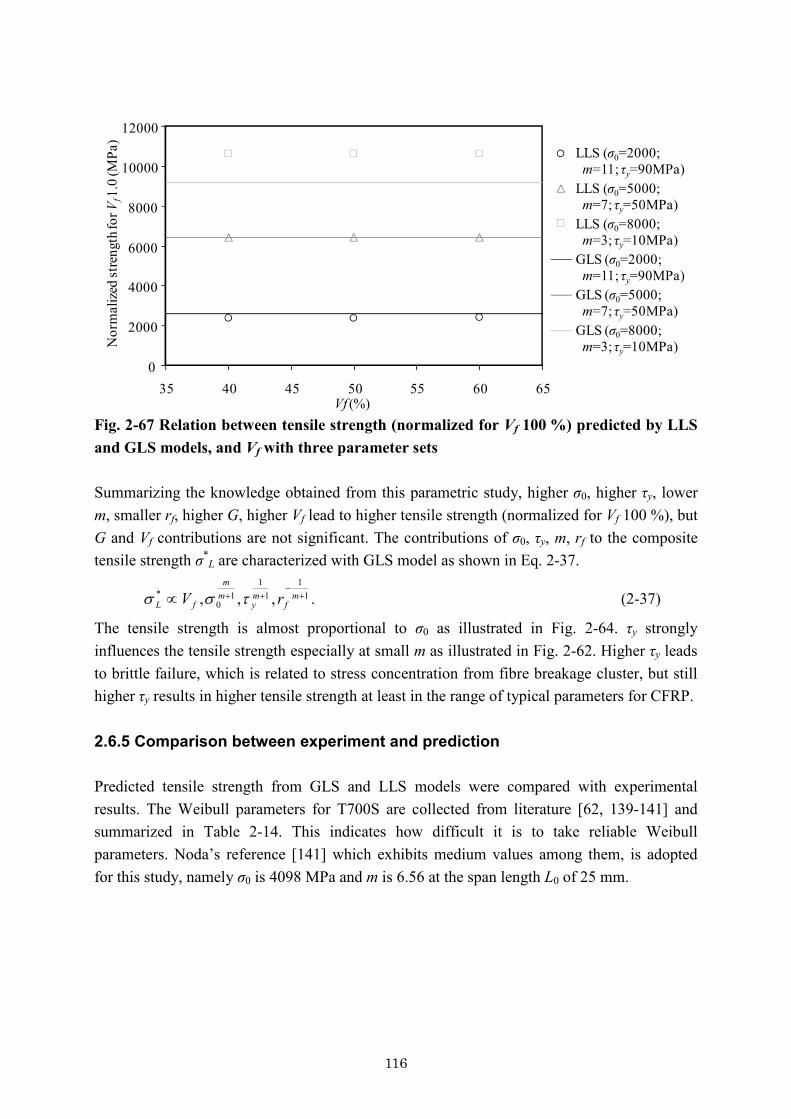
116
Vf (%)
Nor
mal
ized
stre
ngth
for V
f1.0
(MPa
)
0
2000
4000
6000
8000
10000
12000
35 40 45 50 55 60 65
LLS (σ0=2000;m=11; τy=90MPa)
LLS (σ0=5000;m=7; τy=50MPa)
LLS (σ0=8000;m=3; τy=10MPa)
GLS (σ0=2000;m=11; τy=90MPa)
GLS (σ0=5000;m=7; τy=50MPa)
GLS (σ0=8000;m=3; τy=10MPa)
Fig. 2-67 Relation between tensile strength (normalized for Vf 100 %) predicted by LLS and GLS models, and Vf with three parameter sets Summarizing the knowledge obtained from this parametric study, higher σ0, higher τy, lower m, smaller rf, higher G, higher Vf lead to higher tensile strength (normalized for Vf 100 %), but G and Vf contributions are not significant. The contributions of σ0, τy, m, rf to the composite tensile strength σ*
L are characterized with GLS model as shown in Eq. 2-37.
11
11
10
* ,,, +-
++µ mf
my
mm
fL rV tss . (2-37)
The tensile strength is almost proportional to σ0 as illustrated in Fig. 2-64. τy strongly influences the tensile strength especially at small m as illustrated in Fig. 2-62. Higher τy leads to brittle failure, which is related to stress concentration from fibre breakage cluster, but still higher τy results in higher tensile strength at least in the range of typical parameters for CFRP. 2.6.5 Comparison between experiment and prediction Predicted tensile strength from GLS and LLS models were compared with experimental results. The Weibull parameters for T700S are collected from literature [62, 139-141] and summarized in Table 2-14. This indicates how difficult it is to take reliable Weibull parameters. Noda’s reference [141] which exhibits medium values among them, is adopted for this study, namely σ0 is 4098 MPa and m is 6.56 at the span length L0 of 25 mm.
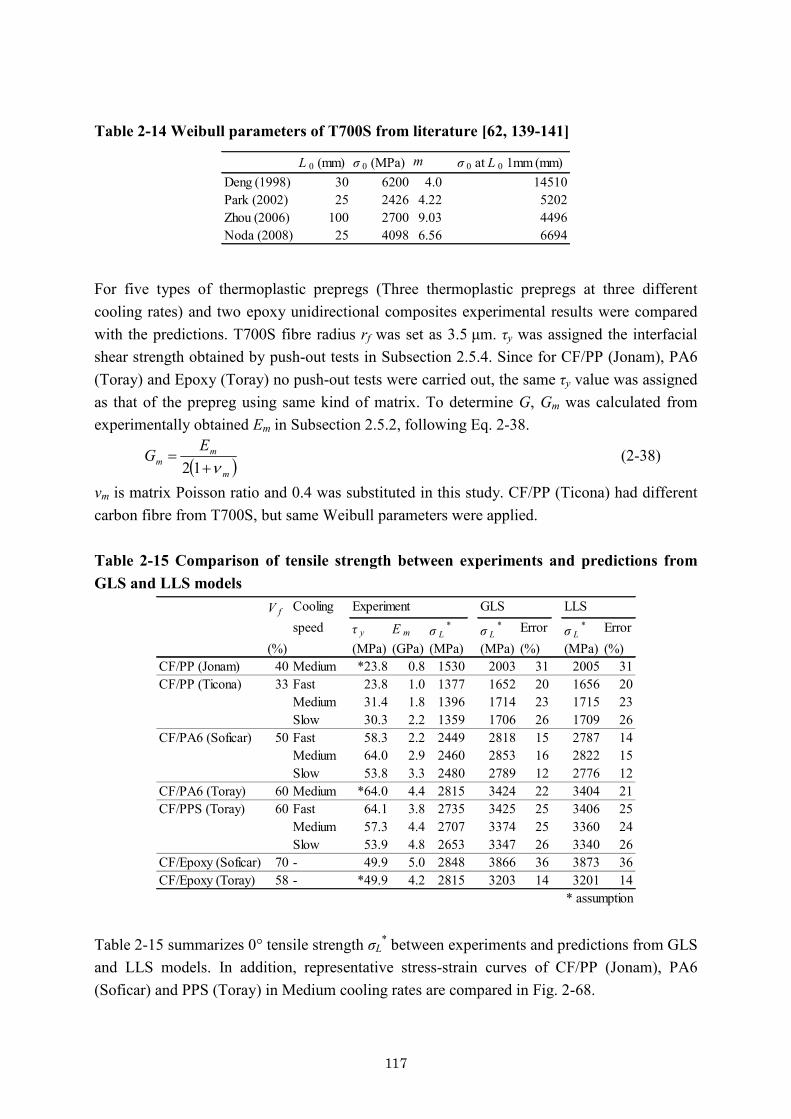
117
Table 2-14 Weibull parameters of T700S from literature [62, 139-141]
L 0 (mm) σ 0 (MPa) m σ 0 at L 0 1mm (mm)Deng (1998) 30 6200 4.0 14510Park (2002) 25 2426 4.22 5202Zhou (2006) 100 2700 9.03 4496Noda (2008) 25 4098 6.56 6694
For five types of thermoplastic prepregs (Three thermoplastic prepregs at three different cooling rates) and two epoxy unidirectional composites experimental results were compared with the predictions. T700S fibre radius rf was set as 3.5 μm. τy was assigned the interfacial shear strength obtained by push-out tests in Subsection 2.5.4. Since for CF/PP (Jonam), PA6 (Toray) and Epoxy (Toray) no push-out tests were carried out, the same τy value was assigned as that of the prepreg using same kind of matrix. To determine G, Gm was calculated from experimentally obtained Em in Subsection 2.5.2, following Eq. 2-38.
( )m
mm
EGn+
=12
(2-38)
νm is matrix Poisson ratio and 0.4 was substituted in this study. CF/PP (Ticona) had different carbon fibre from T700S, but same Weibull parameters were applied. Table 2-15 Comparison of tensile strength between experiments and predictions from GLS and LLS models
V f Coolingspeed τ y E m σ L
* σ L* Error σ L
* Error(%) (MPa) (GPa) (MPa) (MPa) (%) (MPa) (%)
CF/PP (Jonam) 40 Medium *23.8 0.8 1530 2003 31 2005 31CF/PP (Ticona) 33 Fast 23.8 1.0 1377 1652 20 1656 20
Medium 31.4 1.8 1396 1714 23 1715 23Slow 30.3 2.2 1359 1706 26 1709 26
CF/PA6 (Soficar) 50 Fast 58.3 2.2 2449 2818 15 2787 14Medium 64.0 2.9 2460 2853 16 2822 15Slow 53.8 3.3 2480 2789 12 2776 12
CF/PA6 (Toray) 60 Medium *64.0 4.4 2815 3424 22 3404 21CF/PPS (Toray) 60 Fast 64.1 3.8 2735 3425 25 3406 25
Medium 57.3 4.4 2707 3374 25 3360 24Slow 53.9 4.8 2653 3347 26 3340 26
CF/Epoxy (Soficar) 70 - 49.9 5.0 2848 3866 36 3873 36CF/Epoxy (Toray) 58 - *49.9 4.2 2815 3203 14 3201 14
* assumption
GLS LLSExperiment
Table 2-15 summarizes 0° tensile strength σL
* between experiments and predictions from GLS and LLS models. In addition, representative stress-strain curves of CF/PP (Jonam), PA6 (Soficar) and PPS (Toray) in Medium cooling rates are compared in Fig. 2-68.
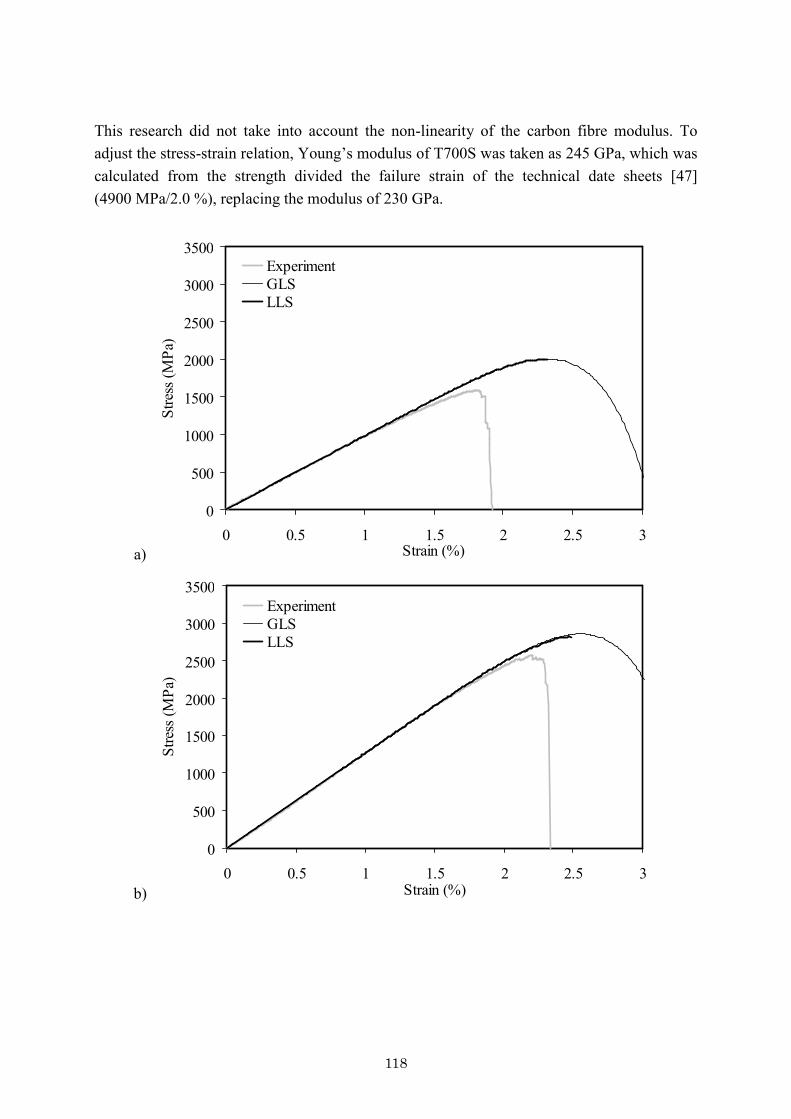
118
This research did not take into account the non-linearity of the carbon fibre modulus. To adjust the stress-strain relation, Young’s modulus of T700S was taken as 245 GPa, which was calculated from the strength divided the failure strain of the technical date sheets [47] (4900 MPa/2.0 %), replacing the modulus of 230 GPa.
a)
0
500
1000
1500
2000
2500
3000
3500
0 0.5 1 1.5 2 2.5 3Strain (%)
Stre
ss (M
Pa)
ExperimentGLSLLS
b)
0
500
1000
1500
2000
2500
3000
3500
0 0.5 1 1.5 2 2.5 3Strain (%)
Stre
ss (M
Pa)
ExperimentGLSLLS

119
c)
0
500
1000
1500
2000
2500
3000
3500
0 0.5 1 1.5 2 2.5 3Strain (%)
Stre
ss (M
Pa)
ExperimentGLSLLS
Fig. 2-68 Comparison of tensile stress-strain curves between experiments and predictions from GLS and LLS models: (a) CF/PP (Jonam), (b) CF/PA6 (Soficar) and (c) CF/PPS (Toray) in Medium cooling rate Table 2-15 and Fig. 2-68 indicate that the GLS and LLS models provide similar results under this combination of Weibull modulus m and matrix shear yield stress τy. In addition, they reveal big gaps between experiments and predictions up to 36 %. The lower slopes at final phases in the experiments are due to overestimated strain caused by tab slippage. Therefore, this is probably not a fundamental difference. Since the strength gap is different for different prepreg types, possible causes of this gap are discussed for each material in the next section. 2.7 Mechanisms explaining the gap between experiment and prediction As shown in the previous section, the predictions from GLS and LLS models indicate much higher strength than the experiments. In this section, three possible causes for the lower experimental strength are proposed. The first hypothesis is a revision of the Weibull parameters. The Weibull parameters directly influence the tensile strength and are dependent on the fibre length. Scaling effects on the Weibull parameters are precisely investigated, using literature data. The second hypothesis is the decrease of the matrix shear yield stress τy during tensile loading. Energy criterion suggests that the effective yield stress increases as each stress tensor component. Therefore, the matrix shear yield stress τy may decrease as the matrix axial stress increases under tensile loading. Lower τy results in a lower tensile strength. The last hypothesis is the dispersed failure. In 0° tensile tests of some of prepreg systems, composite
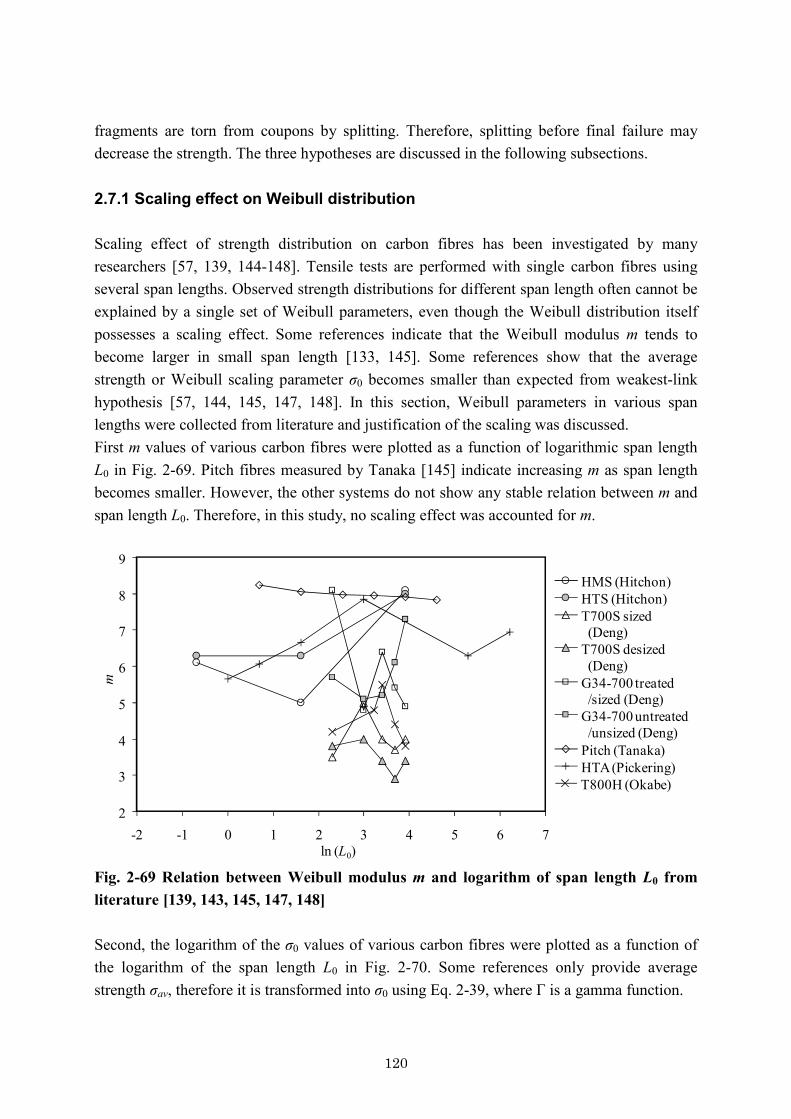
120
fragments are torn from coupons by splitting. Therefore, splitting before final failure may decrease the strength. The three hypotheses are discussed in the following subsections. 2.7.1 Scaling effect on Weibull distribution Scaling effect of strength distribution on carbon fibres has been investigated by many researchers [57, 139, 144-148]. Tensile tests are performed with single carbon fibres using several span lengths. Observed strength distributions for different span length often cannot be explained by a single set of Weibull parameters, even though the Weibull distribution itself possesses a scaling effect. Some references indicate that the Weibull modulus m tends to become larger in small span length [133, 145]. Some references show that the average strength or Weibull scaling parameter σ0 becomes smaller than expected from weakest-link hypothesis [57, 144, 145, 147, 148]. In this section, Weibull parameters in various span lengths were collected from literature and justification of the scaling was discussed. First m values of various carbon fibres were plotted as a function of logarithmic span length L0 in Fig. 2-69. Pitch fibres measured by Tanaka [145] indicate increasing m as span length becomes smaller. However, the other systems do not show any stable relation between m and span length L0. Therefore, in this study, no scaling effect was accounted for m.
m
HMS (Hitchon)HTS (Hitchon)T700S sized(Deng)
T700S desized(Deng)
G34-700 treated/sized (Deng)
G34-700 untreated/unsized (Deng)
Pitch (Tanaka)HTA (Pickering)
ln (L0)
2
3
4
5
6
7
8
9
-2 -1 0 1 2 3 4 5 6 7
T800H (Okabe)
Fig. 2-69 Relation between Weibull modulus m and logarithm of span length L0 from literature [139, 143, 145, 147, 148] Second, the logarithm of the σ0 values of various carbon fibres were plotted as a function of the logarithm of the span length L0 in Fig. 2-70. Some references only provide average strength σav, therefore it is transformed into σ0 using Eq. 2-39, where Γ is a gamma function.
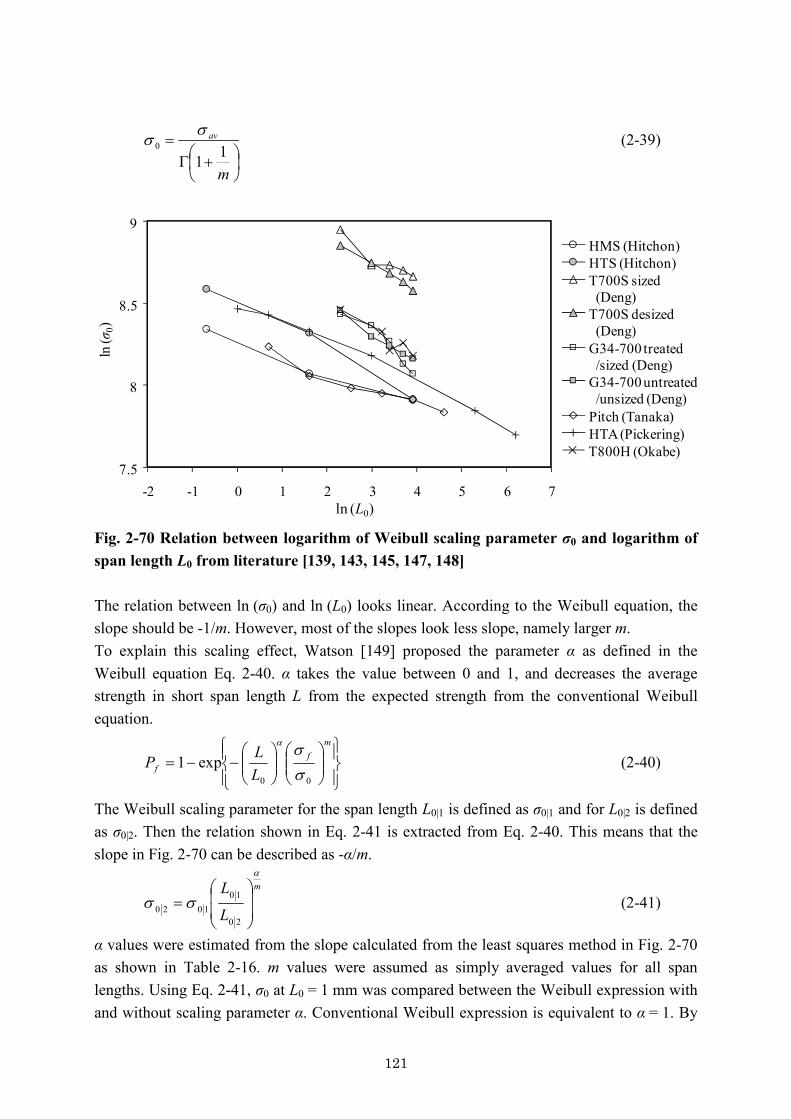
121
÷øö
çèæ +G
=
m
av
110
ss (2-39)
ln (L0)
ln(σ
0)
7.5
8
8.5
9
-2 -1 0 1 2 3 4 5 6 7
HMS (Hitchon)HTS (Hitchon)T700S sized(Deng)
T700S desized(Deng)
G34-700 treated/sized (Deng)
G34-700 untreated/unsized (Deng)
Pitch (Tanaka)HTA (Pickering)T800H (Okabe)
Fig. 2-70 Relation between logarithm of Weibull scaling parameter σ0 and logarithm of span length L0 from literature [139, 143, 145, 147, 148] The relation between ln (σ0) and ln (L0) looks linear. According to the Weibull equation, the slope should be -1/m. However, most of the slopes look less slope, namely larger m. To explain this scaling effect, Watson [149] proposed the parameter α as defined in the Weibull equation Eq. 2-40. α takes the value between 0 and 1, and decreases the average strength in short span length L from the expected strength from the conventional Weibull equation.
ïþ
ïýü
ïî
ïíì
÷÷ø
öççè
æ÷÷ø
öççè
æ--=
mf
f LLP
00
exp1ssa
(2-40)
The Weibull scaling parameter for the span length L0|1 is defined as σ0|1 and for L0|2 is defined as σ0|2. Then the relation shown in Eq. 2-41 is extracted from Eq. 2-40. This means that the slope in Fig. 2-70 can be described as -α/m.
m
L
La
ss÷÷
ø
ö
çç
è
æ=
20
101020 (2-41)
α values were estimated from the slope calculated from the least squares method in Fig. 2-70 as shown in Table 2-16. m values were assumed as simply averaged values for all span lengths. Using Eq. 2-41, σ0 at L0 = 1 mm was compared between the Weibull expression with and without scaling parameter α. Conventional Weibull expression is equivalent to α = 1. By

122
introducing α, σ0 values significantly reduce for most of carbon fibre systems. Thus α reduce the predicted strength and may result in a better fit with the experiments. Table 2-16 Scaling parameter α calculated from the relation between logarithmic Weibull scaling parameter σ0 and logarithmic span length L0 from literature [139, 143, 145, 147, 148]
m (averaged) σ 0 (averaged at L 0 1mm) m/α α σ 0 at L 0 1mm σ 0 reduction(MPa) (MPa) (%)
HMS (Hitchon) 6.40 4195 10.64 0.60 3865 8HTS (Hitchon) 6.87 4845 6.85 1.00 4948 -2T700S sized (Deng)
4.04 14470 6.10 0.66 10835 25
T700S desized (Deng)
3.50 15785 5.91 0.59 10401 34
G34-700 treated /sized (Deng)
5.92 6923 4.35 1.36 8138 -18
G34-700 untreated /unsized (Deng)
5.88 6824 5.50 1.07 7054 -3
Pitch (Tanaka) 6.11 5299 10.85 0.56 3829 28HTA (Pickering) 6.58 5284 7.96 0.83 4964 6T800H (Okabe) 4.54 8414 5.90 0.77 6967 17
In the next step, the σ0 values of various carbon fibres were plotted as a function of logarithmic span length L0 in Fig. 2-71. Even though σ0 is not in the logarithmic scale, the relation between σ0 and ln (L0) also looks linear.
ln (L0)
2000
3000
4000
5000
6000
7000
8000
-2 -1 0 1 2 3 4 5 6 7
σ 0
HMS (Hitchon)HTS (Hitchon)T700S sized(Deng)
T700S desized(Deng)
G34-700 treated/sized (Deng)
G34-700 untreated/unsized (Deng)
Pitch (Tanaka)HTA (Pickering)T800H (Okabe)
Fig. 2-71 Relation between Weibull scaling parameter σ0 and logarithm of the span length L0 from literature [139, 143, 145, 147, 148]

123
For focusing on linear relation between σ0 and ln (L0), new parameter β is set up as in Eq. 2-42.
( )10201020 lnln LL --= bss (2-42)
This relation is introduced into Weibull equation as described in Eq. 2-43.
( ) úúû
ù
êêë
é
þýü
îíì
----=
mf
f LLP
00 lnlnexp1
bss
(2-43)
β values were estimated from the slope calculated from the least squares method in Fig. 2-71 as shown in Table 2-17. Using Eq. 2-42, σ0 at L0 = 1 mm was compared between Weibull expression with and without scaling parameter β. By introducing β, σ0 values significantly reduce for most of carbon fibre systems. Thus, β further reduces the predicted strength and may fit it even better to the experiments. Table 2-17 Scaling parameter β calculated from the relation between Weibull scaling parameter σ0 and logarithmic span length L0 from literature [139, 143, 145, 147, 148]
σ 0 (averaged at L 0 1mm) β σ 0 at L 0 1mm σ0 reduction(MPa) (MPa) (Mpa) (%)
HMS (Hitchon) 4195 321 3892 7HTS (Hitchon) 4845 569 4975 -3T700S sized (Deng)
14470 1104 9978 31
T700S desized (Deng)
15785 1039 9408 40
G34-700 treated /sized (Deng)
6923 896 6800 2
G34-700 untreated /unsized (Deng)
6824 740 6334 7
Pitch (Tanaka) 5299 285 3780 29HTA (Pickering) 5284 420 4809 9T800H (Okabe) 8414 705 6331 25
σ0 data of HTA measured by Pickering [147] are summarized in relation between ln (σ0) and ln (L0) or that between σ0 and ln (L0) in Fig. 2-72. Pickering indicated that ln (σ0) against ln (L0) does not follow a linear relation, hence the tendency cannot be fitted with α. In this HTA data, the relation between σ0 and ln (L0) reasonably follows the linear fitting line.
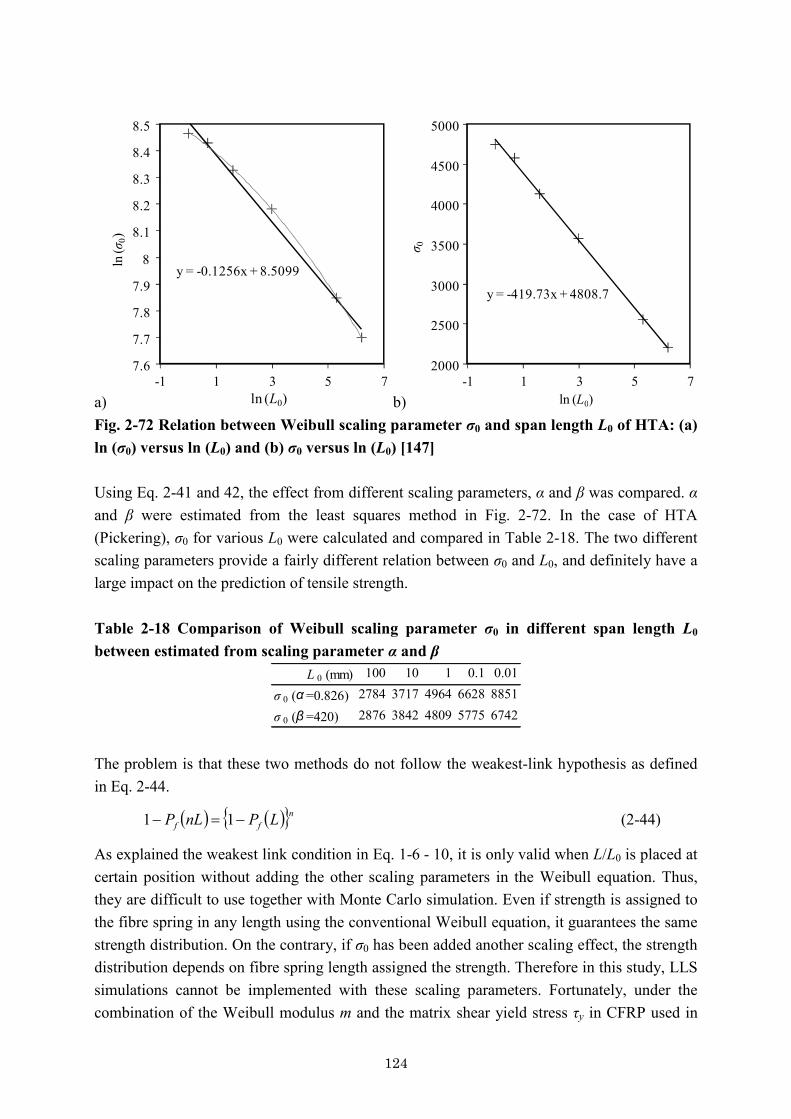
124
a)
y = -0.1256x + 8.5099
7.6
7.7
7.8
7.9
8
8.1
8.2
8.3
8.4
8.5
-1 1 3 5 7ln (L0)
ln(σ
0)
b)
y = -419.73x + 4808.7
2000
2500
3000
3500
4000
4500
5000
-1 1 3 5 7ln (L0)
σ 0
Fig. 2-72 Relation between Weibull scaling parameter σ0 and span length L0 of HTA: (a) ln (σ0) versus ln (L0) and (b) σ0 versus ln (L0) [147] Using Eq. 2-41 and 42, the effect from different scaling parameters, α and β was compared. α and β were estimated from the least squares method in Fig. 2-72. In the case of HTA (Pickering), σ0 for various L0 were calculated and compared in Table 2-18. The two different scaling parameters provide a fairly different relation between σ0 and L0, and definitely have a large impact on the prediction of tensile strength. Table 2-18 Comparison of Weibull scaling parameter σ0 in different span length L0 between estimated from scaling parameter α and β
L 0 (mm) 100 10 1 0.1 0.01
σ 0 (α =0.826) 2784 3717 4964 6628 8851
σ 0 (β =420) 2876 3842 4809 5775 6742 The problem is that these two methods do not follow the weakest-link hypothesis as defined in Eq. 2-44.
( ) ( ){ }nff LPnLP -=- 11 (2-44)
As explained the weakest link condition in Eq. 1-6 - 10, it is only valid when L/L0 is placed at certain position without adding the other scaling parameters in the Weibull equation. Thus, they are difficult to use together with Monte Carlo simulation. Even if strength is assigned to the fibre spring in any length using the conventional Weibull equation, it guarantees the same strength distribution. On the contrary, if σ0 has been added another scaling effect, the strength distribution depends on fibre spring length assigned the strength. Therefore in this study, LLS simulations cannot be implemented with these scaling parameters. Fortunately, under the combination of the Weibull modulus m and the matrix shear yield stress τy in CFRP used in

125
this study, GLS and LLS models predict almost the same strength as proved in Subsection 2.6.5. Therefore, impact of these scaling parameters can be evaluated only from GLS model. In the case of using scaling parameter α, the constitutive equation of composite stress σL in GLS model is deduced as in Eq. 2-45 (refer to deduction procedure in Subsection 2.6.2), where σ1 can be described as in Eq. 2-46.
ïþ
ïýü
ïî
ïíì
÷÷ø
öççè
æ-=
+a
ss
ssm
fffL V
11251 (2-45)
aa
a tss
+
÷÷÷
ø
ö
ççç
è
æ
=
m
f
y
m
rL00
1 (2-46)
Tensile strength σL* can be written in analytical equation of Eq. 2-47.
( ) ÷øö
çèæ
+++
þýü
îíì
++=
+
11512
1
1*
aa
ass
a
mm
mV
m
fL (2-47)
In the case of using scaling parameter β, the constitutive equation of composite stress σL in GLS model is deduced as in Eq. 2-48.
( ) úú
û
ù
êê
ë
é
ïþ
ïýü
ïî
ïíì
---=
m
yff
fffL Lr
V00 lnln12
51tsbs
sss (2-48)
The tensile strength σL* cannot be derived in an explicit expression.
For five types of thermoplastic prepregs (Three thermoplastic prepregs at three different cooling rates) and two epoxy unidirectional composites, experimental values were compared with the predictions from the GLS model. The used parameters were the same as in Subsection 2.6.5, except α and β. α and β for T700S values were unknown. Deng [139] provided Weibull parameters for various span lengths but σ0 was too high compared to the Noda data [141] assigned in this study. Therefore, for the purpose to compare the impact of α and β, α value for HTA (Pickering), namely 0.826 was used. β value was assigned to agree the predicted strength CF/PA6 (Soficar) at Medium cooling rate between using α and β; β was set as 687 MPa. Table 2-19 summarizes 0° tensile strength σL
* for experiments and predictions from GLS model using conventional Weibull equation, Weibull equation with scaling parameter α and β. In all systems, tensile strength predicted using α or β provides to be much smaller than that without scaling. Since these studies focus on the fibre strength distribution, not the matrix properties, the reduction of the strength gap between experiments and predictions from the conventional Weibull equation should be similar for all prepreg systems containing the same carbon fibres. Fig. 2-73 compares the stress-strain curves of CF/PA6 (Soficar) among experiment, predictions from GLS model using α and β.
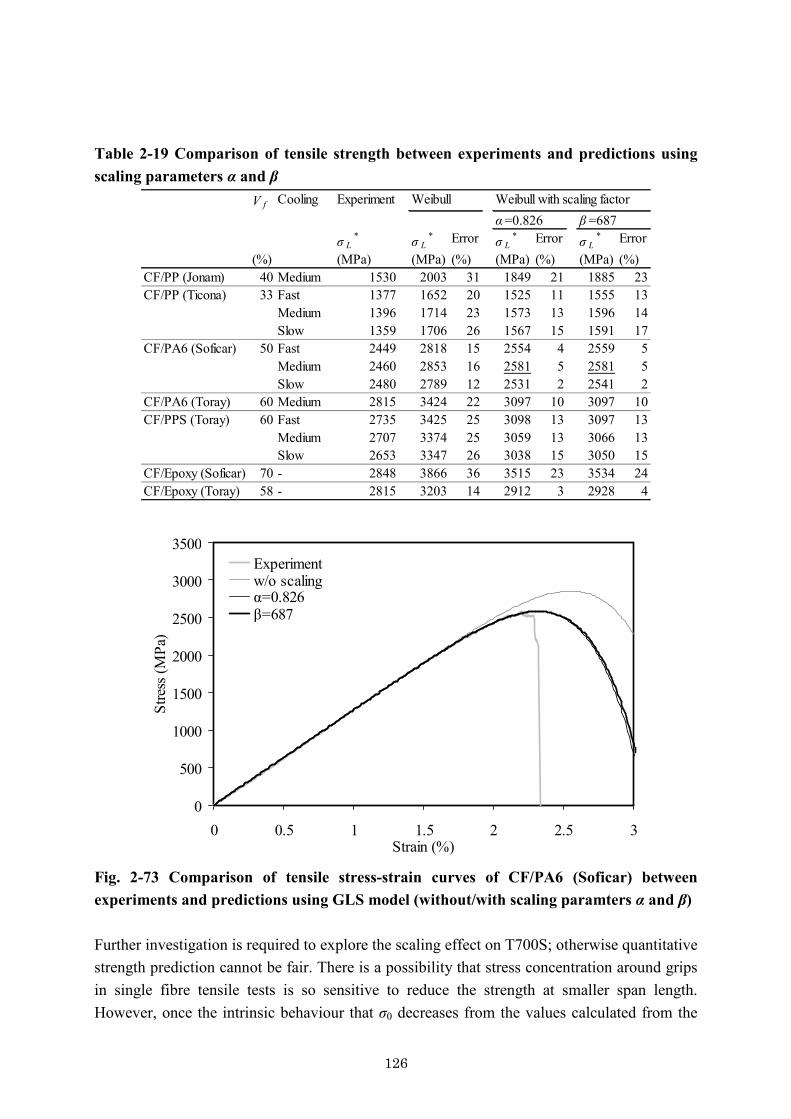
126
Table 2-19 Comparison of tensile strength between experiments and predictions using scaling parameters α and β
V f Cooling Experiment Weibull
σ L* σ L
* Error σ L* Error σ L
* Error(%) (MPa) (MPa) (%) (MPa) (%) (MPa) (%)
CF/PP (Jonam) 40 Medium 1530 2003 31 1849 21 1885 23CF/PP (Ticona) 33 Fast 1377 1652 20 1525 11 1555 13
Medium 1396 1714 23 1573 13 1596 14Slow 1359 1706 26 1567 15 1591 17
CF/PA6 (Soficar) 50 Fast 2449 2818 15 2554 4 2559 5Medium 2460 2853 16 2581 5 2581 5Slow 2480 2789 12 2531 2 2541 2
CF/PA6 (Toray) 60 Medium 2815 3424 22 3097 10 3097 10CF/PPS (Toray) 60 Fast 2735 3425 25 3098 13 3097 13
Medium 2707 3374 25 3059 13 3066 13Slow 2653 3347 26 3038 15 3050 15
CF/Epoxy (Soficar) 70 - 2848 3866 36 3515 23 3534 24CF/Epoxy (Toray) 58 - 2815 3203 14 2912 3 2928 4
α =0.826Weibull with scaling factor
β =687
0
500
1000
1500
2000
2500
3000
3500
0 0.5 1 1.5 2 2.5 3Strain (%)
Stre
ss (M
Pa)
Experimentw/o scalingα=0.826β=687
Fig. 2-73 Comparison of tensile stress-strain curves of CF/PA6 (Soficar) between experiments and predictions using GLS model (without/with scaling paramters α and β) Further investigation is required to explore the scaling effect on T700S; otherwise quantitative strength prediction cannot be fair. There is a possibility that stress concentration around grips in single fibre tensile tests is so sensitive to reduce the strength at smaller span length. However, once the intrinsic behaviour that σ0 decreases from the values calculated from the

127
conventional Weibull equation at small span is confirmed, these approaches would be helpful to explain the gap between experiments and predictions of composite strength. 2.7.2 Decrease of matrix shear yield stress As shown in the parametric study in Subsection 2.6.4, the matrix shear yield stress τy strongly affects the tensile strength. Lower τy results in a low composite strength. τy is conventionally assigned as constant value, however τy may change during tensile loading because a multi-axial load is subjected to interface region. According to the Von-Mises criterion, the strength in each direction decreases depending on applied stress. Effective yield stress σy can be described as in Eq. 2-49.
( ) ( ) ( ) ( )212
231
223
21133
23322
22211
22 3
223 ttt
sssssss +++
-+-+-== Jy (2-49)
Fig. 2-74 schematizes the periphery of a broken fibre tip. The stress state is investigated in a small box at the interfacial region of matrix. The axial stress σ11 and shear stress τ12 are the most important. The other stress components (related to the Poisson effect) are less significant in comparison with σ11 and τ12. Therefore, the expression of σy can be reduced to Eq. 2-50.
212
211 3tss +@y (2-50)
12t
11s
Broken cross-section
CF
Global axial loadInterfacial region
21
3
Fig. 2-74 Schematic of interface around broken fibre applied multi-axial load
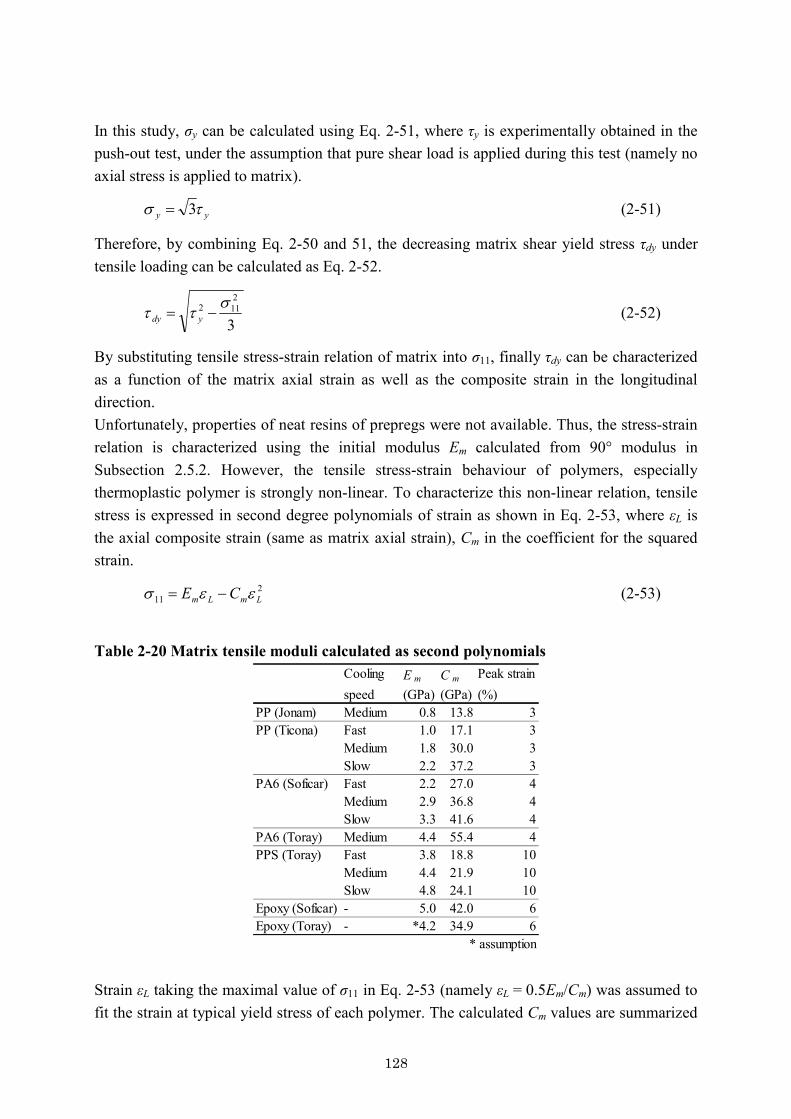
128
In this study, σy can be calculated using Eq. 2-51, where τy is experimentally obtained in the push-out test, under the assumption that pure shear load is applied during this test (namely no axial stress is applied to matrix).
yy ts 3= (2-51)
Therefore, by combining Eq. 2-50 and 51, the decreasing matrix shear yield stress τdy under tensile loading can be calculated as Eq. 2-52.
3
2112 s
tt -= ydy (2-52)
By substituting tensile stress-strain relation of matrix into σ11, finally τdy can be characterized as a function of the matrix axial strain as well as the composite strain in the longitudinal direction. Unfortunately, properties of neat resins of prepregs were not available. Thus, the stress-strain relation is characterized using the initial modulus Em calculated from 90° modulus in Subsection 2.5.2. However, the tensile stress-strain behaviour of polymers, especially thermoplastic polymer is strongly non-linear. To characterize this non-linear relation, tensile stress is expressed in second degree polynomials of strain as shown in Eq. 2-53, where εL is the axial composite strain (same as matrix axial strain), Cm in the coefficient for the squared strain.
211 LmLm CE ees -= (2-53)
Table 2-20 Matrix tensile moduli calculated as second polynomials
Cooling E m C m Peak strainspeed (GPa) (GPa) (%)
PP (Jonam) Medium 0.8 13.8 3PP (Ticona) Fast 1.0 17.1 3
Medium 1.8 30.0 3Slow 2.2 37.2 3
PA6 (Soficar) Fast 2.2 27.0 4Medium 2.9 36.8 4Slow 3.3 41.6 4
PA6 (Toray) Medium 4.4 55.4 4PPS (Toray) Fast 3.8 18.8 10
Medium 4.4 21.9 10Slow 4.8 24.1 10
Epoxy (Soficar) - 5.0 42.0 6Epoxy (Toray) - *4.2 34.9 6
* assumption Strain εL taking the maximal value of σ11 in Eq. 2-53 (namely εL = 0.5Em/Cm) was assumed to fit the strain at typical yield stress of each polymer. The calculated Cm values are summarized

129
in Table 2-20. Stress-strain curves of PP (Ticona), PA6 (Soficar), PPS (Toray) at Medium cooling rate and Epoxy (Soficar) are compared in Fig. 2-75.
0
20
40
60
80
100
120
0 0.5 1 1.5 2 2.5 3Strain (%)
Stre
ss (M
Pa)
PP (Ticona)PA6 (Soficar)PPS (Toray)Epoxy (Soficar)
Fig. 2-75 Calculated axial stress-strain curves of polymers The G value in the LLS model can also decrease during tensile loading. J2 deformation theory (Total strain theory of plasticity) [142] can deduce G as the function of matrix axial stress. However as shown in Subsection 2.6.4, G only has a small influence on the 0° tensile strength. Therefore, in this study, G was assumed to be constant. Five kinds of thermoplastic prepreg (Three thermoplastic prepreg at three different cooling rates) and two epoxy unidirectional composites were compared with predictions from GLS and LLS models in the same manner as Subsection 2.6.5, except that now the decreasing matrix shear yield stress τdy is taken into account. Table 2-21 compares 0° tensile strength σL
* between experiments and predictions, using constant τy and a decreasing τdy, for the GLS and LLS models. In the case of CF/PP and PA6 systems, predictions using constant τy and decreasing τdy indicate no significant difference. On the contrary, in the case of CF/PPS and Epoxy systems, the tensile strength predicted using the decreasing τdy provided much smaller difference between experiment and prediction than that using constant τy. Fig. 2-76 compares for CF/PPS the experimental stress-strain curves with the predictions from GLS and LLS model using τy and τdy. Decreasing matrix shear yield stress cannot explain all the gap between experiments and predictions. However in the cases of CF/PPS and Epoxy, apparently brittle matrix systems, decreasing τdy strongly influences tensile strength.
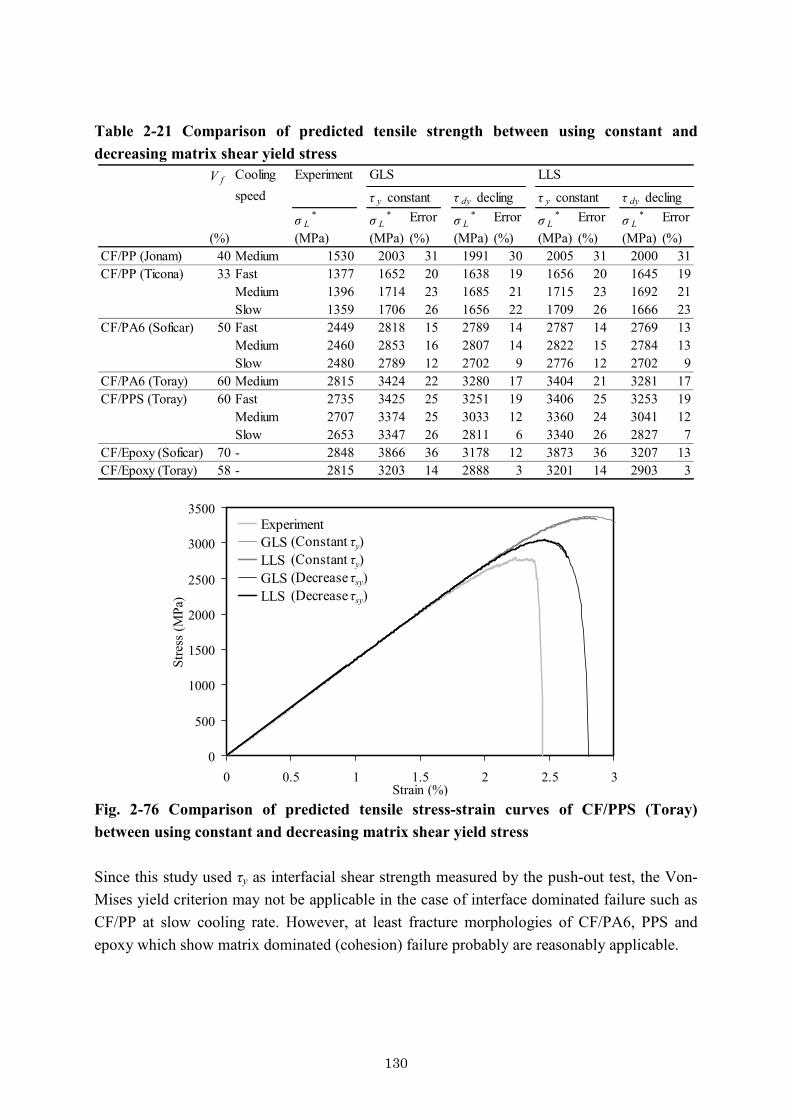
130
Table 2-21 Comparison of predicted tensile strength between using constant and decreasing matrix shear yield stress
V f Cooling Experiment GLS LLSspeed
σ L* σ L
* Error σ L* Error σ L
* Error σ L* Error
(%) (MPa) (MPa) (%) (MPa) (%) (MPa) (%) (MPa) (%)CF/PP (Jonam) 40 Medium 1530 2003 31 1991 30 2005 31 2000 31CF/PP (Ticona) 33 Fast 1377 1652 20 1638 19 1656 20 1645 19
Medium 1396 1714 23 1685 21 1715 23 1692 21Slow 1359 1706 26 1656 22 1709 26 1666 23
CF/PA6 (Soficar) 50 Fast 2449 2818 15 2789 14 2787 14 2769 13Medium 2460 2853 16 2807 14 2822 15 2784 13Slow 2480 2789 12 2702 9 2776 12 2702 9
CF/PA6 (Toray) 60 Medium 2815 3424 22 3280 17 3404 21 3281 17CF/PPS (Toray) 60 Fast 2735 3425 25 3251 19 3406 25 3253 19
Medium 2707 3374 25 3033 12 3360 24 3041 12Slow 2653 3347 26 2811 6 3340 26 2827 7
CF/Epoxy (Soficar) 70 - 2848 3866 36 3178 12 3873 36 3207 13CF/Epoxy (Toray) 58 - 2815 3203 14 2888 3 3201 14 2903 3
τ dy declingτ y constant τ y constantτ dy decling
0
500
1000
1500
2000
2500
3000
3500
0 0.5 1 1.5 2 2.5 3Strain (%)
Stre
ss (M
Pa)
ExperimentGLSLLSGLSLLS
(Constant τy)(Constant τy)(Decrease τsy)(Decrease τsy)
Fig. 2-76 Comparison of predicted tensile stress-strain curves of CF/PPS (Toray) between using constant and decreasing matrix shear yield stress Since this study used τy as interfacial shear strength measured by the push-out test, the Von-Mises yield criterion may not be applicable in the case of interface dominated failure such as CF/PP at slow cooling rate. However, at least fracture morphologies of CF/PA6, PPS and epoxy which show matrix dominated (cohesion) failure probably are reasonably applicable.

131
2.7.3 Dispersed failure As indicated in Subsection 2.4.1, unidirectional CFRTP tended to cause dispersed failure. Especially, CF/PP prepregs and CF/Epoxy pultruded unidirectional composites with brittle resin started splitting at relatively low strain and the divided fragments seemingly decreased the tensile strength. Indeed, the 0° tensile strength of CF/PP (Jonam) and CF/Epoxy (Soficar) was much lower than the predicted strength as shown in Table 2-15. (CF/PP (Ticona) has different CF, thus a fair prediction is difficult.) Fig. 2-77 compares normalized the stress-strain curves of CF/Epoxy (Toray) and CF/PP (Jonam). CF/PP exhibits a lot of splitting indicated as spikes on the curves at strain over 1 % in comparison with CF/Epoxy that breaks in a brittle manner. This strength difference may not be explained only by the difference in matrix shear yield stress. This research proposes a new model to characterize how dispersed failure decreases the tensile strength.
0
1000
2000
3000
4000
5000
0 0.5 1 1.5 2 2.5Strain (%)
Nor
mal
ized
stre
ss fo
r Vf 1
.0 (M
Pa)
CF/Epoxy (Toray)CF/PP (Jonam)
Fig. 2-77 Comparison of tensile stress-strain curves between CF/Epoxy (Toray) and CF/PP (Jonam) consolidated in Medium cooling rate Careful observation during 0° tensile tests revealed that splitting grows in an unstable way and immediately divided fragments through the whole length of the coupons. Therefore, a simulation which split area is discounted in each strain step is designed. The outline of this simulation procedure is as follows: a representative area with a certain length is set up as part of a tensile coupon. Fracture mechanics model clarifies the relation between critical geometry of a fibre breakage cluster to initiate splitting and the applied stress. On the other hand, a probabilistic study reveals the relation among the fibre breakage rate, the
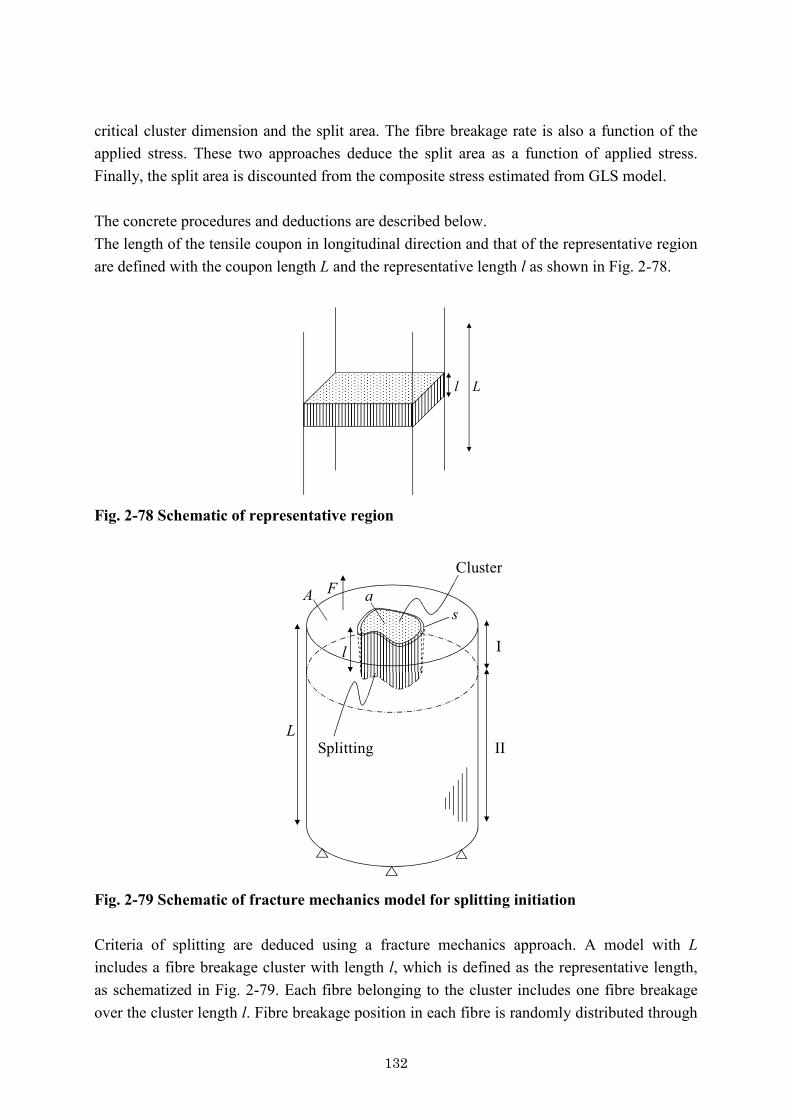
132
critical cluster dimension and the split area. The fibre breakage rate is also a function of the applied stress. These two approaches deduce the split area as a function of applied stress. Finally, the split area is discounted from the composite stress estimated from GLS model. The concrete procedures and deductions are described below. The length of the tensile coupon in longitudinal direction and that of the representative region are defined with the coupon length L and the representative length l as shown in Fig. 2-78.
Ll
Fig. 2-78 Schematic of representative region
F
l I
II
Cluster
Splitting
as
L
A
Fig. 2-79 Schematic of fracture mechanics model for splitting initiation Criteria of splitting are deduced using a fracture mechanics approach. A model with L includes a fibre breakage cluster with length l, which is defined as the representative length, as schematized in Fig. 2-79. Each fibre belonging to the cluster includes one fibre breakage over the cluster length l. Fibre breakage position in each fibre is randomly distributed through
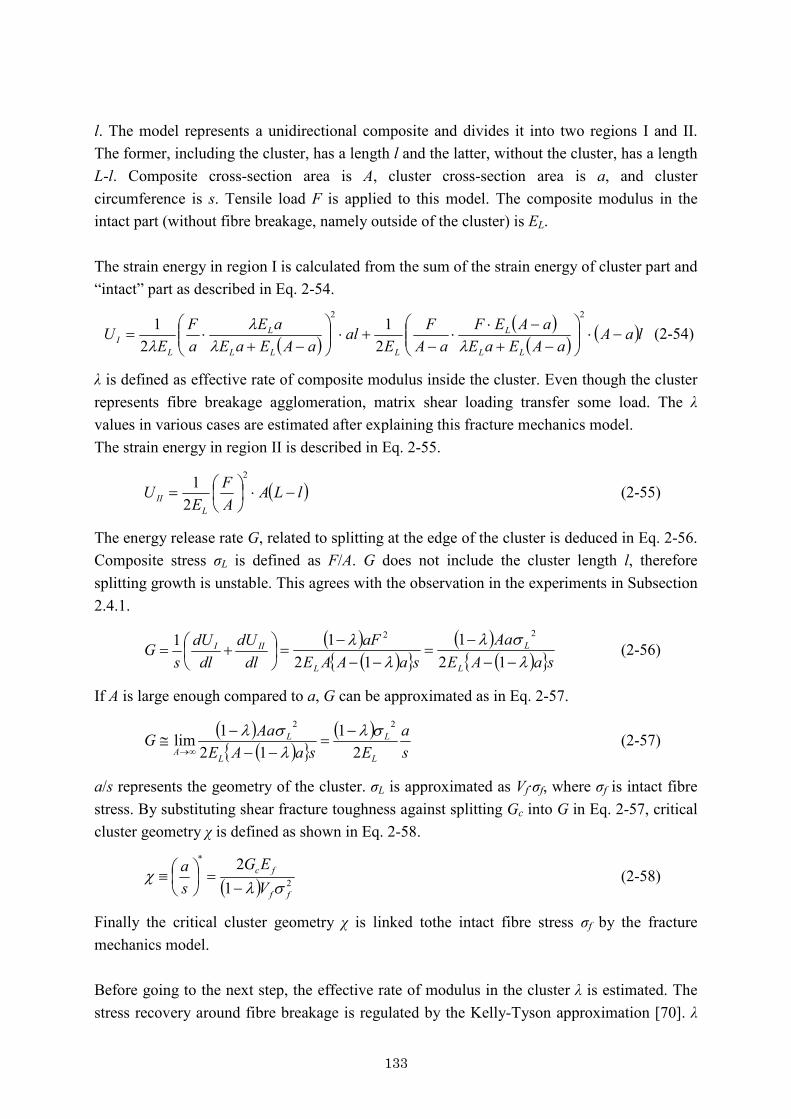
133
l. The model represents a unidirectional composite and divides it into two regions I and II. The former, including the cluster, has a length l and the latter, without the cluster, has a length L-l. Composite cross-section area is A, cluster cross-section area is a, and cluster circumference is s. Tensile load F is applied to this model. The composite modulus in the intact part (without fibre breakage, namely outside of the cluster) is EL. The strain energy in region I is calculated from the sum of the strain energy of cluster part and “intact” part as described in Eq. 2-54.
( )( )( ) ( )laA
aAEaEaAEF
aAF
Eal
aAEaEaE
aF
EU
LL
L
LLL
L
LI -×÷÷
ø
öççè
æ-+
-××
-+×÷÷
ø
öççè
æ-+
×=22
21
21
lll
l (2-54)
λ is defined as effective rate of composite modulus inside the cluster. Even though the cluster represents fibre breakage agglomeration, matrix shear loading transfer some load. The λ values in various cases are estimated after explaining this fracture mechanics model. The strain energy in region II is described in Eq. 2-55.
( )lLAAF
EU
LII -×÷
øö
çèæ=
2
21 (2-55)
The energy release rate G, related to splitting at the edge of the cluster is deduced in Eq. 2-56. Composite stress σL is defined as F/A. G does not include the cluster length l, therefore splitting growth is unstable. This agrees with the observation in the experiments in Subsection 2.4.1.
÷øö
çèæ +=
dldU
dldU
sG III1 ( )
( ){ }( )
( ){ }saAEAa
saAAEaF
L
L
L lsl
ll
---
=--
-=
121
121 22
(2-56)
If A is large enough compared to a, G can be approximated as in Eq. 2-57.
( )( ){ }
( )sa
EsaAEAaG
L
L
L
LA 2
112
1lim22 sl
lsl -
=--
-@
¥® (2-57)
a/s represents the geometry of the cluster. σL is approximated as Vf·σf, where σf is intact fibre stress. By substituting shear fracture toughness against splitting Gc into G in Eq. 2-57, critical cluster geometry χ is defined as shown in Eq. 2-58.
( ) 2
*
12
ff
fc
VEG
sa
slc
-=÷
øö
çèæº (2-58)
Finally the critical cluster geometry χ is linked tothe intact fibre stress σf by the fracture mechanics model. Before going to the next step, the effective rate of modulus in the cluster λ is estimated. The stress recovery around fibre breakage is regulated by the Kelly-Tyson approximation [70]. λ
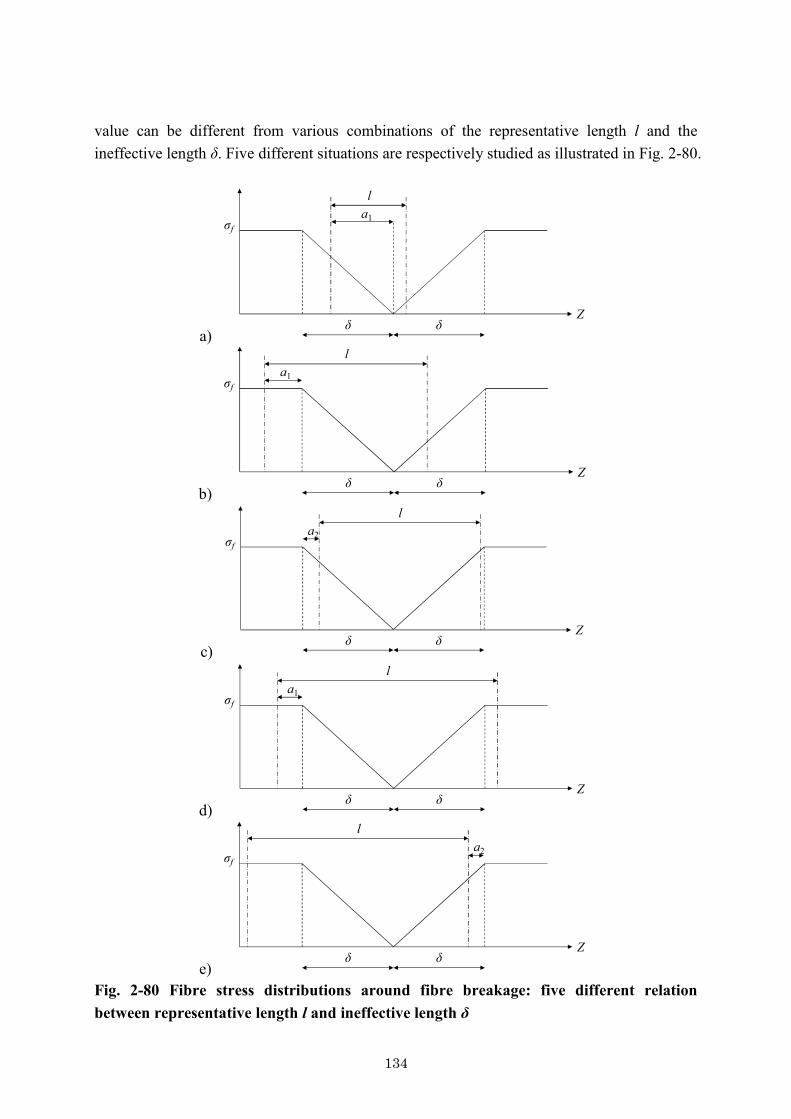
134
value can be different from various combinations of the representative length l and the ineffective length δ. Five different situations are respectively studied as illustrated in Fig. 2-80.
a) Z
δ δ
la1σf
b) Z
δ δ
la1σf
c) Z
δ δ
la2σf
d) Z
δ δ
la1σf
e) Z
δ δ
la2σf
Fig. 2-80 Fibre stress distributions around fibre breakage: five different relation between representative length l and ineffective length δ
135
The average recovery stress σr in the cluster length l is deduced under the iso-strain condition. If the cluster includes enough fibres and every fibre is broken at an arbitrary position, the iso-strain condition can be justified. If l ≤ δ, the representative region l is always included in the ineffective area in 2δ. The parameter a1 is introduced as indicated in Fig. 2-80a. The average stress in l is formulated with a1 and this is averaged again in the range of a1 = 0 to l. Finally, σr is derived with intact fibre stress σf in Eq. 2-59.
( ) ( )f
l ff
rl
ll
daaa
aa
sd
ddds
ds
s3
220 111
11
=×
÷÷ø
öççè
æ-
-+
=ò
(2-59)
If δ < l ≤ 2δ, two situations should be considered. In the first one, the representative region laps out from the ineffective area as shown in Fig. 2-80b, in the second one the representative region is completely included in the ineffective area as shown in Fig. 2-80c. Parameter a2 is additionally introduced. σr is deduced counting both cases in Eq. 2-60.
( ) ( )
ll
daalal
al ff
f
r ×
÷÷ø
öççè
æ--
--++
=ò
-dd
dds
ds
ss
0 111
1 222
( ) ( ) ( ) ( )
ll
daalal
aal ff
×
÷÷ø
öççè
æ+-
+-+-
-
+ò
-dd
dds
dd
ds2
0 222
22
22
fllsdd÷÷ø
öççè
æ+-= 2
2
31 (2-60)
If 2δ < l, two situations should be also considered. In the first one, the ineffective area is completely included in the representative region as shown in Fig. 2-80d, in the second one, the ineffective area is partially included in the representative region as shown in Fig. 2-80e. σr is deduced counting both cases in Eq. 2-61.
( )
ll
daalal
ff
f
r ×
÷÷ø
öççè
æ--+×+
=ò
- ddsd
ss
s
2
0 111 222
( ) ( ) ( )
ll
daaa
al fff
×
÷÷ø
öççè
æ-
-+++-
+òd
dd
dsd
sds
0 222
2 2222
fllsdd÷÷ø
öççè
æ+-= 2
2
31 (2-61)

136
From Eq. 2-59 to 61, the effective rate of modulus in the representative area λ can be summarized into two ways as in Eq. 2-62 and 63.
dl
3l
= (l ≤ δ) (2-62)
2
2
31
llddl +-= (δ < l) (2-63)
In the next step, the relation between the geometry of the cluster and the fibre breakage rate is clarified by a probabilistic study. A cross-section of unidirectional composites, including enough large number of fibres is modelled as schematized in Fig. 2-81. The fibres are arrayed in a hexagonal packing. Assuming that the splitting progresses in the matrix along the middle line between the fibres, hexagonal debonding lines are placed around each fibre (dotted line in fig. 2-79).
Debonding line: s
Intact fibre
vrfu
Broken fibre
Cluster: a
Fig. 2-81 Schematic of the probabilistic study to simulate the relation between fibre breakage rate Pf and cluster dimension a/s The distance between fibre centres v is defined as Eq. 2-64.
ff V
rv32p
= (2-64)
The side of debonding line u is defined as Eq. 2-65.
3vu = (2-65)
Then, the broken fibres are randomly assigned in designated fibre breakage rate Pf. Broken fibres or an agglomeration of broken fibres are searched and set as a cluster. The cluster boundary is defined with debonding lines, while the area is inside the boundary. The
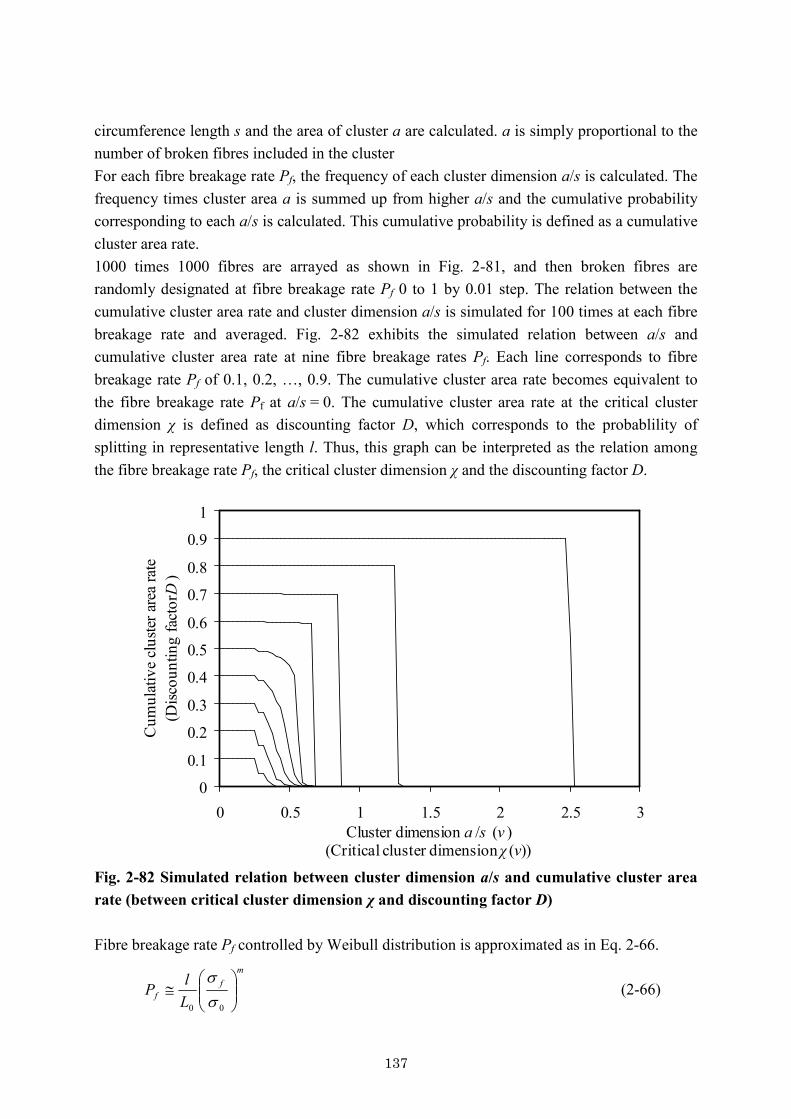
137
circumference length s and the area of cluster a are calculated. a is simply proportional to the number of broken fibres included in the cluster For each fibre breakage rate Pf, the frequency of each cluster dimension a/s is calculated. The frequency times cluster area a is summed up from higher a/s and the cumulative probability corresponding to each a/s is calculated. This cumulative probability is defined as a cumulative cluster area rate. 1000 times 1000 fibres are arrayed as shown in Fig. 2-81, and then broken fibres are randomly designated at fibre breakage rate Pf 0 to 1 by 0.01 step. The relation between the cumulative cluster area rate and cluster dimension a/s is simulated for 100 times at each fibre breakage rate and averaged. Fig. 2-82 exhibits the simulated relation between a/s and cumulative cluster area rate at nine fibre breakage rates Pf. Each line corresponds to fibre breakage rate Pf of 0.1, 0.2, …, 0.9. The cumulative cluster area rate becomes equivalent to the fibre breakage rate Pf at a/s = 0. The cumulative cluster area rate at the critical cluster dimension χ is defined as discounting factor D, which corresponds to the probablility of splitting in representative length l. Thus, this graph can be interpreted as the relation among the fibre breakage rate Pf, the critical cluster dimension χ and the discounting factor D.
0
0.1
0.2
0.3
0.4
0.5
0.6
0.7
0.8
0.9
1
0 0.5 1 1.5 2 2.5 3Cluster dimension a /s (v )
Cum
ulat
ive
clus
ter a
rea
rate-
(Disc
ount
ing
fact
or D
)
(Critical cluster dimension χ (v)) Fig. 2-82 Simulated relation between cluster dimension a/s and cumulative cluster area rate (between critical cluster dimension χ and discounting factor D) Fibre breakage rate Pf controlled by Weibull distribution is approximated as in Eq. 2-66.
mf
f LlP ÷÷
ø
öççè
æ@
00 ss
(2-66)
138
Pf is also a function of the intact fibre stress σf. The fracture mechanics model defines the critical cluster dimension χ as a function of σf. Consequently, the above probabilistic study can characterize the discounting factor D using Pf and χ, which are both functions of σf. The constitutive equation of composite stress for dispersed failure can be described using the tensile strength prediction model and the discounting factor D. The discounting factor D is multiplied by L/l to calculate the probability of splitting in a coupon; splitting initiating in arbitrary position would tear out the composite fragment through the whole coupon length. In this study, the tensile strength prediction model is GLS model and the stress predicted from the model is denoted as σGLS. Thus the constitutive equation is derived as in Eq. 2-67.
( ) GLSfL PDlL scs ÷
øö
çèæ -= ,1 (2-67)
σGLS expression is explored in Subsection 2.6.2 and written as in Eq. 2-68, where σ1 is described as Eq. 2-69.
ïþ
ïýü
ïî
ïíì
÷÷ø
öççè
æ-=
+1
11251
mf
ffGLS Vss
ss (2-68)
11
001
+
÷÷ø
öççè
æ=
m
f
ym
rL ts
s (2-69)
Intact fibre stress σf is written in elastic relation as in Eq. 2-70.
Lff E es = (2-70)
Function D in Eq. 2-67 cannot be described explicitly. In each strain increment, σf is decided from Eq. 2-70, then Pf and χ are calculated from Eq. 2-66 and Eq. 2-58, respectively. The corresponding D is extracted using calculated Pf and χ in Fig. 2-82. By substituting D and σGLS calculated from Eq. 2-68 into Eq. 2-67, finally the stress-strain curve of a composite can be described. Based on the properties of CF/PP (Jonam) consolidated at Medium cooling rate, 0° tensile strength was simulated. Parameter set-up was the same as in Subsection 2.6.5. Vf was 40 % and rf was 3.5 μm. To adjust the stress-strain relation without accounting for the non-linearity of CF, Ef was applied 245 GPa which is calculated from strength divided failure strain (4900 MPa/2.0 % [47]). Weibull parameters were set as follows: L0 = 25 mm, σ0 = 4098 MPa, m = 6.56. τy was 23.8 MPa. Representative length l could not be identified before the simulation, because the cluster size critical to splitting can be different in various constitutions. Tensile strength was simulated for various values of l and the minimum one should be the tensile strength. Fig. 2-83 summarizes the simulated tensile strength in various l. Four different values for shear fracture toughness against splitting Gc, 25, 50, 100 or 200J/m2 were applied. l was expressed in multiples of δ to make λ constant through simulation. In this

139
simulation set, if Gc = 25J/m2 and l = 1.5δ, this simulated strength almost agreed with the experimental one.
1500
1600
1700
1800
1900
2000
2100
0 1 2 3 4l (δ)
Tens
ile st
reng
th (M
Pa)
ExperimentGLSGc=200J/m2
Gc=25J/m2Gc=50J/m2Gc=100J/m2
Fig. 2-83 Simulated relation of CF/PP (Jonam) between tensile strength and representative length l Stress strain curves for various values of Gc at l = 1.5δ are illustrated in Fig. 2-84. If the composite has high Gc, splitting does not reduce tensile strength, because splitting generates after exceeding the strain at maximum stress. In addition, GLS cannot explain the final phase of tensile failure, which intensive crack from fibre breakage cluster suddenly divides the remaining fibres, even if predicted tensile strength is almost the same. In the case of Gc = 25J/m2, the difference from experimentally obtained tensile strength has vanished. However, according to the interlaminar fracture toughness in mode II measured in Subsection 2.5.5, CF/PP (Ticona) at Medium cooling rate gave 674 J/m2 of fracture toughness for propagation. Even the fracture toughness for initiation was as high as 172 J/m2. CF/PP (Jonam) is different from CF/PP (Ticona), however Gc cannot be different so much. In ENF tests, the GIIc is measured at the interlayer where resin rich zone exists, especially in thermoplastic prepregs. Moreover, solving the splitting initiation by the fracture mechanics model, multi-axial load was not taken into account. Even if accounting for these two concerns, the shear fracture toughness achieving good agreement with experimental strength (25J/m2) is too different from the measured interlaminar fracture toughness in mode II. Therefore, the splitting observed during experiments can be caused by another mechanism.
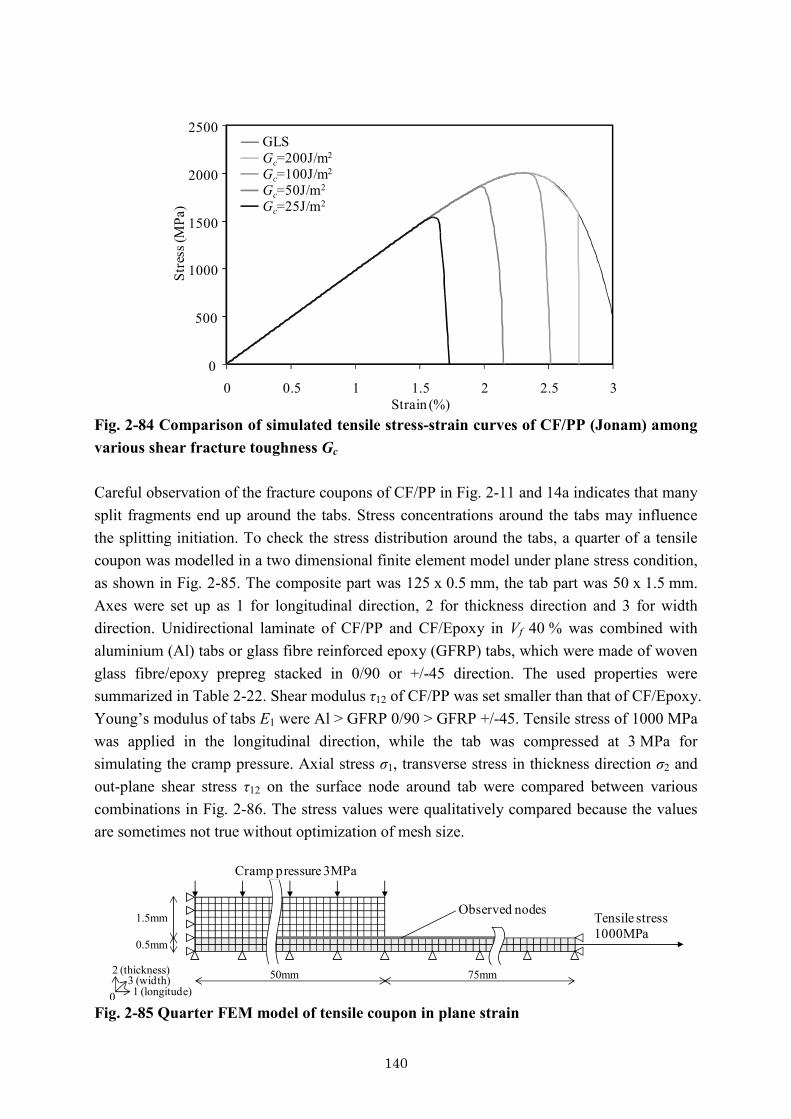
140
0
500
1000
1500
2000
2500
0 0.5 1 1.5 2 2.5 3Strain (%)
Stre
ss (M
Pa)
GLSGc=200J/m2
Gc=25J/m2Gc=50J/m2Gc=100J/m2
Fig. 2-84 Comparison of simulated tensile stress-strain curves of CF/PP (Jonam) among various shear fracture toughness Gc Careful observation of the fracture coupons of CF/PP in Fig. 2-11 and 14a indicates that many split fragments end up around the tabs. Stress concentrations around the tabs may influence the splitting initiation. To check the stress distribution around the tabs, a quarter of a tensile coupon was modelled in a two dimensional finite element model under plane stress condition, as shown in Fig. 2-85. The composite part was 125 x 0.5 mm, the tab part was 50 x 1.5 mm. Axes were set up as 1 for longitudinal direction, 2 for thickness direction and 3 for width direction. Unidirectional laminate of CF/PP and CF/Epoxy in Vf 40 % was combined with aluminium (Al) tabs or glass fibre reinforced epoxy (GFRP) tabs, which were made of woven glass fibre/epoxy prepreg stacked in 0/90 or +/-45 direction. The used properties were summarized in Table 2-22. Shear modulus τ12 of CF/PP was set smaller than that of CF/Epoxy. Young’s modulus of tabs E1 were Al > GFRP 0/90 > GFRP +/-45. Tensile stress of 1000 MPa was applied in the longitudinal direction, while the tab was compressed at 3 MPa for simulating the cramp pressure. Axial stress σ1, transverse stress in thickness direction σ2 and out-plane shear stress τ12 on the surface node around tab were compared between various combinations in Fig. 2-86. The stress values were qualitatively compared because the values are sometimes not true without optimization of mesh size.
Tensile stress1000MPa
Cramp pressure 3MPa
Observed nodes
50mm 75mm
1.5mm
0.5mm
1 (longitude)
2 (thickness)3 (width)
0 Fig. 2-85 Quarter FEM model of tensile coupon in plane strain
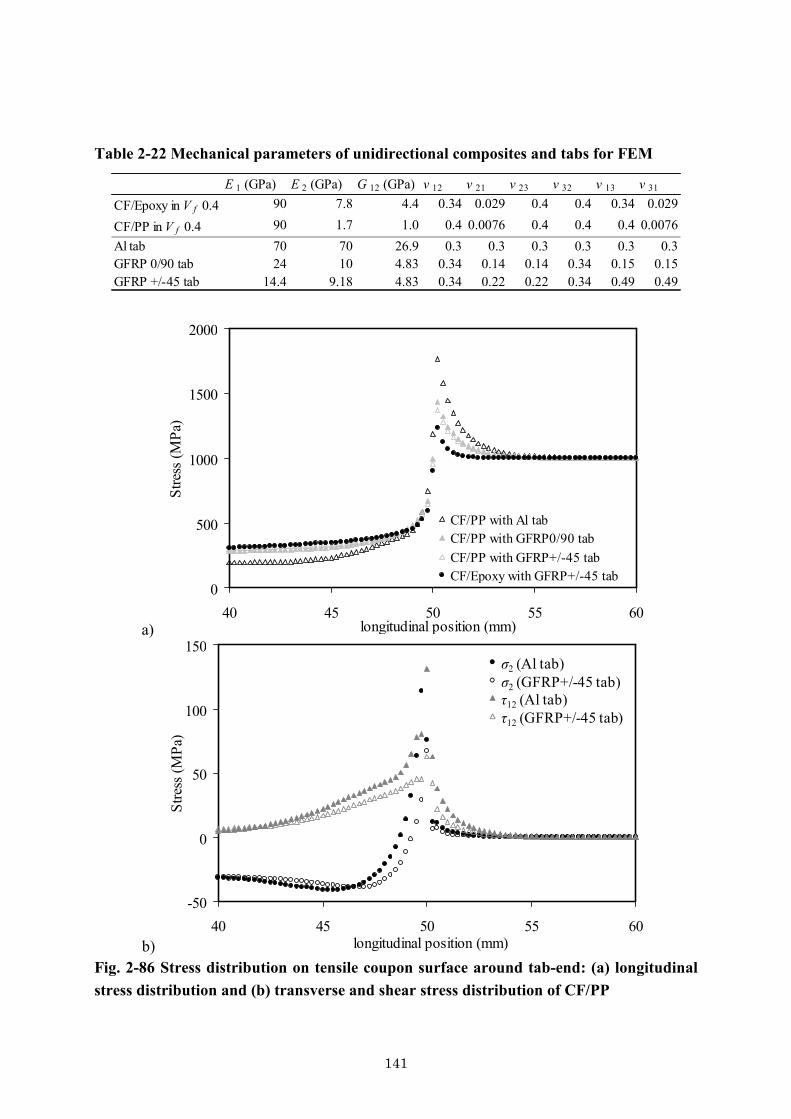
141
Table 2-22 Mechanical parameters of unidirectional composites and tabs for FEM
E 1 (GPa) E 2 (GPa) G 12 (GPa) ν 12 ν 21 ν 23 ν 32 ν 13 ν 31
CF/Epoxy in V f 0.4 90 7.8 4.4 0.34 0.029 0.4 0.4 0.34 0.029
CF/PP in V f 0.4 90 1.7 1.0 0.4 0.0076 0.4 0.4 0.4 0.0076Al tab 70 70 26.9 0.3 0.3 0.3 0.3 0.3 0.3GFRP 0/90 tab 24 10 4.83 0.34 0.14 0.14 0.34 0.15 0.15GFRP +/-45 tab 14.4 9.18 4.83 0.34 0.22 0.22 0.34 0.49 0.49
a)
0
500
1000
1500
2000
40 45 50 55 60longitudinal position (mm)
Stre
ss (M
Pa)
CF/PP with Al tabCF/PP with GFRP0/90 tabCF/PP with GFRP+/-45 tabCF/Epoxy with GFRP+/-45 tab
b)
σ2 (Al tab)σ2 (GFRP+/-45 tab)τ12 (Al tab)τ12 (GFRP+/-45 tab)
-50
0
50
100
150
40 45 50 55 60longitudinal position (mm)
Stre
ss (M
Pa)
Fig. 2-86 Stress distribution on tensile coupon surface around tab-end: (a) longitudinal stress distribution and (b) transverse and shear stress distribution of CF/PP

142
Fig. 2-86a compares σ1 between CF/PP with Al tab, with GFRP 0/90 tab, GFRP +/-45 tab and CF/Epoxy with GFRP +/-45 tab. The tab-end corresponds to 50 mm in the longitudinal position. In CF/PP composites, the level of stress concentration is in the following order: Al > GFRP 0/90 > GFRP +/-45, similar to the order of their Young’s modulus E1. Fig. 2-86b compares σ2 and τ12 between CF/PP with Al tab and GFRP +/-45 tab. In the same way, the GFRP +/-45 tab brings a lower stress concentration than the Al tab. CF/PA6 (Toray) with GFRP +/-45 tabs was fractured in brittle manner as indicated in Subsection 2.4.1. However as compared in Fig. 2-87, CF/PA6 (Toray) with Al tabs caused dispersed failure. This means that the fracture mode of unidirectional laminate is sensitive to the tab material. In addition, with GFRP +/-45 tab, CF/Epoxy exhibits lower stress concentration than the CF/PP as shown in Fig. 2-86a. The lower shear properties of the CF/PP laminate enhance the stress concentration.
a)
b) Fig. 2-87 Comparison of 0º fracture coupons of CF/PA6 (Toray) between (a) GFRP +/-45 and (b) Al tabs Even though PP exhibits almost the lowest level of interlayer fracture toughness among various polymer options, CF/PP does not cause splitting until the tensile failure according to the above simulation. Consequently, from these studies it can be concluded that splitting failure may not be an intrinsic behaviour of CFRP; splitting is probably induced by experimental imperfections; stress concentration around the tabs is probably main reason. Since 90º tensile strength of CFRTP is normally very weak, the stress concentration in transverse direction is especially critical. GFRP +/-45 tabs suppresses stress concentration in comparison with other materials. However, it could not prevent dispersed failure in CF/PP system. (Refer to Subsection 2.4.1) Therefore, the potential strength of material system with a weak matrix and/or interface, such as CF/PP, may not be obtained using the conventional test standard.
143
2-8 Conclusion To reveal the fundamental features of carbon fibre reinforced thermoplastic composites (CFRTP), unidirectional laminates of CF/PP, PA6, PPS and Epoxy were investigated. Experimentally, global mechanical properties, namely 0º and 90º tensile strength, and microscopic mechanical properties, namely work of adhesion, matrix modulus, matrix residual stress, interfacial shear stress and interlaminar fracture toughness in mode II were measured, especially focusing on influences of the matrix/interface and of the processing conditions. Analytically, existing constitutive models to connect the microscopic mechanical properties to the 0º tensile strength were implemented and partially modified. A parametric study within the range of properties of carbon fibre reinforced polymer composites revealed the roles of carbon fibre and matrix/interface properties. In addition, three possible mechanisms, which should be considered for more precise prediction of the 0º tensile strength, were proposed. Obtained results in each part of the experiments and analysis are summarized as follows. Experiments 1) Global mechanical properties 1-1) 0º tensile strength Since most of the unidirectional laminates in this study were made of the same carbon fibre T700S, the strength efficiency was compared using the composite strength normalized to Vf 100 %. CF/PA6 and tough Epoxy gave the highest strength efficiency, whereas CF/PP and CF/brittle Epoxy, which were broken with large degree of splitting, resulted in a low strength efficiency. Regarding the experimental method, tab slippage and splitting easily occurred in the CF/thermoplastic matrix systems due to the low shear yield stress of the thermoplastics. The cooling rate during consolidation strongly affects the crystallinity of semi-crystalline polymers. However, a significant difference of the 0º tensile strength could not be found at different cooling rates because anyway it is a fibre dominated property. At least, the cooling rate influenced the fracture morphology of CF/PP. At fast cooling rate, carbon fibres were covered by PP, but at slow cooling rate, the carbon fibre surface looked clean. PP matrix properties improved as the cooling rate became slower and as the degree of crystallinity enhanced. In this way, the shear failure mode was shifted from matrix cohesion failure to interfacial failure. The CF/PA6 surface was always covered with matrix and the CF/PPS surface always looked clean, independent of the cooling rates. Since both work of adhesion of CF/PA6 and PPS was high, probably PPS polymer was so brittle that the matrix was fragmented into pieces, which “fly off” at the final failure. 1-2) 90º tensile strength CF/PP system exhibited an extremely low 90º strength. Slower cooling rates resulted in higher strength in CF/PP and PA6, but no significant influence was observed for CF/PPS. The
144
fracture morphology of CF/PP showed a clean fibre surface even at fast cooling rate, while the fibre surface after 0º tensile coupons was covered by matrix. However, the stress concentration around the fibres was less intensive than that in the 0º tension. This implies that the interfacial strength in the normal direction is lower than that in shear. Low 90º tensile strength in CF/PP was caused by this weak interfacial strength: the fibre debonding occurred already at low transverse tensile stress, and a situation similar to tensile test of matrix with open holes. On the contrary, the fibre surface in CF/PA6 was covered by matrix at all cooling rates. Therefore, the 90º strength of CF/PP and PA6 are both controlled by the matrix properties, even though the strength level was very different. The matrix strength was probably increased as the cooling rate becomes slower. Fracture surface of CF/PPS were partially covered by matrix at any cooling rate, while that in 0º tensile coupons were completely clean. This implies that CF/PPS has good adhesion and 90º tension causes less intensive stress concentration than under the 0º tension. 2) Microscopic mechanical properties 2-1) Work of adhesion The study of work of adhesion between carbon fibre and thermoplastics relied on existing literature data. PAN based CF and PA6, PPS and Epoxy had a good adhesion, while PP exhibited an extremely low work of adhesion. This seems to be the reason why engineers often complain about the low compatibility between CF and PP. 2-2) Matrix modulus The matrix modulus was calculated from the 90º tensile modulus by extracting the “true” modulus of matrix inside the CF array using a geometrical model. Matrix modulus in the descending order is as follows: PPS > PA6 > PP. Slower cooling rate which means longer processing time around the crystallization temperature enabled more crystal growth, and hence a higher degree of cystallinity, resulting in the higher matrix modulus. Especially, the modulus of PP changed more than double with cooling rate. This indicates the modulus of PP is strongly dependent on crystallinity. 2-3) Matrix residual stress The matrix residual stress was calculated from the residual stress in the 90º layers, which was measured from the curvature of an unbalanced laminate [0n/90n]. The matrix residual stress in the descending order was as follows: PPS > PA6 >> PP. This was reasonable, since both the matrix modulus and temperature difference between crystallization temperature and room temperature showed the same order. A slower cooling rate led to a higher matrix residual stress of CF/PA6, because slower cooling rate resulted in a higher matrix modulus and a larger temperature difference between crystallization temperature and room temperature. On the contrary, the matrix residual stress of CF/PP and PPS were not sensitive to cooling rates. Stress relaxation during processing might not be neglected in CF/PP and PPS.
145
2-4) Interfacial shear stress The interfacial shear stress (IFSS) takes one of the most important roles in the 0º tensile strength. IFSS was measured using a push-out test set up, in which a single fibre was pushed out from a slice of unidirectional composite, cut in the perpendicular direction to the fibre. Axial load applied to the fibre by the indenter was distributed into the rest of the composite by shear load, at the interface. Since the highest shear stress was applied at the interface, the failure was also localized at the interface. CF/PA6, PPS and Epoxy exhibited a much higher IFSS than CF/PP. This was the same tendency as for the work of adhesion. In the case of CF/PP, a slower cooling rate resulted in a higher IFSS. The statistic nature of the IFSS was represented using a Weibull plot. The IFSS at fast cooling rate showed significantly low dispersion (high m). This implies a matrix dominated failure at fast cooling and an interface dominated failure at slower cooling rate, also because the SEM observation of the 0° tensile coupons indicated that the fibre surface was covered by matrix at fast cooling rate and looked clean at slower cooling rate. Since CF/PA6 had a good adhesion as indicated in the SEM observation of the 0º tensile coupons, IFSS was mainly controlled by matrix properties. As the cooling rate became slower, the IFSS increased first and then decreased again. At faster cooling rate, increase of degree of crystallinity probably enhances matrix shear yield stress. However, at slower cooling rate, the lack of ductility due to too high degree of crystallinity probably lead to low matrix shear yield stress again. In the case of CF/PPS, slower cooling rate led to lower IFSS. Due to a good adhesion between CF and PPS, the matrix shear yield stress controlled the ILSS. Probably the matrix yield stress decreased as cooling rate became slower and as degree of crystallinity became higher. 2-5) Interlaminar fracture toughness in mode II Interlaminar fracture toughness in mode II (GIIc) was measured by ENF tests. This parameter characterizes the interface from the aspect of toughness, but is not only an interface (like IFSS) but also a matrix dominated parameter. In addition, GIIc probably has a strong relation to the splitting during the 0° tensile tests. Measured GIIc in descending order was as follows: PA6 > PPS > PP. While IFSS of PA6 was on the same level as that of PPS, matrix ductility probably had a positive effect on GIIc. In the case of CF/PP, as the cooling rate became slower, GIIc increased first and then decreased again. Slower cooling rate increased the matrix shear yield stress. However, a too long processing time probably lost ductility of PP, resulting in a lower GIIc. In the case of CF/PA6, slower cooling rate led to lower GIIc, probably due to losing ductility. In the case of CF/PPS, slower cooling rate also resulted in lower GIIc, the same tendency as for the IFSS. SEM observation indicated that PPS significantly lost ductility as the cooling rate became slower.
146
Analysis 1) Constitutive models to predict 0º tensile strength This study emphasized three principles for designing constitutive models to predict the 0º tensile strength of CFRP. First, it was proposed to neglect the matrix axial stress as well as the matrix crack contribution. The stress released from broken fibres was mainly transferred by matrix shear. Second, the Kelly-Tyson approximation was used for describing the stress recovery from fibre breakage. Matrix was hypothesized as perfectly plastic, resulting in a linear stress recovery as a function of distance from the breakage point. Real situation around fibre breakage was too complicated, due to debonding, plastic hardening of matrix, etc., but could be approximated with this simple hypothesis without losing too much accuracy in predicted tensile failure. The use of only one parameter to control the stress recovery, namely the matrix shear yield stress, made the constitutive models easy to clarify each parameter’s contribution. Since microscopic situations were different from various materials or process conditions, gaps from predicted strength from constitutive models should be discussed for each system. Third, a method was proposed to model localized shear failure around a broken fibre. As can be seen in the SEM observations, even the shear failure of the matrix having s good adhesion was localized close to the interface. The shear load is transferred from a “small area” at interface of the broken fibre to a “large area” at the position of the surrounding fibres. Assuming a constant shear load, the shear stress at the smallest area, namely close to the broken fibre surface becomes always critical. Hence, this situation justified to build the model as a combination of a perfect plastic interface and an elastic matrix to connect to the surrounding fibres. Two constitutive models connecting the microscopic mechanical properties to the “global” composite properties of 0º tensile strength were investigated. First, in the global load sharing (GLS) model the load sustained by the broken fibres is immediately distributed to all other fibres. The model proposed by Curtin [71] was partially revised by recalculating average sustained stress at the broken fibre precisely. Since the tensile strength was expressed by an analytical equation, each parameter’s contribution could be explicitly evaluated. Second, in the local load sharing (LLS) model, the stress redistribution from the broken fibres to the adjacent fibres was precisely solved. To simulate the statistical nature of fibre breakage at a large scale, and to achieve accurate stress distribution in 3D model considering non-linear matrix shear behaviour at small calculation cost, Okabe’s method [84-86] using the spring element unit cell was chosen. The complex reality reduced into fibre longitudinal springs and matrix shear springs which are dominant in the 0º tensile response. In addition, stress recovery from fibre breakage point reflected matrix non-linearity was analytically assigned to avoid iterative calculation. Conventionally, the modulus of the matrix shear spring was required to be adjusted with a 3D FEM to provide an exact stress concentration, but in this study a method that enables analytical estimation of the modulus has been developed. 2) Parametric study
147
Since the fibre properties are dominant for the 0º tensile strength, the Weibull scaling parameter σ0, which is the fibre strength at a failure probability of 63 %, has the most important role. According to GLS model, the tensile strength is proportional to σ0
m/(m+1). m is the Weibull modulus representing dispersion of fibre strength. Higher m means a lower dispersion and tends to cause catastrophic failure because a slight stress concentration around broken fibres often breaks adjacent fibres which all have the same level of strength. Regarding the interface/matrix parameters, a higher matrix shear yield stress τy (if the interface is critical, the interfacial shear strength is the same meaning in the analysis) represents a higher shear load transfer efficiency to reduce ineffective length but it also increases the stress concentration. In the possible range of CFRP, smaller m and higher τy always resulted in a higher tensile strength, even though higher τy sometimes causes catastrophic failure. Therefore, combination of a strong interface and a high matrix shear yield stress was always right for improving tensile strength of CFRP. According to the GLS model, tensile strength is proportional to τy
1/(m+1). At the other parameters, a smaller fibre radius rf improved tensile strength (GLS model suggests tensile strength is proportional to rf
-1/(m+1)). A higher shear modulus G and a higher Vf slightly improved tensile strength as well, but not significantly. In the case of relatively smaller m and τy in the range of CFRP, the predicted tensile strength from the LLS model tended to exceed that from GLS model. LLS model considers the interaction among adjacent fibres. Adjacent fibres additionally sustain the load more than expected from GLS model as long as the fibres survive. A low τy redistributed low stress and small m improved the survival rate, leading to ductile failure. On the contrary, combination of a large m and a high τy brought brittle failure. Thus, the predicted strength from LLS model became smaller than that from GLS model. In the range of CFRP using T700S, predicted strength from GLS and LLS models was almost same. Therefore, the GLS model, which analytically predicts the 0º tensile strength with explicitly interpreting each parameter’s contribution, is a strong tool for material development. 3) Mechanisms explaining the gap between experiment and prediction The Weibull parameters for T700S collected from literature varied a lot. This implies that it is difficult to obtain reliable Weibull parameters. Hence, medium values were chosen to predict the 0º tensile strength using the constitutive models (GLS and LLS). The predicted strength was much higher than the experimentally obtained strength. In addition, the gaps between predictions and experiments were different from various matrices or process conditions. Hence, other mechanisms should be considered for each system. Therefore, three complementary models to explain the gaps were proposed. 3-1) Scaling effect on Weibull distribution Weibull parameters for various span lengths were collected from literature and scaling influences were investigated. A clear dependency of the Weibull modulus m on the span
148
length could not be found. On the contrary, the fibre strength increased with decreasing the span length, but the effect was smaller than predicted by conventional Weibull equation. Hence, a “smaller” σ0 at the short span should be used for better fit between the model and the experiment. Two ways of evaluating scaling influences on σ0 with modified Weibull distributions were proposed. However, if the approved scaling effects were applied, it was proven that these distributions did not fit to weakest-link model. This made it impossible to simulate the tensile failure using LLS model, because the a priori applied fibre strength distribution was dependent on the unit fibre length. Therefore, the tensile strength was predicted using only the GLS model. As the scaling effect of T700S was unknown, impact of this mechanism could not be quantitatively evaluated. However, it was shown that the scaling could fairly reduce the predicted strength compared to the conventional constitutive models. Since the gap between predicted strength and experiment was different from various matrix systems and process conditions even in the same T700S system, this mechanism was also not all-around. Although this hypothesis collapsed the weakest-link theory, thin, long CF should follows the weakest-link theory. While Weibull distribution is semi-empirically deduced, another empirical strength distribution should be set up to enable to characterize all the situations without collapsing the weakest-link theory. 3-2) Decrease of matrix shear yield stress A decrease of the “effective” matrix shear yield stress τdy during tensile loading was proposed, while the constitutive models from the literature treated the matrix shear yield stress τy as a constant. τdy decreases as axial matrix stress increases, according to the Von-Mises yield criterion. The matrix axial stress-strain relation was estimated as a second order polynomial using the experimentally obtained matrix modulus. The predicted unidirectional composite strength, especially in brittle systems such as CF/PPS and Epoxy, fairly approached the experimentally obtained strength. However, the gap between experiment and prediction could not be explained only by this mechanism. 3-3) Dispersed failure CF/PP and brittle Epoxy exhibited a much lower 0º tensile strength than predicted from the constitutive models. They experienced splitting already at a relatively low strain. A new simulation method was proposed to evaluate how much the strength reduced by splitting. Splitting grows in an unstable way, therefore once splitting occurs, composite fragments are split out from the coupon and the coupon releases the sustained load. Therefore, this study proposed a constitutive model which the split fragments area was discounted from the coupon area at each strain step. First the condition to initiate splitting was formulated using the shear fracture toughness, the dimension of a fibre breakage cluster and the applied stress in a fracture mechanics model. Second, a probabilistic study revealed the relation among the split area, the critical dimension
149
of the cluster to initiate splitting and the fibre breakage rate. Fibre breakage rate was described using the Weibull equation and hence was a function of applied load. From these approaches, split area was obtained as a function of applied load. The load sustained by the split fragments was discounted from the stress-strain curves predicted from GLS model and finally, the tensile strength was simulated. To explain the tensile strength of CF/PP, the shear fracture toughness should be 25 J/m2. However, the measured interlaminar fracture toughness in mode II of CF/PP by ENF tests was 674 J/m2. As the interlayer was relatively resin rich, the fracture toughness obtained from the ENF tests might not be appropriate for evaluating splitting initiation. In addition, this fracture mechanics model did not consider the multi-axial stress state around the cluster; the multi-axial stress might accelerate the splitting initiation. However, the values of 25 J/m2 and 674 J/m2 were too different from each other. Hence, it is reasonable to conclude that normal CFRP intrinsically never fails with splitting, because PP exhibits almost the lowest level of interlayer fracture toughness among various polymer options. Probably the experimentally observed splitting was caused by intensive stress concentration at the tabs, especially a transverse stress against a weak 90º tensile strength. Fracture coupons indicated that long fragments originated from the tab-ends. FEM indicated that a lower shear modulus of composite results in a higher stress concentration. Therefore, thermoplastic composites have a tendency to generate splitting rather than epoxy composites. In addition, FEM showed that a higher modulus of the tabs provided a higher stress concentration. Even though GFRP +/-45 tabs were applied which had much lower modulus than aluminium, splitting could not be prevented in the experiments. This indicates a difficulty to obtain potential tensile strength of unidirectional CFRTP, especially CF/PP.
150
Chapter 3 Hybrid effects in carbon fibre reinforced polypropylene
combined with self-reinforced polypropylene
3.1 Introduction This chapter explores the hybridization of carbon fibre reinforced thermoplastic composites with a new class of self-reinforced polymer composite. The self-reinforced polymer composite is made of chemically identical polymers, but composed of a highly oriented polymer “reinforcement” and an isotropic polymer “matrix”. Recently, applications of self-reinforced polypropylene (SRPP) have been widely distributed due to the superior cost/performance ratio and excellent processability of this material. For example, CurvTM, which is a commercialized SRPP in the form of a woven sheet, has a more than three times higher modulus and five times higher strength in comparison with normal PP; its impact resistance is three times higher than that of typical continuous GF/PP composite materials as introduced in Table 1-3. In addition, its density is only around 0.9 g/cm3. This study aims to extend the material potentials of “high modulus/strength” carbon fibre reinforced polypropylene (CFRPP) by combining it with “tough and light” SRPP. Concretely, two concepts are proposed. The first concept focuses on the tensile properties. SRPP has an intrinsic behavior of shrinkage under high temperature due to entropy enhancement in the polymer packing state.

151
When SRPP is consolidated with CFRPP by hot pressing, compressive residual stress is accumulated in CFRPP due to the shrinkage of SRPP and presumably improves the tensile properties compared with sole CFRPP. The second concept focuses on impact resistance. The addition of tough SRPP to CFRPP is anticipated to bring improvements in impact properties. This chapter is organized as follows. Section 3.2 and 3.3 describe the materials and fabrication procedures applied to hybrid composites. In Section 3.4 the mechanical and thermal properties of SRPP are characterized. The visco-elastic behaviour of SRPP including the shrinkage phenomenon is investigated by dynamic mechanical thermal analysis and the compressive residual stress accumulated during consolidation is quantitatively measured. Section 3.5 demonstrates the interply hybrid composites and analyses the contribution of SRPP shrinkage to their tensile properties. Section 3.6 investigates the Izod impact strength of interply hybrid composites with different stacking sequence and Vf (volume fraction of carbon fibre). 3.2 Materials 1) Carbon fibre reinforced polypropylene prepreg Commercially few companies provide CF/PP unidirectional prepreg. This study used the prepreg AtenPly produced by Jonam Composites Ltd. (United Kingdom) and Celstran CFTTM CF-PP50 by Ticona GmbH (Germany) as shown in Fig. 2-1a and b. Table 3-1 summarizes their specifications and cross-sections. More details are described in Section 2.2. Table 3-1 CFRPP prepreg specifications and cross-sections
ManufacturerDensity(g/cm3)
T m
(ºC)V f
(%)Thickness(mm) Cross-section
AtenPly JonamComposites
1.26 142 40 0.15
Celstran CFTTM Ticona 1.20 164 33 0.25
2) Self-reinforced polypropylene woven sheet Black colored SRPP woven sheet CurvTM produced by Propex Fabrics GmbH (Germany) was used as shown in Fig. 3-1 [150]. Table 3-2 summarizes the specifications and cross section. Stretched PP tapes (hereafter SRPP tape) are woven and bonded together by selectively melting only the tape surface through a hot-compaction procedure. The molten PP is re-crystallized during cooling and fills the interface as can be seen in the cross-section of SRPP

152
in Fig. 1-36. Two types of thickness (0.15 and 0.35 mm) were respectively applied in different studies. Hereafter, they are distinguished as “thin” and “thick” SRPP.
Fig. 3-1 SRPP woven sheets [150] Table 3-2 SRPP woven sheet specifications and cross-section
ManufacturerDensity(g/cm3)
T m
(ºC)Thickness(mm) Cross-section
CurvTM PropexFabrics
0.92 165 (Isotropic PP)180 (Oriented PP)
0.15or0.35→
PP matrixHighly oriented PP reinforcement
Thermoforming temperature
Fig. 3-2 Melting of SRPP woven sheet observed by DSC [152] During the hot-compaction, the isotropic PP matrix which is re-crystallized in random orientation during the hot-compaction exhibits a melting temperature Tm of around 165ºC, but

153
oriented PP reinforcement has a Tm of around 180ºC, according to Propex observation by differential scanning calorimetry (DSC) as shown in Fig. 3-2 [152]. Hence, thermoforming temperature should be higher than Tm of the matrix, but lower than Tm of the oriented PP reinforcement. Finally, Fig. 3-3 illustrates the manufacturer’s technical data sheet [151] of CurvTM woven laminate.
Fig. 3-3 CurvTM data sheet [151]

154
3) Self-reinforced polypropylene tape Fig. 3-4 shows a bobbin of the constituent of SRPP, namely the stretched PP tapes (SRPP tape) provided by Propex Fabrics. Table 3-3 summarizes the specifications and cross-section. The tape is thin, only 60μm thickness.
Fig. 3-4 SRPP tape bobbin Table 3-3 SRPP tape specifications and cross-section
Manufacturer T m
(ºC)Width(mm)
Thickness(mm)
Cross-section
CurvTM
tapePropexFabrics
164 (Isotropic PP)174 (Oriented PP)
2.5 0.06
The heat flow when heating the PP tape at 10ºC/min was measured from -50 to 200ºC by DSC Q2000 (TA Instruments). As illustrated in Fig. 3-5, the cliff indicating the melting of crystals is distributed in the range from 140 to 180ºC. This implies that the tape contains crystals with various orientations and degree of perfection, but a large amount of the highly oriented and perfect PP crystals as the peak appears around 174ºC. Tensile tests at the cross-head speed of 25 %/min were performed at various temperatures by W. Pinxten [153]. The stress-strain curves in Fig. 3-6 indicate that the modulus decreases as temperature becomes higher. Table 3-4 summarizes the tensile properties of SRPP tapes obtained by two measurers [153]. The tensile modulus and the strength at room temperature are around 7 GPa and 550 MPa, respectively.

155
Fig. 3-5 Heat flow of SRPP tape observed by DSC
0
100
200
300
400
500
600
700
0 20 40 60 80 100Strain (%)
Tens
ile st
ress
(MPa
)
25°C50°C75°C100°C120°C140°C160°C170°C
Fig. 3-6 Tensile stress-strain curves of SRPP tapes under various temperatures [153] Table 3-4 tensile properties of SRPP tape [153]
Measurer Modulus (MPa) Strength (MPa) Failure strain (%)Propex Fabrics 6716-8711 515.6-542.7 9-11W. Pinxten 6854 (192) 589.3 (23.9) 19.5 (0.6)
( ):standard deviation
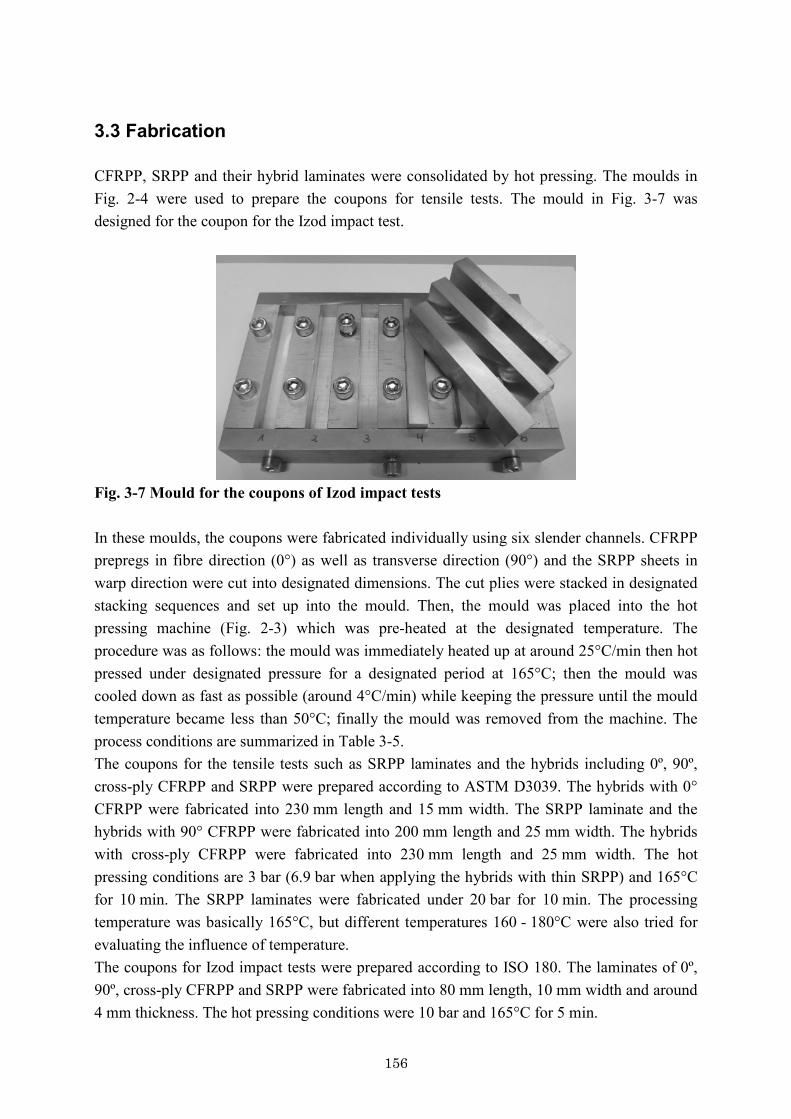
156
3.3 Fabrication CFRPP, SRPP and their hybrid laminates were consolidated by hot pressing. The moulds in Fig. 2-4 were used to prepare the coupons for tensile tests. The mould in Fig. 3-7 was designed for the coupon for the Izod impact test.
Fig. 3-7 Mould for the coupons of Izod impact tests In these moulds, the coupons were fabricated individually using six slender channels. CFRPP prepregs in fibre direction (0°) as well as transverse direction (90°) and the SRPP sheets in warp direction were cut into designated dimensions. The cut plies were stacked in designated stacking sequences and set up into the mould. Then, the mould was placed into the hot pressing machine (Fig. 2-3) which was pre-heated at the designated temperature. The procedure was as follows: the mould was immediately heated up at around 25°C/min then hot pressed under designated pressure for a designated period at 165°C; then the mould was cooled down as fast as possible (around 4°C/min) while keeping the pressure until the mould temperature became less than 50°C; finally the mould was removed from the machine. The process conditions are summarized in Table 3-5. The coupons for the tensile tests such as SRPP laminates and the hybrids including 0º, 90º, cross-ply CFRPP and SRPP were prepared according to ASTM D3039. The hybrids with 0° CFRPP were fabricated into 230 mm length and 15 mm width. The SRPP laminate and the hybrids with 90° CFRPP were fabricated into 200 mm length and 25 mm width. The hybrids with cross-ply CFRPP were fabricated into 230 mm length and 25 mm width. The hot pressing conditions are 3 bar (6.9 bar when applying the hybrids with thin SRPP) and 165°C for 10 min. The SRPP laminates were fabricated under 20 bar for 10 min. The processing temperature was basically 165°C, but different temperatures 160 - 180°C were also tried for evaluating the influence of temperature. The coupons for Izod impact tests were prepared according to ISO 180. The laminates of 0º, 90º, cross-ply CFRPP and SRPP were fabricated into 80 mm length, 10 mm width and around 4 mm thickness. The hot pressing conditions were 10 bar and 165°C for 5 min.
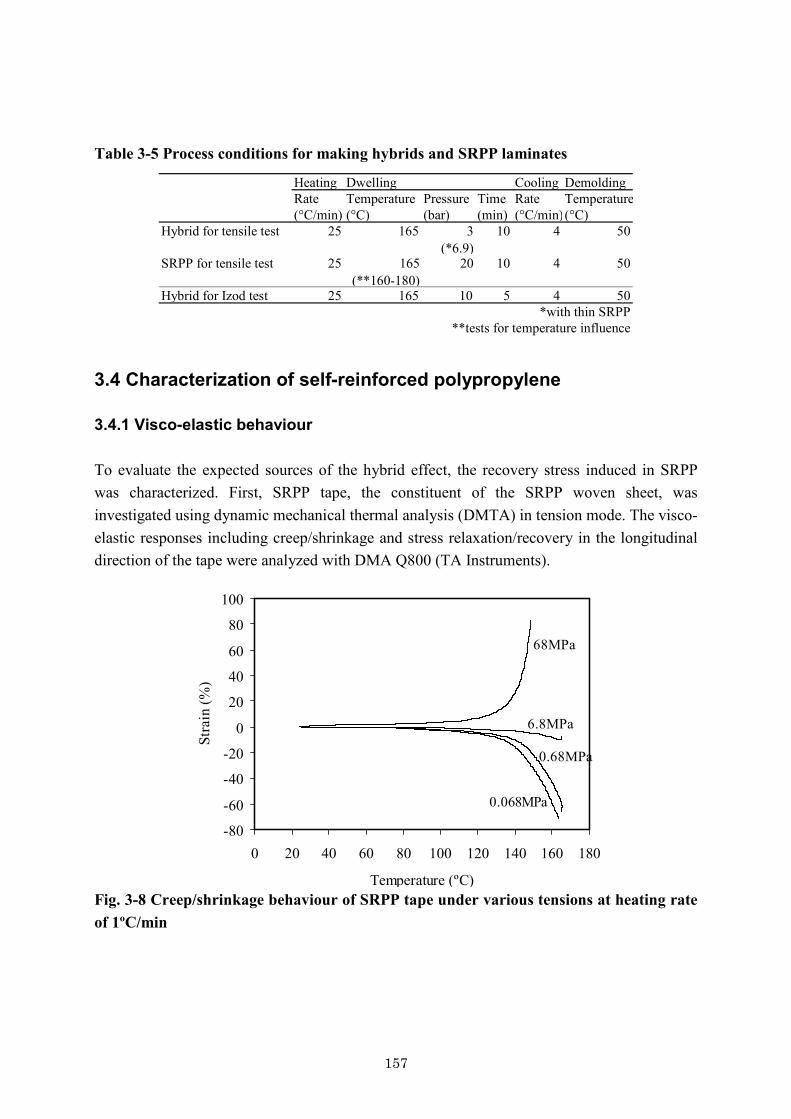
157
Table 3-5 Process conditions for making hybrids and SRPP laminates
Heating Dwelling Cooling DemoldingRate Temperature Pressure Time Rate Temperature(°C/min) (°C) (bar) (min) (°C/min)(°C)
Hybrid for tensile test 25 165 3(*6.9)
10 4 50
SRPP for tensile test 25 165(**160-180)
20 10 4 50
Hybrid for Izod test 25 165 10 5 4 50*with thin SRPP
**tests for temperature influence 3.4 Characterization of self-reinforced polypropylene 3.4.1 Visco-elastic behaviour To evaluate the expected sources of the hybrid effect, the recovery stress induced in SRPP was characterized. First, SRPP tape, the constituent of the SRPP woven sheet, was investigated using dynamic mechanical thermal analysis (DMTA) in tension mode. The visco-elastic responses including creep/shrinkage and stress relaxation/recovery in the longitudinal direction of the tape were analyzed with DMA Q800 (TA Instruments).
68MPa
6.8MPa
0.68MPa
0.068MPa
-80
-60
-40
-20
0
20
40
60
80
100
0 20 40 60 80 100 120 140 160 180
Temperature (ºC)
Stra
in (%
)
Fig. 3-8 Creep/shrinkage behaviour of SRPP tape under various tensions at heating rate of 1ºC/min
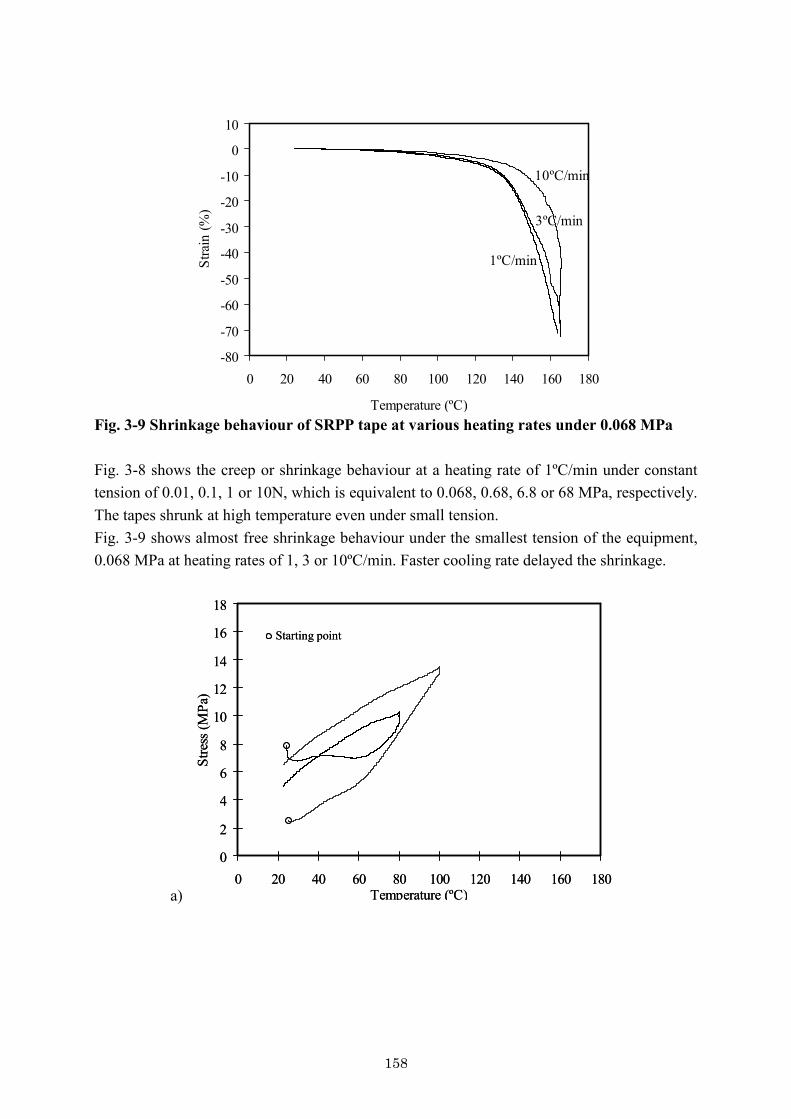
158
10ºC/min
3ºC/min
1ºC/min
-80
-70
-60
-50
-40
-30
-20
-10
0
10
0 20 40 60 80 100 120 140 160 180
Temperature (ºC)
Stra
in (%
)
Fig. 3-9 Shrinkage behaviour of SRPP tape at various heating rates under 0.068 MPa Fig. 3-8 shows the creep or shrinkage behaviour at a heating rate of 1ºC/min under constant tension of 0.01, 0.1, 1 or 10N, which is equivalent to 0.068, 0.68, 6.8 or 68 MPa, respectively. The tapes shrunk at high temperature even under small tension. Fig. 3-9 shows almost free shrinkage behaviour under the smallest tension of the equipment, 0.068 MPa at heating rates of 1, 3 or 10ºC/min. Faster cooling rate delayed the shrinkage.
a)
0
2
4
6
8
10
12
14
16
18
0 20 40 60 80 100 120 140 160 180Temperature (ºC)
Stre
ss (M
Pa)
Starting point
0
2
4
6
8
10
12
14
16
18
0 20 40 60 80 100 120 140 160 180Temperature (ºC)
Stre
ss (M
Pa)
Starting point
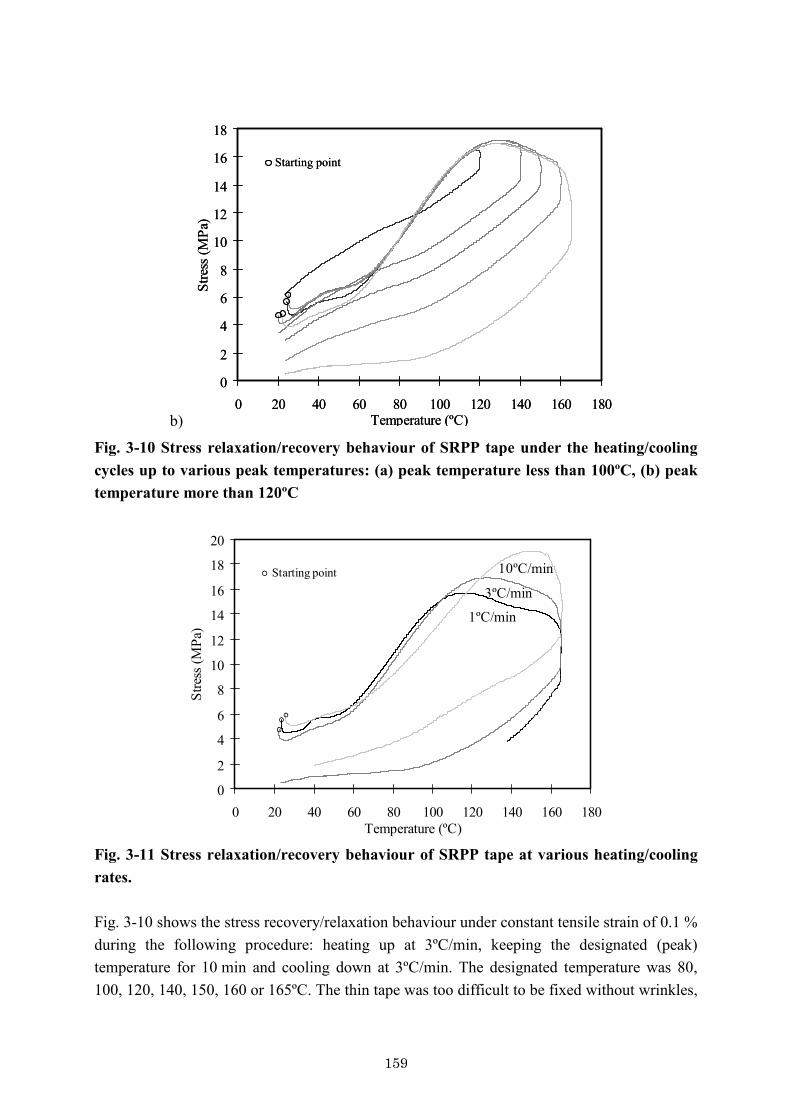
159
b)
0
2
4
6
8
10
12
14
16
18
0 20 40 60 80 100 120 140 160 180Temperature (ºC)
Stre
ss (M
Pa)
Starting point
0
2
4
6
8
10
12
14
16
18
0 20 40 60 80 100 120 140 160 180Temperature (ºC)
Stre
ss (M
Pa)
Starting point
Fig. 3-10 Stress relaxation/recovery behaviour of SRPP tape under the heating/cooling cycles up to various peak temperatures: (a) peak temperature less than 100ºC, (b) peak temperature more than 120ºC
0
2
4
6
8
10
12
14
16
18
20
0 20 40 60 80 100 120 140 160 180Temperature (ºC)
Stre
ss (M
Pa)
10ºC/min
3ºC/min
1ºC/min
Starting point
Fig. 3-11 Stress relaxation/recovery behaviour of SRPP tape at various heating/cooling rates. Fig. 3-10 shows the stress recovery/relaxation behaviour under constant tensile strain of 0.1 % during the following procedure: heating up at 3ºC/min, keeping the designated (peak) temperature for 10 min and cooling down at 3ºC/min. The designated temperature was 80, 100, 120, 140, 150, 160 or 165ºC. The thin tape was too difficult to be fixed without wrinkles,
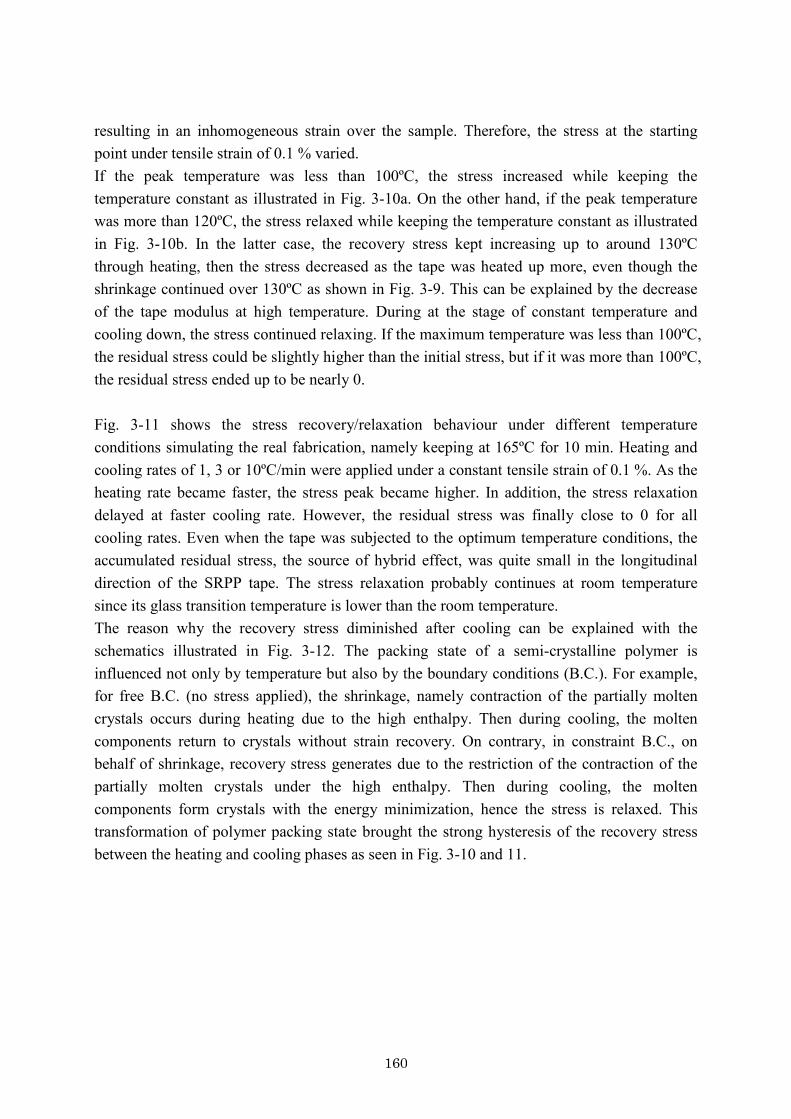
160
resulting in an inhomogeneous strain over the sample. Therefore, the stress at the starting point under tensile strain of 0.1 % varied. If the peak temperature was less than 100ºC, the stress increased while keeping the temperature constant as illustrated in Fig. 3-10a. On the other hand, if the peak temperature was more than 120ºC, the stress relaxed while keeping the temperature constant as illustrated in Fig. 3-10b. In the latter case, the recovery stress kept increasing up to around 130ºC through heating, then the stress decreased as the tape was heated up more, even though the shrinkage continued over 130ºC as shown in Fig. 3-9. This can be explained by the decrease of the tape modulus at high temperature. During at the stage of constant temperature and cooling down, the stress continued relaxing. If the maximum temperature was less than 100ºC, the residual stress could be slightly higher than the initial stress, but if it was more than 100ºC, the residual stress ended up to be nearly 0. Fig. 3-11 shows the stress recovery/relaxation behaviour under different temperature conditions simulating the real fabrication, namely keeping at 165ºC for 10 min. Heating and cooling rates of 1, 3 or 10ºC/min were applied under a constant tensile strain of 0.1 %. As the heating rate became faster, the stress peak became higher. In addition, the stress relaxation delayed at faster cooling rate. However, the residual stress was finally close to 0 for all cooling rates. Even when the tape was subjected to the optimum temperature conditions, the accumulated residual stress, the source of hybrid effect, was quite small in the longitudinal direction of the SRPP tape. The stress relaxation probably continues at room temperature since its glass transition temperature is lower than the room temperature. The reason why the recovery stress diminished after cooling can be explained with the schematics illustrated in Fig. 3-12. The packing state of a semi-crystalline polymer is influenced not only by temperature but also by the boundary conditions (B.C.). For example, for free B.C. (no stress applied), the shrinkage, namely contraction of the partially molten crystals occurs during heating due to the high enthalpy. Then during cooling, the molten components return to crystals without strain recovery. On contrary, in constraint B.C., on behalf of shrinkage, recovery stress generates due to the restriction of the contraction of the partially molten crystals under the high enthalpy. Then during cooling, the molten components form crystals with the energy minimization, hence the stress is relaxed. This transformation of polymer packing state brought the strong hysteresis of the recovery stress between the heating and cooling phases as seen in Fig. 3-10 and 11.

161
Heating Cooling
Free B.C.Shrinkage
Constraint B.C.Recovery stress
High enthalpy
Re-crystallizationPartial meltActivationat 60-80ºC
Initial
High enthalpy
Fig. 3-12 Schematic of polymer packing state of SRPP tape 3.4.2 Tensile properties Tensile testing was performed on two types of SRPP woven sheet; one has a thickness of 0.15 mm (thin) and the other 0.35 mm (thick). Single ply and six-ply stacks were investigated. To evaluate the influence of processing temperature, the stacks were consolidated at different temperatures. When 160ºC was applied, the stacks were not consolidated and when 180ºC was applied, polymer was molten and squeezed out from the mould. Therefore, the mechanical properties were compared at three temperatures, 165, 170 and 175ºC. The dimensions of the coupons were 200 mm length and 25 mm width (span length was 150 mm). Tabs made of glass fibre/epoxy in 25 x 25 x 4 mm were bonded to the sand-blasted surface of the coupons with Araldite 2011TM epoxy glue; the coupons are put between two press plates and compressed for 1 day. Tensile tests were performed according to ASTM D3039 using Instron 4505 tensile testing machine equipped with hydraulic grips. The cross-head speed was 2 mm/min. The load was applied in the warp direction of the SRPP. An extensometer with a gauge length of 50 mm was attached to the coupons by means of two rubber bands. To avoid damage to the device at failure of the coupons, the extensometer was removed at 0.5 % strain. The computer connected to the machine registered the extensometer strain first, and then the displacement of the grips after the removal. After the tests, adjustment of the stiffness slopes measured from the extensometer and the grip displacement around 0.5 % made the whole stress-strain curves
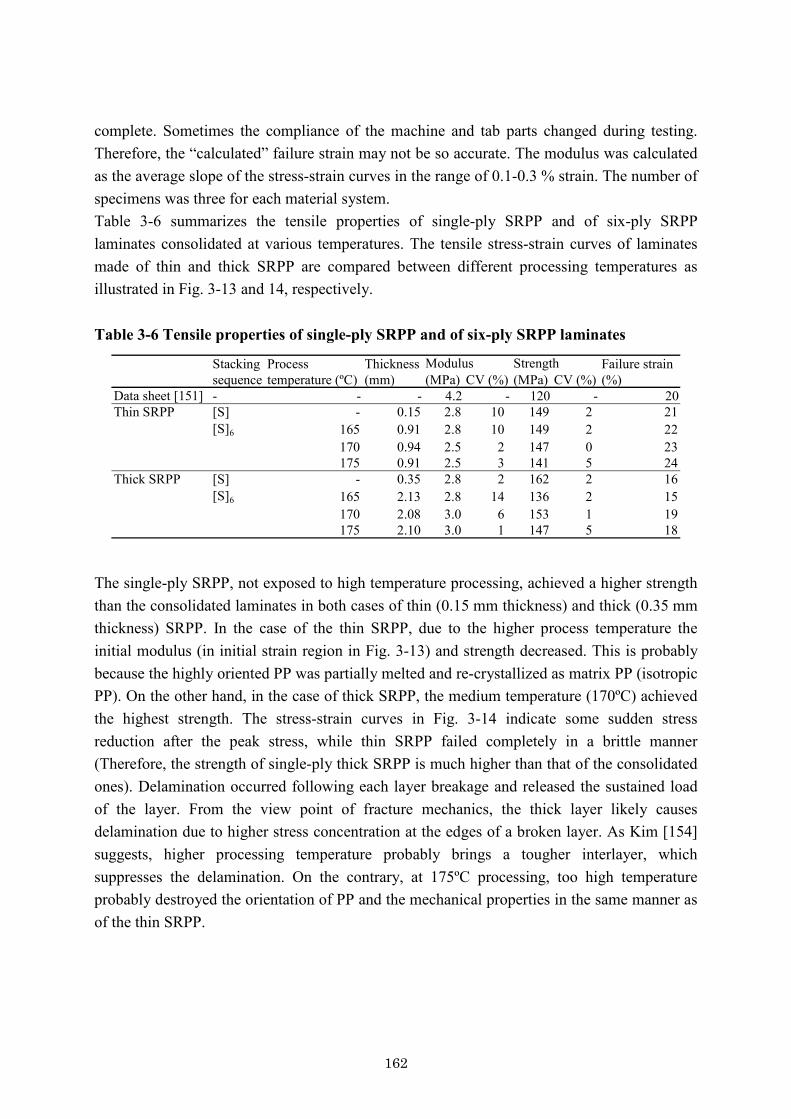
162
complete. Sometimes the compliance of the machine and tab parts changed during testing. Therefore, the “calculated” failure strain may not be so accurate. The modulus was calculated as the average slope of the stress-strain curves in the range of 0.1-0.3 % strain. The number of specimens was three for each material system. Table 3-6 summarizes the tensile properties of single-ply SRPP and of six-ply SRPP laminates consolidated at various temperatures. The tensile stress-strain curves of laminates made of thin and thick SRPP are compared between different processing temperatures as illustrated in Fig. 3-13 and 14, respectively. Table 3-6 Tensile properties of single-ply SRPP and of six-ply SRPP laminates
Stacking Process Thickness Failure strainsequence temperature (ºC) (mm) (MPa) CV (%) (MPa) CV (%) (%)
Data sheet [151] - - - 4.2 - 120 - 20Thin SRPP [S] - 0.15 2.8 10 149 2 21
[S]6 165 0.91 2.8 10 149 2 22170 0.94 2.5 2 147 0 23175 0.91 2.5 3 141 5 24
Thick SRPP [S] - 0.35 2.8 2 162 2 16[S]6 165 2.13 2.8 14 136 2 15
170 2.08 3.0 6 153 1 19175 2.10 3.0 1 147 5 18
Modulus Strength
The single-ply SRPP, not exposed to high temperature processing, achieved a higher strength than the consolidated laminates in both cases of thin (0.15 mm thickness) and thick (0.35 mm thickness) SRPP. In the case of the thin SRPP, due to the higher process temperature the initial modulus (in initial strain region in Fig. 3-13) and strength decreased. This is probably because the highly oriented PP was partially melted and re-crystallized as matrix PP (isotropic PP). On the other hand, in the case of thick SRPP, the medium temperature (170ºC) achieved the highest strength. The stress-strain curves in Fig. 3-14 indicate some sudden stress reduction after the peak stress, while thin SRPP failed completely in a brittle manner (Therefore, the strength of single-ply thick SRPP is much higher than that of the consolidated ones). Delamination occurred following each layer breakage and released the sustained load of the layer. From the view point of fracture mechanics, the thick layer likely causes delamination due to higher stress concentration at the edges of a broken layer. As Kim [154] suggests, higher processing temperature probably brings a tougher interlayer, which suppresses the delamination. On the contrary, at 175ºC processing, too high temperature probably destroyed the orientation of PP and the mechanical properties in the same manner as of the thin SRPP.

163
Fig. 3-13 Tensile stress-strain curves of laminates made of thin SRPP in various processing temperatures up to 10 % strain.
0
50
100
150
200
0 5 10 15 20 25Strain (%)
Tens
ile st
ress
(MPa
)
165ºC
170ºC
175ºC
Fig. 3-14 Tensile stress-strain curves of laminates made of thick SRPP in various processing temperatures. 3.4.3 Residual stress The residual stress imposed by SRPP woven sheet in the hybrid composites comes not only from the SRPP tapes in the longitudinal direction, but also from those in the transverse direction or the PP matrix at the interfacial areas among the tapes. The driving force is supposed to be the difference of thermal expansion coefficient between CFRPP and SRPP. This study assumed that the thermal residual stress of 0º CFRP is neglectable due to the low

164
or negative thermal expansion of carbon fibre, and in the hybrid composites, the 0º CFRP layer is so stiff to maintain the dimension of hybrid composites in the longitudinal direction, as well as SRPP layer. Hence, a residual stress induced by an intrinsic shrinkage of SRPP (including the effect of thermal expansion coefficient) can be calculated from the curvature of an unbalanced laminate of SRPP woven sheet and CFRPP prepregs. First the relation between the SRPP residual stress and the curvature of the laminate was formulated. The residual stress σr accumulates in the SRPP layer during processing and the laminate warps. The stress distribution in the laminate was defined as shown in the cross-section of an unbalanced laminate illustrated in Fig. 3-15a, where a, b, c, Ea, Eb and ρ denoted thickness of SRPP, thickness of CFRPP, distance between CFRPP surface and neutral axis, SRPP modulus, CFRPP modulus and curvature radius to the neutral axis, respectively.
a)
tension compression
neutralaxis
a
b
c
ρ
Ea
Eby
Eby/ρ
σr
Eay/ρSRPP
CFRPP
b)
Fig. 3-15 Schematics of residual stress estimation: stress distribution on cross-section (a) and warp dimensions of unbalanced laminate (b) Considering the equilibrium of axial force:
0=+÷÷ø
öççè
æ+ò ò
+-
+-- +-
dyyEdyyEcb
cba
c
cbbar rr
s (3-1)
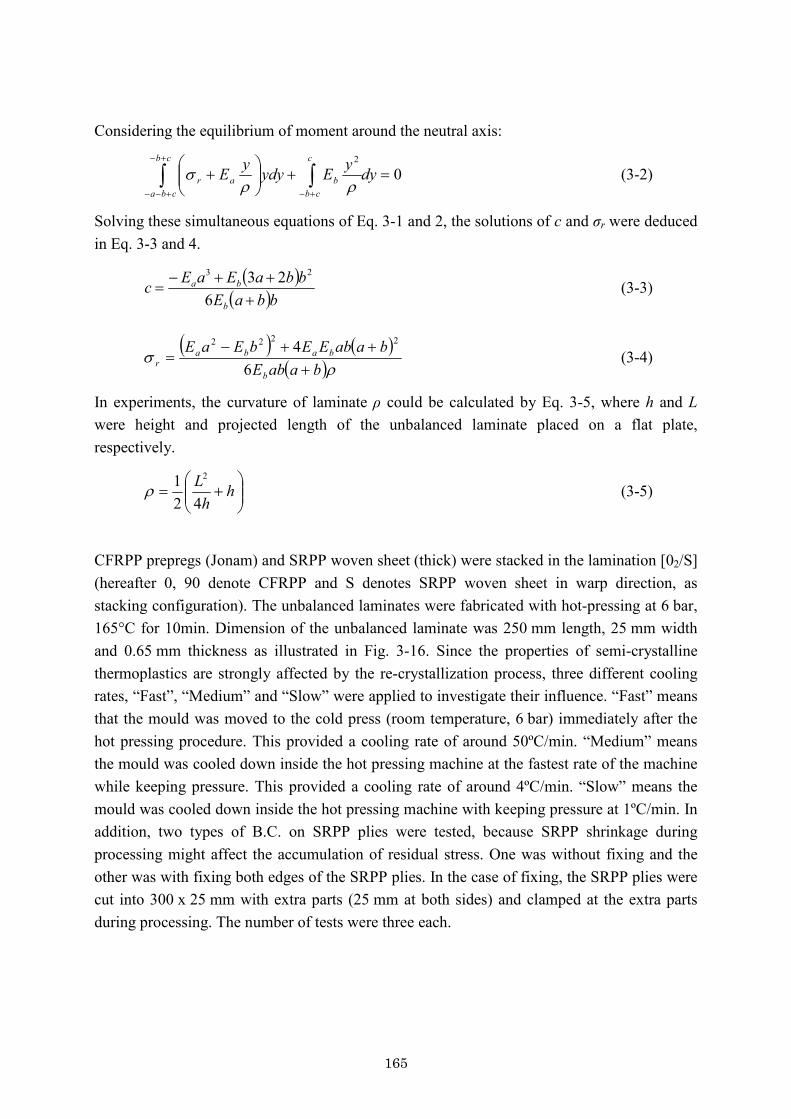
165
Considering the equilibrium of moment around the neutral axis:
02
=+÷÷ø
öççè
æ+ò ò
+-
+-- +-
dyyEydyyEcb
cba
c
cbbar rr
s (3-2)
Solving these simultaneous equations of Eq. 3-1 and 2, the solutions of c and σr were deduced in Eq. 3-3 and 4.
( )( )bbaE
bbaEaEcb
ba
+++-
=6
23 23
(3-3)
( ) ( )( )rs
baabEbaabEEbEaE
b
babar +
++-=
64 2222
(3-4)
In experiments, the curvature of laminate ρ could be calculated by Eq. 3-5, where h and L were height and projected length of the unbalanced laminate placed on a flat plate, respectively.
÷÷ø
öççè
æ+= h
hL42
1 2
r (3-5)
CFRPP prepregs (Jonam) and SRPP woven sheet (thick) were stacked in the lamination [02/S] (hereafter 0, 90 denote CFRPP and S denotes SRPP woven sheet in warp direction, as stacking configuration). The unbalanced laminates were fabricated with hot-pressing at 6 bar, 165°C for 10min. Dimension of the unbalanced laminate was 250 mm length, 25 mm width and 0.65 mm thickness as illustrated in Fig. 3-16. Since the properties of semi-crystalline thermoplastics are strongly affected by the re-crystallization process, three different cooling rates, “Fast”, “Medium” and “Slow” were applied to investigate their influence. “Fast” means that the mould was moved to the cold press (room temperature, 6 bar) immediately after the hot pressing procedure. This provided a cooling rate of around 50ºC/min. “Medium” means the mould was cooled down inside the hot pressing machine at the fastest rate of the machine while keeping pressure. This provided a cooling rate of around 4ºC/min. “Slow” means the mould was cooled down inside the hot pressing machine with keeping pressure at 1ºC/min. In addition, two types of B.C. on SRPP plies were tested, because SRPP shrinkage during processing might affect the accumulation of residual stress. One was without fixing and the other was with fixing both edges of the SRPP plies. In the case of fixing, the SRPP plies were cut into 300 x 25 mm with extra parts (25 mm at both sides) and clamped at the extra parts during processing. The number of tests were three each.

166
Fig. 3-16 Unbalanced laminate made [02/S]: upper is CFRPP and lower is SRPP Table 3-7 and Fig. 3-17 summarize the residual stress measured under two B.C. at three cooling rates. Ea and Eb were set as 2.8 and 92.7 GPa, respectively according to tensile testing results shown in Table 3-6 and 2-4. The lower cooling rate achieved the higher residual stress in the case without fixing, while the stress was almost independent on cooling rates in the case with fixing. The results with fixing probably were more trustable. If SRPP shrinkage was not well suppressed, this shrinkage might cause fibre waviness inside CFRPP and reduce its modulus Eb; there was a possibility to overestimate Eb. At the lower cooling rate, there was more time to shrink and disturb fibre alignment, resulting in more warp. According to the DMTA results, the residual stress induced by the shrinkage of SRPP tapes could be neglected. Therefore, this residual stress of nearly 11 MPa in SRPP might be only the result of thermal expansion difference between CFRPP and SRPP. Table 3-7 Residual stress of SRPP under two B.C. at three cooling rates
Cooling rate(MPa) CV (%)
w/o fixing Fast 10.0 21Medium 14.4 6Slow 16.0 5
with fixing Fast 10.3 8Medium 10.9 11Slow 11.1 14
Residual stress
0
5
10
15
20
Fast cooling Medium cooling Slow cooling
Res
idua
l stre
ss (M
Pa)
w/o fixingwith fixing
Fig. 3-17 Residual stress of SRPP under two B.C. at three cooling rates
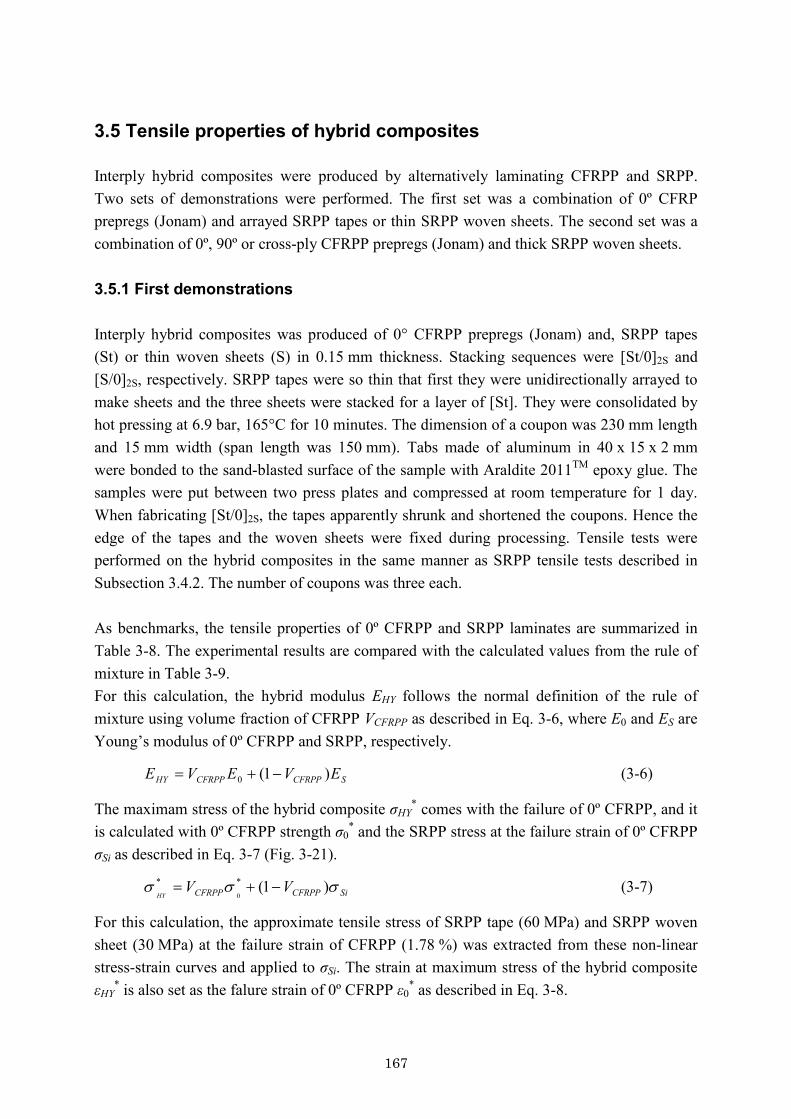
167
3.5 Tensile properties of hybrid composites Interply hybrid composites were produced by alternatively laminating CFRPP and SRPP. Two sets of demonstrations were performed. The first set was a combination of 0º CFRP prepregs (Jonam) and arrayed SRPP tapes or thin SRPP woven sheets. The second set was a combination of 0º, 90º or cross-ply CFRPP prepregs (Jonam) and thick SRPP woven sheets. 3.5.1 First demonstrations Interply hybrid composites was produced of 0° CFRPP prepregs (Jonam) and, SRPP tapes (St) or thin woven sheets (S) in 0.15 mm thickness. Stacking sequences were [St/0]2S and [S/0]2S, respectively. SRPP tapes were so thin that first they were unidirectionally arrayed to make sheets and the three sheets were stacked for a layer of [St]. They were consolidated by hot pressing at 6.9 bar, 165°C for 10 minutes. The dimension of a coupon was 230 mm length and 15 mm width (span length was 150 mm). Tabs made of aluminum in 40 x 15 x 2 mm were bonded to the sand-blasted surface of the sample with Araldite 2011TM epoxy glue. The samples were put between two press plates and compressed at room temperature for 1 day. When fabricating [St/0]2S, the tapes apparently shrunk and shortened the coupons. Hence the edge of the tapes and the woven sheets were fixed during processing. Tensile tests were performed on the hybrid composites in the same manner as SRPP tensile tests described in Subsection 3.4.2. The number of coupons was three each. As benchmarks, the tensile properties of 0º CFRPP and SRPP laminates are summarized in Table 3-8. The experimental results are compared with the calculated values from the rule of mixture in Table 3-9. For this calculation, the hybrid modulus EHY follows the normal definition of the rule of mixture using volume fraction of CFRPP VCFRPP as described in Eq. 3-6, where E0 and ES are Young’s modulus of 0º CFRPP and SRPP, respectively.
SCFRPPCFRPPHY EVEVE )1(0 -+= (3-6)
The maximam stress of the hybrid composite σHY* comes with the failure of 0º CFRPP, and it
is calculated with 0º CFRPP strength σ0* and the SRPP stress at the failure strain of 0º CFRPP
σSi as described in Eq. 3-7 (Fig. 3-21).
SiCFRPPCFRPP VVHY
sss )1(**0
-+= (3-7)
For this calculation, the approximate tensile stress of SRPP tape (60 MPa) and SRPP woven sheet (30 MPa) at the failure strain of CFRPP (1.78 %) was extracted from these non-linear stress-strain curves and applied to σSi. The strain at maximum stress of the hybrid composite εHY
* is also set as the falure strain of 0º CFRPP ε0* as described in Eq. 3-8.
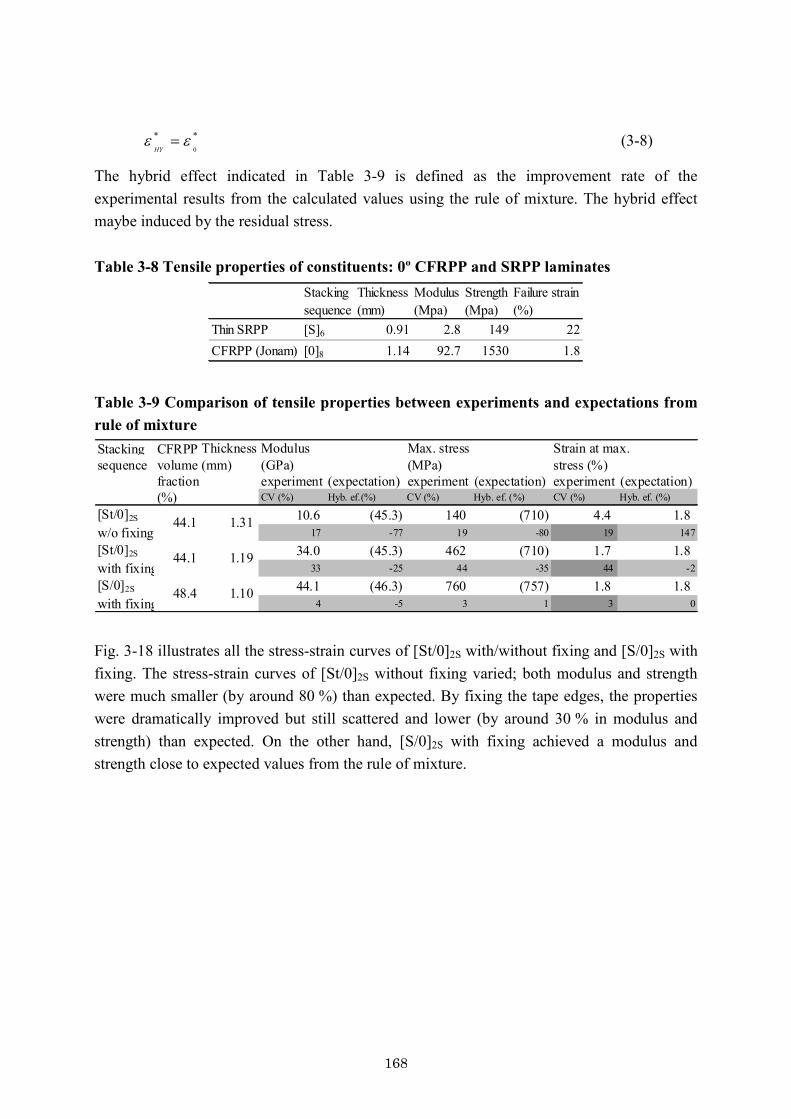
168
**0
ee =HY
(3-8)
The hybrid effect indicated in Table 3-9 is defined as the improvement rate of the experimental results from the calculated values using the rule of mixture. The hybrid effect maybe induced by the residual stress. Table 3-8 Tensile properties of constituents: 0º CFRPP and SRPP laminates
Stackingsequence
Thickness(mm)
Modulus(Mpa)
Strength(Mpa)
Failure strain(%)
Thin SRPP [S]6 0.91 2.8 149 22CFRPP (Jonam) [0]8 1.14 92.7 1530 1.8
Table 3-9 Comparison of tensile properties between experiments and expectations from rule of mixture Stacking CFRPP Thickness Modulus Max. stress Strain at max.sequence volume (mm) (GPa) (MPa) stress (%)
fraction experiment (expectation) experiment (expectation) experiment (expectation)(%) CV (%) Hyb. ef.(%) CV (%) Hyb. ef. (%) CV (%) Hyb. ef. (%)
[St/0]2S 10.6 (45.3) 140 (710) 4.4 1.8w/o fixing 17 -77 19 -80 19 147
[St/0]2S 34.0 (45.3) 462 (710) 1.7 1.8with fixing 33 -25 44 -35 44 -2
[S/0]2S 44.1 (46.3) 760 (757) 1.8 1.8with fixing 4 -5 3 1 3 0
48.4 1.10
44.1 1.31
44.1 1.19
Fig. 3-18 illustrates all the stress-strain curves of [St/0]2S with/without fixing and [S/0]2S with fixing. The stress-strain curves of [St/0]2S without fixing varied; both modulus and strength were much smaller (by around 80 %) than expected. By fixing the tape edges, the properties were dramatically improved but still scattered and lower (by around 30 % in modulus and strength) than expected. On the other hand, [S/0]2S with fixing achieved a modulus and strength close to expected values from the rule of mixture.

169
a)
0
200
400
600
800
0 2 4 6 8Strain (%)
Tens
ile st
ress
(MPa
)
Rule of mixtureHybrids
b)
0
200
400
600
800
0 2 4 6 8Strain (%)
Tens
ile st
ress
(MPa
)
Rule of mixtureHybrids
c)
0
200
400
600
800
0 2 4 6 8Strain (%)
Tens
ile st
ress
(MPa
)
Rule of mixtureHybrids
Fig. 3-18 Tensile stress-strain curves of hybrid laminates [St/0]2S without fixing (a), with fixing (b) and [S/0]2S with fixing (c)
170
Fig. 3-19 compares the fracture coupons of these hybrid laminates. SRPP tapes were split out from the coupon due to the interfacial weakness between the tapes. However in the case of [S/0]2S, failure damage was localized and SRPP woven sheets were not intensively delaminated.
a)
b)
c)
Fig. 3-19 Fracture coupons of [St/0]2S without fixing (a), with fixing (b) and [S/0]2S with fixing (c) As explanation of the loss in properties of both [St/0]2S composites, it is assumed that the recovery stress induced by the shrinkage of SRPP layers during processing locally disturbs the carbon fibre alignment in the CFRPP layers. As shown in Fig. 3-9, the shrinkage increases at high temperature at which CFRPP becomes soft. Comparing the cross-sections of these hybrid laminates in Fig. 3-20, elliptical cross-sections of the carbon fibres indicate much more fibre waviness in [St/0]2S without fixing than that in [St/0]2S with fixing and [S/0]2S with fixing. Even if the residual stress of SRPP woven sheet reaches 11 MPa as measured in Subsection 3.4.3, the expectable improvement in strength σr_HY from the rule of mixture as described in Eq. 3-9 is 5.5 MPa in [S/0]2S. This is too small to expect a significant improvement for tensile properties of interplay hybrid composites in carbon fibre direction.
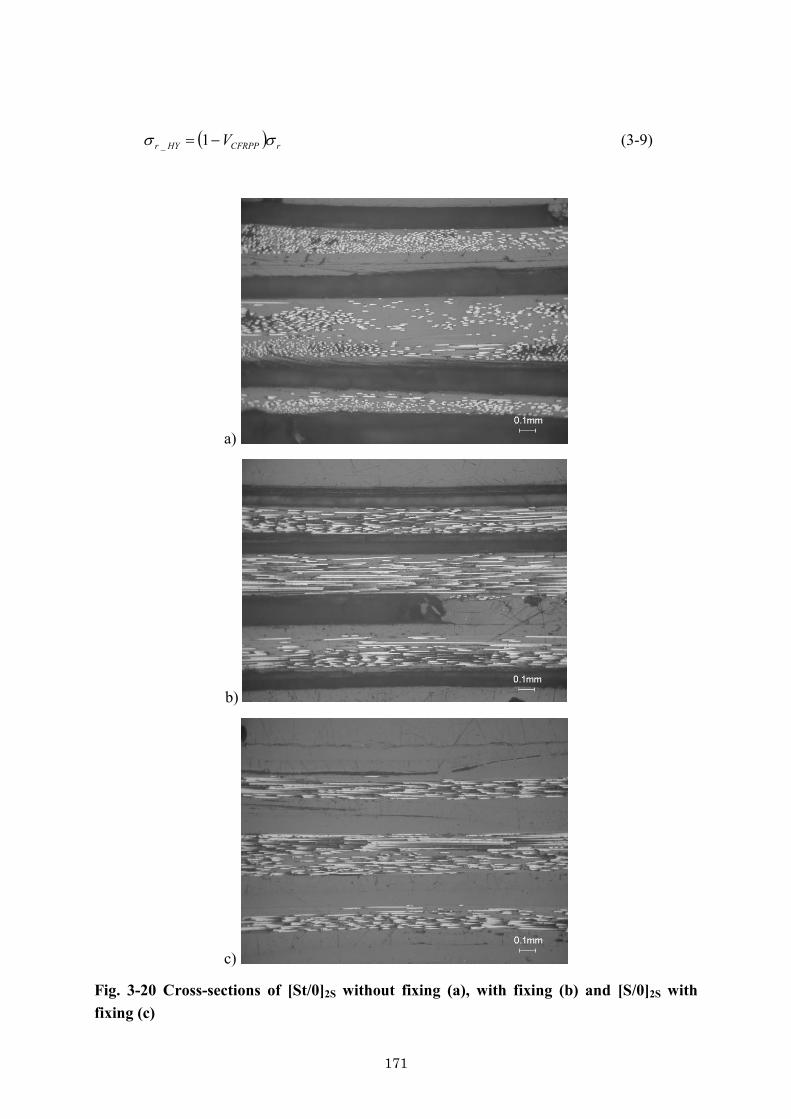
171
( ) rCFRPPHYr V ss -= 1_ (3-9)
a)
b)
c)
Fig. 3-20 Cross-sections of [St/0]2S without fixing (a), with fixing (b) and [S/0]2S with fixing (c)
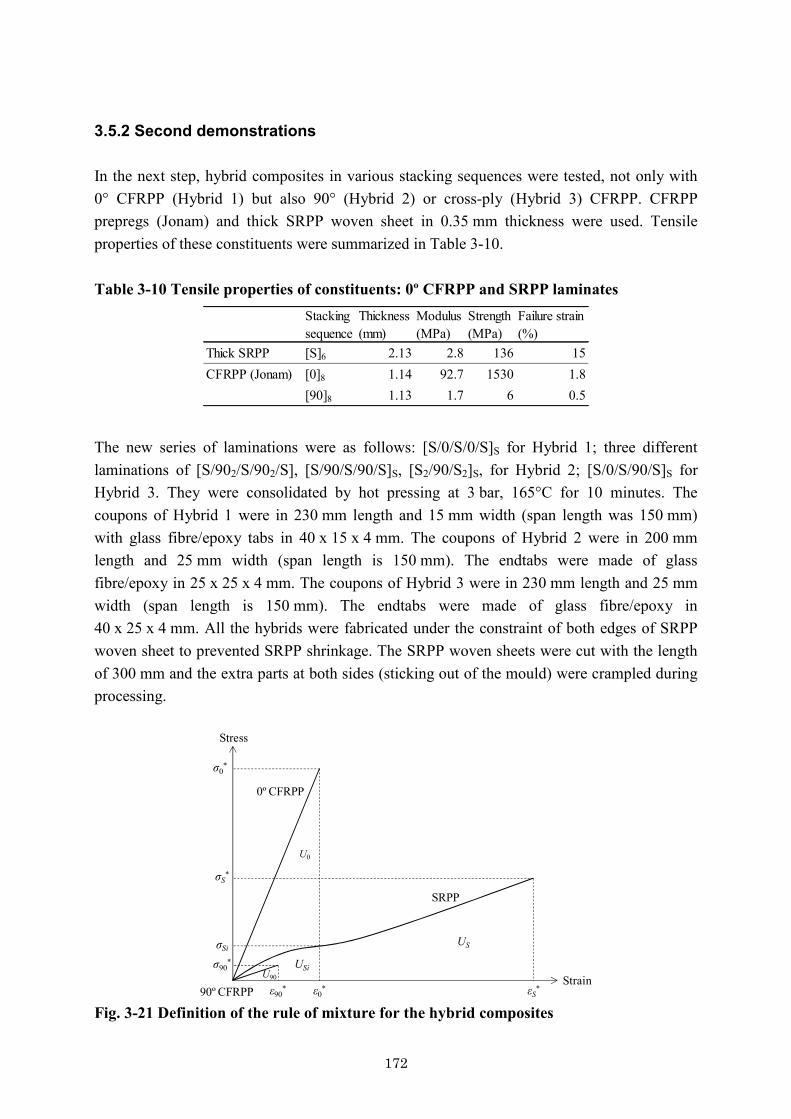
172
3.5.2 Second demonstrations In the next step, hybrid composites in various stacking sequences were tested, not only with 0° CFRPP (Hybrid 1) but also 90° (Hybrid 2) or cross-ply (Hybrid 3) CFRPP. CFRPP prepregs (Jonam) and thick SRPP woven sheet in 0.35 mm thickness were used. Tensile properties of these constituents were summarized in Table 3-10. Table 3-10 Tensile properties of constituents: 0º CFRPP and SRPP laminates
Stackingsequence
Thickness(mm)
Modulus(MPa)
Strength(MPa)
Failure strain(%)
Thick SRPP [S]6 2.13 2.8 136 15CFRPP (Jonam) [0]8 1.14 92.7 1530 1.8
[90]8 1.13 1.7 6 0.5 The new series of laminations were as follows: [S/0/S/0/S]S for Hybrid 1; three different laminations of [S/902/S/902/S], [S/90/S/90/S]S, [S2/90/S2]S, for Hybrid 2; [S/0/S/90/S]S for Hybrid 3. They were consolidated by hot pressing at 3 bar, 165°C for 10 minutes. The coupons of Hybrid 1 were in 230 mm length and 15 mm width (span length was 150 mm) with glass fibre/epoxy tabs in 40 x 15 x 4 mm. The coupons of Hybrid 2 were in 200 mm length and 25 mm width (span length is 150 mm). The endtabs were made of glass fibre/epoxy in 25 x 25 x 4 mm. The coupons of Hybrid 3 were in 230 mm length and 25 mm width (span length is 150 mm). The endtabs were made of glass fibre/epoxy in 40 x 25 x 4 mm. All the hybrids were fabricated under the constraint of both edges of SRPP woven sheet to prevented SRPP shrinkage. The SRPP woven sheets were cut with the length of 300 mm and the extra parts at both sides (sticking out of the mould) were crampled during processing.
0º CFRPP
SRPP
90º CFRPPStrain
Stress
ε0*ε90
* εS*
σ90*
σ0*
σSi
σS*
U0
U90
US
USi
Fig. 3-21 Definition of the rule of mixture for the hybrid composites
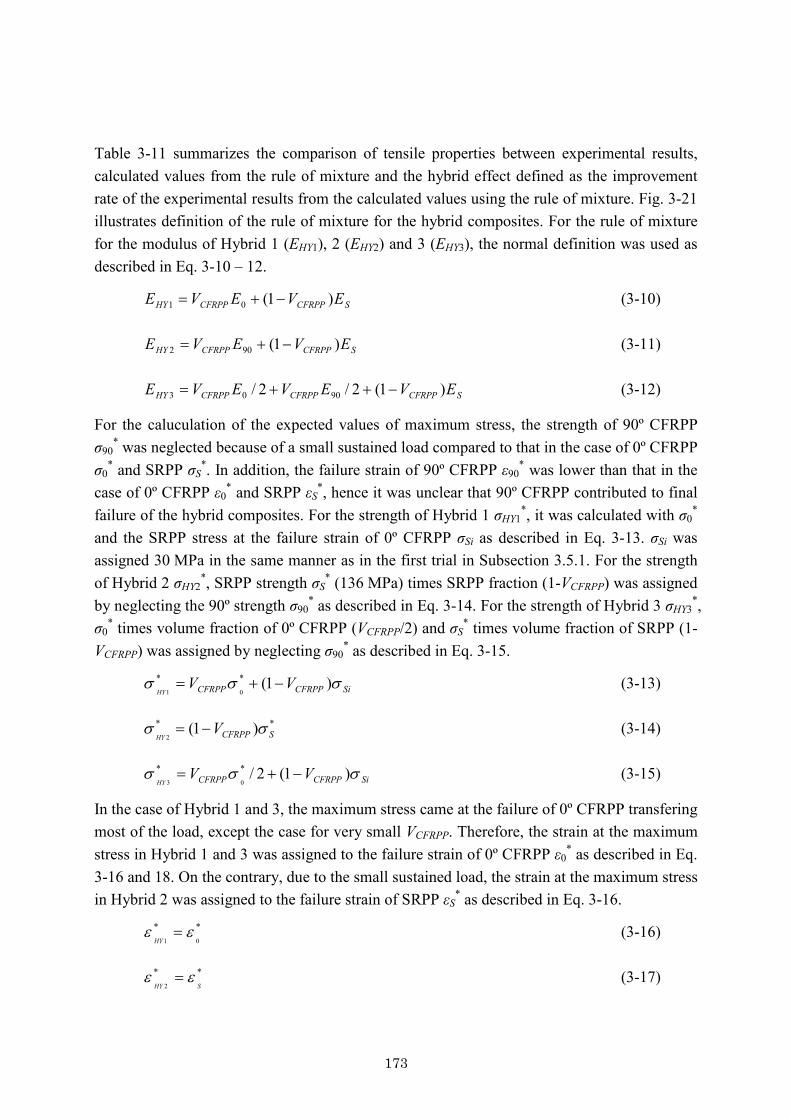
173
Table 3-11 summarizes the comparison of tensile properties between experimental results, calculated values from the rule of mixture and the hybrid effect defined as the improvement rate of the experimental results from the calculated values using the rule of mixture. Fig. 3-21 illustrates definition of the rule of mixture for the hybrid composites. For the rule of mixture for the modulus of Hybrid 1 (EHY1), 2 (EHY2) and 3 (EHY3), the normal definition was used as described in Eq. 3-10 – 12.
SCFRPPCFRPPHY EVEVE )1(01 -+= (3-10)
SCFRPPCFRPPHY EVEVE )1(902 -+= (3-11)
SCFRPPCFRPPCFRPPHY EVEVEVE )1(2/2/ 9003 -++= (3-12)
For the caluculation of the expected values of maximum stress, the strength of 90º CFRPP σ90
* was neglected because of a small sustained load compared to that in the case of 0º CFRPP σ0
* and SRPP σS*. In addition, the failure strain of 90º CFRPP ε90
* was lower than that in the case of 0º CFRPP ε0
* and SRPP εS*, hence it was unclear that 90º CFRPP contributed to final
failure of the hybrid composites. For the strength of Hybrid 1 σHY1*, it was calculated with σ0
* and the SRPP stress at the failure strain of 0º CFRPP σSi as described in Eq. 3-13. σSi was assigned 30 MPa in the same manner as in the first trial in Subsection 3.5.1. For the strength of Hybrid 2 σHY2
*, SRPP strength σS* (136 MPa) times SRPP fraction (1-VCFRPP) was assigned
by neglecting the 90º strength σ90* as described in Eq. 3-14. For the strength of Hybrid 3 σHY3
*, σ0
* times volume fraction of 0º CFRPP (VCFRPP/2) and σS* times volume fraction of SRPP (1-
VCFRPP) was assigned by neglecting σ90* as described in Eq. 3-15.
SiCFRPPCFRPP VVHY
sss )1(**01
-+= (3-13)
** )1(2 SCFRPPV
HYss -= (3-14)
SiCFRPPCFRPP VVHY
sss )1(2/**03
-+= (3-15)
In the case of Hybrid 1 and 3, the maximum stress came at the failure of 0º CFRPP transfering most of the load, except the case for very small VCFRPP. Therefore, the strain at the maximum stress in Hybrid 1 and 3 was assigned to the failure strain of 0º CFRPP ε0
* as described in Eq. 3-16 and 18. On the contrary, due to the small sustained load, the strain at the maximum stress in Hybrid 2 was assigned to the failure strain of SRPP εS
* as described in Eq. 3-16. **01
ee =HY
(3-16)
**2 SHY
ee = (3-17)
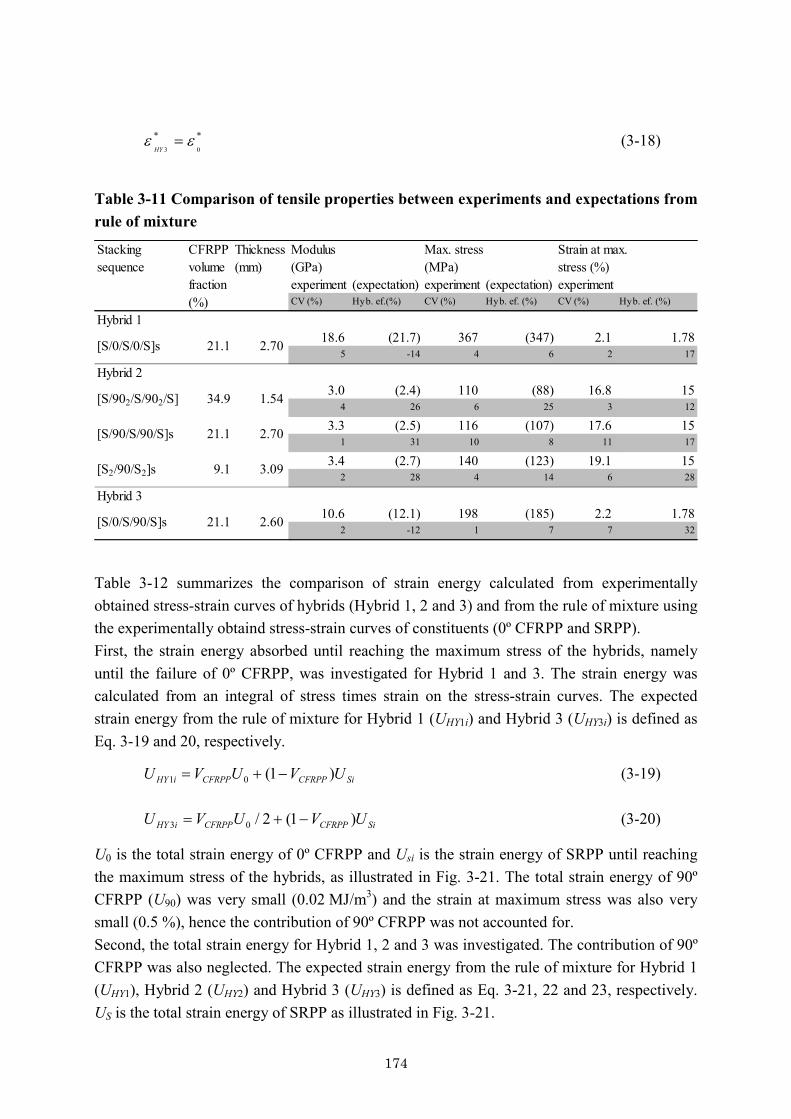
174
**03
ee =HY
(3-18)
Table 3-11 Comparison of tensile properties between experiments and expectations from rule of mixture
Stacking CFRPP Thickness Modulus Max. stress Strain at max.sequence volume (mm) (GPa) (MPa) stress (%)
fraction experiment (expectation) experiment (expectation) experiment(%) CV (%) Hyb. ef.(%) CV (%) Hyb. ef. (%) CV (%) Hyb. ef. (%)
Hybrid 118.6 (21.7) 367 (347) 2.1 1.78
5 -14 4 6 2 17
Hybrid 23.0 (2.4) 110 (88) 16.8 15
4 26 6 25 3 12
3.3 (2.5) 116 (107) 17.6 151 31 10 8 11 17
3.4 (2.7) 140 (123) 19.1 152 28 4 14 6 28
Hybrid 310.6 (12.1) 198 (185) 2.2 1.78
2 -12 1 7 7 32
21.1 2.70
34.9 1.54
[S/0/S/0/S]s
[S/902/S/902/S]
[S/0/S/90/S]s 21.1 2.60
2.7021.1
9.1 3.09
[S/90/S/90/S]s
[S2/90/S2]s
Table 3-12 summarizes the comparison of strain energy calculated from experimentally obtained stress-strain curves of hybrids (Hybrid 1, 2 and 3) and from the rule of mixture using the experimentally obtaind stress-strain curves of constituents (0º CFRPP and SRPP). First, the strain energy absorbed until reaching the maximum stress of the hybrids, namely until the failure of 0º CFRPP, was investigated for Hybrid 1 and 3. The strain energy was calculated from an integral of stress times strain on the stress-strain curves. The expected strain energy from the rule of mixture for Hybrid 1 (UHY1i) and Hybrid 3 (UHY3i) is defined as Eq. 3-19 and 20, respectively.
SiCFRPPCFRPPiHY UVUVU )1(01 -+= (3-19)
SiCFRPPCFRPPiHY UVUVU )1(2/03 -+= (3-20)
U0 is the total strain energy of 0º CFRPP and Usi is the strain energy of SRPP until reaching the maximum stress of the hybrids, as illustrated in Fig. 3-21. The total strain energy of 90º CFRPP (U90) was very small (0.02 MJ/m3) and the strain at maximum stress was also very small (0.5 %), hence the contribution of 90º CFRPP was not accounted for. Second, the total strain energy for Hybrid 1, 2 and 3 was investigated. The contribution of 90º CFRPP was also neglected. The expected strain energy from the rule of mixture for Hybrid 1 (UHY1), Hybrid 2 (UHY2) and Hybrid 3 (UHY3) is defined as Eq. 3-21, 22 and 23, respectively. US is the total strain energy of SRPP as illustrated in Fig. 3-21.

175
SCFRPPCFRPPHY UVUVU )1(01 -+= (3-21)
SCFRPPHY UVU )1(2 -= (3-22)
SCFRPPCFRPPHY UVUVU )1(2/03 -+= (3-23)
Fig. 3-22 illustrates the typical fracture coupons of SRPP and Hybrid 1, 2, 3. Table 3-12 Comparison of strain energy between experiments and expectations from rule of mixture Stacking CFRPPsequence volume fraction U HYi (MJ/m3) U HY (MJ/m3)
(%) experiment (expectation) Hyb. ef. (%) experiment (expectation) Hyb. ef. (%)
[S] 0 0.36 16.28[S]6 0 0.35 14.18[0]4 100 17.02 17.02Hybrid 1[S/0/S/0/S]s 21.1 4.03 3.87 4 8.08 14.78 -45
Hybrid 2[S/902/S/902/S] 34.9 10.43 9.23 13
[S/90/S/90/S]s 21.1 12.81 11.19 14
[S2/90/S2]s 9.1 14.88 12.89 15
Hybrid 3[S/0/S/90/S]s 21.1 2.33 2.07 13 9.02 12.98 -31
Strain energyStrain energy
a)
b)
c)
d)
Fig. 3-22 Fracture coupons of [S]6 (a), [S/0/S/0/S]S (b), [S/902/S/902/S] (c) and [S/0/S/90/S]S (d)
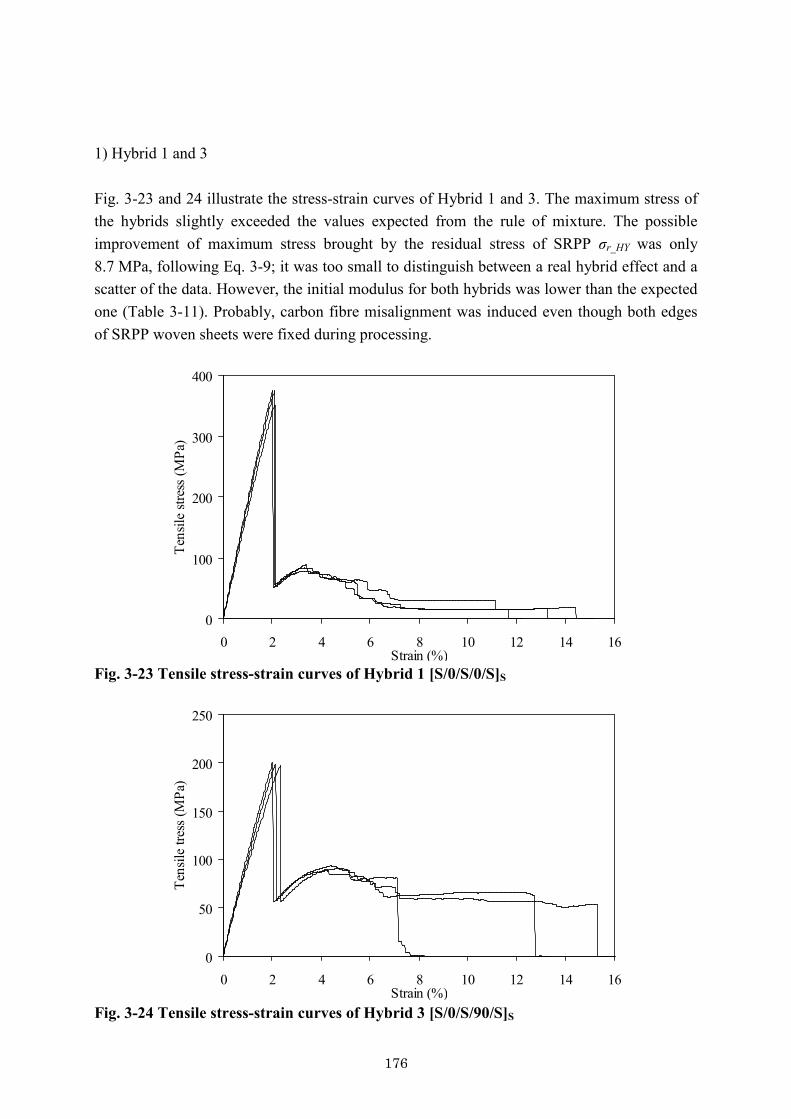
176
1) Hybrid 1 and 3 Fig. 3-23 and 24 illustrate the stress-strain curves of Hybrid 1 and 3. The maximum stress of the hybrids slightly exceeded the values expected from the rule of mixture. The possible improvement of maximum stress brought by the residual stress of SRPP σr_HY was only 8.7 MPa, following Eq. 3-9; it was too small to distinguish between a real hybrid effect and a scatter of the data. However, the initial modulus for both hybrids was lower than the expected one (Table 3-11). Probably, carbon fibre misalignment was induced even though both edges of SRPP woven sheets were fixed during processing.
Fig. 3-23 Tensile stress-strain curves of Hybrid 1 [S/0/S/0/S]S
Fig. 3-24 Tensile stress-strain curves of Hybrid 3 [S/0/S/90/S]S
0
50
100
150
200
250
0 2 4 6 8 10 12 14 16Strain (%)
Tens
ile tr
ess (
MPa
)
0
100
200
300
400
0 2 4 6 8 10 12 14 16Strain (%)
Tens
ile st
ress
(MPa
)
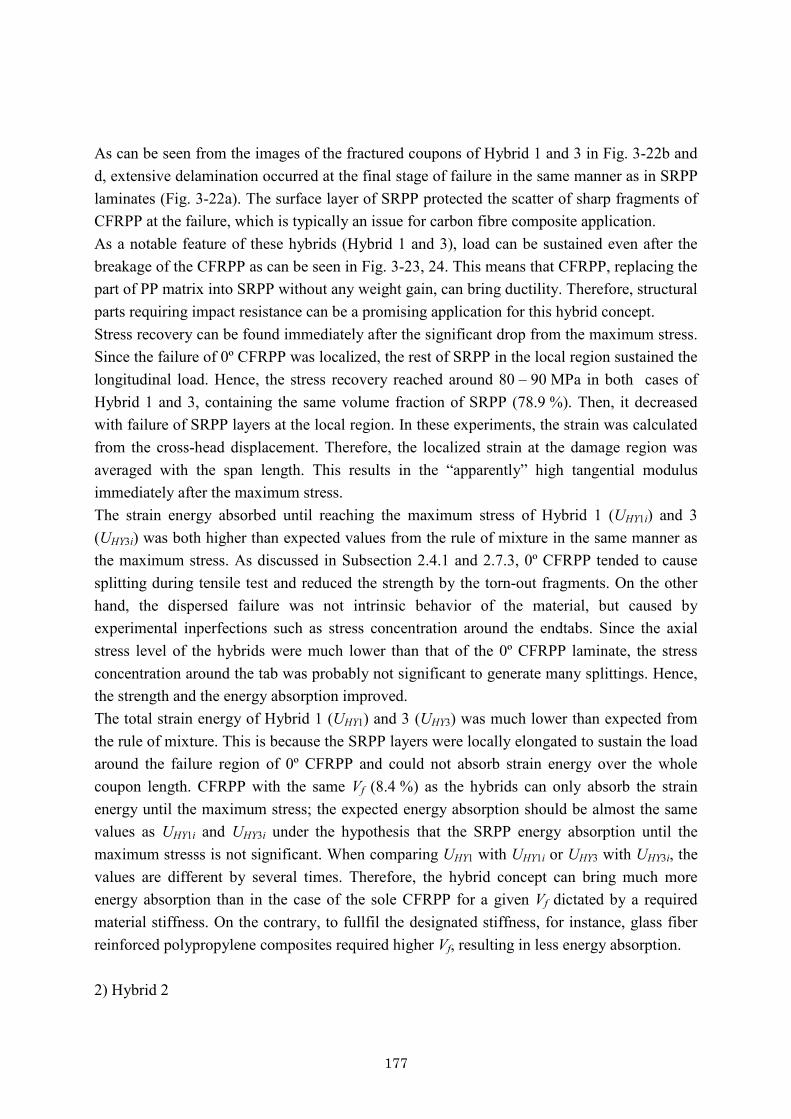
177
As can be seen from the images of the fractured coupons of Hybrid 1 and 3 in Fig. 3-22b and d, extensive delamination occurred at the final stage of failure in the same manner as in SRPP laminates (Fig. 3-22a). The surface layer of SRPP protected the scatter of sharp fragments of CFRPP at the failure, which is typically an issue for carbon fibre composite application. As a notable feature of these hybrids (Hybrid 1 and 3), load can be sustained even after the breakage of the CFRPP as can be seen in Fig. 3-23, 24. This means that CFRPP, replacing the part of PP matrix into SRPP without any weight gain, can bring ductility. Therefore, structural parts requiring impact resistance can be a promising application for this hybrid concept. Stress recovery can be found immediately after the significant drop from the maximum stress. Since the failure of 0º CFRPP was localized, the rest of SRPP in the local region sustained the longitudinal load. Hence, the stress recovery reached around 80 – 90 MPa in both cases of Hybrid 1 and 3, containing the same volume fraction of SRPP (78.9 %). Then, it decreased with failure of SRPP layers at the local region. In these experiments, the strain was calculated from the cross-head displacement. Therefore, the localized strain at the damage region was averaged with the span length. This results in the “apparently” high tangential modulus immediately after the maximum stress. The strain energy absorbed until reaching the maximum stress of Hybrid 1 (UHY1i) and 3 (UHY3i) was both higher than expected values from the rule of mixture in the same manner as the maximum stress. As discussed in Subsection 2.4.1 and 2.7.3, 0º CFRPP tended to cause splitting during tensile test and reduced the strength by the torn-out fragments. On the other hand, the dispersed failure was not intrinsic behavior of the material, but caused by experimental inperfections such as stress concentration around the endtabs. Since the axial stress level of the hybrids were much lower than that of the 0º CFRPP laminate, the stress concentration around the tab was probably not significant to generate many splittings. Hence, the strength and the energy absorption improved. The total strain energy of Hybrid 1 (UHY1) and 3 (UHY3) was much lower than expected from the rule of mixture. This is because the SRPP layers were locally elongated to sustain the load around the failure region of 0º CFRPP and could not absorb strain energy over the whole coupon length. CFRPP with the same Vf (8.4 %) as the hybrids can only absorb the strain energy until the maximum stress; the expected energy absorption should be almost the same values as UHY1i and UHY3i under the hypothesis that the SRPP energy absorption until the maximum stresss is not significant. When comparing UHY1 with UHY1i or UHY3 with UHY3i, the values are different by several times. Therefore, the hybrid concept can bring much more energy absorption than in the case of the sole CFRPP for a given Vf dictated by a required material stiffness. On the contrary, to fullfil the designated stiffness, for instance, glass fiber reinforced polypropylene composites required higher Vf, resulting in less energy absorption. 2) Hybrid 2

178
Hybrid 2 also exhibited hybrid effects in strength and failure strain. In addition, the initial modulus increased more than expected. It looks curious because normally the modulus strictly follows the rule of mixture. Fig. 3-25 compares the stress-strain curves of SRPP laminate [S]6 and Hybrid 2 [S/902/S/902/S]. Even though the modulus of 90° CFRPP was less than SRPP, the slope of the hybrid at small strain exceeded that of SRPP. To explain the cause of the modulus enhancement, two hypotheses were suggested: first, SRPP woven sheet had a large Poisson ratio; second, the modulus of SRPP could be increased by restricting the transverse contraction under tensile loading.
0
50
100
150
0 5 10 15 20Strain (%)
Tens
ile st
ress
(MPa
)
[S/902/S/902/S][S]6
Fig. 3-25 Comparison of tensile stress-strain curves between Hybrid 2 [S/902/S/902/S] and SRPP [S]6
0
0.1
0.2
0.3
0.4
0.5
0.6
0.7
0 2 4 6 8 10 12Strain (%)
Poiss
on ra
tio
[S]6[S2/90/S2]s[S/90/S/90/S]s
Fig. 3-26 Comparison of Poisson ratio between SRPP [S]6 and Hybrid 2 [S2/90/S2]S, [S/90/S/90/S]S

179
As a proof, the Poisson ratio was experimentally obtained using an extensometer set up in the direction of coupon width under tensile loading. The comparison between the pure SRPP laminate and the hybrids with 90° CFRPP is illustrated in Fig. 3-26. The Poisson ratio of SRPP was found to be very high, surprisingly more than 0.5 at small strains. On the other hand, by introducing 90° CFRPP layers, the Poisson ratio effectively decreased. The initial modulus of Hybrid 2 in loading direction EHY2 was predicted using the constituents’ properties. To consider the Poisson effect, not only the loading direction but also the transverse direction were accounted for. The stiffness matrix of Hybrid 2 KHY2 can be expressed in Eq. 3-24, where K90 and KS are the stiffness matrix of 90º CFRPP and SRPP, respectively; t90 and tS are the total thickness of 90° CFRPP and SRPP, respectively.
( ) S90HY2 KKK SS tttt +=+ 9090 (3-24)
The stiffness matrices can be described with the modulus and Poisson ratio of each component as indicated in Fig. 3-27. The modulus and Poisson ratio of SRPP woven sheet in the warp and weft direction are defined as equivalent. E0, E90, ES are initial moduli of 0°, 90° CFRPP and SRPP, respectively; ν0, ν90, νS are the Poisson ratios of 0° CFRPP, 90° CFRPP and SRPP, respectively.
90
0
ES, νS
ES, νS
E0, E90, ν0, ν90
tS/2
tS/2t90
, EHY2
Fig. 3-27 Schematic of hybrid laminate By solving Eq. 3-24 and transferring elastic constants in the stiffness matrix into engineering constants, EHY2 can be deduced as in Eq. 3-25.
÷÷ø
öççè
æ-+
+÷÷ø
öççè
æ-+
þýü
îíì
÷÷ø
öççè
æ-+
+÷÷ø
öççè
æ-+
-÷÷ø
öççè
æ-+
+÷÷ø
öççè
æ-+
=
290900
0
90
90
2
290900
090
90
90
290900
90
90
902
11
1111
S
S
S
S
S
S
SS
S
S
S
S
S
S
S
SHY E
tttE
ttt
Ett
tEtt
tE
tttE
tttE
nnn
nn
nnn
nnn (3-25)
The initial moduli for the three types of Hybrid 2, namely [S/902/S/902/S], [S/90/S/90/S]S, [S2/90/S2]S were predicted. The values for E0, E90, ES were tabulated in Table 3-10; t90 and tS were calculated from the CFRPP volume fraction shown in Table 3-11; ν0 was set as 0.34 and ν90 was calculated from ν0·E90/E0. The experimentally obtained modulus of the hybrids can be fit with νS = 0.54. Fig. 3-28 summarizes the relation between the CFRPP fraction and the
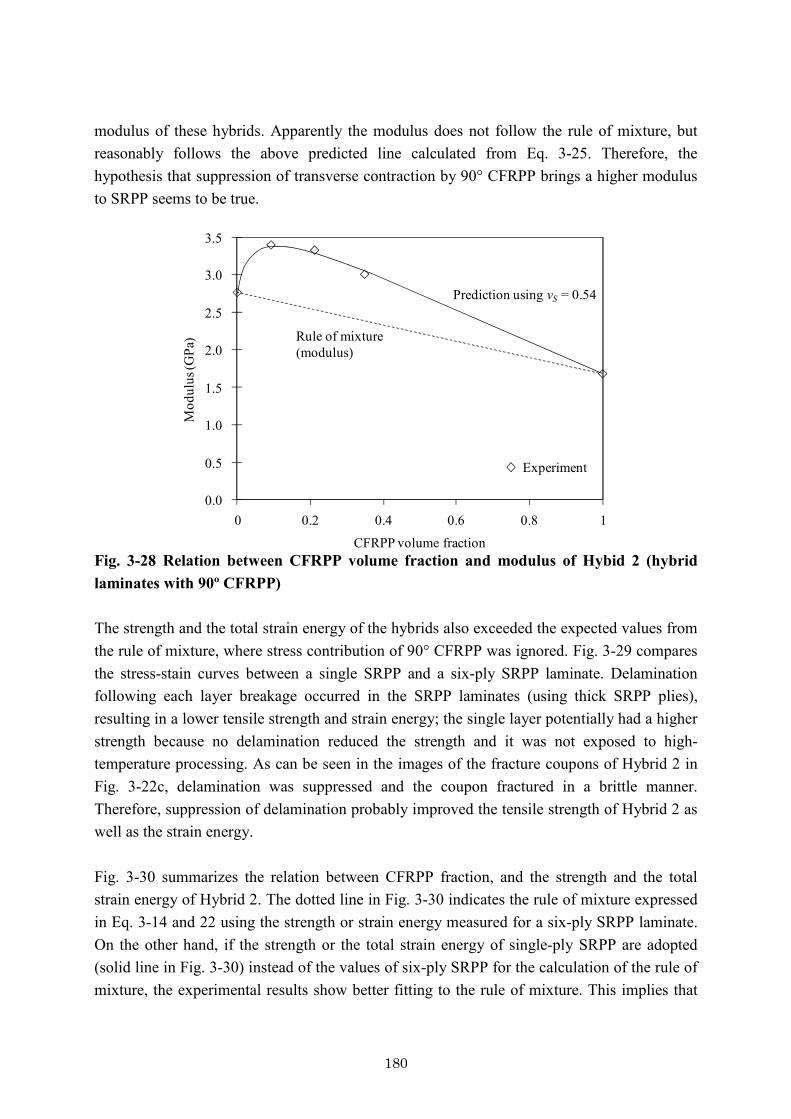
180
modulus of these hybrids. Apparently the modulus does not follow the rule of mixture, but reasonably follows the above predicted line calculated from Eq. 3-25. Therefore, the hypothesis that suppression of transverse contraction by 90° CFRPP brings a higher modulus to SRPP seems to be true.
0 0.2 0.4 0.6 0.8 1
CFRPP volume fraction
0.0
0.5
1.0
1.5
2.0
2.5
3.0
3.5
Mod
ulus
(GPa
)
Prediction using νS = 0.54
Rule of mixture(modulus)
Experiment
Fig. 3-28 Relation between CFRPP volume fraction and modulus of Hybid 2 (hybrid laminates with 90º CFRPP) The strength and the total strain energy of the hybrids also exceeded the expected values from the rule of mixture, where stress contribution of 90° CFRPP was ignored. Fig. 3-29 compares the stress-stain curves between a single SRPP and a six-ply SRPP laminate. Delamination following each layer breakage occurred in the SRPP laminates (using thick SRPP plies), resulting in a lower tensile strength and strain energy; the single layer potentially had a higher strength because no delamination reduced the strength and it was not exposed to high-temperature processing. As can be seen in the images of the fracture coupons of Hybrid 2 in Fig. 3-22c, delamination was suppressed and the coupon fractured in a brittle manner. Therefore, suppression of delamination probably improved the tensile strength of Hybrid 2 as well as the strain energy. Fig. 3-30 summarizes the relation between CFRPP fraction, and the strength and the total strain energy of Hybrid 2. The dotted line in Fig. 3-30 indicates the rule of mixture expressed in Eq. 3-14 and 22 using the strength or strain energy measured for a six-ply SRPP laminate. On the other hand, if the strength or the total strain energy of single-ply SRPP are adopted (solid line in Fig. 3-30) instead of the values of six-ply SRPP for the calculation of the rule of mixture, the experimental results show better fitting to the rule of mixture. This implies that
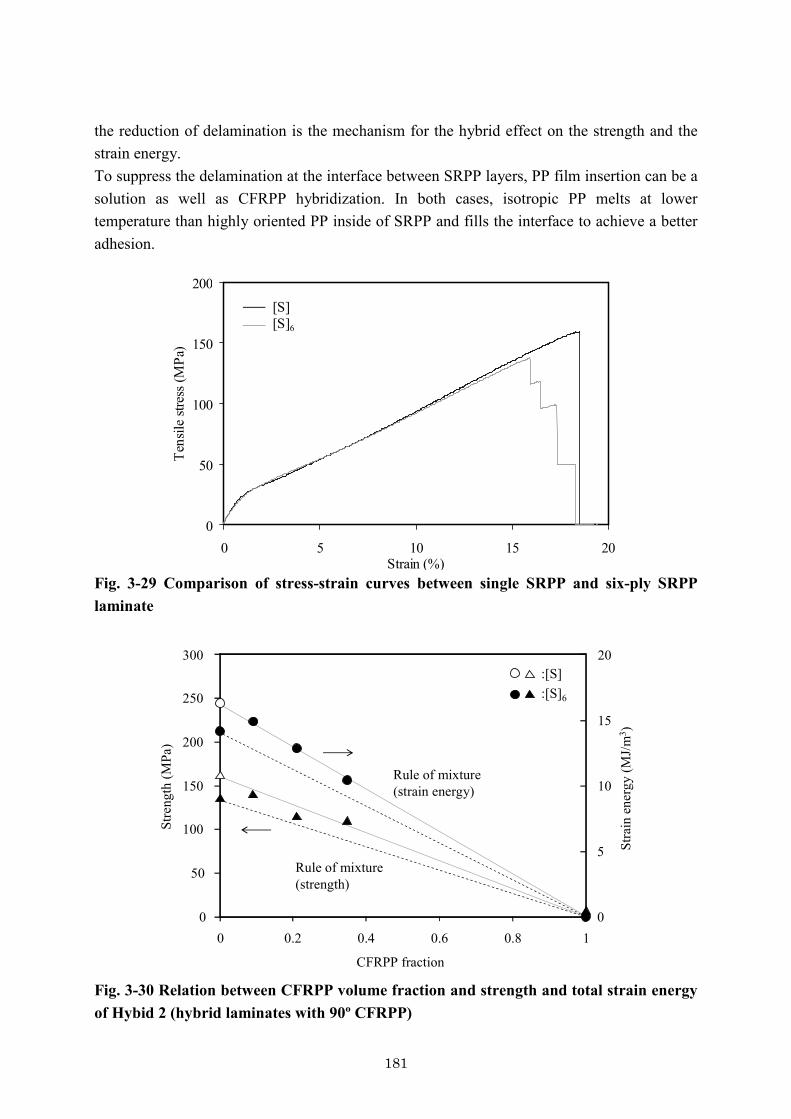
181
the reduction of delamination is the mechanism for the hybrid effect on the strength and the strain energy. To suppress the delamination at the interface between SRPP layers, PP film insertion can be a solution as well as CFRPP hybridization. In both cases, isotropic PP melts at lower temperature than highly oriented PP inside of SRPP and fills the interface to achieve a better adhesion.
0
50
100
150
200
0 5 10 15 20Strain (%)
Tens
ile st
ress
(MPa
)
[S][S]6
Fig. 3-29 Comparison of stress-strain curves between single SRPP and six-ply SRPP laminate
Rule of mixture(strain energy)
0
5
10
15
20
0
50
100
150
200
250
300
0 0.2 0.4 0.6 0.8 1
CFRPP fraction
Rule of mixture(strength)
Stre
ngth
(MPa
)
Stra
in e
nerg
y (M
J/m
3 )
:[S]:[S]6
Fig. 3-30 Relation between CFRPP volume fraction and strength and total strain energy of Hybid 2 (hybrid laminates with 90º CFRPP)
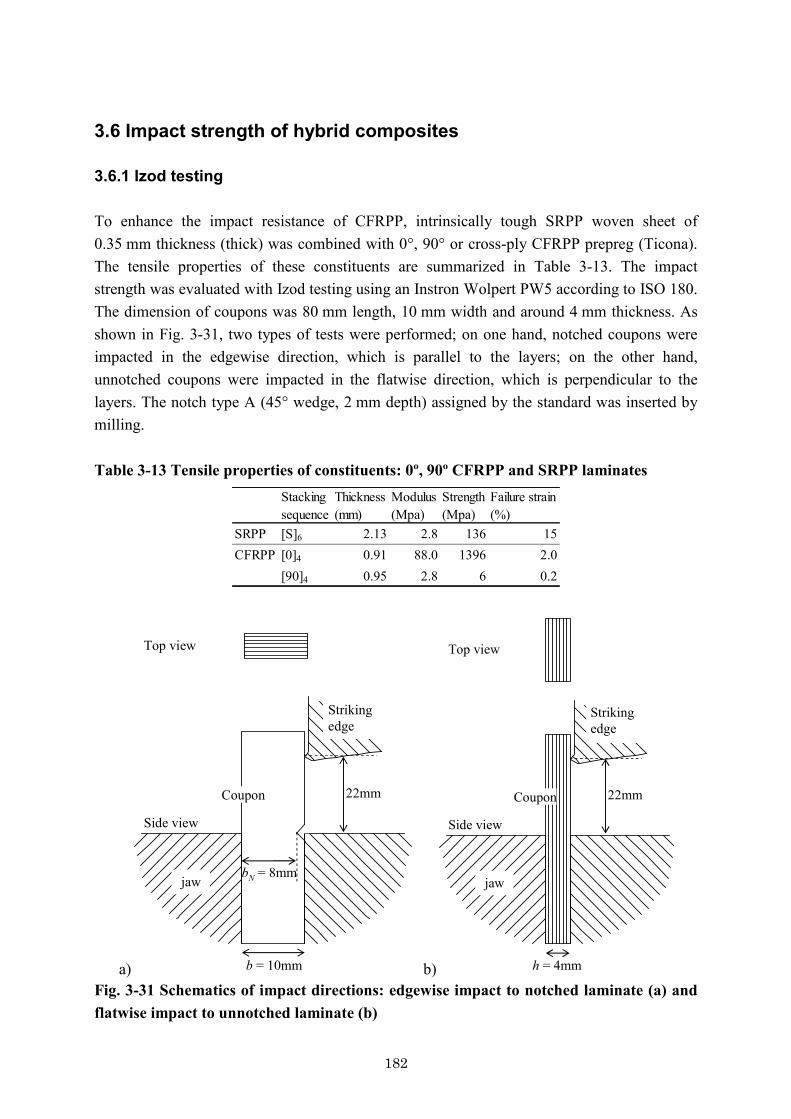
182
3.6 Impact strength of hybrid composites 3.6.1 Izod testing To enhance the impact resistance of CFRPP, intrinsically tough SRPP woven sheet of 0.35 mm thickness (thick) was combined with 0°, 90° or cross-ply CFRPP prepreg (Ticona). The tensile properties of these constituents are summarized in Table 3-13. The impact strength was evaluated with Izod testing using an Instron Wolpert PW5 according to ISO 180. The dimension of coupons was 80 mm length, 10 mm width and around 4 mm thickness. As shown in Fig. 3-31, two types of tests were performed; on one hand, notched coupons were impacted in the edgewise direction, which is parallel to the layers; on the other hand, unnotched coupons were impacted in the flatwise direction, which is perpendicular to the layers. The notch type A (45° wedge, 2 mm depth) assigned by the standard was inserted by milling. Table 3-13 Tensile properties of constituents: 0º, 90º CFRPP and SRPP laminates
Stackingsequence
Thickness(mm)
Modulus(Mpa)
Strength(Mpa)
Failure strain(%)
SRPP [S]6 2.13 2.8 136 15CFRPP [0]4 0.91 88.0 1396 2.0
[90]4 0.95 2.8 6 0.2
a)
22mmCoupon
Strikingedge
b = 10mm
bN = 8mm
Top view
Side view
jaw
b) h = 4mm
Coupon
Strikingedge
Top view
Side view
jaw
22mm
Fig. 3-31 Schematics of impact directions: edgewise impact to notched laminate (a) and flatwise impact to unnotched laminate (b)

183
The impact strength aiN (for notched, edgewise) and aiU (for unnotched, flatwise) were calculated by dividing the absorbed energy through the cross-section of the coupons as described with Eq. 3-26 and 27, respectively. W was input work, which was calculated as a difference of potential energy of the hammer before and after impact, h was the specimen thickness, b was the width and bN was the residual width after inserting a notch.
NiN hb
Wa = (3-26)
hbWaiU = (3-27)
Three series of interply hybrid composites, Hybrid 1, 2 and 3 were prepared. Hybrid 1 included 0° CFRPP, Hybrid 2 included 90° CFRPP and Hybrid 3 included cross-ply CFRPP. These series contained five different volume fractions of CFRPP (or SRPP) and the relation between the impact strength and the volume fraction of carbon fibre Vf was investigated. The expected impact strength was calculated using the rule of mixture. In the case of the hybrids subjected to tension, the constituent, which has the lower failure strain, often limits the strength as described in Subsection 1.2.6. However in Izod impact tests, it is unknown which constituent would limit the impact strength under the flexural load and the failure mechanisms would probably be complicated. Therefore, in this study, the rule of mixture of the impact strength was defined simply as a linear relation against Vf. Concretely, the straight line between the impact strength of 100 % CFRPP and that of 100 % SRPP described the rule of mixture. Stacking sequences of Hybrid 1, 2 and 3 in the five different Vf are summarized in Table 3-14. A coupon with Vf = 0 referred to the SRPP laminate, and was common for Hybrid 1, 2 and 3. Number of tests was three for each material. Table 3-14 List of stacking sequences applied Izod impact tests
V f (%) Hybrid 1 Hybrid 2 Hybrid 30 [S]12
8 [(S/0/S)2/S/(S/0/S)2] [(S/90/S)2/S/(S/90/S)2] [S/0/S2/90/S3/90/S2/0/S]16 [(S/02)2/S]S [(S/902)2/S]S [(S/0/90)2/S]S
24 [S/06/S/06/S] [S/906/S/906/S] [S(0/90)3/S/(90/0)3/S]33 [0]16 [90]16 [0/90]4S
The flexural rigidity (EI) had a strong influence on the impact resistance. Since all the coupons had almost the same thickness or residual width after inserting the notch, the flexural modulus became important. In this study, the flexural modulus was set to be linear relation to Vf by arranging the stacking sequences. This can make discussion easy about the influence of Vf and flexural modulus on the impact strength. In the case of the edgewise tests on notched coupons, the flexural modulus EfN can be calculated from the sum of flexural rigidity EiIi of each layer (i) divided by the bending moment of inertia of the coupon I as described in Eq. 3-28 and is proportional to Vf, where n, Ei, Ii, hi denote the number of layers, the Young’s

184
modulus of the i-th layer, the moment inartia of the i-th layer, the thickness of the i-th layer, respectively.
( )h
hE
hb
bhE
I
IEE
n
iii
N
n
iNii
n
iii
fN
ååå=== === 1
31
3
1
12/
12/ (3-28)
In the case of the flatwise tests on unnotched coupons, the flexural modulus EfU can also be calculated from the sum of EiIi of each layer (i) divided by the bending moment of inertia of the coupon I. If y axis is set in the thickness direction and 0 position is set at the neutral axis (namely symmetry plane), the bending moment of inertia of each layer (i) is strongly dependent on the stacking sequence (namely distance from the neutral axis), and not simply follows the tendency of Vf as described in Eq. 3-29, where yi_l and yi_u are the distance from the neutral axis to the lower side and to the upper side of each layer (i), respectively.
( )3
1
33
3
1
2
1__
_
_
4
12/ h
yyE
bh
dybyE
I
IEE
n
ii
n
i
y
yi
n
iii
fU
liui
ui
liåå òå=
==
-×=== (3-29)
As can be seen in Table 3-15 and Fig. 3-32, the bending modulus was fully proportional to Vf in the unnotched flatwise coupons, and almost proportional to Vf in the notched edgewise coupons. Table 3-15 Calculated flexural modulus of each stacking sequences in edgewise and flatwise direction (Unit is GPa)
V f
(%) Hybrid 1 Hybrid 2 Hybrid 3 Hybrid 1 Hybrid 2 Hybrid 30 2.8 2.88 23.3 2.8 11.7 24.2 2.8 21.116 44.4 2.8 21.3 39.9 2.8 25.224 65.9 2.8 30.8 51.0 2.8 32.233 88.0 2.8 45.4 88.0 2.8 53.5
Notched edgewise Unnotched flatwise
a)
0
20
40
60
80
100
0 8 16 24 32Vf (%)
Flex
ural
mod
ulus
(GPa
) Hybrid 1Hybrid 2Hybrid 3
CFRPP 100%SRPP 100%

185
b)
0
20
40
60
80
100
Flex
ural
mod
ulus
(GPa
) Hybrid 1Hybrid 2Hybrid 3
0 8 16 24 32Vf (%)
SRPP 100% CFRPP 100% Fig. 3-32 Relation between flexural modulus and Vf in edgewise (a) and flatwise (b) direction 3.6.2 Edgewise impact with notched laminates Impact strength on the notched coupons in the edgewise direction aiN for Hybrid 1, 2 and 3 for five different Vf is summarized in Table 3-16. The relation between the impact strength and Vf, and fracture morphologies are discussed for each hybrid series. Table 3-16 Izod impact strength of notched laminates of Hybrid 1, 2 and 3 in edgewise direction
V f
(%) (kJ/m2) CV (%) (kJ/m2) CV (%) (kJ/m2) CV (%)0 140 88 201 1 123 6 142 716 208 5 112 7 178 324 255 3 78 7 207 1233 266 6 5 100 217 17
Hybrid 3Hybrid 2Hybrid 1
1) Hybrid 1 Fig. 3-33 illustrates the relation between the impact strength and Vf for Hybrid 1, combining CFRPP oriented only in the 0º direction. The absorbed energy increased nearly proportional to Vf. Even in Izod impact tests, 0° CFRPP sustains most of the applied load (tensile modulus of SRPP is 2.8 GPa, CFRPP is 88.0 GPa); the global failure was controlled by 0° CFRPP. The fracture coupons were not divided into two parts at the notches after the tests as illustrated in Fig. 3-34. Generally, impact induced an opening mode force at the notch, resulting in tension failure. However, layers around the notch were delaminated and expanded; fiber breakage was not significant.
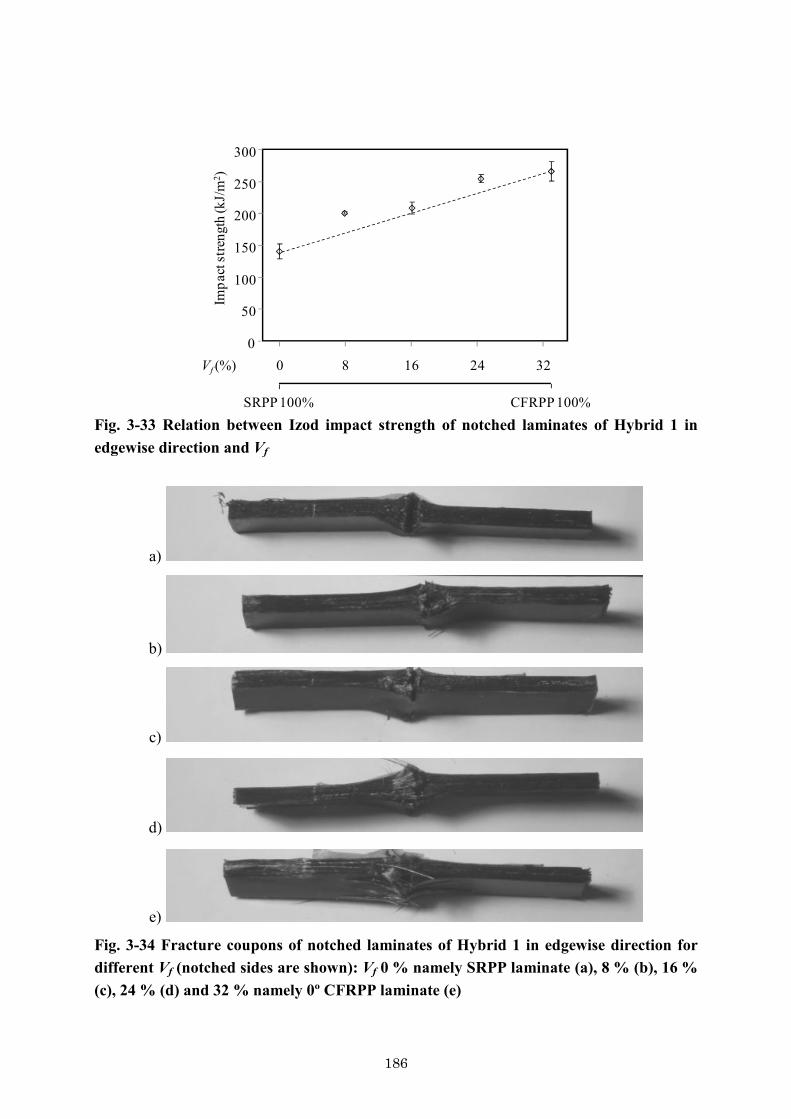
186
0
50
100
150
200
250
300
0 8 16 24 32Vf (%)
Impa
ct st
reng
th (k
J/m
2 )
SRPP 100% CFRPP 100% Fig. 3-33 Relation between Izod impact strength of notched laminates of Hybrid 1 in edgewise direction and Vf
a)
b)
c)
d)
e)
Fig. 3-34 Fracture coupons of notched laminates of Hybrid 1 in edgewise direction for different Vf (notched sides are shown): Vf 0 % namely SRPP laminate (a), 8 % (b), 16 % (c), 24 % (d) and 32 % namely 0º CFRPP laminate (e)
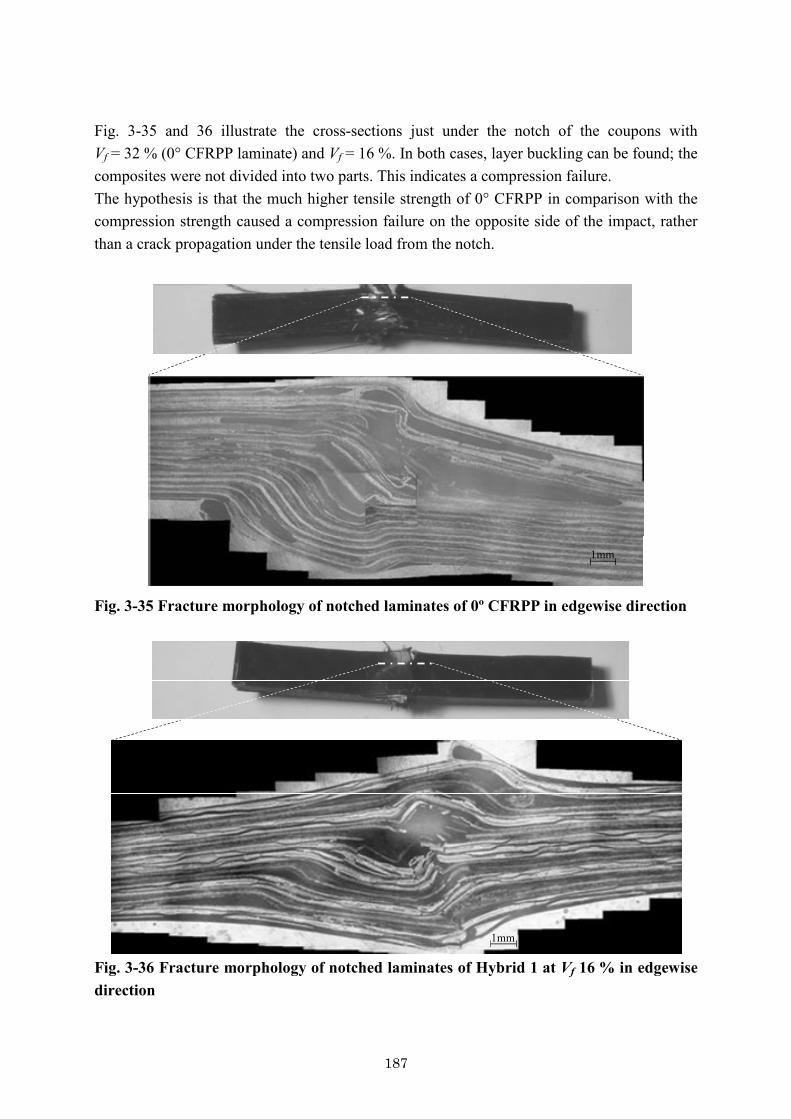
187
Fig. 3-35 and 36 illustrate the cross-sections just under the notch of the coupons with Vf = 32 % (0° CFRPP laminate) and Vf = 16 %. In both cases, layer buckling can be found; the composites were not divided into two parts. This indicates a compression failure. The hypothesis is that the much higher tensile strength of 0° CFRPP in comparison with the compression strength caused a compression failure on the opposite side of the impact, rather than a crack propagation under the tensile load from the notch.
1mm
Fig. 3-35 Fracture morphology of notched laminates of 0º CFRPP in edgewise direction
1mm
Fig. 3-36 Fracture morphology of notched laminates of Hybrid 1 at Vf 16 % in edgewise direction
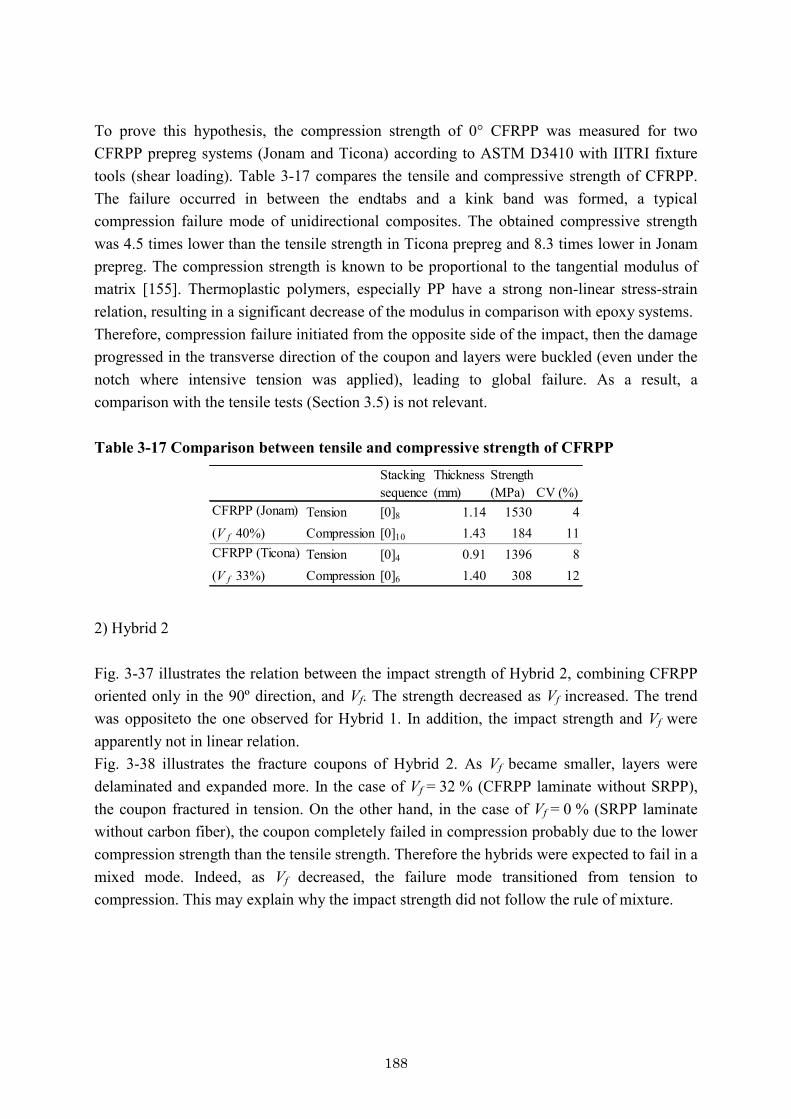
188
To prove this hypothesis, the compression strength of 0° CFRPP was measured for two CFRPP prepreg systems (Jonam and Ticona) according to ASTM D3410 with IITRI fixture tools (shear loading). Table 3-17 compares the tensile and compressive strength of CFRPP. The failure occurred in between the endtabs and a kink band was formed, a typical compression failure mode of unidirectional composites. The obtained compressive strength was 4.5 times lower than the tensile strength in Ticona prepreg and 8.3 times lower in Jonam prepreg. The compression strength is known to be proportional to the tangential modulus of matrix [155]. Thermoplastic polymers, especially PP have a strong non-linear stress-strain relation, resulting in a significant decrease of the modulus in comparison with epoxy systems. Therefore, compression failure initiated from the opposite side of the impact, then the damage progressed in the transverse direction of the coupon and layers were buckled (even under the notch where intensive tension was applied), leading to global failure. As a result, a comparison with the tensile tests (Section 3.5) is not relevant. Table 3-17 Comparison between tensile and compressive strength of CFRPP
Stacking Thicknesssequence (mm) (MPa) CV (%)
CFRPP (Jonam) Tension [0]8 1.14 1530 4(V f 40%) Compression [0]10 1.43 184 11CFRPP (Ticona) Tension [0]4 0.91 1396 8(V f 33%) Compression [0]6 1.40 308 12
Strength
2) Hybrid 2 Fig. 3-37 illustrates the relation between the impact strength of Hybrid 2, combining CFRPP oriented only in the 90º direction, and Vf. The strength decreased as Vf increased. The trend was oppositeto the one observed for Hybrid 1. In addition, the impact strength and Vf were apparently not in linear relation. Fig. 3-38 illustrates the fracture coupons of Hybrid 2. As Vf became smaller, layers were delaminated and expanded more. In the case of Vf = 32 % (CFRPP laminate without SRPP), the coupon fractured in tension. On the other hand, in the case of Vf = 0 % (SRPP laminate without carbon fiber), the coupon completely failed in compression probably due to the lower compression strength than the tensile strength. Therefore the hybrids were expected to fail in a mixed mode. Indeed, as Vf decreased, the failure mode transitioned from tension to compression. This may explain why the impact strength did not follow the rule of mixture.

189
0
50
100
150
200
250
300
Impa
ct st
reng
th (k
J/m
2 )
0 8 16 24 32Vf (%)
SRPP 100% CFRPP 100% Fig. 3-37 Relation between Izod impact strength of notched laminates of Hybrid 2 in edgewise direction and Vf
a)
b)
c)
d)
e) Fig. 3-38 Fracture coupons of notched laminates of Hybrid 2 in edgewise direction for different Vf (notched sides are shown): Vf 0 % namely SRPP laminate (a), 8 % (b), 16 % (c), 24 % (d) and 32 % namely 0º CFRPP laminate (e)
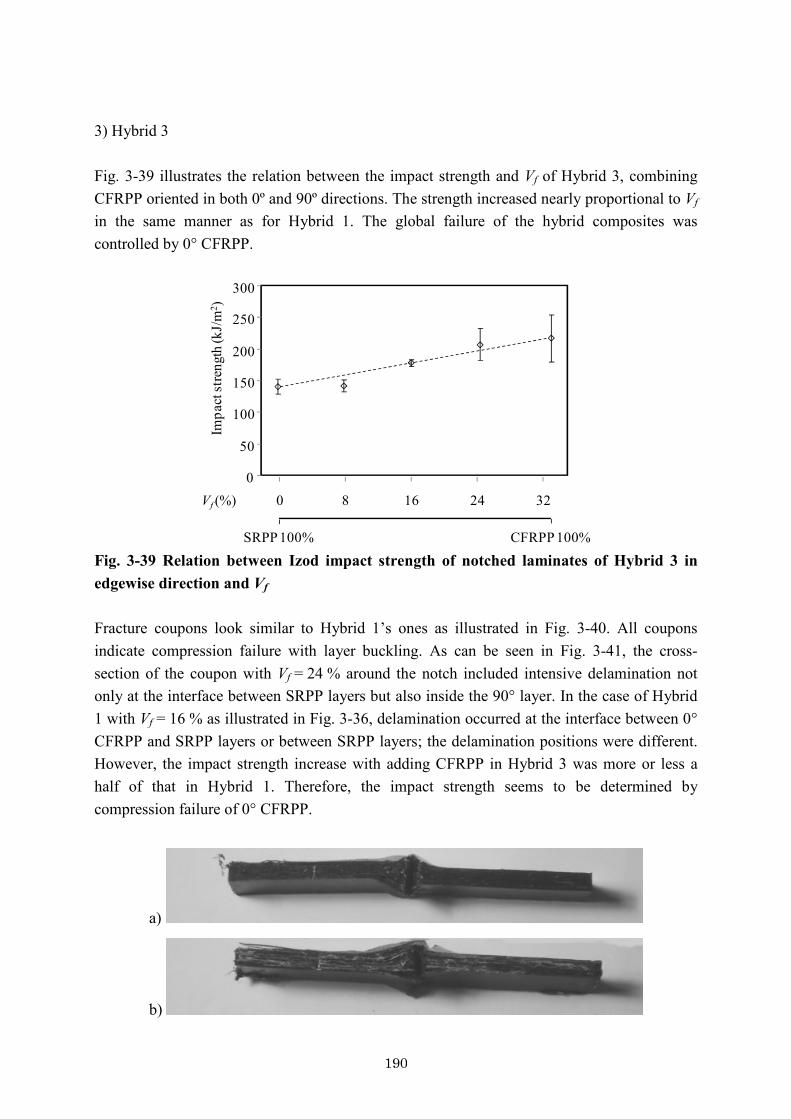
190
3) Hybrid 3 Fig. 3-39 illustrates the relation between the impact strength and Vf of Hybrid 3, combining CFRPP oriented in both 0º and 90º directions. The strength increased nearly proportional to Vf in the same manner as for Hybrid 1. The global failure of the hybrid composites was controlled by 0° CFRPP.
0
50
100
150
200
250
300
Impa
ct st
reng
th (k
J/m
2 )
0 8 16 24 32Vf (%)
SRPP 100% CFRPP 100% Fig. 3-39 Relation between Izod impact strength of notched laminates of Hybrid 3 in edgewise direction and Vf Fracture coupons look similar to Hybrid 1’s ones as illustrated in Fig. 3-40. All coupons indicate compression failure with layer buckling. As can be seen in Fig. 3-41, the cross-section of the coupon with Vf = 24 % around the notch included intensive delamination not only at the interface between SRPP layers but also inside the 90° layer. In the case of Hybrid 1 with Vf = 16 % as illustrated in Fig. 3-36, delamination occurred at the interface between 0° CFRPP and SRPP layers or between SRPP layers; the delamination positions were different. However, the impact strength increase with adding CFRPP in Hybrid 3 was more or less a half of that in Hybrid 1. Therefore, the impact strength seems to be determined by compression failure of 0° CFRPP.
a)
b)
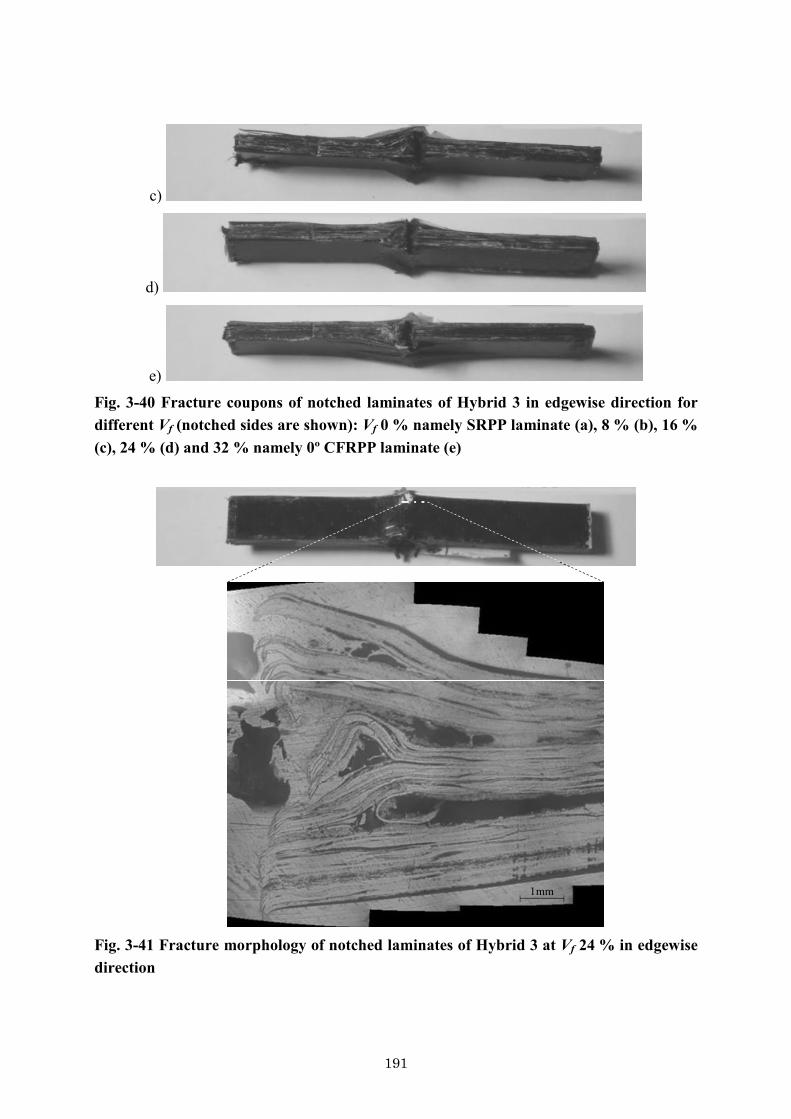
191
c)
d)
e)
Fig. 3-40 Fracture coupons of notched laminates of Hybrid 3 in edgewise direction for different Vf (notched sides are shown): Vf 0 % namely SRPP laminate (a), 8 % (b), 16 % (c), 24 % (d) and 32 % namely 0º CFRPP laminate (e)
1mm
Fig. 3-41 Fracture morphology of notched laminates of Hybrid 3 at Vf 24 % in edgewise direction

192
3.6.3 Flatwise impact with unnotched laminates The impact strength of the unnotched coupons tested in the flatwise direction aiU for Hybrid 1, 2 and 3 and for five different Vf is summarized in Table 3-18. The relation between the impact strength and Vf, and fracture morphologies are discussed for each hybrid series. Table 3-18 Izod impact strength of unnotched laminates of Hybrid 1, 2 and 3 in flatwise direction
V f
(%) (kJ/m2) CV (%) (kJ/m2) CV (%) (kJ/m2) CV (%)0 77 58 66 21 69 6 50 2516 104 7 59 3 58 624 111 14 40 7 40 733 122 21 1 12 57 7
Hybrid 1 Hybrid 2 Hybrid 3
1) Hybrid 1 Fig. 3-42 illustrates the relation between the impact strength and Vf of Hybrid 1, combining only CFRPP oriented in the 0º direction. The strength increased nearly proportional to Vf, except for the coupons with Vf 8 %. The impact strength was much lower than that of the notched coupons in the edgewise direction (Fig. 3-33).
0
25
50
75
100
125
150
Impa
ct st
reng
th (k
J/m
2 )
0 8 16 24 32Vf (%)
SRPP 100% CFRPP 100% Fig. 3-42 Relation between Izod impact strength of unnotched laminates of Hybrid 1 in flatwise direction and Vf Fig. 3-43 illustrates that the fracture coupons of the hybrids (namely Vf of 8, 16 and 24 %) exhibit many delaminations at the interface between SRPP layers. This failure mode implies that the interface between SRPP layers is weaker than that between SRPP and 0° CFRPP or in
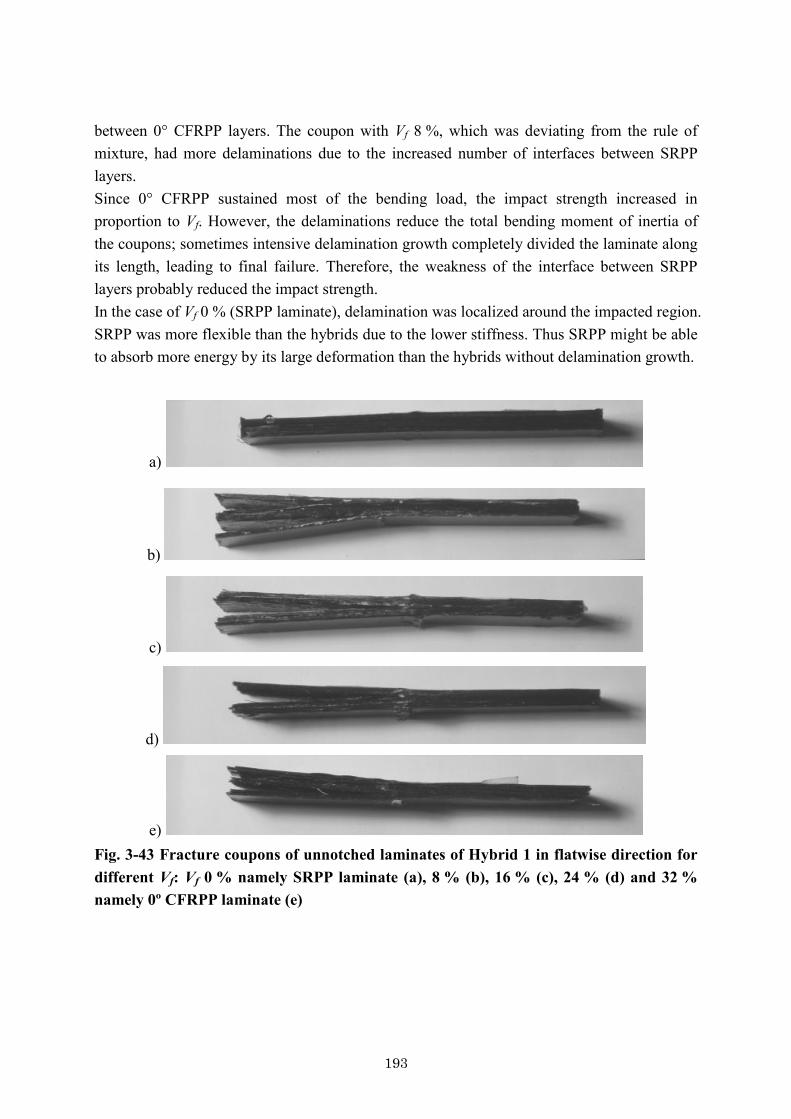
193
between 0° CFRPP layers. The coupon with Vf 8 %, which was deviating from the rule of mixture, had more delaminations due to the increased number of interfaces between SRPP layers. Since 0° CFRPP sustained most of the bending load, the impact strength increased in proportion to Vf. However, the delaminations reduce the total bending moment of inertia of the coupons; sometimes intensive delamination growth completely divided the laminate along its length, leading to final failure. Therefore, the weakness of the interface between SRPP layers probably reduced the impact strength. In the case of Vf 0 % (SRPP laminate), delamination was localized around the impacted region. SRPP was more flexible than the hybrids due to the lower stiffness. Thus SRPP might be able to absorb more energy by its large deformation than the hybrids without delamination growth.
a)
b)
c)
d)
e) Fig. 3-43 Fracture coupons of unnotched laminates of Hybrid 1 in flatwise direction for different Vf: Vf 0 % namely SRPP laminate (a), 8 % (b), 16 % (c), 24 % (d) and 32 % namely 0º CFRPP laminate (e)
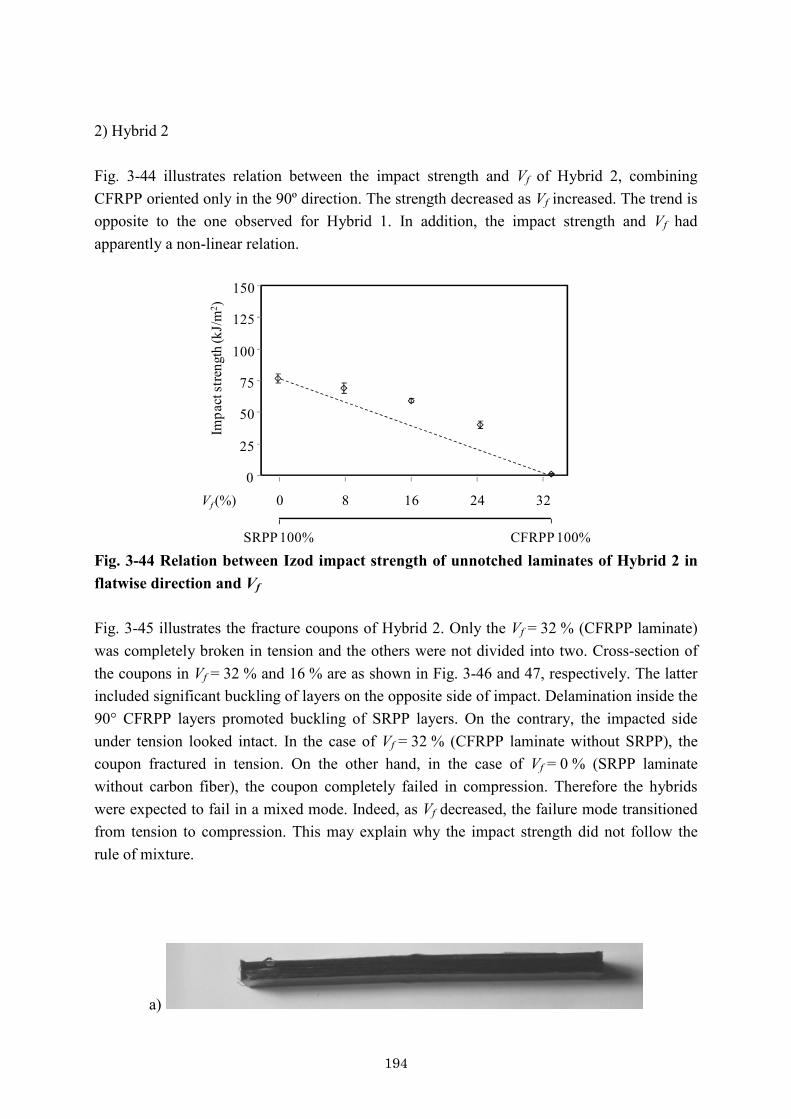
194
2) Hybrid 2 Fig. 3-44 illustrates relation between the impact strength and Vf of Hybrid 2, combining CFRPP oriented only in the 90º direction. The strength decreased as Vf increased. The trend is opposite to the one observed for Hybrid 1. In addition, the impact strength and Vf had apparently a non-linear relation.
0
25
50
75
100
125
150
Impa
ct st
reng
th (k
J/m
2 )
0 8 16 24 32Vf (%)
SRPP 100% CFRPP 100% Fig. 3-44 Relation between Izod impact strength of unnotched laminates of Hybrid 2 in flatwise direction and Vf Fig. 3-45 illustrates the fracture coupons of Hybrid 2. Only the Vf = 32 % (CFRPP laminate) was completely broken in tension and the others were not divided into two. Cross-section of the coupons in Vf = 32 % and 16 % are as shown in Fig. 3-46 and 47, respectively. The latter included significant buckling of layers on the opposite side of impact. Delamination inside the 90° CFRPP layers promoted buckling of SRPP layers. On the contrary, the impacted side under tension looked intact. In the case of Vf = 32 % (CFRPP laminate without SRPP), the coupon fractured in tension. On the other hand, in the case of Vf = 0 % (SRPP laminate without carbon fiber), the coupon completely failed in compression. Therefore the hybrids were expected to fail in a mixed mode. Indeed, as Vf decreased, the failure mode transitioned from tension to compression. This may explain why the impact strength did not follow the rule of mixture.
a)
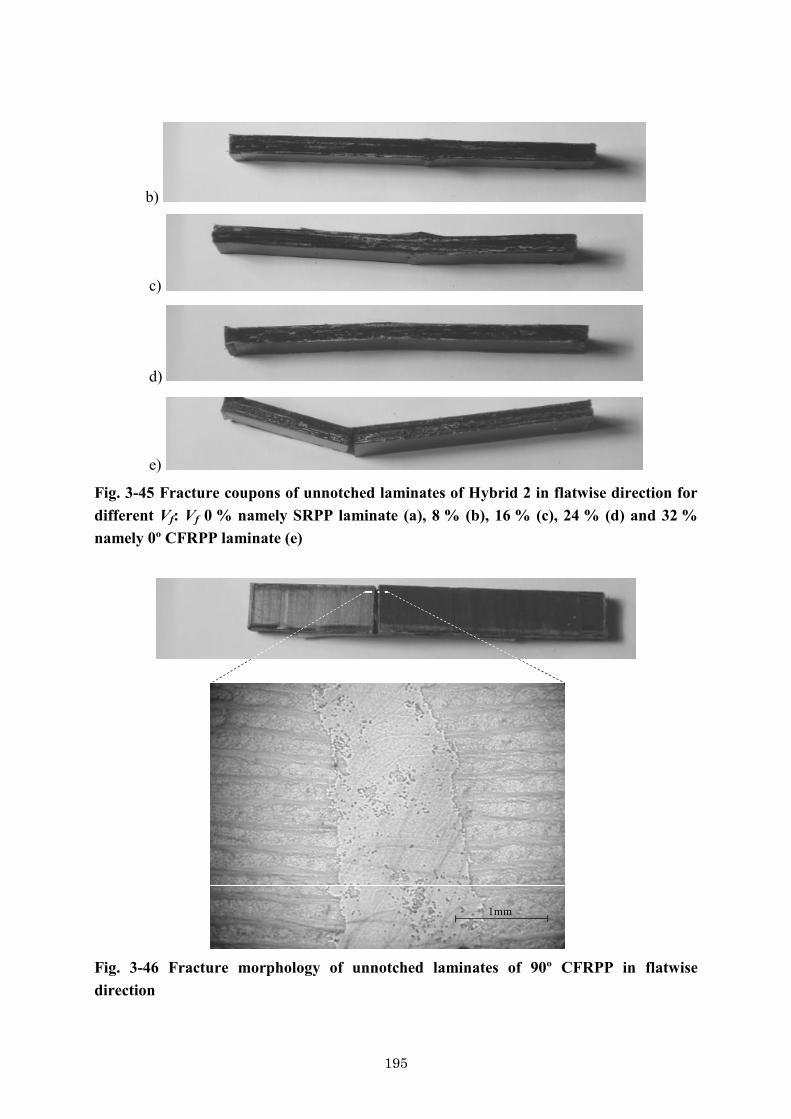
195
b)
c)
d)
e)
Fig. 3-45 Fracture coupons of unnotched laminates of Hybrid 2 in flatwise direction for different Vf: Vf 0 % namely SRPP laminate (a), 8 % (b), 16 % (c), 24 % (d) and 32 % namely 0º CFRPP laminate (e)
1mm
Fig. 3-46 Fracture morphology of unnotched laminates of 90º CFRPP in flatwise direction

196
1mm
Fig. 3-47 Fracture morphology of unnotched laminates of Hybrid 2 at Vf 16 % in edgewise direction 3) Hybrid 3 Fig. 3-48 illustrates the relation the between impact strength and Vf of Hybrid 3, combining CFRPP oriented in both 0º and 90º directions. An obvious correlation could not be found, but the strength slightly decreased as Vf increased.
0
25
50
75
100
125
150
Impa
ct st
reng
th (k
J/m
2 )
0 8 16 24 32Vf (%)
SRPP 100% CFRPP 100% Fig. 3-48 Relation between Izod impact strength of unnotched laminates of Hybrid 3 in flatwise direction and Vf

197
Fracture coupons illustrated in Fig. 3-49 indicate various delamination positions in each coupon. The weak 90° CFRPP layers were the main pass for the delamination, which reduced the total bending moment of inertia of the coupons, and sometimes extensive delamination growth completely divided the laminate through its length, leading to the final failure. Therefore, the volume fraction of 90° CFRPP took an important role on the impact strength. However, delamination in between SRPP layers or 0° CFRPP and SRPP competitively occurred, therefore the relation deviated from the rule of mixture.
a)
b)
c)
d)
e)
Fig. 3-49 Fracture coupons of unnotched laminates of Hybrid 3 in flatwise direction: Vf 0 %-SRPP (a), 8 % (b), 16 % (c), 24 % (d) and 32 %-cross-ply CFRPP (e) 3.6.4 Strength improvement SRPP layers themselves have a potential to absorb significant amount of the impact energy under tension. However, due to the weakness of the interface between the SRPP layers, significant delamination decreased the global impact resistance. In the case of impact in the edgewise direction applied to the notched coupons, especially Hybrid 1 and 3, the delamination accelerated buckling of the layers and led to compressive failure. In the case of impact in the flatwise direction applied to the unnotched coupons, especially Hybrid 1 and 3,
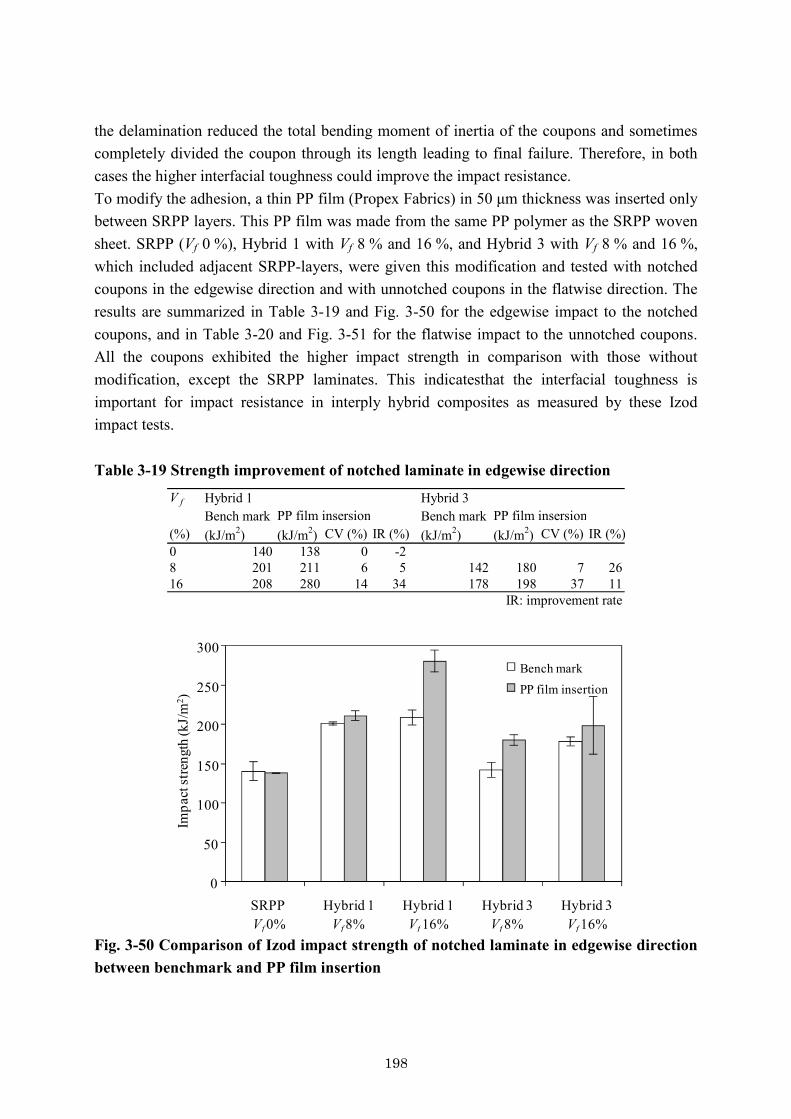
198
the delamination reduced the total bending moment of inertia of the coupons and sometimes completely divided the coupon through its length leading to final failure. Therefore, in both cases the higher interfacial toughness could improve the impact resistance. To modify the adhesion, a thin PP film (Propex Fabrics) in 50 μm thickness was inserted only between SRPP layers. This PP film was made from the same PP polymer as the SRPP woven sheet. SRPP (Vf 0 %), Hybrid 1 with Vf 8 % and 16 %, and Hybrid 3 with Vf 8 % and 16 %, which included adjacent SRPP-layers, were given this modification and tested with notched coupons in the edgewise direction and with unnotched coupons in the flatwise direction. The results are summarized in Table 3-19 and Fig. 3-50 for the edgewise impact to the notched coupons, and in Table 3-20 and Fig. 3-51 for the flatwise impact to the unnotched coupons. All the coupons exhibited the higher impact strength in comparison with those without modification, except the SRPP laminates. This indicatesthat the interfacial toughness is important for impact resistance in interply hybrid composites as measured by these Izod impact tests. Table 3-19 Strength improvement of notched laminate in edgewise direction
V f
Bench mark Bench mark(%) (kJ/m2) (kJ/m2) CV (%) IR (%) (kJ/m2) (kJ/m2) CV (%) IR (%)0 140 138 0 -28 201 211 6 5 142 180 7 2616 208 280 14 34 178 198 37 11
IR: improvement rate
PP film insersion PP film insersionHybrid 1 Hybrid 3
0
50
100
150
200
250
300
SRPPVf 0%
Hybrid 1Vf 8%
Hybrid 1Vf 16%
Hybrid 3Vf 8%
Hybrid 3Vf 16%
Impa
ct st
reng
th(k
J/m
2 )
Bench markPP film insertion
Fig. 3-50 Comparison of Izod impact strength of notched laminate in edgewise direction between benchmark and PP film insertion

199
Table 3-20 Strength improvement of unnotched laminate in flatwise direction
V f
Bench mark Bench mark(%) (kJ/m2) (kJ/m2) CV (%) IR (%) (kJ/m2) (kJ/m2) CV (%) IR (%)0 77 78 4 28 66 126 15 91 50 62 7 2416 104 111 6 6 58 85 17 47
IR: improvement rate
PP film insersion PP film insersionHybrid 1 Hybrid 3
0
25
50
75
100
125
150
SRPPVf 0%
Hybrid 1Vf 8%
Hybrid 1Vf 16%
Hybrid 3Vf 8%
Hybrid 3Vf 16%
Impa
ctst
reng
th (k
J/m
2 )
Bench mark
PP film insertion
Fig. 3-51 Comparison of Izod impact strength of unnotched laminate in flatwise direction between benchmark and PP film insertion
a)
b)
c)
Fig. 3-52 Fracture coupons of unnotched laminate of Hybrid 1 in flatwise direction with film insertion for different Vf: Vf 0 % namely SRPP laminate (a), 8 % (b), 16 % (c)
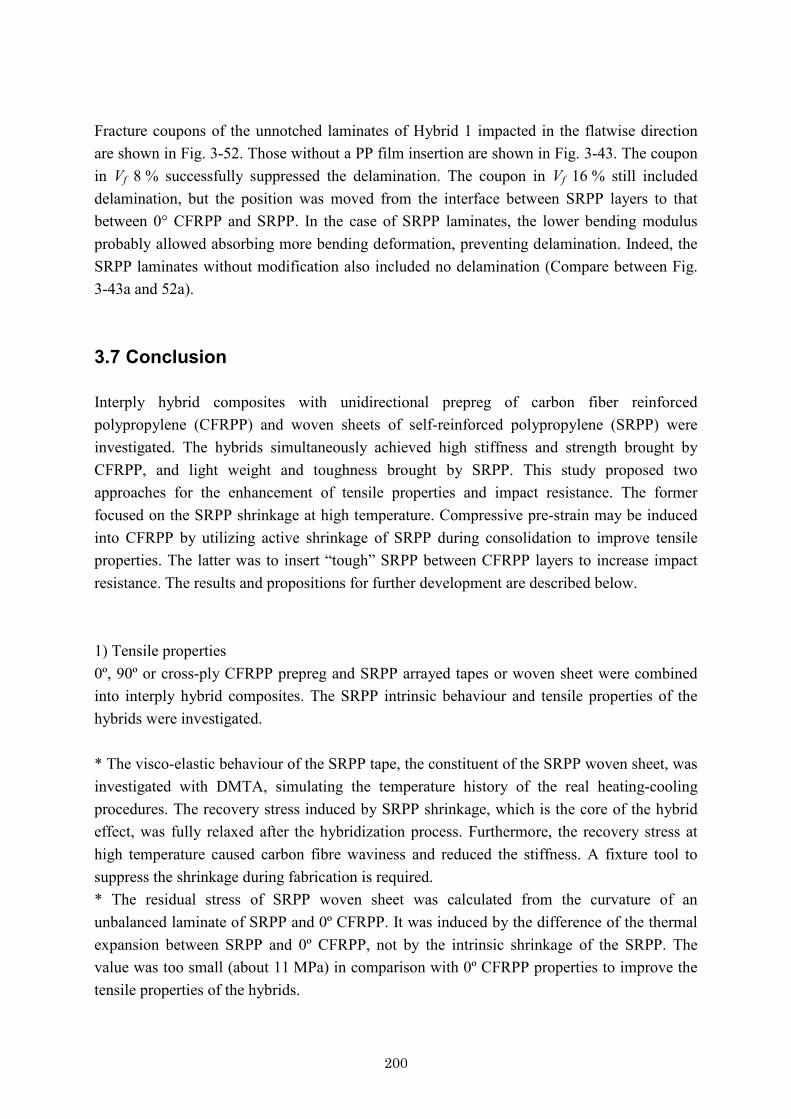
200
Fracture coupons of the unnotched laminates of Hybrid 1 impacted in the flatwise direction are shown in Fig. 3-52. Those without a PP film insertion are shown in Fig. 3-43. The coupon in Vf 8 % successfully suppressed the delamination. The coupon in Vf 16 % still included delamination, but the position was moved from the interface between SRPP layers to that between 0° CFRPP and SRPP. In the case of SRPP laminates, the lower bending modulus probably allowed absorbing more bending deformation, preventing delamination. Indeed, the SRPP laminates without modification also included no delamination (Compare between Fig. 3-43a and 52a). 3.7 Conclusion Interply hybrid composites with unidirectional prepreg of carbon fiber reinforced polypropylene (CFRPP) and woven sheets of self-reinforced polypropylene (SRPP) were investigated. The hybrids simultaneously achieved high stiffness and strength brought by CFRPP, and light weight and toughness brought by SRPP. This study proposed two approaches for the enhancement of tensile properties and impact resistance. The former focused on the SRPP shrinkage at high temperature. Compressive pre-strain may be induced into CFRPP by utilizing active shrinkage of SRPP during consolidation to improve tensile properties. The latter was to insert “tough” SRPP between CFRPP layers to increase impact resistance. The results and propositions for further development are described below. 1) Tensile properties 0º, 90º or cross-ply CFRPP prepreg and SRPP arrayed tapes or woven sheet were combined into interply hybrid composites. The SRPP intrinsic behaviour and tensile properties of the hybrids were investigated. * The visco-elastic behaviour of the SRPP tape, the constituent of the SRPP woven sheet, was investigated with DMTA, simulating the temperature history of the real heating-cooling procedures. The recovery stress induced by SRPP shrinkage, which is the core of the hybrid effect, was fully relaxed after the hybridization process. Furthermore, the recovery stress at high temperature caused carbon fibre waviness and reduced the stiffness. A fixture tool to suppress the shrinkage during fabrication is required. * The residual stress of SRPP woven sheet was calculated from the curvature of an unbalanced laminate of SRPP and 0º CFRPP. It was induced by the difference of the thermal expansion between SRPP and 0º CFRPP, not by the intrinsic shrinkage of the SRPP. The value was too small (about 11 MPa) in comparison with 0º CFRPP properties to improve the tensile properties of the hybrids.

201
* In the hybrids with 0º CFRPP, the tensile modulus/strength was the same as expected from the rule of mixture. In addition, a certain level of stress could be sustained even after breakage of the CFRPP layers. This brought much higher energy absorption than CFRPP with the same Vf and hence similar stiffness. On the contrary, the localized failure led to less energy absorption of SRPP than the value expected from the rule of mixture. Furthermore, dispersion of sharp fragments following carbon fibre breakage could be suppressed if 0º CFRPP was covered by SRPP. * In the case of hybrids with 90º CFRPP, the 90º CFRPP layers effectively suppressed the transverse contraction of the SRPP layers having high Poisson ratio during tensile loading. This increased the modulus of the hybrids in comparison with the expected values from the rule of mixture, while these improvements may not be significant in comparison with adding 0º CFRPP layers. * SRPP laminates reduced their strength by delamination following each layer breakage due to the weakness of the interface between SRPP layers. The insertion of a PP film or CFRPP prepreg between the SRPP layers is probably useful for achieving better adhesion and hence improving the composite strength. The latter happens because the isotropic PP polymer has a lower melting temperature than the highly oriented PP and is selectively melted and welded between SRPP layers, without an important loss of mechanical properties of the highly oriented PP in SRPP during the consolidation. * The recovery stress of highly oriented PP relaxed after the hybridization process. The highly oriented polymer having much higher glass transition temperature Tg than the semi-crystal PP (Tg of normal PP is less than room temperature) may stop relaxing the recovery stress during cooling and can be utilized for the residual stress to enhance the tensile properties of the hybrids. * Interply hybrid composites cannot significantly improve the tensile strength. On the other hand, direct hybridization between carbon fibres and highly oriented polymer fibres may increase the tensile strength, because of its higher matrix shear yield stress in comparison to that of isotropic polymer matrix. 2) Impact resistance 0º, 90º or cross-ply CFRPP prepreg and SRPP woven sheet were hybridized for five different Vf, and then Izod impact tests were performed in the edgewise direction on notched laminates and in the flatwise direction on unnotched laminates. * The 0º CFRPP layer sustained most of the load even in Izod impact, thus the impact strength increased roughly in proportion to Vf. This means that the addition of CFRPP simultaneously achieves a higher modulus and the toughness (as measured during the Izod test).

202
* The compression strength of a 0º CFRPP is much lower than its tensile strength. Therefore, the notched coupons subjected to impact in the edgewise direction initially failed in compression on the opposite side of the impactor rather than in tension at the notch; the layer buckling progressed in the transverse direction of the coupons, leading to global failure. The Izod tests can be a reference for applications in crush tubes, which have a similar failure mode. * The 90º CFRPP was weak in tension and SRPP was weak in compression. This combination changed failure mode as Vf changed. As Vf became higher, the impact strength decreased, but not proportionally. * In the case of the edgewise impact on the notched laminates, delaminations accelerated the buckling of layers, leading to compression failure. In the case of the flatwise impact on unnotched laminates, delamination reduced the total bending moment of inertia of the coupons; sometimes intensive delamination divided the laminate through its length, leading to final failure. Consequently, delamination took a significant role in the fracture of hybrids in Izod testing. The insertion of a matrix film enhanced the interfacial fracture toughness and hence successfully increased the impact resistance. * Delamination was easily caused in hybrids with 0º CFRPP because of high stiffness. On the contrary, SRPP laminate subjected to impact in the flatwise direction exhibited no delamination. The deformation of “soft” SRPP itself could broadly distribute the impact load. * A structure designed for bending does not fit to these hybrids because it cannot utilize the potential strength of both constituents. The weak interface between the layers easily causes delamination and the delamination decreases the impact strength. Even when the interfacial fracture toughness is improved, the compression strength of 0º CFRPP, which is much lower than its tensile strength, limits the global impact strength. Therefore, thin structures and tension based designs are suitable for these hybrids. * If carbon fibres and highly oriented polymer fibres can be combined next to each other (for instance by commingling), the matrix shear modulus is improved and hence, based on the results of this study, the composite compression strength is expected to increase. This can broaden the application of the hybrids, rather than the interply hybrids.

203
Chapter 4
General conclusion
This thesis discusses the mechanical properties of continuous carbon fibre reinforced thermoplastic composites. Two main subjects, micromechanics of carbon fibre reinforced thermoplastic composites (Chapter 2), and hybridization of carbon fibre reinforced polypropylene and self-reinforced polypropylene (Chapter 3) are respectively summarized in terms of outputs. Finally, future prospect of continuous carbon fibre reinforced thermoplastic composites is presented. 1) Micromechanics of carbon fibre reinforced thermoplastic composites Microscopic/global mechanical properties of unidirectional laminates, which are the basic constituents of composite materials, were analyzed for three matrix systems of carbon fibre/polypropylene (CF/PP), polyamide 6 (CF/PA6) and polyphenylene sulfide (CF/PPS). Since the mechanical properties of a semi-crystalline thermoplastic matrix are strongly influenced by crystallization, not only various types of matrix but also various cooling rates were experimentally evaluated. In addition, the tensile failure of the unidirectional laminates was modeled, taking into account the various aspects of the failure behaviour.
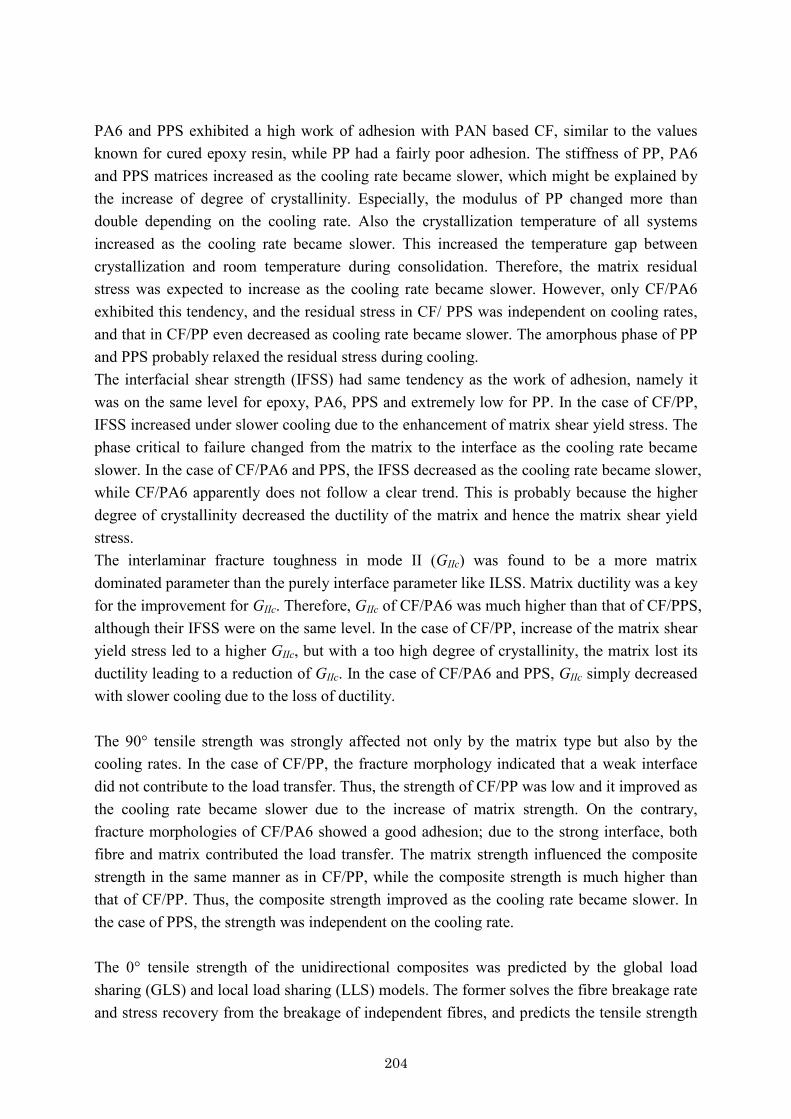
204
PA6 and PPS exhibited a high work of adhesion with PAN based CF, similar to the values known for cured epoxy resin, while PP had a fairly poor adhesion. The stiffness of PP, PA6 and PPS matrices increased as the cooling rate became slower, which might be explained by the increase of degree of crystallinity. Especially, the modulus of PP changed more than double depending on the cooling rate. Also the crystallization temperature of all systems increased as the cooling rate became slower. This increased the temperature gap between crystallization and room temperature during consolidation. Therefore, the matrix residual stress was expected to increase as the cooling rate became slower. However, only CF/PA6 exhibited this tendency, and the residual stress in CF/ PPS was independent on cooling rates, and that in CF/PP even decreased as cooling rate became slower. The amorphous phase of PP and PPS probably relaxed the residual stress during cooling. The interfacial shear strength (IFSS) had same tendency as the work of adhesion, namely it was on the same level for epoxy, PA6, PPS and extremely low for PP. In the case of CF/PP, IFSS increased under slower cooling due to the enhancement of matrix shear yield stress. The phase critical to failure changed from the matrix to the interface as the cooling rate became slower. In the case of CF/PA6 and PPS, the IFSS decreased as the cooling rate became slower, while CF/PA6 apparently does not follow a clear trend. This is probably because the higher degree of crystallinity decreased the ductility of the matrix and hence the matrix shear yield stress. The interlaminar fracture toughness in mode II (GIIc) was found to be a more matrix dominated parameter than the purely interface parameter like ILSS. Matrix ductility was a key for the improvement for GIIc. Therefore, GIIc of CF/PA6 was much higher than that of CF/PPS, although their IFSS were on the same level. In the case of CF/PP, increase of the matrix shear yield stress led to a higher GIIc, but with a too high degree of crystallinity, the matrix lost its ductility leading to a reduction of GIIc. In the case of CF/PA6 and PPS, GIIc simply decreased with slower cooling due to the loss of ductility. The 90° tensile strength was strongly affected not only by the matrix type but also by the cooling rates. In the case of CF/PP, the fracture morphology indicated that a weak interface did not contribute to the load transfer. Thus, the strength of CF/PP was low and it improved as the cooling rate became slower due to the increase of matrix strength. On the contrary, fracture morphologies of CF/PA6 showed a good adhesion; due to the strong interface, both fibre and matrix contributed the load transfer. The matrix strength influenced the composite strength in the same manner as in CF/PP, while the composite strength is much higher than that of CF/PP. Thus, the composite strength improved as the cooling rate became slower. In the case of PPS, the strength was independent on the cooling rate. The 0° tensile strength of the unidirectional composites was predicted by the global load sharing (GLS) and local load sharing (LLS) models. The former solves the fibre breakage rate and stress recovery from the breakage of independent fibres, and predicts the tensile strength
205
analytically. The latter considers interaction between adjacent fibres, but requires a numerical simulation. A strong interface, namely a high matrix shear yield stress τy, never decreases the composite strength under possible range of carbon fibre reinforced plastics (CFRP); the stress concentration around a cluster of broken fibres does not reduce the strength significantly. Therefore, the GLS model can predict the 0° tensile strength σL
* with reasonable accuracy in the range typical for CFRP parameters. It allows to evaluate explicitely the contribution of each parameter as follows. Let Vf be the fibre volume fraction, σ0 and m - the Weibull scaling parameter and modulus, respectively, and rf - the fibre radius. Then
11
11
10
* ,,, +-
++µ mf
my
mm
fL rV tss . (4-1)
Since m as well as σ0 strongly influences σL* especially in the range of CFRP, reliable Weibull
parameters should be selected for prediction of the tensile strength. Moreover, the scaling effect, which leads in the range of short fibres to a lower strength length than expected from the conventional Weibull equation, may have to be considered. The 0° tensile strength, normalized to Vf = 100 %, was compared for different material systems. CF/PA6 and CF/ductile epoxy exhibited the highest strength, CF/PPS exhibited the second highest, and CF/PP and CF/brittle epoxy exhibited the lowest strength. The cooling rate did not influence the strength because σL
* is a fibre dominated parameter as indicated in Eq. 4-1. The matrix shear yield stress τy as well as the IFSS, which represent matrix/interface features, contributed less than the Weibull parameters σ0 and m, but sometimes could not be neglected in terms of matrix difference. The IFSS (varying in a similar way as τy used in the prediction) of CF/PP was almost a half of CF/PA6. This indicated that CF/PP can be expected to have about 10 % less strength than CF/PA6 (in the case of m = 6.56), but the experiments showed that the difference is more than expected. By counting multi-axial load conditions at the interface, the matrix shear yield stress τy for brittle matrices seemed to reduce during tensile loading according to the Von Mises yield theory. This could explain the strength reduction in CF/PPS rather than CF/PA6 and CF/ductile epoxy. In the case of CF/PP and CF/brittle epoxy, intensive splitting during tensile loading discounted the strength. However, the splitting is never generated under tension if the composite had normal interfibre fracture toughness as CFRP; stress concentration around tab-ends, especially high tensile stress in perpendicular direction of fibre against the relatively weak transverse strength of unidirectional laminate caused the splitting. The strength reduction of CF/PP and CF/brittle epoxy did not fully come from material intrinsic properties. Softer tab material helped to suppress it, however low matrix shear yield stress of thermoplastic also induced more stress concentration than epoxy. In addition, the low matrix shear yield stress easily caused tab slippage due to the failure at the matrix rich region of composite surface.

206
Consequently, using current standards, it is difficult to measure accurately and reliably the potential strength in 0° tensile tests of thermoplastic composites, especially if they have a low matrix shear yield stress such as PP. 2) Hybridization of carbon fibre reinforced polypropylene and self-reinforced polypropylene Hybridization of carbon fibre reinforced polypropylene (CFRPP), having high modulus/strength, with self-reinforced polypropylene (SRPP), having superior toughness/low density, was demonstrated. The interply hybrids were investigated in tensile and impact tests. Izod impact tests were applied to notched coupons in edgewise direction and unnotched coupons in flatwise direction. As the tensile strength of 0° CFRPP was much higher than the compression strength, the hybrids failed in compression when bending stress was applied. The weak interface between SRPP layers caused buckling to help compression failure in the notched edgewise case and caused delamination to reduce flexure rigidity in the unnotched flatwise. By improving the interfacial toughness between SRPP layers, a higher impact strength was achieved in both cases, but still the low compression strength of 0° CFRPP limited the impact strength. Since SRPP intrinsically exhibited excellent tensile energy absorption, structures that was subject to bending are not suitable for utilizing the SRPP potential. In tensile tests, the hybrids achieved the modulus/strength values as expected from the rule of mixture. Moreover, they continuously sustained a certain load even after 0° CFRPP breakage, while the localized failure prevents fully utilizing the potential energy absorption of SRPP. In addition, surface SRPP layers prevent scattering of sharp fragments of CFRPP. CF in transverse direction effectively suppressed the Poisson contraction of SRPP under tension and realised the highest stiffness increase for the CFRPP-SRPP hybrids. This was an attractive hybrid effect, while this effect was not remarkable in the combination with high stiffness 0° CFRPP. Consequently, a structure subjected to impact in the tensile direction was a promising application for the hybrids. SRPP showed shrinkage behavior at high temperature. This generated a recovery stress under consolidation of hybrids and applied a compressive residual stress inside the CFRPP. However, the stress was fully relaxed after cooling and could not be utilized for mechanical improvement. On the contrary, the shrinkage at high temperature easily caused misalignment of CF in molten matrix, resulting in low modulus/strength of the composite. Therefore, fabrication of hybrids required fixation of the material edges.
207
3) Future prospect of continuous carbon fibre reinforced thermoplastic composites Even though the impregnation process has difficulties, various merits such as fast fabrication cycle and recyclability probably accelerate the applications of continuous CFRTP. To improve the strength of CFRTP in the fibre direction, a strong interface between carbon fibre and matrix is the key. Even if the fracture morphology after the tensile test reveals that the fibres are covered with matrix, this is not the proof of a strong interface but only indicates that the interfacial shear strength is higher than matrix shear yield stress. The matrix and interface properties should be compatible at a high level. Especially, the interface region around broken fibres (interface and local matrix) is subjected to a higher shear stress than the surrounding matrix, hence the efficiency of shear load transfer is limited by the interfacial properties. A modification of the interface region might be more beneficial than a uniform modification of the matrix. In addition, this research suggests that the combination of the relatively low matrix shear yield stress and the relatively high modulus, typically in brittle matrix systems such as PPS, may reduce the tensile strength. In that sense, it is reasonable that epoxy, which can be toughened with addition of toughening agents and has a good adhesion, is preferentially and extensively used as the partner for carbon fibres. Therefore, matrices having a good adhesion with carbon fibres and a high toughness such as PA6 and PEEK, can also be candidates for CFRTP system. On the other hand, since the strength of CFRTP in the transverse direction is mainly controlled by the matrix properties as well as the interface properties, the processing conditions, especially the cooling rate, have a strong influence. The high strength of matrix and interface is much more important for the transverse strength of CFRTP rather then for the strength in fibre direction. Further investigations are required on properties that are yet explored less than in conventional thermoset systems, especially the compressive and fatigue properties. These might be more sensitive to matrix/interface properties, and hence to process conditions, than the tensile properties. The interply hybrid composites of CFRPP and SRPP can achieve higher stiffness and strength than the sole SRPP laminate, as expected from the rule of mixture. In addition, the hybrids exhibit a much higher energy absorption than that of CFRPP with the same Vf; because a certain load can be sustained after reaching the maximum stress (when the brittle carbon fibres farcture). To fully utilize the material potential of the hybrids in terms of energy absorption, an appropriate application with the prevailing tension loading (not flexure) is required because the compressive strength of polypropylene matrix composites is much lower than its tensile strength. This hybrid concept can be extended to the other CFRTP and highly oriented thermoplastic polymers. In addition, if highly oriented polymer fibres and carbon fibres are

208
commingled and hybridized by means of the selectively molten surface of the oriented polymer fibres, a higher matrix shear yield stress and higher matrix shear modulus in comparison to isotropic polymer matrix may be achieved; this simultaneously leads to the improvement of the tensile and compressive strength of CFRTP in fibre direction.
209
References
[1] I. Taketa, J. Ustarroz, L. Gorbatikh, S.V. Lomov, I. Verpoest, Interply hybrid
composites with carbon fiber reinforced polypropylene and self-reinforced polypropylene, Composites Part A, 41 (2010), 927-932.
[2] H. Darcy, Les Fontaines Publiques de la Ville de Dijon, Dalmont, Paris (1856). [3] V. Michaud, A. Mortensen, Infiltration processing of fibre reinforced composites:
governing phenomena, Composites: Part A, 32 (2001) 981-996. [4] B.R. Gebart, Permeability of unidirectional reinforcements for RTM, Journal of
Composite Materials, 26 (1992), 1100-1133. [5] V. Michaud, J.-A.E. Månson, Impregnation of compressible fibre mats with a
thermoplastic resin. Part I: theory. Journal of Composite Materials, 35 (2001), 1150-1173.
[6] V. Michaud, R. Törnqvist, J.-A.E. Månson, Impregnation of compressible fibre mats with a thermoplastic resin. Part II: experiments. Journal of Composite Materials, 35 (2001), 1174-1200.
[7] J. Wolfrath, V. Michaud, J.-A.E. Månson, Deconsolidation in glass mat thermoplastic composites: Analysis of the mechanisms, Composites Part A, 36 (2005), 1608-1616.
[8] K. van Rijswijk, H.E.N. Bersee, Reactive processing of textile fiber-reinforced thermoplastic composites - An overview, Composites Part A, 38 (2007), 666–681.
[9] P. Ó Máirtín, P. McDonnell, M.T. Connor, R. Eder, C.M. Ó Brádaigh, Process investigation of a liquid PA-12/carbon fibre moulding system, Composites Part A, 32 (2001), 915-923.
[10] Parton, H., Baets, J., Lipnik, P., Goderis, B., Devaux, J., and Verpoest, I., Properties of poly(butylene terephthatlate) polymerized from cyclic oligomers and its composites. Polymer, 2005. 46(23): p. 9871-9880.
[11] H. Yoon, K. Takahashi, Mode I interlaminar fracture toughness of commingled carbon fibre/PEEK composites, Journal of Materials Science, 28 (1993), 1849-1855
[12] B. Lauke, U. Bunzel, K. Schneider, Effect of hybrid yarn structure on the delamination behaviour of thermoplastic composites, Composites Part A, 29 (1998), 1397-1409.
[13] N. Bernet, V. Michaud, P.E. Bourban, J.-A.E. Månson, Commingled yarn composites for rapid processing of complex shapes, Composites Part A, 32 (2001), 1613-1626.
[14] M.D. Wakeman, L. Zingraff, P.E. Bourban, J.-A.E. Månson, P. Blanchard, Stamp forming of carbon fibre/PA12 composites – A comparison of a reactive impregnation process and a commingled yarn system, Composites Science and Technology, 66 (2006), 19-35.

210
[15] J.D. Muzzy, Thermoplastics – Properties, Comprehensive Composite Materials, 2 (2000), 57-76.
[16] HexPly® M10 and F593, Product Data from Hexcel. [17] E. Mäder, K. Grundke, H.-J. Jacobasch, G. Wachinger, Surface, interphase and
composite property relations in fibre-reinforced polymers, Composites, 25 (1994), 739-744.
[18] S.Y. Fu, B. Lauke, E. Mäder, X. Hu, C.Y. Yue, Fracture resistance of short-glass-fiber-reinforced and short-carbon-fiber-reinforced polypropylene under Charpy impact load and its dependence on processing, Journal of Materials Processing Technology, 89-90 (1999), 501-507.
[19] S.-Y. Fu, B. Lauke, E. Mäder, C.-Y. Yue, X. Hu, Tensile properties of short-glass-fiber- and short-carbon-fiber-reinforced polypropylene composites, Composites Part A, 31 (2000), 1117-1125.
[20] P.J. Hine, B. Brew, R.A. Duckett, I.M. Ward, Failure mechanisms in continuous carbon-fibre reinforced PEEK composites, Composites Science and Technology, 35 (1989), 31-51.
[21] P.-Y. B. Jar, H.-H. Kausch, The influence of moulding conditions on delamination behaviour of carbon-fibre/PEEk composites, Composites Science and Technology, 52 (1994), 349-359.
[22] S.-L. Gao, J.-K. Kim, Cooling rate influences in carbon fibre/PEEK composites. Part I: Crystallinity and interface adhesion, Composites Part A, 31 (2000), 517-530.
[23] S.-L. Gao, J.-K. Kim, Cooling rate influences in carbon fibre/PEEK composites. Part II: Interlaminar fracture toughness, Composites Part A, 32 (2001), 763-774.
[24] N. Oya, H. Hamada, Mechanical properties and failure mechanisms of carbon fibre reinforced thermoplastic laminates, Composites Part A, 28 (1997), 823-832.
[25] T. Yýlmaz, T. Sýnmazçelik, Investigation of load bearing performances of pin connected carbon/polyphenylene sulphide composites under static loading conditions, Materials and Design, 28 (2007), 520–527.
[26] T. Sinmazc, S. Fidan, V. Günay, Residual mechanical properties of carbon/ polyphenylenesulphide composites after solid particle erosion, Materials and Design, 29 (2008), 1419–1426.
[27] I. De Baere, W. Van Paepegem, J. Degrieck, On the nonlinear evolution of the Poisson’s ratio under quasi-static loading for a carbon fabric-reinforced thermoplastic. Part I: influence of the sensor, 28 (2009), 196–203.
[28] B. Vieille, J. Aucher, L. Taleb, Influence of temperature on the behavior of carbon fiber fabrics reinforced PPS laminates, Materials Science and Engineering A, 517 (2009), 51–60.
[29] H. Quan, Z.-M. Li, M.-B. Yang, R. Huang, On transcrystallinity in semi-crystalline polymer composites, Composites Science and Technology, 65 (2005), 999-1021.
211
[30] S. Meretz, W. Auersch, C. Marotzke, E. Schulz, A. Hampe, Investigation of morphology-dependent fracture behaviour with the single-fibre pull-out test, Composites Science and Technology, 48 (1993), 285-290.
[31] L. Ye, T. Scheuring, K. Friedrich, Matrix morphology and fibre pull-out strength of T700/PPS and T700/PET thermoplastic composites, Journal of Materials Science, 30 (1995), 4761-4769.
[32] M. Zhang, J. Xu, Z. Zhang, H. Zeng, X. Xiong, Effect of transcrystallinity on tensile behaviour of discontinuous carbon fibre reinforced semicrystalline thermoplastic composites, Polymer, 37 (1996), 5151-5158.
[33] A.S. Nielsen, R. Pyrz, Study of the influence of thermal history on the load transfer efficiency and fibre failure in carbon/polypropylene microcomposites using Raman spectroscopy, Composite Interface, 6 (1999), 467-482.
[34] C.C. Jeng, M. Chen, Flexural failure mechanisms in injection-moulded carbon fibre/PEEK composites, Composites Science and Technology, 60 (2000), 1863-1872.
[35] C.M. Wu, M. Chen, J. Karger-Kocsis, Interfacial shear strength and failure modes in sPP/CF and iPP/CF microcomposites by fragmentation, Polymer, 42 (2001), 129-135.
[36] T. Ramanathan, A. Bismarck, E. Schulz, K. Subramanian, The use of a single-fibre pull-out test to investigate the influence of acidic and basic surface groups on carbon fibres on the adhesion to poly(phenylene sulfide) and matrix-morphology-dependent fracture behaviour, Composites Science and Technology, 61 (2001), 1703-1710.
[37] A.S. Nielsen, R. Pyrz, A Raman study into the effect of transcrystallisation on thermal stresses in embedded single fibres, Journal of Materials Science, 38 (2003), 597–601.
[38] E. Schulz, G. Kalinka, W. Auersch, Effect of transcrystallization in carbon fiber reinforced poly(p-phenylene sulfide) composites on the interfacial shear strength investigated with the single fiber pull-out test, Journal of Macromolecular Science Part B, 35 (1996), 527-546.
[39] J.A. Nairn, P. Zoller, The development of residual thermal stresses in amorphous and semicrystalline thermoplastic matrix composites, Proceedings of toughened composites conference, Houston, March 1985, 328-341.
[40] R.J. Young, P.A. Lovell, Introduction to polymers, London, Chapman & Hall, 1991. [41] J.F. Guillen, W.J. Cantwell, The influence of cooling rate on the fracture properties of
a thermoplastic-based fibre-metal laminate, Journal of Reinforced Plastics and Composites, 21 (2002), 749-772.
[42] Y. Youssef, J. Denault, Thermoformed glass fiber reinforced polypropylene: microstructure, mechanical properties and residual stresses, Polymer Composites 19 (1998), 301-309.
[43] P.P. Parlevliet, H.E.N. Bersee, A. Beukers, Residual stresses in thermoplastic composites – A study of the literature – Part I: Formation of residual stresses, Composites Part A, 37 (2006), 1847-1857.
212
[44] T. Ramanathan, A. Bismarck, E. Schulz, K. Subramanian, Investigation of the influence of acidic and basic surface groups on carbon fibres on the interfacial shear strength in an epoxy matrix by means of single-fibre pull-out test, Composites Science and Technology, 61 (2001), 599-605.
[45] L.D. Landro, M. Pegoraro, Evaluation of residual stresses and adhesion in polymer composites, Composites Part A, 27 (1996), 847-853.
[46] H.D. Wagner, J.A. Nairn, Residual thermal stresses in three concentric transversely isotropic cylinders: application to thermoplastic-matrix composites containing a transcrystalline interphase, Composites Science and Technology, 57 (1997), 1289-1302.
[47] http://www.torayca.com/index2.html [48] S.C. Bennett, D.J. Johnson and W. Johnson, Strength-structure relationship in PAN-
based carbon fibers, Journal of Materials Science, 18 (1983), 3337-3347. [49] E. Hayakawa, M. Shioya, A. Takaku, Sonic modulus in fiber-axis direction of carbon
fibers, Advanced Composite Materials, 4 (1994), 33-46. [50] T. Norita, A. Kitano, K. Noguchi, Proceedings of the 4th Japan-US Conference on
Composite Materials, Washinton DC, 1988, 548-557. [51] J.F. Villeneuve, R. Naslain, R. Fourmeaux, J. Sevely, Longitudinal thermal expansion
and Poisson ratio of some ceramic fibres as measured by transmission electron microscopy, Composites Science and Technology, 49 (1993), 89-103.
[52] G.J. Curtis, J.M. Milne, W.N. Reynolds, Non-hookean behavior of strong carbon fibres, Nature, 220 (1968), 1024-1025.
[53] T. Ishikawa, M. Matsushima, Y. Hayashi, Hardening non-linear behavior in longitudinal tension of unidirectional carbon composites, Journal of Matereals Science 20 (1985), 4075-4083.
[54] M. Shioya, E. Hyakawa, A. Takaku, Non-hookean stress-strain response and changes in crystallite orientation of carbon fibres, Journal of Materials Science 31 (1996), 4521-4532.
[55] Y. Nukushina, J. Matsui, M. Itoh, On the tensile load to elongation response of carbon fibre single filament samples, Journal of Japan Society for Composite Materials, 15 (1989), 210-221.
[56] N. Toyama, J. Takatsubo, An investigation of non-linear elastic behavior of CFRP laminates and strain measurement using Lamb waves, Composites Science and Technology, 64 (2004), 2509-2516.
[57] C.P. Beetz Jr, A self-consistent Weibull analysis of carbon fibre strength distributions, Fibre Science and Technology, 16 (1982), 81-94.
[58] W. Weibull, A statistical distribution function of wide applicability, Journal of Applied Mechanics, 18 (1951), 293-297.
[59] M. R’Mili, T. Bouchaour, P. Merle, Composites Science and Technology, 56 (1996), 831-834.

213
[60] K. Naito, Y. Tanaka, J.M. Yang, Y. Kagawa, Tensile properties of ultrahigh strength PAN-based, ultrahigh modulus pitch-based and high ductility pitch-based carbon fibers, Carbon, 46 (2008), 189-195.
[61] B.D. Coleman, On the strength of classical fibres and fibre bundles, Journal of the Mechanics and Physics of Solids, 7 (1958), 60-70.
[62] J.B. Park, T. Okabe, N. Takeda, W.A. Curtin, Electromechanical modeling of unidirectional CFRP composites under tensile loading, Composites Part A, 33 (2002), 267-275.
[63] M. Fuwa, A.R. Bunsell and B. Harris, Tensile failure mechanisms in carbon fibre reinforced plastics, Journal of Materials Science, 10 (1975), 2062-2070.
[64] K. Goda, The role of interfacial debonding in increasing the strength and reliability of unidirectional fibrous composites, Composite Science and Technology, 59 (1999), 1871-1879.
[65] H. Li, Y. Jia, G. Mamtimin, W. Jiang, L. An, Stress transfer and damage evolution simulations of fiber-reinforced polymer-matrix composites, Materials Science and Engineering A, 425 (2006), 178-184.
[66] H. Kusano, Y. Aoki, Y. Hirano, Y. Nagao, Observation of the initial destruction and the crack growth in unidirectional CFRP, Proceedings of 33rd Symposium on Composite Materials (2008) 49-50.
[67] H. Kusano, T. Hasegawa, Y. Aoki, Y. Hirano, Y. Nagao, Visualization on Static Tensile Test for Unidirectional CFRP, Proceedings of 17th International Conference on Composite Materials, Edinburg, 2009, IF8:2.
[68] B.W. Rosen, AIAA Journal, Tensile failure of fibrous composites, 6 (1968), 1985-1991.
[69] H.L. Cox, The elasticity and strength of paper and other fibrous materials, British Journal of Applied Physics, 3 (1952), 72-79.
[70] A. Kelly, W.R. Tyson, Tensile properties of fibre-reinforced metals: Copper/tungsten and copper/molybdenum, Journal of Mechanics and Physics of Solids, 13 (1965), 329-338.
[71] W.A. Curtin, Theory of mechanical properties of ceramic-matrix composites, Journal of the American Ceramic Society, 74 (1991), 2037-2045.
[72] J.J. Brennan, K.M. Prewo, High-Strength Silicon Carbide Fibre Reinforced Glass-Matrix Composites, Journal of Materials Science, 15 (1980), 463-468.
[73] D.B. Marshall, A.G. Evans, Failure Mechanisms in Ceramic-Fiber/Ceramic-Matrix Composites, Journal of the American Ceramic Society, 68 (1985), 225–231.
[74] C. Zweben, Tensile failure of fiber composites, AIAA Journal, 6 (1968), 2325-2331. [75] J.M. Hedgepeth, P. Van Dyke, Local stress concentrations in imperfect filamentary
composite materials, Journal of Composite Materials, 1 (1967), 294-309.
214
[76] D.G. Harlow, S.L. Phoenix, The chain-of-bundles probability model for the strength of fibrous materials I: analysis and conjectures, Journal of Composite Materials, 12 (1978), 195-214.
[77] D.G. Harlow, S.L. Phoenix, The chain-of-bundles probability model for the strength of fibrous materials II: A numerical study of convergence, Journal of Composite Materials, 12 (1978), 314-334.
[78] H. Suemasu, An Analytical Study of Probabilistic Aspect of Strength of Unidirectional Fiber Reinforced Composite under Tensile Loads, Transaction of Japan Society for Composite Materials, 8 (1982), 29-36.
[79] S.B. Batdorf, Tensile Strength of Unidirectionally Reinforced Composites, Journal of reinforced plastics and composites, 1 (1982), 153-164.
[80] S.B. Batdorf, R. Ghaffarian, Tensile Strength of Unidirectionally Reinforced Composites, Journal of reinforced plastics and composites - II, 1 (1982), 165-176.
[81] Z. Xia, W.A. Curtin, P.W.M. Peters, Multiscale modeling of failure in metal matrix composites, Acta Materiaria, 49 (2001), 273-287.
[82] Z. Xia, W.A. Curtin, Multiscale modeling of damage and failure in aluminum-matrix composites, Composites Science and Technology, 61 (2001), 2247-2257.
[83] L. Mishnaevsky Jr., P. Brøndsted, Micromechanisms of damage in unidirectional fiber reinforced composites: 3D computational analysis, Composites Science and Technology, 69 (2009), 1036-1044.
[84] T. Okabe, H. Sekine, K. Ishii, M. Nishikawa, N. Takeda, Numerical method for failure simulation of unidirectional fiber-reinforced composites with spring element model, Composites Science and Technology, 65 (2005), 921-933.
[85] T. Okabe, M. Nishikawa, N. Takeda, H. Sekine, Effect of matrix hardening on the tensile strength of alumina fiber-reinforced aluminum matrix composites, Acta Materialia, 54 (2006), 2557-2566.
[86] T. Okabe, K. Ishi, M. Nishikawa, N. Takeda, Prediction of Tensile Strength of Unidirectional CFRP Composites, Advanced Composite Materials, 19 (2010), 229-241.
[87] C.M. Landis, R.M. McMeeking, Composite Science and Technology, 59 (1999), 447-457.
[88] N.J. Capiati, R.S. Porter, The concept of one polymer composites modelled with high density polyethylene, Journal of Materials Science, 10 (1975), 1671-1677.
[89] A. Teishev, S. Incardona, C. Migliaresi, G. Marom, Journal Applied Polymer Science, 50 (1993), 503-512.
[90] C. Marais, P. Feillard, Manufacturing and mechanical characterization of unidirectional polyethylene-fibre/polyethylene-matrix composites, Composites Science and Technology, 45 (1992), 247-255.

215
[91] G. Hinrichsen, S. Kreuzberger, Q. Pan, M. Rath, Production and characterization of UHMWPE fibers LDPE composites, Proceedings of 9th International Conference on the Mechanics of Composite Materials, Riga, 1995.
[92] F.v. Lacroix, M. Werwer, K. Schulte, Solution impregnation of polyethylene fibre/polyethylene matrix composites, Composites Part A, 29 (1998), 371-376.
[93] I.M. Ward, P.J. Hine, The science and technology of hot compaction, Polymer, 45 (2004), 1413-1427.
[94] P.J. Hine, I.M.Ward, N.D. Jordan, R.H. Olley, D.C. Bassett, The hot compaction behaviour of woven oriented polypropylene fibres and tapes. I. Mechanical properties, Polymer, 44 (2003), 1117-1131.
[95] N.D. Jordan, D.C. Bassett, R.H. Olley, P.J. Hine, I.M.Ward, The hot compaction behaviour of woven oriented polypropylene fibres and tapes. II. Morphology of cloths before and after compaction, Polymer, 44 (2003), 1133-1143.
[96] P.J. Hine, R.H. Olley, I.M. Ward, The use of interleaved films for optimising the production and properties of hot compacted, self reinforced polymer composites, Composites Science and Technology, 68 (2008), 1413–1421.
[97] Y. Le Bozec, S. Kaang, P.J. Hine and I.M. Ward, The thermal-expansion behaviour of hot-compacted polypropylene and polyethylene composites, Composite Science and Technology 60 (2000) 333-344.
[98] B. Alcock, N.O. Cabrera, N.-M. Barkoula, C.T. Reynolds, L.E. Govaert, T. Peijs, The effect of temperature and strain rate on the mechanical properties of highly oriented polypropylene tapes and all-polypropylene composites, Composite Science and Technology 67 (2007) 2061-2070.
[99] B. Alcock, N.O. Cabrera, N.-M. Barkoula, J. Loos, T.Pijs, The mechanical properties of unidirectional all-polypropylene composites, Composites: Part A 37 (2006) 716-726.
[100] B. Alcock, N.O. Cabrera, N.-M. Barkoula, A.B. Spoelstra, J. Loos, T.Peijs, The mechanical properties of woven tape all-polypropylene composites, Composites: Part A 38 (2007) 147-161.
[101] W. Broeckaert, I. Verpoest, Self-reinforced polypropylene composites, Presentation of THEPLAC-2005, International Workshop on Thermoplastic Composites, Lecce, Sep 2005.
[102] I. Verpoest, W. Broeckaert, T. Czarnecki, The first composite suitcase series is based on self-reinforced polypropylene, “Cetex®” - thermoplastic composites “From Scratch to Flight”, Spandruk, Delft (2006), 45-50.
[103] P.W. Manders, M.G. Bader, The strength of hybrid glass/carbon fibre composites: part 1: failure strain enhancement and failure mode, Journal of Materials Science, 16 (1981), 2233-2245.
[104] T. Hayashi, K. Koyama, A. Yamazaki, M. Kihira, Development of new material properties by hybrid composition. Fukugo Zairyo, 1 (1972), 21-25.

216
[105] A.R. Bunsell B Harris, Hybrid carbon and glass fibre composites, Composites, 5 (1974), 157-164.
[106] C. Zweben, Tensile strength of hybrid composites, Journal of Materials Science, 12 (1977), 1325-1337.
[107] H. Fukuda, An advanced theory of the strength of hybrid composites, Journal of Materials Science, 19 (1984), 974-982.
[108] B. Harris, A. R. Bunsell, Impact properties of glass fibre/carbon fibre hybrid composites, Composites, 6 (1975), 197-201.
[109] Y. Kitazaki and H. Hata, Journal of Adhesion Society of Japan, 8 (1972), 131. [110] D.M. Brewis, D. Briggs, Adhesion to polyethylene and polypropylene, Polymer, 22
(1981), 7-16. [111] E. Occhiello, M. Morra, G. Morini, F. Garbassi, D. Johnson, On oxygen plasma-
treated polypropylene interfaces with air, water, and epoxy resins. II. Epoxy resins, Journal of Applied Polymer Science, 42 (1991), 2045-2052.
[112] C. Bonnerup, P. Gatenholm, The effect of surface energetics and molecular interdiffusion on adhesion in multicomponent polymer systems, Journal of Adhesion Science and Technology, 7 (1993), 247-262.
[113] N. Inagaki, Plasma Surface Modification and Plasma Polymerization, Technomic Publishing, Lancaster, 1996.
[114] M. Sarmadi, F. Denes, Surface modification of polymers under cold plasma conditions. Tappi Journal, 79 (1996), 189-204.
[115] D.A. Berta, Coatings of Polymers and Plastics, R.A. Ryntz and P.V. Yaneff, eds., Marcel Dekker, New York, 2003, 97.
[116] Y. Oda, T. Hata, 17th Annual Meeting of the High Polymer Society of Japan, 1968, 267.
[117] L. S. Penn, E. R. Bowler, A new approach to surface energy characterization for adhesive performance prediction, Surface and Interface Analysis, 3 (1981), 161-164.
[118] C.F. Schoff, Coatings of Polymers and Plastics, R.A. Ryntz and P.V. Yaneff, eds., Marcel Dekker, New York, 2003, 227.
[119] Y. Wang and S. Rak, Adhesion Aspects of Polymeric Coatings, 2, K.L. Mittal, ed., VSP, Utrecht, 2003, 121-136.
[120] S. Wu, Polymer Handbook, 3rd Ed., J. Brandrup and E.H. Immergut, eds., Wiley-Interscience, New York, 1989, VI, 414-426.
[121] E.J. Berger, Acid-Base Interactions: Relevance to Adhesion Science and Technology, K.L. Mittal, ed., VSP, Utrecht, 1991, 217.
[122] J. Comyn, Handbook of Adhesives and Sealants, Vol. 2, P. Cognard, ed., Elsevier, Amsterdam, 2006, 34.
[123] M.C. Paiva, C.A. Bernardo, M. Nardin, Mechanical, surface and interfacial characterisation of pitch and PAN-based carbon fibres, Carbon, 38 (2000), 1323-1337.
217
[124] T. Ishikawa, N. Watanabe, K. Bansaku, Y. Ono, Closed form predictions of macroscopic thermomechanical properties of orthogonal 3-D woven Fabric composites, Proceedings of International Conference on Composite Materials, Australia, Jul. 1997, V, 189-200.
[125] P.P. Parlevliet, H.E.N. Bersee, A. Beukers, Residual stresses in thermoplastic composites – A study of the literature – Part II: Experimental techniques Composites Part A, 38 (2007), 651-665.
[126] J.A. Nairn, P. Zoller, The development of residual thermal stresses in amorphous and semicrystalline thermoplastic matrix composites, Proceedings of toughened composites conference, Houston, Mar. 1985, 328-341.
[127] G. Jeronimidis, A.T. Parkyn, Residual-stresses in carbon fiber-thermoplastic matrix laminates, Journal of Composite Materials, 22 (1988), 401-415.
[128] J.A. Barnes, G.E. Byerly, The formation of residual-stresses in laminated thermoplastic composites, Composites Science and Technology, 51 (1994), 479-494.
[129] K.D. Cowley, P.W.R. Beaumont, The measurement and prediction of residual stresses in carbon–fibre/polymer composites, Composites Science and Technology, 57 (1997), 1445-1455.
[130] R.A. Shapery, Thermal expansion coefficients of composite materials based on energy principles, Journal of Composite Materials, 2 (1968), 380-404.
[131] J.-A.E. Månson, J.C. Seferis, Process simulated laminate (Psl) – A methodology to internal-stress characterization in advanced composite-materials, Journal of Composite Materials, 26(1992), 405-431.
[132] L.T. Drazal, M. Madhukar, Fibre-matrix adhesion and its relationship to composite mechanical properties, Journal of Materials Science, 28 (1993), 569-610.
[133] C.-Y. Hui, S.L. Phoenix, D. Shia, The single-filament-composite test: a new statistical theory for estimating the interfacial shear strength and Weibull parameters for fiber strength, Composites Science and Technology, 57 (1997), 1707-1725.
[134] F.M. Zhao, N. Takeda, K. Inagaki, N. Ikuta, A study on interfacial shear strength of GF/epoxy composites by means of microbond tests, Advanced Composite Letters, 5 (1996), 113–116.
[135] A. Godara, L. Gorbatikh, G. Kalinka, A. Warrier, O. Rochez, L. Mezzo, F. Luizi, A.W. van Vuure, S.V. Lomov, I. Verpoest, Interfacial shear strength of a glass fiber/epoxy bonding in composites modified with carbon nanotubes, Composites Science and Technology, 70 (2010), 1346-1352.
[136] J. Noda, T. Okabe, N. Takeda, M. Shimizu, Tensile strength of CFRP cross-ply laminates containing transverse cracks, Advanced Composite Materials, 15 (2006), 81-93.
[137] T. Okabe, H. Sekine, J. Noda, M. Nishikawa, N. Takeda, Characterization of tensile damage and strength in GFRP cross-ply laminates, Materials Science and Engineering A, 383 (2004), 381-389.

218
[138] C.M. Landis, I.J. Beyerlein, R.M. McMeeking, Micromechanical simulation of the failure of fiber reinforced composites, Journal of the Mechanics and Physics of Solids, 48 (2000), 621-648.
[139] S. Deng, L. Ye, Y.-W. Mai, H.-Y. Liu, Evaluation of fibre tensile strength and fibre/matrix adhesion using single fibre fragmentation tests, Composites Part A, 29 (1998), 423-434.
[140] Y. Zhou, M.A. Baseer, H. Mahfuz, S. Jeelani, Statistical analysis on the fatigue strength distribution of T700 carbon fiber, Composites Science and Technology, 66 (2006), 2100-2106.
[141] J. Noda, M. Nakada, Y. Miyano, Temperature dependence of accumulation of fiber breakage under tensile loading for unidirectional CFRP laminates, Journal of Reinforced Plastics and Composites, 27 (2008), 1005-1019.
[142] W.F. Chen, D.J. Han, Plasticity for Structural Engineers, Springer-Verlag, New York, 1987.
[143] J.W. Hitchon, D.C. Phillips, The dependence of the strength of carbon fibres on length, Fibre Science and Technology 12 (1979), 217-233.
[144] K.K. Phani, The strength-length relationship for carbon fibres, Composites Science and Technology, 30 (1987), 59-71.
[145] T. Tanaka, H. Nakayama, A. Sakaida, N. Horikawa, Estimation of tensile strength distribution for carbon fiber with diameter varying along fiber, Journal of Society Materials Science, Japan, 47 (1998), 719-726.
[146] S.-R. Dai, M.R. Piggott, The strengths of carbon and Kevlar fibres as a function of their lengths, Composites Science and Technology, 49 (1993), 81-87.
[147] K.L. Pickering, T.L. Murray, Weak link scaling analysis of high-strength carbon fibre, Composites Part A, 30 (1999), 1017-1021.
[148] T. Okabe, N. Takeda, Size effect on tensile strength of unidirectional CFRP composites –experiment and simulation, Composites Science and Technology, 62 (2002), 2053-2064.
[149] A.S. Watson R.L. Smith, An examination of statistical theories for fibrous materials in the light of experimental data, Journal of Materials Science, 26 (1985), 3260-3270.
[150] http://www.curvonline.com [151] CurvTM –Technical Data sheet C100A, Propex Fabrics GmbH. [152] I. Verpoest, W. Broeckaert, T. Czarnecki, A. Detaeye, R. Hillaert, M. Jansens, The
first composite suitcase series is based on self-reïnforced polypropylene, Presentation of SAMPE Europe 27th international conference, Mar. 2007, Paris.
[153] W. Pinxten, De invloed van het visco-elastisch gedrag van verstrekt polypropylene op het krimpgedrag van polypropylene-composieten, Master thesis in Katholieke Universiteit Leuven, 2004-2005.
219
[154] K.J. Kim, W.-R. Yu, P. Harrison, Optimum consolidation of self-reinforced polypropylene composite and its time-dependent deformation behavior, Composites Part A, 39 (2008), 1597-1605.
[155] B.W. Rosen, Mechanics of composite strengthening, Fiber Composite Materials, American Society Metals Seminar, 1965.
220
Curriculum Vitae
Name Ichiro Taketa Address 1515, Tsutsui, Masaki-cho, Iyogun, Ehime 791-3193 JAPAN Telephone +81 (0)89 960 3842 E-mail [email protected] Education Jun.2008-Present PhD research assistant Department of Metallurgy and Materials Engineering Faculty of Engineering Katholieke Universiteit Leuven Apr.2001-Mar.2003 Master of Science Department of Advanced Energy Graduate School of Frontier Sciences University of Tokyo Apr.1997-Mar.2001 Bachelor of Engineering Department of Aeronautics and Astronautics Faculty of Engineering University of Tokyo Work experiences Apr.2003-Present Senior Research Engineer Composite Materials Research Laboratories Toray Industries, Inc.

221
List of publications
In refereed journals: [1] Taketa, T. Okabe, A. Kitano, A new compression-molding approach using
unidirectionally arrayed chopped strands, Composites Part A, 39 (2008), 1884-1890. [2] I. Taketa, T. Okabe, A. Kitano, Strength improvement in unidirectional arrayed
chopped strands with interlaminar toughening, Composites Part A, 40 (2009), 1174-1178.
[3] I. Taketa, J. Ustarroz, L. Gorbatikh, S.V. Lomov, I. Verpoest, Interply hybrid composites with carbon fiber reinforced polypropylene and self-reinforced polypropylene, Composites Part A, 41 (2010), 927-932.
[4] I. Taketa, N. Sato, A. Kitano, M. Nishikawa, T. Okabe, Enhancement of strength and uniformity in unidirectionally arrayed chopped strands with diagonal angled slits, Composites Part A, 41 (2010), 1639-1646.
[5] I. Taketa, T. Okabe, H. Matsutani, A. Kitano, Flowability of unidirectionally arrayed chopped strands in compression molding, Composites Part B, (In press).
In conference proceedings: [1] I. Taketa, T. Okabe, A. Kitano, A new compression-molding approach using
unidirectionally arrayed chopped strands, Proceedings of 11th Japanese-European Symposium on Composite Materials, Sep. 2008, Porto.
[2] I. Taketa, N. Sato, M. Yamanouchi, E. Wadahara, A. Kitano, T. Okabe, A new compression-molding approach using unidirectionally arrayed chopped strands, Proceedings of 33rd symposium on composite materials, Oct. 2008, Hokkaido.
[3] I. Taketa, N. Sato, M. Yamanouchi, E. Wadahara, A. Kitano, T. Okabe, A new compression-molding approach using unidirectionally arrayed chopped strands, Proceedings of SAMPE Europe 30th international conference, Mar. 2009, Paris.
[4] I. Taketa, N. Sato, M. Yamanouchi, E. Wadahara, A. Kitano, T. Okabe, A new compression-molding approach using unidirectionally arrayed chopped strands, Proceedings of 17th International Conference on Composite Materials, Jul. 2009, Edinburgh.

222
[5] J. Ustarroz, I. Taketa, S.V. Lomov, I. Verpoest, Carbon/PP composites and carbon/self-reinforced PP hybrid composites, Proceedings of 17th International Conference on Composite Materials, Jul. 2009, Edinburgh.
[6] I. Taketa, J. Ustarroz, L. Gorbatikh, S.V. Lomov, I. Verpoest, Hybridization of carbon fibre reinforced polypropylene and self-reinforced polypropylene, Proceedings of SAMPE Europe 31th international conference, Apr. 2010, Paris.
[7] I. Taketa, L. Gorbatikh, S.V. Lomov, I. Verpoest, Hybrid effects on the interply composites reinforced with carbon fibre and stretched polypropylene, Proceedings of 14th European Conference on Composite Materials, Jun. 2010, Budapest.
[8] I. Taketa, L. Gorbatikh, S.V. Lomov, I. Verpoest, The influence of matrix and cooling rate on the properties of carbon fiber reinforced thermoplastics, Proceedings of 2nd Japanese Conference on Composite Materials, Mar. 2011, Tokyo.