analysis of erosion thresholds, channel networks, and
TRANSCRIPT

Analysis of Erosion Thresholds, Channel Networks, and LandscapeMorphology Using a Digital Terrain Model1
William £. Dietrich, Cathy J. Wilson2, David R. Montgomery3, and fames McKeanDepartment of Geology and Geophysics. University of California. Berkeley. CA 94720
ABSTRACTTo investigate the linkage between erosion process and channel network extent, we develop two simple erosionthreshold theories driven by a steady state runoff model that are used in the digital terrain model TOPOG to predictthe pattern of channelization. TOPOG divides the land surface into elements defined by topographic contours andflow lines, which can be classified as divergent, convergent and planar elements. The calibration parameter for therunott model is determined using empirical evidence that the divergent elements which comprise the ridges in ourstudy area do not experience saturation overland flow, where as the convergent elements in the valleys do duringsignificant runoff events. A threshold theory lor shallow landsliding predicts a pattern of instability consistent withthe distribution of landslide scars in our 1.2 km2 study site and confirms the interpretation, based on field observations, that indicate the steeper channel heads to be at least partially controlled by slope instability. Most sites ofpredicted and observed slope instability do not, however, support a channel head, hence landslide instability aloneis not sutficient for channelization. In contrast, most elements predicted to be eroded by saturation overland flowcoincide with the observed location of the channel network. In addition, areas of predicted downslope decrease inrelative sediment-transport capacity were found to correspond to locations where channels became discontinuous.The topographic threshold given by the saturation overland flow erosion theory varies with the third power of criticalboundary shear stress, suggesting that critical shear stress, although difficult to quantify with much precision in thefield, is a dominant control on the extent ot the channel network where saturation overland flow is significant.Current extent ot the channel network in our field site, tor example, may best \)c explained as resulting fromgrazing-induced reduction in surtace resistance.
Introduction
Landscape dissection is controlled by the tendencytor runoff to channelize into avenues of concentrated erosion (e.g., Horton 1945; Smith and Bretherton 19721. Field studies have revealed that theupslope extent of the channel network may be welldefined by an inverse relationship between drainage area and slope (Montgomery and Dietrich 1988,1989, 1992). These studies have also shown that atthe channel head, there is typically a processchange, upslope of which mass wasting and diffusive processes predominate and downslope ofwhich runoff-driven incision occurs (e.g., Dietrichand Dunne 199,}). Hence, in a given catchment,
Manuscript received October 1° I1"'1 accepted December! 1992■ Australian Center for Catchment livdrology, CSIRO, Canberra. ACT 2601, Australia.' Department oi Geological Sciences University ol Washington, Seattle. WA 9K19V
there appears to be a threshold of erosion resistance which sets the location of a channel head at aspecific drainage area and local slope, and thereforedetermines the extent of the channel network ina watershed. This concept has been explored in alandscape evolution model by Willgoose et al.(1991).
Acquisition of high-resolution digital elevationdata allows a comparison between the location ofchannel networks mapped in the field and networks predicted by process-based theories. Otherthan the comparison between predicted and observed ephemeral gullies in an agricultural field byMoore et al. 11988..), however, we know of no suchstudies. Numerical models can convert the elevation data into a digital surface upon which waterand sediment can be routed. At present, however,digital elevation data, even at very high resolutionisay 1 m grid spacing) are too sparse to capture thelocal topography around typical small channel
|Thc lourn.il til Geology, 1993, volume 10! p 2v;-27K| c 199.5 bv The Universitv ol Chicago All rights reserved. 0022-1 *76 9. I0102-009S1.00
259
f
260 W I L L I A M E . D I E T R I C H E T A L
heads, which often are only decimeters in size attheir tips. Process-based models for channel networks, then, are best thought of as attempting todefine where in the landscape there would be atendency for erosion to channelize, rather than asattempting to predict the size and downstream topographic evolution of discrete channels that collectto form the network.
In this paper we build upon a recent study (Dietrich et al. 1992) to propose two simple thresholdof erosion models that, based on field observations,appear appropriate for explaining channel initiation in a small watershed where the full extent ofthe channel network has been mapped. We developthese theories in a form which can be easily testedusing digital elevation data and a simple hydro-logic routing model. Our analysis suggests thatboth the upslope extent and discontinuous natureof the channel network in our field area in MarinCounty, California, can be explained primarily bysaturation overland flow erosion. Shallow landsliding, while active at many of the steeper channelheads, also occurs in areas that do not have sufficient runoff to maintain a downslope channel.Hence landsliding does not uniquely define channel-head locations. The mechanistic analysis proposed here, although crude, does strongly suggesthow the channel network in our study area hasresponded to climatic change and landuse. It alsoleads to further testable hypotheses regarding erosion thresholds.
TheoryThree simple theories for predicting runoff, slopeinstability, and erosion by saturation overlandflow. Although these theories were reported byDietrich et al. (1992), their derivations were notgiven. These theories are developed here in a formto take advantage of two topographic attributeseasily determined from digital elevation data:drainage area per unit contour length, and localground slope.
Runoff Model. In well-vegetated semi-arid tohumid landscapes where precipitation intensitydoes not exceed the soil infiltration capacity, runoff occurs by subsurface and saturation overlandflow (e.g., Dunne 1978). Erosion thresholds will becrossed during precipitation events that elevatepore pressures associated with subsurface flow tothe point of mass failure of the ground or wheresubsurface flow returns to the surface and combines with incoming precipitation to generate saturation overland flow of sufficient depth to causesurface incision of the ground. On exposed cuts
such as in channel heads, seepage erosion may require a critical hydraulic gradient to displace surface materials (Dunne 1990; Montgomery 19911,but this process will not be considered here.
Although erosion events are clearly driven bystorms of varying intensity and duration that occuron watersheds of seasonally varying antecedentconditions, the modeling of such unsteady rainfall-runoff processes introduces considerable complexity and several calibration parameters for whichspatial and temporal variability is difficult to define. Given that we can only ask whether a particular place in a landscape is likely to experience hydrologic conditions favorable for a threshold oferosion to be exceeded, rather than make specificpredictions about the size and dynamics of individual channels, it seems appropriate to keep the hydrologic driving function as simple as possible,while still retaining the essential physics. Here weuse a steady-state runoff model that can be interpreted as mimicking the topographic dependenceof runoff during transient storm events. Thismakes evaluation of the predicted storm runoff difficult, but we suggest that the landscape topography itself places some constraint on the magnitudeof the saturated flow response. We will also assume that transmissivity, saturated conductivity,and the ground resistance to runoff and erosion arespatially constant.
Following the formulation proposed by O'Lough-lin (1986) for subsurface flow, we can write theconservation of mass for steady-state, shallow subsurface flow and saturation overland flow asfollows:
qa - TMb = udb. 1
As shown in figure 1, a is the catchment drainingacross a contour of length, b. The total runoff perunit area, ./. is equal to the precipitation, p. minusthe evaporation, e. minus deep drainage, r. i.e., [q= p — e — r). As O'Loughhn (1986) correctlypoints out, even in the steady-state case, p. e. andi need not be spatially constant, although we assume so here. The shallow subsurface flow modeled here is assumed to flow parallel to the groundsurface and at saturation is equal to the transmissivity, T, times the surface slope, M, times the contour length, b. Here M equals sinH. Runoff th. :cannot be transmitted in the subsurface mu>ttravel overland, and does so with a mean velocityof u for a depth, d, across the contour length, b.Hence, equation (1) simply states that the difference between the total runoff and the saturated
»*»

Journal of Geology CENTENNIAL SPECIAL ISSUE 261
toour>darY
TMb
i igure 1. Plan view and cross section of area drainingacross the contour length, b. as defined by "flow lines"generated by the program TOPOG lO'Loughlin 1986).In the cross section, the heavy line depicts the groundsurface. The stippled area is the shallow subsurface flowand saturation overland How with discharge of Tmb andudb. respectively. Here q equals precipitation, r>. minusevaporation, e. and deep drainage, r. a is drainage area,h. z. and d (measured normal to the ground surface), arethe thickness ot the subsurface saturated flow, thicknessof the potentially unstable mass, and thickness of thesaturation overland flow, and u is the mean overlandHow velocity parallel to the ground surface. T is the:ransmisstvity and M is sin t).
subsurface flow is the overland flow at steady-stateconditions.
According to equation ill, the ground will saturate everywhere that these conditions hold:
b q
Equation (21 can be rearranged to state that wherethe topographic ratio, a/\bM), is greater than orequal to the hydrologic ratio, Tlq. the ground willsaturate. In essence, a/\bM) is the topographic•erm that expresses the tendency for flow convergence (high a/b) and for the flow to travel quicklyas shallow subsurface flow |large .VI) rather thanas saturation overland flow (small Al). Large areasdraining to gentle slopes [i.e., where this ratio islarge) are prone to saturation. The hydrologic ratio,Tlq, can be thought of as the ability of the subsurface to transmit flow relative to the applied runoff.
Hence, where this ratio is small, the ground tendsto saturate.
If the hydrologic parameter, Tlq, is roughly spatially constant for a given storm, then a survey ofthe upslope extent of saturation at points throughout a watershed should find these points havingthe same value of a/[bM) (e.g., Kirkby 1978; Bevenand Kirkby 1979). Equation (2), when used in combination with knowledge of the landscape form derived from a digital elevation model, will alsoprove useful in establishing the value of Tlq, asdiscussed later.
Slope Stability Threshold. Shallow landslidingoccurs when pore water pressure reduces the fric-tional strength of the soil to the point where theshear stress due to the downslope weight of thesoil exceeds the strength. We assume that the zoneof shallow surface storm runoff is confined to acohesionless (at failure) soil overlying a less conductive, but stronger bedrock. Hence, in figure 1,z defines not only the maximum thickness of shallow surface flow, but also the thickness of the shallow, potentially unstable surface layer. The grounddoes not have to be saturated for failure to occur;hence the local thickness of saturated flow, h, canbe less than or equal to z. If T = Kz cos 6, in whichK is the saturated conductivity, then for subsurfaceflows equal to or less than saturated, the ratio ofthe actual runoff to maximum subsurface flow is:
qa A. sin 0/7 cos 0 hbTM K sin Hz cost. 13)
Because our hydrologic model assumes flow parallel to the ground surface, excessive pore pressureassociated with exfiltrating gradients cannot bemodeled. The thickness of the saturated zone required to convey the imposed runoff varies from asmall value up to z. the thickness of the conducting layer; hence h/z varies from nearly zero to 1.0.
For cohesionless material, the infinite slope stability model can be written as:
psztan0 = (pNz - puh)tan6
and with substitution of equation (3) for h/z thisbecomes:
b pu. \ tan 6/ q (4)
This states that instability will occur when thearea per unit contour length is greater than or equalto the product of four terms: the bulk density ratio

262 W I L L I A M E . D I E T R I C H E T A L
of wet soil (ps) to water (pu.), the ratio of the tangentof the ground surface to the angle of internal friction (tan d>), the hydrologic ratio [T/q], and theground slope (sin 0). Although it would be morerealistic to include a cohesion term in equation(4), this requires additional information about soildepth, or at least the depth of rooting. Again, forsimplicity, here the contribution of cohesion is neglected. Because of the condition of flow parallelto the ground surface, slopes greater than or equalto the friction angle are chronically unstable andwould be in areas where bedrock is exposed. Also,for slopes with tan 0 < |(psz - pwh)/[psz)\ ■ tan d>,the ground is stable even if saturated.
Threshold of Erosion by Saturation OverlandFlow. In general, we can write the conservation ofmass equation for erosion due to sediment transport as:
~ . d zv • <7 = - p„ —i s K - a f
in which q, is the sediment transport vector, p, isthe dry bulk density of the soil surface, t is time,and z is the local elevation of the ground surface.Sediment transport by running water varies in proportion to boundary shear stress (e.g., Slattery andBryan 1992; Dunne 1991); therefore divergence ofthe boundary shear stress (in excess of some critical value) will induce erosion. The threshold oferosion by overland flow, however, is not necessarily equivalent to the threshold of channel incisionby that flow. This was clearly the case in rill incision on both an unvegetated surface (i.e., Slatteryand Bryan 1992), and on poorly vegetated surfaces(Dunne and Aubrey 1986). Dunne (1980) has argued that one reason for this stability, at least incoarser sediments, is the diffusive behavior of rainsplash transport in shallow sheet flow, whichwould tend to damp the tendency for the flow toincise. Based on flume experiments in somewhatcohesive materials, there is evidence that althoughthe lateral instability of the flow develops, it doesnot cut a channel (or rill) until the flow has becomeapproximately supercritical and causes the formation of an upslope propagating knickpoint (Slatteryand Bryan 1992).
Because of the high resistance to surface erosionin the well-vegetated areas where saturation overland flow occurs and the resulting significant flowdepth needed to generate boundary shear stress tocause sediment transport, we will assume thatonce a critical boundary shear stress (tc) is exceeded, the flow will incise and form a channel.This is particularly true where the surface, due to
roots, stems and decayed organic matter, is considerably more resistant than the immediate subsurface. As long as the actual relationship betweenboundary shear stress (t,,) and sediment transportrate is strongly non-linear, as might be expectedin this case, the characterization of the surface ashaving a threshold boundary shear stress is reasonable. If we also assume that sediment transport, <:/..is proportional to an excess boundary shear stress,as is usually shown tor sand and coarser material(e.g., Yalin 1972), then
<_*<*!
and channels would be expected to form when \ih> -J and tend to thin and disappear if \[c)[7,. -7,V')/dx\ < 0. On poor- to well-vegetated surfaces,the availability of sediment for transport is limited, so the actual transport rate will be well belowthe transport capacity estimated from an excessboundary shear stress equation. Nonetheless, wepropose that the tendency for scour or depositionwill still respond to spatial change in excess ofshear stress.
Boundary shear stress in nonaccelerating flowscan be written as:
-, = pwgdM. 15!
Gravitational acceleration, g. and fluid density, pu.,are known, and the local slope can be determinedfrom a sufficiently high-resolution digital elevation model. The flow depth must be calculatedbased on runoff rate and surface roughness. Rewriting equation (1) to solve for flow depth,
1d = —\qa - TMb),ub
multiplying each side by pwgM. and substitutinginto (5), gives
Tb ub [qa - TMb). (6)
To eliminate the velocity term in (6), we use a formof the Darcy-Weisbach equation often employed inoverland flow studies (e.g., Dunne and Dietrich1980),
u = (W (7)
For turbulent flow the friction factor, f. is constantbut for laminar flow the friction factor varies in-

[ournal of Geology CENTENNIAL SPECIAL ISSUE 263
versely with Reynolds number, i.e., f = Kv/ud inwhich v is the kinematic viscosity and K is a constant for a given roughness condition. Using thefrictional relationship given in equation (7), theboundary shear stress for turbulent flow is
Th = pw,lMgP'3 (-J (qCj\- TM) , (8)
whereas for laminar flow
7,,, = pJMg) i .? K v"F-™
1
(9)
Setting equations (8) and (9) equal to the criticalshear stress and solving for the topographic condition where the critical shear stress is equaled orexceeded gives
1.41 _ < 2
b p l ' -gMf ' -q qT-M 10)
for turbulent flow and
~> ,.»
b o i K v g ' - M ' - q qIM 11
for laminar flow.This analysis shows that it channel initiation by
saturation overland flow can be characterized asoccurring once a critical boundary shear stress isxceeded, then the area per unit contour length up-iope of the channel vanes with critical shear
stress and inversely with roughness, precipitationand, if critical shear stress is sufficiently large, inversely with ground slope. If the critical shearstress is very small, then equations 110) and (11)reduce to equation (2), that is, channel initiation isequivalent to ground saturation. Montgomery11991) has suggested that in some instances groundsaturation may be the appropriate criteria for channel head advance by seepage erosion. In this case,channel incision might result from saturationoverland flow draining a large area, but once inci--:on has occurred, seepage erosion advances the
lannel head upslope to the point where the. round does not saturate.
Field SiteTo test the application of the runoff and erosionthresholds, we selected a field site where extensivemapping and process studies have been conducted
(figure 2). The general area, known as TennesseeValley, lies north of San Francisco in MarinCounty, California, and is underlain by intenselydeformed greywacke, chert, and greenstone (Wahr-haftig 1984). The ground is mostly soil-mantled,with the gravelly soil typically thin (<1 m) on sideslopes and ridge tops and thickening to several meters in the colluvial fills in the valley axes. Localbedrock outcrops occur on some ridges and onsteep slopes. The climate is Mediterranean withan average annual precipitation of about 760 mm(Rantz 1968). Vegetation varies with topographicposition and aspect, with native and Europeangrasses covering many of the ridgetops and gentlerside slopes, and dense stands of coyote brushmixed with locally impenetrable poison oak occurring in many of the hollows and the steep sideslopes in narrow canyons. The area was grazed bycattle from the early 1800s until about 1981; thisgrazing apparently increased the area of grass relative to brush and, when it was most heavily grazedin the late 19th century, the grass cover was probably greatly reduced relative to the present condition (Montgomery 1991).
The channel network mapped in the field(Montgomery and Dietrich 1989) is shown in figure2. Channels extend up to and often through convergent areas of thick colluvial deposits. The channels in the steep canyons have bedrock floors. Inthe main valley the channel is incised into a broad,several meter thick deposit of alluvium and colluvium. Radiocarbon dating in this area (Montgomery 1991), and elsewhere in the Bay area (Reneauet al. 1990) indicates that the aggradation of colluvium and alluvium here took place during the Ho-locene. A variety of direct and indirect evidence,gathered from historical accounts, recovered artifacts, and aerial photographs indicates that thechannel in the main valley cut down and formed aterrace about 100 yrs ago during the period of mostintense grazing and that many of the tributarychannels were either formed or extended into theupslope colluvium at this time (Montgomery1991).
As reported by Montgomery and Dietrich (1988,1989, 1992), the drainage area to the mapped channel heads systematically decreases with increasinglocal slope (figure 3). For any particular slope, contributing area to the observed channeled headsranges about one order of magnitude. The data forchanneled and unchanneled valleys below andabove the channel head suggest that the channelheads lie at a topographic threshold (figure 3), asmight be expected from the threshold theories presented above.
264 W I L L I A M E . D I E T R I C H E T A L
Contour interval - 40 ft
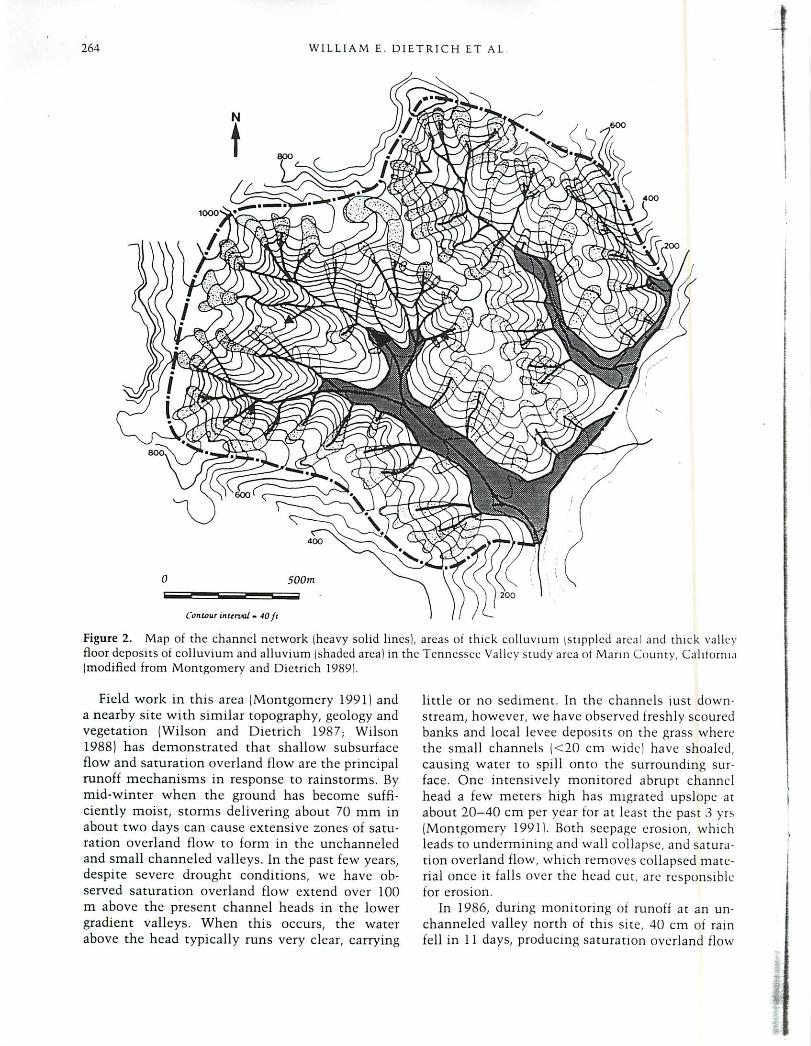
Figure 2. Map of the channel network (heavy solid lines),floor deposits of colluvium and alluvium (shaded area) in the(modified from Montgomery and Dietrich 1989).
Field work in this area (Montgomery 1991) anda nearby site with similar topography, geology andvegetation (Wilson and Dietrich 1987; Wilson1988) has demonstrated that shallow subsurfaceflow and saturation overland flow are the principalrunoff mechanisms in response to rainstorms. Bymid-winter when the ground has become sufficiently moist, storms delivering about 70 mm inabout two days can cause extensive zones of saturation overland flow to form in the unchanneledand small channeled valleys. In the past few years,despite severe drought conditions, we have observed saturation overland flow extend over 100m above the present channel heads in the lowergradient valleys. When this occurs, the waterabove the head typically runs very clear, carrying
areas of thick colluvium (stippled areal and thick valleyTennessee Valley study area ot Marin County, California
little or no sediment. In the channels just downstream, however, we have observed freshly scouredbanks and local levee deposits on the grass wherethe small channels (<20 cm wide) have shoaled,causing water to spill onto the surrounding surface. One intensively monitored abrupt channelhead a few meters high has migrated upslope atabout 20-40 cm per year for at least the past 3 yrs(Montgomery 1991). Both seepage erosion, whichleads to undermining and wall collapse, and saturation overland flow, which removes collapsed material once it falls over the head cut, are responsiblefor erosion.
In 1986, during monitoring of runoff at an unchanneled valley north of this site, 40 cm of rainfell in 11 days, producing saturation overland flow

■
Journal of Geology CENTENNIAL SPECIAL ISSUE 265
CD03C■ffl
"O
local slope (m / m)
Figure 3. Drainage area and local ground slope for channels (triangles), channel heads (solid circles), and unchanneled surfaces (open circlcsl in the study area shownin figure 2 (modified from Montgomery and Dietrich1992).
iver 100 m in length (essentially to the divide).The grass was bent down by the flow and, locallyat the upslope tip of the small channel and thedownslope end of the valley, the overland flow hada Froude number >1.0, although no obvious surface erosion occurred. Measurements of the runoffproduced during this storm revealed that it hadroughness properties compatible with a laminarflow description, i.e., the calculated roughness varied inversely with Reynolds number, yielding a K(as defined above) of about 10,000 (Wilson 1988, p.109). Despite this large Reynolds number, the datagave no indication of reaching a constantroughness. We suspect that the flow was indeedturbulent, but the momentum defect caused by thevegetation resulted in a turbulent eddy diffusioncoefficient that did not vary with height above thebed, giving a laminar-like flow resistance relationship.
As saturation overland flow is largely confinedto convergent zones along valley axes, erosion onthe surrounding hillslopes is primarily due to processes not involving surface runoff, i.e., mass-wasting processes. Shallow landslides involvingjust the soil-mantle are common in this area. Dueto the dense brush in the steep canyon areas, it isdifficult to map all the scars, even in the field.Some of these scars are probably several decades>ld based on the vegetation cover and sharpness of
the edges, and in other cases, where bedrock is nearthe surface, it is difficult to define a discreet failurearea. The scars are commonly only 5 to 10 m acrossand about twice as long. Using aerial photographsand field inspection, we mapped 39 landslide scarsin the 1.2 km: larger catchment of the two shownin figure 2. The scars are most commonly found
on the steeper footslopes and at the downstreamend of small steep, unchanneled valleys. Given theuncertainty in mapping these subtle features whenwe compare the observed and predicted pattern oflandsliding, we will interpret the mapped scars asindicating areas of mass instability, rather than asdiscrete points of failure.
On the gentler hillslopes and on the ridges, sediment transport occurs primarily by biogenic transport associated with the burrowing activity of animals (Reneau et al. 1988; Black and Montgomery1991). Given the minor role of water in transporting soil, downslope transport by this biogenicactivity is probably largely slope dependent. Perhaps the well-defined hilltop convexities in thisarea, as would be expected from a slope dependenttransport law (Gilbert 1909), attest to this process.
Topographic AnalysisPrediction of the full extent of the channel network in a landscape using the above threshold theories requires digital elevation data of sufficientlyhigh resolution that the finest scale source-area basins can be quantitatively analyzed. At least forour field area (but probably in general), the digitalelevation model (DEM) from the United StatesGeological Survey 7.5' quadrangle was useless. Although elevations were digitized every 25 m alongnorth-south lines in this DEM, the individual profiles were 150 m apart, and the data were interpolated to a rectangular array of data points spaced30 m apart (Bauer and Anderson unpub. data). Asshown by Bauer and Anderson and clearly visibleby inspection of a topographic map generated fromthe data, this DEM (made available for the firsttime in January 1992) cannot resolve valleys withwavelengths <1000 m with much accuracy. Giventhe general tendency for channel networks to extend into fine-scale valleys in steep terrain (Montgomery and Dietrich 1988, 1989; Dietrich andDunne 1993) we question whether analyses basedon USGS DEM's can be used to infer channel networks or the transition from hillslope to channel-driven erosion processes.
As an alternative, we took advantage of speciallyflown, low-elevation high resolution black andwhite photographs to generate our own DEM. Several mapped ground features were used to controlregistration of the digital coordinates. Elevationdata were obtained at a density ol about every 10m for the 1.21 krrr catchment from stereo digitization of the photographs. The low canopy cover permitted clear ground visibility, and we selected datapoints to capture topographic change rather than to

266 W I L L I A M E . D I E T R I C H E T A L
follow a regular grid. Elevation error for individualpoints we estimate to be ±0.5 m; horizontal erroris about r3m.
For the simple steady-state threshold of erosiontheories described above, any digital terrain modelthat enables one to compute local alb and M withreasonable accuracy should be sufficient. As manyhave found, however, grid-based analyses so fartend to produce undesirable artifacts (e.g., Fairfieldand Leymane 1991). To avoid this problem and toanalyze landscape morphology in a mannerstrongly tied to its hydrologic response, we haverelied on the digital terrain model, TOPOG(O'Loughlin 1986; Moore et al. 1988b; Vertessyet al. 1990).
TOPOG grids the data points, smooths the datato remove sinks, draws contours and then linesroughly normal to the contours (minimum distance lines) that extend up from low elevations toridges. These lines are approximately the flowlines for shallow subsurface and overland flow, andthe combination of two adjacent flow lines intersecting two successive contours divides the landsurface into distinctly shaped elements. For eachelement, the total contributing area, a. can be calculated and the ratio alb from the bottom contourlength of the element. The local slope, M. is the
sine of the gradient from the contour interval divided by the average length of the flow lines joining them in an element.
In order to link runoff and erosion processes tolandscape morphology, we took advantage of theelement shape created by TOPOG to classify eachelement into divergent, planar, and convergentmorphology. We used the simple criterion that if[bl - bl)/[bl -r bl) exceeded a set percentage-change, the element fell into one of the three categories. Here M and bl are the contour length ofthe upslope and downslope sides of the element,respectively. This percentage change is somewhatarbitrary. We chose the smallest values estimatedto be relatively free of artifacts of the model(<-0.10 is convergent, >0.10 is divergent, otherwise planar) to resolve the fine-scale topography.Figure 4 shows the spatial distribution of the threeelement types for our map representation of oursite with 5 m contour intervals and average spacingbetween the "flow lines" of about 20 m. This combination of element size and criterion for shape distinction successfully shows the valley axes as convergent and the ridge lines as divergent. Therelative distribution of divergent and planar elements is, however, clearly dependent on flow linespacing and contour interval relative to the cnte-
Figure 4. Spatial pattern of convergent, planar, and divergent topographic elements in the larger, 1.2km2 catchment in figure 2 (modifiedfrom Dietrich et al. 1992).
Element Shape

Journal of Geology CENTENNIAL SPECIAL ISSUE 267
rion. If the percentage change requirement is heldconstant, then with decreasing spacing betweenthe flow lines and resultant narrowing of the elements, the planar elements spread upslope at theexpense of divergent ones, leaving just the triangular elements where the flow lines terminate alongthe ridge line. The extent of the convergent elements is much less sensitive to the size of the element.
Land surface morphology classified in this manner captures an aspect of both the form of the surface and its likely hydrologic behavior. The contour lines create a smoothed representation of thesurface, and in combination with the relativelybroadly spaced flow lines this tends to emphasizethe relative hydrologic convergence as comparedto the local detailed shape of the ground surface.We will use element classification to guide evaluation of Tlq. as shown below.
In order to make comparisons with our channelinitiation theory, we have also classified convergent elements as channeled or unchanneled. Channeled elements were identified by tracing the observed channel network (figure 2) onto acomputer-generated map of the catchment. Wefound that nearly all of the "channeled" elementsfell within the observed range ot topographicthreshold for channel heads of (-i/bhS2 = 200 mto (a/blS2 = 25 m reported by Montgomery andDietrich (1992) (figure 5) (here S is the tan B). Thisexcellent agreement between field-determined values of alb and tan 0 and that calculated from theDEM for channeled portions of the landscapestrongly supports the use of the DEM as an accurate representation of the actual ground surface.Only where the threshold relations are proiectedto steep slopes where channels do not occur in thefield do the planar and unchanneled elements alsofall within this range. We will discuss this later.
Further evidence of the reliability of the datacomes from comparing the computed alb andslope data using TOPOG with that from a completely different grid-based digital terrain modeldeveloped by Bauer (pers. comm. 19921. For all elements, the average of the logarithm of alb is 58.9m using TOPOG and 59.0 using Bauer's model,■"he average slope of the elements is 23.4° usingTOPOG, whereas the average slope using Bauer'smodel is 22.5°. In both cases the standard deviations were essentially identical. This suggests thatartifacts peculiar to a particular digital terrainmodel are minimum.
Building upon the characteristic form conceptpopularized by Kirkby (1971), Willgoose (1989) hassuggested that in a slope-area analysis of the kind
f m2.
^ E XChanneledConvergentPlanarDivergent
Slope (tan 6)
Figure 5. Comparison of the area per unit contourlength versus ground slope data generated from the digital terrain model, TOPOG, with the upper and lowerlimit (solid lines) of channel head data given in figure3. A total of 5632 elements were classified by shape.Channeled convergent elements were identified usingthe network map in figure 2. Symbols represent the average of the log values of alb for uniform log classes ofground slope. Individual data points are shown in Dietrich et al. (1992).
.
in figures 2 and 5, hillslopes should show a systematic increase in contributing area with increasingslope (a convex profile), because hillslope form ispresumably set by slope-dominated transport processes. Channeled portions of the landscape shouldshow a systematic decrease in slope with increasing drainage area because of the importance of water runoff as well as slope in the transport process(a concave profile), and the length of the hillslopewould be reflected in a distinctive inflection pointon a area-slope or slope-area graph of elements derived from a digital terrain model. Tarboton et al.(1991) have subsequently claimed to observe thisinflection point in their analysis of digital elevation data, but this may be an artifact of their analysis of low resolution USGS DEM's. Furthermore,an innovative theoretical analysis based on stability theory by Loewenherz (I99la. 1991b) suggeststhat the channel head may extend upslope of theinflection point. While there is a clear change inthe contributing area-slope relation associatedwith the transition from divergent to convergentelements (figure 5), there is no simple inflection inour data.

268 W I L L I A M E . D I E T R I C H E T A L4
Threshold* Analysis
The thresholds of saturation (equation 2), slope stability (equation 4), and erosion by saturation overland flow (equations 10 and 11) are functions of alb and M; hence the derived threshold equationscan be readily compared with the observed distribution of element types. This comparison canplace significant constraints on the appropriateness of the threshold and, in effect, permits a rational approach for evaluating the parameters in eachof the threshold theories. In fact, given the assumption of steady-state runoff, such a comparison maybe the only reasonable way to parameterize fullythese theories.
Threshold of Saturation. All three thresholds arecontrolled at least partly by the ratio of transmis-sivity to runoff rate [Tlq). In the threshold of saturation (equation 2) Tlq is the slope of the line relating alb to -VI. There are at least three ways toassess [Tlq). Field measurements, such as pumptests on piezometers, can provide estimates of T,and q can be selected from precipitation records.Given the high spatial variability of T and the uncertainty of what exactly q is (because of thesteady-state assumption), this method of assessingTlq cannot be used. Based on an intensive hydro-logic study near our field site (Wilson 1988), weestimate the transmissivity to be about 17 m2/dand, surprisingly, not to vary significantly withtopographic position (hollow versus ridge) becauseof the dominance of the high conductivity of thesurface soil. This estimate must still be consideredextremely crude, but without some other constraint, we have no rational way of choosing a significant steady-state q to drive the erosionthresholds.
Another method, which at least would helpevaluate the general validity of the model, wouldbe to map in a watershed the farthest upslope extent of saturated areas developed from a large precipitation event and determine whether this position has a similar value of al(bM] throughout thebasin, as expected from equation (2). We have attempted to do this, but because of an extendeddrought in California, we have had very little opportunity to make observations. It is also difficultto locate field observations with the precision necessary to identify which element it belongs to inthe digital terrain model. The last significant overland flow event was in March of 1989 after aroughly 0.08 m rainfall. For six different hollows,it appears the al(bM) value for the farthest upslopeextent of surface saturation ranged from 200 to atleast 2000 m, with four of the points apparently
falling between 500 to 1000 m. If T is roughly l7m2/d, then q in this case would be 0.034 to 0.068m/d. No landslides occurred during this event, butsome of the smallest upslope channel tips didscour, and a carefully monitored channel head advanced about 0.4 m upslope.
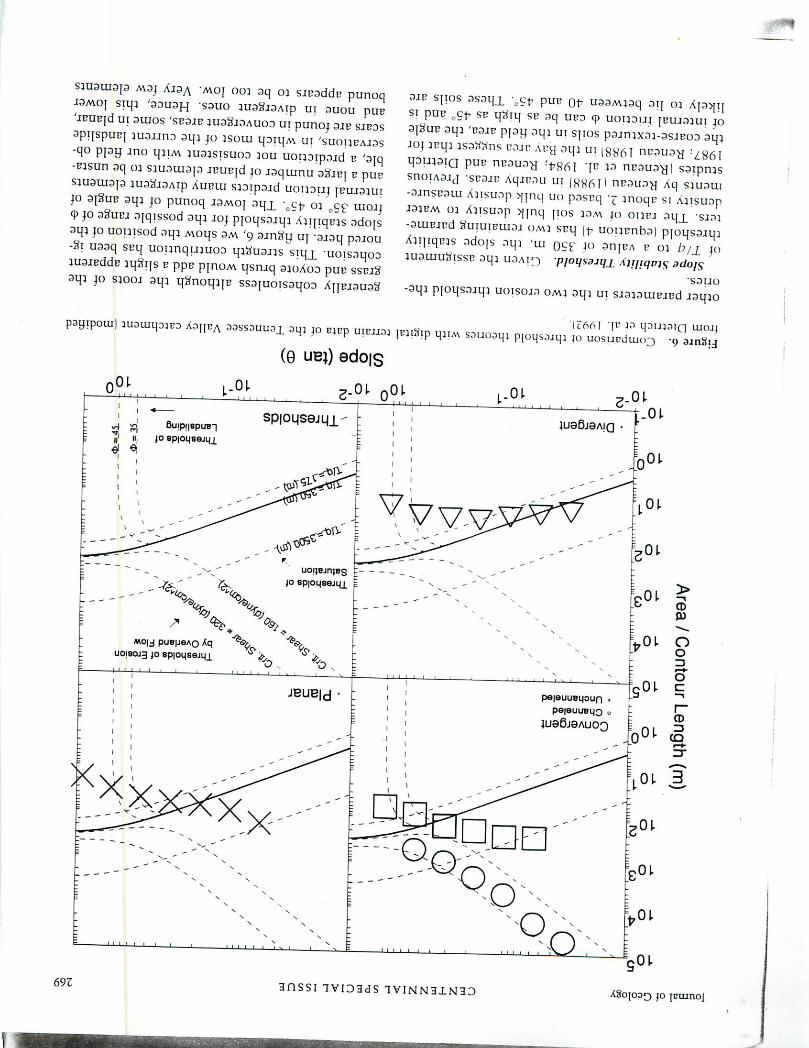
A third method to estimate Tlq. and one thatseems most appropriate for a general threshold oferosion investigation, is to use the landscape morphology to place constraints on the possible valueof Tlq. Based on both field observations and whatwe would expect from simple physical intuition,we would not expect the divergent elements,which are almost exclusively found on the ridges,to experience saturation. Furthermore, the lowergradient convergent elements making up channeled and unchanneled valleys ought to becomesaturated during events large enough to cause land-sliding or channelization by saturation overlandflow. Figure 6 shows the saturation threshold linefor three values of Tlq plotted against the variouselement types. Clearly, a value of about 350 m forTlq causes nearly all divergent elements to be unsaturated while nearly all of the convergent andchanneled ones are saturated (figure 6) (see Dietrich et al. 11992) for comparison with individualdata points). The vast maionty of the planar elements are also predicted to be unsaturated, whichseems reasonable. This value of Tlq would requirea q of 0.05 m/d if T is 17 m2/d. To judge whetheran 0.05 m/d roughly steady-state runoff is possible,we used the simple analytical model of Iida (1984)to estimate that it would take roughly 9 days for a59 m long planar slope (approximate mean slopelength here) to reach steady-state with a transmissivity of 17 m2/d and rainfall of 0.05 m/d. A stormabout this magnitude (0.40 m) and duration occurred near here in 1986 (Wilson 1988). The maximum precipitation recorded in 10 days at a raingage in this general area is 1.1 m (California Dept.Water Resources 1981). Figure 7 shows the extentof ground water saturation for steady-state runoffand a Tlq of 350 m. The saturated region, with fewexceptions, is confined to the valley network ofchanneled and unchanneled convergent topography. Some of the long triangular saturated patchesalong the divide are clearly artifacts of the model,but otherwise the predicted saturated topographyappears consistent with field observations.
Although we cannot conclude that we knowwith any precision an appropriate value of Tlq, theabove analyses place significant constraint on it.The estimated value of 350 m is not unreasonable,based on field observations. In the analysis to follow, we will take Tlq as fixed and evaluate the
sjuotuop moj AjoA -mo, ooi oq oj sipaddp punoqiOMO{ Siqj 'ODUOH SOUO JU0_i3Aip ui ouou pup'Jeuprd ui slugs 'spojp juoSjoauoo ui punoi DIP SJP3SapHspuBj vxuira aqi p isoui qDiqM ui 'suoijpajos-qo ppy Jno qjiM juojsisuod jou uoijDipo.d p 'oiq-eisun oq 03 sjuouiop ruuFjd jo laqumu aSiBi b put!siuouiop juoSiOAip Aupiu S.Dip3jd UOUOUJ puiOJUIJO orgup oqj p punoq jomot 9_tX -^ OJ' Qe moj.9 JO dSupi sjqissod oq. joj ppqsDjqj Ajqiqpjs adoiswp jo uoijisod oq. Moqs dm '9 DinSy up^n poiou-31 uaaq spq uoijnqujuoD qjSuous siqX uoisoqooauoipddp jqgiis b ppc pinoM qsmq djoAod pue sspiS3q3 p sjooj aqj qgnoqjp ssaruoisaqoa Aqpiauog
3JB SH°S 3S3HJ- oft pup Of uooMioq oq 03 Ap>n,si puc oet sp qgiq sn oq una q> uoijduj tpujdju. pargUB oqj 'pdip ppy 0Lp Ul slIOS p3Jnjxoj.asjE03 oin
JOJ jpqj jsottms bojb Apg oqi u, |8861 ncauny ^qomoiQ puP npouoy .>86I -p 3D nMu^, *™*snoiAOjj -spo.p Aqipau u. |886T) npouoy Aq sj'uom-o.nspaui Ansunp >Hnq uo pasBq >z lnoqp si AjisuopJoipm 01 Aiisuop .jjnq nos jaM 10 oijbj oqX sidj-ompiPd Suiuipuio. omj Spq lt- uo.jpnbo) proqsaiujA^qiqpjs odop aqj •__, QS£ }0 3n|UA r OJ ^ £.itioiuuSissp aqj U3A,D PIous3jU1 AmqD,s 3d0fS
"SOUO-aqj ppqsajqj uoisojo omj oqj ui siojoiupjEd roqjo
p o y i p o t u , j u o t u q ^ o X o „ - A _ 3 S S D U U 0 J _ o q j p e j C p u ^ , c l l S i p q 3 l A , „ P l o q s o J q j ' ^ I S 1 I ^ ^ ^ ™
(0 ubj) edois
H fl S S I I V I D H c I S 1 V I N N H 1 N 3 3ASojosq jo pjiunoj
PI3?-! .sisApup oqj jo Ajiaijisuosut oqj jo jopjijjp upsiqj sj -sonpA qgiq qons OAPq ostb ppoq [ouupqooqj uioij odo[suMop rpA\ spuupqo japjo-joq8iqi,uop AqAA aSuBJ pjoqsoiqj ppaq puupqo aqj jossooxo ui san[PA zS[q/o) aApq saupjnquj lodoojsoqi jo suoXupa >poipoq moiieu oqj ui sjuouio[o
oqj Ajuo jpqj si ojou dm oinjpoj puooss oqx 'sno-nutjuoosip dip spuupqo AqM uiETdxo osp A[qpuins-Did pjnoqs uoijeijiui puupqo ioj Aiooqj ppqsoiqjV •tionounl puupqo lopio loqgiq p qjiM uou-ounl oqj jp guijpuigiio Ajqiqpjsm Aq uoAtip jou dipsjouupqo Aipjnqiij oqj jpqj sjsoSSns AtSuoijs uou
moi ooi iuaipe-6 aiqeisaiqeisun
ajnssejd sjod luaioujnsui -iqeisAhiiqbis adore
it
"j oi > 2s(q/e)"j 9. > Ssiq/B) > uj oi j|
"J 002 > ^SfP/B) > uj 52ui 002 < 2S(q/B-loysajqi DiqdBj6odoi
TV 13 HDl^J.3ia 1 wvmiM
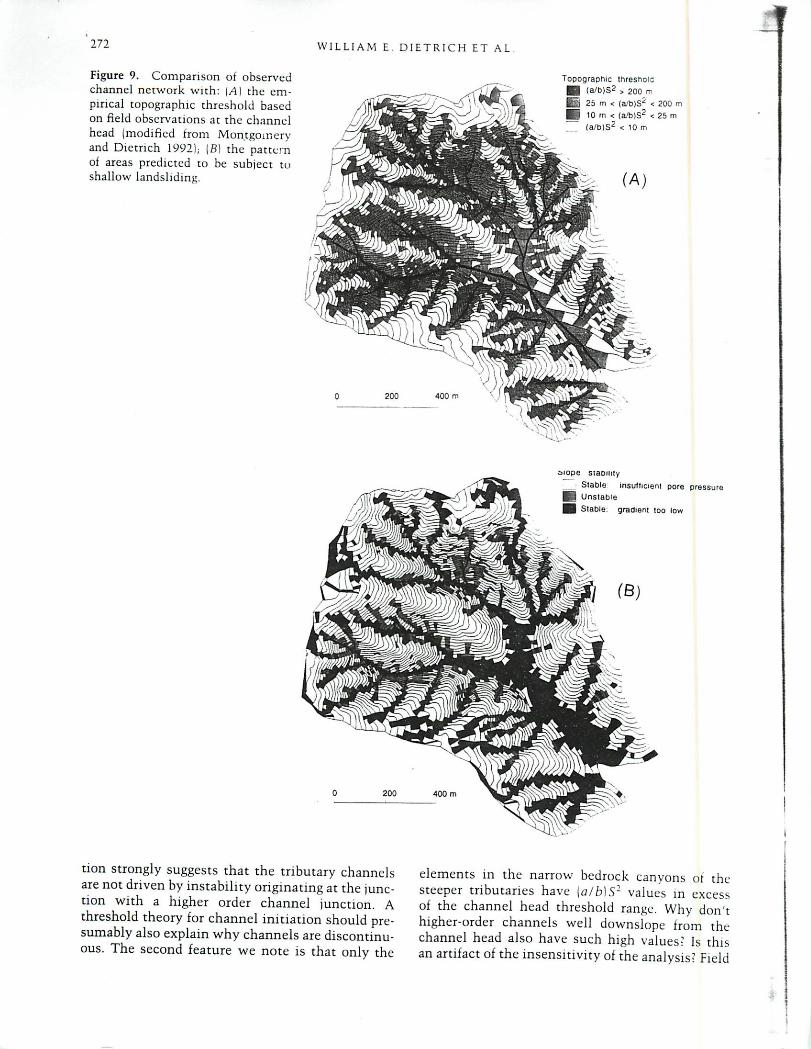
_uipqspuc[ A.ojpqso: joolqns oq oj poioipoid sboie jou-irjued oqj \g) :|£66I qoujaifj put?AjoutoSjuota; uioij poyipotu) peoqpuupqo oqi je suoijEAiosqo ppy uoposEq pjoqsoiqj oiqdp.Sodoi pouid-tuo oqj {v) :qjiM _jioa\iou jouucqopo/uosqo jo uosuedui03 "6 a^nSij
III
[ournal of Geology CENTENNIAL SPECIAL ISSUE 273
Relative sediment transport capacityI | Above 2000
1500 - 20001000 - 1500500 - 1000
0.2 - 500Below 0.2
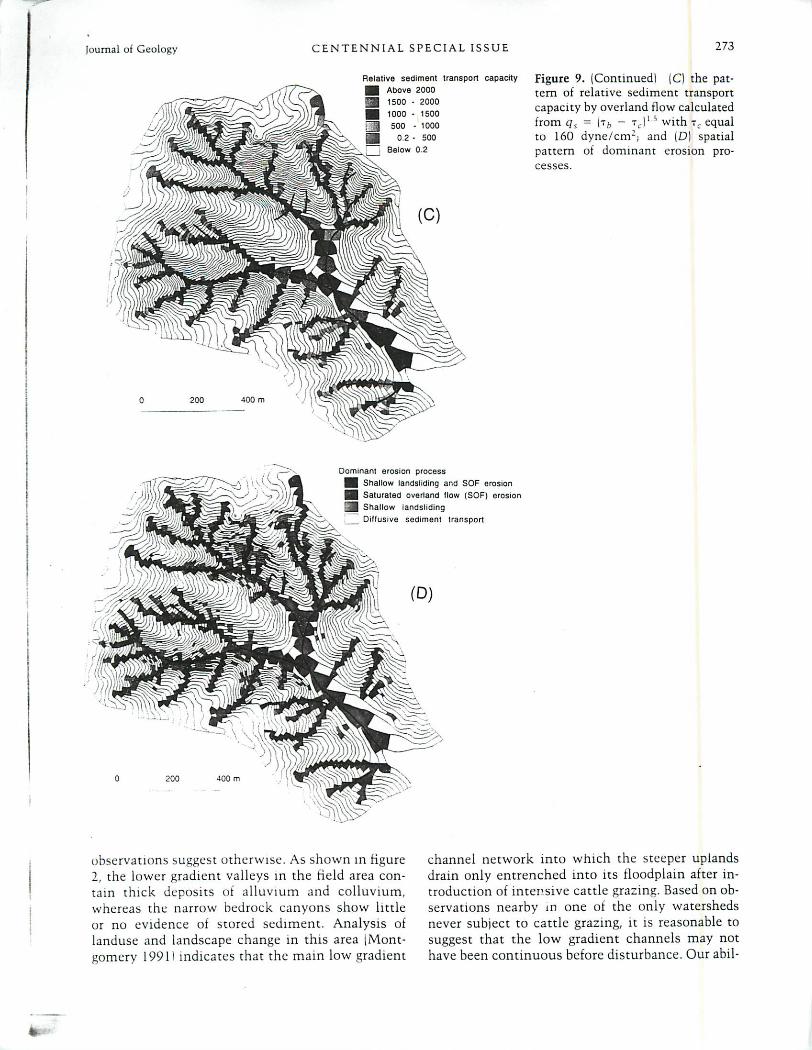
Figure 9. (Continued) (C) the pattern of relative sediment transportcapacity by overland flow calculatedfrom cjs = |7,, - tJ1 3 with tc equalto 160 dync/cirr; and (D) spatialpattern of dominant erosion processes.
Dominant erosion processj Shallow landsliding and SOF erosion
| Saturated overland flow (SOF) erosion| Shal low landsl id ing__ Diffusive sediment transport
2 0 0 4 0 0 m
observations suggest otherwise. As shown in figure2, the lower gradient valleys in the field area contain thick deposits of alluvium and colluvium,whereas the narrow bedrock canyons show littleor no evidence of stored sediment. Analysis oflanduse and landscape change in this area (Montgomery 1991) indicates that the main low gradient
channel network into which the steeper uplandsdrain only entrenched into its floodplain after introduction of intensive cattle grazing. Based on observations nearby in one of the only watershedsnever subject to cattle grazing, it is reasonable tosuggest that the low gradient channels may nothave been continuous before disturbance. Our abil-
•274 W I L L I A M E . D I E T R I C H E T A L
ity to analyze this problem is limited because theelements in the low gradient valleys are quite largeand the local hydraulics within an element associated with a channel are likely to be quite differentthan that estimated from the element as a whole.Nonetheless, the field observations and topographic analysis suggest a tendency for the low gradient valleys to aggrade with poorly defined channels when unaltered by landuse.
The third and fourth features of figure 9_4 haveto do with the unchanneled elements within ornear the threshold range of channel initiation.While none of the channel heads extend below the(a/b)S2 of 25 m, many elements lying above thisvalue are unchanneled. Most of these elementsform distinct linear patches on the steep sideslopes of the bedrock canyons and lie in subtle hollows. Empirically we would argue that these elements lie in areas prone to channelization, but either because of local variations in such propertiesas saturated conductivity and friction angle or, andmore likely, because of a tendency for diffusivesediment transport to fill in channels here the siteslack mappable channels. If these elements lieabove the erosion threshold, the latter interpretation seems most plausible. The fourth feature, andone that Montgomery and Dietrich (1992) emphasized, is the tendency for elements with the valueof (alb)S1 just below 25 m to lie at the topographictransition from valley to ridge. Montgomery andDietrich (1992) argue that this strongly suggeststhat ridge and valley development and ultimatelytheir spacing is influenced by the threshold ofchannel initiation. To be consistent, the erosiontheories described above should not predict surfaceinstability upslope of these elements.
Figure 95 shows the pattern of elements predicted to be unstable for a Tlq of 350 m and a <|> of40° and their relationship to the channel network.As discussed above, these parameters are reasonably well constrained by topographic analysis andobservations; nonetheless, there remains significant uncertainty about the full extent of the potentially unstable ground. The comparison with thechannel network shows that nearly half of thechannel heads lie in or just below areas predictedto be above the slope stability threshold. The vastmajority of the unstable elements, however, do notdrain directly to a channel head nor lie on the pathof a channel. Hence, while landsliding can contribute to channel head advance upslope, the tendencyfor landsliding alone is not sufficient to maintaina channel. On the other hand, many of these unchanneled, but unstable elements do correspond tothe elements either within the channeled range of
[a/bjS1 or just below it (compare with figure 9A).These observations indicate that the linear patchesof unchanneled elements within the channel headrange shown in figure 9_4 correspond to unstableareas that just lack sufficient runoff to maintain achannel.
In figure 9C, the pattern of relative sedimenttransport capacity (-,, - -,)'3 is mapped and compared with the observed channel network. Although channel incision is expected to occur oncea critical boundary shear stress is exceeded (andpossibly supercritical flow occurs), if the divergence of the boundary shear stress and thereby sediment transport field is negative downslope, aggradation and smothering of any channelizationtendency is likely. In comparing the excess relativesediment transport capacity with the observedchannel network it is worth remembering how approximate the parameters are in the boundaryshear stress model and the large scale of the element relative to the size of the channel. Nonetheless, the similarity throughout the basin of resultsfor 35 different tributaries for a single set of parameters supports the mechanistic interpretation proposed here.
In most of the tributaries, the channel head liesslightly downslope of the point where the boundary shear stress exceeds the critical value for saturation overland flow erosion. The other channelheads generally correspond to sites where landsliding predominates. Relative sediment transport increases downstream along the channel network,but for all nine discontinuous tributaries, thedownstream end of the channel corresponds to thereach where the relative sediment transport declines downslope. A decline in the downslope direction also occurs along the network where thechannels leave the narrow canyons and enter thebroad valley, in agreement with the historical tendency for deposition to occur in the lower valleyand possibly have only a poorly formed channel.This seems to provide strong support for the general structure of our model.
Most of the unchanneled elements that liewithin the channel head range of [a/b)S2 and alongthe valley axes are predicted to be unstable due tosaturation overland flow erosion (compare 9C._4).Although this is good correspondence between thethreshold theory and the observed topographicthreshold, it does not explain why these elementsremained unchanneled. One simple answer, whichpresumes the model to be reasonably accurate, isthat the assumed critical boundary shear stress androughness are slightly incorrect for application ofthis model to the field observations. Figure 10

wm.
Journal of Geology CENTENNIAL SPECIAL ISSUE 275
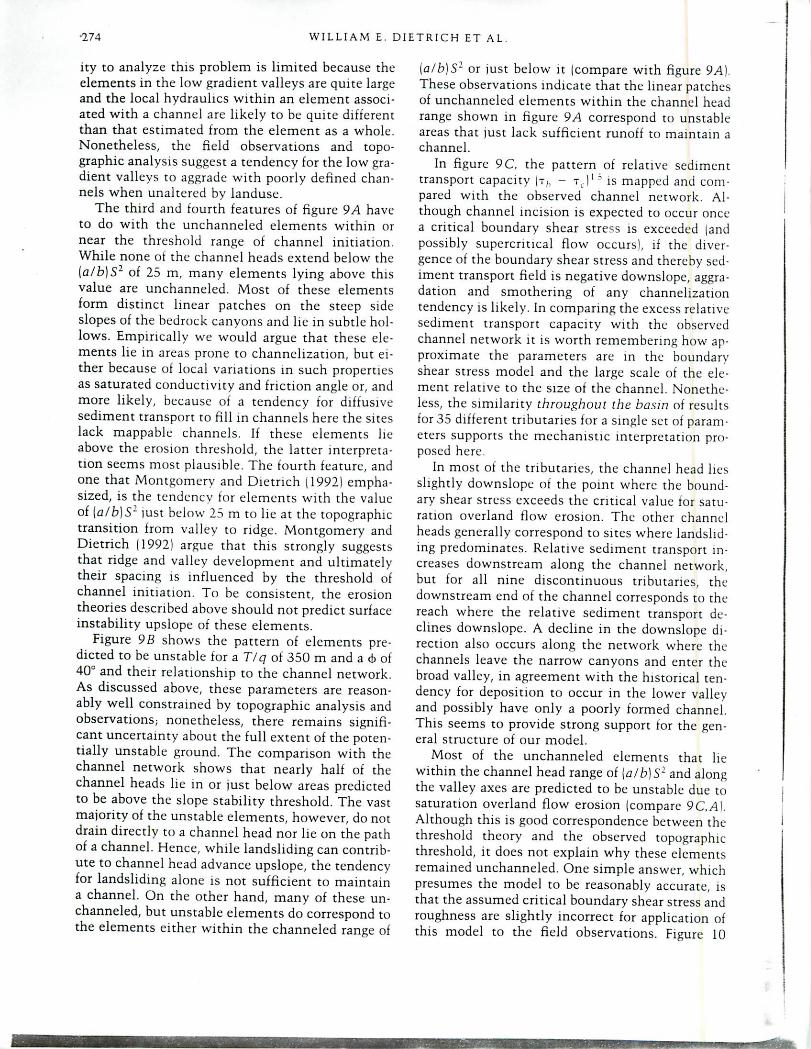
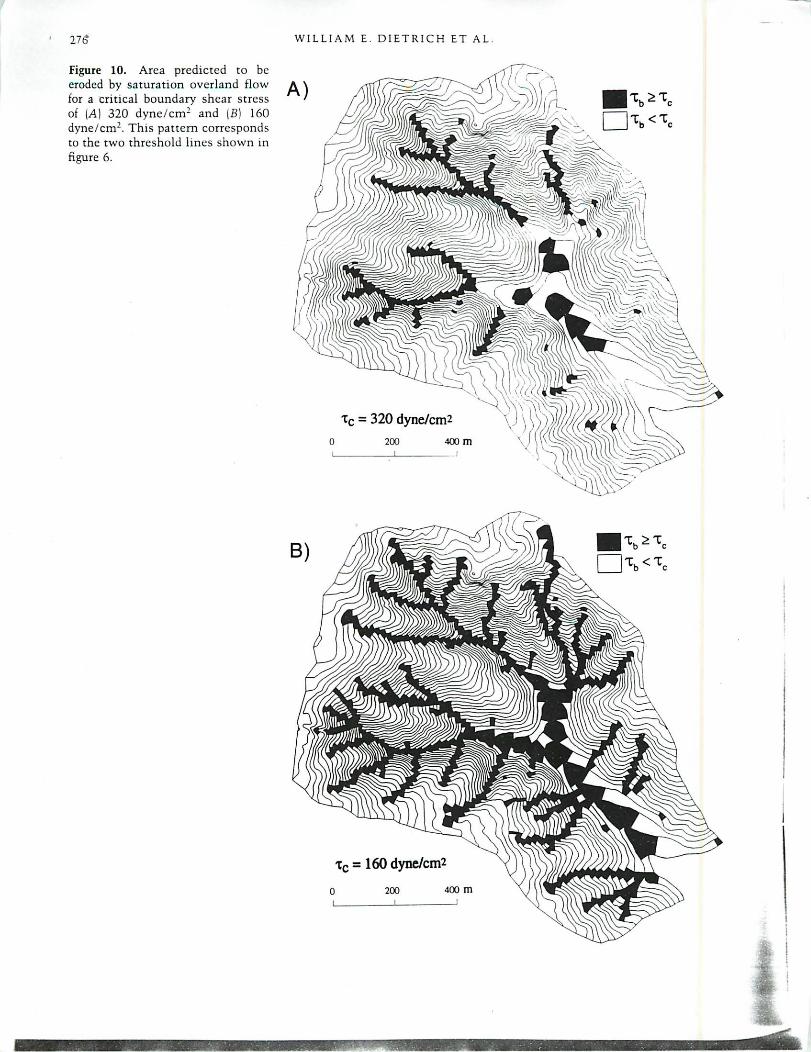
shows the effect of changing the critical boundaryshear stress by only a factor of two. Because of thethird power dependency on critical boundary shearstress in the threshold model, a huge difference inthe extent of channel network (elements above thecritical boundary shear stress) is predicted withsmall changes in tc. This implies that the difference between observed and predicted channel network in figure 9C is explicable by a small modification of the tc. Unfortunately, for the purposes offield verification of this erosion threshold model,this result suggests that critical boundary shearstress is an important parameter which is virtuallyunknowable at the level necessary to test modelpredictions. While it will be useful to determinewhether tc is 1000 or 100 dyne/cm2 from field experiments, we will likely not be able to characterize it for an entire basin to within 50%. Hence,like saturated conductivity or transmissivity, critical boundary shear stress, even though it has asmaller range of values, may not be a parameterthat can be sufficiently well-known from just fieldobservations and an "effective" value must be estimated from response of the system as a whole.
If we accept the general validity of the saturation overland flow erosion threshold model, thenour model results clearly demonstrate that changesin land use or climate that alter the surface resistance to erosion should have a dramatic effect onthe stability of the channel network. Cattle grazingin this area reduced the critical boundary shearstress and caused significant expansion of thechannel network (figure 10).
Figure 9D summarizes the spatial significanceof different erosion processes predicted from thethreshold theories. It shows the ridge lines dominated by diffusive (slope-dependent) sedimenttransport processes that feed sediment to landslide-prone planar and subtle convergent slopes bordering the ridges and valley sides. Surface runoff in thelarger valleys then conveys the sediment furtherdownstream. Mapping of process dominance, asshown in figure 9D, should prove useful in catchment sediment budget studies. A more formidabletask is the development of sediment transport lawssupported with field observations that permit routing of sediment down hillslopes and along thechannel network.
ConclusionsWith the development of digital terrain models capable of analyzing large sets of digital elevations,it is now possible both to quantify the detailedtopography of landscapes and to explore process-
based models in explaining mappable features. Oneof the most useful features to map is the channelnetwork. We have shown that it can be used toplace significant constraint on erosion theories. Parameterization of such theories may be quite difficult because of the high spatial variability of thecontrolling parameters and the sensitivity of themodel outcome to their values. Instead of relyingon field observations alone for evaluation of theparameters, the topography and the extent of theobserved channel network itself can be used to determine the parameters. But once such a calibration is done, application elsewhere is needed tovalidate the model.
Despite this limitation, the comparison between the threshold theory of saturation, erosionby saturation overland flow, and threshold of slopeinstability and the observed topography and extentof the channel network in our field area suggestsseveral conclusions. The upslope extent of thechannel network is controlled by a combination ofslope instability and erosion by saturation overlandflow. These two thresholds have very different a Ib to M relationships and should not be representedby a single function, as some may choose whenexamining the empirical data. Although seepageerosion may also be important, our analysis suggests that it is not required. While slope instabilitycontributes to channel head advance, it alone doesnot control the tendency for channelization: overland flow appears to be required. Hence, there aremany steep areas bordering the channeled valleysthat cross the topographic threshold for channelization, but remain unchanneled because onlyshallow landsliding occurs. In other, steeper environments with greater relief, perhaps debris flowscour from landsliding can act to cut channel-likefeatures, thus reducing the importance of overlandflow. Application of our model to locations in Oregon and Washington support this interpretation.
The threshold of erosion by saturation overlandflow varies as the third power of critical boundaryshear stress. Consequently, the extent of the channel network incised by erosive overland flow variesdramatically with changes in surface resistance.This helps explain the widespread gullying in thegrazing land surrounding the San Francisco Bayand probably many other areas where overlandflow is important in channel incision.
Application of the models proposed here toother landscapes with similar erosion processeswill require high resolution digital elevation models to capture the topographic control on runoffand erosion mechanisms. The models proposedhere should be quite general to landscapes where
J i
27b*
Figure 10. Area predicted to beeroded by saturation overland flowfor a critical boundary shear stressof [A) 320 dyne/cm2 and [B) 160dyne/cm2. This pattern correspondsto the two threshold lines shown infigure 6.
WILLIAM E. DIETRICH ET AL

Journal of Geology CENTENNIAL SPECIAL ISSUE 277
shallow subsurface and saturation overland flowrunoff mechanisms predominate. For model evaluation, detailed mapping of the channel networkand location of landslide scars is essential. Suchdata are rarely available at present.
ACKNOWLEDGMENTS
This research was supported by National ScienceFoundation Grant EAR-8917467, Grant TFW-FY92-010 from the CMER and SHAMW commit
tees of the Washington State Timber/Fish/Wildlifeagreement, and Australian Center for CatchmentHydrology (Wilson). We thank the U.S. Department of Agriculture Forest Service, Pacific Southwest Region, Engineering Staff for providing accessto an analytical stereo plotter for generating thedigital elevation data. Rob Reiss conducted theTOPOG simulations and generated the plots usedhere. This paper was greatly improved by the generous comments of three anonymous reviewers,and by Keith Loague and Mary Power.
REFERENCES CITED
Beven, K., and Kirkby, M. I., 1979, A physically basedvariable contributing area model of basin hydrology:HydroL Sci. Bull., v. 24. p. 43-69.
Black, T., and Montgomery, D. R., 1991, Sedimenttransport by burrowing mammals, Mann County,California: Earth Surt. Proc. Landforms, v. 16, p. 163—172.
California Department ot Water Resources, 1981, Rain-iall-depth duration trequency.
Dietrich, W. F., and Dunne, T., 1993, The channel head,in Beven, K., and Kirkby, M. I., eds., Channel Networks Hydrology: Chichester. Wiley, p. 175—219.
; Wilson, C. ).; Montgomery, D. R.; McKean, [.,and Bauer, R., 1992, Erosion thresholds and land sur-tace morphology: Geology, v. 20, p. 675-679.
Dunne, T., 1978, Field studies ot hillslope flow processes, in Kirkby. M. |., ed.. Hillslope Hydrology:Chichester, Wiley, p. 227-293.
, 1980, Formation and controls ot channel networks: Frog. Phys. Geog., v. 4, p. 211-239.
-, 1990, Hydrology, mechanics, and geomorphicimplications of erosion by subsurface flow, in Higgins, C. G., and Coates, D. R.. eds., Groundwater geomorphology: the role ot subsurface water in earth-surface processes and landtorms: Geol. Soc. AmericaSpec. Paper 252, p. 1-28.
, and Aubrv. B. F., 1986, Evaluation of Horton'stheory of sheetwash and rill erosion on the basis offield experiments, m Abrahams, A. D., ed., HillslopeProcesses: Boston, Allen and Unwin, p. 31—53.
-, and Dietrich, W. E., 1980, Experimental study ofHorton overland flow on tropical hillslopes; 1. Soilconditions, infiltration and trequency ot runoff; 2. Hydraulic characteristics and hillslope hydrographs:Zeits. tur Geomorph. Suppl. Band 35, p. 40-80.
Fairfield, H., and Lcymane. P.. 1991, Drainage networkstrom grid digital elevation models: Wat. Resour. Res.,v. 27, p. 709-717.
Gilbert, G. K., 1909, Convexity ot hilltops: lour. Geology, v. 17, p. 344-350.
Horton, R. E., 1945, Erosional development ot streamsand their drainage basins: Geol. Soc. America Bull.,v. 56, p. 275-370.
Iida, T., 1984, A hydrological method of estimation ofthe topographic effect on the saturated throughflow:Jap. Geomorph. Union Trans., v. 5, p. 1-12.
Kirkby, M. [., 1971, Hillslope process-response modelsbased on the continuity equation: Inst. Brit. Geog.Spec. Pub. 3, p. 15-30.
, 1978, Implications for sediment transport, inKirkby, M. I., ed., Hillslope Hydrology: Chichester,Wiley, p. 325-364.
Loewenherz, D. S., 1991d. Stability and the initiation ofchannelized surface drainage: a reassessment of theshort wavelength limit: lour. Geophys. Res., v. 96, p.8453-8464.
, 1991b, Stability and the role of length scale-dependent material transport in the initiation and development of surtace drainage networks: Unpub.Ph.D. dissertation, University ot California. Berkeley.
Montgomery, D. R., 1991. Channel initiation and landscape evolution: Unpub. Ph.D. dissertation, University of California, Berkeley.
, and Dietrich, W. E., 1988, Where do channelsbegin-: Nature, v. 336, p. 232-234.
, and , 1989, Source areas, drainage density,and channel initiation: Water Resour. Res., v. 25, p.1907-1918.
, and Dietrich, W. E., 1992, Channel initiation andthe problem of landscape scale: Science, v. 255, p.826-830.
Moore, 1. D.; Burch, G. J.; and MacKenzie, D. H., 1988a.Topographic effects on the distribution of surface soilwater and the location of ephemeral gullies: Trans.Am. Soc. Agnc. Eng., v. 31, p. 1098-1107.
; O'Louiihhn, E. M.; and Burch, G. [.. 1988b. Acontour-based topographic model tor hydrological andecological applications: Earth Surt. Proc. Landforms,v. 13, p. 305-320.
O'Loughlm, E. M., 1986. Prediction ot surface saturationzones in natural catchments by topographic analysis:Water Resour. Res., v. 22, p. 794-804.
Rantz, S. E., 1968, Average annual precipitation and run-oft in north coastal California, U.S. Geol. Survey HydroL Atlas 298: scale 1:1,000,000.
Reid, L. M., 1989, Channel incision by surface runoff

178 WILLIAM E. DIETRICH ET AL
in grassland catchments: Unpub. Ph.D. dissertation,University of Washington, Seattle.
Reneau, S. L., 1988, Depositional and erosional historyof hollows: application to landslide location and trequency, long-term erosion rates, and the effects of climatic change: Unpub. Ph.D. dissertation, Universityof California, Berkeley, 328 p.
; Dietrich, W. E.: Wilson, C. |.; and Rogers, |. D.,1984, Colluvial deposits and associated landslides inthe northern S. F. Bay Area, California, USA: Proc.Fourth Int. Sym. Landslides (Toronto), p. 425-430.
, and , 1987, Size and location of colluviallandslides in a steep torested landscape: Int. Assoc.Hvdrol. Sci. Pub. 165, p. 39-48.
-; Donahue, D. }.-, lull, A. J. T.; and Rubin,M., 1990, Later Quaternary history of colluvial deposition and erosion in hollows, central CaliforniaCoast Ranges: Geol. Soc. America Bull., v. 102, p.969-982.
Slattery, M. C, and Bryan, R. B., 1992, Hydraulic conditions for rill incision under simulated rainfall: a laboratory experiment: Earth Surf. Proc. Landforms, v. 17,p. 127-146.
Smith, T. R., and Bretherton, F. P., 1972, Stability andconservation of mass in drainage basin evolution: Water Resour. Res., v. 8, p. 1506-1529.
Tarboton, D. G.; Bras, R. L.; and Rodriguez-Iturbe, I.,
1991, On the extraction of channel networks fromdigital elevation data: Hydro. Proc., v. 5, p. 81-100.
Vertessy, R. A.; Wilson, C. |.; Silburn, D. M.; Connolly,R. D.j and Ciesiolka, C. A., 1990, Predicting erosionhazard areas using digital terrain analysis: Int. Assoc.Hydro!. Sci. Pub. 192, p. 298-308.
Wahrhaftig, C, 1984. Structure of the Marin HeadlandsBlock, California: a progress report, in Blake, M. C.|r., ed., Franciscan Geology of Northern California:Soc. Econ. Palcont. Mineral. Pacific Coast Sec, v. 43,p. 31-50.
Willgoose, G. R., 19S9, A physically based channel network and catchment evolution model: Unpub. Ph.D.dissertation, Massachusetts Institute of Technology,Cambridge, MA.
; Bras, R. L.; and Rodriguez-Iturbe, I., 1991, A coupled channel network growth and hillslope evolutionmodel: Water Resour. Res., v. 27, p, 1671-17Q2.
Wilson, C. |., 1988, Runoff and pore pressure development in hollows: Unpub. Ph.D. dissertation, University of California, Berkeley, 284 p,
, and Dietrich, W. E., 1987, The contribution ofbedrock groundwater flow to storm runoff and highpore pressure development in hollows: Int. Assoc. Hvdrol. Sci.. v. 165, p. 49-59.
Yahn, M. S., 1972, Mechanics ot Sediment Transport.Pcrgammon Press, 290 p.
J