analysis of differential financial impacts of lwr load
TRANSCRIPT

INL/EXT-19-55614 Revision 1
Analysis of Differential Financial Impacts of LWR Load-Following
Operations
Paul W. Talbot Pralhad Burli James D. Richards Aaron S. Epiney Mohammad G. Abdo Cristian Rabiti Richard D. Boardman September 2019

DISCLAIMER This information was prepared as an account of work sponsored by an
agency of the U.S. Government. Neither the U.S. Government nor any agency thereof, nor any of their employees, makes any warranty, expressed or implied, or assumes any legal liability or responsibility for the accuracy, completeness, or usefulness, of any information, apparatus, product, or process disclosed, or represents that its use would not infringe privately owned rights. References herein to any specific commercial product, process, or service by trade name, trade mark, manufacturer, or otherwise, does not necessarily constitute or imply its endorsement, recommendation, or favoring by the U.S. Government or any agency thereof. The views and opinions of authors expressed herein do not necessarily state or reflect those of the U.S. Government or any agency thereof.

INL/EXT-19-55614 Revision 1
Analysis of Differential Financial Impacts of LWR Load-Following Operations
Case Study: Economic Dispatch of Palo Verde Generating Station in a Regulated Market in Arizona
Paul W. Talbot Pralhad Burli
James D. Richards Aaron S. Epiney
Mohammad G. Abdo Cristian Rabiti
Richard D. Boardman
September 2019
Idaho National Laboratory Idaho Falls, Idaho 83415
http://www.inl.gov
Prepared for the U.S. Department of Energy Office of Nuclear Energy
Under DOE Idaho Operations Office Contract DE-AC07-05ID14517

ii

iii
ABSTRACT
This document reports the application of HERON (Holistic Energy Resource Optimization Network), a newly-developed RAVEN (Risk Analysis Virtual ENvironment) plugin for grid and capacity optimization, to a case study conducted in collaboration with Arizona Public Service (APS). The study is a work in progress; this report presents a description of HERON and results from applying it to a particular consideration of interest to APS.
APS is anticipating several operational challenges. The first is rapid growth of Variable Renewable Energy (VRE) sources such as wind and solar power providing energy to the grid in the APS service region. This creates challenges for baseload operation of the Palo Verde Generating Station (PVGS), a nuclear power plant co-owned and operated by APS. The second challenge for APS is a change in the cooling water acquisition contract with the Sub Regional Operating Group (SROG). The existing contract is expiring soon, and a renewal is only available for a significantly higher price of water. These two challenges represent a difficulty in maintaining profitability for PVGS as local area demand is highly fluctuant and water prices may increase. Furthermore, excess production at PVGS is currently traded on the Palo Verde energy Hub (PVH), which occasionally offers very low or negative locational marginal prices (LMP) for electricity.
This analysis considers using HERON to analyze the potential benefits of occasional economic dispatch via power ramping of PVGS as a method to mitigate unprofitable production hours. Similar to load following, optional economic dispatch would allow APS to elect curtailment of PVGS as low as 70% of its nominal operating level between the hours of 08:00 and 16:00 provided local area demand is met and it is profitable to do so. This document reports a stochastic differential analysis of the Net Present Value (NPV) of PVGS as operated by NPS as a result of optional economic dispatch.
To model this differential case, HERON has been designed from previous efforts in the APS case study as a generic tool to accelerate the design and execution of RAVEN workflows for technoeconomic analysis of grid energy systems. HERON leverages both RAVEN and the CashFlow plugin for RAVEN to stochastically explore or optimize a response surface with energy grid system production capacities as inputs and mean NPV as a goal function. HERON performs these evaluations by stochastically sampling market, weather, and demand events using RAVEN’s ARMA reduced-order model capability to generate boundary conditions for dispatch optimization. The algorithm performs the dispatch optimization for each of the synthetic scenarios. For this case, HERON designs workflows to simulate behavior of the PVH, wind, solar, and APS local area demand, and uses these synthetic scenarios to stochastically evaluate the differential benefit of economic dispatch for each scenario.
While this study finds economic dispatch to be a potential source of revenue, the magnitude of the differential NPV is sufficiently small that it is unlikely a priority for increasing the profitability of PVGS. Further, the differential NPV shrinks throughout the simulated years, suggesting the long-term benefit of such operation given current assumptions is negligible.

iv
CONTENTS
FIGURES .......................................................................................................................................................v
TABLES .........................................................................................................................................................v
ACRONYMS ............................................................................................................................................... vi
1. INTRODUCTION ...............................................................................................................................7
2. APS CASE DESCRIPTION ................................................................................................................9 2.1 Status Quo .................................................................................................................................9 2.2 Load Following ....................................................................... Error! Bookmark not defined.
2.2.1 General Discussion ......................................................................................................9 2.2.2 Application to Palo Verde Generating Station ...........................................................11
3. ECONOMIC ANALYSIS MODEL DESCRIPTION .......................................................................13 3.1 HERON ...................................................................................................................................13
3.1.1 Stochastic Optimization for Component Sizing .........................................................14 3.1.2 Generic Dispatch Optimization ..................................................................................15 3.1.3 Application to APS ....................................................................................................16
4. SIMULATIONS ................................................................................................................................17 4.1 Inputs and Assumptions ..........................................................................................................17 4.2 APS Case Simulation ..............................................................................................................18
4.2.1 Example Dispatch ......................................................................................................18 4.2.2 Results ........................................................................................................................20
5. CONCLUSIONS AND FUTURE WORK ........................................................................................26 5.1 Conclusions .............................................................................................................................26 5.2 Ongoing Work .........................................................................................................................26
6. REFERENCES ..................................................................................................................................27
v
FIGURES Figure 1: Two-loop Stochastic Optimization Workflow ............................................................................ 13 Figure 2: Full-Year Synthetic History Examples ........................................................................................ 18 Figure 3: 2019 3-day Synthetic History Examples ..................................................................................... 19 Figure 4: Full-Year Dispatch Examples ...................................................................................................... 19 Figure 5: 2019 3-day Dispatch Examples ................................................................................................... 20 Figure 6: Yearly Savings and Curtailment Trends ...................................................................................... 21
TABLES Table 1: Growth Factors for Synthetic Histories ........................................................................................ 18 Table 2: NPV Statistical Results ................................................................................................................. 22

vi
ACRONYMS
ARMA Auto Regressive Moving Average APS Arizona Public Service CAPEX CAPital EXpenditure CSV Comma-Separated Values EG Electrical Grid HERON Holistic Energy Resource Optimization Network HES Hybrid Energy Systems HPC High-Performance Computing IES Integrated Energy Systems IRR Internal Rate of Return LCOE Levelized Cost Of Electricity LMP Locational Marginal Pricing LWR Light Water Reactor MACRS Modified Accelerated Cost Recovery System MWh Megawatt Hour N-R HES Nuclear-Renewable Hybrid Energy Systems NHES Nuclear HES NPP Nuclear Power Plant NPV Net Present Value O&M Operations and Maintenance PVH Palo Verde energy hub PVGS Palo Verde nuclear generating station PWR Pressurized Water Reactor RAVEN Risk Analysis Virtual ENvironment VRE Variable Renewable Energy source XML eXtensible Markup Language
7
Analysis of Differential Financial Impacts of LWR Load-Following Operations
Case Study: Economic Dispatch of Palo Verde Generating Station in a Regulated Market in Arizona
1. INTRODUCTION This document reports the application of newly-developed HERON (Holistic Energy Resource
Optimization Network), a plugin for the RAVEN (Risk Analysis Virtual Environment) framework, to a case study conducted in collaboration with Arizona Public Service (APS), the operating owner of the Palo Verde Generating Station (PVGS) nuclear power plant. The APS case study is a work in progress; this report presents a description of HERON and corresponding results for a particular consideration within the APS study. The goal of this report is to demonstrate HERON for analysis of a regulated market and determine how suitable it is to reproduce the driving technoeconomic phenomena in order to capture sufficient complexity to allow utilities working in regulated markets to apply HERON and its results to inform strategic decisions.
Based on existing development in the Nuclear-Renewable Hybrid Energy Systems (N-R HES) software framework [1-2, 14-21], development of HERON was initiated this year at Idaho National Laboratory (INL) in an effort to expedite assembling RAVEN workflows for technoeconomic grid energy system analysis. HERON approaches this task in two ways: creating a simplified user interface (UI) by which grid analysts can have their systems translated to RAVEN workflows; and providing a generic grid dispatch optimization algorithm. In order to provide a sufficiently generic algorithm, HERON makes no assumptions about the resources (i.e. water, hydrogen, electricity) that various components (power plants, industrial facilities, etc) produce or consume, or the economics of the construction or operation of these components. HERON evaluates values for the technical and economic factors of a grid energy system from three sources: fixed/parametric values, RAVEN ARMA histories, and Python-based transfer functions of arbitrary design. HERON attempts to build the most economic dispatch of the components in the system such that constraints are met and profit is maximized (or cost to the system is minimized).
HERON is applied to this APS case study as a technoeconomic evaluation accelerator. APS is currently experiencing market conditions where power pricing reflects the regional excess Variable Renewable Energy (VRE) generation during low seasonal demand. Particularly in the spring and fall, the locational marginal pricing (LMP) for electricity at the Palo Verde energy Hub (PHV) can be low and even negative. When the LMP is below the marginal operational cost of producing electricity at PVGS, producing power in excess of local net demand (defined as local demand less the production from local VREs) is a net loss for APS.
In this study, we consider the potential increase in Net Present Value (NPV) available by performing power maneuvering at PVGS as an alternative to curtailing commercial renewable generation to avoid low or negative LMP at PVH. This power maneuvering has several constraints: PVGS must supply power to meet local demand after Variable Renewable Energy (VRE) sources such as wind and solar are dispatched (defined as “net demand”); economic dispatch is defined as any one of three units at PVGS ramping power twice per day, once at 08:00 down as low as 70% of its capacity, and once at 16:00 back to full power (equivalent to PVGS full power production ramping to 90% of its production during the same time); economic dispatch is limited to day-ahead dispatch based on projected net electricity demand. For those days in which the opportunity cost of producing electricity (mostly water acquisition and treatment costs) less the revenue of trading electricity at PVH is positive, economic dispatch is a profitable option. Restated, economic dispatch is employed when electricity price at PVH is lower than the operation and maintenance costs to PVGS due to water usage.

8
The limitation for economic dispatch is based on the ownership and physical conditions of the three nuclear units at PVGS. At any time during the year, one of these units may be offline for reloading or maintenance, another unit is in the later stages of its fuel cycle, and the third unit is in the early stages of its fuel cycle. Economic dispatch is only viable for the third unit, due to complications with power maneuvers for units late in their fuel cycle. Furthermore, APS is one of seven owners of PVGS, and economic dispatch is assumed to be limited to the APS share of total generation for each unit. Thus, any one unit may ramp power production to 70% of capacity, or equivalently PVGS may ramp power production to 90% of full capacity.
The economic assessment of economically dispatching PVGS is considered differentially with respect to current status quo operation of PVGS for the years of 2019 through 2048. During this time, it is expected that wind power will increase through 2022, solar power installations will increase throughout the project, local area demand will increase, and the LMP at PVH will exhibit more extreme variability. Through generating RAVEN workflows, HERON assembles these inputs and boundary conditions and statistically determines the expected value of increased NPV as the result of economic dispatch operation.
Section 2 describes the case in further detail. Section 3 describes the development of algorithms governing HERON. Section 4 contains the inputs, assumptions, and simulation information. Section 5 explores an alternate case with greatly increased VRE growth. Section 6 contains conclusions and some suggestions for further studies.

9
2. APS CASE DESCRIPTION As discussed previously in [2], there are three particular challenges posed to the Palo Verde
generating station (PVGS). One comes as a result of expected increases water costs in the future, resulting in higher operations and maintenance (O&M) costs for PVGS. The second challenge rises from increased penetration of Variable Renewable Energy (VRE) generators in the APS region leading to increased volatility in the net demand (regional demand less VRE generation), increasing the frequency at which net demand is lower than the APS-owned portion of PVGS’s capacity. APS has roughly one-third ownership in the generation at PVGS. Finally, the increase in VRE throughout the Independent System Operators (ISO) trading at the Palo Verde energy hub (PVH) could increase frequency of low LMP at PVH. The combination of low LMP, low local area net demand, and nonzero variable O&M naturally leads to considering the opportunity cost of PVGS running at full power versus the possible benefits of economic dispatch in select periods of time to maximize profitability.
An effort was made in [2] to consider the impact of negative pricing at the PVH at times when production exceeded local area demands, and it was determined that insufficient occurrences of negative prices exist in the region to suggest economically dispatching PVGS. This case expands consideration in two major ways: including the O&M savings from reduced water consumption; and projecting future changes in LMP at PVH in a stochastic representation.
2.1 Status Quo The current nominal behavior of PVGS is to run all operating units at full power, providing energy to
PVGS and the local area energy demands. Once local net demand is satisfied, the remaining electricity is sold at the PVH at whatever price is currently offered; APS participates in the CAISO’s Western Energy Imbalance Market and market conditions at PVH determine regional power pricing. As demonstrated in [2], this price occasionally drops to low and even negative values, although rarely. At the hours when prices at PVH are negative, energy in excess of net demand produced at PVGS represents a financial loss. Furthermore, the marginal cost of producing electricity at PVGS is not negligible due to water consumption. Water in the APS operating region is a valuable commodity, distinguishing PVGS variable operation costs from most operating nuclear plants in the United States.
Due to factors such as fuel contracts [1], the marginal cost for producing energy at a nuclear generating station is negligible; all of the costs are typically represented by capital expenditures. However, due to the cost of water in the Southwest region of the United States, a notable marginal cost for operating PVGS is the water acquisition and treatment cost. The amount of water consumed to cool the reactors and produce electricity at PVGS is a function of both the time of year as well as the power level of the three units. As a result, the opportunity cost of exceeding local demand includes both the (potentially negative) prices at PVH as well as the variable O&M costs due to water use. For convenience of convention, we consider the opportunity cost negative if the O&M cost per megawatt is greater than the PVH price per megawatt.
2.2 Economic Dispatch 2.2.1 General Discussion
One potential source of relief for negative opportunity costs is to consider economic dispatch via curtailment at nuclear generating stations during overproduction hours. Owing to high fixed costs and low variable costs at NPPs, traditionally they have operated as baseload sources of energy. However, the proliferation of renewable energy sources, which often produce intermittent supply streams of electricity, has made balancing the demand and supply variations a major challenge for utilities. Furthermore, increased electricity supply from such alternate sources has also resulted in negative prices in some deregulated markets – adversely impacting the economic viability of NPPs, as discussed above. Other factors that necessitate flexibility in electricity generation at NPP include having a high percentage of

10
total generating capacity from nuclear (e.g. France, Belgium, Slovakia etc.), large nuclear generating units in a small electrical system (e.g. new entrants in the nuclear industry such as Turkey, UAE, Belarus), transmission system capacity constraints for NPPs, environmental regulations limiting non-nuclear generation, and changes in electricity market rules [3].
In order to overcome these challenges and adjust their electricity supply capabilities to match variations in daily/seasonal electricity demand, NPPs in several parts of the world are implementing load following practices. Load following can be described as a system wherein the operator modifies the level of generation output at a short notice to keep it in line with the demand requirements. Since electricity demand cannot be precisely predicted in advance, utilities have to monitor the grid and alter generation to the desired level. Barring certain old design nuclear reactors, most modern light water nuclear reactors are capable of operating in load following mode. This entails an ability to alter their power level either one or two times per day in the range of 100 - 50% or lower of their rated power, with a ramp rate of up to 5% or more of rated power per minute [5]. However, based on the specific design on the plant and the extent of maneuverability, certain modifications from operational and maintenance perspectives may be required to support load following operations [6]. Additionally, load following operations could result in greater wear and tear of some components such as control rods, valves, pumps that are used more frequently [7], although it has been suggested these complications are negligible [4].
As noted earlier, an important characteristic of NPPs is the high proportion of fixed costs vis-à-vis operations and maintenance costs and fuel costs. Some studies indicate that for nuclear power, capital investment represents about 60% of the total levelized cost, approximately 20% for operations and maintenance and less that 20% for fuel [8]. As a result, once constructed, the marginal cost of electricity generation at NPPs is low and barely varies with the level of output [9]. This dynamic has been one of the primary drivers of operating NPPs at baseload irrespective of the wholesale price of electricity. Yet, NPP operations differ across countries and from one region to another based on technical and economic factors including the energy mix. Therefore, multiple factors need to be analyzed based on the peculiarities of the case at hand to help decision makers in evaluating the potential payoffs from pursuing load following operations.
In France, nuclear power constitutes more than 75% of the country’s energy mix, load following practices are relatively common. Similarly, several NPPs in Germany have also adopted load following in order to accommodate intermittent power generation from renewable sources. However, such practices are rare in the United States. In the United States, only the Columbia Generating Station (CGS), a commercial NPP located in the Pacific Northwest, adjusts its power generation in response to the variations in demand via a process that is referred to as load shaping [10]. Load shaping is necessitated during the spring season owing to the potential spill-over at the hydroelectric plants in the Bonneville Power Authority network and is performed in accordance with the guidelines approved by the United States Nuclear Regulatory Commission. At CGS, load shaping is achieved by either adjusting the reactor recirculation flow by which the generating capacity is maneuvered to 85% of full power or by adjusting the control rods to drop power generation to 65%. However, the requests to adjust generation must be received by the NPP at least 12 hours in advance for generation to be lowered to 85%, 48 hours for reduction to 65%, and 72 hours for a complete shutdown [10].
Meanwhile, it is well known that power plants use large quantities of water for cooling needs, and against the backdrop of water supply constraints owing to population growth and economic development, their water use has attracted scrutiny in recent years [11]. Khamis and Kavvadias [12] provides a detailed assessment of challenges associated with water management and emerging trends at NPPs. They assert that NPPs consume between 20 and 83% more water than coal power plants of the same capacity, and given competing water uses (for agriculture and sanitation) as well as water scarcity in many parts of the world, efficient water management has gained importance at NPPs [12]. Lack of adequate and usable water resources could have important economic implications for the viability of NPPs compared to other energy sources. The International Atomic Energy Agency (IAEA) has an ongoing program to evaluate

11
developments pertaining to the use of desalinated water for nuclear energy operations; however, other potential sources of water include wastewater from municipalities, agricultural run-off, and brackish groundwater, which obviate the need to use freshwater for heat dissipation at NPPs [12, 13]. While the issue of water scarcity is important, NPPs could also achieve substantial cost savings through a more efficient use of water through design and operational improvements ensuring better financial performance. Adopting economic dispatch practices could translate into lower water consumption at NPPs and offer the potential for mitigating water acquisition and treatment expenses whilst boosting overall profitability.
2.2.2 Application to Palo Verde Generating Station For the purposes of this study, APS as joint-owners and operators of PVGS have suggested a few
limitations on load following for this study:
• The decision to load follow must be taken at close of business on the day before economic dispatch is to occur.
• If the choice is made to dispatch economically, the power profile for PVGS follows a set pattern, reducing power by up to 30% of full capacity for a continuous 8 hours from 08:00 to 16:00. This follows the so-called “duck curve” of energy demand and supply from VREs.
• If load following, the level at which to curtail is chosen so that the local demand is always met; that is, the curtailment is limited by the maximum net demand during economic dispatch hours.
While not as flexible as hourly load response, this envelope approach offers a method to mitigate day scenarios when the PVH LMP is low in coincidence with low local demand. APS also suggested there is a maximum allowable 50 daily load follow cycles per year. In this study we compare the number of desired economic dispatch days to this limitation.
It is important to note the difference between moment’s-notice load following as a correctional factor and the choice to dispatch economically in a day-ahead load following behavior. While load following often suggests rapidly adjusting plant operation in response to changes in load behavior, in this study we consider load following to be a day-ahead choice on whether to curtail operations during part of the following day.
The choice to load follow in this study will be made based on the projected water usage and LMP at PVH for the next operating day. This assumes good forecasting of the demand, LMP, solar, and wind generation for the next day. In this study, we will assume complete knowledge of weather, market, and demand events. We further consider APS trading at PVH as an hourly day-ahead market. As such, the results obtained are a theoretical stochastic limit for the benefits of economic dispatch at PVGS given the operation constraints above.
The opportunity cost of producing electricity in a day is determined as follows:
𝐶" =18&𝐶',) − 𝐶+,)
,-
)./
, (1)
where • ℎ indexes the hour of the day, • 𝐶" is the opportunity cost of producing electricity for that day, • 𝐶',) is the cost of acquiring enough water to produce one megawatt hour (MWh) of electricity, • 𝐶+,) is the LMP at PVH expressed in dollars per MWh.
12
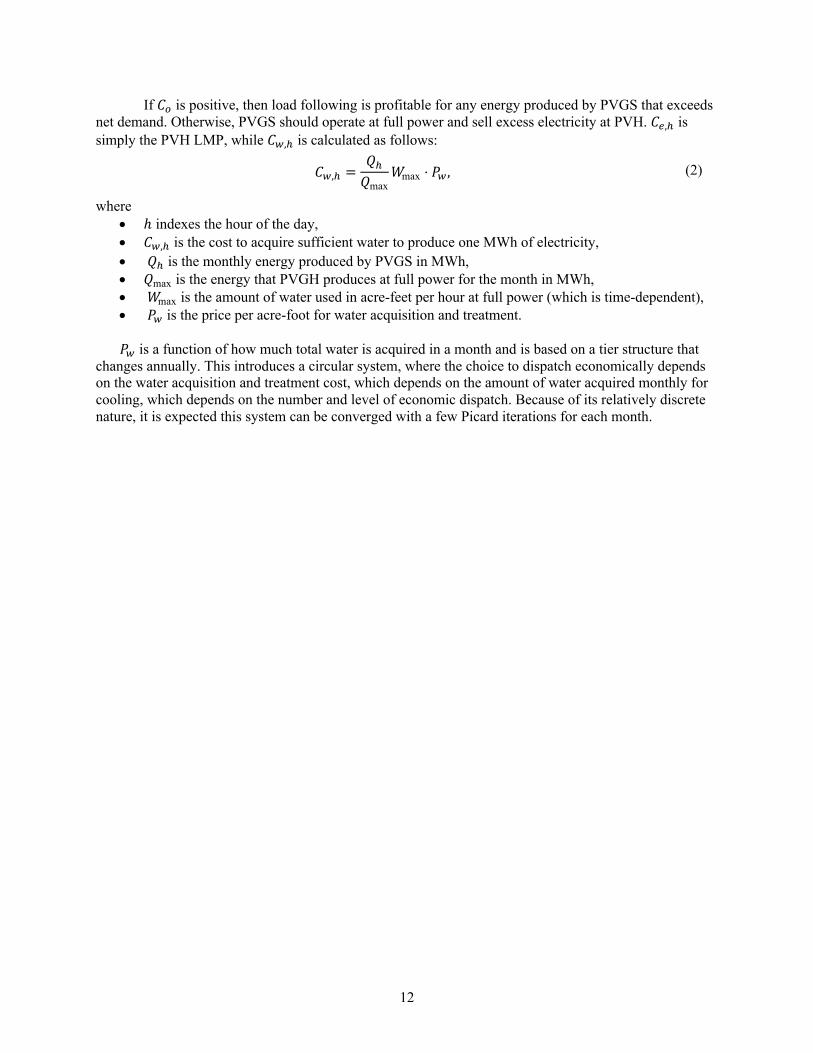
If 𝐶" is positive, then load following is profitable for any energy produced by PVGS that exceeds net demand. Otherwise, PVGS should operate at full power and sell excess electricity at PVH. 𝐶+,) is simply the PVH LMP, while 𝐶',) is calculated as follows:
𝐶',) =𝑄)𝑄max
𝑊max ⋅ 𝑃', (2)
where • ℎ indexes the hour of the day, • 𝐶',) is the cost to acquire sufficient water to produce one MWh of electricity, • 𝑄) is the monthly energy produced by PVGS in MWh, • 𝑄max is the energy that PVGH produces at full power for the month in MWh, • 𝑊max is the amount of water used in acre-feet per hour at full power (which is time-dependent), • 𝑃' is the price per acre-foot for water acquisition and treatment.
𝑃' is a function of how much total water is acquired in a month and is based on a tier structure that
changes annually. This introduces a circular system, where the choice to dispatch economically depends on the water acquisition and treatment cost, which depends on the amount of water acquired monthly for cooling, which depends on the number and level of economic dispatch. Because of its relatively discrete nature, it is expected this system can be converged with a few Picard iterations for each month.

13
3. ECONOMIC ANALYSIS MODEL DESCRIPTION This section summarizes the current status of stochastic grid energy dispatch optimization. In particular,
it focuses on the extension of previous methods to a generic approach using HERON, a RAVEN plugin that focuses on constructing RAVEN workflows for grid energy system analysis.
3.1 HERON Since its inception the integrated energy systems program has been acquiring the knowledge,
technology, and methodologies to analyze grid energy systems in a stochastic manner [1, 2, 14-18]. Over the last several years [1, 2], workflows have been developed in RAVEN [19] to perform stochastic optimization of grid energy systems. These workflows are intended to optimize or construct a response surface for the average economic performance of grid energy system portfolios, particularly with respect to the size of each component in the grid energy system. This optimization is performed stochastically in a two-loop approach, as in Figure 1. These workflows have previously been generated manually and served as a significant learning curve necessary to perform energy grid analysis in RAVEN. HERON overcomes two obstacles: generating RAVEN workflows automatically through an energy grid analyst centered input and providing a generic grid energy system dispatch optimizer.
Figure 1: Two-loop Stochastic Optimization Workflow
HERON’s optimization workflow starts with selecting sizes for each of the components in the grid energy system. The algorithm then proceeds into the inner loop, which is performed many times per cycle in the outer loop. The inner loop starts by generating synthetic stochastic time histories for uncertain variables such as energy prices, solar and wind production, and energy demand. These stochastic histories are generated by sampling previously-trained supervised learning algorithms. RAVEN uses a combination of Fourier decomposition and cross-correlated ARMA [20-22] algorithms in tandem. Each stochastic history is generated such that the same samples for each inner loop are correlated (i.e., residential demand is high when temperature is high) but each iteration of the inner loop has independent sampling. These stochastic histories serve as the boundary conditions for the dispatch optimization.
In the inner loop, once the stochastic histories are obtained, the system resources are dispatched in the most economical manner possible. The algorithm for obtaining this can come from one of two sources. HERON contains a generic resource optimization algorithm that dispatches each unit for each hour using a conservation and physics-based dispatch. HERON’s dispatch optimization algorithm makes no assumptions about the performance of various units and can theoretically dispatch any number of units with an arbitrary number of resources passing between them (such as steam, electricity, hydrogen, and so forth). Due to its general nature, however, the dispatch decision making can be greatly accelerated through writing a vectorized dispatcher specific to the system. For instance, if the marginal costs of multiple electricity-producing components are constant at any power level, this assumption can be made
MeanEconomic
Metrics
Stochastic opt.or
Sensitivity analysis
Synthetic time
histories
Economic Analysis
Optimal dispatch
StatisticalTreatment
NewGrid
System

14
once and used thereafter; whereas HERON’s dispatch never assumes marginal costs and recomputes them at every decision-making opportunity. There is a tradeoff between the general applicability of HERON’s dispatcher and writing a use case dispatcher for speed. In general, if a system is sufficiently straightforward to quickly vectorize, it is beneficial for speed to do so.
The task of the dispatcher is to dispatch the units in the grid energy system in the most economical way possible to meet the problem constraints, for every hour in each year of the simulation. Once this ideal dispatch is obtained, economic metrics are calculated using the CashFlow module [23], a plugin for RAVEN. These metrics are often the net present value (NPV) of the system over the project life, the internal rate of return (IRR) required for the system to be profitable over the project left, or the levelized cost of a resource required to be profitable for the system over the project life. Each of these metrics is single valued for an iteration of the inner loop.
Once all the inner loops have been calculated, the collection of economic metric evaluations are evaluated statistically. The mean of the metric is returned to the outer loop. If the outer loop is mapping the response of the system, a new portfolio is selected and the process begins again. If the outer loop is searching for the optimal portfolio, the mean of the economic metric is used to guide the optimization algorithm, and the process continue to convergence. Both the inner loop and outer loop are described in more detail in the following sections.
3.1.1 Stochastic Optimization for Component Sizing Generally speaking, the objective of the RAVEN workflows constructed for IES are to determine the
optimal sizing of various units in a grid energy system such that the resulting mix will perform optimally for a wide range of potential stochastic conditions. These stochastic conditions may include weather events such as solar and wind availability, and commodity markets including electricity availability and demand. Rather than solving the optimal sizing of units in the grid energy system to satisfy any one particular set of outcomes, we seek the portfolio that will be the most ideal on average.
The approach we use to address this stochastic problem is stochastic optimization. Stochastic optimization is similar to traditional optimization, except that it assumes the underlying model may not be deterministic. This allows it to iterate repeatedly in order to converge on a stochastically converged optimal point. Stochastic convergence in RAVEN is obtained via two methods: denoising and stochastic gradient determination.
Denoising describes the process of sampling a model many times to determine its average or most likely behavior. In HERON’s system, the number of times the inner loop is run to obtain distinct economic metrics for distinct scenarios determines the level of denoising. Depending on the sensitivity of the economic metrics to changes in the scenario, many iterations may be required to suitably converge the mean behavior of a portfolio mix.
Stochastic gradient determination is an extension to deterministic gradient descent minimization algorithms. While traditionally gradient descent minimization follows directions of steepest gradient descent to converge on local minima, stochastic gradient descent does not assume that previous gradients obtained are perfectly accurate. Without this assumption, stochastic gradient descent is free to traverse the response surface in a less deterministic method, while still converging on stochastically optimal average behavior.
HERON simplifies the process of performing stochastic optimization or response surface construction by creating RAVEN input files from a template more accessible to grid system analysts, translating components and resources into objects understood in the RAVEN input.

15
3.1.2 Generic Dispatch Optimization Aside from input generation, HERON’s major feature is a generic physics-based resource
optimization algorithm. Previous attempts at dispatch optimization include portfolio-specific algorithms without inertial terms (such as ramp rates and energy storage) as preprocessors to black-box gradient-descent algorithms [1] and black-box genetic algorithms with corrections for inertial terms [24] that have both proved useful in solving dispatch problems. While preprocessing can help inform gradient-descent and genetic optimization algorithms, these black-box algorithms mathematically explore the input space without information about the underlying physics. As a result, the optimization algorithms often consistently attempt to explore portions of the input space that are physically unviable, such as requiring unrealistic ramp rates or impossible unit performance. Furthermore, it can be time consuming to write an effective dispatching algorithm for each new portfolio to be considered.
HERON attempts to overcome both the portfolio-specific dispatch preprocessing and black-box optimization algorithm by performing generic physics-based economics-driven dispatch. Because HERON is able to directly inquire the behavior of components to determine what is physical, it can explore the economics space with more alacrity than an optimization treating the system as a black box. Because HERON is generic, it is able to easily add or remove arbitrary grid components consuming or producing arbitrary resources.
In order to dispatch components in a physical manner, HERON employs a conservation-based solver. That is, HERON’s primary dispatch routine is to balance resources throughout a grid system in the most economical way possible, within each time step. HERON begins a time step by dispatching all the fixed units. This may result in a balance with an excess or shortfall of some resources. Next, it dispatches the minimum for each component. These minima may be physics-constrained, such as if a unit can only ramp down so far in a given time step, or component-constrained, such as a minimum production level. The balance is updated with the minimal behaviors of the units in the system. After dispatching fixed terms and minima, HERON is potentially left with excess or shortage of some resources.
Having established the minimum starting point for all components, HERON then seeks the most optimal economical method to dispatch components as to reach a balance of zero in all resources; this is the essence of the dispatch optimization. This involves creating additional layers of decision trees; for each component that helps resolve an excess or shortfall, new imbalances may arise, causing a need for new decision. Once a branch reaches a balance of zero, it is compared with the other branches of the decision tree; the branch with the optimal economic metric is considered the optimal choice and the process continues.
As noted above, HERON’s dispatcher makes no assumptions about the behavior of any of the components, markets, or constraints in the system. It re-evaluates all values at each juncture, as changes in the dispatch of one component may affect the marginal cost of another. This constant evaluation results in a performance slowdown; HERON can take several seconds per dispatch hour to arrive at a solution for a system of a dozen components and several resources. However, this dispatch optimization strategy can be accelerated through representative clustering [22]. As mentioned above, any assumptions that can be made about the decision-making process that leads to vectorized algorithms represents a significant opportunity for speedup; in these instances, it is recommended to use a custom dispatcher instead of HERON’s generic approach.

16
3.1.3 Application to APS For the PVGS load following case considered in this work, there is no optimization or response
surface construction for the system; PVGS has a fixed size and other units are not under consideration for optimal sizing. As a result, only a single evaluation of the outer loop is necessary, allowing more computation effort to be placed in the inner calculation.
For the inner dispatch, the decision point for economic dispatch as a load-following behavior via curtailment is straightforward to vectorize. A custom dispatch written to perform the dispatch optimization performs several orders of magnitude faster in testing than HERON’s generic dispatcher, and so the custom dispatcher is used in this work.

17
4. SIMULATIONS 4.1 Inputs and Assumptions
For the sake of this economic dispatch analysis, there are several simplifying assumptions and inputs employed. This analysis is differential; that is, it compares the savings available due to exercising a economic dispatch when compared with nominal operation. As such, no capital or operating costs common to the two cases are considered; only the sales of energy exceeding local demand at the PVH and the variable O&M costs of water acquisition and treatment for PVGS operation are considered in the cash flow analysis.
Although PVGS is co-owned by multiple entities, it is assumed that only APS is benefited from exercising economic dispatch, limiting power ramping to the APS-owned portion of PVGS.
To avoid disclosure of business-sensitive information, a generic discount rate of ten percent annually is assumed for the benefitting entity. This discount rate is used in the NPV calculation to convert revenues and expenses from future activities into 2019 dollar equivalence. We assume an inflation rate of 2.184 percent and a tax rate of 21 percent, based on national published values over the last several years. The timeframe of consideration is from 2019 through 2048, comprising a 30-year study.
We assume that the day-ahead dispatch of energy-generating resources begins with the VREs (wind and solar), then PVGS, then other energy sources. In this manner, the demand seen by PVGS is a net demand, calculated as the local area demand less VRE generation. Most sources of wind and solar are not curtailable and dispatched at nominal operation, while wind and solar owned by APS are potentially curtailable. However, APS-owned resources are only curtailed if demand is completely satisfied using only VRE sources; they are still dispatched before PVGS in this study. As such, the minimum level that PVGS is curtailable to in a given day is the maximum net demand during economic dispatch hours.
APS has provided the data to determine water acquisition and treatment costs under current plans through 2048. This includes a multi-tier acquisition cost schedule computed on a monthly basis.
In order to synthesize VRE production and hence the net demand for PVGS, the behavior of wind and solar production must be considered. Publicly available power production histories for 2015 through 2018 have been used to train ARMA-based RAVEN surrogate models. In a similar fashion, public LMP values observed at the PVH were obtained for past years in order to train surrogate models for synthetic generation. We assume that all wind generation observes the same average wind speeds in a given hour, and similarly that all solar sources observe the same irradiance availability in a given hour.
To simulate future conditions, reasonable growth factor assumptions were agreed upon based on publicly available data. Table 1 shows the assumed growth modes and factors for the various synthetic histories. In the table, “growth factor” refers to the percentage growth each year in the year range. Growth mode is one of two options. If the mode is “linear”, then it is assumed that the same quantity of growth is added each year, resulting in a linear growth. If the mode is “exponential”, this assumes a compounded with the growth factor as a percent of the previous year, rather than the 2019 value, resulting in exponential growth. If a synthetic history is not expected to grow for a range, it is not listed below. Note that each year, regardless of growth, represents a unique statistical sampling of the synthetic history generator. These growth factors represent a change in the mean of each history; the yearly histories will still fluctuate stochastically, and the standard deviation of the fluctuations will grow with the mean.

18
Synthetic History Year Range Growth Factor (%) Growth Mode
Wind 2019 – 2022 21.62 linear
Solar (total) 2019 – 2022 10.32 linear
2023 – 2048 3.67 linear
LMP at PVH 2019 – 2048 1.50 linear
Local Demand 2019 – 2048 2.30 exponential
Table 1: Growth Factors for Synthetic Histories
4.2 APS Case Simulation 4.2.1 Example Dispatch
In order to clearly represent the results obtained during simulations, we consider here example synthetic histories and dispatches obtained in the RAVEN analysis. In particular, we consider a single sample from the 1000 taken. Figure 2 shows the total solar (green), total wind (red), and demand (blue) histories overlaid by the net demand (orange) for both 2019 and 2048 for this sample. While all histories grow throughout the project life, we observe that the net demand’s range grows with its mean, so that the lowest net demands observed at PVGS in 2048 are not remarkably different than the lows in 2019, while the maximum net demand observed is much greater in 2048 than in 2019.
Figure 2: Full-Year Synthetic History Examples; 2019 (left), 2048 (right)
Figure 3 shows close-up three-day windows into two particular days in May 2019. Because the net demand is low, these are particularly likely candidates for economic dispatch. In both of these days the demand is seen peaking during the midday and dropping during the evening, following the solar cycle, while wind generation is generally stronger during the night.
19
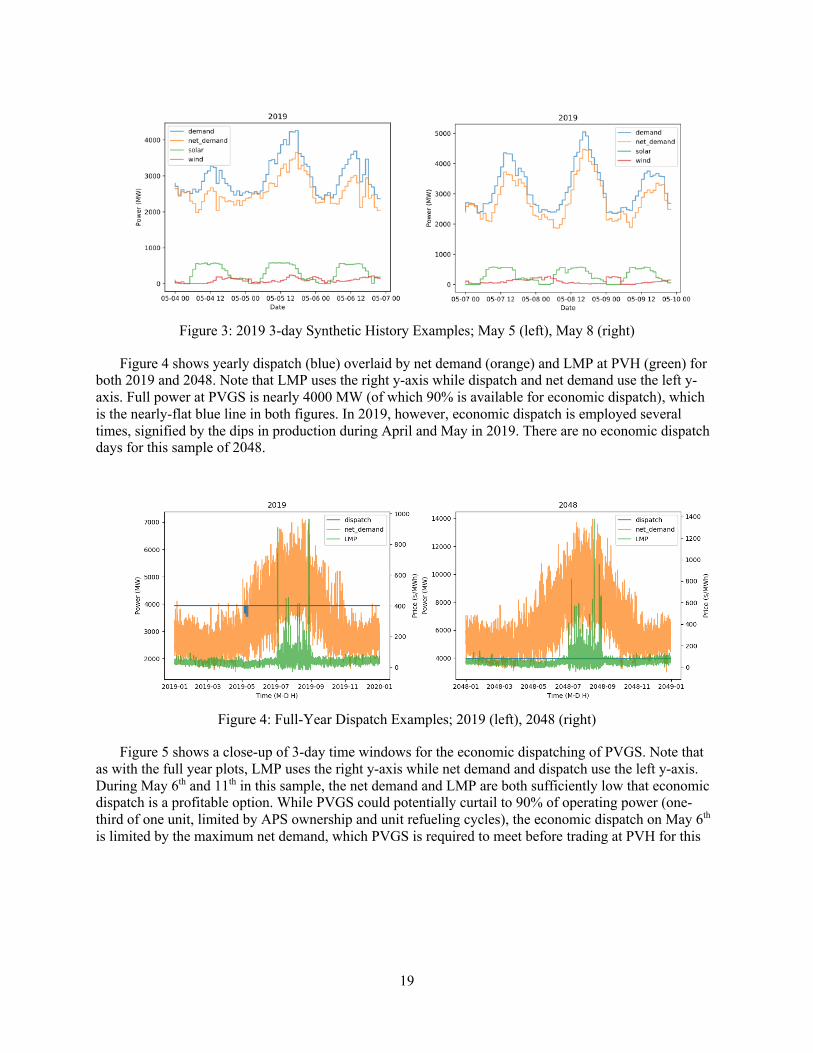
Figure 3: 2019 3-day Synthetic History Examples; May 5 (left), May 8 (right)
Figure 4 shows yearly dispatch (blue) overlaid by net demand (orange) and LMP at PVH (green) for both 2019 and 2048. Note that LMP uses the right y-axis while dispatch and net demand use the left y-axis. Full power at PVGS is nearly 4000 MW (of which 90% is available for economic dispatch), which is the nearly-flat blue line in both figures. In 2019, however, economic dispatch is employed several times, signified by the dips in production during April and May in 2019. There are no economic dispatch days for this sample of 2048.
Figure 4: Full-Year Dispatch Examples; 2019 (left), 2048 (right)
Figure 5 shows a close-up of 3-day time windows for the economic dispatching of PVGS. Note that as with the full year plots, LMP uses the right y-axis while net demand and dispatch use the left y-axis. During May 6th and 11th in this sample, the net demand and LMP are both sufficiently low that economic dispatch is a profitable option. While PVGS could potentially curtail to 90% of operating power (one-third of one unit, limited by APS ownership and unit refueling cycles), the economic dispatch on May 6th is limited by the maximum net demand, which PVGS is required to meet before trading at PVH for this

20
analysis. For these economic dispatch days, PVGS reduces power to the desired level for the hours of 08:00 to 16:00, following the “duck curve” of the net demand and LMP at PVH.
Figure 5: 2019 3-day Dispatch Examples; May 5 (left), May 8 (right)
4.2.2 Results To complete this study, one thousand scenarios are generated, each containing thirty years of
correlated hourly data for wind production, solar production, LMP at PVH, and local demand. These scenarios each exhibit mean growth for each variable according to Table 1. Each of these scenarios are optimally dispatched using the custom dispatching algorithm, which makes economic dispatch choices as discussed in Section 2.2.2 above. The savings from economic dispatch, defined as the opportunity cost as a result of curtailment when economic dispatch is desirable, is entered into the CashFlow module, which produces an NPV value for each scenario in discounted 2019 dollars. This NPV represents the differential benefit of economically dispatching PVGS when production exceeds net demand and the opportunity cost as a function of LMP at PVH and variable O&M due to water consumption is positive. These scenarios are all collected, and statistics calculated for the NPV, number of economic dispatch days, and the input scenarios. The full workflow is carried out in RAVEN and dispatched on INL’s high-performance supercomputer FALCON on 50 distributed processing cores, taking approximately 5,800 seconds (1.6 hours) in user time (290,000 CPU seconds).
Yearly average statistical results are shown in Figure 6. In the uppermost plot (blue), the average savings due to economic dispatch for each year is shown, along with the 5th and 95th percentile of the same. In the second plot (orange), the mean number of economic dispatch days (“curtails”) is provided along with the maximum and minimum number of economic dispatch days. These two plots together suggest that while initially there may be savings as a result of economic dispatch, the benefits fall off as the local demand outpaces the installation of new VRE sources. This is justified by the last to plots in Figure 6, where the yearly average LMP at PVH (green) changes slowly in time while the yearly average net demand (red) grows exponentially over the study. While not immediately clear from the figures, the LMP remains positive on average, but is negative within two standard deviations throughout the study and is increasingly negative in successive years. The yearly mean net demand grows to a mean of over 6000 MW by 2048, with a lower two-standard-deviation envelope of 4000 MW. With a full-power PVGS generation of almost 4000 MW, this suggests that by 2048 the net demand should rarely dip below PVGS nominal power production, offering no benefits from employing economic dispatch.

21
Figure 6: Yearly Savings and Economic Dispatch Trends (1000 samples)
Statistics for the mean NPV for economic dispatch for the 1000 samples taken are given in Table 2.
All the units in these results are expressed in 2019 US dollars. The mean savings over the 30-year analysis for economic dispatch is roughly $50,000 with a standard deviation of approximately 25 percent. 5 percent of scenarios observed savings under $31,000, while 95 percent of scenarios observed savings

22
under $72,000. When compared with the nominal PVGS revenue from electricity production, this is a small expected savings, especially as it neglects other potential costs that may be associated with economic dispatch of the plant such as increased operation and maintenance costs.
Mean Std. Dev. 5th Percentile 95th Percentile Minimum Maximum
50.6 12.6 31.3 71.8 18.8 104.4 Table 2: NPV Statistical Results (units of 1000 2019USD)
23
5. GREATER VRE GROWTH SCENARIO The results from Section 4 suggest low profitability for economic dispatch. This is primarily due to
the strong growth of local area demand and the comparably slow growth of VRE, which causes the opportunity to sell excess production at PVH to be rare. The overlap of excess production with sufficiently low LMP prices is even more rare. These results naturally lead to the question of what possible circumstances would lead to economic dispatch of PVGS as a strongly profitable option.
As an alternate scenario to the growth scenarios provided in Section 4, we consider a case with much stronger growth in VREs and smaller population growth. This consideration is justified by a recent measure in Arizona. Proposition 127 would have required regulated utilities to obtain 50 percent of electricity from VRE sources by 2030 [25]. Although the measure was defeated strongly in polls [26], the conversation surrounding the measure gives weight to a strong VRE growth scenario.
To consider this scenario, we employ the same mechanics as in Section 4, but with the growth factors in Table 3. Most notable is the exponential growth of both solar and wind sources through 2028, and slower growth thereafter. Additionally, PVH is presumed to remain consistent while local growth is negligible through 2028 and slow thereafter.
Synthetic History Year Range Growth Factor (%) Growth Mode
Wind 2019 – 2028 10.0 exponential
2029 – 2048 2.3 linear
Solar (total) 2019 – 2028 10.0 exponential
2029 – 2048 2.3 linear
LMP at PVH 2019 – 2048 0.0 linear
Local Demand 2019 – 2028 0.0 linear
2029 – 2048 1.0 linear
Table 3: Increase VRE Case Growth Factors
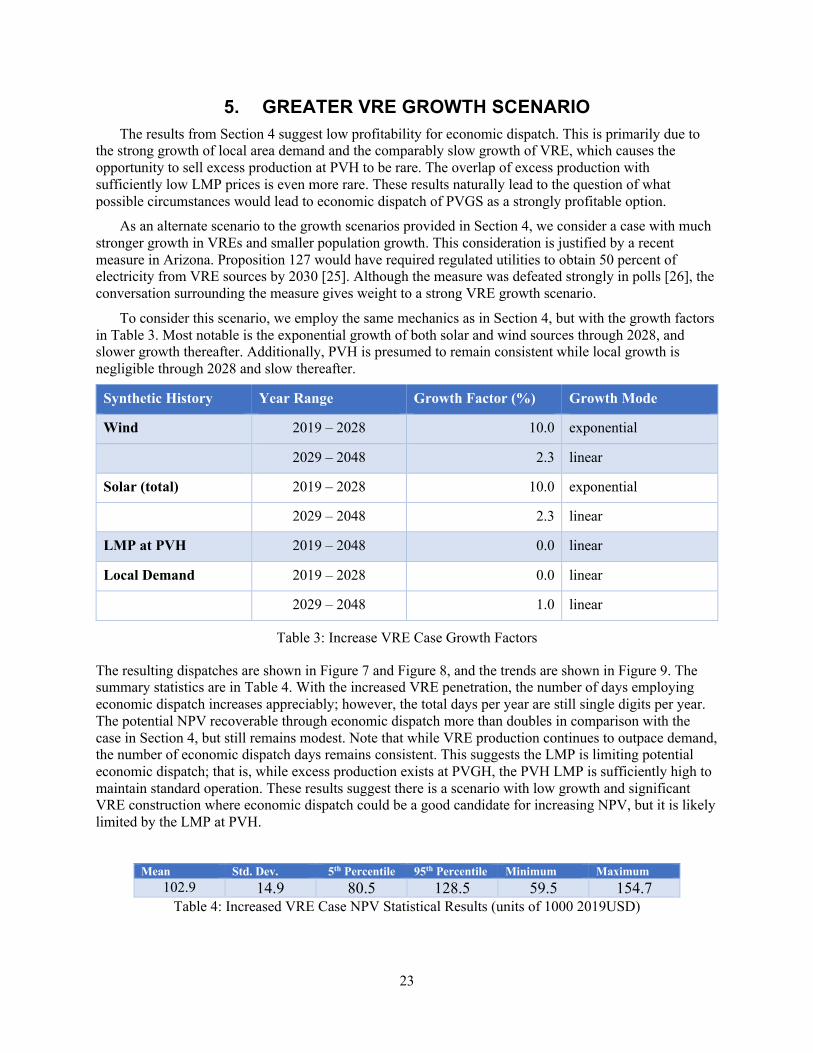
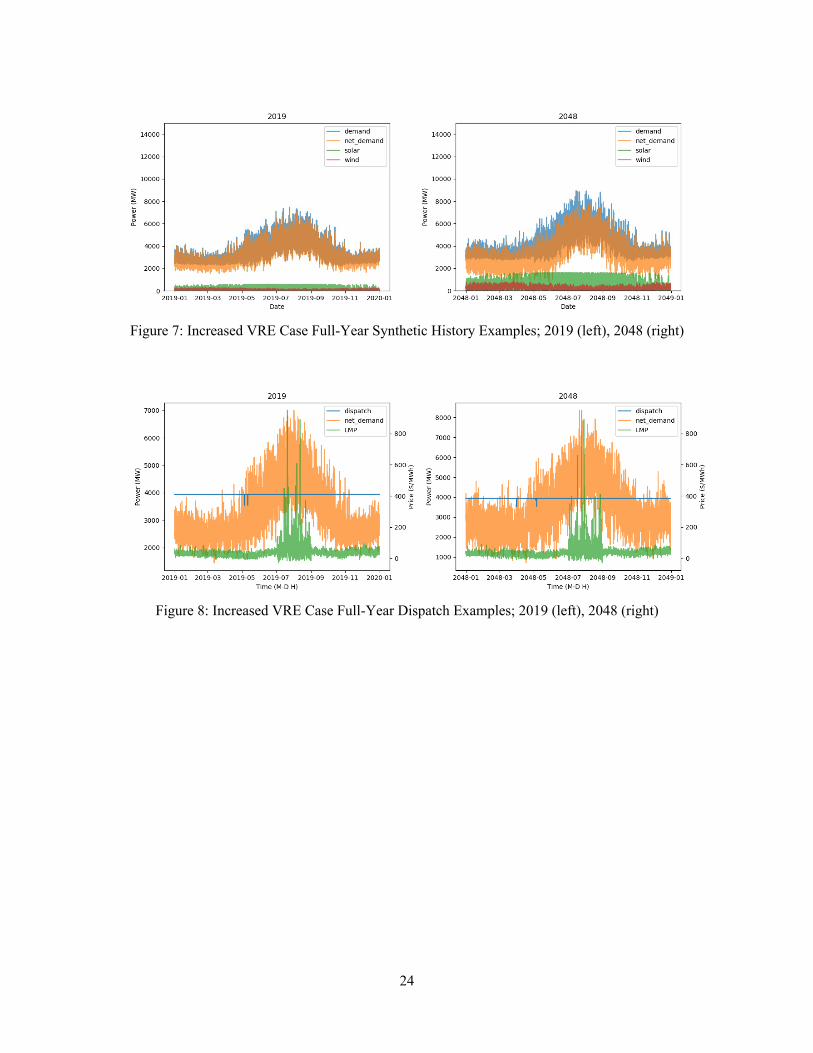
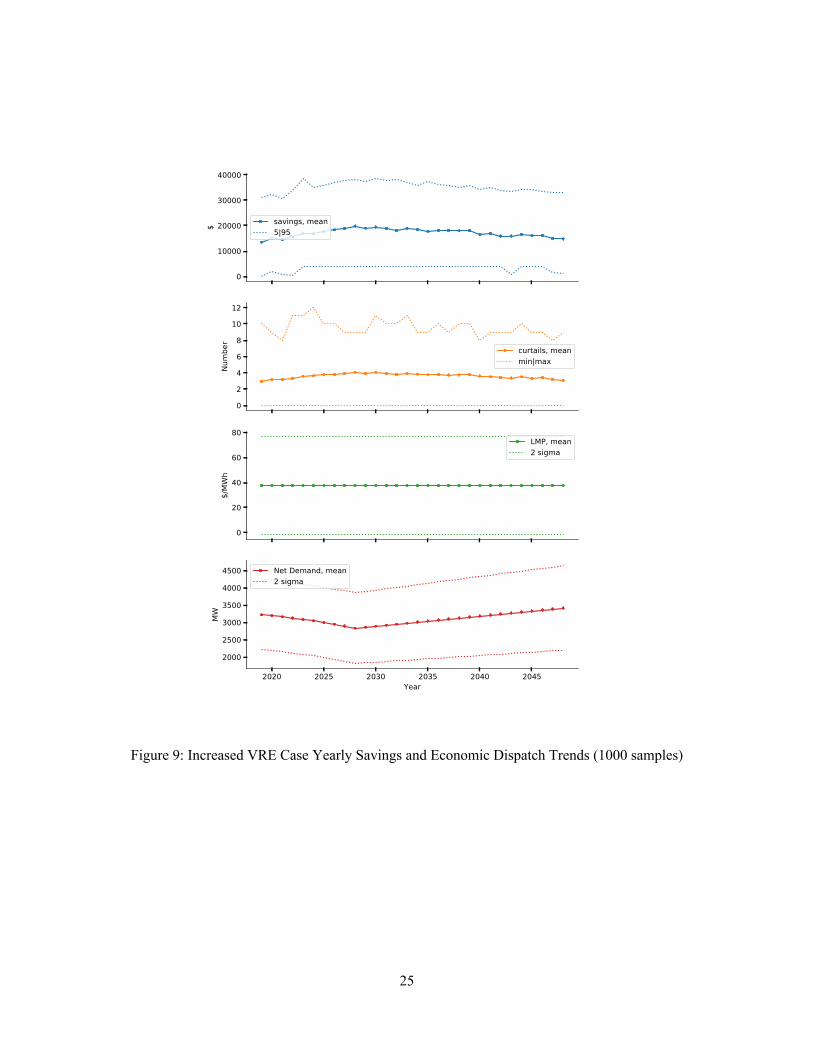
The resulting dispatches are shown in Figure 7 and Figure 8, and the trends are shown in Figure 9. The summary statistics are in Table 4. With the increased VRE penetration, the number of days employing economic dispatch increases appreciably; however, the total days per year are still single digits per year. The potential NPV recoverable through economic dispatch more than doubles in comparison with the case in Section 4, but still remains modest. Note that while VRE production continues to outpace demand, the number of economic dispatch days remains consistent. This suggests the LMP is limiting potential economic dispatch; that is, while excess production exists at PVGH, the PVH LMP is sufficiently high to maintain standard operation. These results suggest there is a scenario with low growth and significant VRE construction where economic dispatch could be a good candidate for increasing NPV, but it is likely limited by the LMP at PVH.
Mean Std. Dev. 5th Percentile 95th Percentile Minimum Maximum 102.9 14.9 80.5 128.5 59.5 154.7
Table 4: Increased VRE Case NPV Statistical Results (units of 1000 2019USD)
24
Figure 7: Increased VRE Case Full-Year Synthetic History Examples; 2019 (left), 2048 (right)
Figure 8: Increased VRE Case Full-Year Dispatch Examples; 2019 (left), 2048 (right)
25
Figure 9: Increased VRE Case Yearly Savings and Economic Dispatch Trends (1000 samples)

26
6. CONCLUSIONS AND FUTURE WORK 6.1 Conclusions
A comparison was made using HERON of running the Palo Verde Generating Station (PVGS) at full power throughout the years 2019 to 2048 versus allowing optional daily curtailment (e.g. economic dispatch) in a deregulated market. This economic dispatch is assumed to be elected day-ahead and only during the middle third of the day. The choice to employ economic dispatch depends on the local area demand, production from variable renewable energy (VRE) sources such as wind and solar, and the local marginal price of electricity (LMP) observed at the Palo Verde Hub (PVH).
Using a stochastic analysis, we observed the number of desirable economic dispatch days on average to be several per year in 2019 and decreasing to nearly zero through 2048. This is far below the recommended limit of 50 economic dispatch days per year suggested by Arizona Public Service (APS).
Based on the assumptions and inputs used in this analysis, we conclude that on average and in greater than 99.9% of scenarios, it is profitable to operate PVGS in a load-following mode as described in Section 2.2.2. Out of 1000 scenarios, no samples demonstrated a 0-profit case for considering economic dispatch over the thirty-year cycle. On average, as reported in Section 4.2.2, the entities owning PVGS could increase NPV by 50,565 2019USD over the 2019 to 2048 timeframe under the assumptions employed, with a standard deviation of approximately 12,600 2019USD.
However, despite the opportunity for profit, no allowance was made in the economic analysis for the retrofitting, retraining, or other capital or recurring expenditures associated with performing economic dispatch. While these costs were presumed negligible, they may be of the same order magnitude as the profitability of the load following, thus bringing the profitability in question.
Extending the suggested case, a scenario with greatly increased VRE construction and reduced demand growth was also considered. In this unlikely but possible scenario, the increase of NPV is significantly higher than the base case. This suggests scenarios may exist in which economic dispatch is viable for PVGS, though it requires trends that are currently considered unlikely by APS.
HERON was used to generate the workflows used in the analysis, and the resulting dispatch correctly met the regulated requirements (net demand) and limited curtailment to APS specifications for hypothetical economic dispatch of PVGS.
In conclusion, while there is potential for increased NPV for PVGS through optional economic dispatch, the possible benefit is trivially small under the assumptions used for this analysis. HERON was capable of performing the necessary technoeconomic analysis within the regulated market framework.
6.2 Ongoing Work One of the assumptions used in this work is treating the three units at PVGS as a single linear unit,
with negligible downtime. This assumption tends to overestimate the number of economic dispatch days in the simulation lifetime, and so does not notably change the outcome. However, a more rigorous treatment of the units at PVGS could increase the quality of the simulations.
The primary interest for previous work with APS has considered construction of reverse osmosis plants, either as a method for increasing load or mitigating variable load [1]. The construction of a reverse osmosis plant was not considered in this study. Additionally, alternative sources of water acquisition or treatment to mitigate water prices are under consideration at APS; these alternatives have not been explored in this work. However, increasing local area demand (either statically or as variable load response) or less expensive water acquisition and treatment would both serve to reduce the number of economic dispatch days that would be profitable for APS, thereby enhancing the conclusion that economic dispatch is unlikely to be noticeably profitable. However, including these other considerations would increase the accuracy of this simulation for planning purposes.
The work in HERON can further be applied to a deregulated market system, where the units involved minimize system cost or maximize profit without limits of meeting local requirements first.

27
7. REFERENCES
1. C. Rabiti, A. S. Epiney, P. W. Talbot, J. S. Kim, S. Bragg-Sitton, A. Alfonsi, A. Yigitoglu, S. Greenwood, S. M. Cetiner, F. Ganda, G. Maronati, “Status Report on Modeling and Simulation Capabilities for Nuclear-Renewable Hybrid Energy Systems,” Idaho National Laboratory, September 2017, INL/EXT-17-43441.
2. A. Epiney, C. Rabiti, P. W. Talbot, J. S. Kim, J. D. Richards, S. Bragg-Sitton, “Case Study: Nuclear-Renewable-Water Integration in Arizona”, Idaho National Laboratory, September 2018, INL/EXT-18-51359.
3. M. Lykidi, P. Gourdel, “How to manage flexible nuclear power plants in a deregulated electricity market from the point of view of social welfare?” Energy, 85, 167-180.
4. P. Morilhat, S. Feutry, C. Le Maitre, J. M. Favennec, “Nuclear Power Plant Flexibility at EDF”, HAL EDF archives, January 2019.
5. A. Lokhov, "Technical and economic aspects of load following with nuclear power plants", OECD, NEA, Paris, France, June 2011.
6. International Atomic Energy Agency, “Non-baseload Operation in Nuclear Power Plants: Load Following and Frequency Control Modes of Flexible Operation”, International Atomic Energy Agency Nuclear Energy Series No. NP-T-3.23, Vienna, Austria, 2018.
7. J. H. Keppler, M. Cometto, “System Effects in Low-Carbon Electricity Systems”, Paris, 2012. 8. L. Pouret, W. J. Nuttall, “Can nuclear power be flexible?”, EPRG Draft Working Paper, Judge
Business School, University of Cambridge, 2007. 9. World Nuclear Association, “Economics of Nuclear Power”, accessed at http://www.world-
nuclear.org/information-library/economic-aspects/economics-of-nuclear-power.aspx on 06/20/2019, 2019.
10. D. Ingersoll, C. Colbert, Z. Houghton, R. Snuggerud, J. Gaston, M. Empey, “Can nuclear power and renewables be friends?”, Proceedings of ICAPP, pp. 3-6, May, 2015.
11. A. S. Stillwell, M. E. Webber, “Geographic, technologic, and economic analysis of using reclaimed water for thermoelectric power plant cooling”, Environmental science & technology, 48(8), 4588-4595, 2014.
12. I. Khamis, K. C. Kavvadias, “Trends and challenges toward efficient water management in nuclear power plants”, Nuclear Engineering and Design, 248, 48-54, 2012.
13. International Atomic Energy Agency, “Status of Nuclear Desalination in IAEA Member States”, IAEA TECDOC Series. International Atomic Energy Agency, 2007.
14. C. Rabiti, H. E. Garcia, R. Hovsapian, R. A. Kinoshita, G. L. Mesina, S. M. Bragg-Sitton, R. D. Boardman, “Strategy and Gaps for Modeling, Simulation, and Control of Hybrid Systems”, Idaho National Laboratory, April 2015, INL/EXT-15-34877.
15. A. S. Epiney, J. Chen, C. Rabiti, “Status on the Development of a Modeling and Simulation Framework for the Economic Assessment of Nuclear Hybrid Energy Systems (FY 16)”, Idaho National Laboratory, September 2016, INL/EXT-16-39832.
16. A. S. Epiney, R. A. Kinoshita, J. S. Kim, C. Rabiti, M. S. Greenwood, “Software development infrastructure for the HYBRID modeling and simulation project”, INL report INL/EXT-16-40004, September 2016.
17. J. S. Kim, H. E. Garcia “Nuclear-Renewable Hybrid Energy System for Reverse Osmosis Desalination Process,” Transactions of the American Nuclear Society. 2015;112:121-4.
18. J. S. Kim, J. Chen J, H. E. Garcia. “Modeling, control, and dynamic performance analysis of a reverse osmosis desalination plant integrated within hybrid energy systems,” Energy. 2016;112:52-66.
19. C. Rabiti, A. Alfonsi, J. Cogliati, D. Mandelli, R. Kinoshita, S. Sen, C. Wang, J. Chen, "RAVEN User Manual," INL/EXT-15-34123, Printed March 2017.

28
20. J. Chen, C. Rabiti, “Synthetic wind speed scenarios generation for probabilistic analysis of hybrid energy systems”, Energy 120, 2017, p. 507-517.
21. P. Talbot. C. Rabiti, A. Alfonsi, C. Krome, M. R. Kunz, A. Epiney, C. Wang, D. Mandelli, “Correlated Synthetic Time Series Generation using Fourier and ARMA”, Proceedings of American Nuclear Society, Annual Meeting, 2019.
22. N. Stauff, G. Maronati, R. Ponciroli, F. Ganda, T. Kim, T. Taiwo, A. Cuadra, M. Todosow, P. Talbot, C. Rabiti, B. Dixon, S. Kim, “Daily Market Capability and Results”, ANL/NSE-19/5, April 2019.
23. A. S. Epiney, C. Rabiti, A. Alfonsi, P. Talbot, F. Ganda, “Report on the Economic Optimization of a Demonstration Case for a Static N-R HES Configuration using RAVEN,” Idaho National Laboratory, April 2017, INL/EXT-17-41915.
24. Nicolas E. Stauff, R. Ponciroli, T. K. Kim, T. A. Taiwo, “Economic Impact of Flexible Nuclear Operation Estimated with EDGAR Optimization Code,” NURER 2018, Sept 30 – Oct 3, 2018, Jeju, Korea.
25. State of Arizona, “A Constitutional Amendment Amending Article XV of the Constitution of Arizona to Require Electricity Providers to Generate At Least 50% of their Annual Sales of Electricity from Renewable Energy Sources,” Application for Serial Number Initiative Petition to State of Arizona, Feb. 20 2018, accessed at https://apps.azsos.gov/election/2018/general/ballotmeasuretext/C-04-2018.pdf
26. Ryan Randazzo, “Arizona voters reject clean-energy measure Proposition 127 by large margin,” AZCentral, Nov. 6 2018, Arizona, USA