analysis of biomass use in the energy sector in...
TRANSCRIPT

Analysis of biomass use in the energy sector in cooperation with the chemical industry Master of Science Thesis in the Master’s Programme Sustainable Energy Systems and Industrial Ecology
MARTIN JOHNSSON
ANNA ÅHLUND Department of Energy and Environment Division of Energy Technology CHALMERS UNIVERSITY OF TECHNOLOGY Göteborg, Sweden 2011 T2011-361

MASTER’S THESIS T2011-361
Analysis of biomass use in the energy sector in
cooperation with the chemical industry
Master of Science Thesis in the Master’s Programme Sustainable Energy Systems and Industrial Ecology
MARTIN JOHNSSON
ANNA ÅHLUND
SUPERVISOR:
Dr. Jan Grundmann
EXAMINER
Assoc. Prof. Erik Ahlgren
Department of Energy and Environment
Division of Energy Technology CHALMERS UNIVERSITY OF TECHNOLOGY
Göteborg, Sweden 2011

Analysis of biomass use in the energy sector in cooperation with chemical industry Master of Science Thesis in the Master’s Programme Sustainable Energy Systems and Industrial Ecology MARTIN JOHNSSON ANNA ÅHLUND
© MARTIN JOHNSSON, ANNA ÅHLUND, 2011
Department of Energy and Environment
Division of Energy Technology
Chalmers University of Technology
SE-412 96 Göteborg
Sweden
Telephone: + 46 (0)31-772 1000
Chalmers Reproservice Göteborg, Sweden 2011

I
Analysis of biomass use in the energy sector in cooperation with chemical industry Master of Science Thesis in the Master’s Programme Sustainable Energy Systems and Industrial Ecology MARTIN JOHNSSON ANNA ÅHLUND Department of Energy and Environment Division of Energy Technology Chalmers University of Technology
ABSTRACT
The use of renewable raw material has increased every year and climate change is becoming a wide spread issue in both public sector and enterprises. For both energy and chemical industry today’s most prominent alternative for fossil feedstock is biomass. Vattenfall plans to expand its use of biomass and for this reason cooperation between the energy and chemical industry with respect to biomass use could be of interest.
This Master’s thesis will look at biorefinery technologies giving solid residues, and further see if these residues can be used in co-combustion with coal. Another perspective will be to see how biorefinery technologies can be combined in order to produce “right” target products and residues. A carbon cycle and energy balance has been performed to see if integration between these industries can be sustainable out of a biomass supply perspective,
To evaluate different biorefinery technologies a classification and a ranking system has been developed. Categories in classification are base on Cherubini (2010) and chapter 3, 4 and 5 in this report. The ranking system is designed by seven criteria’s with different weighting factors, these are closely connected to the objective of this thesis. The c-cycle and energy balance will show how much biomass is needed to replace crude oil within chemical industry. Both calculated values are then compared with available farmland in EU-27.
This thesis discusses ten different technologies that give eight valuable solid residues, five of these are of special interest for co-combustion with coal. The ranking shows that fermentation 2nd is the most promising technology, both due to target product production and valuable residue. Further promising technologies are pyrolysis, gasification and hydrolysis.The c-cycle and energy balance shows that there is enough arable land to cultivate biomass and replace the use of crude oil.
Today there are good technical possibilities for cooperation between chemical and energy industry and there are several suitable residues for co-combustion with coal. Out of a sustainability perspective it is theoretical possible to exchange crude oil with biomass, but the complex land use question has to be further investigated. Also more research has to look into process integration of both different biorefinery technologies and process integration between biorefinery and coal fired power plant.
Key words: Biorefinery, biomass, chemical industry, residues

II
Analys av biomassa användningen inom energisektorn i samarbete med kemiindustrin Examensarbete inom mastersprogrammen Sustainable Energy Systems och Industrial Ecology MARTIN JOHNSSON
ANNA ÅHLUND
Institutionen för Energi och Miljö
Avdelningen för Energiteknik
Chalmers tekniska högskola
SAMMANFATTNING
Användningen av förnyelsebara råmaterial ökar för varje år och klimatförändringar har blivit ett känt problem både bland offentlig sektor och privata företag. Både för kemiindustrin och energiindustrin är biomassa ett av de bästa alternativen för att ersätta fossila råmaterial. Vattenfall planerar att utöka sin användning av biomassa signifikant, därav skulle ett eventuellt samarbete mellan kemiindustri och energi sektorn kunna vara av intresse.
Detta ex-jobb avser att undersöka vilka bioraffinaderi teknologier som ger fasta restprodukter och vidare vilka av dessa som kan sameldas med kol. En annan aspekt är att undersöka hur olika bioraffinaderi teknologier kan kombineras för att producera ”rätt” produkter och restprodukter. En kolcykel och en energibalans är gjord för att se om integration mellan dessa två industrier är hållbar utifrån ett biomassa perspektiv.
Utvärdering av de studerade teknologierna har gjorts genom att utveckla ett klassificerings och rankning system. Kategorierna i klassificeringen är baserade på Cherubini (2010) och kapitel 3, 4 och 5 i denna rapport. Ranking systemet är designat av sju olika bedömningskriterier med viktnings faktorer, dessa är stark kopplade till examensarbetets frågeställning. Beräkningar i kolcykeln och energibalansen visar hur mycket biomassa som behövs för att ersätta råolja användningen i kemiindustrin. Båda dessa värden jämförs sedan med odlingsbar mark i EU-27.
Detta examensarbete diskuterar tio olika grupper av bioraffinaderi teknologier som ger åtta värdefulla restprodukter med fast karaktär. Fem av dessa är intressanta för sameldning med kol vid värme- och elproduktion. Rankingen lyfter fram andra generationens fermentering som den mest lovande teknologin, detta beror både på passande målprodukt och en värdefull restprodukt. Andra lovande teknologier är pyrolys, förgasning och hydrolys. Kolcykeln och energibalansen visar att det är teoretiskt finns tillräckligt mycket land areal för att ersätt råolja med biomassa.
Det finns goda tekniska möjligheter för ett samarbete mellan kemiindustrin och energiindustrin. Arbetet har visat att det finns flera restprodukter från bioraffinaderi teknologier som passar för sameldning med kol. Utifrån ett hållbarhets perspektiv är det teoretiskt möjligt att ersätta råolja med biomassa, men hur odlingsbar mark skall användas är en komplex fråga som behöver studeras mer ingående. Även mer forskning på processintegration både för bioraffinaderi teknologier och processintegration mellan bioraffinaderi och kolkraftverk är nödvändig.
Nyckelord: Bioraffinaderi, Biomassa, Kemiindustrin, Restprodukter
III
Table of content
ABSTRACT I
SAMMANFATTNING II
TABLE OF CONTENT III
PREFACE VII
NOTATIONS VIII
1 INTRODUCTION 1
1.1 Objective 1
1.2 Limitations 2
1.3 Outline 2
1.3.1 Literature review 2
1.3.2 Qualitative interviews 3
2 BACKGROUND 4
2.1 Biomass 4
2.2 Biorefinery 5
2.3 Combustion processes 6
2.4 Biomass co-firing 7
2.5 Paper Mill 8
2.6 Stenungsund chemical industry cluster 10
3 BIOREFINERY TECHNOLOGIES 13
3.1 Mechanical processes 13
3.2 Thermochemical processes 13
3.2.1 Pyrolysis 13
3.2.2 Gasification 14
3.2.3 Liquefaction 15
3.3 Biochemical processes 15
3.3.1 Anaerobic digestion 15
3.3.2 Fermentation 16
3.4 Chemical processes 16
3.4.1 Hydrolysis 16
3.4.2 Transesterfication 17
3.5 Cellulose separation technologies 18
3.5.1 Lignin Precipitation System (LPS) 19
3.5.2 LignoBoost 19
3.5.3 Near-Neutral Pre-Extraction 20
3.5.4 Organosolv 20

IV
3.6 Development status of technologies 21
4 TARGET PRODUCTS FROM BIOREFINERY TECHNOLOGIES 22
4.1 Syngas 22
4.2 Bio-Oil 22
4.3 Biogas 22
4.4 Ethanol 22
4.5 RME 23
4.6 Paper 23
5 VALUABLE RESIDUES 24
5.1 Bark 24
5.2 Char coal 25
5.3 AHR and SSFR 26
5.3.1 Concentrated liquid distillation residue (DR) 28
5.4 Glycerol 28
5.5 Lignin 29
6 METHOD 31
6.1 Market potential for target products 31
6.2 Classification 31
6.3 Weighted ranking 32
6.4 Combination of technologies 32
6.5 C-cycle and energy balance 33
6.6 Sensitivity analysis 36
6.6.1 Ranking 36
6.6.2 C-cycle and energy balance 37
7 RESULTS 38
7.1 Market potential for target products 38
7.1.1 Syngas and biogas 38
7.1.2 Ethanol 38
7.1.3 RME 39
7.1.4 Lignin and paper 40
7.2 Classification of biorefinery technologies 41
7.3 Ranking of biorefinery technologies 42
7.4 Possibilities for combination of technologies 44
7.4.1 Syngas production 44
7.4.2 Ethanol and Biogas plant 45
7.4.3 RME transesterfication 46

V
7.4.4 Cellulose separation 47
7.5 Result from C-cycle and energy balance 47
7.5.1 Biomass economy 49
8 SENSITIVITY ANALYSIS 51
8.1 Ranking of biorefinery technologies 51
9 DISCUSSION 52
10 CONCLUSIONS AND RECOMMENDATIONS 54
11 REFERENCES 56
APPENDIX A 62
APPENDIX B 63
APPENDIX C 66

VI

VII
Preface
This report presents a master thesis project carried out in cooperation with Vattenfall Europe New Energy GmbH. The project was done from March 2011 to August 2011 at the Department Energy and Environment, Energy Technology at Chalmers University of Technology, Göteborg, Sweden. The project has been achievable due to finance by Vattenfall Europe New Energy GmbH.
The aim has been to give Vattenfall GmbH a future prospect of possibilities for biomass utilisation in EU-27. Focus has been on different biorefinery technologies and their residues, with a sustainability systems perspective. The project has been carried out with Dr. Jan Grundmann (Vattenfall GmbH) as supervisor and Assoc. Prof. Erik Ahlgren (Chalmers) as examiner. We would like to thank both of you for your time, patience and feedback.
We highly appreciated Andreas Beyer and Michael Klysz at Vattenfall GmbH for their assistance and advice throughout the project. Special thanks to Energy Technology Department for hosting us during our work period. We would also like to show our gratitude to all people we have interviewed for their time, patience and valuable knowledge.
Göteborg August 2011
Martin Johnsson and Anna Åhlund

VIII
Notations
Abbreviations
AHR Solid dilute-acid hydrolysis residue
CCS Carbon Capture and Storage
DM Dry matter
DR Concentrated liquid distillation residue
ETBE Ethyl tert-butyl ether
ETS European Emission Trading Scheme
EU European Union
FAME Fatty acid methyl ester
FBC Fluidised bed combustion
HHV Higher Heating Value
HTL Hydrothermal Liquefaction
LHV Lower Heating Value
LPS Lignin Precipitation System
PBC Pulverised bed combustion
PVC Polyvinylchloride
RME Rape methyl ester
SHF Separate Hydrolysis and Fermentation
SNG Synthetic Natural Gas
SSF Simultaneous Saccharinification and Fermentation
SSFR Solid SSF residue
WC Wood chips
WWT Waste water treatment
Elements
C Carbon
Ca Calcium
Cd Cadmium
Cl Chlorine
Co Cobalt
K Potassium
H Hydrogen
Mg Magnesium
N Nitrogen

IX
Na Sodium
O Oxygen
P Phosphorus
Pb Lead
S Sulphur
Zn Zink
Chemical compounds
CH4 Methane
CH3OH Methanol
C2H4O2 Acetic acid
C2H5OH Ethanol
CH2O2 Formic acid
C3H6O3 Lactic acid
C3H8O3 Glycerol/Glycerine
(C6H10O5)n Cellulose
C9H10O2(OCH3)n Lignin
CO Carbon monoxide
CO2 Carbon dioxide
H2 Hydrogen gas
HCl Hydrochloric acid
HMF 5-hydroxymethylfurfural
H3O4P Phosphoric acid
H2SO4 Sulphuric acid
KOH Potassium hydroxide
N2 Nitrogen gas
NaOH Sodium Hydroxide
SO2 Sulphur dioxide
Words
Feedstock Stream of raw material used to produce valuable products
Residue Process waste that can be both valuable or non valuable
Target product The main product leaving a biorefinery technology

Units
g
G
ha
J
kg
kgdm
M
tce
toe
tdm
P
ppm
wt%
Symbols
Units for calculations
dm
ppm
wt%
Symbols
for calculations
gram
Giga, 10
hectare
Joule
kilogram, 10
kilogram of dry matter
Mega, 10
tonne of coal equivalent
tonne of oil equivalent
tonne of dry matter
Peta, 10
Parts per million
weight percent
Operation
Intermediate product
Input/
Output/Product streams
Process streams
Recirculation
Giga, 109
hectare
kilogram, 103 gram
kilogram of dry matter
Mega, 106
tonne of coal equivalent
tonne of oil equivalent
tonne of dry matter
Peta, 1015
Parts per million
weight percent
Operation
Intermediate product
/Feedstock
Output/Product streams
Process streams
Recirculation streams
X
gram
kilogram of dry matter material
tonne of coal equivalent
tonne of oil equivalent
tonne of dry matter material
Parts per million
Intermediate product
streams
Output/Product streams
streams
material
material

XI
List of equations
Equation 1: Fermentation process. .............................................................................. 16
Equation 2: Unit analysis for calculations of total gC coming from crude oil. .......... 34
Equation 3: Unit analysis for calculation of carbon content in energy crop mix. ...... 34
Equation 4: Unit analysis for calculations of need for biomass to cover total amount of carbon from crude oil. ............................................................................................. 34
Equation 5: Unit analysis for calculation of need for cultivated land. ....................... 34
Equation 6: Unit analysis for calculate total energy coming from crude oil within chemical industry. ........................................................................................................ 34
Equation 7: Unit analysis to calculate the amount for biomass in DM that is needed to cover energy demand. .................................................................................................. 35
Equation 8: Unit analysis to calculate the cultivated area needed to produce the necessary amount of biomass. ...................................................................................... 35
Equation 9: Calculations of total gC coming from crude oil. ..................................... 47
Equation 10: Calculations of carbon content in energy crop willow. ......................... 47
Equation 11: Calculations of need for biomass to cover total amount of carbon from crude oil. ...................................................................................................................... 48
Equation 12: Calculations of need for cultivated land (yield 10 tDM/ha). ................... 48
List of figures
Figure 1: Composition of cellulosic material. ............................................................... 4
Figure 2: Pathways for biomass from raw material to chemical applications. Building Blocks are the pre steps before end use application is produced. ................................. 5
Figure 3: Coal fired combustion plant .......................................................................... 7
Figure 4: Schematic arrangement of fuel and air for re-burning in pulverised fuel boiler .............................................................................................................................. 8
Figure 5: Stenungsund chemical industry ................................................................... 11
Figure 6: Biorefinery site for kraft lignin and vanillin ................................................ 19
Figure 7: Chemical differences between wood and bark ............................................ 24
Figure 8: Yields of char coal as % of dry solid basis depending on heating temperature .................................................................................................................. 26
Figure 9: Dilute-acid hydrolysis for ethanol production ............................................ 27
Figure 10: Simultaneous Saccharinification and Fermentation enzyme hydrolysis process for ethanol production .................................................................................... 27
Figure 11: Classification system. ................................................................................ 32
Figure 12: EU-27 chemical industry, incl. pharmaceuticals, energy consumption by source on annual basis ................................................................................................. 35

XII
Figure 13: Summary of biorefinery technologies, their target products and residues. ...................................................................................................................................... 41
Figure 14: Process scheme for syngas production with gasification or pyrolysis ...... 45
Figure 15: Process scheme integrated ethanol plant (first and second generation) with biogas ................................................................................................................... 46
Figure 16: Process scheme of the RME production with transesterfication. .............. 46
Figure 17: Process scheme for cellulose/lignin separation ........................................ 47
Figure 18: Area of land that needs to be cultivated by energy crops in order to replace energy and carbon coming from crude oil. Number above staples show percentage of total arable land. ................................................................................... 48
List of tables
Table 1: Development status of biorefinery technologies. ........................................... 21
Table 2: Properties for bark pellets ............................................................................. 25
Table 3: Properties of AHR and SSFR ........................................................................ 28
Table 4: Properties of lignin ........................................................................................ 30
Table 5: Basic figures for calculations on C-cycle. ..................................................... 36
Table 6: Percentages of EU-27 gas utilisation replaced with biogas or syngas ......... 38
Table 7: Market share of bioethylene according to today’s ethylene production in EU-27 .................................................................................................................................. 39
Table 8: Explanation of criteria’s in ranking. ............................................................. 42
Table 9: Weighting factors for ranking. ...................................................................... 43
Table 10: Results of the ranking. ................................................................................. 43
Table 11: Calculations on future crude oil price. ........................................................ 50
Table 12: Result of sensitivity analysis for ranking. .................................................... 51

1
1 Introduction
The Bruntland commission, the Kyoto Protocol and the Rio conference is a few examples of attempt to achieve climate mitigation. One of the main objectives for the European Union within the environmental field is to increase the use of biomass. The region is committed to increase the proportion of renewable energy to 20 % of total energy consumption by 2020 (ENCROP, 2010).
To meet these goals, Vattenfall plans to increase the use of biomass to 5-10 million ton per year and aims to control and invest in the whole value chain from cultivation to end use. This will lead to new areas for cultivation of biomass, new areas for food production and new logistic solutions for biomass transportation (Grundmann, 2011). Due to the fact that many energy enterprises will become players within the biomass market, to fulfill their climate ambitions, cooperation’s between energy sector and the chemical industry with respect to biomass use could be of interest. Energy producers do have an interest in how the biomass can be used and which technologies in chemical industry that gives the best residues as energy carrier back for use in energy services. One example of cooperation can be an energy enterprise producing the biomass and sells it to a chemical industry. The chemical industry refines the biomass to high value chemicals and the residues go back to power producer for co-combustion in a coal fired power plant. The excess heat from this plant can be used in the chemical refinery if they are placed closely (Grundmann, 2011). In this way coal power plants and chemical industry create an industrial cooperation site, where waste heat and waste products from biomass are used. To give Vattenfall the prospect to make a relevant forecast for the potential demand for biomass within the chemical industry in EU-27, including pharmaceuticals, a carbon cycle and an energy balance is performed.
1.1 Objective
Both energy and chemical industry shows more interest in alternatives for their fossil feedstock, the most prominent alternative today is biomass. The purpose with this project is to investigate different biorefinery technologies and the future market for target product from these technologies. The aim is to see if Vattenfall and other actors in energy industry could benefit from cooperation with other branches, such as the chemical industry.
Due to purpose of this project and the interest of the constituent, Vattenfall Europe New Energy GmbH in Hamburg, four main questions has been formulated as the framework for this project.
• What solid residues do different biorefinery technologies give?
• Do the residues from biorefineries fulfil the quality requirements for the combustion processes
within coal fired power plants?
• Which combination of biorefinery technologies is best for creating synergies between the
chemical and energy sector?
• Is cooperation between chemical industry and energy sector sustainable out of a biomass
supply perspective?
By elaborate a classification system and a ranking system of biorefinery technologies the results will be presented, together with demand for biomass if crude oil would be exchanged.

2
1.2 Limitations
The master thesis limitations are here defined, this to prohibit the work from being too broad or incomprehensible to handle within the timeframe.
The geographical area is set to EU-27; other different geographical areas are sometimes discussed briefly to be able to give “hands on” examples. This area is not valid for the biomass market which is a global market with no geographical restrictions. The two industries looked into are energy and chemical, with a focus on chemical industry regarding future markets and technologies of use. Regarding infrastructure this project does assume that existing infrastructure in EU-27 is intact and no development has been taken into account.
Different types of technologies to refine biomass will be investigated, the focus will be on technologies giving solid residues. The technologies will be studied with the focus on input and output. The quality requirements for fuel of the coal fired power plants will only be discussed directly with Vattenfall professionals.
In evaluation of process integration this master thesis only looks at which processes that can be combined to produce desired products. Quality of excess heat leaving specific processes and more exact process integration recommendations will not be a part of this project.
Regarding the carbon cycle and energy balance the result will be affected by a number of parameters. Limitations for calculations regard yield, conversion efficiency and type of raw material used in chemical industry. The yield of energy crops vary a lot with both geographical location and spices cultivated. This is taken into account by doing calculations on three different yields. The fact that biomass yield most likely will increase in the future with optimised and effective cultivation standards, has been neglected to simplify calculations. All calculations will be performed with today’s crop yields. Assumptions around conversion efficiency are complex due to different technologies, in this master thesis the conversion rate is set to when syngas is produced from crude oil or biomass, respectively 97% and 87% (Dinjus, 2009). The crude oil used for energy and fuel in chemical sector are in these calculations neglected. Only the crude oil used as feedstock is included.
1.3 Outline
To be able to investigate different biorefinery technologies and to find adequate background information a literature review and qualitative interviews has been carried out.
1.3.1 Literature review
The literature studies will focus on scientific articles and books available in databases at library of Chalmers University of Technology. There are lot of articles and books written in the field of biorefinery, much of this literature focus on the biomass process and chemical/biochemical reactions and processes. Some of the articles describe the way of biomass through the plant and type of products that are produced in different steps of a biorefinery. Most of the articles are written from a chemical or a biomass production aspect and just a few from the energy point of view. Only a small number of articles discuss the residues composition from biomass used in biorefineries.
Books where used when information about well known technologies and subjects where searched for. For more recent research result scientific articles contributed with
3
adequate information. Research in the open web has also been implemented to find adequate company and organizations reports; here the search engine Google has mainly been used.
European Chemical Industry Council, Cefic, and ENCROP where mainly used to find data on crude oil use, energy content in energy crops and energy crop yield/ha/year. Cefic represents 29,000 chemical companies in Europe. The council try to embody its members and interacts on their behalf with international and EU institutions, non-governmental organizations and the international media (Cefic, 2011). ENCROP is a European project to promote the production and cultivation of energy crops and to increase the knowledge of different actors along the supply chain. The project was carried out during a three year period, from October 2007 until August 2010 (ENCROP, 2010).
1.3.2 Qualitative interviews
To fill information gaps from literature studies interviews with experts have been valuable for important data collection. Interviews with concerned companies, power plants and institutions have been performed.
The interviewer together with the interviewee created the result through a dynamic conversation. During the literature study four different areas of interview objects of special interest were been obtained, these are following:
• Chemical industry to understand the residues leaving the chemical plant
• Chemical industry to understand their requirements for future industry cluster
• University experts within field of biomass use and biorefinery technologies
• Vattenfall for information about the coal fired power plants requirements in Germany
A list of connected people can be found in Appendix A, each person’s is displayed with title, contact details and date for interview.

4
2 Background
This chapter will give the reader a short introduction to biomass as raw material, what is defined as biorefinery, how does a general combustion process works and what does it mean to co-fire biomass and coal. These subjects are necessary in order to assimilate the following chapters of this report. This chapter will also include two examples, one of an exciting biorefinery and one of an integrated industrial site.
2.1 Biomass
Biomass is a renewable energy source and the demand is expected to increase over the coming decades. Interest in biomass as an energy source and raw material is rising for several reasons. The use of biomass is CO2 neutral due to the photosynthesis which converts sun energy and CO2 to biological material. It is also an alternative for fossil fuels which is a limited resource (non renewable) and several energy crops are also alternative agriculture products where other crops are not suitable. The four types of biomass discussed are: wood, recycled material (for example demolition wood and waste paper), agricultural by-products (for example straw and tops) and energy crops (for example willow and Miscanthus) (de Mol, Jogems, van Beek, & Gigler, 1997). Biomass lignocelluloses materials refer to plants that are composed of cellulose, hemicelluloses and lignin (Doherty, Mounsavioun, & Fellows, 2010), see Figure 1. Compared to fossil raw material, biomass material generally has a lower fraction of carbon, more oxygen and less hydrogen (Cherubini, 2010). Cellulose gives trees and woods their strength; these fibers are long, flexible and natural linear homopolymer (Lui, 2010). The chemicals structure of cellulose is (C6H10O5)n and is made by long chains of glucose molecules, (C6 sugar) (Cherubini, 2010). Lignin (C9H10O2(OCH3)n) is the natural phenolic glue that holds together cellulose fibers and act as a natural protection against biological degradation of cellulose and hemicelluloses (Lui, 2010).
Although biomass is stated as CO2 neutral the future use of biomass has several limitations, both concerning limited availability of land and logistic problems. If explored biomass really is CO2 natural depends on cultivation methods and previous use of land to mention a few parameters. The costs for biomass as a fuel and raw material are divided into three parts: the purchase price, the logistic costs for the collection and the costs for establishing and running the energy plant (de Mol, Jogems, van Beek, & Gigler, 1997). Costs of logistics may determine a major part of feasibility, especially when biomass costs are relatively low (Annevelink & de Mol, 2006). Today the only commercial biofuel, here referring to only transportation fuel, products comes from plant oils esters (FAME) of long-chain fatty acids or ethanol from the enzymatic digestion and fermentation of starch or sucrose. These raw materials are competing over arable land for food production (Doherty, Mounsavioun, & Fellows, 2010). As for all agriculture products biomass has losses during storage, these losses can be positive effects (moisture losses) or negative losses (dry matter losses) (de Mol, Jogems, van Beek, & Gigler, 1997).
Figure 1: Composition of cellulosic material (Doherty, Mounsavioun, & Fellows, 2010).

5
In Figure 2 the product refinery chain of biomass within chemical industry is illustrated, here it can be seen that there are four main steps towards final application. Today there are only a few biorefineries operating but this will have to change if climate goals are going to be met and if industries want to secure a steady supply of raw material.
Figure 2: Pathways for biomass from raw material to chemical applications (Luo, van der Voet, & Huppes, 2010). Building Blocks are the pre steps before end use application is produced.
2.2 Biorefinery
To get a more efficient utilization of biomass the users must exhaust as much of the biomass as possible. This means that both the energy sector and the chemical industries can process the same biomass, but different parts of it. The concept for this cogeneration is named biorefinery. In the biorefinery all necessary biological, chemical and energy processes will be handled at the same site but in different processes. These processes will give different chemicals with possible utilisation in the chemical industries instead of fossil products but also energy services in different ways. The International Energy Agency (IEA) describes the biorefinery process as: “Biorefining is the sustainable processing of biomass into a spectrum of marketable products and energy” (IEA Bioenergy, 2010). The concept needs a lot of different methods to separate the biomass into their components (i.e. carbohydrates and proteins).
There are different processes to separate the valuable parts from the biomass feedstock i.e. mechanical, chemical, bio chemical and thermochemical. This structure with separation in different steps or processes is similar with the oil refinery and that’s the reason of the similar name. A major difference between the biomass feedstock and the fossil feedstock is that the fossil compounds most often are homogeneous, but the biomass is not (Cherubini, 2010). This variety of the feedstock gives disadvantages which means that the site needs a lot of different equipments and technologies but also seasonal problems connected to that the refinery perhaps can’t produce the

6
maximal capacity during the winter. But there are also advantages, these are often connected to the range of different products and the biorefinery can easier change their production due to the raw material and technologies than the petroleum based can do (Dale & Kim, 2006). Another advantage is the fact that biorefinery uses biomass that do not affect the environment as negative as coal (Brown, 2003). There are possibilities to produce gaseous and solid fuels from the lignin part. This fuels are often used for the own plant but there are also possibilities to connect the system to a bigger power plant i.e. co-fire the lignin part with coal in a coal fired power plant.
2.3 Combustion processes
Even if Europe has a heavy climate debate and the European Union (EU) works with ambitious climate targets, coal is still one of the two most important energy sources in the EU. Together coal and nuclear produces a clear majority of the electricity and heat in EU and the coal alone stand for around 30% of the electricity production (Eurostat, 2009). The situation is similar in Germany and here around 43% of the produced electricity comes from coal (24.6% lignite and 18.3% hard coal) and coal is also an important source for heat (Bundesministerium für Wirtschaft und Technologie, 2010). There are also a lot of new plants with coal especially in “new economies”. China and other developing countries are building coal fired power plants due to that these are quiet cheap, easy to operate and quick to build, which is an advantage due to the fast increasing energy demand in these regions (Breeze, 2005).
There are some problems with this big consumption of coal; first the coal is an ending resource even if coal has a long expire date, approximately 150 years with today’s reserves and extraction rate (British Petrolium, 2010). The second problem is the formation of carbon dioxide in the combustion processes using coal (Miller, 2005). Only in Germany around 40% of the CO2-emissions come from coal (Bundesministerium für Wirtschaft und Technologie, 2010). The third problem is the increasing price of coal as a fuel. The increase in fuel price together with a forecasted price increase of the European Emission Trading Scheme (ETS) will give a higher marginal cost for coal as technology (Erdmann & Zweifel, 2008). These three reasons will give good incitements to find other solutions or improvements. These questions are also important for Vattenfall due to that they have 18 coal power plants (11 in Germany) producing heat and electricity (Vattenfall AB, 2010).
Changing directly to other sources from coal is very hard due to the big share of the market. There are a lot of different possible improvements such as efficiency improvements of existing plants, carbon capture and storage (CCS) and co-firing with biomass (Miller, 2005), (Termuehlen & Emsperger, 2003). Switch the fuel in some parts to biomass is difficult and it’s important that the biomass follows the quality requirements. The size of the particles is very important due to that the combustion processes can handle the particles or not.
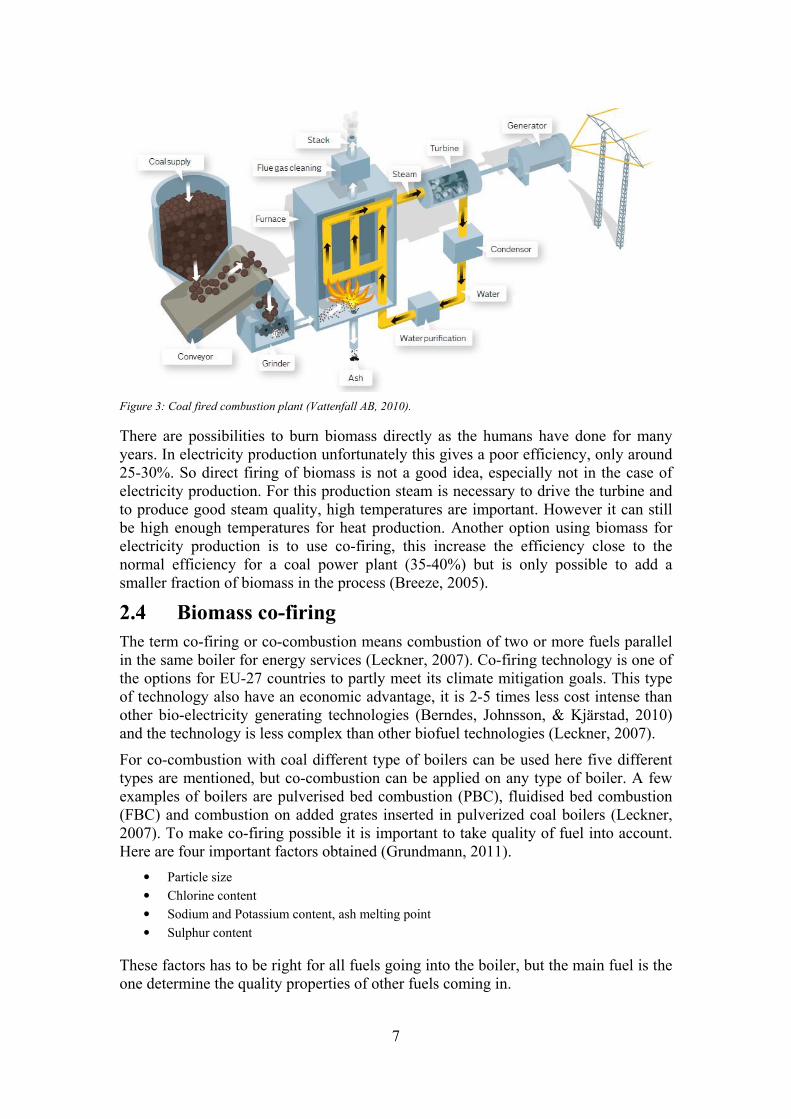
The basic idea of a coal fired power plant and all other combustion power plants is to let the fuel burn in an excess of air. The air will be heated and in a heat exchanger system the air heats water to steam. This steam drives a steam turbine, which is connected to a generator for producing electricity. After the turbine the steam is cooled to water again and returns back to the heat exchanger system again. The releasing heat from the cooling of the steam can be connected to a process or a district heating net (Miller, 2005).
7
Figure 3: Coal fired combustion plant (Vattenfall AB, 2010).
There are possibilities to burn biomass directly as the humans have done for many years. In electricity production unfortunately this gives a poor efficiency, only around 25-30%. So direct firing of biomass is not a good idea, especially not in the case of electricity production. For this production steam is necessary to drive the turbine and to produce good steam quality, high temperatures are important. However it can still be high enough temperatures for heat production. Another option using biomass for electricity production is to use co-firing, this increase the efficiency close to the normal efficiency for a coal power plant (35-40%) but is only possible to add a smaller fraction of biomass in the process (Breeze, 2005).
2.4 Biomass co-firing
The term co-firing or co-combustion means combustion of two or more fuels parallel in the same boiler for energy services (Leckner, 2007). Co-firing technology is one of the options for EU-27 countries to partly meet its climate mitigation goals. This type of technology also have an economic advantage, it is 2-5 times less cost intense than other bio-electricity generating technologies (Berndes, Johnsson, & Kjärstad, 2010) and the technology is less complex than other biofuel technologies (Leckner, 2007).
For co-combustion with coal different type of boilers can be used here five different types are mentioned, but co-combustion can be applied on any type of boiler. A few examples of boilers are pulverised bed combustion (PBC), fluidised bed combustion (FBC) and combustion on added grates inserted in pulverized coal boilers (Leckner, 2007). To make co-firing possible it is important to take quality of fuel into account. Here are four important factors obtained (Grundmann, 2011).
• Particle size
• Chlorine content
• Sodium and Potassium content, ash melting point
• Sulphur content
These factors has to be right for all fuels going into the boiler, but the main fuel is the one determine the quality properties of other fuels coming in.

8
There are both positive and negative synergy effects with biomass/coal co-combustion. Some of the positive synergies are the reduced consumption of coal and therefore also mitigation of fossil CO2 emissions (Leckner, 2007). Using biomass in co-firing has a relatively low impact on the conversion efficiency. Neither an uncertainty with fuel supply is not put on risk, the plant is then depending on two different types of fuel. Another advantage is that using biomass in coal fired power plant, existing infrastructure can be used. This give incentive to use local fuel (Leckner, 2007) and an expanded use of biomass is not constrained (Berndes, Johnsson, & Kjärstad, 2010). The disadvantage of co-combustion can be additional costs for equipment and drying of biomass, lack of experience is also seen as a negative aspect. The mix of fuels may also cause negative synergies in combustion process (Leckner, 2007).
In Figure 4 a pulverised fuel boiler is scheduled, the different combustion zones can be viewed. Originally the fuel injected in a PBC boiler at re-burning zone was natural gas, but now is has been seen that it is here possible to inject solid fuels in this zone as well (Leckner, 2007). This solid fuel could be biomass if the grinding technology can give sufficient small particles. It is also important that sufficient residence time and temperature in the furnace for burnout of the char coal particles is kept and at the same time as ash deposition is avoided (Harding & Adams, 2000).
According to Leckner there are four main groups of the impact of co-firing, these are (1) energy content and volatiles, (2) precursors to gaseous emissions, (3) ash-forming elements and (4) trace elements. Often do biomass fuels have lower heating value than coal and higher moisture content than coal so total energy content is differenced. By drying biomass in an external facility the heating value can be increase and moisture content can be lowered (Leckner, 2007).
Plants size restrictions are not theoretical rather economical due to the limitation on how far biomass can be transported. A
feasible level of biomass input is probably 5 % to 10 % of the maximum boiler capacity (Leckner, 2007), (Berndes, Johnsson, & Kjärstad, 2010). Both for PBC and FBC this amount of biomass input can be handled without any major changes of technology or problems with corrosion (Leckner, 2007), (Berndes, Johnsson, & Kjärstad, 2010).
Conclusions out of this is that co-firing biomass with coal can have a positive impact on the lignocelluloses supply system, which would have a positive spin off on infrastructure for biomass logistic and storage. Coal co-fired with biomass can clearly increases the near-term demand for biomass in many countries (Berndes, Johnsson, & Kjärstad, 2010).
2.5 Paper Mill
One example of a today existing biorefinery is a modern chemical paper mill. There are two existing main process in the pulping process, either the mill use mechanical
Figure 4: Schematic arrangement of fuel and air for re-burning in pulverised fuel boiler (Leckner, 2007).

9
pulping or chemical pulping. The pulp consists of cellulose fibres and the mechanical or chemical process names describe how these fibres are extracted from the wood.
The mechanical process grinds wood or wood chips with electrical power. The fibres are separated from one another with a series of rotating discs. This process has a very high efficiency, 90-98% (Brown, 2003). Mechanical pulp fibres are stiff and mostly intact. The pulp also includes a large amount of a smaller material called fines. This fine consists of fragments from the fibre wall and broken fibres. The fines have an important role for optical skills which give smooth printing surface. This is one of the reasons ways mechanical pulping is used for production of newsprint (Brännvall, 2009). Another important difference due to the chemical pulping is that the lignin is not removed from the fibres. The lignin is the reason why newsprint is weaker and also the reason for darken the newsprint over time. The mechanical process is very energy intensive and uses everything from the tree, therefore it is not interesting out of a biorefinery perspective (Brown, 2003).
In the chemical pulping process the fibres are released chemically. The lignin that acts like glue between the fibres is removed by chemicals and thereby releases the fibres. The problem with these chemicals is that they are strong and not specific for lignin, so even other components like carbohydrates are released. There are two different main processes in the chemical pulping; kraft and sulphite (Brännvall, 2009).The sulphite process gives a lighter, easier to bleach pulp but the kraft process have a god established system for chemical recycling and use the lignin as a fuel. Due to that fact that even some hemicelluloses are damage in the chemical process the pulping yield is only around 35-60% of input biomass. The fibres are stronger than the mechanical and around 70% of the total pulp production is based on a chemical production (Brown, 2003).
Around 20% of the chemical pulp is from the sulphite process which is often connected to that the pulp from kraft process has better properties. But still the sulphite process is important in several countries and for some special paper qualities. The advantages for this sulphite process are: higher brightness of unbleached pulp, lower odour problems, in some situations higher yields and lower investment costs (Alén, 2000).
As described earlier the kraft process is the dominating chemical pulping process around the world. The chemicals the process use (named cooking chemicals) are sodium hydroxide and sodium sulphide. The process can also work with only sodium hydroxide and in that case the process is named soda cooking (Brännvall, 2009). In a short description three different liquors are used in the kraft process; white, black and green. The white liquor is the clean one going into the cooking process together with wood chips. After the cooking the black liquor comes out and contains dissolved organic substances such as lignin and inorganic cooking chemicals. The black liquor is evaporated and burned to smelt. The smelt is solved in water and named green liquor and with a process called causticising the green liquor is converted to white (Brännvall, 2009). The black liquor is separated from the pulp with washing and after evaporation the solid content is around 65-80%. The lignin from the process contains around 6% sodium of the dry mass (Alén, 2000).
Before the developments of the chemical recycle system the kraft process wasn’t competitive with the sulphite process, due to high price of sodium hydroxide. The high cost was connected to the use of sodium carbonate as make up chemical to

10
produce sodium hydroxide. Instead the mills started to use the inexpensive sodium sulphate for this. The produced pulp from the kraft process is strong and that’s the reason for the name kraft, which means “strong” in German and Swedish (Brown, 2003).
The black liquor is the key point in this process related to the energy issue. The black liquor contains lignin and degraded polysaccharides. This lignin has limited applications but has a high heating value compared to raw wood and is for that reason a good boiler fuel. Also the degraded polysaccharides are used as boiler fuel even if the heating value is low. In the pulp mill the black liquor is used in a recovery boiler (Brown, 2003).
2.6 Stenungsund chemical industry cluster
Chemical industry cluster in Stenungsund, Sweden, shows what an industry cluster can look like and what benefits that can occur in such cluster. Since 1960 Stenungsund, positioned 50 kilometres north of Gothenburg, has been a central location for Swedish petro chemical industry (Berglund, 2010). The companies in Stenungsund are now deeply integrated with many synergy effects and a lot of to-know-how is available in this cluster, this type of cluster also has a competitive advantage (Zhao, Watanabe, & Griffy-Brown, 2009). Such industry cluster often do operate in the same market, share suppliers, education institutes and will most often share the same challenges and fears (Zhao, Watanabe, & Griffy-Brown, 2009). This is also the case in Stenungsund.
The first three companies involved in making Stenungsund a chemical industry hub was Esso, Modo and Unifos (Borealis, 2010). During the 1960’s further expansion of the cluster was needed due to international market outlooks, Sweden didn’t want to be dependent on imported basic petro chemical products (Berglund, 2010). Not only did Stenungsund expand, the chemical industry also wanted total integration between refinery plants, steam cracking and polymerisation (Berglund, 2010).
Today Stenungsund chemical industry is one of the major integrated industry cluster which has developed to be one of its kind worldwide. Here six chemical companies and two energy companies operating together to optimize energy and raw material resources. What characterizes this cluster is the hard niche on high performing products and materials, the electricity supply to the cluster comes from Nordic energy mix which is nearly CO2 free, and this is the first cluster taking clear actions towards green chemistry (Onsander, 2011). Figure 5 shows how complex the cluster is and the “pipes” can be followed to see how the resource flows are connected.
Danish Dong and Swedish Vattenfall is the gas, water and electricity supplier to the plant. Since a couple of years Dong delivers gas with a small part of biogas mixed in the natural gas, this part could increase if biogas production would be put into focus (Onsander, 2011). Vattenfall provide the plant with electricity and runs a water treatment plant which supplies the industry and part of Stenungsund municipally with water (Stenungsund Kommun, 2011). AGA Gas produces nitrogen, oxygen, carbon dioxide and argon from air. Both nitrogen and oxygen is delivered through pipelines to other industries in the cluster, AGA Gas is not included in the cluster group and is treated as a normal supplier (Onsander, 2011). Nitrogen is here used to prohibit fire and explosions (Stenungsund Kommun, 2011).

11
Figure 5: Stenungsund chemical industry (Lindkvist, 2010).
The Stenungsund cluster “starts” with Borealis cracker facility which produces ethylene and propylene from butane, ethane, naphtha and propane. Switches between these feedstock’s can quickly be made (Onsander, 2011). Ethylene and propylene is transferred to the own polyethylene plant, using a self developed technology, producing plastic products (Stenungsund Kommun, 2011). The oil cracker produces hydrogen gas at 110bar which is used by actors in cluster. Fuel gas and hydrogen is mainly used by the industries for steam production. Many of the industrial processes in Stenungsund requires steam at very high pressures, this implies own production of steam to fulfil the right requirements (Borg & Stralström, 2007). Fuel gases and hydrogen are residues from Borealis production site in Stenungsund (Borg & Stralström, 2007) and ETBE, ethyl tert-butyl ether, leaving the Borealis cracker is sold direct and mixed into petrol (Onsander, 2011).
AkzoNobel produces special chemicals like ethylene oxides, surfactants and amines from ethylene, oxygen and ammonia. Through conversion of saline to chlorine with electricity Ineos crates their base product. Chlorine together with ethylene forms the plastic material polyvinylchloride (PVC) (Stenungsund Kommun, 2011). Both AkzoNobel and Ineos import parts of their ethylene demand (Lindkvist, 2010).
Perstorp Oxo is the youngest and smallest member of Stenungsund industry cluster. They produce aldehydes, alcohols and organic acids which are used in colour, coatings and safety glass. Raw materials used are ethylene, propylene and natural gas (Lindkvist, 2010). Perstorp Oxo excess heat is transferred into Stenungsund municipally district heating system, the excess heat stands for 90 % of the total heat in the system (Borg & Stralström, 2007).

12
The chemical industry in Stenungsund has together started an initiative called “Hållbar kemi 2030 – Kemiföretagen i Stenungsund” 1 (Lindkvist, 2010). Their common vision for the future states “In 2030 Stenungsund will be the hub for the manufacturing of sustainable products within the chemical industry. Our operation is based on renewable feedstock and energy and contributes towards a sustainable society” (Lindkvist, 2010). Behind this statement lie plans to have an integrated industry site which uses raw materials and produce products that are a part of a natural ecosystem, in addition have efficient energy consumption, develop existing system further to take care of excess heat, recycle plastic materials and use locally produced transportations fuels. This to avoid furthers dependence on fossil feedstock (Tysklind & Söderberg, 2010). The industry cluster can’t achieve these changes on their own, they also need system service from municipally and both national and EU-27 policies have to change to favour use of renewable raw materials in the chemical industry. Today there are three main value chains for biomass feedstock, these are energy generation, vehicles fuel and materials/chemicals. EU-27 policies of today support the first two of these values chains through tax reduction and cap and trade scheme. For chemical industry to become competitive for biomass feedstock this picture has to change. According to Robert Onsander Hållbar Kemi 2030 is a vision and not a detailed action plan (Onsander, 2011).
1 English translation – Sustainable Chemistry 2030 – Chemical industry in Stenungsund

13
3 Biorefinery technologies
The different parts of the lignocelluloses feedstock can be used for different purposes and therefore is it necessary to separate it in different steps. The different parts can as described before create different valuable products such as chemicals or fuels. The technical processes have the aim to depolymerise, break up polymers to monomers, and deoxygenating (removal of oxygen) the biomass components (Cherubini, 2010). The first part is primary refinery which divides the raw material after decided specifications such as size (de Jong, van Ree, & Elbersen, 2006). The second part is described well by Cherubini and includes four different main categories; Thermochemical processes, Biochemical processes, Mechanical processes and Chemical processes (Cherubini, 2010).
Due to the objective of this Master thesis the focus will be to find technologies that give solid residues which can be used for co-firing in coal fired power plants. Other biorefinery technologies, giving non solid residues, will also be presented together with their possibilities for the future, but in a shorter context (Clements & Van Dyne, 2006). Chapter 3 is a summary and explanation of all for this master’s thesis relevant biorefinery technologies. Information about target products and residues will be found in chapter 4 and 5.
3.1 Mechanical processes
Cherubini describes the mechanical processes as “Processes which do not change the state or the composition of biomass, but only perform a size reduction or a separation of feedstock components” (Cherubini, 2010). In the biorefinery system these processes often are first in line because a size reduction is necessary to continue with other processes. Examples of these other processes can be drying, pelletizing and granulating. Another common mechanical process is the barking process. This is a process especially used in the paper mills but also in other plants to bare the hemicelluloses part of the tree (Cherubini, 2010). The residue is often bark or sawdust.
3.2 Thermochemical processes
These processes use high temperatures and have short reaction rates converting biomass into energy and/or heat and power but also in some of the processes produce chemicals (Cherubini, 2010). In this report are pyrolysis, gasification and liquefaction described. A regular combustion for heat and power is also a thermochemical process with the purpose to produce heat and power. The residues after such process are mostly ash, which is no valuable residue (Miller, 2005). The difference between pyrolysis, gasification and combustion is the temperature. Pyrolysis work with the lowest temperature (between 400 and 700°C), gasification operates at 700 to 900°C and finally combustion between 800 and 950°C (Neves, Thunman, Matos, Tarelho, & Gómez-Barea, 2011). The yield from thermochemical processes is around 60% and that is high compared with other biorefinery processes (Eriksson, 2009).
3.2.1 Pyrolysis
Pyrolysis is a technology that treats biomass with moderate temperatures around 400-700°C. The heat is transferred from surrounding gas in absence of oxygen to the biomass particle (Dermibas, 2009). The particle size is depending on the pyrolysis
14
model, the heating rate and residence time. The heating rate, the speed of temperature increase, is important due to the production rate of volatile gases. The main product types from pyrolysis are volatile gases and liquids, with the residue char coal. The char coal is a solid product similar to coal, see chapter 5.2. Volatile gases are a mix of CO, CO2, H2, Methane and Ethylene. These are interesting gases to condensate in the production of chemicals (Clements & Van Dyne, 2006), (Neves, Thunman, Matos, Tarelho, & Gómez-Barea, 2011). The liquid is called bio-oil and consists of complex mixture of different compounds, see chapter 4.2. If the target is to produce as much gas as possible in the pyrolysis process a low heating rate and a high temperature is used, the opposite will favour char coal. (Dermibas, 2009). It is possible to use pyrolysis with both hemicelluloses directly and separated lignin.
There are different types of pyrolysis, slow, fast and flash. Slow pyrolysis means pyrolysis with a low heating rate, approximately 0.1-1°Cs-1 and reach a maximum temperature around 500°C (Bahng, Mukarakate, Robichaud, & Nimlos, 2009). This heating rate corresponds to traditional pyrolysis and will favour production of char coal. This technology has been used for thousands of years in production of char coal as a fuel and the residence time is between 5 to 30 minutes
The fast model is more efficient for extraction of liquid products and uses a higher heating rate in combination with smaller particles (<1mm) (Dermibas, 2009). The heating rate is approximately between 10 to 200°Cs-1 and the residence time is only up to a couple of seconds (Bahng, Mukarakate, Robichaud, & Nimlos, 2009). After the fast heating, a rapid cooling of the pyrolysis vapour is necessary to get the bio oil (Bridgewater & Peacock, 2000). Even with cooling some gaseous products will be formed and the process will give around 60-75wt% liquid bio-oil, 15-25wt% char coal and 10-20wt% non condensable gases (Bridgewater, 2003).
Flash is an improved model of the fast pyrolysis with higher heating rate, up to over 1000°Cs-1 and a residence time of only a few seconds and uses very small particles, under 0.2mm (Dermibas, 2009). Due to the short residence time this process requires smaller particles than fast and slow pyrolysis (Bahng, Mukarakate, Robichaud, & Nimlos, 2009). If the biomass raw material contains heavy metals, most of these will be in the char and the bio-oil is almost heavy metal free (Kuppens, et al., 2009).
3.2.2 Gasification
Gasification is also a form of pyrolysis but in this report, as in much of the literature, gasification will be treated separately. In this technology the solid biomass will be treated with higher temperatures (700-900°C) with an oxygen supply around 35% of the demand for combustion. This treatment converts the biomass to a combustible gas mixture. This gas mixture is called producer gas or fuel gas (Faaij, 2006) and consists of carbon monoxide (CO), hydrogen (H2), methane (CH4), nitrogen (N2), carbon dioxide (CO2) and some smaller fractions of higher hydrocarbons (Brown, 2003). The gas can be used as fuel for heat and power services, which is most common, but can also be used as feedstock for production of liquid fuels and chemicals. The process is endothermic and requires heat, this heat can be produced either from the produced gas or from burning some parts of the biomass directly (Brown, 2003). Also the gasification process will give some char coal (around 10%) even if the high temperatures favour gas production (around 85%) (Zhang, Xu, & Champagne, 2010).
There are a several advantages with the gaseous fuel from gasification of biomass compared to a fossil fuel; lower emissions of toxic by-products to the atmosphere and

15
efficient usage of solid by-products in form of char coal. The fact that the greenhouse gas comes from a renewable source is another advantage. Most common is to use the char coal direct in the gasification process. Char coal could be extracted technically, but is normally not economically feasible.
Depending on how the gases will be treated, for example cleaning, after the gasification different heating values can be obtained on the gas in a range from 3.4 to over 35 MJ/m3. 35 MJ/m3 is similar to natural gas and the gas with this high values are also named Substitute natural gas or Synthetic natural gas (SNG). This gas is suitable for replacing or as compliment to natural gas and is already in use (Brown, 2003), (Zhang, Xu, & Champagne, 2010).
3.2.3 Liquefaction
Another thermochemical conversion method is liquefaction. There are two different types of liquefaction techniques, direct and indirect, both technologies produce as much liquids as possible and the residue is mainly tars. (Brown, 2003).
3.2.3.1 Direct liquefaction
Direct liquefaction takes place in an aqueous phase with a temperature around 350°C and a pressure around 203bar. The residence time is long, around one hour (Brown, 2003). One benefit of this technology, also called Hydrothermal liquefaction (HTL), is that the technology can handle waste streams from other processes which often are in aqueous solutions (Dermibas, 2009). The technique produces, as from fast pyrolysis, a lot of different liquid products such as alcohols, phenols and other hydrocarbons. During the process the oxygen content of the organic material is reduced richly to carbon dioxide (Dermibas, 2009). The research is not as developed as for pyrolysis and gasification but there is some interesting results and heating values around 36 MJ/kg is obtained together with a thermal efficiency of 80-90% (Brown, 2003).
3.2.3.2 Indirect liquefaction
This is a technology where low-value organic materials produce a liquid with a gas mixture of syngas (H2 and CO) with a high heating value. The liquid will afterwards continue to a catalytic or biological synthesis to produce ethanol or other chemical products or compounds. The technique is developed for the process of coal into methanol or synthetic fuel but can also work with biofuels. There are two ways of production: the traditional process with moderate-temperature, high pressure and a catalytic chemical reaction and a more modern way is to use microorganisms growing on coal atoms to convert syngas to alcohols or acids (Brown, 2003).
3.3 Biochemical processes
In these processes the temperature is lower, down to 30°C, and the reaction rate is also lower than for the thermochemical processes. The two most common types are anaerobic digestion and fermentation (Cherubini, 2010).
3.3.1 Anaerobic digestion
This technique decomposes mainly organic wastes of different types into biogas, a combination of mainly methane and carbon dioxide. The process takes place in an oxygen free environment with help from bacteria. The process is in different steps and in every step a special bacteria have a special task to break down the organic

16
compounds. This process is good for wet biomass and examples are manure, organic industrial waste sludge’s and organic domestic wastes. This is an old technology in the food and beverage industry but is increasing also in other branches to take care of waste and to produce a useful product, such as fuel. If the produced fuel is used directly in electricity production this process has a low efficiency. Biogas needs upgrading to give the process similar efficiency as with natural gas. The residue is often wet slurry with different energy and nutrient content (Faaij, 2006), (Brown, 2003).
3.3.2 Fermentation
Fermentation is a biochemical process which uses microorganisms and/or enzymes to create reactions. The reactions take place in an aqueous solution with the final products in modest concentration. One of the most used substrates is glucose but other examples are glycerol, pentoses and other hydrocarbons (Clements & Van Dyne, 2006). Fermentation is used for ethanol production from sugar, corn or other starch rich products, this is called 1st generation of fermentation. Besides the ethanol different numbers of other chemicals can be produced from fermentation. Most of them are produced in a small amount as specialty chemicals in example aliphatic acid and lactic acid (Brown, 2003). The fermentation process is chemically described as:
Equation 1: Fermentation process.
������ � 2������ 2��� Fermentation 2nd generation uses cellulose based raw material and therefore gives different residues, these are mainly lignin based with good energy content.
3.4 Chemical processes
These processes conduct a change in the chemical structure of the molecule with a reaction to other substances. The most common processes are hydrolysis and transesterfication. There is a group of other chemical reactions, which will not be discussed in this Master thesis due to their complexity. These chemical reactions are standard chemical process in the industry today, but with other raw materials, which also can work with biomass.
3.4.1 Hydrolysis
Hydrolysis is a process where water splits a larger reactant molecule into two smaller molecules. The development of the technology started in the beginning of the 19th century when Napoleon started an economic continental blockade which stopped the import of sugar to Europe. Some researchers, especially in Germany, started different projects and Kirchhoff found that potato starch converted into sugar when it was cooked in dilute acid. In 1835 the Swedish scientist Berzelius found out that an enzyme with a catalyst could speed up the process and this developed the sugar production from sugar beets (Kamm, Kamm, Gruber, & Kromus, 2006).
This technology is used in the production of sugar from sugar beets or in extraction of starch from a lignocelluloses feedstock for ethanol production. The operating temperature is around 150-200°C and the process time is between a couple of seconds up to some minutes. The process can be one of the important technologies to extract starch from cellulosic feedstock for ethanol production (Brown, 2003).

17
3.4.1.1 Dilute-Acid Conversion
Hydrolysis with acid can be done by different acids, for example sulphuric and hydrochloric acids. But due to economic reasons the most common acid is sulphuric.
The temperature of the steam is very important for the process and a low temperature favour xylose and a high will favour more furfural and tars. Xylose comes from xylan which is a complex polysaccharide in plant cell walls. There is an option for lower temperatures but in that case the concentration of the acid must be higher and a good chemical recycling system must be used to reach economical feasibility. Most of the technical development was done around the Second World War to secure some necessary production of sugar. An important factor here was to use a cellulosic feedstock, which was large in both USA and Germany. After the war some pilot plants have been built, none of these was commercialised because of the relatively low petroleum price the last decades. It was more economic feasible to use the “cheap” petroleum feedstock than develop a new and more expensive technology (Katzen & Schell, 2006).
3.4.1.2 Enzymatic Hydrolysis
Also the enzyme process started to develop after the Second World War. Research was done especially during the late seventies and early eighties. Up to the nineties some pilot and demonstration plants was built, but still no commercial plants. The reason for this is the same as for acid plants; it was cheaper with petroleum based products (Katzen & Schell, 2006).
Since a couple of year more research is performed and some projects are started and there is now a working technology. This has been possible due to the fact that the oil fields are smaller and the oil price is increasing but also because of the environmental debate. The technology is commercialised for sugar canes and sugar production but not for cellulosic feedstock at the moment (Katzen & Schell, 2006).
The enzymatic hydrolysis converts cellulose with a higher efficiency and has been tested in bench-scale and pilot scale. There is two ways to do the enzyme process either in separated reactors called Separate Hydrolysis and Fermentation (SHF) which has the problem that glucose formed in the hydrolysis process reduces the enzyme performance. The other possibility is to do the hydrolysis and fermentation in the same reactor and here the glucose can be consumed directly by yeast. This process is named Simultaneous Saccharinification and Fermentation (SSF). Drawbacks are a compromise between efficient hydrolysis and efficient fermentation due to process conditions. Another drawback is that some of the yeast is removed together with the lignin and can therefore not be recycled (Eriksson, 2009). Even the hydrolysis residues are mainly lignin based, such as AHR and SSFR.
3.4.2 Transesterfication
Transesterfication is a process where triglyceride reacts with alcohols like methanol or ethanol to produce methyl ester or ethyl ester (also known as FAME) and the residue is glycerol. Triglyceride is extracted from the seed from different plants (soybean, sunflower or rape). If the seed have oil content over 20% mechanical pressing can be used and the seeds are crushed. If the seeds have a lower content a solvent extraction can be necessary. The extracted triglycerides, known as “fats and oils”, are esters of glycerol and fatty acids. The fatty acids have an even number of carbon atoms and the

18
degree of saturation can vary a lot. Fats are often solids in room temperature and have a high percentage of saturated acids. Oils have on the other side a high percentage of unsaturated acids and are liquid in room temperature.
Triglycerides from plants are often oils and therefore they have a high number of unsaturated fatty acids. The oils can be extracted from many different plants but today around 50% of the world production comes from soya beans which have a high yield in comparison. There are also future possibilities with a tree called Chinese tallow tree that is growing in the south of United States. The estimated potential of this plant is close to ten times higher than for soybeans (Brown, 2003)
The transesterfication process is a simple process between the triglyceride and methanol. The reaction takes place at 60°C if sodium hydroxide is used as catalyst or at room temperature with potassium hydroxide as catalyst. But in the last case the reaction time is longer. The two products (glycerol and RME) will be in two separate phases so the RME can be decanted of. The glycerol layer also contains an excess of methanol and the catalyst. The methanol is separated for reuse with distillation and the catalyst can be separated due to the use of the glycerol. Sometimes the catalyst need to be naturalised and for that purpose a phosphoric acid can be used in that case also another by-product is formed. This by product is a phosphorus salt which can be separated and use as fertilizer, the produced volume is very small. At the end the RME is washed to remove the last amount of methanol and after that the RME is vacuum dried (Batchelor, Booth, & Walker, 1995).
3.5 Cellulose separation technologies
The cellulose separation technology is also a chemical separation technology, but is here presented separated due to many different methods. The lignin is separated in the pulp process due to the fact that the lignin give bad properties connected to the colour of the paper. To avoid this, the lignin is separated to some level and the pulp is bleached to get a perfect paper. The separated lignin is used for internal heat and power services or extracted if it’s economical feasible to do that. The separation from the today’s most widely used pulp system, the Kraft mill, can recover lignin with a very high yield by acidification and filtration (i.e. LignoBoost) (Brunow, 2006). Of course there is also isolation of lignin from other types of production with lignocelluloses biomass. These two categories can be described based on the lignin’s sulphur content and in some way the sulphur content also describes what the lignin can be used for (Borges da Silvaa, et al., 2009), to see this complex system see Figure 6:
• Sulphur free lignin based on biomass conversion technologies for biofuel production.
• Sulphur containing lignin based on production from kraft and sulphite pulp production.
It is important to note that the sulphur containing processes also can be used for the production of biofuel i.e. ethanol.
Today the paper mills use the black liquor in the recovery boiler to get electricity and steam but also in the recycle of cooking chemicals. There is an excess of lignin in the black liquor which can be extracted for other services. This is also good for the paper mills where the recovery boiler often is the bottleneck for increasing pulp production. If some lignin is extracted more black liquor can pass through the recovery boiler and more pulp can be produced (Wallmo, 2008). After the separation of lignin in the pulp production the product called lignin consist of both organic and inorganic materials.

19
The organic materials consist of around 50% sugars which give this product a potential as animal feed additive (Pye, 2006).
3.5.1 Lignin Precipitation System (LPS)
The pulp mill of the soda model do not use sulphur in the chemical processes which will give a possibility to separate sulphur free lignin. Instead this lignin has special thermal and solubility properties, in combination with the sulphur free this give lignin for high value applications. The separation process starts with filtration of the black liquor to separate contaminated pulp fibres. After that will the filtrated liquor be acidificated to create lignin slurry. Next step will be to condition the slurry in a maturation step and then filter to remove the crated lignin solids. The last step will be to wash and dry the filter cake to a high purity powder with only around 5% moisture. The rest of the black liquor which will not be returned to the mill will rather be used in an anaerobic digestion or by wet oxidation. The LPS technology is quite new and the first mill to use the technology was a French mill in Thonon and there are also building projects in India (Pye, 2006).
3.5.2 LignoBoost
The LignoBoost process is simple in just a few steps. The first step after the black liquor leave the evaporator system is precipitation vessel. In this vessel carbon dioxide is used to reduce the pH of the black liquor to around 9-10. Around 75% of the lignin is precipitated as a sodium salt (Borges da Silvaa, et al., 2009).
Figure 6: Biorefinery site for kraft lignin and vanillin (Borges da Silvaa, et al., 2009).
STFI – Packforsk and LignoBoost AB have a demonstration plant in Bäckhammar, Sweden. This plant uses between 260 and 280 kgCO2/tonne lignin (Tomani, 2008). In the next step this lignin will be suspended in water and the pH will drop more, the drop will be a result of acidification with sulphuric acid (H2SO4) (Borges da Silvaa, et
20
al., 2009). There are possibilities to use sulphuric acid in both steps, but it can damage the sulphur balance in the paper mill. The CO2 process is more complicated but better in an economic perspective (Wallmo, 2008). The final step is a filtration process and washing where the lignin is taken out in different steps before the black liquor returns to the recovery boiler at the paper mill. The separated lignin can then be used for energy purposes or in production of different chemical products such as vanillin, see chapter 5.2.
The demonstration plant in Bäckhammar has in cooperation with Chalmers University of Technology tested two different lignin fuels with good results. One fuel as powder and one as filter cake, properties of lignin as fuel are presented in Table 4, in chapter 5.2.
3.5.3 Near-Neutral Pre-Extraction
There are also other technologies based on a paper mill, one of them is the Near-Neutral Pre-extraction. This technology is based on extraction of hemicelluloses with focus on production of acetic acid and raw material for fermentation to ethanol. The system is similar to the LignoBoost and the pH is decreased with H2SO4 after the evaporation. In the described model from van Heiningen et al will the lignin return within the plant. The advantages are that the process off loaded the recovery cycle (like LignoBoost), the quality and quantity of the pulp is also unchanged (van Heningen, Mao, Genco, Yoon, Zou, & Pendse)
3.5.4 Organosolv
Organosolv is a very old technique and have been used for over hundred years to separate wood in different components. In the beginning it was to study lignin and carbohydrates and to do this separation organic chemicals (solvents) where used. Later in the history research was done to find out if the technology was possible to use to replace short comings in the traditional pulp industry. Just a few of these technologies were good enough to compete with kraft pulping. These are often regular chemical processes with addition of organic solvents. Depending on which solvents used the process name can change i.e. Alcell (ethanol), Acetosolv (acetic acid) or Formacell (formic acid). The Alcell are the most common and the aqueous pulping solution consists of ethanol, here pulping liquor will be cooked in relatively high temperatures and pressure (around 195°C and 28 bar) (Pye, 2006). The organosolv follow the mechanism for regular chemical pulping, but is more selective due to the alkali-alcohol reactions that occur to the organic solvents. The result of this is that organosolv is more selective to lignin and therefore more lignin can be separated. Organosolv have the following advantages due to regular chemical pulping (Kadia & Dai, 2006):
• Higher separation factor of lignin
• Milder conditions during production; free of strong acids or alkalis and low temperatures
• Reduction or elimination of sulphur containing compound emission
• A simplified recovery chemical recovery system
• Recovery of lignocelluloses chemical by-products
There is one major problem with the organosolv technique; the quality of the pulp is not god enough. The pulp can be used for some special paper application but the most promising for this technology now is the development around biofuel production. The

21
residues (lignin) from the organosolv technique are clean and that is a reason way it can be interesting for the biofuel and chemical market (Kadia & Dai, 2006).
3.6 Development status of technologies
In the following table the development status of the different involved technologies are summarized. As can be seen many of the technologies are existing (commercialised) or on their way towards market introduction. It is important to mention that some of the technologies are commercialised as technology but are sometimes not commercialised as biorefinery technology or as a technology used for production of green chemicals. Gasification and liquefaction works with coal, but both technologies need further development before use with biomass. According to gasification the technology is ready but only demonstration plants up 10 MWth is existing.
Table 1: Development status of biorefinery technologies.
Technology Status Location
Anaerobic Digestion Existing World wide
Barking Existing World wide
Fermentation (1st) Existing World wide
Fermentation (2nd) Demonstration/Existing Kalundborg, Abengoa
Gasification Demonstration/Existing Güssing, Chalmers
Hydrolysis Existing World wide
LignoBoost Pilot plant Bäckhammar
Liquefaction (direct) Pilot plant USA/Europe
Liquefaction (indirect) Existing USA/Europe
LPS Existing France/India
Near-Natural Demonstration/Existing USA
Organosolv Existing World wide
Pyrolysis Demonstration/Existing USA/Europe
Transesterfication Existing World wide
22
4 Target products from biorefinery technologies
The different biorefinery technologies produces several main products, in this chapter the target products with large potential for future use are presented. These target products also gives interesting residues during production.
4.1 Syngas
Syngas and biogas is used for different purposes and have different compositions. Carbon dioxide, carbon monoxide and hydrogen is the mix building up syngas and this synthetic gas is produced though gasification or pyrolysis. Other outputs from these technologies are bio-oil and char coal. Both the fraction of bio-oil and char coal is very depend on temperature in the process and char coal is most often used for direct combustion within the own biorefinery plant.
Syngas energy density is 50% of natural gas and it can be used as combustion fuel or a feedstock for various chemical products, but is mostly used for production of methanol. Due to the short carbon chains it is easy to rearrange syngas to desired carbon chains in chemicals. Syngas contains a small part of nitrogen that has to be separated to get a useful product. This is a hard process due to the similar boiling points of nitrogen and carbon monoxide (Biofuel org. U.K., 2011).
4.2 Bio-Oil
Bio-oil from pyrolysis is a dark brown fluid with a viscosity close to medium fuel oil and will not mix with any other hydrocarbon liquid. A problem with the oil is the temperature sensitivity; due to this the bio-oil cannot be distilled in a further chemical process without being other products. Bio-oil can act as raw material in the chemical industry and fulfil the same requirements in many cases as the traditional crude oil (Bridgewater & Peacock, 2000). The higher heating value for bio-oil is around 17 MJ/kg in comparison with crude oil 42-44 MJ/kg.
4.3 Biogas
With a decomposition of organic materials (including wastes) with bacteria in anaerobic digestion (see chapter 3.3.1) gaseous fuel will be produced. The bacteria break down the organic material into simpler organic compounds. Biogas mainly consists of methane and carbon dioxide but also a number of trace gases (Brown, 2003). To achieve a good gaseous fuel as clean methane as possible is necessary. This clean stream is reached by separating carbon dioxide with different methods in a step called upgrading. If sulphur needs to be separated, this can be done with a water scrubber.
If biogas is upgraded and compressed it can be used as transportation fuel and it can through upgrading reach natural gas values. Biogas upgraded to 97% of methane has a caloric value of 9.67 kWh/m3, slightly less than natural gas that has 11.0 kWh/m3, although this upgrading is energy intensive and can be costly as well (Erdmann & Zweifel, 2008)
4.4 Ethanol
Ethyl alcohol or ethanol is an organic compound with the molecular formula C2H5OH. Ethanol has quite broad application possibilities within chemical industry as a solvent in the synthesis of other organic compounds or as transportation fuel. The most

23
common production model is fermentation (see chapter 3.3.2) which gives a dilute aqueous solution. This solution needs afterwards a fraction distillation to obtain an acceptable quality, after the distillation even dehydration can be necessary. Final product is a colour less flammable liquid ( Encyclopædia Britannica, 2011). Production can be done either with a starch based feedstock (the first generation) or with a lignocelluloses feedstock (second generation). If the lignocelluloses feedstock is used than some pretreatment is necessary either with hydrolysis or with different lignin separation methods (Faaij, 2006). The second generation only has energy efficiency around 35%, so to be competitive the residue must be used. These residues are often lignin rich and are therefore energy rich (Eriksson, 2009).
4.5 RME
FAME is formed by a reaction called transesterfication between triglyceride and methanol. Normally in Europe the fatty acids are from Rapeseed and therefore the most common product name is Rape methyl ester (RME). There are different ways to sell this fuel either it can be sold as B100 which is 100% of RME and then 100% renewable fuel. Another way to sell the RME is to blend it with diesel and sell this blended product. The positive aspect with RME is that it can directly or with very small modifications replace diesel in vehicles. In Europe, especially in Germany and France, large amount of this fuel is used. The problem with RME is that it is still a quite expensive fuel and needs subsidies to be competitive. In Europe this is solved by a subside system in two parts. The first part of the system is according to rape production includes subsidies to farmers that produce these plants for example instead of crops for food production. The second part is in the tax system and tax benefits are given to producers and users of RME (Faaij, 2006).
4.6 Paper
The first product is from the pulp and paper mill is pulp and with further process paper can be produced. Pulp is not an end consumer product but there are cases with mills that only produce pulp and sell to paper producing sites. Paper production is a traditional industry with a large energy demand connected to different steps of drying and pressing. This because the pulp is a wet slurry when it leaves the mill. The paper making process also includes the bleaching which is necessary for a white paper with good contrast. The chemicals used for this is chlorine or in more modern case oxygen. Paper production is an important industry in some of the EU-27 countries, especially in Finland and Sweden. The two biggest categories of produced paper are printing/writing and packaging, together they stand for around 60% of the worldwide production. The paper production worldwide increase every year and there is a clear connection of paper use and income in a country, higher income means more paper (Brännvall, 2009).

24
5 Valuable residues
Output from biorefinery technologies are target products, by-products and valuable residues. In this chapter the solid residues coming from different biorefinery technologies in chapter 3 is presented.
5.1 Bark
The bark proportion of biomass feedstock often plays an important role in energy conversion properties, this due to the fact that removal of bark sometimes is not feasible and in other cases bark is separated and sold on a separate market (Kenney, Sennerby-Forsse, & Layton, 1989). Biomass is usually classified by parameters energy purposes, humidity, density, heating value and ash content (Werther Guidi, 2008). Compared with wood, bark has higher moisture content, higher ash and alkali metal content which may cause corrosion in boilers and furnaces (Werther Guidi, 2008). Compounds like sulphur and chlorine in the ash are corrosive and can reduce the oxide layer in boilers and furnace, these compounds can also reduce the melting point of the ash. Although in woody biomass there are low concentrations of sulphur and chlorine (Lehtikangas, 2000). Since bark acts as a protection and nutrients barrier for the wood it contains higher concentrations of N, P, K, Mg, Ca, Cd, Pb, Co and Zn, see Table 2 (Adler, Verwijst, & Aronsson, 2005). Because of these minerals the ash content of the whole tree is largely depending on the proportion of bark (Werther Guidi, 2008).
Figure 7: Chemical differences between wood and bark (Kenney, Sennerby-Forsse, & Layton, 1989)
Bark also has a higher content of lignin and a lower percentage of cellulose, see Figure 7. This induce that biomass with high bark content is a valuable energy source due to the high content of lignin, but to get maximum energy output this type of biomass has to be stored properly and bark properties has to be taken into account (Adler, Verwijst, & Aronsson, 2005). Bark is more sensitive to temperature and pressure than wood because of the relatively high content of lignin and alkali metals. The proportions of lignin in bark products increase during storage time (Lehtikangas, 2000).
For a willow stand assessed in 2003 the bark proportion of biomass standing in the field where on average 19%, the small twigs had around 56% bark content and 5 year old plants had lowest with 15% bark content. Bark content in willow where seen to be relatively constant when plant had grown a diameter of 20 mm at a height of 55 cm. Due to the special properties of bark, the bark content in energy crops have direct impact on the quality of fuel and ash content in bark is seen as high (4.1%-4.8%) (Adler, Verwijst, & Aronsson, 2005). Higher ash content in biomass depends on alkali metals and lowers the heating value (Lehtikangas, 2000).

25
Table 2: Properties for bark pellets (Berglin, Tomani, Salman, Herstad Svärd, & Åmand, 2008)
Unit Bark pellets
C %wt of dry solids 51.90%
H %wt of dry solids 6.10%
N %wt of dry solids 0.40%
S %wt of dry solids 0.04%
O %wt of dry solids 37.90%
Cl %wt of dry solids 0.02%
Ca mg/kg dry solids 9324
K mg/kg dry solids 2138
Na mg/kg dry solids 310
Ash %wt of dry solids 3.60%
LHV MJ/kg dry wt 17.7
HHV MJ/kg dry wt 21
Moisture content % dry wt 10.30%
There has been found that bark from poplar crops contain important pharmaceuticals (Barton, 1984). This bark can also be used for acid treatment of leather, and in this way replace today use of hazard acid liquids (Grundmann, 2011). This could maybe lead to a higher value on this type of bark.
From the pulp and paper industry of today a lot of wooden bark is produced. One modern mill can separate and sell 242 GWh/yr. The electricity production in EU-27 was in 2008 3.4 million GWh (Eurostat, 2009), (Jönsson & Berntsson, 2011). Considering that there are 209 pulp mills or combined pulp and paper mills in EU ETS, a significant amount of bark is available on the market (EcoFys, 2009).
5.2 Char coal
Char coal is formed then wood is slowly heated in a chamber with limited and controlled amount of air, it can either be extracted as a residue for further combustion process at another plant or it can be combusted directly at the own plant. If it’s economically feasible to extract char coal for co-combustion with coal is uncertain, this depends on for instance transportation distance and cooperation with owner of plant. Char coal has several advantages among the solid residues coming from biorefinery technologies. One of them is the small amount of minerals and alkali content (Brown, 2003). A chemical biorefinery plant has shown that char coal from biomass is a promising fuel with heating values around 25.6 MJ/kg and ash content of 15%. Combustion of this char coal can yield more energy than combustion of the entire originally feedstock (50% moisture content) at pilot plant (Hayes, Fitzpatrick, Hayes, & Ross, 2006). The pilot plant discussed by Hayes et al. estimated that the energy potential coming from char coal is greater than the energy needed at the plant when scale of operation is equal or bigger than 270 dry tonnes of feedstock per day. This surplus could be sold as electricity on the grid or the char coal could be sold for co-combustion with coal (Hayes, Fitzpatrick, Hayes, & Ross, 2006).
Char coal from low and medium temperature processes with biomass or waste as feedstock material is one of the most reactive carbon materials, more reactive than char from coal (Di Blasi, 2008). This is due to a highly disordered structure together

26
with the porosity (Henrich, Bürkle, Meza-Renken, & Rumpel, 1998). If the temperature in process is increased the yield of char coal from biomass decreases, so if high yield of biomass char should be obtained the pyrolysis process should work with low temperature and low heating rate. Increasing particle size of biomass and higher lignin content of biomass also affects the yield of char coal in a positive way (Demirbas, 2004). Figure 8 shows the trend of char coal yields, figures for drawing this diagram are average values from Di Blasi. Here fast pyrolysis is performed in a fluidized-bed pyrolysis and slow pyrolysis refers to pyrolysis of cylinders 40 mm in diameter (laboratory scale), both fast and slow pyrolysis is performed with softwood (Di Blasi, 2008).
Due to that higher pyrolysis and gasification temperatures give more valuable products from biomass it is unlikely to believe that pyrolysis at low temperature will be preferable at commercial scale. In most processes studied the char coal is directly combusted within the own plant both due to simplifications and for char coals high heating value. During literature study no valuable products coming from char coal used as feedstock have been obtained, only char coal own value as fuel is discussed in literature.
Figure 8: Yields of char coal as % of dry solid basis depending on heating temperature (Di Blasi, 2008).
Char coal is a very important energy source in developing countries, and is often used in households, but also for larger applications. The briquetting of char coal improves the efficient of the energy used and therefore also the efficiency of the biomass based energy. As example a wood based char coal contains 80% carbon, 1-3% ash and 12-15% volatile gases (Dermibas, 2009).
5.3 AHR and SSFR
Ethanol can be produced in several different ways and before fermentation dilute-acid hydrolysis or enzymatic hydrolysis can be used to separate out cellulose. These two processes are described in Figure 9 and Figure 10, here it can be seen that there are some possibilities to take out solid lignin rich residues which can be pelletized and used as fuel (Wingren, Galbe, & Zacchi, 2008).
0%
5%
10%
15%
20%
25%
30%
35%
40%
45%
397 427 477 527 577 627 677
Ch
ar
coa
l [w
t%]
Temperature [°C]
Slow pyrolysis
Fast pyrolysis

27
In the dilute-acid hydrolysis residue (AHR) is taken out by filtration before the distillation. The data for the residue will be presented in Table 3. The hydrolysis process leads in both cases to a reduction in the alkali content which is good for the boiler (Eriksson, 2009).
Figure 9: Dilute-acid hydrolysis for ethanol production (Eriksson, 2009).
In the SSF process the final ethanol concentration will be low, only around 4wt%. To increase this it is necessary to concentrate the ethanol stream to a higher level. The most common operator to use is distillation. After the distillation a solid phase residue named SSFR is separated out with filtration. The liquid phase/slurry can be further processed in either an evaporator system or in an anaerobic digester. The evaporator system will use a lot of energy but will give a condensate that can be recycled within the system to save water. The digester on the other hand gives methane/biogas that can be used or sold. The both systems also give residues back to the pellet making process, but with different properties. The solid stream from the filtration and the concentrated steam from the evaporator system will be mixed together and dried to 85% DM. The drying process will most likely use steam on different steam levels (around 12 and 20bar). Dried solids can be used as fuel to create the necessary steam and the excess can be sold. Both processes are operated as batch process and the total residence time for the digester will be around 25 days and for the evaporator system 84h and the fermentation takes around 72h (Wingren, Galbe, & Zacchi, 2008).
Figure 10: Simultaneous Saccharinification and Fermentation enzyme hydrolysis process for ethanol production (Eriksson, 2009).
The residues from the anaerobic digester case are good and consist of 80% lignin which also gives a good heating value. The pellets from the evaporator consist of only 55% of lignin. This is due to that the concentrated syrup from the evaporators contains of other substances as glycerol, ash and inorganic compounds. This will decrease the

28
heating value of the pellets. The lower heating value in combination with the higher ash content will do the evaporator residue, DR, to a lower quality fuel. There are also some risks for higher sulphur content in the evaporator syrup (Wingren, Galbe, & Zacchi, 2008).
Table 3: Properties of AHR and SSFR (Eriksson, 2009), (Wingren, Galbe, & Zacchi, 2008).
Unit AHR SSFR
C %wt of dry solids 59.10% 46.80%
H %wt of dry solids 5.90% 6.20%
N %wt of dry solids 0.15% 5.82%
S %wt of dry solids 0.10% 0.30%
O %wt of dry solids 34.60% 33.10%
Cl %wt of dry solids <0.01% 0.03%
Ca %wt of dry solids 0.00074% 0.72%
K %wt of dry solids 0.00044% 1.32%
Na %wt of dry solids 0.00026% 0.013%
Ash %wt of dry solids 0.50% 0.19%
LHV MJ/kg DS 20.9 19.9
HHV MJ/kg DS 22.7 21.5
Moisture content % - 15.0%
5.3.1 Concentrated liquid distillation residue (DR)
DR is a wet residue from the second generation ethanol production and the composition of this residue is not completely known but part of it is similar to glucose. The heating value is under 20 MJ/kg and it can be dried to pellets. There is some ongoing research about combustion of DR, but there is a major problem with alkaline. This alkaline comes from products which are used to neutralize the stream after pretreatment process and will also give a higher ash content of the residue. There are possibilities to use the DR in digester for biogas production or as fertilizer (Eriksson, 2009).
5.4 Glycerol
Glycerol or glycerine (C3H8O3) is a residue from the production of rape methyl ester (RME) or FAME (from other plant-oils) a fuel substitute for diesel engines. The oilseed can be used in three ways in the engine; pure rape oil, blended with fossil diesel and as RME. The fluid properties of pure rape oil make it unsuitable, because of large droplets which give incomplete combustion. Both the blended version and RME can be used in a diesel engine with no or very small modifications (Batchelor, Booth, & Walker, 1995).
Currently the glycerol market is nearly saturated. The market consists of cosmetics, chemical, food and beverage industries, after the entry of the RME glycerol price has decreased. Due to the low price the market at the moment tries to find out which valuable products can be developed from glycerol to get a higher value out of this residue (Bohon, Metzger, Linak, King, & Roberts, 2011). The price policy of the glycerol products is complex due to different purity of the products. The traditional industries use glycerol at purity of around 98%, from transesterfication the purity is around 80-88% (Rahmat, Abdullah, & Mohamed, 2010). There are other examples;

29
one of the Swedish RME producers, Perstorp AB, in Stenungsund produce glycerol with a purity of at least 97% and sell this product to other chemical companies (Perstorp AB, 2008).
The good thing for the environment with the RME glycerol production is that this can replace fossil based glycerol even if it’s not used as fuel. Further more important factor for the environmental friendliness is how the methanol is produced. The methanol can be produced either from natural gas or from gasification of biomass. If the methanol comes from the gasification the total process can be more sustainable (Eriksson, 2009).
The technical problem with glycerol is that the compound has a melting point around 17.8°C and therefore is syrup in room temperature (CHEMnetBASE, 2011). So the glycerol is more similar to oil but still possible to use as a fuel.
5.5 Lignin
Lignin (C9H10O2(OCH3)n) is the natural phenolic glue that holds together cellulose fibers and act as a natural protection against biological degradation of cellulose and hemicelluloses (Lui, 2010). It is a three-dimensional macromolecule with a carbon to oxygen atom ratio higher than 2:1. Hemicelluloses and cellulose have approximately the carbon ratio 1:1. This is the reason why lignin is a more energy dense substance than sugar (Lui, 2010). Cellulose and hemicelluloses can be hydrolyzed to sugars and then fermented into high value products such as ethanol. Lignin cannot be fermented but it may be useful for chemical extraction and energy generation (Cherubini, 2010). First in the 1940’s engineers learned how to use lignin and hemicelluloses for energy production, prior lignin was a waste product with severe environmental problems (Lui, 2010). There has been shown that there is a significant difference between the hardwood and softwood lignin structure which gives different physical and chemical properties of these two lignin types (Lui, 2010). Lignin molecules weight distributions do to certain extend affect the reactivity and physicochemical properties of lignin (Doherty, Mounsavioun, & Fellows, 2010). There are large research projects going on to find out and evaluate what chemicals that can be extracted from the lignin. But at the moment this research is on a basic level in many cases. So besides today’s use for production of vanillin it is hard to say how the future uses will be (Lui, 2010). To see properties of lignin see Table 4.
There is an ongoing process to find a possible ways to use the isolated lignin in an efficient way connected to both resource and environmental questions. This is hard due to the complex molecule structure of the lignin. Already today there are some commercial products for the lignin i.e. vanillin and dimethylsulfoxide. Product classification of different lignin products (Brunow, 2006):
• Combustion products
• Utilization of surface products
• Condensation of lignin so that becomes an integral part of a product
So there is competition between different usages of the lignin. This competition has both an environmental and economical aspect. Also the properties of the lignin residue will be important and the value can be depending on the contamination from the separation processes (Pye, 2006). This future processes will mainly be based on the focus to get fermentable sugars from cellulose and hemicelluloses. An important

30
factor to keep in mind is that the lignin in many cases will be given in wet slurry. This slurry will afterwards pass through a drying process and later solid lignin or pellets are produced.
Table 4: Properties of lignin (Berglin, Tomani, Salman, Herstad Svärd, & Åmand, 2008).
Unit Lignin
C %wt of dry solids 62.70%
H %wt of dry solids 5.70%
N %wt of dry solids 0.15%
S %wt of dry solids 0.18%
O %wt of dry solids 27.60%
Cl %wt of dry solids < 0.01 %
Ca mg/kg dry solids 1085
K mg/kg dry solids 543
Na mg/kg dry solids 1666
Ash %wt of dry solids 1.4%
LHV MJ/kg dry wt 17
HHV MJ/kg dry wt 26.3
Moisture content % dry wt 29.30%

31
6 Method
This chapter describes the different methods that are used in the Master thesis and explains how chapter 7 and 8 are performed. The research method used in this project is analytic research through classification and ranking of biorefinery technologies.
6.1 Market potential for target products
To see what market potential different target products can reach an analysis based on statistical data and scenario analysis has been encompassed. Here the fossil feedstock market and renewable resources market were analysed from different views such as, market share of today, production of today and possible future demand.
Data for today’s production of target products based on biomass, see chapter 4, where collected and this production was compared to production of similar products from fossil feedstock. After these two steps calculations have been done to see how much production has to increase in order to substitute products from fossil feedstock. Different fractions of substitutions up to 50% where used to calculate the market share of bio based products. This has been performed by calculating the amount bio based ethanol that is necessary to replace 10, 20, 30, 40 or 50% of today’s production of ethylene and how large increase in ethanol production this will give. The same type of calculations has been carried out for syngas and biogas.
Information about today’s production in EU-27 is collected from Eurostat 2009 production database and calculations where performed in Microsoft Office Excel. Calculations on ethanol were done on tonne bases, due that energy content in renewable ethanol is the same as for fossil ethanol. For syngas the energy content is lower than of fossil natural gas, here energy content was used as bases.
For RME, lignin and paper a theoretical market potential assessment where performed. This theoretical assessment is based on literature and market situation today. Calculations where here excluded because the constituent do have low or no interest for these markets. Instead a short description of the market situation is done.
6.2 Classification
Classification is used to systematically order a larger group of research objects and it works as a useful tool in decision making process. To be able to classify research objects one or several categories are chosen, each and every object should fit into one of these categories. In order to do so the process of classification is divided into two parts, one static for order of steps in value chain2 and one dynamic for type of biorefinery process (Welter, 2006). The static process is fixed and does not change throughout the classification work. The dynamic part aloud the classification system to expand there is necessary.
The categories for type of biorefinery process are chosen from Cherubini (2010) the categories for value chain are closely connected to objective and chapter 3, 4 and 5. The input in category “Technology/process” represents chapter 3, category “Target product” is based on chapter 4 and “Residues” column is based on chapter 5. The order for these categories represents biomass process way through a biorefinery
2 Value chain is describing the biomass path from gate to gate.

32
system. In total this classification has seven categories forming a 4x3 matrix, see Figure 11.
To easy follow the steps in value chain the objects placed in each box will be connected with arrows. If there are any interconnections between different boxes cross section arrows show these connections. All seven categories can also be found in chapter 3, 4 and 5, with these texts as background the matrix is filled with information.
6.3 Weighted ranking
To get an overview over which biorefinery technologies that can be interesting to focus on in the future a weighted ranking is performed. 14 different technologies are ranked by seven different criteria’s, with a score from 1 to 14, where 14 is the best. In this ranking it is not possible that two technologies get the same score in each criteria even if they seem to be similar. This was done in order to have distinct differences between all technologies. So in total a score of 105 points (∑1+2+3+…+14) will be given in each criteria. The maximum score for a technology is therefore 98 points (7 criteria x 14 maximum score). Each criteria will be weighted and is given a weighting factor based on the importance of the criteria connected to the objective of the thesis. This weighting process will be described more deeply in chapter 7.3 and the maximum weighted score is 26.6 points. The ranking is based mainly on the fact review in the report. In Appendix B a short text describes each technology in all criteria and these texts creates a judgement table. The way from the judgment table to the allocated score in the ranking table is based on Table 8 that describes which factors that are important in each specific criteria. The ranking is performed in Microsoft Office Excel.
6.4 Combination of technologies
In the section Combination of technologies the review of different biorefinery technologies and their properties together with literature of planned and existing plants are put together in possible plant solutions. These plants are suggested combination of different process steps to achieve interesting target products and at the same time valuable residues. Some of the processes options comes from Eriksson
Figure 11: Classification system.

33
(2009) but are after that modified. The suggested plants are described with process schemes to give the reader a clear view and explanation of symbols can be seen at page IX. Different inputs and outputs are marked in these schemes and can except from raw material, products and residues as well as other chemicals or heat. The focus for the scheme is based on interesting target products and how their system can be built up and at the same time give interesting residues. This chapter don’t include calculations of process integration which not are included in the objective. The technologies used in these chapters do not need temperatures that are higher than the excess temperatures from coal power plants.
6.5 C-cycle and energy balance
The aim here is to calculate the amount of carbon coming from crude oil that is used as feedstock, in EU-27 chemical industry. Calculated demand for carbon will be used to estimate how much farmland is needed to cultivate energy crops to cover the demand for carbon. To make the result more transparent an energy balance is also performed, here the energy coming from crude oil in chemical industry is calculated. Then calculations are performed to determine the amount of biomass corresponding to the energy coming from crude oil. For biomass and crude oil used in energy services such calculations should be based on exergy content rather than energy content, although for chemical industry this is of less importance. If energy content is used instead of exergy content, there is most likely an underestimation of demand for raw material.
The calculations of carbon content and energy balance will be done on a mix of energy crops, this master thesis will exclude wooden biomass and agricultural by-products as biomass raw material. The energy crop mix includes willow, hemp, reed canary grass and poplar, the term energy crop mix refers to these species. Miscanthus is excluded because no appropriate data has been found on specific properties.
To carry out the carbon cycle analysis calculations and data collections where divided into four steps:
1. Find data for crude oil consumption in EU-27 chemical industry, with pharmaceuticals
included. Calculate the total amount of carbon in this amount of crude oil.
2. Find data and calculate the carbon content in a mix of energy crops cultivated in EU-27.
3. Calculate how much energy crops in kg that is needed to replace the total carbon coming from
crude oil.
4. Calculate how much cultivated area that is needed to cultivate the amount of energy crops
from point 3, compare these numbers with available farmland in EU-27.
The calculations on energy balance where performed in three stages:
1. Calculate the total energy coming from crude oil within chemical industry. Use the same crude
oil consumption as in calculations for carbon cycle.
2. Calculate the mass of biomass in tDM corresponding to energy coming from crude oil.
3. Calculate how large cultivated area is needed to produce this amount of biomass. These
numbers are then compared with available farmland in EU-27.
Calculations for both cases are performed in Microsoft Office Excel software. Before doing calculations unit analysis for each point above where performed, here beneath the unit analysis for the carbon cycle and energy balance is presented.

34
Equation 2: Unit analysis for calculations of total gC coming from crude oil.
� �� �� � � ����� ���� ���� � �� � ���� � �� ����� ��� ���� � �������� � ������ � � ���� �� �� ���� ���� ��� �� �� ����� ������� �� ��� ����� ��� �� ������ !������ " ��#$ �# ��� � #$��� �% " # ��
By performing calculations due to Equation 2 the total amount of carbon coming from crude oil in chemical industry is obtained. The unit tonne of oil equivalent is often used to compare energy content in different fuels. The second step is to calculate the carbon content in energy crop mix.
Equation 3: Unit analysis for calculation of carbon content in energy crop mix.
� �� �� � � � ���� ���! ��& ��� ����� ���� �� �� � � ���� ���! ��& '# (��� ���� ) � �����!���� *��� 1000 �� ��� � " -� � -�./0#$ -�./0 � 1000 " � � #$0
Here the mean net calorific value in energy crop mix and mean percentage of carbon content in dry matter material, DM, where used to calculate the carbon content per energy unit for biomass. Equation 2 and Equation 3 is needed to move forward and perform calculations on how much biomass the amount of carbon corresponds to.
Equation 4: Unit analysis for calculations of need for biomass to cover total amount of carbon from crude oil.
���� � �� ���1� ���� � ���� ����� ��� ���� � �������� ������� ���� �� �� � � � ���� ���! ��& '# (��� ����) � � �� �� � � � ���� ���! ��& !�� � ���� � �� ��� ����� ������� �� �� 1������ �� ������ !������" ��#$ -�./0 � �� #$0 �% " -� Equation 4 gives the total amount of biomass in dry weight needed to cover the necessity for carbon. In order to calculate how many kg of dry matter biomass that is needed, the energy content in energy crop mix is used.
Equation 5: Unit analysis for calculation of need for cultivated land.
2� �� �� ��� *����� �������� �����3���� � ���� ���! ��& ��� ���� " �./�./�� /���� " �� ����0
The last equation is performed to obtain the size of the cultivated area that is required to produce the annual amount of carbon calculated from Equation 2. This figure is then compared with the total area of farmland available in EU-27.
Following three equations shows the unit analysis performed to calculate the energy balance.
Equation 6: Unit analysis for calculate total energy coming from crude oil within chemical industry.
���� � �� ����� ��� ���� � �������� � ������ � � ���� �� �� ���� ���� ��� �� �� ����� ������� �� ����� ��� �� ������ !������
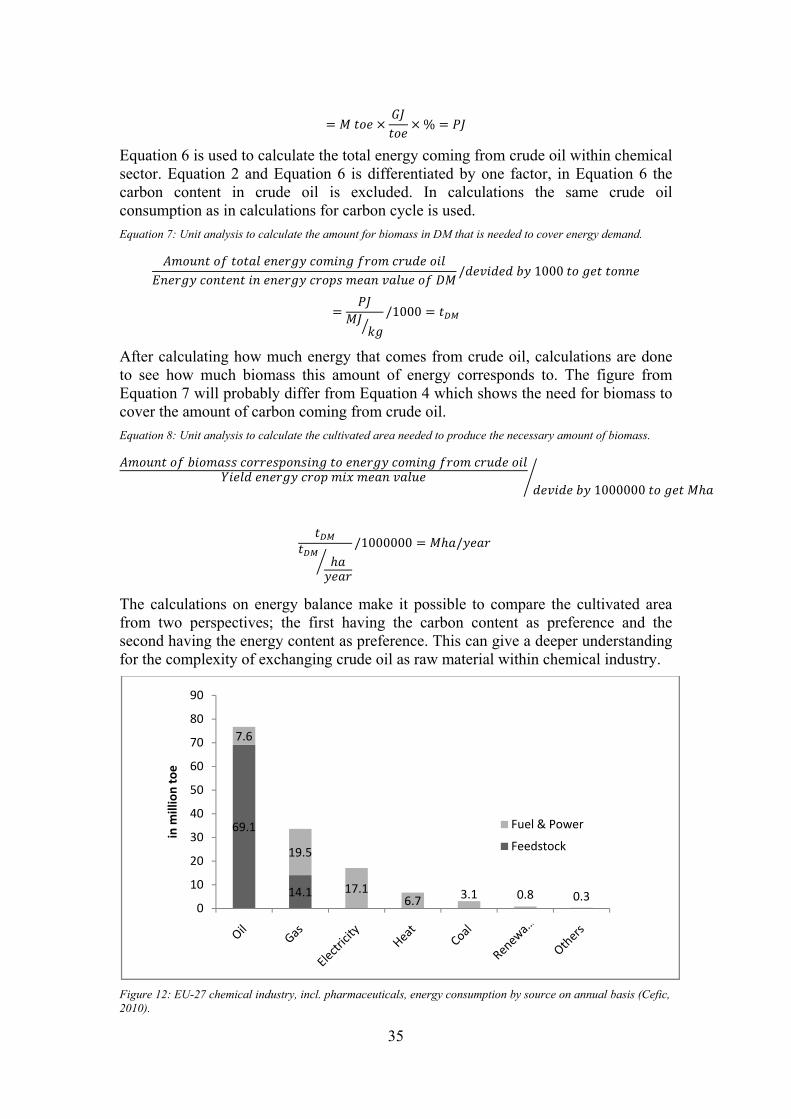
35
" # ��� � 5$��� �% " 6$ Equation 6 is used to calculate the total energy coming from crude oil within chemical sector. Equation 2 and Equation 6 is differentiated by one factor, in Equation 6 the carbon content in crude oil is excluded. In calculations the same crude oil consumption as in calculations for carbon cycle is used.
Equation 7: Unit analysis to calculate the amount for biomass in DM that is needed to cover energy demand.
���� � �� ����� � ���� ���� � ���� ����� ���� ���� �� �� � � � ���� ���!� ��� ���� �� '#/�� ���� 1� 1000 �� ��� �� � " 6$#$ -�0 /1000 " �./
After calculating how much energy that comes from crude oil, calculations are done to see how much biomass this amount of energy corresponds to. The figure from Equation 7 will probably differ from Equation 4 which shows the need for biomass to cover the amount of carbon coming from crude oil.
Equation 8: Unit analysis to calculate the cultivated area needed to produce the necessary amount of biomass.
���� � �� 1������ ������!� �� � �� � ���� ���� � ���� ����� ���3���� � ���� ���! ��& ��� ���� �� ��� 1� 1000000 �� ��� #��7
�./�./ ������8 /1000000 " #��/���� The calculations on energy balance make it possible to compare the cultivated area from two perspectives; the first having the carbon content as preference and the second having the energy content as preference. This can give a deeper understanding for the complexity of exchanging crude oil as raw material within chemical industry.
Figure 12: EU-27 chemical industry, incl. pharmaceuticals, energy consumption by source on annual basis (Cefic, 2010).
69.1
14.1
7.6
19.5
17.16.7
3.1 0.8 0.30
10
20
30
40
50
60
70
80
90
in m
illi
on
to
e
Fuel & Power
Feedstock

36
Figure 12 shows the energy consumption within chemical industry in EU-27. Here energy used as feedstock and energy used for transportation and processes are separated and displayed with different colours. For calculations on carbon cycle and energy balance in chemical industry the amount of crude oil used as feedstock, 69.1 M toe has been used.
To easy display variables from data collection a table of figures has been composed, see Table 5. Figures in italic has not been used in calculations for carbon cycle or energy balance, but can be used as reference value for further comparison. Other figures have been used in calculations done with equations above.
Table 5: Basic figures for calculations on C-cycle.
Basic facts Value Unit
C-content in crude oil (Johansson, 2010) 20 gC/MJ
C-content in energy crop mean value (calculated) 25.7 gC/MJ
Arable land EU-27 (ENCROP, 2010) 111 Mha
Permanent pasture land EU-27 (ENCROP, 2010) 69 Mha
Cultivated land Europe, inclusive Ukraine (Berndes, 2011) 164 Mha
Permanent pasture land Ukraine (Berndes, 2011) 76 Mha
Energy content in energy crop mix DM (mean value) (ENCROP, 2009) 18.234 MJ/kg
Conversion efficiency from biomass to useful product (Dinjus, 2009) 87%
Conversion efficiency from crude oil to useful product 97%
Yield energy crop mix mean value (ENCROP, 2010) 10 tDM/ha/year
Reed canary grass (ENCROP, 2010) 5 tDM/ha/year
Energy willow (Salix) (ENCROP, 2010) 6.0-10.0 tDM/ha/year
Poplar (Italy) (ENCROP, 2010) 20 tDM/ha/year
Aspen (ENCROP, 2010) 5 tDM/ha/year
toe = energy from burning 1 tonne of crude oil 42 GJ/toe
Crude oil use in chemical industry (Cefic, 2010) 69.1 M toe
6.6 Sensitivity analysis
To see if the results are validated different sensitivity analysis has been carried out. For most systems and analysis this project uses variables that have an uncertain character, such as biomass yield, weighting factors or future market potentials. To understand the result in a border aspect these types of variables has been varied to show what effect they have on the out coming result.
6.6.1 Ranking
To analyse how the chosen score system and the selection of weight factors affect the result of the ranking, sensitivity analysis is done. This is carried out in Microsoft Office Excel together with the ranking, both the scoring system and the weighting factor is varied in different cases.

37
The analysis is performed in three different cases:
1. The winner in each criteria is awarded one bonus points which give a score of 15 points.
2. The score system is not linear and a better placing is awarded “higher” score. The used score
system is 1, 2, 3, 4, 6, 8, 10, 12, 15, 18, 21, 24, 28, 32.
3. Variations of the weighting factors. Here different changes are done, but the one that is
presented in the report have higher weighting for the criteria target product and lower for
combination of power plant and independence.
The second option is chosen to spread out the score and award better technologies a higher score in comparison with not so good technologies. In the original case the difference between two or three places is not so large. But in this case the consequences between couples of places can be large. There is also an extra focus on the top four technologies, to see the sensitivity of the best ranked technologies to the chosen parameters.
6.6.2 C-cycle and energy balance
Due to large variations in energy crop yield three different (5, 10 and 20 tdm/ha/year) yields has been used during calculations. Yield of energy crops vary a lot with both geographical location and spices cultivated. In addition yields of biomass will increase throughout the years when more optimised and effective cultivation standards are applied on energy crops (Grundmann, 2011). The three different yields are determined from literature source of different yield in different geographical areas, climate and spices (ENCROP, 2010). For the c-cycle and energy balance the sensitivity analyse in incorporated in the results, see chapter 7.5.

38
7 Results
This chapter is divided into four parts, these mirror the subchapters in chapter 6 Method. First the classification system is presented where the target products and solid residues from different biorefinery technologies are shown, this leads onto the second part, the ranking system for technologies presented in classification. The third part present example on how different technologies can be combined in order to produce right target products and valuable residues. Last subchapter give the reader the results of the carbon cycle and the energy balance.
7.1 Market potential for target products
As discussed previous in chapter 3 the biorefineries give both target products and residues, here the future market potential for the most important biorefinery products are presented. The future market potential for different target products is performed as a sensitivity analysis, concerning both technology of use and residue. The target product that will gain market shares in the future will effect development of technologies and therefore also what residues that will be available. Text here beneath is based on statistical data and future scenario analysis.
7.1.1 Syngas and biogas
In 2009 EU-27 consumed almost 500 Gm3 of natural gas, which responds to 0.27 ppm of EU-27 total energy consumption (Eurostat, 2009). As seen today the fraction of gas as energy supplier is very small, but with increasing oil prices this fraction can easily increase both in EU-27 and worldwide. Natural gas can be replaced both by syngas or biogas after upgrading, due to different energy content in biogas it is preferable as transportation fuel and syngas is appropriate for production of chemicals. Table 6 shows what volume that is needed to replace different fractions of natural gas. Today 11.8 Gm3 of biogas is produced, this number can be used as reference value to understand that there has to be a large increase in production of syngas and biogas, if these are suppose to replace the today’s use of natural gas. If it is added to the picture that gas consumption will probably increase with increasing oil price, production of renewable gases has to increase further. Only to replace 10% of natural gas with biogas the production has to increase 639%.
Table 6: Percentages of EU-27 gas utilisation replaced with biogas or syngas
Fraction replaced Syngas G m3 Biogas G m
3 % increase in biogas production
10% 98.35 75.40 639%
20% 263.86 150.80 1278%
30% 295.04 226.20 1917%
40% 393.39 301.60 2556%
50% 491.74 377.00 3195%
7.1.2 Ethanol
One of the most important chemicals from ethanol at the market is ethylene, this is an important part of many product categories. Such as polymers, oligomers and ethylene oxide which can play an important role in different chemical production. Ethylene can be produced in different ways and most common today is production from a fossil base in a cracker. It can also be produced with dehydration of ethanol from biomass

39
fermentation or gas from gasification or digestion. The ethylene production is very important for the plastic industry and the most important role for the ethanol today is the transport industry.
Table 7: Market share of bioethylene according to today’s ethylene production in EU-27 (Eurostat, 2011), (ePure, 2010)
Part Bioethylene M tonne Bioethylene M tonne Ethanol % of capacity case 2009
10% 1.72 2.82 40%
20% 3.43 5.64 79%
30% 5.15 8.46 119%
40% 6.86 11.27 159%
50% 8.58 14.09 198%
Table 7 shows in the first column the percentage part of the ethylene production that will be changed to bioethylene and the second column shows the necessary amount of bioethylene in mega tonne. The third column gives the necessary quantities of bioethanol and the last column shows a comparison with the production capacity of 2009. As can be seen in Table 7 a start of a bioethylene production will take a big part of the ethanol production capacity even at such as low parts as 10%. It is important to keep in mind that the ethanol production for transport services has increased with several of hundreds percent the last five years and the last year with around 30% (ePure, 2010). With focus only at the transport sector there is an over capacity in production at the moment. But if the increase of consumption will continue with the same rate, this over capacity will turn over to a shortage in a few years. In total this means that there is a huge potential of production of ethanol in EU-27 and the situation looks similar in Germany. Ethanol can also be used for other purposes in chemical industry than fuel and plastics.
There is some ongoing bioethylene research at some of the big sites in Europe, in example Stenungsund. Another good example is Braskem, in Brazil, that have started the first bio polyethylene site in the world. In this project Braskem cooperates with some of the largest packing producers (i.e. Papier-Mettler) in the world to produce sustainable packing applications with sugar canes as base (Braskem, 2011).
7.1.3 RME
There are some different ways to sell this fuel either it can be sold as B100 which is 100% of RME and a 100% renewable fuel. Another way to sell the RME is to blend it with diesel and sell this blended product. In Europe especially in Germany and France large amount of this blended fuel is used. The problem with RME is that it is still a quite expensive fuel and needs subsidies to be competitive.
Germany is one of the examples of countries with subsidies for RME but now the government decreased the tax subvention and the market increase flatted out (EurObserv’ER, 2009). But still there is an increasing market in EU-27 and in addition to that the European Union has a target for 2020 that 10% of the transportation fuel should be covered by “renewable energy” (European Union, 2009). This means that there must be a huge potential for different renewable transportations fuels. According to Eurostat around 3.5% (6.5% in Germany) of the transportation fuel is renewable (Eurostat, 2008). At the moment there is an ongoing discussion

40
about the sustainability of RME as biofuel which can result in a future decreased interest in this fuel.
7.1.4 Lignin and paper
Lignin is, as described, a very interesting residue that is necessary to separate from the cellulose. The residue is interesting because of the high energy content, but also because of a future potential in the production of chemicals such as aromatics. There are some well known chemical products extracted from lignin as lignosulfonate, examples from these are vanillin and pesticides (Doherty, Mounsavioun, & Fellows, 2010). The chemical industry is very interesting for companies producing lignin because of high prices of chemicals which can give higher prices for high quality lignin. At the moment the chemical extraction of chemicals from lignin is in the research phase. There is no big competition over the lignin between the energy sector and the chemical industry today, but this can change in the future. There are also possibilities to use the lignin as raw material in gasification to produce syngas and energy.
The main product from cellulose separation today is paper and the two biggest categories of produced paper are printing/writing and packaging, together they stand for around 60% of the worldwide production. The paper production worldwide increases every year and there is a clear connection of paper use and income in a country, higher income means consumption of more paper (Brännvall, 2009). This means that the paper branch is quite safe at the moment due to the volumes but there can on the other hand be new and cheaper producers in the future. Connected to the concurrence situation it is important to the European companies to keep the quality and learn to use as much of the wooden raw material as possible.

41
7.2 Classification of biorefinery technologies
Figure 13: Summary of biorefinery technologies, their target products and residues.
During this Master thesis ten main groups of different biorefinery technologies have been reviewed and classified. Arrows in Figure 13 helps reader to follow steps in value chain, interconnections between different sections are marked with diagonal arrows. Out of these ten processes, five technologies give five different valuable solid residues; see black boxes under “Residues” in Figure 13. These residues have properties suitable as fuel for co-combustion and they are cellulose based. Some other “solid” residues such as glycerol, rape meal and sludge have shown to be inappropriate for co-combustion with coal. Among these five different three residues have shown to be most fitting, these are lignin, AHR and SSFR, see tables Table 4 and Table 3. It has been hard to estimate the output of specific residues from each technology. This is partly due to the fact that there are hardly any commercial biorefineries to study today, most activities in this field are still in a research phase and not commercialised. It is also important to mention that as combustion fuel some of these solid residues do have competition with other valuable products. Lignin for example is used for producing vanillin, glycerol is used in food and cosmetic industry and rape meal can be used as animal feed. Bark can be suitable for co-combustion if it

42
is pre-treated and dried to pellets before, but this is not believed to be economical feasible. As for char coal it is often not extracted, rather used for direct combustion within the own biorefinery plant.
7.3 Ranking of biorefinery technologies
The different criteria’s and their explanation are described in the following table, see Table 8. This table is then used to allocate the score to the technologies in each criteria. The feedstock in to the system is cellulose based, except from anaerobic digestion and fermentation (1st).
Table 8: Explanation of criteria’s in ranking.
Criteria Explanation Score comments
Target product (TP) Possible use of TP. Quality of TP. Amount of product and final or intermediate product.
Good applications give high score and vice verse.
Market potential (TP) How is the market potential today and in the future?
High score for good market possibilities.
Development status technology
How is the development status for the technology?
See ch. 3. Existing technology gives a high score.
Independence Can the technology stand alone or is it a part in a bigger system.
High score for good stand alone possibilities.
Residue Properties of residue: state, energy content and chemical composition.
Solid residues with co-combustion properties give a high score.
Combination with power plant
Are there possibilities to use streams from a coal fired power plant?
High score for good integration possibilities.
Residue market potential
Are there other valuable markets for the residue?
Low score for competing markets.
The weighting process is based on different weighting factors which are connected to the objective. The most important object for this thesis is to find an interesting residue that can be used in a co-combustion process. This is the reason why the criteria “Residue” have the highest weighting factor. To get as much good residue as possible it is important to have an interesting target product that companies want to produce and customers want to buy. That is why the criteria connected to target product is the second and third most important. The market potential for the target product, weighted as third criteria, is hard to predict and that is the reason why “Market potential target product” have a lower weighting than “Target product”. Development status is given a low weighting and that is mainly based on the fact that the development status can change fast if right research focus is chosen. The fact that it can change fast and that the criteria have minor importance are the reason for low weighting in the other cases. Also criteria’s with minor importance and a low weighting factor is important for the whole process. In Table 9 the weighting factors used in the ranking are presented.

43
Table 9: Weighting factors for ranking.
Criteria Weighting (%)
Target product 25%
Market potential target product 15%
Development status technology 5%
Independence 5%
Residue 30%
Combination with power plant 10%
Residue market potential 10%
100%
The result of the ranking is presented in Table 10. There are four dominating technologies in the ranking both based on score and weighted score; fermentation (2nd), pyrolysis, gasification and hydrolysis. In the bottom of the table the two types of liquefaction and some of the lignin technologies are found. Finally in the middle some interesting technologies such as digestion. In the top fermentation (2nd) is a bit better than the other technologies and that depends on a good product and a good residues especially in combination with hydrolysis. Those are the main reason to the high weighted score and also secure the first place of fermentation (2nd). This ranking includes some parts that are subjective especially connected to the allocation of score in the criteria. The basis of judgement will be further presented in Appendix B.
Table 10: Results of the ranking.
Total score Ranking total score Weighted score Ranking weighted score
Fermentation (2nd) 74 2 12.2 1
Pyrolysis 75 1 10.9 2
Gasification 69 4 10.7 3
Hydrolysis 73 3 10.3 4
LPS 53 9 8.5 5
Transesterfication 58 6 7.9 6
Anaerobic Digestion 56 7 7.7 7
Fermentation (1st) 55 8 7.4 8
LignoBoost 40 10 6.9 9
Barking 59 5 6.4 10
Organosolv 40 10 5.6 11
Near-Natural 27 13 4.2 12
Liquefaction (indirect) 32 12 3.7 13
Liquefaction (direct) 24 14 2.8 14
44
7.4 Possibilities for combination of technologies
To give the requested products, different technologies in chapter 3 can be used in combinations, here a number of these combinations will be described. Technologies from all four categories will be included in at least one example. The combination will also include production of the in chapter 4 presented target products and extraction of the in chapter 5 presented valuable residues. These three chapters and the review of the literature according to existing plants and ideas for plants have given input to the presented combinations in this chapter. One important factor in many of these combinations is to fulfil the energy requirements for the different processes, which need further investigations, both for the primary technology and for upgrading of the residue. This is important especially in the primary process, because the residue will not be used as a fuel directly on site which is normal otherwise. To solve this important question the biorefinery in these cases must be connected to the coal fired power plant which use the residues for combustion and can send back excess heat. The process integration and the necessary calculations for this are beyond the limitations of this thesis. Another good reason of building the plants close to each other is the transport of the residue. If the plants are close to each other the cost and environmental problem with the transport can be minimized. Produced chemicals have a high value and therefore transportation can be more accepted in an economical point of view. Also gas can be transported, in that case connection to the gas grid is necessary.
7.4.1 Syngas production
The syngas production from pyrolysis and gasification starts with size reduction to get the desired size. If it is necessary to remove bark it will be removed in this stage. Next process step will be pyrolysis or gasification step, in this step the biomass will be heated to high temperatures and then release the volatile gases. The volatile gases are often named syngas and have a lot of different application possibilities, such as fuel for power production or as platform for production of other chemicals (for example methanol) or fuels. The power production uses a gas turbine to drive the generator for electricity production. Depending on the process parameters the relationship between gas and the two other components will vary. The two other components are bio-oil, see chapter 4.2, which can be used in the chemical industry and char coal, see chapter 5.2. Char coal is an energy rich residue, but will often be recirculated to produce as much gas as possible. There are possibilities to take out parts of the char coal and use for co-combustion with coal.

45
Figure 14: Process scheme for syngas production with gasification or pyrolysis (Eriksson, 2009).
7.4.2 Ethanol and Biogas plant
There are many ways to combine the production of ethanol and biogas. The main operations are fermentation and anaerobic digestion, here one model will be presented. The model has an ethanol production in the first step with both first and second generation ethanol and the second step is biogas production. These two main products have a wide range of applications both in direct use and in different upgrading processes, see also chapter 5.3.
An advantage with second generation fermentation is that lignin is separated and the lignin can then be used as a fuel to cover the plants heat demand. Or in this case be used as fuel in a coal fired power plant and excess heat from the plant can be used for different heat demands at the biorefinery plant. If the ethanol stream will be used for other services than fuel, further processing will be necessary. These processes can of course be done on site and can also use heat from the power plant. The solid separation can be done with evaporation which also needs extra heat. The pretreatment, in this case is hydrolysis, either needs some kind of acid or enzyme to release the cellulose before fermentation. There are some suggestions that the acid can be replaced with carbon dioxide which then can be taken from the power plant is CCS is used.
The residues from the ethanol production can then go further to the combustion process or the slurry phase (DR) to the digester for biogas production. As mentioned before the quality of the DR is not good enough to use for co-combustion with coal, it is better to use it in the digester. Also other wastes from farms or household can be put in the digester to increase the produced amount of gas. This gas can be consumed directly on site, upgraded and sold to the gas network or as transportation fuel. The fertilizer produced in the waste water treatment (WWT) can be used at farms, even the solid part from the fermentation can be used as fertilizer but it can also be used in the in the power plant. The process scheme can be seen in Figure 15 and the pretreatment step includes size reduction and hydrolysis.

46
Figure 15: Process scheme integrated ethanol plant (first and second generation) with biogas (Eriksson, 2009).
7.4.3 RME transesterfication
Figure 16 shows a theoretical process design of a biorefinery with the main product RME. The RME production is special because it does not use cellulosic feedstock and instead oil based crops. The process have two possibilities to take out fuel for a combustion process, first in the chemical extraction where rape seed meal is extracted and then in the transesterfication where glycerol can be decanted of. Due to the high value for rape seed meal as animal feed this residue is of no interest for co-combustion with coal. If glycerol should be used as a fuel drying process is necessary. The temperature level for the transesterfication is around 60°C so can be supplied by excess heat from power plant.
Another important part for the RME production is the use of methanol. Methanol is used in excess and everything will not react with triglyceride this gives possibilities to reuse some parts of the methanol. Even if some part is reused new methanol is necessary to add on to every batch. Methanol can be produced from syngas which can be produced from gasification of biomass. This means that also a gasification process can be integrated with the RME production and the syngas which not is necessary for the methanol production can be used for other purposes.
Figure 16: Process scheme of the RME production with transesterfication.

47
7.4.4 Cellulose separation
The separation between cellulose and lignin are done for different purposes such as ethanol production 2nd generation and paper production. Also production of other chemicals can be interesting in the future and there is some ongoing research on this area. The separation technologies are described in chapter 3.5. The first step to extract cellulose from lignin is to size down the wood stock and also barking of the wooden feedstock. Bark is traditionally used as a fuel internally or sold on the market and can be used in co-combustion. The second step is to separate out the lignin, also the lignin is traditionally used internally as fuel for heat but it can be extracted and used in the co-combustion process. If bark and lignin are used in the co-combustion the excess heat from the plant must go back to the separation processes. There is an excess of bark and lignin, and especially the lignin has other possible use for example vanillin or other chemical production. The chemical production from lignin is an ongoing research area.
Figure 17: Process scheme for cellulose/lignin separation (Eriksson, 2009)
7.5 Result from C-cycle and energy balance
Calculations on both carbon cycle and energy balance are performed with figures from Table 5 and equations in chapter 6.5 have been used in the same order as presented. In this master thesis conversion efficiency is set to when syngas is produced from crude oil and biomass, respectively 97% and 87% (Dinjus, 2009). Here beneath follows one example of a calculations to further simplify comprehension.
Equation 9: Calculations of total gC coming from crude oil.
� �� �� � � ����� ���� ���� � �� � ���� � �� ����� ��� ���� � �������� � ������ � � ���� �� �� ���� ���� ��� �� �� ����� ������� �� ��� ����� ��� �� ������ !������ " 20 ��#$ � 69,1 # ��� � 42 000 #$��� � 97 % " 5.63 � 10AB ��
Equation 10: Calculations of carbon content in energy crop willow.
� �� �� � � � ���� ���! ��& ��� ����� ���� �� �� � � ���� ���! ��& '# � �����!���� *��� 1000 �� ��� �

48
" 49.80 -� � -�./018.62 #$ -�./0 � 1000 " 26.75 � � #$0
Equation 10 was done for willow, hemp, reed canary grass and poplar. All these values where than added together and divided by four to get a mean value of carbon content in energy crop mix, this showed to be 25.68 gC/MJ. Results from Equation 9 and Equation 10 are used in Equation 11 together with figures from Table 5.
Equation 11: Calculations of need for biomass to cover total amount of carbon from crude oil.
���� � �� ���1� ���� � ���� ����� ��� ���� � �������� ������� ���� �� �� � � � ���� ���! ��& '# (��� ����) � � �� �� � � � ���� ���! ��& !�� � ���� � �� ��� ����� ������� �� �� 1������ �� ������ !������" 5.63 � 10AB��18.05 #$ -�./0 � 25.7 �� #$0 � 87 %10B " 1.4 � 10D �./ Equation 12: Calculations of need for cultivated land (yield 10 tDM/ha).
2� �� �� ��� *����� �������� �����3���� � ���� ���! ��& ��� ���� " 1.4 � 10D �./10 �./�� /���� /10� " 14.0 #�� ����0
Equation 12 give that 14.0 Mha/year of land area needs to be cultivated in order to cover carbon content from crude oil in chemical industry. Same calculations where done for all three yields, 5, 10 and 20 tDM/ha/year. Calculations on energy balance was performed in a similar way, but used energy content in crude oil and energy crop as basis for comparison, see Appendix C.
In Figure 18 the result from calculations of carbon cycle, shown by red bars, and energy balance, shown by blue bars, can be viewed. Each bar represents one of the sensitivity analyses by using different yields of biomass. Figure 18 shows that out of an energy perspective the demand for cultivated land area is higher for all three yields than for the carbon cycle.
Figure 18: Area of land that needs to be cultivated by energy crops in order to replace energy and carbon coming from crude oil. Number above staples show percentage of total arable land.
7.014.1
28.1
6.312.6
25.2
0,0
20,0
40,0
60,0
80,0
100,0
120,0
140,0
160,0
180,0
200,0
Yield 20
tdm/ha
Yield 10
tdm/ha
Yield 5
tdm/ha
Total
arable
land
Total
framland
Mh
a c
ult
iva
ted
/ye
ar
Area cultivated to cover crude oil demand
Area cultivated cover energy
coming from crude oil
Area cultivated to cover
carbon coming from crude oil

49
Total farmland includes both arable land and permanent pasture land in EU-27. In EU-27 there is 111 million ha of arable land and 69 million ha of permanent pasture land available (ENCROP, 2010). To facilitate if areas in Figure 18 are reasonable a future scenario of demand for food and energy is used. The scenario assumptions for food demand in 2030 are chosen from the book European Energy Pathways. Here it is shown that 44-53 Mha of cultivated land and 20 Mha of pasture land might not be needed for food production (Berndes, 2011). This corresponds to 40-47% respectively 29% of EU-27 present agricultural land area. Figure 18 shows that even with the lowest yield of energy crops the need for cultivated area is smaller than the expected “free land” (44-53 Mha), more specific 32.2 Mha for energy balance and 25.0 Mha for C-cycle is needed. Although it is important to keep in mind that result from forecasting demand for energy and food in the future always depends heavily on how the scenario assumptions are chosen.
7.5.1 Biomass economy
The carbon cycle and energy balance shows that theoretical there is enough land available to cultivate the biomass needed to replace crude oil in chemical industry. Another interesting question would be to see how much the crude oil price has to increase in order for biomass to be competitive with crude oil.
Assumptions regarding price and conversion level have been done to perform simplified calculations regarding biomass economy. The price of biomass used in calculations are 200 €/MWh and 78 €/barrel for crude oil (Grundmann, 2011) (Oil-price.net, 2011). Conversion level for crude oil to useful product is assumed to be 97%. Biomass is simplified to consist of 33% lignin and 67% cellulose, the chemical industry is assumed to use all cellulose and separate all lignin in the biomass feedstock.
Three different scenarios has been viewed, in all the chemical industry use all cellulose. In the first the lignin is separated but not sold, in the second case chemical industry sell the lignin part to energy industry and in the third scenario chemical industry sell both lignin and emission permits that they can avoid by using biomass as raw material. These three scenarios gives three different “future crude oil price”, this means what level crude oil price has to reach in order for biomass to be economical preferable or at least feasible. All three scenarios are calculated with the assumption that chemical industry does not get any subsidies for using biomass instead of crude oil.
In Table 11 the result for future crude oil price can be viewed. The three different “future crude oil price” are marked with italic typing. Also the percentage increase can be viewed.
As seen the three different scenarios do not give any major impact on the different future crude oil price, not even scenario three that on forehand where believed to make a major difference on “future crude oil price”. For all three cases biomass is competitive with crude oil first at levels of 300 % increase of today’s crude oil price. Conclusion can be made that with this economically situations the exchange of crude oil towards biomass will be postponed. This not only because of the price of biomass, the exchange of crude oil towards biomass is more complex. This process does have both economical, political, technical and resource problems. The calculations done here are very rough and are performed to show further one of the problems with

50
exchanging crude oil to biomass. Here only crude oil price is taken into account, resources like coal and natural gas are excluded, and also technical improvements for both biomass utilisation and extraction of fossil raw material are excluded.
Table 11: Calculations on future crude oil price.
Calculated parameter Value Unit
Energy coming from crude oil 2815 PJ
Total cost for crude oil 38619 million €
Total cost for biomass 139979 million €
Today price of crude oil 78 €/barrel
Today price of biomass 200 €/MWh
Scenario 1
Future crude oil price 284 €/barrel
Increase in percentage 362%
Scenario 2
Lignin replacing hard coal 840 PJ
Revenue lignin 2320 million €
Future crude oil price 279 €/barrel
Increase in percentage 356%
Scenario 3
Avoided g CO2 178428823 t CO2
Avoided emissions rights 2378 million €
Future crude oil price 274 €/barrel
Increase in percentage 350%
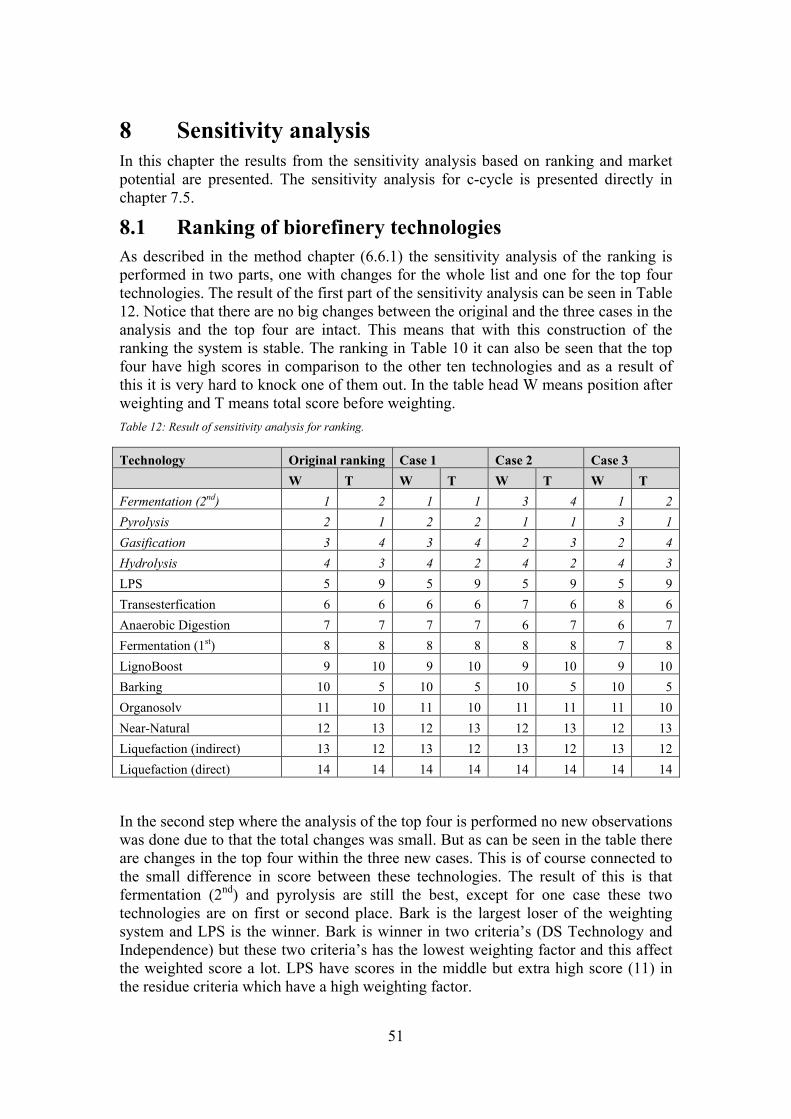
51
8 Sensitivity analysis
In this chapter the results from the sensitivity analysis based on ranking and market potential are presented. The sensitivity analysis for c-cycle is presented directly in chapter 7.5.
8.1 Ranking of biorefinery technologies
As described in the method chapter (6.6.1) the sensitivity analysis of the ranking is performed in two parts, one with changes for the whole list and one for the top four technologies. The result of the first part of the sensitivity analysis can be seen in Table 12. Notice that there are no big changes between the original and the three cases in the analysis and the top four are intact. This means that with this construction of the ranking the system is stable. The ranking in Table 10 it can also be seen that the top four have high scores in comparison to the other ten technologies and as a result of this it is very hard to knock one of them out. In the table head W means position after weighting and T means total score before weighting.
Table 12: Result of sensitivity analysis for ranking.
Technology Original ranking Case 1 Case 2 Case 3
W T W T W T W T
Fermentation (2nd) 1 2 1 1 3 4 1 2
Pyrolysis 2 1 2 2 1 1 3 1
Gasification 3 4 3 4 2 3 2 4
Hydrolysis 4 3 4 2 4 2 4 3
LPS 5 9 5 9 5 9 5 9
Transesterfication 6 6 6 6 7 6 8 6
Anaerobic Digestion 7 7 7 7 6 7 6 7
Fermentation (1st) 8 8 8 8 8 8 7 8
LignoBoost 9 10 9 10 9 10 9 10
Barking 10 5 10 5 10 5 10 5
Organosolv 11 10 11 10 11 11 11 10
Near-Natural 12 13 12 13 12 13 12 13
Liquefaction (indirect) 13 12 13 12 13 12 13 12
Liquefaction (direct) 14 14 14 14 14 14 14 14
In the second step where the analysis of the top four is performed no new observations was done due to that the total changes was small. But as can be seen in the table there are changes in the top four within the three new cases. This is of course connected to the small difference in score between these technologies. The result of this is that fermentation (2nd) and pyrolysis are still the best, except for one case these two technologies are on first or second place. Bark is the largest loser of the weighting system and LPS is the winner. Bark is winner in two criteria’s (DS Technology and Independence) but these two criteria’s has the lowest weighting factor and this affect the weighted score a lot. LPS have scores in the middle but extra high score (11) in the residue criteria which have a high weighting factor.

52
9 Discussion
This work shows that there is a huge potential for bio based products in the future. There are probably not possibilities to replace all fossil products, due to both resource availability and technical hurdles, therefore it is important to focus on some of them. As mention before gas has a broad market and there are strong intensives to get out more and “new” gases on the market. The gas market increase every year and EU-27 is at the moment depending on Russian natural gas which can give political problems in the future. Although technologies producing gaseous products do not have any residues that are of interest for this Master’s thesis.
The top four technologies in the ranking are not unexpected due to their products and residues but there are some statements to do about the result. First anaerobic digestion is a promising technology for the future and will maybe earn a higher rank than place seven. This technology has here lost credits because of the non suitable residue, which is one of the main focuses in this Master thesis. Also the feedstock to the anaerobic digester can be based on all organic materials not only wooden feedstock and an investment in wooden based biogas is probably not a sustainable idea when the wood can be used for other purposes. If different gaseous products are the most interesting, a solution with gasification is the most appropriate. Another technology that need comments is hydrolysis, this technology is in the top four and have quite high credits due to good residues. Here it is necessary to keep in mind that hydrolysis in this case is a technology to separate lignin and cellulose. This means that the produced target products are intermediates or improvements of the feedstock.
The lignin technologies that can be found in the middle of the ranking often give good residues, however large facilities (pulp mills and separation facilities) are necessary. The result of this is that older mills can be retrofitted and new mills can be built in this way, but it is not the most interesting option for the energy or chemical companies to invest in paper mills. In the last two places different liquefaction technologies are found, there can be opportunities for these technologies in the future, but in this ranking with these categories the score is lower than for the other technologies.
There are both positive and negative aspects with different solutions of technologies combinations, but the target of this Master thesis is to get valuable products and residues that can decrease the usage of coal and crude oil. One superior option is to produce ethylene from the bioethanol and then replace the fossil based ethylene. As described in the report ethylene can be produced from ethanol (fermentation) or from syngas (gasification) and because of the residue the recommendation will be to focus on fermentation.
Connected to the chapter 7.4 about combination of technologies there are also important questions about logistics. The heat from the coal power plant should not go longer than necessary, this to prohibit loses of heat. Transportation regarding heat, products and residues all has to be considered to be as efficiently as possible. With a close location the transportation of biorefinery residues can be minimized and can in the best case be transported on conveyor to the power plant. Transports of products or intermediate products which have a higher economic value can be done with truck or train and in some case, depending on the site location, with barges. The texts about a modern paper mill and the Stenungsund industry cluster shows the future potential to combined a biorefinery, a coal fired power plant and a chemical plant. As shown in the report a couple of different technologies can be connected to produce different

53
products. The most important is not to produce many products, it is to produce large quantities of some of them to be an important market player.
In the work with the carbon cycle and the energy balance many different assumptions where made. The results from both analyses are very dependent on these assumptions and results could be illuminating to fit different purpose. To make this report as transparent as possible follows here a discussion on factors that has an effect on the results.
For all type of biomass the yield varies a lot with both geographical location and spices cultivated. This report does take these fluctuations into account by doing a sensitivity analysis. Conventional farming has increased its yields by 1.5 to 2 % each year the last 50 years, this will also be the case for energy crop cultivation, but such optimisation is not taken into account in this report. If this would be taken into consideration it is likely to believe that energy crop yield will increase in the future.
Also conversion efficiency varies a lot with different technologies and end product. For both crude oil use and biomass use the raw material is converted into several valuable products along the value chain, and for most technologies the residues are taken care of and used. This makes the assumptions around conversion efficiencies complex.
The comparison of needed cultivated area with available farmland can be done with a number of different reference values. In this project two different values were chosen, available arable land and total farmland. Often the land use is affected by many factors which makes it complex question. To mention a few parameters the availability of land is affected by competition of interest, national restrictions, shape of land and location. All these parameters can prohibit utilisation due to technical, social and political hurdles. In EU-27 there are also many restrictions regarding nature preservation which limits further cultivation.
When starting discussion with chemical industry for a possible cooperation insight and arguments around biomass economy is valuable. To get well built up arguments more complex calculation on biomass economy has to be performed. Although it is surprising to see how much the crude oil price has to increase in order to reach biomass levels. It would be interesting to see more detailed calculations to see if this picture is changing, with for examples political subsidies.
We have through this project learned many important lessons both regarding methodology and target image. If we would do this once again we would try to have a clearer picture of what we wanted to achieve at the end. This would have given us the opportunity to go deeper in to some areas that we found more interesting, for example the ranking system. We did try to find an appropriate methodology instead of looking forward to what we wanted to learn. Regarding methodology it is important to keep a broad mindset, even if the goal stands clear. This was the case with the carbon cycle and the energy balance, here we learned well how to see a problem out of different angels to avoid a lock in. One big downbeat in this study is that there have only been theoretical studies of different technologies, this due to the fact that there are very few biorefineries existing, producing chemical products. In the beginning of the project we had hoped to see facilities and implementations live, but unfortunately this was not possible.

54
10 Conclusions and recommendations
This Master thesis concludes that there are good technical potentials for cooperation between the chemical industry and the energy sector. The fact that there are very few commercial biorefinery producing chemicals indicates that this branch is far away from replacing crude oil. If energy industry wants to benefit from development towards green products now is the right time to start cooperation, before any new power plants are build or even planned.
There are five solid residues from different biorefinery technologies that can be co-combustion with coal. These are char coal, lignin, AHR, SSFR and bark. Out of these five, lignin, AHR and SSFR are the most suitable both to chemical properties and technology used.
In chapter 7.4 different combinations of biorefinery technologies are presented. Due to the market potential analysis bioethanol will gain large market shares in the future. This makes the combination with fermentation (2nd) and hydrolysis to the most prominent solution, based on the ranking. Hydrolysis has a high score in the ranking but needs combination with other technologies to give a target product. This technology combination needs further development on wooden based ethanol production before commercialisation of is possible. Other technologies with high ranking scores are pyrolysis and gasification, the problem with these technologies are that the residue is hard to extract from the plant.
Another important question around the change from crude oil based to biomass based chemistry is the question about land use. For the performed energy balance the expected demand for cultivated land area is higher than for the expectations for the carbon cycle. This pin points the complexity on how to determine the need for energy crops to cover the crude oil used today in chemical industry. Results depend heavily on conversion rate and this figure is changing with better technology and different end products. Conversion rate used here for crude oil and biomass into useable product is a simplification and this should be kept in mind when studying the results.
Results from carbon cycle and energy balance give an indication on how much biomass that will be needed in the future and calculations shows that the demand is far lower than the available land in EU-27. The complexity of problem definition makes it hard to determine if performed calculations are “right” and depending on input data, results can be manipulated to fit the purpose of stakeholder. Calculations in this Master thesis shows that there is enough theoretical land areal to cultivate biomass to replace the use of crude oil in chemical industry, but before this can happen many social and economical hurdles has to been torn down. Although it should be mentioned that the use of crude oil in EU-27 is 460.6 million toe and chemical industry uses only 69.1 million toe. Further investigation on how much of theoretical land area in EU-27 that actually can be used for cultivation of food or energy crops is needed. Calculations in this Master’s thesis on biomass economy showed that crude oil still do have a great economical advantage over biomass as raw material.
Investigations connected to logistics and process integration between chemical sites and power plants has to be performed deeper. It is necessary that the chemical industry think about if and how they are ready to implement these new green chemicals and if they fulfil the quality requirements.

55
The chemical industry is known to be a very traditional industry which has low exchangeability on raw material and is loyal to their supplier. They rather stay with one supplier known to be good, than change to a cheaper or more environmentally friendly one which they do not have the same trust for. As for today there are no clear incentives, such as tax reduction or subsidy, for the chemical industry to exchange crude oil to renewable feedstock and crude oil is still cheaper and easier to convert into valuable products. To speed up this process political incentive has to take place, but also cooperation with other branches is believed to encourage the exchange. Although the chemical industry is very complex, it is becoming greener and to still be competitive enterprises has to follow this trend.

56
11 References
Encyclopædia Britannica. (2011). Ethyl alcohol. Retrieved May 27, 2011, from Encyclopædia Britannica Online: http://www.britannica.com/EBchecked/ topic/194354/ethyl-alcohol
Adler, A., Verwijst, T., & Aronsson, P. (2005). Estimation and relevance of bark proportion in a willow stand. Biomass and bioenergy (29), 102-113.
Alén, R. (2000). Basic chemistry of wood delignification. In P. Stenius (Ed.), Papermaking Science and Technology - Forest Products Chemistry (Vol. III, pp. 58-104). Helsinki: Fapet Oy.
Annevelink, B., & de Mol, R. (2006). Biomass logistics. Agrotechnology & Food Sceiense Group, Wagenigen UR.
Bahng, M.-K., Mukarakate, C., Robichaud, D. J., & Nimlos, M. R. (2009). Current technologies for analysis of biomass thermochemical processing: A review. Analytica Chimica Acta (651), 117-138.
Barton, G. (1984). Short Communication - Definition of Biomass Samples Involving Wood, Bark and Foliage. Biomass (4), 311-314.
Batchelor, S. E., Booth, E. J., & Walker, K. C. (1995). Energy analysis of rape methyl ester (RME) production from winter oilseed rape. Industrial Crops and Products (4), 193-202.
Berglin, N., Tomani, P., Salman, H., Herstad Svärd, S., & Åmand, L.-E. (2008). Pilot-scale combustion studies with kraft lignin as a solid biofuel. 2008 Tappi Engineering, Pulping and Environmental Conference. Portland.
Berglund, B. (2010). Den petrokemiska revolutionen Svensk petrokemisk industri 1960-2010. Nossebro: Rydins Tryckeri AB.
Berndes, G. (2011). Biomass potentials in Europe: comparing sizes of different sources and put in a global perspective. In F. Johnsson (Ed.), European Energy Pathways - Pathways to Sustainable European Energy Eystem (Vol. I, pp. 227-232). Gothenburg: Energy Technology, Chalmers University of Technology.
Berndes, G., Johnsson, F., & Kjärstad, J. (2010). Co-firing of biomass with coal: a cost-effective option for Europe. In F. Johnsson (Ed.), European Energy Pathways - Pathsways to Sustainable European Energy Systems (Vol. I, pp. 133-139). Gothenburg: Energy Technology, Chalmers University of Technology.
Biofuel org. U.K. (2011). What is SynGas? Retrieved June 17, 2011, from www.biofuel.org.uk: http://biofuel.org.uk/what-is-syngas.html
Bohon, M. D., Metzger, B. A., Linak, W. P., King, C. J., & Roberts, W. L. (2011). Glycerol combustion and emissions. Proceedings of the Combustion Institute (33), 2717-2724.
Borealis. (2010). Borealis historia i Stenungsund. Retrieved May 11, 2011, from www.borealis.se: http://www.borealisgroup.com/stenungsund/borealis-anlaggningar-i-Sverige/borealis-historia/
Borg, F., & Stralström, K. (2007). Industrikombinat - en affärsmöjlighet för Vattenfall. Linköping: Linköpings Universitet.

57
Borges da Silvaa, E., Zabkova, Z., Araújo, J., Cateto, C., Barreiro, M., Belgacem, M., et al. (2009). An integrated process to produce vanillin and lignin-based polyurethanes from kraft lignin. Chemical Engineering Research and Design (87), 1276–1292.
Braskem. (2011). Innovative and sustainable partnerships. Retrieved May 20, 2011, from Braskem: http://www.braskem.com.br/plasticoverde/eng/parcerias_cases.html
Breeze, P. (2005). Power Generation Technologies. Burlington: Newnes - an imprint of Elsevier.
Bridgewater, A. (2003). Renewable fuels and chemicals by thermal processing of biomass. Chemical Engineering Journal (91), 87-102.
Bridgewater, A., & Peacock, G. (2000). Fast pyrolysis processes for biomass. Renewable and Sustainable Energy Reviews (20), 1-73.
British Petrolium. (2010). BP-Statistical review of world energy. London: British Petrolium.
Brown, R. C. (2003). Biorenewable Resources Engineering New Products from Agriculture. Ames: Iowa State Press.
Brunow, G. (2006). Lignin Chemistry and its role in Biomass Conversion. In B. Kamm, P. R. Gruber, & M. Kamm (Eds.), Biorefineries - Industrial Processes and Products Status Quo and Future Directions Volume 2 (Vol. 2, pp. 151-163). Weinheim: WILEY-VCH Verlag GmbH & Co. KGaA.
Brännvall, E. (2009). Overview of pulp and Paper Processes. In M. Ek, G. Gellerstedt, & G. Henriksson (Eds.), Pulp and Paper Chemistry and Technology - Pulping Chemistry and Technology (Vol. II, pp. 1-13). Berlin: Walter de Gruyter GmbH & Co.
Brännvall, E. (2009). Pulping Tehnology. In M. Ek, G. Gellerstedt, & G. Henriksson (Eds.), Pulp and Paper Chemistry and Technology - Pulping Chemistry and Technology (Vol. II, pp. 121-147). Berlin: Walter de Gruyter GmbH & Co.
Bundesministerium für Wirtschaft und Technologie. (2010). Energie in Deutschalnd Trends und Hintergründe zur Enerieversorgung. Berlin: Bundesministerium für Wirtschaft und Technologie Öffentlichkeitsarbeit.
Cefic. (2011). Cefic - About us. Retrieved April 15, 2011, from www.cefic.org: http://www.cefic.org/About-us/
Cefic. (2010). Facts and Figures 2010 - The European Chemical Industry in a worldwide perspective. Beligium: Cefic.
CHEMnetBASE. (2011). Combined Chemical Dictionary (CCD). (Taylor & Francis Group) Retrieved May 18, 2011, from http://ccd.chemnetbase.com/dictionary-search/results.do?id=2024326&props=&struct=start&disp=&si=
Cherubini, F. (2010). The biorefinery concept: Using biomass instead of oil for producing energy and chemicals. Energy Conversion and Management (51), 1412-1421.
Clements, L. D., & Van Dyne, D. L. (2006). The Lignocellulosic Biorefinery - A Strategy for Returning to Sustainable Source of Fuels and Industrial Organic Chemicals. In B. Kamm, P. R. Gruber, & M. Kamm (Eds.), Biorefineries - Industrial

58
Processes and Products Status Quo and Future Directions (Vol. 1, pp. 115-127). Weinheim, Germany: WILEY-VCH Verlag GmbH & Co. KGaA.
Dale, B. E., & Kim, S. (2006). Biomass Refining Global Impact–The Biobased Economy of the 21st Century. In B. Kamm, P. R. Gruber, & M. Kamm (Eds.), Biorefineries - Industrial Processes and Products: Status Quo and Future Directions (Vol. I, pp. 41-66). Weinheim, Germany: Wiley-VCH Verlag GmbH & Co. KGaA.
de Jong, E., van Ree, R. v., & Elbersen, W. (2006). Biorefineries for the Chemical Industry - A Dutch point of veiw. In B. Kamm, P. R. Gruber, & M. Kamm (Eds.), Biorefineries - Industrial Process and Products Status Quo and Future Directions (Vol. 1, pp. 85-111). Weinheim, Germany: WILEY-VCH Verlag GmbH & Co. KGaA.
de Mol, R., Jogems, M., van Beek, P., & Gigler, J. (1997). Simulation and optimazation of the logistics of biomass fuel collection. Netherlands Journal of Agricultural Science (45), 219-228.
Demirbas, A. (2004). Effects of temperature and particle size on bio-char yield from pyrolysis of agricultural residues. Journal of analytical and applied pyrolysis (72), 243-248.
Dermibas, A. (2009). Biorefineries: Current activities and future developments. Energy Conversion and Managment (50), 2782–2801.
Di Blasi, C. (2008). Combustion and gasification rates of lignocellulosic chars. Progress in Energy and Combustion Science (35), 121-140.
Dinjus, E. (2009). Biomass for energy fuels & chemicals. Retrieved June 12, 2011, from www.itas.fzk.de: http://www.itas.fzk.de/deu/lit/2009/diua09a.pdf
Doherty, W. O., Mounsavioun, P., & Fellows, C. M. (2010). Value-adding to cellulosic ethanol: Lignin polymers. Industrial Crops and Products (33), 259-276.
EcoFys. (2009). Methodology for the free alloation of emission allowances in the EU ETS post 2010 - Sector report for the pulp and paper industry. European Commission.
ENCROP. (2009). Energy from field energy crops - a handbook for energy producers. Jyväskylä, Finland: Jyväskylä Innovation Oy.
ENCROP. (2010). Energy from field energy crops - Sustainable energy production with direct combustion or biogas technology Publishable result-oriented report. Jyväskylä, Finland: Intelligent Energy Europe.
ePure. (2010). ePure Statistics. Retrieved May 30, 2011, from www.ePure.org: http://www.epure.org/statistics/info/Productioncapacityinstalled
Erdmann, G., & Zweifel, P. (2008). Energieökonomik Theorie und Anwendungen. Berlin Heidelberg: Springer-Verlag.
Eriksson, G. (2009). Residues from Biochemical Production of Transport Biofuels in Northern Europe - Combustion Properties and Applications. Luleå University of Technology, Department of Applied Physics and Mechanical Engineering: Division of Energy Engineering . Luleå: Luleå University of Technology.
EurObserv’ER. (2009). Biofuels Barometer. SYSTÈMES SOLAIRES le journal des énergies renouvelables (192), pp. 55-77.
59
European Union. (2009). DIRECTIVE 2009/28/EC OF THE EUROPEAN PARLIAMENT AND OF THE COUNCIL of 23 April 2009 on the promotion of the use of energy from renewable sources and amending and subsequently repealing Directives 2001/77/EC and 2003/30/EC. Official Journal of the European Union (L140/16), 17.
Eurostat. (2009). Panormama of Energy: Energy statistics to support EU policies and solutions. Luxemburg: Office for Official Publications of the European Communities.
Eurostat. (2008). Share of renewable energy in fuel consumption of transport in percent. Luxembourg.
Eurostat. (2011). Statistics on the production of manufactured goods (prom). Retrieved May 30, 2011, from www.ec.europa.eu: http://epp.eurostat.ec.europa.eu/ portal/page/portal/statistics/search_database
Faaij, A. (2006). Assessement of the Energy production industry - Modern options for producing secondary energy carriers from biomass. In J. Dewulf, V. Langenhove, & Herman (Eds.), Renewables-Based Technology Sustainability Assessment (pp. 209-230). West Sussex: John Wiley & Sons Ltd.
Grundmann, J. (2011, April 06). Supervision Master Thesis. (M. Johnsson, & A. Åhlund, Interviewers) Hamburg.
Harding, N., & Adams, B. (2000). Biomass as reburning fuel: a specialized cofiring application. Biomass and Bioenergy (19), 429-445.
Hayes, D. J., Fitzpatrick, S., Hayes, M. H., & Ross, J. R. (2006). The Biofine Process - Production of Levulinic Acid, Furfural, and Formic Acid from Lignocellulosic Feedstocks. In B. Kamm, P. R. Gruber, & M. Kamm (Eds.), Biorefineries - Industrial Processes and Products. Status Quo and Future Directions. Vol. 1 (Vol. I, pp. 139-164). Weinheim: WILEY-VCH Verlag GmbH & Co KGaA.
Henrich, E., Bürkle, S., Meza-Renken, Z., & Rumpel, S. (1998). Combustion and gasification kinetics of pyrolysis chars from waste and biomass. Journal of Analytical and Applied Pyrolysis (49), 221-241.
IEA Bioenergy. (2010). Biorefineries: Co-production of Fuels, Chemicals, Power and Materials from Biomass. Retrieved March 28, 2011, from www.ieabioenergy.com: http://www.ieabioenergy.com/Task.aspx?id=42
Johansson, D. (2010). Fossil fuels: Resources and markets (focus on oil). Chalmers University of Technology, Gothenburg, Sweden.
Jönsson, J., & Berntsson, T. (2011). Pathways for the pulp industry: trade-offs between profit and CO2 emissions reduction. In F. Johnsson (Ed.), European Energy Pathways - Pathways to Sustainable European energy system (Vol. I). Gothenburg: Energy Technology, Chalmers University of Technology.
Kadia, J. F., & Dai, Q. (2006). Pulp. In Kirk-Othmer Encyclopedia of Chemical Technology (Vol. XXI, p. 21). John Wiley & Sons, Inc.
Kamm, B., Kamm, M., Gruber, P. R., & Kromus, S. (2006). Biorefinery Systems - An overview. In B. Kamm, P. R. Gruber, & M. Kamm (Eds.), Biorefineries - Industrial Processes and Products. Status Quo and Future Directions. Vol. 1 (Vol. 1, pp. 3-40). Weinheim: WILEY Verlag GmbH & Co. KGaA.

60
Katzen, R., & Schell, D. J. (2006). Lignocellulosic Feedstock Biorefinery: History and Plant Development for Biomass Hydrolysis. In B. Kamm, P. R. Gruber, & M. Kamm (Eds.), Biorefineries - Industrial Processes and Products. Status Quo and Future Directions. Vol. 1 (Vol. 1, pp. 129-138). Weinheim: WILEY-VCH GmbH & Co. KGaA.
Kenney, W. A., Sennerby-Forsse, L., & Layton, E. (1989). A Review of Biomass Quality Research Relevant to the Use of Poplar and Willow for Energy Conversion. Biomass (21).
Kuppens, T., Cornelissen, T., Carleer, R., Yperman, J., Schreurs, S., Jans, M., et al. (2009). Economic assessment of flash co-pyrolysis of short rotation coppice and biopolymer waste streams. Journal of Environmental Management (91), 2736-2747.
Leckner, B. (2007). Co-combustion summary of technology. Chalmers University of Technology, Energy and Environment, Gothenburg.
Lehtikangas, P. (2000). Quality properties of pelletised sawdust, logging residues and bark. Biomass and Bioenergy (20), 351-360.
Lindkvist, G. (2010). Sustainable Chemistry 2030. Möte om Hållbar kemi 2030.
Lui, S. (2010). Woody biomass: Niche position as a source of sustainable renewable chemicals and energy and kinetics of hot-water extraction/hydrolysis. Biotechnology Advances (28), 563-582.
Luo, L., van der Voet, E., & Huppes, G. (2010). Biorefining of lignocellulosic feedstock - Technical, economic and environmental consierations. Bioresources Technology (101), 5023-5032.
Miller, B. G. (2005). Clean Coal Engineering Technology. Burlington: Elsevier Academic Press.
Neves, D., Thunman, H., Matos, A., Tarelho, L., & Gómez-Barea, A. (2011). Characterization and prediction of biomass pyrolysis products. Progress in Energy and Combustion Science (20), 1-20.
Oil-price.net. (2011). Oil-price.net. Retrieved July 8, 2011, from www.oil-price.net: http://www.oil-price.net/
Onsander, R. (2011, May 27). About industrial clusters integration and future. (M. Johnsson, & A. Åhlund, Interviewers) Gothenburg.
Perstorp AB. (2008). Glycerine tech - Product data sheet. (3) . Stenungsund: Perstorp AB.
Pye, E. K. (2006). Industrial Lignin Production and Applications. In B. Kamm, P. R. Gruber, & M. Kamm (Eds.), Biorefineries - Industrial Processes and Products. Status Quo and Future Directions. Vol.2 (Vol. 2, pp. 165-200). Weinheim: WILEY-VCH Verlag GmbH & Co. KGaA.
Rahmat, N., Abdullah, A. Z., & Mohamed, A. R. (2010). Recent progress on innovative and potential technologies for glycerol transformation into fuel additives: A critical review. Renewable and Sustainable Energy Reviews (14), 987–1000.
Stenungsund Kommun. (2011). Säkerhet och risker - Kemiföretagen. (L. Jansson, Editor) Retrieved May 11, 2011, from www.stenungsund.se: http://www.

61
stenungsund.se/vanstermeny/sakerhetochrisker/kemiforetagen.4.3bb1af4411d08fc12c380001237.html
Termuehlen, H., & Emsperger, W. (2003). Clean and Efficient Coal-Fired Power Plants. New York: The American Society of Mechanical Engineers.
Tomani, P. (2008). Large scale lignin removal experiences. Nordic Wood Biorefinery Conference (pp. 168-174). Stockholm: Innventia.
Tysklind, L., & Söderberg, E. (2010, May 24). Kemiindustrin i Stenungsund har framtiden för sig. Bohusläningen .
Wallmo, H. (2008). Lignin Extraction from Black Liqour - Precipitation, filtration and washing. Department of Chemical and Biological Engineering, Forest Products and Chemical Engineering. Gothenburg: Chalmers University of Technology.
van Heningen, A., Mao, H., Genco, J., Yoon, S.-H., Zou, H., & Pendse, H. Near-Neutral Pre-Extraction before Hardwood Kraft Pulping; a Biorefinery Producing Pulp, Ethanol and Acetic Acid. University of Maine, Depatement of Chemical Engineering, Orno.
Vattenfall AB. (2010). Six sources of energy - one energy system (Coal power). Stockholm: Vattenfall AB.
Vattenfall AB. (2010). Årsredovisning 2010. Stockholm: Vattenfall AB Investor Relations.
Welter, M. (2006). Die Forschungsmethode der Typisierung. Wirtschaft-wissenschaftlisches Studium , 113-116.
Werther Guidi, E. P. (2008). Bark content estimation in polular (Populus deltoides L.) short-rotation coppice in Central Italy. Biomass and Bioenergy (32), 518-524.
Wingren, A., Galbe, M., & Zacchi, G. (2008). Energy considerations for SSF-based softwood ethanol plant. Bioresource Technology (99), 2121-2131.
Zhang, L., Xu, C., & Champagne, P. (2010). Overview of recent advances in thermo-chemical conversion of biomass. Energy Conversion and Management (51), 969-982.
Zhao, W., Watanabe, C., & Griffy-Brown, C. (2009). Competitive advantage in an industry cluster: The case of Dalian Software Park in China. Technology in Society (31), 139-149.
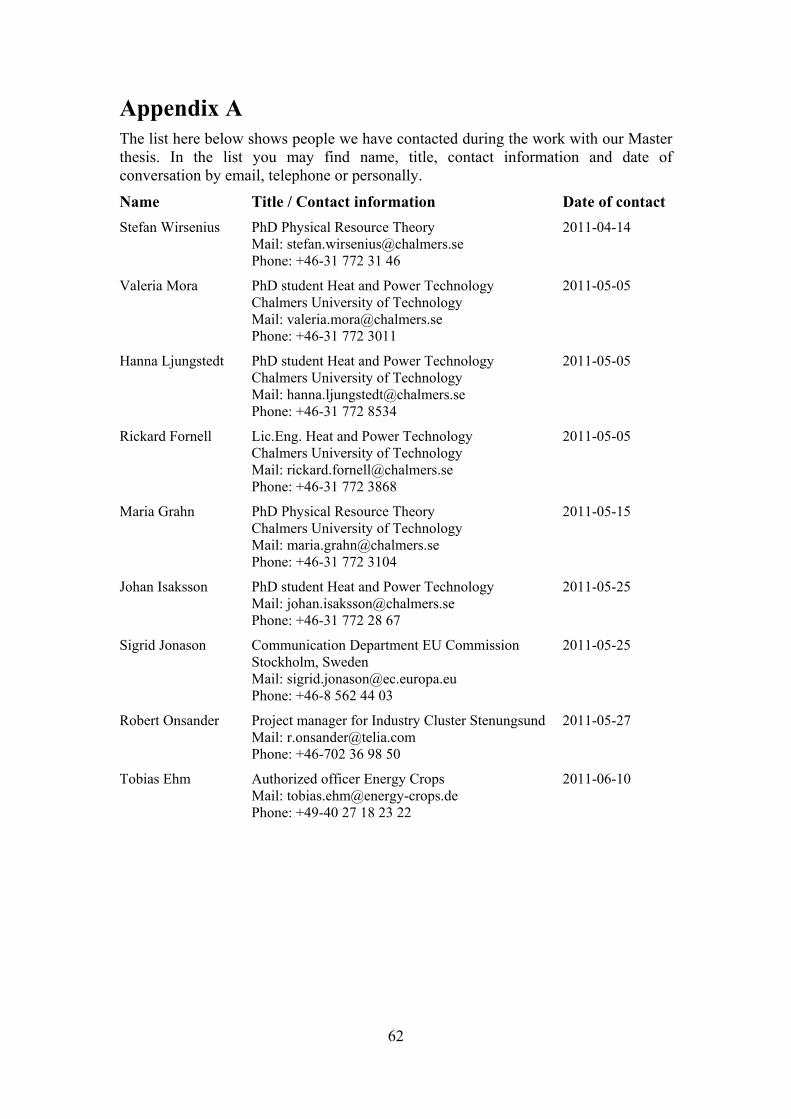
62
Appendix A
The list here below shows people we have contacted during the work with our Master thesis. In the list you may find name, title, contact information and date of conversation by email, telephone or personally.
Name Title / Contact information Date of contact
Stefan Wirsenius PhD Physical Resource Theory 2011-04-14 Mail: [email protected] Phone: +46-31 772 31 46
Valeria Mora PhD student Heat and Power Technology 2011-05-05 Chalmers University of Technology Mail: [email protected] Phone: +46-31 772 3011
Hanna Ljungstedt PhD student Heat and Power Technology 2011-05-05 Chalmers University of Technology Mail: [email protected] Phone: +46-31 772 8534
Rickard Fornell Lic.Eng. Heat and Power Technology 2011-05-05 Chalmers University of Technology Mail: [email protected] Phone: +46-31 772 3868
Maria Grahn PhD Physical Resource Theory 2011-05-15 Chalmers University of Technology Mail: [email protected] Phone: +46-31 772 3104
Johan Isaksson PhD student Heat and Power Technology 2011-05-25 Mail: [email protected] Phone: +46-31 772 28 67
Sigrid Jonason Communication Department EU Commission 2011-05-25 Stockholm, Sweden Mail: [email protected] Phone: +46-8 562 44 03
Robert Onsander Project manager for Industry Cluster Stenungsund 2011-05-27 Mail: [email protected] Phone: +46-702 36 98 50
Tobias Ehm Authorized officer Energy Crops 2011-06-10 Mail: [email protected] Phone: +49-40 27 18 23 22

63
Appendix B Table 13: Total score and ranking for all categories, S=Score and W=Weighting.
3 TP = Target product 4 DS = Development status 5 CPP = Combination with power plant 6 MP = Market potential
Criteria Weighted Total
Target product Potential TP3 DS
4 Technology Independence Residue CPP
5 Residue MP
6 Score Rank Score Rank
Technology S W S W S W S W S W S W S W
Anaerobic Digestion 12 3 12 1.8 11 0.55 11 0.55 4 1.2 4 0.4 2 0.2 7.7 7 56 7
Barking 5 1.25 3 0.45 14 0.7 14 0.7 5 1.5 8 0.8 10 1 6.4 10 59 5
Fermentation (1st) 11 2.75 10 1.5 9 0.45 8 0.4 3 0.9 5 0.5 9 0.9 7.4 8 55 8
Fermentation (2nd) 14 3.5 14 2.1 6 0.3 7 0.35 13 3.9 9 0.9 11 1.1 12.2 1 74 2
Gasification 13 3.25 13 1.95 4 0.2 12 0.6 10 3.0 3 0.3 14 1.4 10.7 3 69 4
Hydrolysis 6 1.5 6 0.9 12 0.6 9 0.45 14 4.2 14 1.4 12 1.2 10.3 4 73 3
LignoBoost 7 1.75 4 0.6 2 0.1 1 0.05 9 2.7 13 1.3 4 0.4 6.9 9 40 10
Liquefaction (direct) 2 0.5 5 0.75 1 0.05 6 0.3 1 0.3 1 0.1 8 0.8 2.8 14 24 14
Liquefaction (indirect) 1 0.25 9 1.35 8 0.4 3 0.15 2 0.6 2 0.2 7 0.7 3.65 13 32 12
LPS 8 2 8 1.2 7 0.35 5 0.25 11 3.3 11 1.1 3 0.3 8.5 5 53 9
Near-Natural 3 0.75 1 0.15 3 0.15 2 0.1 6 1.8 6 0.6 6 0.6 4.15 12 27 13
Organosolv 4 1 2 0.3 10 0.5 4 0.2 8 2.4 7 0.7 5 0.5 5.6 11 40 10
Pyrolysis 9 2.25 11 1.65 5 0.25 13 0.65 12 3.6 12 1.2 13 1.3 10.9 2 75 1
Transesterfication 10 2.5 7 1.05 13 0.65 10 0.5 7 2.1 10 1 1 0.1 7.9 6 58 6
Summary 105 26.25 105 15.75 105 5.25 105 5.25 105 31.5 105 10.5 105 10.5 105 105 735 104

64
Technology Target product Potential TP DS Technology Independence
Anaerobic Digestion Biogas that can replace NG
Can replace NG & NG has a growing market with good infrastructure Existing world wide
Can be used on its own & is often connected to farms or waste disposal
Barking Wood material or bark free tree feedstock
There is already a lot of bark on the world market
A well known technology used for decades
Don't need anything more than a tree buyer
Fermentation (1st) Ethanol Growing market as fuel & chemical Existing especially in Brazil & USA Give ethanol and can stand independent
Fermentation (2nd) Ethanol Growing market as fuel & chemical Demonstration and existing Due to the lignocelluloses feedstock some pretreatment is necessary
Gasification Synthetic gas Huge potential as NG replacer but also for chemical extraction Demonstration and existing Work alone
Hydrolysis Different sugars from starch such as cellulose
Extracted cellulose can i.e. be used for fermentation (2nd) Old existing technology
Give product such as sugar but need connection to work as biorefinery.
LignoBoost Pulp/cellulose
Paper market increase, but not significant. Cellulose can be interesting Pilot plant i.e. Bäckhammar
Need paper mill and extraction technology
Liquefaction (direct) Liquids such as alcohols Good for bio based chemicals Pilot plant Quite independent, give product on site
Liquefaction (indirect) Mixture of gas & liquids Good for bio based chemicals and gas
Developed for coal work with fermentation Need for separation
LPS Pulp/cellulose Hard to forecast, but good quality Existing in France/India Need a paper mill
Near-Natural Pulp/cellulose Hard paper market Demonstration and existing Need a paper mill
Organosolv Pulp/cellulose Low pulp quality, not good Existing Need a paper mill
Pyrolysis Bio-liquids (oil) & Syngas Interesting potential for bioprod. Demonstration and existing Give product on site
Transesterfication FAME Biofuel for transport but with decreasing subsidies Existing Give product on site
Table 14: Background of judgement for score table part one.

65
Table 15: Background of judgement for score table part two.
Technology Residue CPP Residue MP
Anaerobic Digestion A wet residue that maybe can be used as fertilizer
This is no good options for co-combustion with coal There are other possible use such as fertilizer
Barking Bark
Fulfil a lot of requirements for co-combustion. Question about chemical composition and water content
Can be used for energy services but also for i.e. leather treatment
Fermentation (1st) Not so energy rich but can be sent to the digester Low possibilities Energy services with digester
Fermentation (2nd) DS, AHR, SSFR lignin rich residues Spec. AHR and SSFR can be used for co-combustion with coal
There is no other big markets, maybe as fertilizer
Gasification Char coal Mainly used directly in process and not feasible to extract Energy services but most direct in process
Hydrolysis Lignin rich residue as AHR & SSFR Very good possibilities due to the lignin rich residue
Very good possibilities for energy use, similar to fermentation (2nd)
LignoBoost Lignin Shows good properties for co-combustion Research on chemical extraction otherwise energy service
Liquefaction (direct) Not well known, but wet No good known options Possibilities for digester
Liquefaction (indirect) Not well known, but not so wet as direct No good known options Can be digester options
LPS High quality lignin Good for co-combustion Other chemical products
Near-Natural Lignin & Acetic acid Good for co-combustion Possibilities for other use
Organosolv Clean lignin (high separation) Good lignin, good combustion Clean lignin can be used for chemicals
Pyrolysis Char coal Good co-combustion possibilities Optimize Char coal and extract
Transesterfication Glycerol Possibilities with drying Use in chemical industry

66
Appendix C
Carbon cycle and energy balance Table 16: Figures for calculation of carbon content in energy crop mix.
Unit Willow Hemp Reed Canary Grass Poplar
Water content at harvest % 50 10.0-15.0 10.0-15.0 50.0-55.0
Dry mass yield tDM/ha/year 6 5 4 10
Max yield 10 10 10 20
Net calorific value (dry) MJ/kg DM 18.62 17.48 18 18.1
Net calorific mean value MJ/kg DM 18.05
Hydrogen kg H/kg DM% 6.26% 6.00% 6.10% 7.70%
Carbon kg C/kg DM 49.80% 47.30% 48.60% 39.70%
Carbon content gC/MJ 26.75 27.06 27.00 21.93
Carbon content mean value gC/MJ 25.68
Table 17: Basis for diagram showing the result of carbon cycle and energy balance.
Area cultivated to cover carbon coming from crude oil
Yield 20 tdm/ha 7.0 Mha/year Percent of total farmland 3.9%
Percent of arable land 6.3%
Yield 10 tdm/ha 14.0 Mha/year Percent of total farmland 7.8%
Percent of arable land 12.6%
Yield 5 tdm/ha 27.9 Mha/year Percent of total farmland 15.5%
Percent of arable land 25.2%
Area cultivated to cover energy coming from crude oil
Yield 20 tdm/ha 7.8 Mha/year Percent of total farmland 4.3%
Percent of arable land 7.0%
Yield 10 tdm/ha 15.6 Mha/year Percent of total farmland 8.7%
Percent of arable land 14.1%
Yield 5 tdm/ha 31.2 Mha/year Percent of total farmland 17.3%
Percent of arable land 28.1%
Following three equations shows calculations performed to calculate the energy balance. Here the calculations are done with a yield of 10 tdm/ha/year.
Equation 13: Calculations on total energy coming from crude oil within chemical industry.
���� � �� ����� ��� ���� � �������� � ������ � � ���� �� �� ���� ���� ��� �� �� ����� ������� �� ����� ��� �� ������ !������ " 69.1 # ��� � 42 5$��� � 97 % " 2815 6$
Equation 14: Calculations on the amount of biomass DM that is needed to cover energy demand.
���� � �� ����� � ���� ���� � ���� ����� ��� � ���� �� �� � � � ���� ���!� ��� ���� '#/ 1000 (�� ��� �� �) " 2815 6$18.05 #$ -�./0 /1000 " 155 963 102 �./

67
Equation 15: Calculations on the cultivated area needed to produce the necessary biomass.
���� � �� 1������ ������!� �� � �� � ���� ���� � ���� ����� ���3���� � ���� ���! ��& ��� ���� 1000000 (�� ��� #��)7
155 963 102 �./10 �./ ������7 /1000000 " 14.0 #��/����
Calculations for biomass economy; for chapter 7.5.1.
Table 18: Basic figures for biomass economy calculations.
Basic facts
Crude oil Value Unit
Energy content oil 37 MJ/L
Density of crude oil 840 kg/m3
Crude oil price 112 $/barrel
78 €/barrel
Tonne of oil equivalent 42000 MJ/toe
Crude oil use in chemical industry 69.1 M toe
1 barrel 158.9873 L/barrel
Biomass Value Unit
Energy content energy crops (mean value DM) 18.05 MJ/kg
Price biomass 200 €/MWh
1 MJ 0.000278 MWh/MJ
Fraction sugar 0.67
Fraction lignin 0.33
Need for biomass (dry) 139591449288 kg
Hard coal Value Unit
Hard coal price average 80.95 €/tce
1 tce = energy from one tonne of coal 29.3076 GJ/tce
Other variables Value Unit
1 Euro = 1.4313 US dollar 1.4313 $/€
1 US dollar = 0.698909701 Euro 0.6989 €/$
Energy consumption EU-27 75558 PJ
Emission Rights Spot price 13.33 €/t CO2
CO2-emission 94.6 g CO2/MJ

68
Equation 16: Calculations on total cost for crude oil.
E����� ��� !���� F����� !�� 1�����0� ���� �� �� � ��� G � ����� ��� ��� � �������� � ������� ����� �� ���� € $0 "
JKKKKKL112 $1����� 158.99 F1�����7
37#$FMNNNNNO� 69.1# ��� � 42 000 #$��� � 0.6989€ $0 " 38 619 ������ €
Equation 17: Calculations on total cost for biomass.
P��� ��� 1������ � � ���� �� �� � � � ���� ���!� � 6���� �� 1������ " 139591449288 -� � 18.05#$-� � 200€#Q� � 0.000278#Q�/#$10� " 139 979 ������ €
Scenario 1 Equation 18: Calculations on future crude oil price.
2���� ���� ��� 1������ � � ���� �� �� � � �������� ��� ��� � �������� � ������ " 139 979 ������ € � 37#$F � 158.99F/1�����
42 000 #$��� � 69.1#��� " 284 €/1�����
Equation 19: Increase in percentage.
284 €/1����� 78 €/1����� " 362% Scenario 2 Equation 20: Calculations on revenue from sold lignin.
P��� ��� 1������ � � ���� �� �� � � ���� ���!� � R������ �� ��� � � ���� ���� � ����� !����2� � �� ���� ��� ��� � " 139591449288 -� � 18.05#$-� � 33%10B � 80.95 €/���29.31 5$/���10� " 2 320 ������ €
Equation 21: Calculations on future crude oil price if lignin is sold.
(2���� ���� ��� 1������ S T� � �� ���� ���� ��� � ) � � ���� �� �� � �������� ��� ��� � �������� � ������

69
(139 979 S 2320 ������ €) � 37#$F � 158.99F/1�����42 000 #$��� � 69.1#��� " 279 €/1�����
Scenario 3 Equation 22: Calculations on avoided gCO2.
� ���� ���� � ���� ����� ��� � R������ �� ��������� � 1������ � ���������� � " 2815.13 6$ � 67% � 94.6����#$ � 10B " 178428823 ����
Equation 23: Calculations on avoided emissions rights.
� ����� ������� � � ������� ������ �!�� !���� " 178428823 ���� � 13.33 €/����10� " 2 378 ������ €
Equation 24: Calculations on future crude oil price if lignin is sold and emission permits are avoided.
2���� ���� ��� 1������ � � ���� �� �� � �������� ��� ��� � �������� � ������ " (139 979 S 2320 S 2378 ������ €) � 37#$F � 158.99F/1�����
42 000 #$��� � 69.1#��� " 274 €/1�����