analysis of attacking possessions leading to a …...4 analysis of attacking possessions leading to...
TRANSCRIPT
Journal of Sports Science, 2013, 1 (1), 001-038
*Author to whom all correspondence should be addressed
Analysis of Attacking Possessions Leading to a Goal Attempt, and Goal Scoring Patterns within Men’s Elite Soccer
B. T. Plummer*
Loughborough College, Radmoor Road, Loughborough UK, LE11 3BT
Accepted 20 March 2013
Abstract Limited research within sports analysis has been conducted regarding the lower professional divisions within men’s elite soccer in England. Therefore, the aims of the study were to investigate patterns within attacking possessions leading to an attempt on goal or goal scored. Ten matches from the Npower League One fixtures (7 from 2011-12 season and 3 from 2012-13 season) were recorded, producing 297 attacking possessions finishing in shot or goal (32 goals). The data was split into 10 variables, with 5 of the variables analysed using a Friedman’s test (ᵪ2), with a Wilcoxon test (Z) to discover significant differences. The remaining 5 variables were analysed using just the Wilcoxon test (Z). Results indicated that significantly more shots and goals coming from ≤ 4 passes (Z = -3.924, p= <0.001) and (Z = -3.094, p = 0.002) respectively, more attacks originated in the middle or final thirds of the pitch (x2 = 26.909, p = < 0.001), and that more goals were scored within the penalty area (Z = -2.346, p = 0.019). Practical implications from this study have been suggested for the teams within the Npower League One division, however further in depth research considering full seasonal averages may be beneficial to understand how to succeed in this league in the future. Teams should aim to utilise quick attacking play through either set pieces or counter attacks and shoot within the penalty area with short passing combinations, however playing styles and philosophies of the teams should be considered.
Keywords: Men’s soccer, league one, attacking possessions, shooting patterns, performance analysis.
Introduction Over the last few decades there
has been an increase in the
quantity of research conducted
regarding analysis in soccer
(Wright et al., 2011; Abt and
Lovell, 2009; Carling, Williams and
Reilly, 2005), particularly goal
scoring opportunities (Mahony,
Wheeler and Lyons, 2012;
Tenga, Ronglan and Bahr, 2010c;
Grehaigne, Richard and Griffin,
2005; Hughes and Franks, 2005;
Kirkendall, Dowd and DiCicco,
2 Analysis of Attacking Possessions Leading to a Goal Attempt, and Goal Scoring
Patterns within Men’s Elite Soccer
2002). The most effective measure
of attacking success in soccer is
the goals scored and scoring
opportunities created (Mahony,
Wheeler and Lyons, 2012; Carling,
Williams and Reilly, 2005; Jones,
James and Mellalieu, 2004).
Generally, the more successful
teams will create more
opportunities and score more goals
per match (Hughes et al., 2012b;
Mahony, Wheeler and Lyons, 2012;
Grehaigne, Richard and Griffin,
2005; Reep and Benjamin, 1968).
This is essential as the overall
objective in soccer is to outscore
the opposition (Wright et al., 2011;
Tenga, Ronglan and Bahr, 2010c;
Lago, 2009; Jones, James and
Mellalieu, 2004).
Within this literature, performance
indicators have been of particular
interest (Wright et al., 2011;
Reilly, 2007; Carling, Williams
and Reilly, 2005). Performance
indicators are game variables that
define some or all the actions that
occur during a soccer match, these
can be separate actions or a
combination of moves (Castellano,
Casamichana and Lago, 2012;
O’Donoghue et al., 2012; Janković
et al., 2010; Hughes and Bartlett,
2002a). These can help to
establish the ideal method of
playing soccer and therefore can
be used to predict performance in
future games (O’Donoghue, 2005).
Furthermore these performance
indicators can prove to be valuable
information for coaches, as it
enables the team to understand
their strengths and utilise those
identified strengths within a game
setting, as well as being able to
build training sessions to enhance
performance in the weaker aspects
of their play (Hughes et al., 2012a;
Lago, 2009; Carling, Williams and
Reilly, 2005; Franks, 2004; Jones,
James and Mellalieu, 2004).
A significant performance indicator
in soccer is goals scored, as
generally success is regarded as
being able to score more than the
opposition (Hughes et al., 2012b;
Mahony, Wheeler and Lyons, 2012;
Lago, 2009; Grehaigne, Richard
and Griffin, 2005; Kirkendall, Dowd
and DiCicco, 2002). However, just
analysing goal scoring doesn’t
provide succinct analysis of
performance within elite level
soccer (Ruiz-Ruiz et al., 2011), as
B. T. Plummer 3
goal scoring yields very little data.
Tenga, Ronglan and Bahr (2010c)
found that goal scoring attributed
to 1% of the total possession
within elite Norwegian soccer
matches, therefore other aspects
that demonstrate attacking
effectiveness should be
considered. Previous studies have
highlighted shots on goal, balance
between attacking and defending
teams and type of attack as other
key areas to analyse (Ruiz-Ruiz et
al., 2011; Tenga et al., 2010b;
Tenga, Ronglan and Bahr, 2010c;
Olsen and Larsen, 1997).
Most of the early studies within
soccer were conducted manually
(Abt and Lovell, 2009; Mayhew and
Wenger, 1985; Reilly and Thomas,
1976) and considered laborious in
nature. These studies highlighted
simple movements within a game
in addition to the location of the
pitch and how long each movement
occurred (Mayhew and Wenger,
1985; Reilly and Thomas, 1976).
By recording these variables the
work rate and distance travelled
could be obtained, however this
method contains major
inaccuracies due to a lack of
differentiation between game
movement categories (James,
2006). These studies also only
focused on a single player’s
actions, rather than viewing how
the team interacted during the
course of a match (Moussa, Douik,
and Messaoud, 2011; Figueroa,
Leite and Barros, 2005), even with
these significant limitations in the
methodology, these studies were
still considered to be the building
blocks of analysis as it is today.
As technology has developed over
the past few decades, more
effective ways of recording and
analysis can now take place
(Abt and Lovell, 2009;
O’Donoghue, 2006). Some of the
more significant advances include
video recording, computerisation
and live to air TV footage; these
are now readily used within
analysis research and have proved
to be mainly successful (Wright et
al., 2011; Worsfold and
Macbeth, 2009; Leibermann and
Franks, 2004; Scoulding, James
and Taylor, 2004). Video
technology originated in the 1950s,
however, this technology has only
regularly been used by analysts
4 Analysis of Attacking Possessions Leading to a Goal Attempt, and Goal Scoring
Patterns within Men’s Elite Soccer
and coaches in soccer for feedback
purposes, within the past 15 years
(Wright et al., 2011; Hodges and
Franks, 2004; Liebermann et al.,
2002). By using video cameras in
conjunction with computers, games
can be recorded, stored and
processed with relative ease
(O’Donoghue, 2006). However
issues still remain with this method
as the quality of the video footage
can be poor, when rerecording to a
DVD or VHS, and instant replays
and crowd shots can affect the
viewing of the full sequence of
events (Tenga, 2009). Also,
computer-based notational analysis
methods are increasingly common
within elite level sport (Hughes et
al., 2010). Using this method of
analysis, it is easy to adapt to a
coaches specific needs and edit
and attribute video footage to the
system (Hughes, Hughes and
Behan, 2007a). Collectively, these
methods help to enhance feedback
to coaches and players alike
(Leibermann and Franks, 2004;
Hughes, 1996).
The technological progressions
within elite level sport, have lead to
the development of systems that
use multiple cameras to track every
player or official’s movement
through a full game (Randers et al.,
2010; Redwood-Brown, 2008;
Moura et al., 2007; Di Salvo et al.,
2006). However this method
requires significant financial
investment and the installation of a
number of roof cameras within a
stadium, and therefore, it isn’t
accessible to all teams within elite
soccer (Di Salvo et al., 2006).
While single camera tracking relies
heavily on the skills and
experiences of the cameraman
involved. Without a high degree of
competence, the footage collected
becomes unusable (Ariki and
Takiguchi, 2008). However, even
with these significant technological
advances little or no operational
benchmarks can be found in
research (Williams, 2012). Thus
making it difficult to compare
studies effectively and, as a result,
questions the repeatability of the
study itself (O’Donoghue, 2007).
Williams, (2009); James, Mellalieu
and Jones (2005); Bloomfield,
Polman and O’Donoghue (2004)
and Hughes (2004a) all state
that operational definitions must be
B. T. Plummer 5
produced in order to obtain valid
and reliable data. Williams (2012)
conducted research to assess
how many journals from
the International Journal of
Performance Analysis in Sport
included definitions in their papers,
61.1% had clear definitions, 16.8%
partially defined and 22.1% had no
definitions out of the 278 journals
assessed. He also concluded that a
lack of overall definitions within
specific sports created ambiguity
and produced little consistency.
This point is highlighted by
Worsfold and Macbeth (2009);
they studied 6 performance
indicators, over 15 games, from 4
different broadcasting companies.
In this research errors of > 10%
and up to 59.51% were found in
five out of the six variables
analysed. These vastly different
results occured due to the lack of
standardised definitions and
individual interpretation within
soccer analysis (Worsfold and
Macbeth, 2009). Without these
standardised definitions, comparing
findings is difficult (Williams, 2012;
James, Mellalieu and Jones, 2005;
Hughes, 2004a).
O’Donoghue (2007), in contrast,
suggests that by having operational
definitions the research is not
immediately acceptable, instead he
implies that an analysts
understanding of the behaviours
and knowledge of the sport is a
much more important aspect
instead. However this requires all
analysts associated within the
study to have the same knowledge
of the sport, and even with the
same level of knowledge,
interpretation of events may still
vary which suggests that
operational definitions should be
adopted (Williams, 2012).
Operational definitions alone do not
ensure reliability of the methods
used. It is vital that reliability tests
of the analysis systems available
should be conducted and clearly
stated within studies (Hughes,
Cooper and Nevill, 2002b), as this
will help to ensure repeatability of
any tests undertaken (Bruton,
Conway and Holgate, 2000).
However Hughes, Cooper and
Nevill (2002b) found that within 72
published journals, 70% of articles
failed to report reliability measures
or used ineffective methods to
6 Analysis of Attacking Possessions Leading to a Goal Attempt, and Goal Scoring
Patterns within Men’s Elite Soccer
report it. One such ineffective
method is intra-observer reliability,
as this test only highlights the
operator’s ability to use the system,
regardless of whether it is correct
or not (O’Donoghue, 2007). Boyce,
Carter and Neboschick (2000)
found that when using intra-
observer reliability a high level of
agreement was established
between trials however when
analysing reliability using the more
appropriate test, inter-observer
reliability, the reliability was very
low, which highlights the issue
of the intra-observer test. Inter-
observer reliability is considered to
be a more acceptable method as
this aims to establish the extent to
which 2 or more observers can
produce the same or very similar
results on the same subject
(O’Donoghue, 2007; James,
Mellalieu and Hollely, 2002) and is
therefore more accurate at finding
inaccuracies in the data.
Reep and Benjamin (1968), who
many consider pioneers in soccer
notational analysis, studied 3213
soccer games from within the
English 1st division, league and FA
cups, as well as World Cup
competitions and found that 80% of
goals came from ≤3 passes. They
also suggested that the direct style
of soccer is the most effective
method of scoring. More recently
Hughes and Franks (2005) and
Kirkendall, Dowd and DiCicco
(2002) suggest that direct play is
still the most effective method and
both studies found very similar
results where 80%, 77% and 80%
of attempts on goal came from ≤4
passes from the 1990, 1994 and
1998 World cups respectively.
According to research Wright et al.,
(2011) the same trend occurred in
the English Premier League where
85% of all goals came from ≤4
passes.
Many studies have looked at when
goals occur during match play.
They commonly split the full
matches up into 15-minute
segments and look at whether
goals were scored during the 1st
and 2nd halves (Armatas and
Yiannakos, 2010; Armatas et al.,
2007b; Kirkendall, Dowd and
DiCicco, 2002; Jinshan et al., 1993;
Jinshan, 1986). Armatas and
Yiannakos (2010) and Yiannakos
and Armatas (2006) suggest that
B. T. Plummer 7
more goals are scored in the 2nd
half (52.5% to 57.4%) compared to
the first half. The most prolific
segment within the halves occurred
between the 60-75 minute
(Jinshan, 1986) and 75-90 minute
(Jinshan et al., 1993), the latter of
the results corresponding to
Armatas and Yiannakos (2010),
Armatas et al., (2007a), and Abt,
Dickson and Mummery (2002) who
all found that the most goals
occurred during the 75-90 minute.
This is thought to be due to player
fatigue. Fatigue has a direct link to
poor decision making as well has
being linked to a decrease in
sprinting speed, therefore affecting
the ability of players to track back
and deal with all situations
effectively (Catteeuw et al., 2010;
Krustrup, Mohr and Bangsbo,
2002; Reilly, 1996). Therefore it
would appear that the frequency of
goals scored is time dependant
(Abt, Dickson and Mummery,
2002).
A large amount of research in
analysis gathers samples from
tournament style competitions
(Aramatas and Yiannakos, 2010;
Kirkendall, Dowd and DiCicco,
2002; Grant, Williams and Reilly,
1999), as it draws together the
world’s elite in a competitive
context and has the benefit of a
large sample size in a short time
period (Hughes and Franks, 2005).
However in many of these studies
they fail to recognise the direct
influence other games within the
group stages of the competition
can have on performance
(O’Donoghue et al., 2012;
McGarry, 2009; Jones, James and
Mellalieu, 2004). O’Donoghue et
al., (2012) stated that by playing
games at the same time during cup
competitions, performances of
teams vary depending on the
scores of related games. As a
result, by using random games
over the course of a full season the
influence of important individual
games should be nullified. Similarly
to this very few studies make
reference to the direct influence the
opposition have on the actions
within games (Tenga et al., 2009;
Konstadinidou and Tsigilis, 2005;
Hughes and Churchill, 2004b).
McGarry (2009), Tenga et al.,
(2009) and Taylor et al., (2008) all
state that the opposition help
create unexpected situations within
8 Analysis of Attacking Possessions Leading to a Goal Attempt, and Goal Scoring
Patterns within Men’s Elite Soccer
games and therefore should be
regarded when conducting
analysis. Tenga et al., (2010a;
2010b and 2009) suggest that it is
important to state how the defense
is set up, either balanced or
imbalanced, as this can help to
assess the effectiveness of the
attacking play. They state that
without this, technical or tactical
analysis remains incomplete as the
interactions alter the outcome of
events (Tenga et al., 2010a;
O’Donoghue, 2009). However the
accuracy of such methods remains
an issue and is difficult to quantify,
as it is quite subjective (McGarry,
2009). Therefore, more research is
required in this area before it can
be widely adopted within analysis
research methods (O’Donoghue,
2009).
Lucchesi (2001) states that attack
types are defined as a tactical
situation when one team makes a
clear attempt to move towards the
attacking goal, in order to produce
a shot on goal. Attacking types
within soccer have often been
studied (Armatas and Yiannakos,
2010; Tenga et al., 2010a; Tenga
et al., 2009; Lucceshi, 2001),
however there seems to be mixed
reports regarding which attack type
is more effective. Tenga et al.,
(2010a) and Tenga et al., (2010b)
suggest that counter attacks
produce more goals than any other
forms of attacking play, however
Armatas and Yiannakos (2010)
found the opposite. They state that
47.1% of goal attempts came from
elaborate attacks, 32.6% from set
pieces and 20.3% from counter
attacking play during the 2006
World Cup. Whereas, in other
studies there seems to be more of
an emphasis on set pieces. Taylor,
James and Mellalieu (2005), Grant,
Williams and Reilly (1998) and
Jinshan et al., (1993) all found
between 27 to 32% of goal
attempts resulted from set pieces.
However, there still remains a large
difference between goals scored
from set pieces and goals scored
from open play. Williams and Reilly
(1999) found that 24.6% of goals
originated from set pieces and
63.2% of goals were created from
open play. But Kirkendall, Dowd
and DiCicco (2002) indicated
between 50-65% of goals were
scored from set pieces.
B. T. Plummer 9
Tenga et al., (2010a) however only
highlighted counter attacks and
elaborate attacks, and their
influence on the defensive set up of
goal scoring opportunity. They
completely disregarded set pieces
altogether. However Bangsbo and
Peitersen (2000) suggest that set
pieces account for a large
percentage of chances per game
and stress that they shouldn’t be
dismissed. Wright et al., (2011)
also found that 39% of goal
attempts came from ‘other’ attack
types (Wright et al., 2011, pp. 447),
this included rebounds, deflections,
and flicks-on from balls that were
contested for. This highlights that
even within elite level soccer
chance still plays a key role on the
outcome of the game (McGarry,
2009).
A recent study conducted by
O’Donoghue et al., (2012),
highlighted issues regarding the
use of chi-squared a statistical
method of analysis in performance
sport research. O’Donoghue et al.,
(2012) state that this method
assumes that performance actions
within a game are treated as
separate incidents rather than
general performance data, which
therefore creates the illusion that a
larger sample size has been
collected, and as a result appears
to show more significant findings.
Furthermore, the chi-squared
method assumes that all data is
individual (O’Donoghue et al.,
2012). However, this contradicts
research by McGarry (2009),
Tenga et al. (2009), and Taylor et
al. (2008), who all state that it is the
interactions between teams that
actually determine what happens
during a game. This in turn implies
that games cannot be completely
independent and highlights a
limitation in the analysis method
chosen. This is highlighted in the
study by Yamanka et al., (1997),
which found that within 4 games a
statistically significant difference
occurred. Due to the small sample
size researched meaningful
conclusions cannot be assumed as
the results are inflated due to the
method of analysis, in this case the
chi-squared test (O’ Donoghue et
al., 2012). Similar results were also
found in Costa et al., (2011) and
Laios and Moustakidis (2011). The
Friedman’s test, however, doesn’t
assume independence, as it is
10 Analysis of Attacking Possessions Leading to a Goal Attempt, and Goal Scoring
Patterns within Men’s Elite Soccer
a within measure design test and
is considered to be a more
appropriate measure (O’Donoghue,
2012).
There is a plethora of research
regarding passing sequences, goal
attempts and goals scored in the
highest levels of football
competition; however this can be
found predominately in World Cup
events or throughout the English
Premier League season (Wright et
al., 2011 Armatas and Yiannakos,
2010; Acar et al., 2009; Redwood-
Brown, 2008; Armatas, Yiannakos
and Sileloglou, 2007c; Jones,
James and Mellalieu, 2004).
But there has been relatively
little research conducted in the
Championship, League 1 or
League 2 divisions within English
men’s elite soccer. In addition,
as previously stated, most research
within analysis uses the
chi-squared method of statistical
analysis, which has fundamental
errors (O’Donoghue et al., 2012).
Therefore the aim of this study is to
investigate patterns within attacking
possessions leading to an attempt
on goal or goals scored. In
particular predicting four results
from the outset; a) that significantly
more attempts on goal come from ≤
4 passes, b) significantly more
attempts on goal and goals scored
originate within the middle or final
thirds, c) that more goals are
scored in the second half
compared to the first and d) that
most attacks come from counter
attacking play. However to cover a
broader range of attacking
variables the following will also be
considered; shot location, time of
shot within a game, type of shot,
location of goal scored, and time of
goal.
B. T. Plummer 11
Methods
Subjects
Footage from ten Npower League 1
games during the 2011-12 and part
of 2012-13 seasons were used for
the analysis. The league follows a
double, round robin league style
and involves 24 teams. Out of the
10 games, seven were supplied by
a Npower league 1 club; each of
these games were recorded using
a Sony NDR FX160E camera
(Sony, Tokyo, Japan) which was
located in the stands and had an
elevated view of the whole pitch on
a Sony VCT60AV tripod (Sony,
Tokyo, Japan). The remaining 3
games were recorded live on Sky+
TV and then recorded onto DVD
using a Cello - R100LB DVD
recorder (Cello Electronic Ltd,
Manchester United Kingdom) and
uploaded onto iMovie (Apple,
California, USA) to be analysed.
Any passages of play that included
interruptions by replays, off side/
foul play or poor camera tracking
were discarded from the study.
Study Design
Once all the games were filmed all
footage was uploaded onto iMovie
(Apple, California, USA). The
analysis took place 3 weeks after
the games had been filmed to
prevent subjective bias. Each game
was played back at normal speed
until a shot took place, once this
occurred the footage was rewound
back to the start of the possession
and played at half speed to enable
succinct analysis of each attack
(Rees et al., 2010; Hughes and
Reed, 2007b). All actions were
recorded using a hand notational
system that was developed on a
Microsoft Excel spread sheet. This
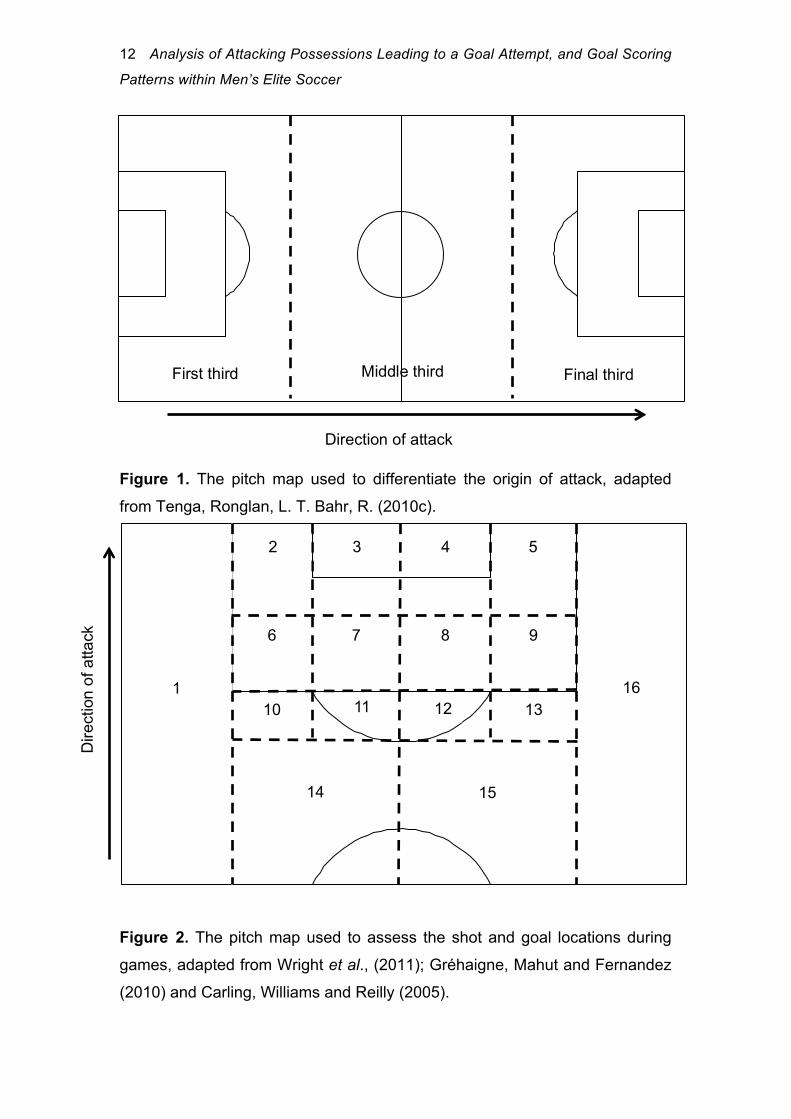
highlighted passing sequences,
origin of attack (see Figure 1.), type
of attack, shot location (see Figure
2.), time of shot, type of shot,
location of goal scored and time of
goal. Each of these areas were
divided into sub-categories and
given definitions to abide by, see
Appendix 1. All shots and goals
from both teams were analysed.
12 Analysis of Attacking Possessions Leading to a Goal Attempt, and Goal Scoring
Patterns within Men’s Elite Soccer
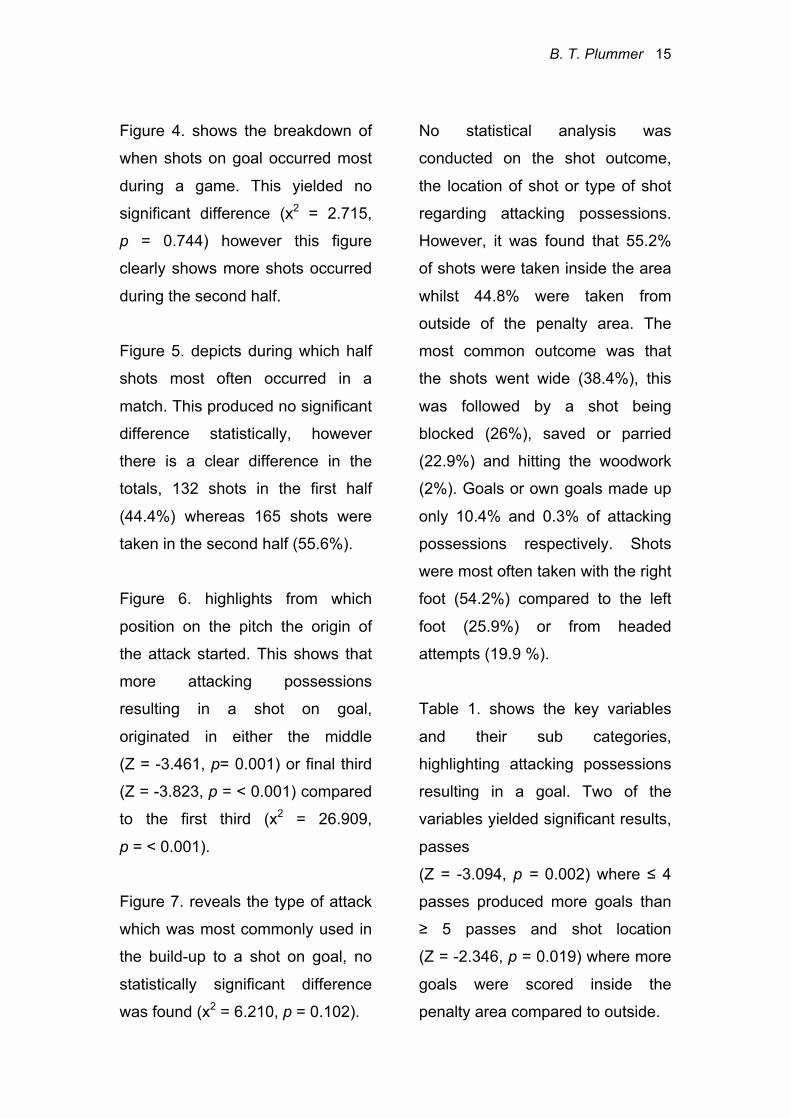
Figure 1. The pitch map used to differentiate the origin of attack, adapted
from Tenga, Ronglan, L. T. Bahr, R. (2010c).
Figure 2. The pitch map used to assess the shot and goal locations during
games, adapted from Wright et al., (2011); Gréhaigne, Mahut and Fernandez
(2010) and Carling, Williams and Reilly (2005).
Dire
ctio
n of
atta
ck
1
3 2 4 5
6 7 8
11 10
9
13 12
15 14
16
Direction of attack
First third Final third Middle third
B. T. Plummer 13
After all games were analysed, 4
weeks were left and 45-minute
segments from 4 randomly
selected games were recoded by a
separate analyst to improve the
inter-reliability (Wright et al., 2011).
Any differences in the data were
discussed and altered accordingly.
The kappa test was conducted on
5 of the 10 variables within
the study and produced ratings
between 0.83-0.98. Scores >0.80
were deemed to be the acceptable
limit for this study.
Data Analysis
All data was checked for normality
using the Kolmogorov-Smirnov
test. Once this was established the
Friedman’s test was deemed to be
the most applicable in this study
and was used to analyse variables
that have 3 or more sub categories.
If a significant result was found a
Wilcoxon test was used as a post-
hoc test to discover where the
differences were found. For
variables that have less than 3 sub
categories either a Wilcoxon test or
paired t-test was chosen,
dependant on whether the data
was parametric or non-parametric.
All analysis was conducted on
SPSS v 20.0.0 (SPSS: An IBM
Company, Armonk, NY) software
with an alpha rating set at p<0.05.
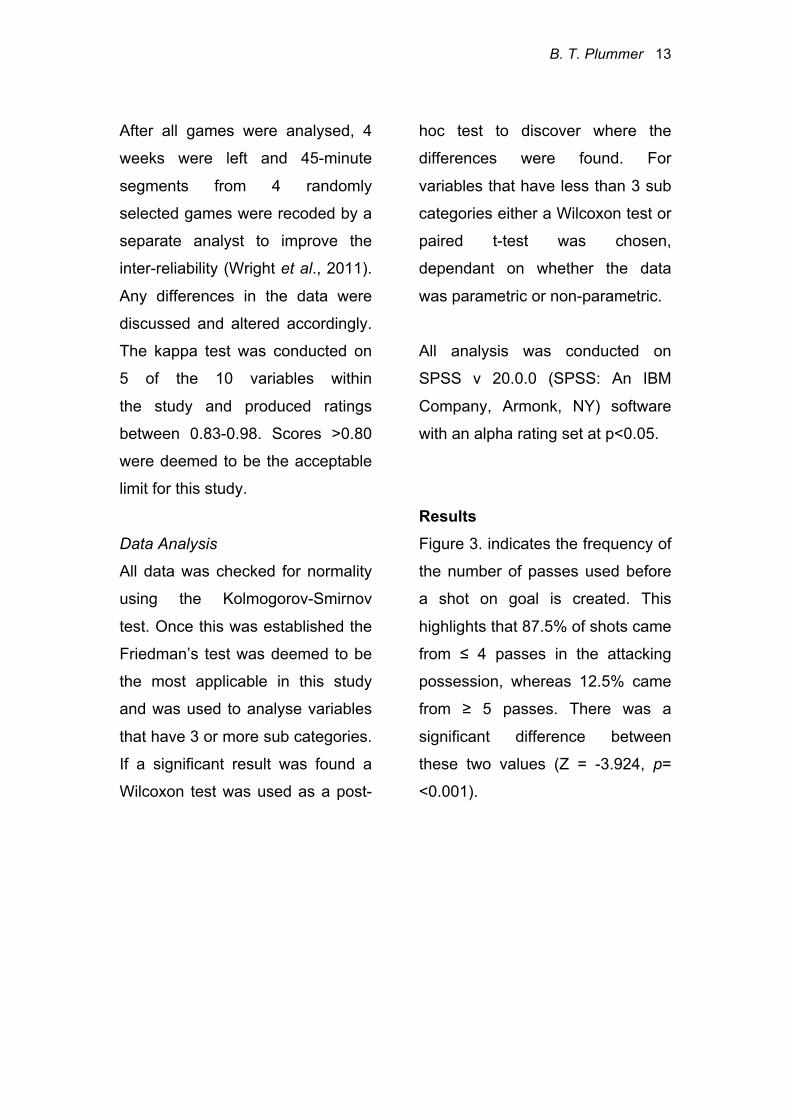
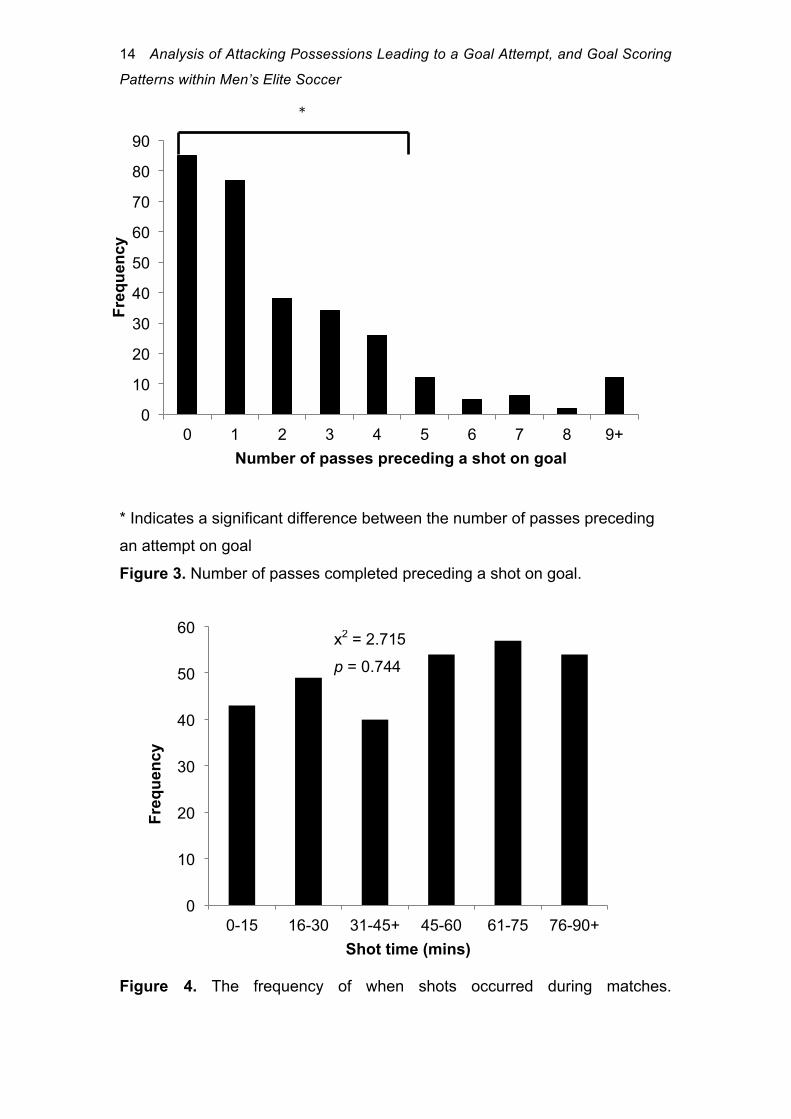
Results Figure 3. indicates the frequency of
the number of passes used before
a shot on goal is created. This
highlights that 87.5% of shots came
from ≤ 4 passes in the attacking
possession, whereas 12.5% came
from ≥ 5 passes. There was a
significant difference between
these two values (Z = -3.924, p=
<0.001).
14 Analysis of Attacking Possessions Leading to a Goal Attempt, and Goal Scoring
Patterns within Men’s Elite Soccer
* Indicates a significant difference between the number of passes preceding
an attempt on goal
Figure 3. Number of passes completed preceding a shot on goal.
Figure 4. The frequency of when shots occurred during matches.
0
10
20
30
40
50
60
0-15 16-30 31-45+ 45-60 61-75 76-90+
Freq
uenc
y
Shot time (mins)
x2 = 2.715
p = 0.744
0
10
20
30
40
50
60
70
80
90
0 1 2 3 4 5 6 7 8 9+
Freq
uenc
y
Number of passes preceding a shot on goal
*
B. T. Plummer 15
Figure 4. shows the breakdown of
when shots on goal occurred most
during a game. This yielded no
significant difference (x2 = 2.715,
p = 0.744) however this figure
clearly shows more shots occurred
during the second half.
Figure 5. depicts during which half
shots most often occurred in a
match. This produced no significant
difference statistically, however
there is a clear difference in the
totals, 132 shots in the first half
(44.4%) whereas 165 shots were
taken in the second half (55.6%).
Figure 6. highlights from which
position on the pitch the origin of
the attack started. This shows that
more attacking possessions
resulting in a shot on goal,
originated in either the middle
(Z = -3.461, p= 0.001) or final third
(Z = -3.823, p = < 0.001) compared
to the first third (x2 = 26.909,
p = < 0.001).
Figure 7. reveals the type of attack
which was most commonly used in
the build-up to a shot on goal, no
statistically significant difference
was found (x2 = 6.210, p = 0.102).
No statistical analysis was
conducted on the shot outcome,
the location of shot or type of shot
regarding attacking possessions.
However, it was found that 55.2%
of shots were taken inside the area
whilst 44.8% were taken from
outside of the penalty area. The
most common outcome was that
the shots went wide (38.4%), this
was followed by a shot being
blocked (26%), saved or parried
(22.9%) and hitting the woodwork
(2%). Goals or own goals made up
only 10.4% and 0.3% of attacking
possessions respectively. Shots
were most often taken with the right
foot (54.2%) compared to the left
foot (25.9%) or from headed
attempts (19.9 %).
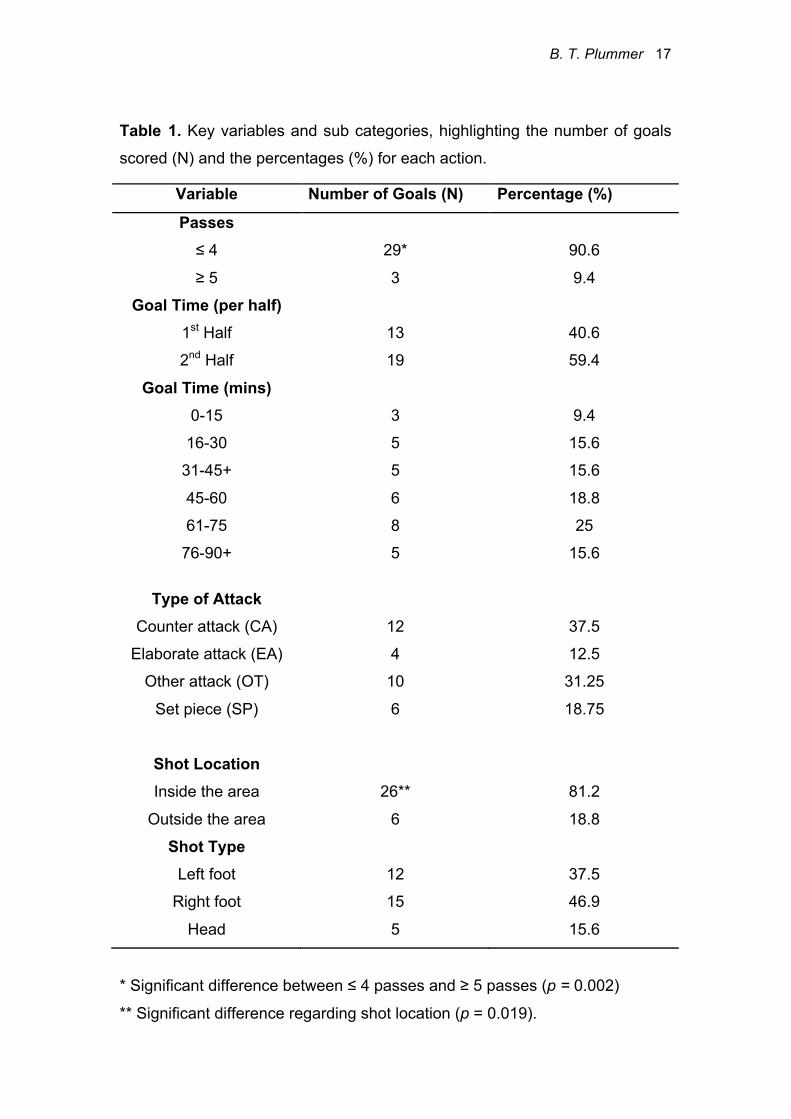
Table 1. shows the key variables
and their sub categories,
highlighting attacking possessions
resulting in a goal. Two of the
variables yielded significant results,
passes
(Z = -3.094, p = 0.002) where ≤ 4
passes produced more goals than
≥ 5 passes and shot location
(Z = -2.346, p = 0.019) where more
goals were scored inside the
penalty area compared to outside.
16 Analysis of Attacking Possessions Leading to a Goal Attempt, and Goal Scoring
Patterns within Men’s Elite Soccer
** Indicates the first third was significantly different to the other attacking
origins.
Figure 5. The frequency of shots per half (45mins).
Figure 6. The origin of attack for attacking possessions resulting in a shot on
goal.
Figure 7. The frequency and type of attack during possessions that lead to a
shot on goal.
0
50
100
150
200
1st half 2nd half
Freq
uenc
y
Shot Time
Z= -1.424
p = 0.154
x2 = 26.909
p = < 0.001
0
50
100
150
200
First third Middle third Final third
Freq
uenc
y
Origin of attack
**
x2 = 6.210
p = 0.102
0
20
40
60
80
100
CA EA OT SP
Freq
uenc
y
Attack Type
B. T. Plummer 17
Table 1. Key variables and sub categories, highlighting the number of goals
scored (N) and the percentages (%) for each action.
Variable Number of Goals (N) Percentage (%)
Passes ≤ 4
≥ 5
29*
3
90.6
9.4
Goal Time (per half) 1st Half
2nd Half
13
19
40.6
59.4
Goal Time (mins) 0-15
16-30
31-45+
45-60
61-75
76-90+
3
5
5
6
8
5
9.4
15.6
15.6
18.8
25
15.6
Type of Attack Counter attack (CA)
Elaborate attack (EA)
Other attack (OT)
Set piece (SP)
12
4
10
6
37.5
12.5
31.25
18.75
Shot Location Inside the area
Outside the area
26**
6
81.2
18.8
Shot Type Left foot
Right foot
Head
12
15
5
37.5
46.9
15.6
* Significant difference between ≤ 4 passes and ≥ 5 passes (p = 0.002)
** Significant difference regarding shot location (p = 0.019).
18 Analysis of Attacking Possessions Leading to a Goal Attempt, and Goal Scoring
Patterns within Men’s Elite Soccer
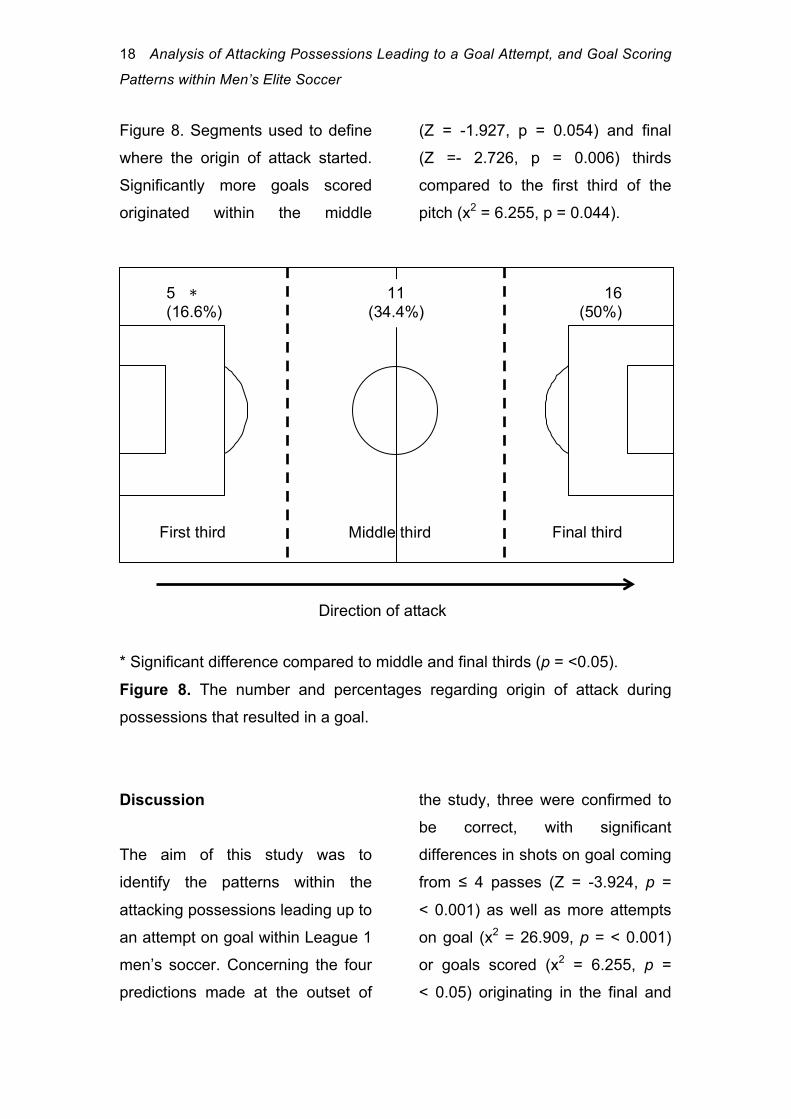
Figure 8. Segments used to define
where the origin of attack started.
Significantly more goals scored
originated within the middle
(Z = -1.927, p = 0.054) and final
(Z =- 2.726, p = 0.006) thirds
compared to the first third of the
pitch (x2 = 6.255, p = 0.044).
* Significant difference compared to middle and final thirds (p = <0.05).
Figure 8. The number and percentages regarding origin of attack during
possessions that resulted in a goal.
Discussion
The aim of this study was to
identify the patterns within the
attacking possessions leading up to
an attempt on goal within League 1
men’s soccer. Concerning the four
predictions made at the outset of
the study, three were confirmed to
be correct, with significant
differences in shots on goal coming
from ≤ 4 passes (Z = -3.924, p =
< 0.001) as well as more attempts
on goal (x2 = 26.909, p = < 0.001)
or goals scored (x2 = 6.255, p =
< 0.05) originating in the final and
Direction of attack
First third Final third Middle third
5 (16.6%)
16 (50%)
11 (34.4%)
*
B. T. Plummer 19
middle thirds of the field compared
to the first third. Although more
goals were scored in the second
half of play (59.4%) no significant
difference was found. The final
hypothesis turned out differently, as
set pieces created the most
attempts on goal rather than
counter attacking play as
previously suggested.
Passing is a key component within
soccer and the efficiency of an
attack is often due to players
successfully passing the ball to
each other in order to create space
and goal scoring opportunities
(Janković et al., 2010). Previous
studies regarding passing
sequences suggest that a greater
proportion of attempts on goal
occur from ≤ 4 passes (Acar et al.,
2009; Hughes and Franks, 2005;
Kirkendall, Dowd and DiCicco,
2002). These papers found that
between 77 to 80% of attempts
came from ≤ 4 passes, this is
slightly different to this current
study as 87.5% of attempts on goal
came from passing sequences of ≤
4 passes. Similar findings were
recorded regarding goals scored
from ≤ 4 passes. Research found
that within the old English 1st
Division, FA Cup, League Cup,
World Cups (1990 and 1994) and
the current English Premier League
generally 80-85% of goals (Wright
et al., 2011; Hughes and Franks,
2005; Reep and Benjamin, 1968).
Whereas in this current study the
figure was slightly higher, with
90.6% of goals coming from ≤ 4
passes. The difference seen
between goals scored and attempts
on goal, from ≤ 4 passes, within
this study compared to other
literature could be partially due to
the standard of competition, tactics
or playing style (Wright et al., 2011;
Kannekens, Elferink-Gemser and
Visscher, 2009). By having
adopting a direct style of play, more
shots would result from shorter
passing sequences (Hughes and
Franks, 2005). Teams that take
part within competition at
International or top National level,
generally have longer passages of
play as they adopt a more
possession based style of play
(Hughes and Franks, 2005) and
this would explain the slight
difference within the values.

20 Analysis of Attacking Possessions Leading to a Goal Attempt, and Goal Scoring
Patterns within Men’s Elite Soccer
Tenga et al., (2010b), Hughes and
Snook (2006) and Hughes and
Franks (2005) suggest that the
longer styles of passing (> 5
passes) were more effective in
terms of scoring goals compared to
smaller passages of play, ≤ 2
passes. However this is dependent
on the team’s ability and is limited
in its capacity to work for every
team (Tenga and Sigmundstad,
2011; Hughes and Franks, 2005).
Therefore further research is still
needed within this area, as there
seems to still be conflicting
research regarding passing
sequences within the modern era.
A larger sample size would be
beneficial, as soccer has changed
dramatically over the past 45 years
since the initial and largest study
conducted by Reep and Benjamin
(1968) (Kuhn, 2005).
Wright et al., (2011) and Millar
(1994) state that teams should
apply pressure within the defensive
third of the opposition territory, to
force turnovers of possession, as
this creates more goal scoring
opportunities and indicates the
importance of utilising possession
in the final third when attacking.
Research by Tenga et al., (2010a)
supports this, as more attacks
originated within the final third
(Tenga et al., 2010a). Similar
findings were recorded in Acar et
al., (2009) and Kirkendall, Dowd
and DiCicco (2002) where 88% and
83% of goals scored originated
within the final third of the pitch
respectively. This current study
correlates to literature as 87% (p <
0.001), and goals scored, 84.4% (p
< 0.05) originated in the middle or
final thirds compared to the first
third and also matches the
hypothesis. Although research
states that yielding a high number
of attacks from the more advanced
positions is dependant on a
number of factors (Wright et al.,
2011; Lago, 2009; Pollard, 2006).
Fitness levels of players is required
to be high, as attackers pressing
high up the pitch expend a greater
amount of energy (Wright et al.,
2011). In addition location of the
game and tactics also reflect how
many attacks start in advanced
positions, as teams that play away
from home generally defend in a
deep position and counter attack
when possession is regained
(Lago, 2009; Pollard, 2006). This
B. T. Plummer 21
current study supports literature in
that longer attacking possessions
are more difficult to score from, and
that counter attacking play along
with short passing sequences
create imbalances within the
opposition defence and yield more
attempts on goal (Tenga and
Sigmundstad, 2011; Bergier,
Soroka and Buraczewski, 2008).
Research suggests that goal
scoring seems to be a time
dependant element within soccer
(Abreu, 2011; Armatas, Yiannakos
and Sileloglou, 2007b; Abt,
Dickson, Mummery, 2002). This
could be due to defenders covering
as much as 20% less ground in the
last 15 minutes of the game
compared to the first 15 minutes of
the game, whereas attackers aren’t
affected to the same extent
(Bradley et al., 2009). In addition,
during the progression of the game,
fatigue builds up exponentially and
causes a decrease in performance
and ability to make effective
decisions (Catteeuw et al., 2010;
Krustrup, Mohr and Bangsbo,
2002), this therefore benefits the
attacking players as more space is
created for them to utlise and
create more goal scoring
opportunities (Ensum, Pollard and
Taylor, 2005). These reasons listed
above may therefore indicate why,
in general, more goals are scored
in the second half of a game
compared to the first (Armatas,
Yiannakos and Sileloglou, 2007c;
Yiannakos and Armatas, 2006;
Kirkendall, Dowd and DiCicco,
2002).
To illustrate this further, Armatas et
al., (2009), Yiannakos and Armatas
(2006) and Kirkendall, Dowd and
DiCicco (2002) found that 58.9%,
57.4% and 77% of goals occurred
in the second half of a game within
the European 2004 championships
and 1998 World Cup respectively.
Armatas, Yiannakos and Sileloglou
(2007c), also found similar results,
however, it appears that the
number of goals scored in the
second half decreases with each
tournament, as 60.8%, 59% and
52.5% of goals came in the second
halves within the 1998, 2002 and
2006 World Cup competitions. The
current study correlates to the
research already stated, as 59% of
all goals were scored in the second
half of play. No significant statistical
22 Analysis of Attacking Possessions Leading to a Goal Attempt, and Goal Scoring
Patterns within Men’s Elite Soccer
difference was obtained when
comparing goals scored in the 1st
and 2nd halves of play. Similar
findings were recorded regarding
attempts on goal, see Figure 5., as
55% of shots came from the
second period of play. Again, this
result wasn’t statistically significant.
Most research indicates that the
final 15 minutes of the game is the
most prolific time for creating an
attempt on goal or scoring
(Armatas and Yiannakos, 2010;
Armatas et al., 2009; Armatas et
al., 2007b; Jinshan et al., 1993).
However this current study
contradicts research as the most
attempts and goals came between
minutes 61-75. This matches
findings from Abt, Dickson and
Mummery (2002) and Jinshan
(1986). Both suggest that the final
30 minutes of the game produce
the highest frequency of attempts
and goals. The reasoning for this
is, as previously stated, thought to
be due to fatigue and poor decision
making as a result of the fatigue
(Catteeuw et al., 2010; Krustrup,
Mohr and Bangsbo, 2002).
Studies have regularly analysed
the method by which goals were
scored (Wright et al., 2011;
Armatas and Yiannakos, 2010;
Tenga,et al., 2010a; Tenga, 2009;
Lucceshi, 2001). However within
these studies only a few variables
were highlighted. Tenga and
Sigmundstad (2011), Tenga et
al.,(2010a) only analysed elaborate
attack vs counter attack. Armatas
and Yiannakos (2010) highlighted
these areas and included set
pieces as another variable and
Wright et al., (2011) also looked at
the areas stated previously and
included a category for any events
that didn’t fall into the previous
variables. Therefore cross
comparisons of studies regarding
attacking types is often difficult to
gauge, due the types of study
design, variables and definitions
used (Tenga and Sigmundstad,
2011).
The variables used within this study
were based around Wright et al.,
(2011), as they were viewed to be
more detailed and relevant, as not
all attempts on goal can be
categorised into the three variables
often used (Wright et al., 2011).
B. T. Plummer 23
Most attacks resulted from a set
piece (31%), which matched
research by Armatas and
Yiannakos (2010), Taylor, James
and Mellalieu (2005), Williams and
Reilly (1999), Grant, Williams and
Reilly (1998) and Jinshan et al.,
(1993), who all found between 27
to 32.6% of attacks came from this
variable. This however yielded no
significant difference (p = > 0.05)
and didn’t relate to the hypothesis,
counter attacking play wasn’t the
most common method of attack.
Significantly more goals were
created within the penalty area (p =
0.019), as 81.2% came from this
position. Wright et al., (2011), Acar
et al., (2009) and Yiannakos and
Armatas (2006) found that 77%,
79% and 79.6% of goals were
scored inside the penalty area in
the English Premier League, World
Cup and European Championships
respectively. The increased amount
of shots in the penalty area were
found to be more effective. Not
surprising perhaps, as skilled
players can place shots nearer the
posts and out of the goalkeepers’
reach, therefore becoming more
efficient than shots outside the area
(Michailidis et al., 2004). However
a much lower figure was recorded
for attempts on goal, 55.2%, and
yielded no significant difference.
This current study has some
practical implications on
performance within the Npower
League 1 competition, however
individual team tactics and playing
styles may vary, and should be
considered when applying the
results from this study. In addition,
the small sample size should also
be considered. The primary factor
for coaches to implement should be
increasing the players’ fitness in
order to limit the decline in
performance towards the end of the
game. This should be coupled with
utilising short attacking play
combinations of ≤ 4 passes, in the
form of either set pieces or counter
attacking play to create an
imbalance within the oppositions’
defence so that players can use the
space created by these forms of
attack. Finally teams should aim to
deliver the ball into the penalty area
to create more goal scoring
opportunities, and increase the
likelihood of scoring. Further
investigation within League 1 men’s
24 Analysis of Attacking Possessions Leading to a Goal Attempt, and Goal Scoring
Patterns within Men’s Elite Soccer
soccer should be conducted over
the course of a season, so that
seasonal averages can be
obtained. Effective attacking
possessions, must combine the key
factors explored within this study.
References
Abreu, P. Moreira, J. Costa, I.
Castelão, D. Reis, L. and
Garganta, J. (2011) ‘Human
versus virtual robotics soccer: A
technical analysis’. European
Journal of Sports Science,
pp. 1-10.
Abt, G. A. Dickson, G. Mummery,
W. K. (2002) ‘Goal scoring
patterns over the course of a
match: An analysis of the
Australian National Soccer
League’, in Spinks, W. Reilly, T.
Murphy, A. (eds.) Science and
Football IV. London: Routledge,
pp. 107-111.
Abt, G. and Lovell, R. (2009) ‘The
use of individualized speed and
intensity thresholds for
determining the distance run at
high-intensity in professional
soccer’. Journal of Sports
Science, 27 (9), pp. 893-898.
Acar, M. F. Yapicioglu, B. Arikan,
N. Yalcin, S. Ates, N. and Ergun,
M. (2009) ‘Analysis of Goals
Scored in the 2006 World Cup’,
in Reilly, T. and Korkusuz, F.
(eds.) Science and Football VI.
London: Routledge, pp. 235-242.
Ali, A. and Farrally, M. (1990) ‘A
computer-video aided time
motion analysis technique for
match analysis’. Journal of
Sports Medicine and Physical
Fitness, 31, pp. 82-88.
Ariki, Y. and Takiguchi, T. (2008)
‘Digital camera work for soccer
video production with event
detection and accurate ball
tracking by switching search
method’. Multimedia and Expo,
10, pp. 173-190.
Armatas, V. Yiannakos, A.
Galazoulas, C. and
Hatzimanouil, D. (2007a) ‘Goal
scoring patterns over the course
B. T. Plummer 25
of a match: Analysis of women’s
high standard soccer matches’.
Physical Training, pp. 1.
Armatas, V. Yiannakos, A.
Papadopoulou, S. Galazoulas,
C. (2007b) ‘Analysis of the set-
plays in the 18th football World
Cup in Germany’. Physical
Training. EJMAS
[Online]. Available at:
http://ejmas.com/pt/2007pt/ptart_
galazoulas_0710.html.
Armatas, V. Yiannakos, A. and
Sileloglou, P. (2007c)
‘Relationship between time and
goal scoring in soccer games:
Analysis of three world cups’.
International Journal of
Performance Analysis in Sport, 7
(2), pp. 48-58.
Armatas, V. Yiannakos, A.
Papadopoulou, S. and Skoufas,
D. (2009) ‘Evaluation of goals
scored in top ranking soccer
matches: Greek “Superleague”
2006-07. Serbian Journal of
Sports Sciences, 3 (1),
pp. 39-43.
Armatas, V. Yiannakos, A. (2010) ‘Analysis and evaluation of goals
scored in 2006 World Cup’.
Journal of Sport and Health
Research. 2 (2) : 119-128.
Atkinson, G. and Nevill, A. M.
(1998) ‘Statistical Methods For
Assessing Measurement Error
(Reliability) in Variables
Relevant to Sports Medicine’.
Sports Medicine, 26 (4),
pp. 217-238.
Bangsbo, J. and Peitersen, B.
(2000) Soccer systems and
strategies. United States:
Human Kinetics.
Bate, R. (1999) Coaching
advanced soccer players.
Google Books [Online]. Available
at: http://www.googlebooks.com
(Accessed: 17 October 2012).
Bergier, J. Soroka, A. and
Buraczewski, T. (2008) ‘Analysis
of actions ended with shots at
goal in Women’s European
Football Championships
(England 2005)’, Reilly, T. and
Korkusuz, F. (eds.) Science and
Football VI: The Proceedings of
the Sixth World Congress on
Science and Football. London:
Taylor and Francis Group,
pp. 197-201.152-154.
26 Analysis of Attacking Possessions Leading to a Goal Attempt, and Goal Scoring
Patterns within Men’s Elite Soccer
Bloomfield, J. Polman, R.
O’Donoghue, P. (2004)’The
“Bloomfield movement
classification”: Motion analysis of
individual players in dynamic
movement sports.’ International
Journal of Performance Analysis
in Sport, 4 (2), pp. 20-31.
Boyce, T. E. Carter, N. and
Neboschick, H. (2000) ‘An
evaluation of intraobserver
reliability versus interobserver
agreement’. European Journal of
Behaviour Analysis, 1 (2),
pp. 107-114.
Bradley, P. S. Sheldon, W.
Wooster, B. Olsen, P. Boanas,
P. and Krustrup, P. (2009) ‘High-
intensity running in English FA
Premier League soccer
matches’. Journal of Sports
Sciences, 27 (2), pp. 159-168.
Bruton, A. Conway, J. H. and
Holgate, S. T. (2000). ‘Reliability:
What is it and how is it
measured?’ Physiotherapy, 86
(2), pp. 94-99.
Carling, C. Williams, A, M. and
Reilly, T. (2005) Handbook of
soccer match analysis. New
York: Routledge.
Castellano, J. Casamichana, D.
and Lago, C. (2012) ‘The use of
match statistics that discriminate
between successful and
unsuccessful soccer teams’.
Journal of Human Kinetics, 31,
pp. 139-147.
Catteeuw, P. Gilis, B. Wagemans,
J. and Helsen, W. (2010)
‘Offside decision making of
assistant referees in the English
Premier League: Impact of
physical and perceptual-
cognitive factors on match
performance’. Journal of Sports
Sciences, 28 (5), pp. 471-481.
Costa, G. C. Caetano, R. C. J.
Ferreira, N. N. Junqueira, G.
Alfonso, J. Costa, P. and
Mesquita, I. (2011)
‘Determinants of attacking
tactics in youth male elite
volleyball’. International Journal
of Performance Analysis in
Sport, 11, pp. 96-104.
Di Salvo, V. Collins, A. McNeill, B.
and Cardinale, M. (2006)
‘Validation of Prozone ®: A new
video-based performance
analysis system’. International
B. T. Plummer 27
Journal of Performance
Analysis, 6 (1), pp. 108-119.
Ensum, J. Pollard, R. and Taylor,
S. (2005) ‘Applications of logistic
regression to shots at goal in
association football’, in Reilly, T.
Cabri, J. and Araujo, D (ed.)
Science and Football V. London:
Routledge, pp. 211-218.
FIFA (2012) Laws of the Game
2012-2013. Zurich: International
Football Association Board.
Figueroa, P. J. Leite, N. J. and
Barros, R. M. L. (2005) ‘Tracking
soccer players aiming their
kinematical motion analysis’.
Computer Vision and Image
Understanding, pp. 1-14.
Franks, I. M. (2004). ‘The need for
feedback’, in Hughes, M. and
Franks, I. M. (eds.) In Notational
Analysis of Sport. London:
Routledge, pp. 8-15.
Grant, A. G. Williams A. M. and
Reilly, T. (1999) ‘Analysis of
goals scored in the 1998 World
Cup’. Journal of Sports
Sciences, 17 (10), pp. 807-840.
Grehaigne, J-F. Richard, J-F. and
Griffin, L. L. (2005) Teaching
and learning team sports and games. Google Books
[Online]. Available at:
http://www.googlebooks.com
(Accessed: 3 October 2012).
Hodges, N. J. and Franks, I. M.
(2004). ‘The need for feedback
In Notational Analysis of Sport’
in Hughes’, M. and Franks, I. M.
(eds.) In Notational Analysis of
Sport. London: Routledge,
pp. 17-39.
Hughes, M. (1996) ‘Notational
Analysis’, in Reilly, T. (ed.)
Science and soccer. London: E.
& F. N. Spon, pp. 343-361.
Hughes, M. D. and Bartlett, R. M.
(2002a) ‘The use of
Performance Indicators in
Performance Analysis.’ Journal
of Sports Sciences, 20,
pp. 739-754.
Hughes, M. Cooper, M. S. Nevill, A.
(2002b) ‘Analysis procedures for
non-parametric data from
performance analysis’.
International Journal of
Performance Analysis in Sport,
2 (1), pp. 6-20.
Hughes, M. (2004a) ‘Performance
analysis - a 2004 perspective.’
28 Analysis of Attacking Possessions Leading to a Goal Attempt, and Goal Scoring
Patterns within Men’s Elite Soccer
International Journal of
Performance Analysis in Sport,
4 (1), pp. 103-109.
Hughes, M. D. and Churchill, S.
(2004b) ‘Attacking profiles of
successful and unsuccessful
teams in Copa America 2001’.
Journal of Sports Sciences,
22 (6), pp. 505.
Hughes, M. D. and Franks, I.
(2005) ‘Analysis of passing
sequences, shots and goals in
soccer’. Journal of Sports
Sciences, 23 (5), pp. 509-514.
Hughes, M. D. and Snook, N.
(2006) ‘Effectiveness of
attacking play in the 2004
European Championships’, in
Dancs, H., Hughes, M. and
O’Donoghue, P. G. (ed.)
Proceedings of the World
Congress of Performance
Analysis of Sport 7. Cardiff: CPA
UWIC Press, pp. 46-62.
Hughes, M. Hughes, M. T. Behan,
H. (2007a) ‘The Evolution of
Computerised Notational
Analysis Through the Example
of Racket Sports’. International
Journal of Sports Science and
Engineering, 1 (1), pp. 3-28.
Hughes, M. D. and Reed, D.
(2007b) Creating performance
profiles using perturbations.
Calgary: Symposium
Proceedings 6th IACSS.
Hughes, M. Caudrelier, T. James,
N. Redwood-Brown, A. Donnelly,
I. Kirkbride, A. and Duschesne,
C. (2012a) ‘Moneyball and
soccer - an analysis of the key
performance indicators of elite
male soccer players by position’.
Journal of Human & Sport
Exercise, 7 (2), pp. 402-412.
Hughes, M. Hughes, T. Michael, D.
Williams, J. James, N. Vuckovic,
G and Locke, Duncan. (2012b)
‘Performance indicators in rugby
union’. Journal of Human Sport
and Exercise, 7 (2), pp. 383-401.
James, N. Mellalieu, D. Hollely, C.
(2002) ‘Analysis of strategies in
soccer as a function of European
and domestic competition’.
International Journal of
Performance Analysis in Sport,
2 (1), pp. 85-103.
James, N. Mellalieu, D. Jones, M.
P. (2005) ‘The development of
position-specific performance
B. T. Plummer 29
indicators in professional rugby
union’. Journal of Sports
Science, 23, pp. 63-72.
Janković, A, Leontijevi, B. Pašić, M.
Jelušic, V. (2010) ‘Influence of
certain tactical attacking patterns
on the result achieved by the
team participants of the 2010
FIFA World Cup in South Africa’.
Physical Culture, 65 (1),
pp. 34-45.
Jinshan, X. (1986) ‘The analysis of
the techniques, tactics and
scoring situations of the 13th
World Cup’. Sandong Sports
Science and Technique, April,
pp. 89-91.
Jinshan, X. Xiakone, C. Yakamaka,
K. and Matsumoto, M. (1993)
‘Analysis of the goals in the 12th
World Cup’. in Reilly, T. Clarys,
J. and Stibbe, A. (eds.) Science
and Football II. London: E. and
F. N. Spon, pp. 203‐205.
Jones, P. D. James, N. and
Mellalieu, S. D. (2004)
‘Possession as a performance
indicator in soccer’. International
Journal of Performance Analysis
in Sport, 4 (1), pp. 98-102.
Kannekens, R. Elferink-Gemser, M.
T. and Visscher, C. (2009)
‘Tactical skills of world-class
youth soccer teams’. Journal of
Sports Science, 27 (8),
pp. 807-812.
Kirkendall, D. T. Dowd, W. W. and
DiCicco, A. D. (2002) ‘Patterns
of successful attacks: a
comparison of the men's and
women's World Cup’. Revista de
Fútbol y Ciencia, 1 (1),
pp. 29-36.
Konstadinidou, X. Tsigilis, N.
(2005). ‘Offensive playing
profiles of football teams from
the 1999 Women's World Cup
Finals’. International Journal of
Performance Analysis in Sport,
5 (1), pp. 61-71.
Krustrup, P. Mohr, M. and
Bangsbo, J. (2002) ‘Activity
profile and physiological
demands of top-class soccer
assistant refereeing in relation to
training status’. Journal of Sports
Sciences, 20, pp. 861-871.
Kuhn, W. (2005) ‘Changes in
professional soccer: A qualitative
and quantitative study’, in Reilly,
30 Analysis of Attacking Possessions Leading to a Goal Attempt, and Goal Scoring
Patterns within Men’s Elite Soccer
T. Cabri, J. and Araújo, D. (eds.)
Science and Football V: The
proceedings of the fifth world
congress on science and
football. Google Books
[Online]. Available at:
http://www.googlebooks.com
(Accessed: 7th February 2013).
Lago, C. (2009) ‘The influence of
match location, quality of
opposition, and match status on
possession strategies in
professional association
football’. Journal of Sports
Science, 27 (13), pp. 1463-1469.
Laios, A. and Moustakidis, A.
(2011) ‘ The setting pass and
performance indicies in
volleyball’. International Journal
of Performance Analysis in
Sport, 11, pp. 34-39.
Liebermann, D. G. Katz, L.
Hughes, M. D. Bartlett, R. M.
McClements, J. and Franks, I.
M. (2002) ‘Advances in the
application of information
technology to sport
performance’. Journal of Sports
Sciences, 20, pp. 755-769.
Lucceshi, M. (2001) Attacking
soccer: A tactical analysis.
Google Books [Online]. Available
at: http://www.googlebooks.com
(Accessed: 8 October 2012).
Mahony, L. E. Wheeler, K. W.
Lyons, K. (2012) ‘Analysis of
factors determining invasion into
attacking areas and the creation
of goal-scoring opportunities in
the Asian cup football
competition’. Asian Journal of
Exercise and Sports Science,
9 (1), pp. 53-66.
McGarry, T. (2009) ‘Applied and
theoretical perspectives of
performance analysis in sport:
Scientific issues and challenges’.
International Journal of
Performance Analysis in Sport,
9, pp. 128-140.
Michailidis, C. Michailidis, I.
Papaiakovou, G. Papaiakovou, I.
(2004) ‘Analysis and evaluation
of way and place that goals
werw achived during the
European Champions League of
Football 2002-2003’. Sports
Organization, 2(1), pp. 48-54.
Moura, F. A. Santiago, P. R. P.
Misuta, M. S. De Barros, R. M.
L. and Cunha, S. A. (2007)
Analysis of the Shots to Goal
Strategies of First Division

B. T. Plummer 31
Brazilian Professional Soccer
Teams. Ouro Preto: 25th
International Symposium on
Biomechanics in Sports.
Moussa, M. Douik, A. and
Messaoud, H. (2011) ‘Tracking
Objects in Color Image
Sequences: Application to
Football Images’. World
Academy of Science,
Engineering and Technology,
56, pp. 1133-1139.
O’Donohgue, P. (2005) ‘Normative
profiles of sports performance’.
International Journal of
Performance Analysis in Sport,
5, pp.104-119.
O’Donoghue, P. (2006) ‘The use of
feedback videos in sport’.
International Journal of
Performance Analysis in Sport,
6 (2), pp. 1-14.
O’Donoghue, P. (2007) ‘Reliability
issues in performance analysis’.
International Journal of
Performance Analysis of Sport,
7 (1), pp. 35-48.
O’Donoghue, P. (2009) ‘Interacting
performance theory’.
International Journal of
Performance Analysis of Sport,
9 (1), pp. 26-46.
O’Donoghue, P. Papadimitriou, K,
Gourgoulis, V. and Haralambis,
K. (2012) ‘Statistical methods in
performance analysis: an
example from international
soccer’. International Journal of
Performance Analysis in Sport,
12, pp. 144-155.
Olsen, E. (1988). ‘An analysis of
goal scoring strategies in the
World Championships in
Mexico’, in Reilly, T. Lees, A.
Davids, K. and Murphy, W.
(eds.), Science and Football.
London: E. and F. N. Spon.
Olsen, E., & Larsen, O. (1997). Use
of match analysis by coaches. In
Reilly, T. Bangsbo, J. and
Hughes, M. (eds.), Science and
football III. London: E. & F. N.
Spon.
Opta (2011) Opta event definitions.
London: Opta.
Pollard, R. (2006) ‘Home
Advantage in soccer: Variations
in its magnitude and a literature
review of the inter-related factors
associated with its existence’.
Journal of Sports Behaviour, 29
32 Analysis of Attacking Possessions Leading to a Goal Attempt, and Goal Scoring
Patterns within Men’s Elite Soccer
(2), pp. 169-189.
Redwood-Brown, A. (2008)
‘Passing patterns before and
after goal scoring in FA premier
league soccer’. International
Journal of Performance Analysis
in Sport, 8 (3), pp.172-182.
Reep, C. and Benjamin, B. (1968) ‘
Skill and chance in association
football’. Journal of the Royal
Statistical Society, 131 (4),
pp. 581-585.
Rees, G. James, N. Hughes, M.
Taylor, J. and Vučković, G. ‘The
effect of match status on
attacking strategies in the
English Championship’. In: The
5th International Christmas Sport
Scientific Conference: qualitative
and quantitative research in
sport science (Unpublished).
Reilly, T. (1996). ‘Motion analysis
and physiological demands’. In
Reilly, T. Bangsbo, J. and
Hughes, M. (eds.) Science and
Football III. London: E. & F. N.
Spon, pp. 65-81. Ruiz-Ruiz, C. Fradua, L.
Fernández-García, Á. And
Zubillaga, A. (2011) ‘Analysis of
entries into the penalty area as a
performance indicator in soccer’.
European Journal of Sport
Science, 1, pp. 1-8.
Scoulding, A. James, N. and
Taylor, J. (2004) ‘Passing in the
soccer World Cup 2002’.
International Journal of
Performance Analysis in Sport, 4
(2), pp 36-41.
Taylor, J. B. James, N. and
Mellalieu, S. D. (2005)
‘Notational analysis of corner
kicks in English Premier League
Soccer’, in Reilly, T, Cabri, J.
and Araújo. D. (eds) Science
and Football V: The Proceedings
of the fifth world congress on
science and football. Google
Books [Online]. Available at:
http://www.googlebooks.com
(Accessed: 17 December 2012).
Taylor, J. B. Mellalieu, S. D.
James, N. and Shearer, D. A.
(2008) ‘The influence of match
location, quality of opposition
and match status on technical
performance in professional
association football’. Journal of
Sports Sciences, 26 (9),
pp. 885-895.
Tenga, A. Kanstad, D. Ronglan, L.
T. Bahr, R. (2009) ‘Developing a
B. T. Plummer 33
new method for team match
performance analysis in
professional soccer and testing
its reliability.’ International
Journal of Performance Analysis
in Sport, 9 (1), pp. 8-25.
Tenga, A. Holme, I. Ronglan, L. T.
Bahr, R. (2010a) ‘Effects of
match location on playing tactics
for goal scoring in professional
Norweigan soccer’. Journal of
Sports Behavior, 33 (1), pp. 89-
108.
Tenga, A, Holme, I. Ronglan, L. T.
Bahr, R. (2010b) ‘Effect of
playing tactics on goal scoring in
Norwegian professional soccer’.
Journal of Sports Science, 28
(3), pp. 237-244.
Tenga, A, Ronglan, L. T. Bahr, R.
(2010c) ‘Measuring the
effectiveness of offensive match-
play in professional soccer’.
European Journal of Sports
Science, 10 (4), pp. 269-277.
Tenga, A. and Sigmundstad, E.
(2011) ‘Characteristics of goal-
scoring possessions in open
play: Comparing the top, in-
between and bottom teams from
professional soccer league’.
International Journal of
Performance Analysis in Sport,
11, pp. 545-552.
Venatrack (2012) Venatrack 3d
real-time sports analysis:
Eventing guidance. Slough:
Venatrack.
Williams, J. J. (2009) An
investigation into operational
definitions used within
performance analysis.
Presentation at the International
Workshop in Performance
Analysis, Lincoln.
Williams, J. J. (2012) ‘Operational
definitions in performance
Analysis and the need for
consensus’. International Journal
of Performance Analysis in
Sport, 12, pp. 52-63.
Wright, C. Atkins, S. Polman, R.
Jones, B. and Sargeson, L.
(2011) ‘Factor associated with
goals and goal scoring
opportunities in professional
soccer’. International Journal of
Performance Analysis in Sport,
11, pp. 438-449.
Yamanaka, K. Liang, D. Y. and
Hughes, M. (1997) ‘An analysis
34 Analysis of Attacking Possessions Leading to a Goal Attempt, and Goal Scoring
Patterns within Men’s Elite Soccer
of the playing patterns of the
Japan national team in the 1994
World Cup qualifying matches
for Asia’. In Reilly, T. Bangsbo,
J. and Hughes, M. (eds.)
Science and Football III. London:
Routledge. pp. 221-228.
Yiannakos, A. and Armatas, V.
(2006) ‘Evaluation of the goal
scoring patterns in European
Championship in Portugal 2004’.
International Journal of
Performance Analysis in Sport, 6
(1), pp. 178-188.
B. T. Plummer 35
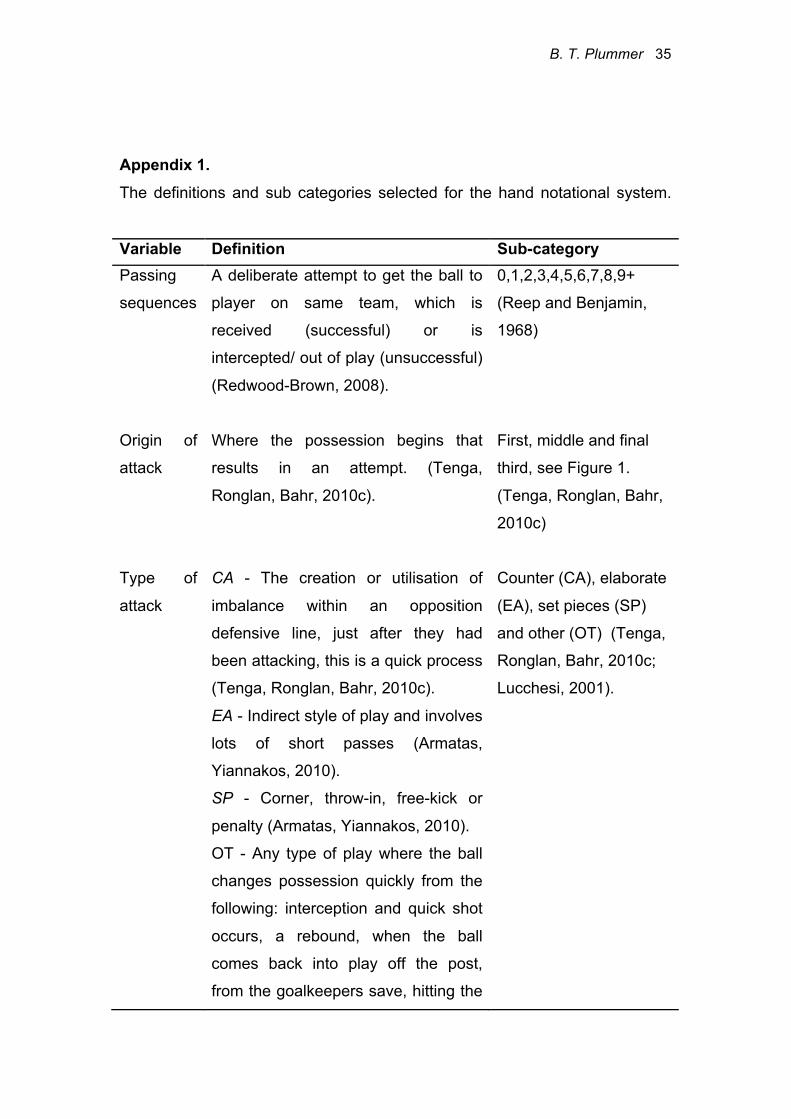
Appendix 1. The definitions and sub categories selected for the hand notational system.
Variable Definition Sub-category Passing
sequences
A deliberate attempt to get the ball to
player on same team, which is
received (successful) or is
intercepted/ out of play (unsuccessful)
(Redwood-Brown, 2008).
0,1,2,3,4,5,6,7,8,9+
(Reep and Benjamin,
1968)
Origin of
attack
Where the possession begins that
results in an attempt. (Tenga,
Ronglan, Bahr, 2010c).
First, middle and final
third, see Figure 1.
(Tenga, Ronglan, Bahr,
2010c)
Type of
attack
CA - The creation or utilisation of
imbalance within an opposition
defensive line, just after they had
been attacking, this is a quick process
(Tenga, Ronglan, Bahr, 2010c).
EA - Indirect style of play and involves
lots of short passes (Armatas,
Yiannakos, 2010).
SP - Corner, throw-in, free-kick or
penalty (Armatas, Yiannakos, 2010).
OT - Any type of play where the ball
changes possession quickly from the
following: interception and quick shot
occurs, a rebound, when the ball
comes back into play off the post,
from the goalkeepers save, hitting the
Counter (CA), elaborate
(EA), set pieces (SP)
and other (OT) (Tenga,
Ronglan, Bahr, 2010c;
Lucchesi, 2001).
36 Analysis of Attacking Possessions Leading to a Goal Attempt, and Goal Scoring
Patterns within Men’s Elite Soccer
woodwork, or a blocked attempt with
an immediate shot after (Wright et al.,
2011).
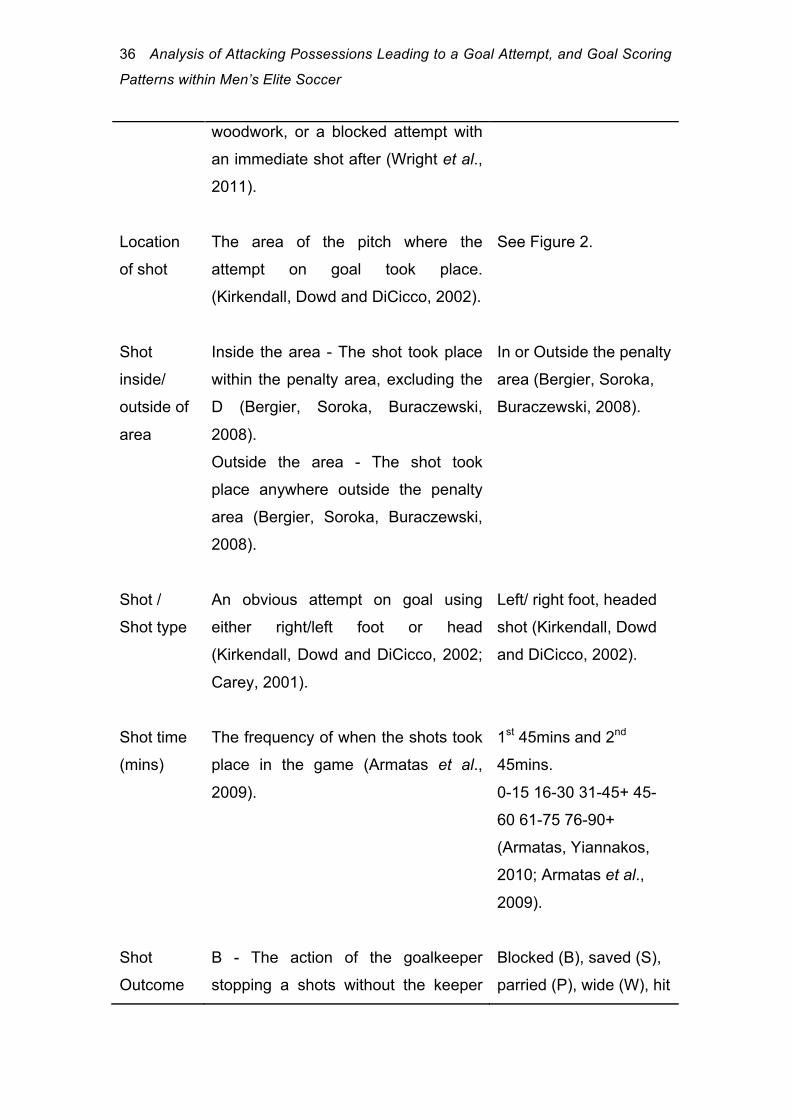
Location
of shot
The area of the pitch where the
attempt on goal took place.
(Kirkendall, Dowd and DiCicco, 2002).
See Figure 2.
Shot
inside/
outside of
area
Inside the area - The shot took place
within the penalty area, excluding the
D (Bergier, Soroka, Buraczewski,
2008).
Outside the area - The shot took
place anywhere outside the penalty
area (Bergier, Soroka, Buraczewski,
2008).
In or Outside the penalty
area (Bergier, Soroka,
Buraczewski, 2008).
Shot /
Shot type
An obvious attempt on goal using
either right/left foot or head
(Kirkendall, Dowd and DiCicco, 2002;
Carey, 2001).
Left/ right foot, headed
shot (Kirkendall, Dowd
and DiCicco, 2002).
Shot time
(mins)
The frequency of when the shots took
place in the game (Armatas et al.,
2009).
1st 45mins and 2nd
45mins.
0-15 16-30 31-45+ 45-
60 61-75 76-90+
(Armatas, Yiannakos,
2010; Armatas et al.,
2009).
Shot
Outcome
B - The action of the goalkeeper
stopping a shots without the keeper
Blocked (B), saved (S),
parried (P), wide (W), hit
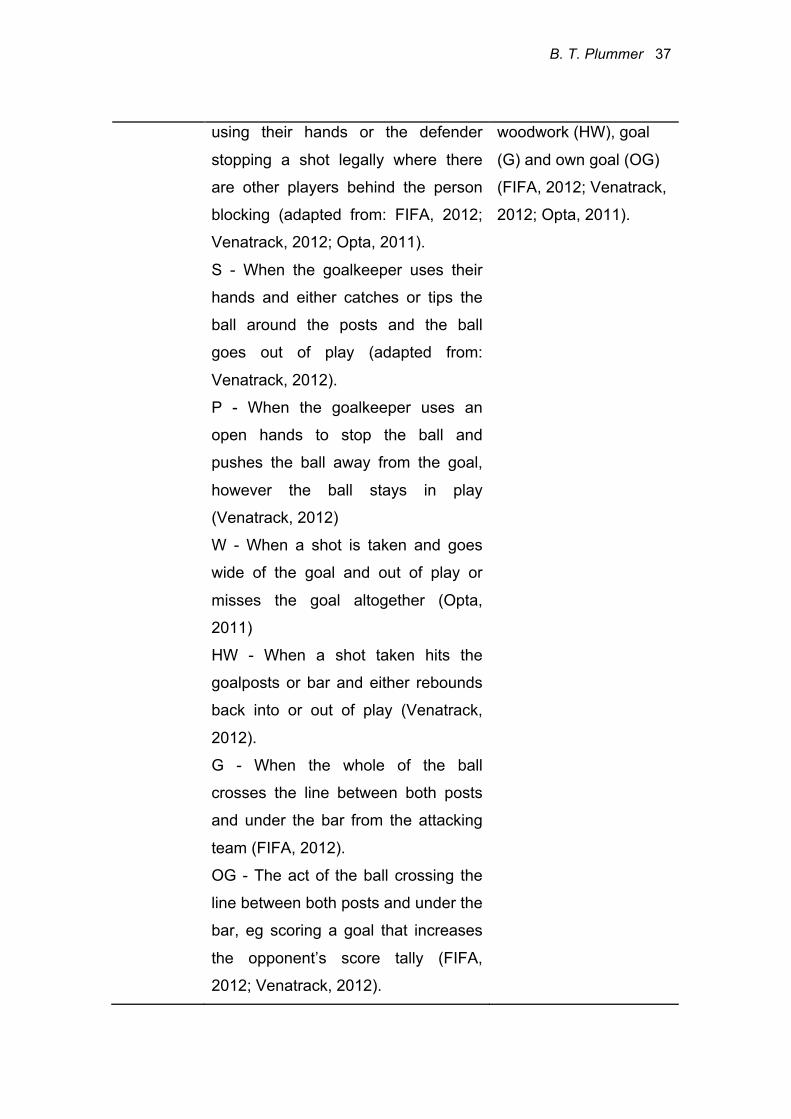
B. T. Plummer 37
using their hands or the defender
stopping a shot legally where there
are other players behind the person
blocking (adapted from: FIFA, 2012;
Venatrack, 2012; Opta, 2011).
S - When the goalkeeper uses their
hands and either catches or tips the
ball around the posts and the ball
goes out of play (adapted from:
Venatrack, 2012).
P - When the goalkeeper uses an
open hands to stop the ball and
pushes the ball away from the goal,
however the ball stays in play
(Venatrack, 2012)
W - When a shot is taken and goes
wide of the goal and out of play or
misses the goal altogether (Opta,
2011)
HW - When a shot taken hits the
goalposts or bar and either rebounds
back into or out of play (Venatrack,
2012).
G - When the whole of the ball
crosses the line between both posts
and under the bar from the attacking
team (FIFA, 2012).
OG - The act of the ball crossing the
line between both posts and under the
bar, eg scoring a goal that increases
the opponent’s score tally (FIFA,
2012; Venatrack, 2012).
woodwork (HW), goal
(G) and own goal (OG)
(FIFA, 2012; Venatrack,
2012; Opta, 2011).
38 Analysis of Attacking Possessions Leading to a Goal Attempt, and Goal Scoring
Patterns within Men’s Elite Soccer
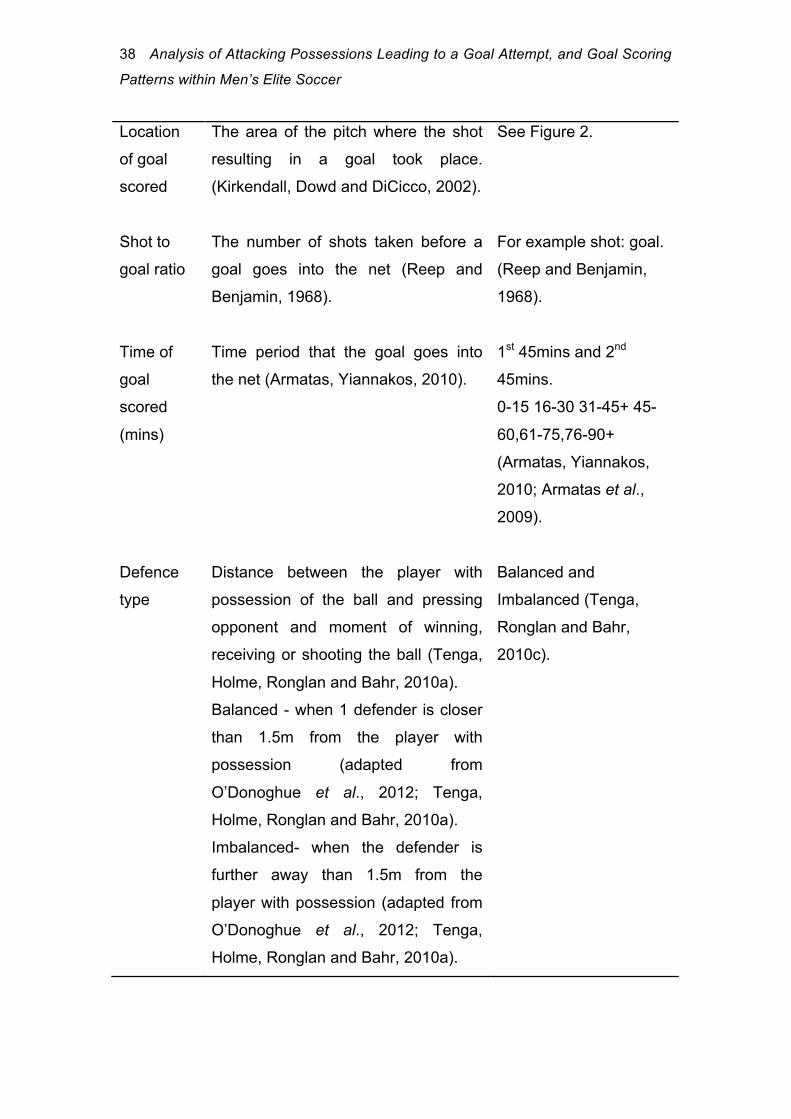
Location
of goal
scored
The area of the pitch where the shot
resulting in a goal took place.
(Kirkendall, Dowd and DiCicco, 2002).
See Figure 2.
Shot to
goal ratio
The number of shots taken before a
goal goes into the net (Reep and
Benjamin, 1968).
For example shot: goal.
(Reep and Benjamin,
1968).
Time of
goal
scored
(mins)
Time period that the goal goes into
the net (Armatas, Yiannakos, 2010).
1st 45mins and 2nd
45mins.
0-15 16-30 31-45+ 45-
60,61-75,76-90+
(Armatas, Yiannakos,
2010; Armatas et al.,
2009).
Defence
type
Distance between the player with
possession of the ball and pressing
opponent and moment of winning,
receiving or shooting the ball (Tenga,
Holme, Ronglan and Bahr, 2010a).
Balanced - when 1 defender is closer
than 1.5m from the player with
possession (adapted from
O’Donoghue et al., 2012; Tenga,
Holme, Ronglan and Bahr, 2010a).
Imbalanced- when the defender is
further away than 1.5m from the
player with possession (adapted from
O’Donoghue et al., 2012; Tenga,
Holme, Ronglan and Bahr, 2010a).
Balanced and
Imbalanced (Tenga,
Ronglan and Bahr,
2010c).