analysis of architectural façade elements in tropical...
TRANSCRIPT

Analysis of Architectural Façade Elements in Tropical Climates for Daylight, Thermal Comfort and Passive Climatization
Elizabeth McCormick1, J. Alstan Jakubiec2, Michael Budig2
1Massachusetts Institute of Technology, Cambridge, USA 2Singapore University of Technology and Design, Singapore
Abstract Singapore is one country that is leading the charge in environmental design in the tropics by advocating for intelligent strategies in buildings. The small city-state uses Residential Envelope Transmittance Values (RETV) to quantify heat transfer through the building façade. This study compares simulated performance metrics of ten Singaporean buildings to calculated RETV values to evaluate qualitative metrics such as daylight penetration and interior operative temperature (comfort) against physical building features such as shading and window-to-wall ratio. The authors have determined that while RETV is a unique way to quantify thermal transfer through the building envelope, it ignores many of the qualitative characteristics implicit in passive buildings that actually define building performance.
Introduction Tropical regions lead the world in urban development and account for the majority of projected urban growth until 2050 (United Nations 2015). Accordingly, tropical residential housing is growing rapidly (James Cook University 2014), creating a market that is largely suitable for passive design strategies. Singapore is one tropical nation that is making deliberate steps toward energy efficiency in buildings. There, air conditioning, ventilation and electric lighting account for up to half of building energy and national electricity consumption (Building and Construction Authority 2014). In order to curb building energy use, Singapore has set limitations on thermal transfer through envelopes hoping to improve façade designs and lower energy consumption.
Eighty percent of Singaporeans live in public housing constructed by the Housing Development Board (HDB), the government agency founded to support rapidly increasing population demands and fight conditions of squatters and slums. With the construction of high-density, high-rise flats, HDB has been the sole agency responsible for public housing in Singapore since 1960. In order to get a complete picture of residential buildings in Singapore, the authors investigate both HDB and private, developer-built high-rise buildings.
For buildings that operate air conditioning predominately during the day, fixed Envelope Thermal Transfer Value (ETTV) limits are in place and are a
requirement for Green Mark certification, the predominant green building standard in Singapore (Building and Construction Authority 2012). The benchmarking scheme, introduced in 2005, has been adopted widely across Southeast Asia, Australia and beyond. Residential Envelope Transmittance Value (RETV) is another standard metric used in Singapore to quantify and weigh the relative importance of conductive and radiative heat transfer through both opaque and translucent building envelope components in residential buildings, which are assumed to be air-conditioned only at night. Due to the hot and humid tropical climate, air conditioning is a requirement at least part of the year in the vast majority of Singaporean homes and office buildings. RETV and ETTV are essentially measures that are driven by this need for air conditioning in Singapore. Because the potential for passive design strategies is high in residential housing and housing is growing rapidly in the tropics, it seems worthwhile to compare metrics such as RETV to other passive metrics which may result in further energy independence by negating the need for active systems.
This manuscript therefore analyzes building facade design features such as glazed area, shading features, and fenestration details related to passive performance measures such as daylight penetration and free-running thermal comfort. By comparing RETV with passive strategies, the authors intend to investigate where RETV and passive design strategies align or are at opposition.
Background Residential Envelope Transmittance Value (RETV) RETV is a combination of conduction through façade elements and solar radiative gains. However, it does not account for daylighting, comfort, or ventilation potential –critical passive elements of building performance. The Building and Construction Authority (BCA) originally introduced Overall Thermal Transfer Value (OTTV), which was replaced by ETTV in 2004 as they found that OTTV “did not reflect accurately the relative performance of the different elements in an envelope system,” particularly in regards to solar gains through glazing (Building and Construction Authority 2004). RETV was introduced in 2008 to accommodate buildings that were naturally ventilated during the day and likely air-conditioned at night.
Daylit Area and Overlit Area The daylit area is a concept defined by Reinhart, Rakha and Weissman (2014), which found a statistical correlation between certain annual, climate-based daylighting measures and an average human perception of what is daylit in real spaces. The daylit area, abbreviated as DA300 lx, 50%, is the portion of a space that receives 300 lx or greater of illuminance for 50% of occupied daylit hours (from 8am to 5pm in this study), and it attempts to answer the simple question: “Is this space daylit adequately?” The depth of the daylit area is simply the depth of space where DA300 lx, 50% is met measured along the centerline of the shoebox model. To supplement this beneficial daylighting metric, the authors also calculate the depth of overlit area. The overlit area measure attempts to quantify lighting, which will result in visual discomfort (glare) and excessive solar heat gains. It is derived from John Mardaljevic’s (2012) Useful Daylight Illuminance (UDI) concept within which illuminances greater than 3000 lx are exceeding a ‘reasonable’ lighting level, and is abbreviated as UDIe3000 lx, 10% with the ‘e’ standing for exceeded. Areas which receive greater than 3000 lx for more than 10% of occupied hours in the year are overlit.
Thermal Comfort As this paper aims to look towards passive design strategies, thermal comfort in naturally ventilated spaces is something the authors wish to quantify. The ASHRAE 55 Adaptive Thermal Comfort standard (de Dear and Brager 2002) is based on a wealth of subjective research which suggests that comfortable interior operative temperatures in naturally ventilated buildings are related to the recent outdoor thermal history. The typical, mean dry bulb air temperature in Singapore according to the IWEC climate file is 27.5 C (ASHRAE 2016), which varies little throughout the year in Singapore’s equatorial climate. Inputting this value into the aforementioned ASHRAE 55 Adaptive Thermal Comfort model (de Dear and Brager 2002) for naturally ventilated buildings gives a 90% acceptance threshold temperature of approximately 28.5 C. Therefore, a very simple measure of thermal comfort is applied in this paper to describe conditions where the interior operative temperature is within a comfortable range, below 28.5 C.
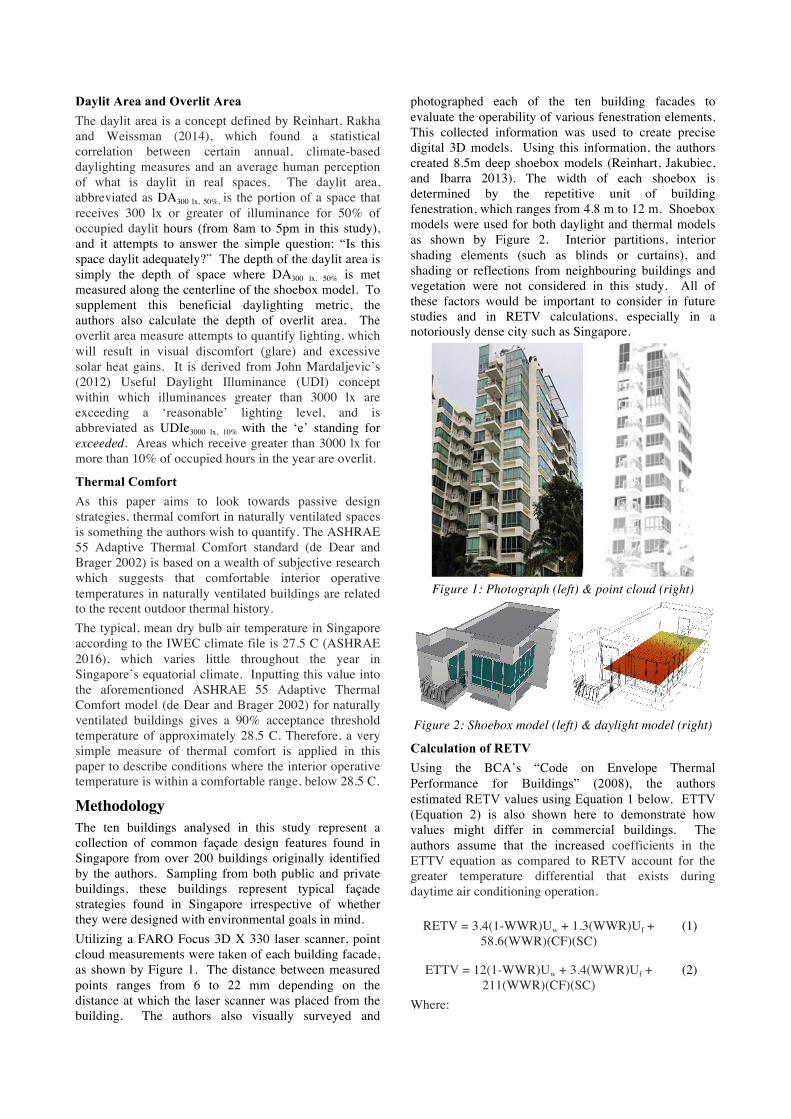
Methodology The ten buildings analysed in this study represent a collection of common façade design features found in Singapore from over 200 buildings originally identified by the authors. Sampling from both public and private buildings, these buildings represent typical façade strategies found in Singapore irrespective of whether they were designed with environmental goals in mind. Utilizing a FARO Focus 3D X 330 laser scanner, point cloud measurements were taken of each building facade, as shown by Figure 1. The distance between measured points ranges from 6 to 22 mm depending on the distance at which the laser scanner was placed from the building. The authors also visually surveyed and
photographed each of the ten building facades to evaluate the operability of various fenestration elements. This collected information was used to create precise digital 3D models. Using this information, the authors created 8.5m deep shoebox models (Reinhart, Jakubiec, and Ibarra 2013). The width of each shoebox is determined by the repetitive unit of building fenestration, which ranges from 4.8 m to 12 m. Shoebox models were used for both daylight and thermal models as shown by Figure 2. Interior partitions, interior shading elements (such as blinds or curtains), and shading or reflections from neighbouring buildings and vegetation were not considered in this study. All of these factors would be important to consider in future studies and in RETV calculations, especially in a notoriously dense city such as Singapore.
Figure 1: Photograph (left) & point cloud (right)
Figure 2: Shoebox model (left) & daylight model (right)
Calculation of RETV Using the BCA’s “Code on Envelope Thermal Performance for Buildings” (2008), the authors estimated RETV values using Equation 1 below. ETTV (Equation 2) is also shown here to demonstrate how values might differ in commercial buildings. The authors assume that the increased coefficients in the ETTV equation as compared to RETV account for the greater temperature differential that exists during daytime air conditioning operation.
RETV = 3.4(1-WWR)Uw + 1.3(WWR)Uf + 58.6(WWR)(CF)(SC)
(1)
ETTV = 12(1-WWR)Uw + 3.4(WWR)Uf + 211(WWR)(CF)(SC)
(2)
Where:

WWR: window-to-wall ratio (fenestration area/ gross area of exterior wall) Uw: thermal transmittance of opaque wall (W/m2K) Uf: thermal transmittance of fenestration (W/m2K) CF: correction factor for solar heat gain through fenestration (%) SC: shading coefficients of fenestration system(%)
The Correction Factor (CF) for solar gains is unitless and defined by the pitch angle and varies with solar orientation. The Shading Coefficient (SC) is the ratio of solar heat gain through a shaded and glazed fenestration system to the solar heat gain through an unshaded 3mm clear glass (Building and Construction Authority 2008) as shown by Equation 3. It factors in both shading geometry and solar control films on the glass using Equation 4 below.
SC = solar heat gain of glass and shading (3)
solar heat gain through a 3mm unshaded clear glass
SC = SCglass-and-film x SCgeometric-shading (4)
The authors assumed identical U-values and solar control films for all buildings, which can be found in Table A1. Using the BCA methodology shown above, the authors found the process to be complicated and somewhat difficult to define shading coefficients, especially where a façade had multiple features or nonconventional shading methods. In response, the authors created a calculation tool to determine the geometric component of SC. Hourly sunlit fenestration area calculations were predicted using Radiance (Ward 1994) using sky conditions from 7:00 AM until 6:00 PM on the solstices and equinoxes as per the BCA guidelines (adjusted slightly so the 7:00 AM time is above the horizon). The sunlit area calculation results were then utilized to split the direct and diffuse irradiation arriving at the window. The RETV calculation methodology (Building and Construction Authority 2008) assumes that shading devices block the sun-shaded percentage of direct solar transmission through the glass, but 100% of potential diffuse radiation is always received by the façade. As a result, the authors noticed several extreme instances where shading elements block primarily diffuse light rather than direct light. In these instances, the shading device had little impact on the geometric component of SC but a large impact on total irradiation. The calculation of SC as a part of RETV therefore appears to oversimplify the impact of many shading systems in the Singaporean climate where the diffuse component of radiation is rather large—68.6% of the global horizontal irradiation is diffused, according to the IWEC weather file. Looking at one condition discovered on BLDG 3, two windows have incredibly similar geometric SC values, as shown by Table 1, while raytracing simulations in Figure 3 shows that the total irradiance received is actually quite varied. On the South orientation where sun angles are high, the low wall does
not block direct sunlight and has little impact on geometric SC. While the obstruction is not high enough to block direct solar radiation from the December sun, it does block a significant amount of diffuse irradiation, which would have a noticeable impact on building performance.
Figure 3: BLDG 3 – demonstrating the impact of shading element on diffuse radiation facing south. The elevation is shown with the corresponding section. The obstruction is indicated by a dashed line in elevation so
the viewer can see the simulated results beyond.
Table 1: Geometric Solar Coefficients of BLDG 3
No Obstruction Obstruction Δ
N/S 0.677993 0.674493 0.0035 E/W 0.692378 0.603607 0.088771
Building Performance Simulations For each shoebox model and analysis type, daylighting and thermal comfort results are calculated in 8 cardinal directions: N, NE, E, SE, S, SW, W and NW. All simulations use the Singapore IWEC weather file (ASHRAE 2016) as a climatic basis. Daylighting models are a direct translation of the 3D point cloud data into a detailed geometric model as earlier illustrated in Figure 2. All glazing is presumed to be 65% transmissive in the visible spectra, and reflective properties are documented in Table A2. Lighting sensor grids are distributed based upon a 0.2m spacing, beginning at 0.1m away from the façade. Simulation models are translated into the Daysim (Reinhart and Walkenhorst 2001) engine using DIVA (Jakubiec and Reinhart 2011), and annual lighting calculations are performed using the Radiance simulation parameters described in Table A3. Two output metrics are calculated based on this—the depth of daylit and overlit areas as previously defined. Both are climate-based daylighting metrics (CBDMs). CBDMs are metrics based upon annual predictions of illuminance which account for the changing solar position throughout the year and varying sky conditions derived from standard meteorological datasets such as the typical meteorological year. Thermal models are constructed using the EnergyPlus simulation engine (Crawley et al 2001) and the Archsim interface (Dogan 2016) based upon the 3D scan data. Thermal and glazing properties are kept constant between the ten models to enable comparisons based on
No Obstruction Obstruction

geometric factors, as was also done for the RETV and daylighting calculations. These material properties are again documented in Table A1. Likewise, internal loads and schedules are standardized based on a typical residential living space. These values are documented in Figure A1. Windows are modelled as individual framed openings, and thermal transfer through mullions is handled with the EnergyPlus WindowProperty: FrameAndDivider object. No mechanical cooling or mechanical ventilation is modelled inside the units. Natural ventilation is assumed to occur based on the ZoneVentilation:WindandStackOpenArea model with a window opening fraction of 0.5 and auto-calculated wind coefficient depending on the hourly wind direction. Windows are opened when the outdoor air temperature is below 28.5 C, the presumed comfortable (operative) temperature. Height difference is set to 0 such that buoyant flow is not considered. Thermal models are coupled with the daylighting models such that at each hour when the spatial average daylight illuminance value from the daylighting simulation is greater than 200 lx, the electric lights in the thermal model are turned off.
Results A summary of all results is displayed in Figure 5 where buildings are ranked against each other based on year built (year), RETV, WWR, Daylit Area, Percent of Hours where Operative Temperature is less than 28.5 C (<28.5 C) and Solar Heat Gains (SHG). Figure 5 also identifies the buildings as HDB or private and designates the predominant shading type. Below is a summary of general observations made from this data.
(1) Private vs. HDB Housing Metrics While the authors hypothesized that newer buildings would have lower RETVs, Figure 4 demonstrates that the newer, private buildings (3, 5, 6, 7) in fact had higher average RETVs based upon geometric factors than older HDB buildings (1, 2, 4, 8, 9, 10). The average age of the HDB buildings measured was 26.8 years with an average RETV of 17.9 W/m2, while the average age of private buildings was only 7.8 years with an average RETV of 21.2 W/m2 at the time research was conducted in 2016. With the exception of BLDG 5, private buildings also had the highest window-to-wall ratios (WWR), averaging at 45% compared to the HDB average of 28%. These statistics are summarized in Table 2. The higher average WWR is likely because the projects have higher budgets and may allow for a greater dependence on mechanical cooling. It is worth noting that the average value of RETV for all studied buildings falls below the 25 W/m2 mandated by the BCA using the presumed values from Table A1.
Figure 4: Building age and corresponding RETV values,
compared between private and HDB buildings
Table 2: Private and HDB Averages
Private HDB
RETV 21.2 W/m2 17.9 W/m2 WWR 45% 28% Daylit 80% 62% <28.5 50.8% 54.5% SHG 27.7 kWh/m2 13.0 kWh/m2
(2) Solar Orientation The buildings with corner windows (2, 5, 7) had less variation in RETV across solar orientations than buildings with glazing facing only one orientation (1, 3, 4, 6, 8, 9), as shown by Figure 6. The sharp peaks of BLDG 3 compared to the steadier line of BLDG 7 indicate that buildings without corner windows are more susceptible to changes in orientation. Accordingly, the buildings with corner windows have less variation in daylight penetration, operative temperature, and solar heat gains. This is useful for large-scale residential buildings that tend to repeat a common module across various orientations. HDB communities, especially, are often built of multiple buildings that utilize the same fenestration system at various orientations. Though this will not necessarily lead to an enhanced overall performance, it provides for a more predictable environment across orientations, which may be beneficial to building operations and maintenance. Corner windows may also offer opportunities for better ventilation, which will be explored in a follow-up study. With the exceptions of BLDG 5 and 7 that have significant corner windows, all of the buildings had higher RETVs on the east and west orientations. This observation remained consistent for solar heat gains and percent time comfortable but was less so for daylight penetration.
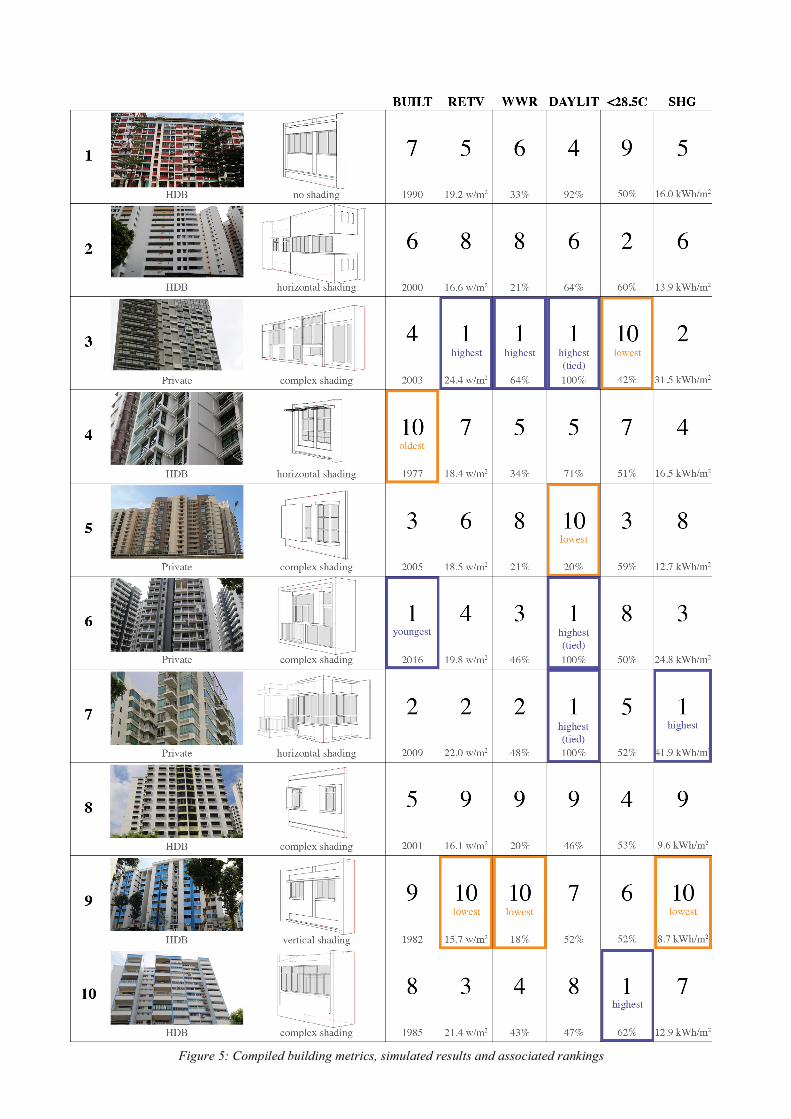
Figure 5: Compiled building metrics, simulated results and associated rankings
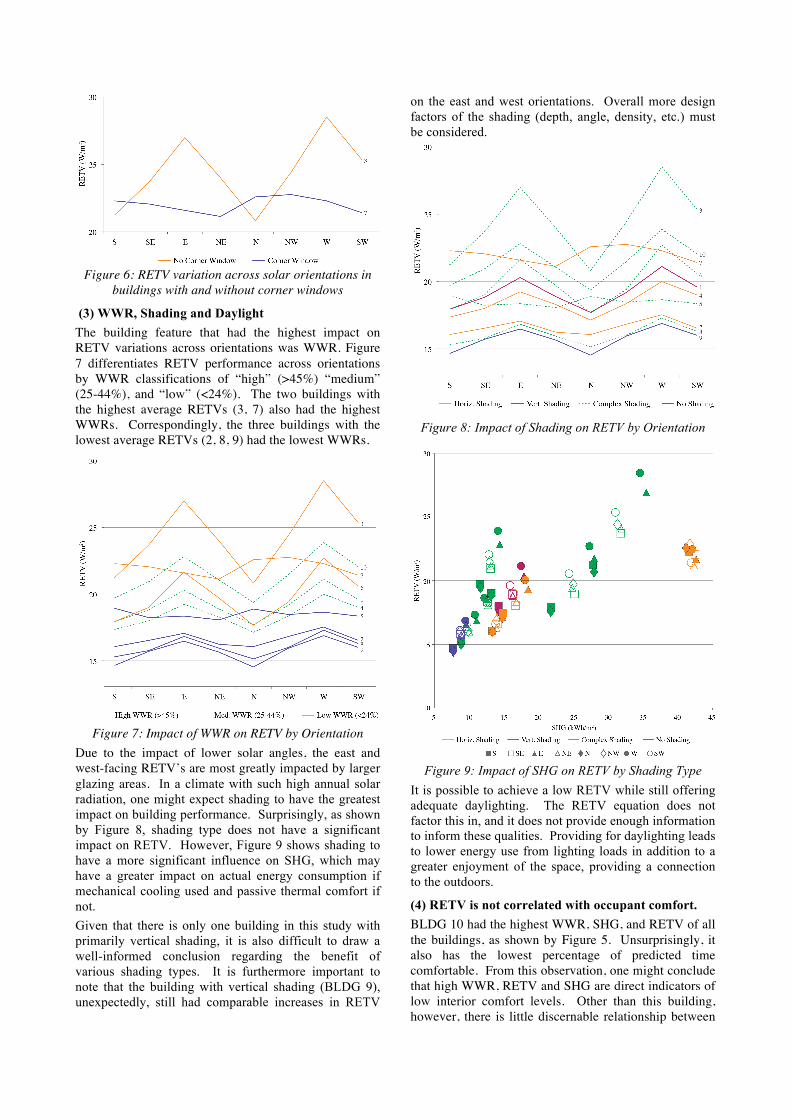
Figure 6: RETV variation across solar orientations in
buildings with and without corner windows
(3) WWR, Shading and Daylight The building feature that had the highest impact on RETV variations across orientations was WWR. Figure 7 differentiates RETV performance across orientations by WWR classifications of “high” (>45%) “medium” (25-44%), and “low” (<24%). The two buildings with the highest average RETVs (3, 7) also had the highest WWRs. Correspondingly, the three buildings with the lowest average RETVs (2, 8, 9) had the lowest WWRs.
Figure 7: Impact of WWR on RETV by Orientation
Due to the impact of lower solar angles, the east and west-facing RETV’s are most greatly impacted by larger glazing areas. In a climate with such high annual solar radiation, one might expect shading to have the greatest impact on building performance. Surprisingly, as shown by Figure 8, shading type does not have a significant impact on RETV. However, Figure 9 shows shading to have a more significant influence on SHG, which may have a greater impact on actual energy consumption if mechanical cooling used and passive thermal comfort if not. Given that there is only one building in this study with primarily vertical shading, it is also difficult to draw a well-informed conclusion regarding the benefit of various shading types. It is furthermore important to note that the building with vertical shading (BLDG 9), unexpectedly, still had comparable increases in RETV
on the east and west orientations. Overall more design factors of the shading (depth, angle, density, etc.) must be considered.
Figure 8: Impact of Shading on RETV by Orientation
Figure 9: Impact of SHG on RETV by Shading Type
It is possible to achieve a low RETV while still offering adequate daylighting. The RETV equation does not factor this in, and it does not provide enough information to inform these qualities. Providing for daylighting leads to lower energy use from lighting loads in addition to a greater enjoyment of the space, providing a connection to the outdoors.
(4) RETV is not correlated with occupant comfort. BLDG 10 had the highest WWR, SHG, and RETV of all the buildings, as shown by Figure 5. Unsurprisingly, it also has the lowest percentage of predicted time comfortable. From this observation, one might conclude that high WWR, RETV and SHG are direct indicators of low interior comfort levels. Other than this building, however, there is little discernable relationship between
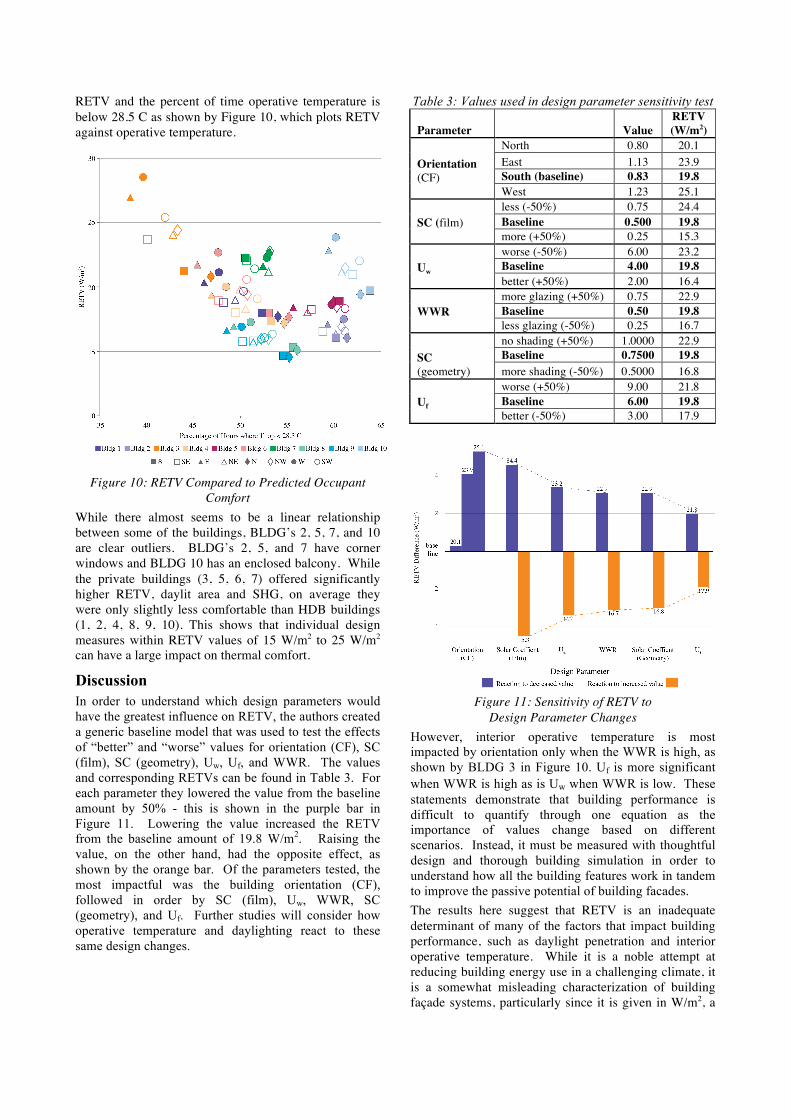
RETV and the percent of time operative temperature is below 28.5 C as shown by Figure 10, which plots RETV against operative temperature.
Figure 10: RETV Compared to Predicted Occupant
Comfort While there almost seems to be a linear relationship between some of the buildings, BLDG’s 2, 5, 7, and 10 are clear outliers. BLDG’s 2, 5, and 7 have corner windows and BLDG 10 has an enclosed balcony. While the private buildings (3, 5, 6, 7) offered significantly higher RETV, daylit area and SHG, on average they were only slightly less comfortable than HDB buildings (1, 2, 4, 8, 9, 10). This shows that individual design measures within RETV values of 15 W/m2 to 25 W/m2 can have a large impact on thermal comfort.
Discussion In order to understand which design parameters would have the greatest influence on RETV, the authors created a generic baseline model that was used to test the effects of “better” and “worse” values for orientation (CF), SC (film), SC (geometry), Uw, Uf, and WWR. The values and corresponding RETVs can be found in Table 3. For each parameter they lowered the value from the baseline amount by 50% - this is shown in the purple bar in Figure 11. Lowering the value increased the RETV from the baseline amount of 19.8 W/m2. Raising the value, on the other hand, had the opposite effect, as shown by the orange bar. Of the parameters tested, the most impactful was the building orientation (CF), followed in order by SC (film), Uw, WWR, SC (geometry), and Uf. Further studies will consider how operative temperature and daylighting react to these same design changes.
Table 3: Values used in design parameter sensitivity test
Parameter
Value RETV (W/m2)
Orientation (CF)
North 0.80 20.1 East 1.13 23.9 South (baseline) 0.83 19.8 West 1.23 25.1
SC (film)
less (-50%) 0.75 24.4 Baseline 0.500 19.8 more (+50%) 0.25 15.3
Uw
worse (-50%) 6.00 23.2 Baseline 4.00 19.8 better (+50%) 2.00 16.4
WWR
more glazing (+50%) 0.75 22.9 Baseline 0.50 19.8 less glazing (-50%) 0.25 16.7
SC (geometry)
no shading (+50%) 1.0000 22.9 Baseline 0.7500 19.8 more shading (-50%) 0.5000 16.8
Uf
worse (+50%) 9.00 21.8 Baseline 6.00 19.8 better (-50%) 3.00 17.9
Figure 11: Sensitivity of RETV to
Design Parameter Changes However, interior operative temperature is most impacted by orientation only when the WWR is high, as shown by BLDG 3 in Figure 10. Uf is more significant when WWR is high as is Uw when WWR is low. These statements demonstrate that building performance is difficult to quantify through one equation as the importance of values change based on different scenarios. Instead, it must be measured with thoughtful design and thorough building simulation in order to understand how all the building features work in tandem to improve the passive potential of building facades. The results here suggest that RETV is an inadequate determinant of many of the factors that impact building performance, such as daylight penetration and interior operative temperature. While it is a noble attempt at reducing building energy use in a challenging climate, it is a somewhat misleading characterization of building façade systems, particularly since it is given in W/m2, a

measurement of actual thermal transfer. The authors would encourage the number to be used as a ‘ranking’ instead of as an actual measurement. The study leaves the authors wondering, how should one define building façade performance? Not all designers have the means to perform building simulations on their projects, yet RETV neglects many of the useful performance measures, such as daylighting or thermal comfort potential, that define building performance.
Future Work and Limitations As the scope of ten buildings was difficult to form definitive conclusions regarding the performance of various building features, the authors hope to expand the number of buildings evaluated in this study and the current results should be understood as an initial case study. The immediate next step for this research is to add in the ventilation potential for these façade elements to further compare to RETV. This work is on going with the aim of calculating typical discharge coefficients in order to determine the effect of specific façade configurations on ventilation potential irrespective of interior layout and the effects of corner windows on ventilation as seen in Figure 12 below, an early simulation result. The calculated discharge coefficients will be used as updated inputs to the ventilation calculations in the thermal models.
Figure 12: A Single-Sided Ventilation Test Model
It will also be important to factor humidity into occupant comfort, as this is a major source of discomfort in the Singaporean climate. Further studies should include actual energy use in the studied spaces to validate the metrics simulated in this manuscript. This can be achieved through monitoring and collection of utility data. The work will also be expanded to include commercial buildings compared against ETTV metrics.
Conclusion Through building simulation and calculation, this research explored the impact of various façade features across ten residential buildings in Singapore in order to validate Singapore’s building performance benchmarking metric, Residential Envelope Transmittance Value (RETV). The authors determined
that RETV is only the first step in quantifying building performance, as it ignores many of the qualities inherent in successful, passively designed residential buildings.
Acknowledgement [To be included in final manuscript]
References ASHRAE. 2016. ASHRAE International Weather Files
for Energy Calculations (IWEC2). Atlanta. Accessed November 22. https://www.ashrae.org/resources--publications/bookstore/iwec2.
Building and Construction Authority. 2004. “Guidelines on Envelope Thermal Transfer Value for Buildings.” February. https://www.bca.gov.sg/PerformanceBased/others/ETTV.pdf.
Building and Construction Authority. 2008. “Code on Envelope Thermal Performance for Buildings.” https://www.bca.gov.sg/performancebased/others/retv.pdf.
Building and Construction Authority. 2012. “BCA Green Mark; Certification Standards for New Buildings.” GM Version 4.1. https://www.bca.gov.sg/EnvSusLegislation/others/GM_Certification_Std2012.pdf.
Building and Construction Authority. 2014. “BCA Building Energy Benchmarking Report 2014.” http://www.bca.gov.sg/GreenMark/others/BCA_BEBR_Abridged_FA.pdf.
Crawley, Drury B., Linda K. Lawrie, Frederick C. Winkelmann, W. F. Buhl, Y. Joe Huang, Curtis O. Pedersen, Richard K. Strand, et al. 2001. “EnergyPlus: Creating a New-Generation Building Energy Simulation Program.” Energy and Buildings, Special Issue: BUILDING SIMULATION’99, 33 (4): 319–31. doi:10.1016/S0378-7788(00)00114-6.
Dear, Richard J. de, and Gail S. Brager. 2002. “Thermal Comfort in Naturally Ventilated Buildings: Revisions to ASHRAE Standard 55.” Energy and Buildings, Special Issue on Thermal Comfort Standards, 34 (6): 549–61. doi:10.1016/S0378-7788(02)00005-1.
Dogan, Timur. 2016. Archsim. Computer Software. (version 4). Solemma. http://www.archsim.com/.
Jakubiec, J. Alstan, and Christoph Reinhart. 2011. “DIVA 2.0: Integrating Daylight and Thermal Simulations Using Rhinoceros 3D, Daysim and EnergyPlus.” In Proceedings of Building Simulation (Vol. 20, No. 11, pp.2202-2209). Sydney, Australia.
James Cook University. 2014. “State of the Tropics 2014 Report.” https://www.jcu.edu.au/__data/assets/pdf_file/0003/246621/SOTT_Final-Report_Low-Res_11-June-2014.pdf.

Mardaljevic, J., M. Andersen, N. Roy, and J.
Christoffersen. 2012. “Daylighting Metrics: Is There a Relation Between Useful Daylight Illuminance and Daylight Glare Probability?” In Proceedings of the Building Simulation and Optimization Conference (BSO12). Vol. 1011. Loughborough, UK.
Reinhart, Christoph, J. Alstan Jakubiec, and Diego Ibarra. 2013. “Definition of a Reference Office for Standardized Evaluations of Dynamic Facade and Lighting Technologies.” In Proceedings of Building Simulation 2013. Chambery, France.
Reinhart, Christoph, Tarek Rakha, and Dan Weissman. 2014. “Predicting the Daylit Area—A Comparison of Students Assessments and Simulations at Eleven Schools of Architecture.” LEUKOS 10 (4): 193–206. doi:10.1080/15502724.2014.929007.
Reinhart, Christoph, and Oliver Walkenhorst. 2001. “Validation of Dynamic RADIANCE-Based Daylight Simulations for a Test Office with External Blinds.” Energy and Buildings 33 (7): 683–97. doi:10.1016/S0378-7788(01)00058-5.
United Nations. 2014. “World Urbanization Prospects,” http://esa.un.org/unpd/wup/Publications/Files/WUP 2014-Report.pdf.
Ward, G.J. 1994. “The RADIANCE Lighting Simulation and Rendering System.” In Proceedings of the 21st Annual Conference on Computer Graphics and Interactive Techniques.
Appendix Table A1: Thermal Model and RETV Properties
Name U-value (W/m2-K)
SHGC SC (film)
Exterior Walls (concrete 0.20 m)
3.73 -- --
Window mullions 5.00 -- -- Window glazing (single pane plus coating)
5.91 0.40 0.496
Adiabatic surfaces (concrete 0.15)
-- --
Figure A1: Internal Gains from Occupancy, Lighting and Equipment Used in Thermal Simulations to
Approximate a Living Space
Table A2: Daylight Model Reflective and Transmissive Properties
Material Name Visible Reflectance (%) Floors 40 Ceilings 80 Walls and Doors 50 Exterior Shading Devices 40 Mullions 35 Ground Plane 20 -- Visible Transmittance (%) Glass 65
Table A3: Radiance Simulation Parameters
Radiance Ambient Parameter Value Bounces (ab) 7 Accuracy (aa) 0.1 Divisions (ad) 4096 Resolution (ar) 512 Supersamples (as) 1024