analysis of a campus-wide wireless network david kotz kobby essien dartmouth college september 2002
TRANSCRIPT

Analysis of a Campus-wide Wireless Network
David Kotz
Kobby EssienDartmouth College
September 2002

But how do people use it?How to design Wi-Fi networks?How to deploy Wi-Fi networks?
Wi-Fi is becoming pervasive

Dartmouth College

5,500 students3,330 live on campus40% own laptops

Class of 2006 just arrived88% own Wi-Fi laptops;100% of MBA students do
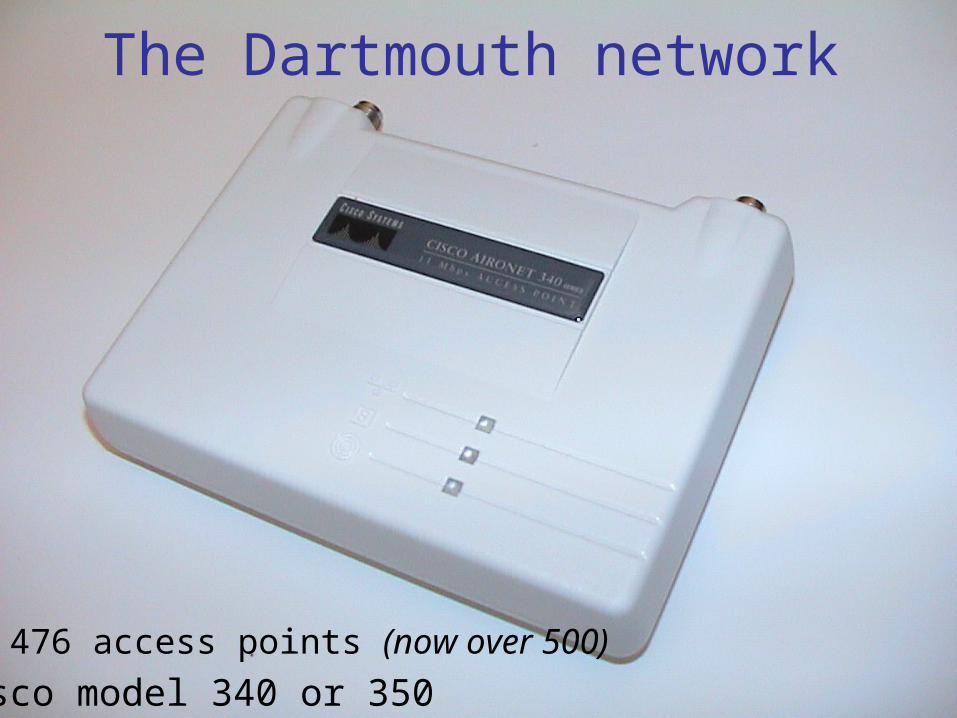
The Dartmouth network
476 access points (now over 500)Cisco model 340 or 350

• Complete Wi-Fi coverage• 200 acre campus• 161 buildings
– 82 Residential
– 32 Academic
– 22 Administrative
– 6 Library
– 19 Social
Dartmouth campus

The largest Wi-Fi study
• Fall 2001• Wi-Fi at Dartmouth• 11 weeks• Over 1700 users• Diverse population• 161 buildings• 476 access points• Campus-wide coverage
[Hutchins and Zegura]• Wi-Fi at GA Tech• 20 or 7 weeks• 444 users• Diverse population• 18 buildings• 109 access points• Partial coverage
[Balachandran 2002]• Wi-Fi at SIGCOMM• 2.5 days• 195 users• Computer scientists• One room• 4 access points• Small sample
[Tang and Baker 2000]• Wi-Fi at Stanford• 12 weeks• 74 users• Computer scientists• 1 building• 12 access points• Small sample

Data Collection

1: Syslog data collection
• AP reports interesting events– Authenticate– Associate– Deauthenticate– Disassociate
• Record date, time, MAC, AP name
• Sent by access point to syslog recorder

2: SNMP data collection
• Every 5 minutes, poll each AP
• Record:– MAC of associated clients– Counter: inbound bytes– Counter: outbound bytes
Inbound
Outbound
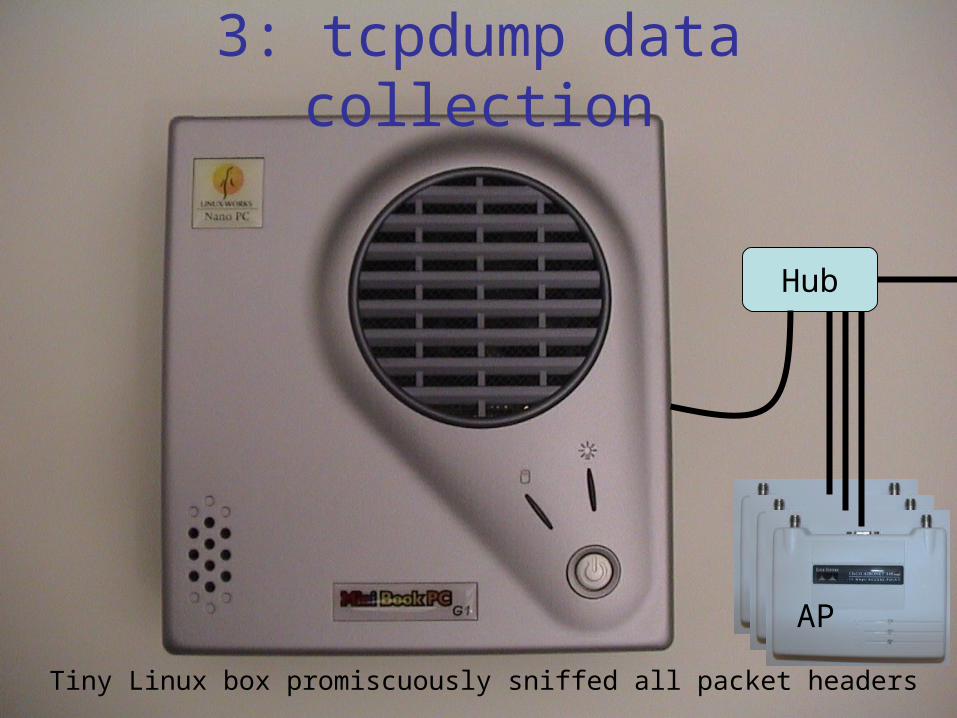
3: tcpdump data collection
Tiny Linux box promiscuously sniffed all packet headers
Hub
AP

ResultsTraffic

Daily traffic (GB)Daily traffic (GB)
Median: 53 GB/day

Average daily traffic, by weekdayAverage daily traffic, by weekdayG
B/d
ay

Average hourly traffic, by hourAverage hourly traffic, by hour
To 11.4 GB (60% inbound)
GB
/hou
r
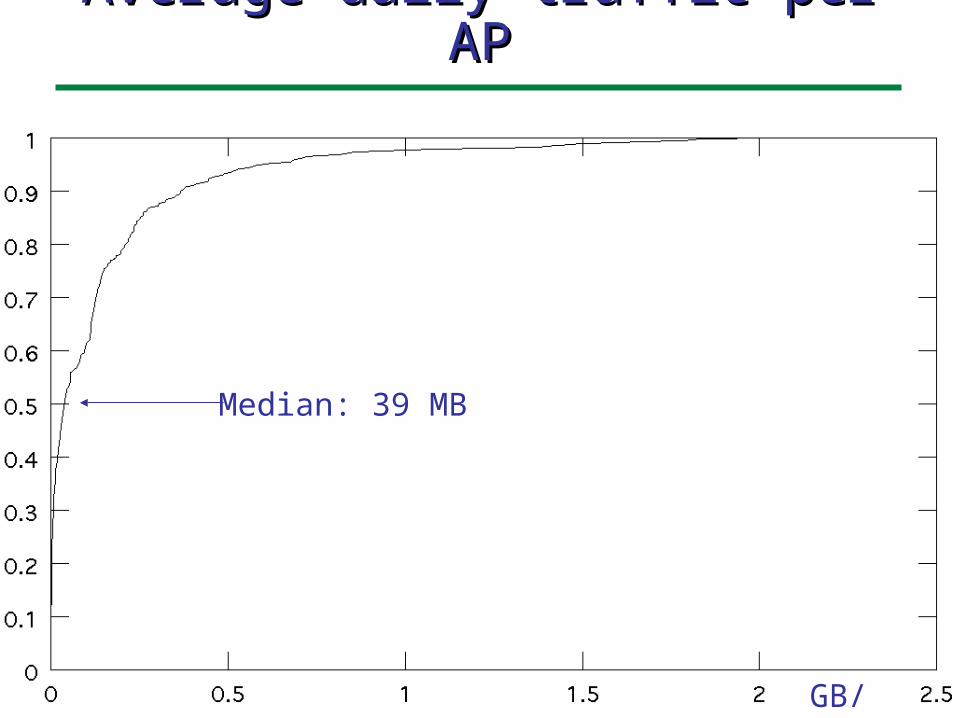
Median: 39 MB
Average daily traffic per APAverage daily traffic per AP
GB/day

Average daily traffic (GB)Average daily traffic (GB)(by category)(by category)
GB
/day

GB
/day
/car
dAverage GB/day Average GB/day per cardper card
(by category)(by category)
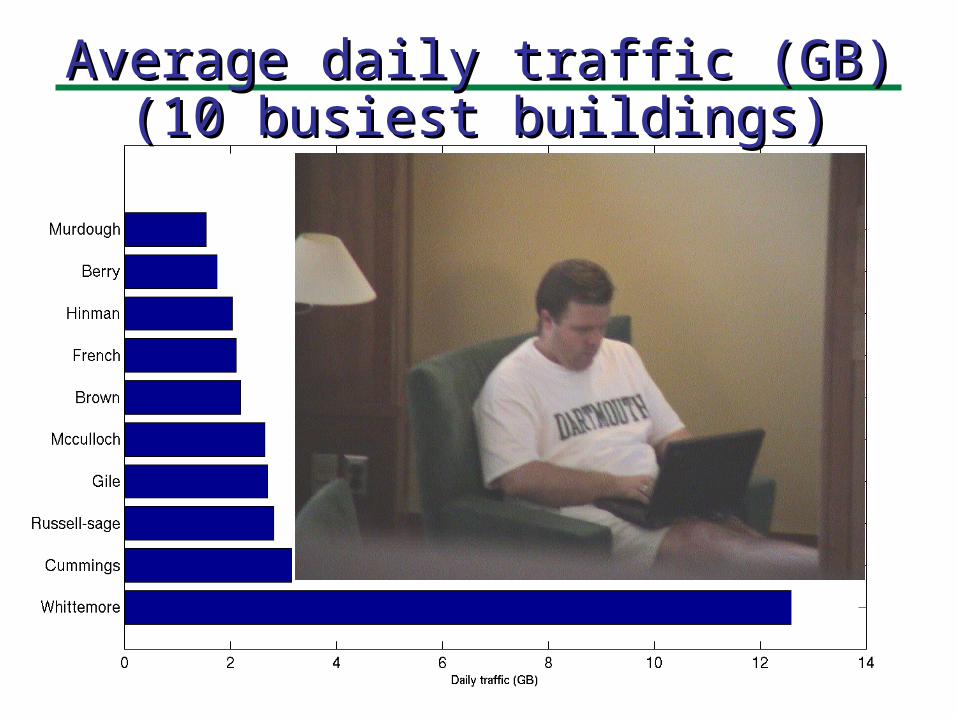
Average daily traffic (GB)Average daily traffic (GB)(10 busiest buildings)(10 busiest buildings)

ResultsSessions

Sessions
timeAss
ocia
ted
Rea
ssoc
iate
d
Dea
uthe
ntic
ated
Session duration 30 mins

Session lengthSession length
Hours
Median session length is 16.6 minutes

Flickering sessions
timeAss
ocia
ted
Reassociated
10 seconds

Max: 19,902Median: 2
Roams per sessionRoams per sessionPlot of the 18% of sessions that involve at least one roam

ResultsUsers

Maximum: 77 days, 64 buildings, 161 APsMedian: 28 days, 5 buildings, 9 APs
Activity per card (distribution)Activity per card (distribution)

Active cards per dayActive cards per day

Active cards per hour (category)Active cards per hour (category)

ResultsProtocols

Brown (dormitory)

Berry Library

Collis Student Center
Sudikoff Lab for Computer Science
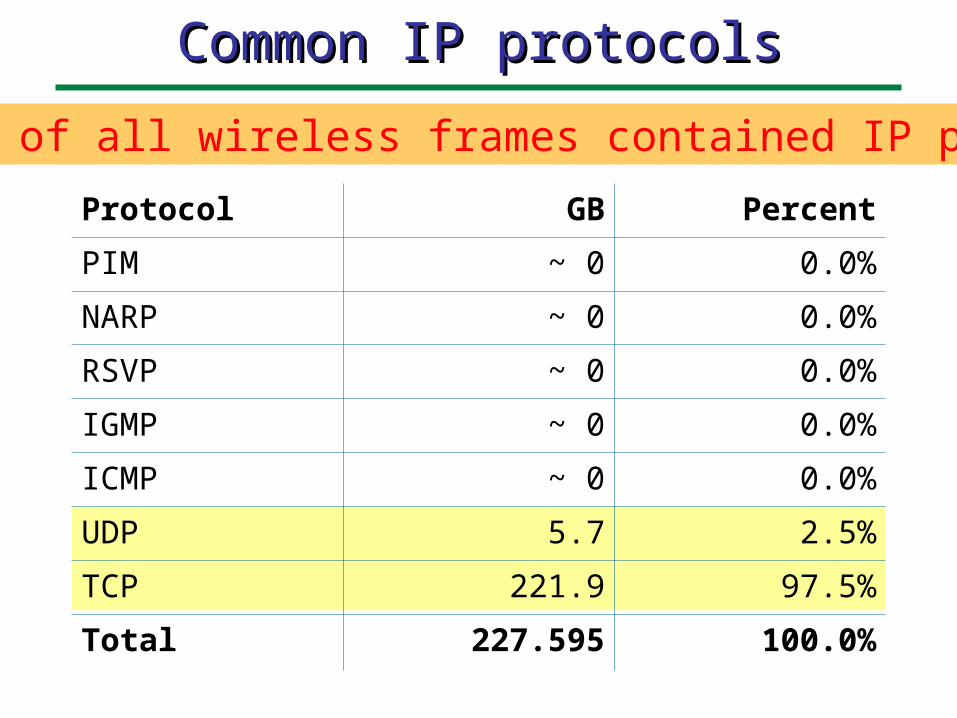
Common IP protocolsCommon IP protocols
Protocol GB Percent
PIM ~ 0 0.0%
NARP ~ 0 0.0%
RSVP ~ 0 0.0%
IGMP ~ 0 0.0%
ICMP ~ 0 0.0%
UDP 5.7 2.5%
TCP 221.9 97.5%
Total 227.595 100.0%
99.7% of all wireless frames contained IP packets

TCP and UDP traffic (GB)TCP and UDP traffic (GB)(by building)(by building)
These top ten account for 85% of traffic

TCP and UDP trafficTCP and UDP traffic(by direction)(by direction)

TCP connectionsTCP connections(by building)(by building)

TCP connectionsTCP connections(by direction)(by direction)

Correction: Figures 27-28Correction: Figures 27-28
Dartmouth College Computer Science
Technical Report TR2002-432
http://www.cs.dartmouth.edu/~campus/
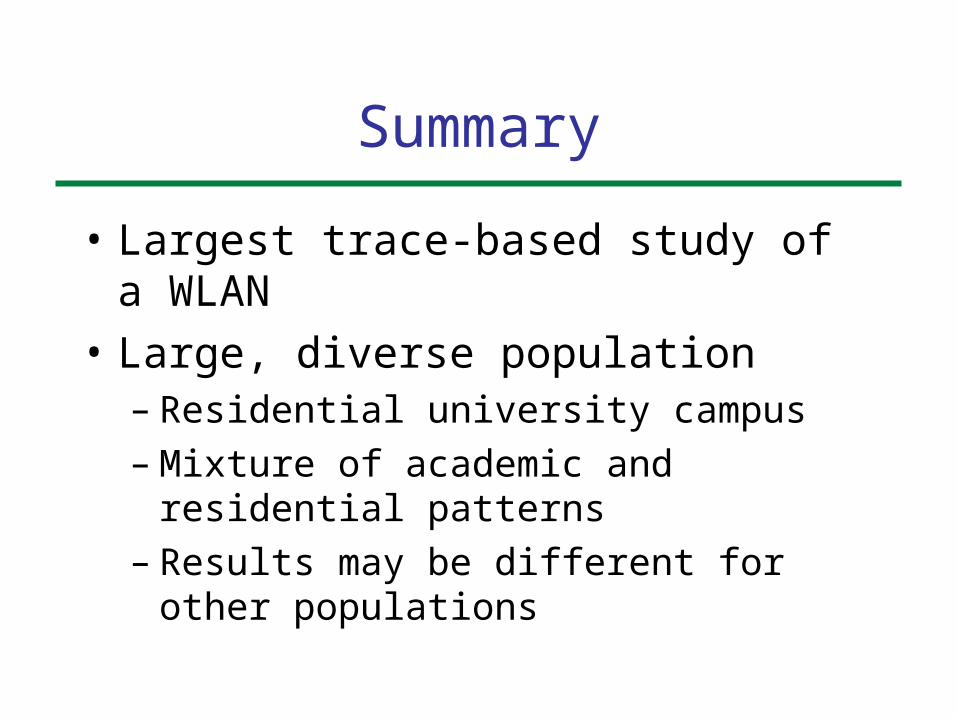
Summary
• Largest trace-based study of a WLAN
• Large, diverse population– Residential university campus– Mixture of academic and residential patterns– Results may be different for other populations

ConclusionsConclusions
• High variance in traffic and activity– From day to day, hour to hour– From place to place, user to user
• No clear dominance of inbound or outbound – Varies by protocol and user
• Dormitories dominated traffic– Especially the Tuck School of Business
• We need:– Cards that avoid roaming across subnet boundary– Support for roaming across subnets (Mobile IP, etc)– Symmetric bandwidth– Full-campus coverage: critical to acceptance

Thank you

David KotzKobby Essien
http://www.cs.dartmouth.edu/~campus/