analysis for improving warehouse data entry quality …
TRANSCRIPT

i
ANALYSIS FOR IMPROVING WAREHOUSE DATA
ENTRY QUALITY IN PT X USING DMAIC APPROACH.
By
Fahmi Sinergia
ID No. 004201400022
A Thesis submitted to the Faculty of Engineering President
University in Partial Fulfillment of the Requirements of Bachelor
Degree in Engineering Major in Industrial Engineering
2019

ii

iii
iv

v
ABSTRACT
As one of the biggest remanufacturing company in South-East ASIA, PT.X owns 12
warehouses all across Indonesia to fulfill the customer demand. In order to fulfill the
customer demands, PT.X have several supplier contracted to supply the part required
according to the needs. PT.X have an agreement with the suppliers that the ordered item
have to be paid within two weeks of arrival or PT.X would have to pay a penalty which is
10% of the item price. Currently, the process and the result of data entry in PT.X is not
optimal yet, since there is still a late payment which cause PT.X to pay additional cost to
the supplier as penalty for exceeding the agreed period. The penalty accumulates to total
between IDR 150,000,000 to IDR 500,000,000 each month for the period between March
2018 to November 2018 and from the observed data it is discovered that there is 1482
field that is incomplete. The objective of this research is to find the solution to the current
situation which will minimize the penalty paid by decreasing the data defect.
The method used to conduct this research is “Define, Measure, Analyze, Improve and
Control” (DMAIC) since DMAIC is well known to be used to improve system especially
when the existing system does not perform optimally. After possible improvement is
done, several ways to control and ensure the company will not return to their “old way”
of managing data entry. It is predicted that if the improvement followed properly, data
quality in PT.X will improve by at least 60.5% after a year of implementation.
Keywords: Six Sigma, DMAIC, Data Defect. Warehouse, Penalty Cost.

vi
ACKNOWLEDGEMENT
Praises and thank to Allah S.W.T, the Almighty God, for all his help so I am able to
finish this thesis and study program despite the hard effort and long time. For this chance
also I would like to say thank you to every people who given their help, motivation and
keep reminding me to finish this thesis, they are:
1. Ir. Andira Taslim M.T, the Head of Industrial Engineering of President
University.
2. My family for supporting me in any situation.
3. Johan Krisnanto Runtuk, S.T., M.T, as the thesis advisor who has given his
valuable guidance, motivation, suggestion and help during the thesis writing
process.
4. PT. X for giving me the internship chance as working experience and opportunity
to gather the material for thesis writing.
vii
Contents
THESIS ADVISOR ........................................................................................................ ii
RECCOMENDATION LETTER................................................................................... iii
DECLARATION OF ORIGINALITY ........................................................................... iv
ABSTRACT ....................................................................................................................v
ACKNOWLEDGEMENT ............................................................................................. vi
LIST OF FIGURE ......................................................................................................... ix
LIST OF TABLE .............................................................................................................x
LIST OF EQUATION .....................................................................................................1
CHAPTER 1....................................................................................................................1
INTRODUCTION ...........................................................................................................1
1.1 Problem Background. .............................................................................................1
1.2 Problem Statement. ................................................................................................2
1.3 Objectives. .............................................................................................................2
1.4 Scopes ....................................................................................................................2
1.5 Assumption ............................................................................................................3
1.6 Research Outline. ...................................................................................................3
CHAPTER 2....................................................................................................................4
LITERATURE STUDY ..................................................................................................4
2.1 Quality. ..................................................................................................................4
2.3 Six-Sigma. .............................................................................................................7
2.4 DMAIC. .................................................................................................................8
CHAPTER 3.................................................................................................................. 12
RESEARCH METHODOLOGY ................................................................................... 13
3.1 Theoretical Framework ........................................................................................ 13

viii
3.2 Research Frameworks .......................................................................................... 18
CHAPTER 4.................................................................................................................. 19
DATA ANALYSIS ....................................................................................................... 19
4.1 Current Process .................................................................................................... 19
4.2 Define. ................................................................................................................. 22
4.3 Measure ............................................................................................................... 27
4.4 Analyze. ............................................................................................................... 28
4.5 Improve. ............................................................................................................... 32
4.6 Control ................................................................................................................. 35
CHAPTER 5.................................................................................................................. 38
CONCLUSION AND RECCOMENDATION ............................................................... 38
5.1 Conclusion ........................................................................................................... 38
5.2 Recommendation.................................................................................................. 38
REFERENCES .............................................................................................................. 39

ix
LIST OF FIGURE
Figure 2.1 DMAIC Framework ........................................................................................9
Figure 2.2 Fishbone Diagram ......................................................................................... 11
Figure 2.3 Document Flow Diagram Symbols ............................................................... 12
Figure 3.1 Research Framework .................................................................................... 18
Figure 4.1 Current Process Chart ................................................................................... 19
Figure 4.2 Pareto Chart of Incomplete Data ................................................................... 24
Figure 4.3 Process Flow Diagrams ................................................................................. 25
Figure 4.4 Document Flow Diagram .............................................................................. 26
Figure 4.5 Fishbone Diagram ......................................................................................... 30
Figure 4.6 Proposed New Form ..................................................................................... 34

x
LIST OF TABLE
Table 2.1 Sigma Values ...................................................................................................8
Table 3.1 Problem Defining Question ............................................................................ 15
Table 3.2 Voice of Costumer ......................................................................................... 16
Table 4.1 Terms Used in PT.X ....................................................................................... 23
Table 4.2 Incomplete Data ............................................................................................. 23
Table 4.3 Monthly Data Defect from March 2018 to November 2018 Percentage .......... 27
Table 4.4 Incomplete Data in the Excel Form ................................................................ 28
Table 4.5 Possible Solution for Root Causes .................................................................. 33
Table 4.6 Potential Solution for Potential Root Cause .................................................... 35

1
LIST OF EQUATION
Equation 1 DPMO Calculation ........................................................................................8
Equation 2 Average Data Calculation ............................................................................ 10

1
CHAPTER 1
INTRODUCTION
1.1 Problem Background.
Data documentation is one of the earliest and the most important things in both
manufacturing company and service company. Documented data quality will determine
the quality of the next steps of company process. According to Evans and Lindsay
(2005), quality management requires detailed planning and administrative activities to
reach planned outcomes through high-level performance in both value production and
every other process. By having a good quality of data with minimal error, not only it will
ensure the process of the system, it will also make it possible for more accurate forecast
and improvement that can be done to the current process. The most common data entry
process done in almost every company is to input the data to excel and then input the data
from excel to data sharing software in the said company.
PT. X is a company that focuses on remanufacturing heavy equipment component. PT. X
itself has 12 warehouses for housing the spare parts, plants needs and finished goods
which located all over Indonesia. Each warehouse support the plant that is located in the
same area as the said warehouse located. What differentiate remanufacturing from
manufacturing is, remanufacturing focuses on fixing the goods instead of making a new
one. Simply put, remanufacturing is to repair the damaged heavy equipment to match at
least 80% of the new heavy equipment performance.
One of the current problems that PT.X facing is the related to the on-time payment to the
vendor. The current regulation for the program used in PT.X for payment to vendor
requires the warehouse data columns to be filled to allow the system to process the
payment to vendor. If there is an empty columns, the system will not be able to give
clearance to accounting department regarding the payment. As result of lateness in
payment, the company has to pay additional cost to the vendor. The penalty for the
lateness is 10% for each PO which accumulate to total between IDR 150,000,000 to IDR

2
500,000,000 each month for the period between March 2018 to November 2018. The cost
spent in paying the additional cost will determine the quality of warehouse data
documentation. To decrease the cost, the data entry should be improved to reduce the
lateness in payment.
This research aims to minimize the lateness caused by incomplete data input in the
warehouse. In order to find the problem root cause, current condition of the data input
will be analyzed. Previous research conducted by Ali et al. in 2011 titled shown that there
is an improvement of data entry error averaging 60.5% for the period of 12 months at the
laboratory of The Uganda Makerere University that saves an estimated $50,115 a year.
Based on the previous research result, DMAIC method is used to review and find the
possible solution to the problem
1.2 Problem Statement.
This research is done to answer these following questions:
How is data entry for warehouse done in PT.X?
How can the data quality be improved and in what way can the unreliable data
be eliminated?
1.3 Objectives.
There are several objectives that need to be achieved which are:
To know how the current data input have been done so far.
To determine the way of improving the current data entry using DMAIC
method.
1.4 Scopes
Due to the limited time and resources in doing this research, there will be some
scopes in this observation:
The data gathered taken from March 2018 to November 2018 in PT.X.
The data taken is only from warehouse for Timika plant.
The historical data taken is the data recorded in warehouse during from 1
March 2018 to 13 November 2018.
3
1.5 Assumption
The number of warehouse worker is constant.
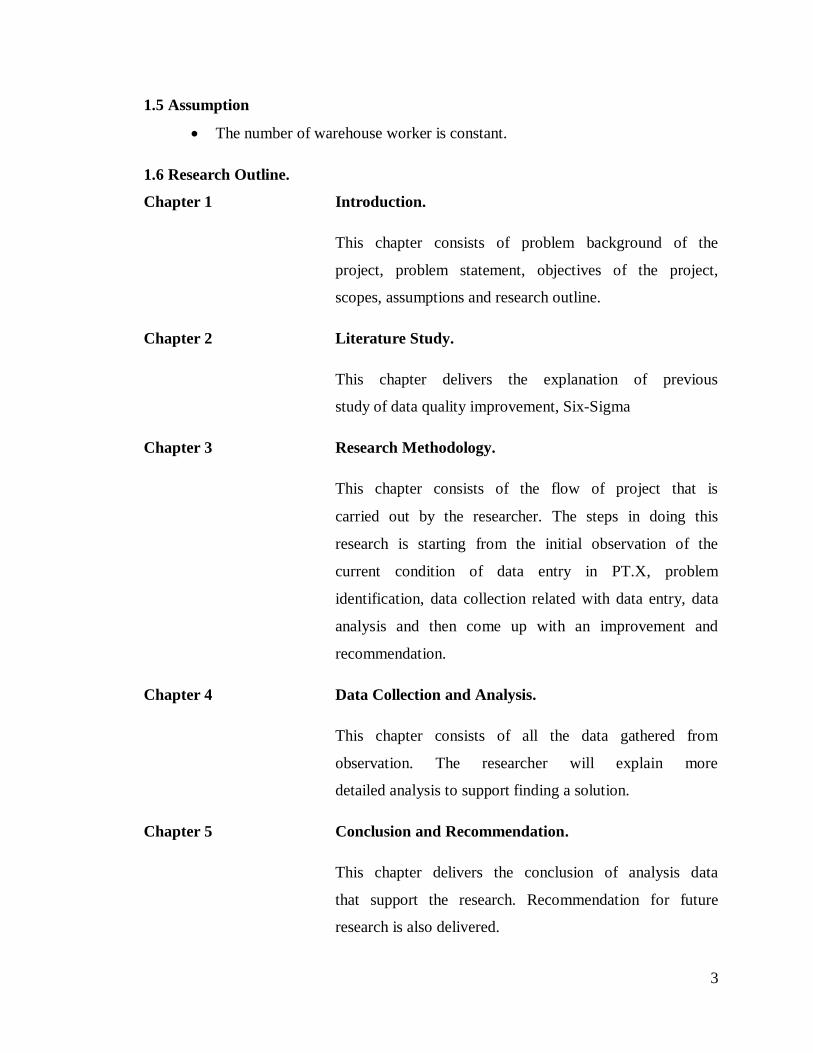
1.6 Research Outline.
Chapter 1 Introduction.
This chapter consists of problem background of the
project, problem statement, objectives of the project,
scopes, assumptions and research outline.
Chapter 2 Literature Study.
This chapter delivers the explanation of previous
study of data quality improvement, Six-Sigma
Chapter 3 Research Methodology.
This chapter consists of the flow of project that is
carried out by the researcher. The steps in doing this
research is starting from the initial observation of the
current condition of data entry in PT.X, problem
identification, data collection related with data entry, data
analysis and then come up with an improvement and
recommendation.
Chapter 4 Data Collection and Analysis.
This chapter consists of all the data gathered from
observation. The researcher will explain more
detailed analysis to support finding a solution.
Chapter 5 Conclusion and Recommendation.
This chapter delivers the conclusion of analysis data
that support the research. Recommendation for future
research is also delivered.

4
CHAPTER 2
LITERATURE STUDY
2.1 Quality.
W Edwards Deming, an American engineer, statistician, professor, author, lecturer, and
management consultant stated that by following certain theory of the management,
organizations will be able to improve the quality of the product while simultaneously
reduce costs. Cost reduction must also include the waste reduction, minimizing staff
turnover rate while simultaneously increasing the number of loyal costumer. In the 1970s,
some of Deming's Japanese supporter makes a summary of his philosophy into a two-part
resemblance: (1) organizations should give more priority to quality, which is defined by
the equation ‘Quality = Results of work efforts/total costs’. If this is achieved, quality
will improves, and costs spent will drop over time and (2) when organizations' mainly
focuses on costs, the costs will rise, but on the long term the quality drops.
2.2 Data Quality.
Data entry is an activity that has to be done in every company to record the data of the
activity done. Data entry of previous period activity will be a historical data for the
company. Historical data itself will be used to forecast the future demand and find out
what is the problem with the current process. By having a good data entry quality, the
historical data will enable better forecasting and future improvement. The most common
understanding of "Data Quality" is a data which is described "Fit-for-use" (Wang &
Strong, 1996). Data with mistakes will result in declining in the effectiveness and
competitive ability of the company as well as service level and other services directly and
indirectly.
The average recognized cost of poor data quality might accumulate up to 10% of
organizations’ total earning, according to a 1998 survey done by New Zealand and
Australian organizations (Malcom, 1998). Gartner have found that in 2005, Fortune 1000
companies would have to spend more money in operational inefficiency because of data
quality issues than they will spend on data warehouse and customer relationship

5
management initiatives’ (Dubois, 2003).. At an Information Quality Conference in 2002,
a telecom company disclosed that it regained over $100 million in "scrap and rework"
costs, a bank said to have regained $60 million, and a government agency regained
around $28.8 million on an initial funding of $3.75 million. Data quality is considered to
be a high-quality data if the data able to meet the requirement needed by the costumer.
When data categorized as excellent quality, it will improve the process and can be
analyze easily, leading to possibility for the organization to make a better decision. High-
quality data is important for business intelligence networks and other types of data
analysis, as well as higher operational efficiency.
According to Sid Adelman et al. (2005), because most organizations have a lot data that
require rework to be usable, they must establish guidelines about which dirty data that
have to be prioritized for rework. By having a guideline to categorize and prioritize
which data is crucial for the business system, the data can be sort to determine which data
is critical to the organization, which is important but not critical, and which is nice to
have but relatively insignificant to the business
2.2.1 Dirty Data
According to Margaret Chu (2004), Dirty data, also known as rogue data, are
inaccurate, incomplete or inconsistent data. Dirty data might contain such mistakes as
spelling or punctuation errors, incorrect data associated with a field, incomplete or
outdated data. Having high number of dirty data in a process will force the
stakeholder related to the process to rework the data for the process to proceed
smoothly. By having to reworking the data continuously, not only it will takes time it
will also cause the company to spent more expenses to paid the overtime pay.
2.2.2 Data Quality Dimensions.
The concept of data quality is defined by several requirements, usually mentioned in
data quality studies as quality properties or data characteristics. Wang et al (Wang et
al., 2001) defined the requirement of data quality as ‘a set of data quality attributes
that most data consumers react to in a fairly consistent way’. This data quality
requirement is adhere to previous empirical research (Zmud, Lind, & Young, 1990).

6
Modern definitions of data quality have a looser definition and many more attributes
compared to the traditional characteristics of accuracy. Ballou and Tayi (Ballou &
Tayi, 1999) described that four dimensions of data quality are being accurate,
complete, consistent, and in time. These four dimensions of data quality is agreed as
the main dimensions even when there is no general agreement on data quality
dimensions and this is still the case today (Wand & Wang, 1996).
Accurate
Data accuracy is an important aspect of data quality. A company’s planning,
forecasting, spending and all such activities are depended on the accuracy of the
data. By having an inaccurate or incorrect data, it will hinder the entire business
system. There are two factors related to data which needs to be taken care of:
1. The data entered have to be in the right value.
2. It must be correctly presented in a consistent manner following the expected
data standards in the business field.
Data Completeness.
In order for information to be useful it needs to be complete. If a part of the
information is missing then it might cause the data to be unusable or the decision
made related to the said data will not be accurate.
Data Consistency.
Data consistency is important to the program well-being, applications, systems
and databases. Data consistency means that data values are the same all across the
system, meaning that the data is not changed during processing or transfers.
Data Timeliness.
Timeliness refers to the time expectation for the accessibility of data. By having a
data that available as soon as possible, it will ensure the next process will be able

7
to start faster. On the other hand, if the data availability took a long time, the next
step will not be able to start since it have to wait for the data to be available.
2.3 Six-Sigma.
Six Sigma is a set of method used to improve a process. It was introduced by
engineer Bill Smith while working at Motorola in 1980. Harry and Schroeder (2000), in
their popular book that discuss about Six Sigma, described it as a
‘‘business process that enable organization to drastically improve their weakest link
by planning and controlling everyday business activities in ways that will decrease
waste and resources used while increasing customer satisfaction’’. Hahn et al. (2000)
defined Six Sigma as a consistent and data based approach aiming to imcrease product
and/or process quality. Meanwhile, Sanders and Hild (2000) described it as a
management strategy that might require a shift in the current company ways of doing
things.
Simply put, costumer would be satisfied if they received the quality of the goods at the
same value as they expected. If the product (service or goods) is on the six-sigma
performance level, company defect per million opportunities (DPMO) of 3.4 percent or
99.99966 percent from what customer’s expect from the company. According to Tennant,
Geoff (2001). The 3.4 DPMO is based on a "shift" of +/- 1.5 sigma created by the
psychologist Dr Mikel Harry. Therefore, six sigma can be used to measure how well the
product. The higher the sigma values achieved, the better the performance of industrial
processes. The table below shows the sigma value that is measured based on the
percentage of COPQ (Cost of Poor Quality) to sales value.

8
Table 2.1 Sigma Values
Calculation of DPMO values is done as follows:
Equation 1 DPMO Calculation
Motorola University Six Sigma Dictionary stated that Six Sigma's indirect goal is to
improve all processes, but not necessarily to the 3.4 DPMO level. Organizations would
have to determine an appropriate sigma level for each of their most important processes
and aims to achieve these levels. To achieve the desirable DPMO level, each organization
should prioritize to improve every process related to the company.
2.4 DMAIC.
Hammer (2002) simply describe the definition of Six Sigma as a project based
methodology that aims to solve specific performance problems recognized by an
organization mainly related to quality improvement and reducing cost. The most well
known method to implement six sigma is DMAIC process. DMAIC refers to a data-
driven improvement cycle used for improving, optimizing and stabilizing business
processes and designs. However, DMAIC is does not necessarily belong to Six Sigma
and could be used for the base for other improvement applications.

9
Figure 2.1 DMAIC Framework
As shown in the figure above, DMAIC consist of five main steps. All of the DMAIC
process steps are required and always proceed in the given order. Those steps are;
2.4.1 Define.
The purpose of this step is to identify the goal and scope of the project, by getting
the basic understanding of which process to be improved, and to determine
understanding and expectations for quality. All these steps will ensure everyone
related in this research are all on the same page regarding what is to be done. This
step will be done by doing steps follows:
1. Define the problem by asking the employee related to the warehouse
management logistic in PT.X.
2. Determine what should be done to solve or minimize the occurrence
frequency based on the observation and analysis.
3. Setting objective of Six-Sigma based on the research.
2.4.2 Measure
The goal of this step is to establish current baselines as the reference for
improvement. This step is a data gathering step and the purpose of this step is to
decide process performance baselines. Good data is the heart of the DMAIC

10
process. The measurement phase is done through two stages using data taken
from March 2018 to September 2018 as follows:
Population or sample collection.
Population taken for the analysis is the amount of data recorded in the system
related to outbound expedition in PT.X to Timika during March 2018 to
September 2018
Calculate the average of dirty data.
Dirty data is the incomplete data that will cause the process related to the payment
for the warehouse item getting delayed. The average number of dirty data can be
found by:
Equation 2 Average Data Calculation
2.4.3 Analyze.
The goal of this step is to identify, validate and choose which root cause should be
prioritized for improvement. This process is repeated until "relevant" root causes
can be identified. Within Six Sigma, usually complex analysis tools are used.
However, it is also reasonable to use basic tools if these are adequate. During the
analyze phase, Fishbone diagram is used to help identify and organize the
potential root cause for data entry errors. Subsequently, the researcher, in
collaboration with everyone related to data entry process trying to identify the
potential root causes and brainstormed possible solutions
Fishbone Diagram.
A fishbone diagram, also known as cause and effect diagram or Ishikawa
diagram, is a tool used to categorize the possible causes of a problem in order to
identify its root causes. The design of the diagram looks like a skeleton of a fish.

11
Fishbone diagrams usually worked from right to left, with each large "bone" of
the fish branching out to include smaller bones adding more detail.
Figure 2.2 Fishbone Diagram
2.4.4 Improve.
The purpose of this step is to identify, test and issuing a solution to the problem;
in part or in whole depending on the situation. Identify creative solutions to
eliminate the key root causes in order to fix and prevent process problems.
2.4.5 Control.
The purpose of this step is to embed the changes and ensure sustainability to make
sure there won’t be any mistakes that leads to repeating the past failure. Jing and
Li (2004) stated that the mental understanding of this approach is that the
important process input variables are reduced to important few, with the goal of
having control of the most important ones will grasp a good understanding of the
whole process. DMAIC is commonly used when a product or process is already in
progress for a certain period but performing unsatisfactory. According to De Feo
and Banard (2004), DMAIC focuses on decreasing non-productive steps,
developing and applying new approach, and using technology to enable
improvement.

12
2.5 Document Flow Diagram
Document flow diagram is an improvement tool that explain how the document flow in a
system. There are several symbols used to represent the document whether it is manual or
automatic.
Figure 2.3 Document Flow Diagram Symbols

13
CHAPTER 3
RESEARCH METHODOLOGY
This chapter contains the procedure and the phase of the entire process in
completing the research. The flow process in this chapter will become a guidance
to do the research so the objectives of this research are reached.
3.1 Theoretical Framework
Observation
Problem
Identification
Literature Study
Data Analysis
Conclusion and
Recommendation
Observation.
Defining the research target.
Conducting initial observation in
warehouse at PT.X.
Collect and sort the data.
Problem Identification
Identify the problem and current
background.
Define the objective of research, scope
and assumptions
Literature Study
Data Quality
Six Sigma
DMAIC
Data Analysis
Define the problem statement.
Measure the data.
Analyze the root cause.
Improve the conditions by performing
potential solution.
Control and monitor the future condition.
Conclusion and Recommendation
Conclusion based on analysis and
calculation for the research.
14
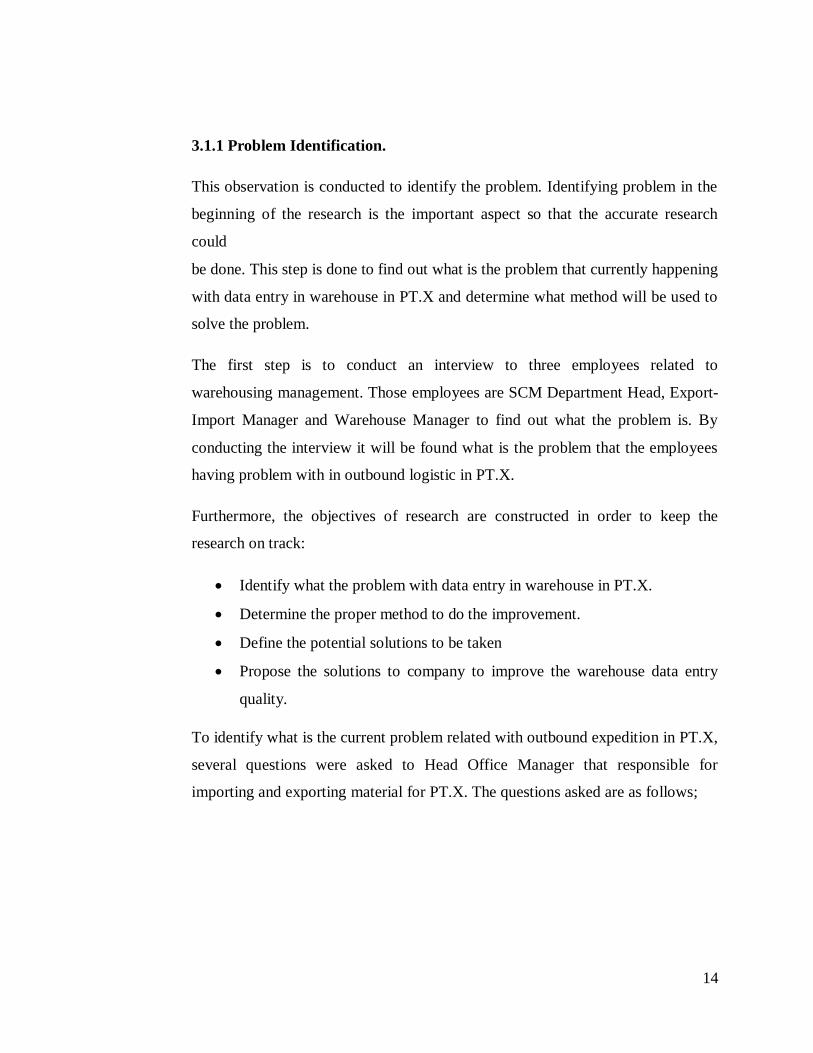
3.1.1 Problem Identification.
This observation is conducted to identify the problem. Identifying problem in the
beginning of the research is the important aspect so that the accurate research
could
be done. This step is done to find out what is the problem that currently happening
with data entry in warehouse in PT.X and determine what method will be used to
solve the problem.
The first step is to conduct an interview to three employees related to
warehousing management. Those employees are SCM Department Head, Export-
Import Manager and Warehouse Manager to find out what the problem is. By
conducting the interview it will be found what is the problem that the employees
having problem with in outbound logistic in PT.X.
Furthermore, the objectives of research are constructed in order to keep the
research on track:
Identify what the problem with data entry in warehouse in PT.X.
Determine the proper method to do the improvement.
Define the potential solutions to be taken
Propose the solutions to company to improve the warehouse data entry
quality.
To identify what is the current problem related with outbound expedition in PT.X,
several questions were asked to Head Office Manager that responsible for
importing and exporting material for PT.X. The questions asked are as follows;

15
Table 3.1 Problem Defining Question
The next step done to identify the problem is using Voice of Costumer (VoC) to
understand the costumer and stakeholder related to outbound expedition better.

16
Table 3.2 Voice of Costumer
After identifying problem of the research, the objective, scope and assumptions
can be determined. The scope of this research is the data only taken from
historical data to Timika from 1 March 2018 to 13 November 2018.
3.1.2 Literature Study.
The literature study of the research is taken from journals and books. The
literature study used for the resource to review the materials relevant with the
study and as the supporting theories for the research. Theories can be used as a
guidance during observation.
The literature study in this research is used based on the topic case where the
problem are identified, which are:
Quality to understand the general means of quality.
Data quality literature which defines what is the general understanding of
data quality and its dimensions.
DMAIC which define the method to solve the problem.
3.1.3 Data Collection.
The data collected for the research take from the observation done in PT. X for
seven months to analyze the problem related with inbound and outbound logistic

17
to Timika. Timika is chosen because it is the farthest one and still has a lot to
improve. The data collected are:
Goods received and sent to Timika from March 2018 to November 2018
Current problem with data entry in warehouse according to SCM
Department Head, Export-Import Manager and Warehouse Manager
3.1.4 Data Analysis.
After the data and observation results collected, the further data processing and
analysis can be run. The steps to analyze the data are:
Define: In this stage, the problem statement of the research is determined.
This stage not using much statistical data and calculation. The shipping
data from March 2018 to November 2018 is shown. The data is inspected
to find out whether the problem found in the data is the same with the
problem mentioned by SCM Department Head, Export-Import Manager
and Warehouse Manager
Measure: this stage is a stage of reformulating the problem and initiating a
search for root causes with the stages of planning and retrieving data and
calculating the current performance and identifying opportunities for
improvement.
Analyze: this stage is a stage of searching and determining the root causes
of problem
Improve: after root causes of problem have been identified, improvement
needs to be taken by specifying the solution
Control: this stage is a phase of controlling the process performance to
prevent the repetition of the same problem.
3.1.5 Conclusion and Recommendation.
The final step of this research is to draw a conclusion from the data and analysis
result obtained to achieve the research’s objectives. The recommendation for will
be presented after the conclusion have been drawn. The recommendation can be

18
used for the others in the future who would like to conduct the research with same
topic as the references to make a better improvement.
3.2 Research Frameworks
Figure 3.1 Research Framework

19
CHAPTER 4
DATA ANALYSIS
This chapter will be discussing about the data processing which covers the data
collection, data calculation and analysis or the interpretation of the data. The
method used is Lean Six Sigma. Lean used to reduce the data defect quantity in PT.X and
Six Sigma which is DMAIC method used to increase the process performance. DMAIC is
commonly used to see the improvement of progress and
control the improvement to be sustained.
4.1 Current Process
Currently, PT.X have a warehouse near head office to receive items from vendors. Figure
below will show how the warehouse in PT.X works
Figure 4.1 Current Process Chart
The step-by-step explanation of the process will explain the process in detail.
1. Receive item on the receiving dock.
Upon receiving the item in the receiving dock, employee will do a simple
inspection on the package. The things to check on this stage are item

20
description, vendor name, vendor/ shipper contact and receiver name and
contact.
2. Sign the documents.
After the details are confirmed, the employee will sign the document to
confirm that PT.X have received the item. After that, the employee will
write the receiving date in the logbook.
3. Move item to the loading dock.
After the document is signed the employee will use forklift to move the
item from receiving dock and move it to the loading dock. The item will
be place in queue for checking. The priority is FIFO (first in first out) with
exception if the item described as urgent then the urgent item will be
prioritized.
When the item is about to be checked, the employee will print a quality
inspection (QI) form and packing list contain the item details. The form
will be passed to the quality control PIC (person in charge0.
4. Check the item for defect
The next step is to check the item for defect. The defects that must be
checked are item description, item number and item condition. If there is
any scratch or the item description and quantity does not match the
description, the vendor will be contacted to replace the item. If the vendor
refuses to replace the item, the company will not order from the said
vendor anymore and the item will be scrapped.
After the item is checked, the QI (quality inspection) form and the packing
list will be returned to the PIC (person in charge). When there is a defect
found, the PIC will be informed and will print a form to claim the defect.
The details of the defect and the inspector name will be written.

21
After the checking is done, the item will be categorized into two; good and defect.
For each category the steps will be explained below.
Good item
1. Input the data to the system.
After the item pass the quality check, the PIC will input the data into the
system, the system will check the item name and match it with the item
demand. The system then will print two labels according to the item
demand. There are two decision; store and send.
a. Store.
The item will be marked with the labels containing item details and
inspection date. After the label is put on the item, the item will be
moved to the storage location called binning storage.
b. Send
If the item is labeled as “send”, the employee will pack the item,fill the
form required and move the item to the RTS (ready to ship) area. The
form consists of item number, type, dimensions and destination. The
form will be passed to traffic PIC so the PIC can find the vendor for
the shipment. Traffic PIC will have to fill the SPB (surat pengiriman
barang) that will be given to the warehouse leader.
Defect item
1. Contact vendor for defect claim.
When the defect is found, the vendor will be contacted and a form for
claiming will be printed. After the detail is confirmed the item will be
moved to RTS (ready to ship) area.
5. Send the item to their respective destination.

22
In this step, all items is under the traffic PIC responsibilities. The traffic
PIC will find the most cost effective shipment and send the item to their
respective area using air shipment to sea shipment according to the
demand.
After all the steps are done, each inspector will input the item details to the system. The
data that required to be completed are “From/Asal”, “PO Number”, “Part Number,
“Description”, “GR DATE”, “SPB Out”, “Manifest out”, “OUT Date”, “Transport” and
“Vesel Name”. The data currently inputted manually. The data will be used by SCM
department to forecast the future demand and by purchasing department and accounting
department to confirm the item and pay the vendor. This research will focus on data
defect which is incomplete since each department said above can only make a proper
decision after all the required data are complete.
4.2 Define.
The first step of DMAIC is define. The purpose of “define” is to determine what to be
checked and find what the problem that needs be solved is. Based on the statement above,
data has to be processed to determine the focus of the research. Data taken from the
company related to the warehouse have several term that is used to categorize the data.
The table below shown the explanation of the term used in the PT.X.

23
Table 4.1 Terms Used in PT.X
The terms above is used as the focus of the research as the any incomplete data on
the terms above will require the employee to complete is before the system able to
process the data. Table below shown the incomplete data from March 2018 to
November 2018.
Table 4.2 Incomplete Data

24
Based on the data above, the pareto chart can be made to sort the types of defect
based on its defect quantity.
Figure 4.2 Pareto Chart of Incomplete Data
Based on the pareto chart above, it shows that GR Date, Vessel Name and
Manifest Out is contributing 80% of the incomplete data. The percentages are
51% for GR Date, 23% for Vessel Name and 7% for the Manifest Out. As the
three biggest contributor for the incomplete data and the company concern since
the incomplete data number is really high, GR Date will be the main concern of
this research.
GR or Good Received is a process of receiving, checking and input the data into
the system. The hardest part of GR is checking since each item must be unpacked
and checked in detailed way to ensure there is no defect in the ordered item before
the GR Date can be filled. Each item have the time limit of checking since after
the item checked, the vendor will be notified whether the item have any defect or

25
not. The time limit is one week from the item received date since after one week
passed, the payment status will be late and the payment penalty will occurs.
4.2.1 Process Flow Diagram
In process improvement, process flow diagram is a tool that summarizes the
process in the form of flow diagram. Process flow diagram will show the general
process done while also shows which department responsible for which actions.
Figure 4.3 Process Flow Diagrams
To help the easier understanding of how the current system works even further,
document flow diagram will be showing how the data procured from process above
move around the related department.

26
Figure 4.4 Document Flow Diagram
The goals of this observation aims for is to have a complete data in the acceptable
time frame. To produce the desired result, there are several factors that are needs
to be considered, which are:
Skillful operator: to produce good quality output, skillful operator is
needed
27
Standardized work method: each operator must clearly understands the
work method used and the method should be standardized so that there
will be no confusion among operators.
Proper inspection method: inspection method used must be made as
optimal as possible to the whole process error can be minimized so there
will not be any need to fix it in the further process.
Enough workforce: since the process is long and require a certain detailed
process, having an understaffed workplace will cause the existing
workforce to cut corner in works in order to meet the deadline.
4.3 Measure
4.3.1 Incomplete Data Calculation.
Data of incomplete data is taken based on month when the data documented and
incomplete data taken from March 2018 to November 2018.
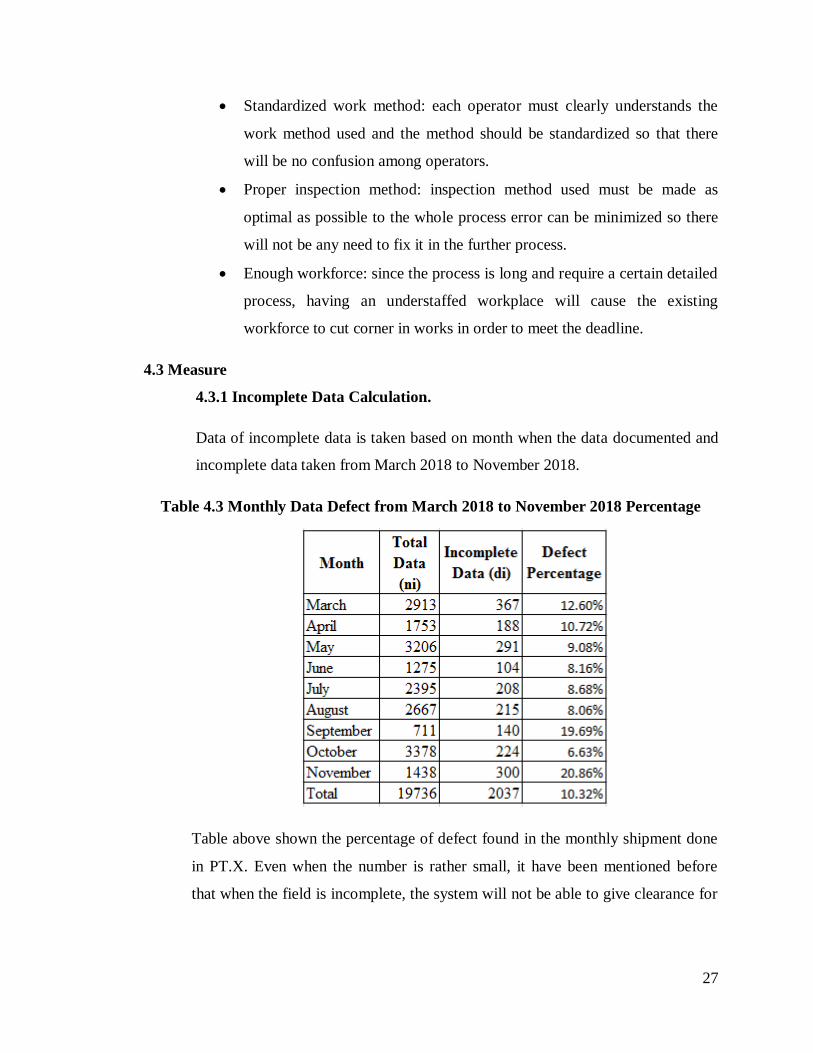
Table 4.3 Monthly Data Defect from March 2018 to November 2018 Percentage
Table above shown the percentage of defect found in the monthly shipment done
in PT.X. Even when the number is rather small, it have been mentioned before
that when the field is incomplete, the system will not be able to give clearance for

28
payment since it is translated as the item have not been checked properly or there
is problem with the item.
Table 4.4 Incomplete Data in the Excel Form
Table above shown what the data input to the excel looks like, out of 16 data
shown above there is only 6 item that have complete data. The rest of data will
not be able to be paid on time since the data uploaded to the system will be
incomplete and the payment will not be allowed, which means out of 16 item
ordered there will be only 6 of them that will be paid on time while 10 of them
will be paid including the penalty cost.
4.4 Analyze.
Analyze stage aims to find the cause of the current problem that is happening by using a
proper analysis tools. This stage is done to further understand the whole process being
observed and to define alternative solutions for solving problem. In this research the
problem is low data quality in warehouse.
4.3.1 Cause and Effect Analysis Using Fishbone Diagram.
The purpose of six sigma implementation is to increase the data quality which
will ultimately increase the company profit since the cost needed to fix the
problem will decrease. To achieve that, improvement needs to be done. Before
improvement is done, further analysis regarding the problem needs to be done.
Analysis and brainstorming is done to find the dominant cause of the problem.
After initial observation in the warehouse is finished, brainstorming is done with

29
the relevant parties. The result of the brainstorm finds that there are several
factors that are causing the problem which will be explained in the fishbone
diagram. Factors causing defect are categorized into five categories which are;
people (the human element), environment, method, machine or equipment and
forms. Data used in the fishbone diagram below is identified as the causes of data
defect.

30
Figure 4.5 Fishbone Diagram

31
Figure above shown the fishbone diagram of the data defect in warehouse. The causes are
categorized into five factors which are people, environment, method, machine/equipment
and forms. Below is the explanation of each factors:
People.
This factor is one of the biggest contributors in data defect because the
process done in the warehouse area related to the data is always done by
human. The operators are not trained enough or not having knowledge of what
is the company demanded regarding the data quality. They assume that every
data is okay as long as there is no complaint from the SCM department while
SCM department have to rework the data to be usable before analyze it. Lack
of training and education from the field leader might be the causes of the
problem.
In addition of lack of training, long working hour also contribute to the cause
of data defect. The shift starts early in 7 a.m. in the morning and finished at 5
p.m. Long working hour causes the employee to lose focus which causes typo
or even skipped the entry. There is also the needs to entry the data to the
computer after item check is done using SAP. Some employee does not know
how to operate the software properly that causes the data defect to increase.
Lastly, since there is a lot of works to be done in one day, the employee get
confused which works should be prioritized. Almost every item listed as
urgent while it is not.
Environment.
The current warehouse design in PT.X is not quite effective since the
placement of receiving dock is so far from the gate while the place for storage
is near the entry. Not only that, the bad airflow causes the warehouse
temperature to be quite high which will cause the employee to lose focus
faster.
Method

32
For receiving the item until the data entry to the system have long steps to
follows especially in the data entry. When there is one mistake in the process,
the most of the process needs to be redone. When there is a high volume of
works, the employee tend to ignore the mistake in hope of next department
will fix the mistake.
Machine/Equipment
In addition to high works volume, some of the equipment does not work
effectively. The computer does not have a program to automatically detect the
errors and the database itself inaccessible once in a while that takes time to
fix.
Forms
For every process, there are forms that are required to be printed and manually
filled. When there is different people filling the forms, it almost certain there
are different handwriting which is unreadable to certain employee. Not only
that, there are some cases where the item details is not listed in the forms
which causes the employee to skip the form altogether.
4.5 Improve.
This stage is related with improving the current problem found after measurement and
data analyzing is done. Some solution is designed to solve, minimize and possibly
eliminate data entry errors by designing experimental solutions using currently available
technology and simple process redesign (Neri et al., 2008). This research focuses on
practical and practical changes that would be easily implemented (high reward and low
risk) and potential changes that require additional resource.
Since the end data is the collective result of each process, every potential root causes
identified in the fishbone diagram should be solved to improve the result quality. The aim
of this process is by eliminating every potential root cause, the end result will have small
to no data defect.

33
Table 4.5 Possible Solution for Root Causes
Root-causes Possible solution
Unclear item forms,
Different people filling the
form, Item data can be
unclear
Ask the costumer (SCM Department) to set
the standard related to the data needed and
share the invoice to the warehouse head.
High workload and staffing
pressure
Schedule more staff as an extra help on days
with high workload. Identify which staff in
the warehouse that able help and give them
a training.
Hot warehouse, Bad
receiving dock placement,
Bad storage placement
Add more ventilation or fan to help and
redesign the placement of receiving dock
and storage placement
Computer does not
automatically detect errors.
Make adjustment to the software to
automatically detect incomplete data and
create a Quality Assurance (QA) position/
role to perform second-check all warehouse
data on the
same evening
Long process to register
the data
Make changes to the current data entry
process related to SAP.
Insufficient training, long
working hour, not being
alert, not enough computer
skill, not knowing which
task to prioritize.
Conduct a well-designed training program
for warehouse data entry employee.
Develop data entry error charts/graphs for
individuals and entire group, give positive
feedback on daily and monthly
performance.
Unclear forms.
Currently the form is just an empty table that the employee filled by hand
writing of each item details. To improve this situation, new form should be
issued where the forms contain necessary details required to be checked.

34
Figure 4.6 Proposed New Form
The figure above will be the proposed new form that will replace the current handwriting
form. The data required will be shared by SCM department to the system and warehouse
will print it, The only field that warehouse department need to fill is “Status” field that
will be filled by “GOOD” if the item match the details and “CLAIM” if the item does not
match the required standard and need to file claim to the vendor.
There is also some potential root-cause that solving it will help in improving the end
result of data quality. Potential root cause here is made by determine what could
happened and from a rare occurrence according to the employee experience.
35
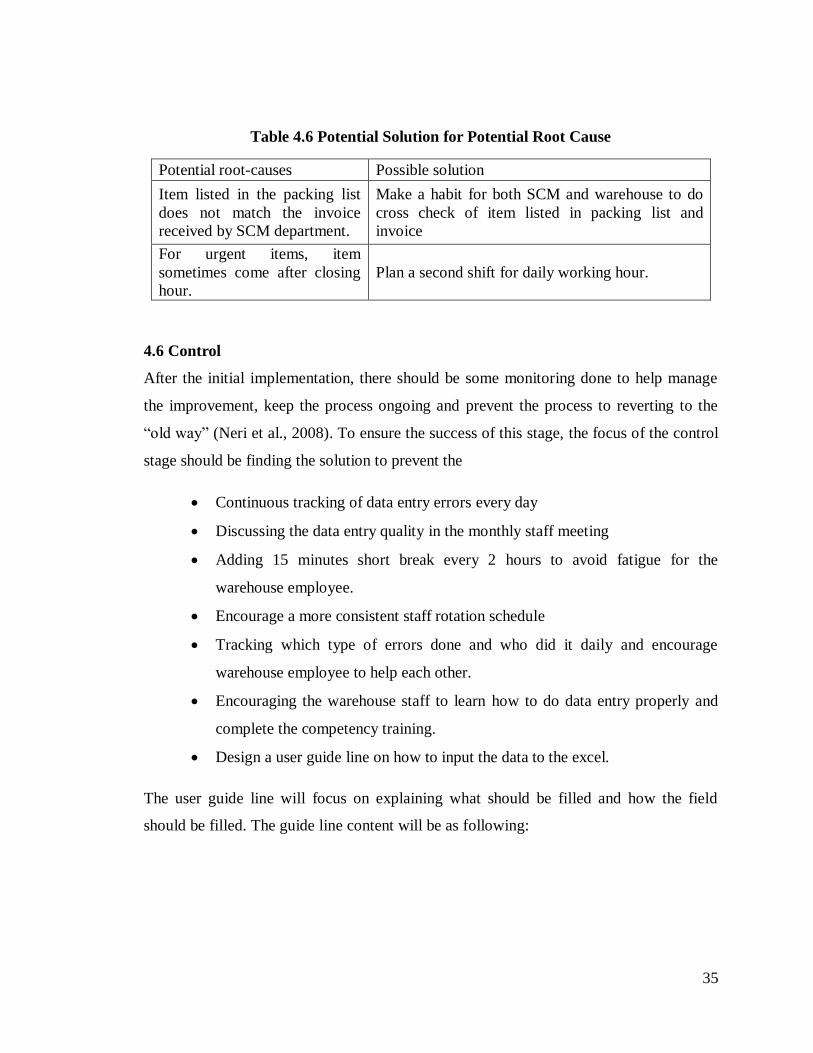
Table 4.6 Potential Solution for Potential Root Cause
Potential root-causes Possible solution
Item listed in the packing list
does not match the invoice
received by SCM department.
Make a habit for both SCM and warehouse to do
cross check of item listed in packing list and
invoice
For urgent items, item
sometimes come after closing
hour.
Plan a second shift for daily working hour.
4.6 Control
After the initial implementation, there should be some monitoring done to help manage
the improvement, keep the process ongoing and prevent the process to reverting to the
“old way” (Neri et al., 2008). To ensure the success of this stage, the focus of the control
stage should be finding the solution to prevent the
Continuous tracking of data entry errors every day
Discussing the data entry quality in the monthly staff meeting
Adding 15 minutes short break every 2 hours to avoid fatigue for the
warehouse employee.
Encourage a more consistent staff rotation schedule
Tracking which type of errors done and who did it daily and encourage
warehouse employee to help each other.
Encouraging the warehouse staff to learn how to do data entry properly and
complete the competency training.
Design a user guide line on how to input the data to the excel.
The user guide line will focus on explaining what should be filled and how the field
should be filled. The guide line content will be as following:

36
1. Introduction.
1.1 General Information.
This guideline will show what is required to be filled in the excel file for item details.
This guide should be read thoroughly by everyone responsible for data input to the Excel.
1.2 Goals
The goals of this guideline is to ensure everyone responsible for data input will know
what the format used to write and what to do when the data is not available.
1.3 Benefits.
The benefits when this guideline is followed properly, the data quality will improve and
the amount of work required to fix the data will decrease which will leads to lower cost
and higher working efficiency.
2 Operating Procedures.
2.1 Necessary Fields.
There are several fields that MUST be filled to ensure the data will be usable without
having to rework the data. The fields are:
From/Asal.
PO Number.
Part Number.
Description.
IN Date.
GR Date.
SPB Out.
Manifest Out
OUT Date.
Transport.
Vesel Name.

37
2.2 Writing Format.
The writing format should follow what is described in the packing list. For the date, there
the format MUST be in “dd-mm-yy” to ensure the data can be processed easily using
Excel formula by the next department
How to do date format setting in Excel:
1. Right click the field
2. Choose “Format Cells”
3. Choose “Date”.
4. Choose the format with 2 digits for every detail (eg. 03-05-18)
5. OK.
2.3 Special Case.
There are special cases for the items:
1. Item data is incomplete.
When this is happened, ask the warehouse person in charge (PIC) to contact head
office (HO). PIC will then sent the necessary data for the field.
2.4 Reminder
1. Make sure every field is complete before give the data to the warehouse PIC.
2. Make sure the date format is in correct form.

38
CHAPTER 5
CONCLUSION AND RECCOMENDATION
5.1 Conclusion
Based on the result of calculation and analysis done, the conclusion can be drawn to
answer the problem statement from before.
How can the data quality be improved and in what way can the unreliable data
be eliminated?
Data quality can be improved by improving every problem root cause since the
end data is collective result of each steps done in the warehouse. There is also a
need to make a plan to solve the possible root cause to ensure the chance for data
defect will be minimized.
5.2 Recommendation.
For future research it would be better if PT.X develop a standard for data
entered to the system so the future research will have more detailed
improvement and result.
Add simple command to reject incomplete data in the system when the data is
entered.
Ex; IF the field is incomplete,
THEN mark field as RED, unable to submit the data to the system.
IF NOT submit data to the system.

39
REFERENCES
Ballou, D. P., & Tayi, G. K. (1999). Enhancing data quality in data warehouse
environments. Communications of the ACM, 42(1), 73-78.
De Feo, J., and Barnard, W. (2004), Juran Institute’s Six Sigma: Breakthrough and
Beyond, McGraw-Hill, NY
Deming, W. E. (1982). Out of the Crisis. Cambridge: Massachusetts Institute of
Technology.
Dubois, L. (2003). What Works: Curing the blown budget in data consolidation.
Retrieved 11.07.05, from www.tdwi.org/research/displayaspx?ID=6877
Goetsch, D.L. and Davis, S.B. 2000. Quality Management. Prentice Hall, Upper
Saddle River, NJ
Harry, M.J., Schroeder, R. (2000). Six Sigma: The Breakthrough Management Strategy
Revolutionizing the World’s Top Corporations. Doubleday, New York.
Jing, G., and Li, N. (2004) Claiming six sigma, Industrial Engineer, February, pp.37-39
Malcom, A. (1998). Poor data quality costs 10% of revenues, survey reveals. Retrieved
18.10.05,from
http://computerworld.co.nz/news.nsf/UNID/CC256CED0016AD1ECC25684C000E0278
?OpenDocu ment&Highlight=2,Poor,data,quality,costs
Margaret Chu (2004), "What Are Dirty Data?", Blissful Data, p. 71 et
seq, ISBN 9780814407806
Neri, R., Mason, C. and Demko, L.A. (2008), “Application of Six Sigma/CAP
methodology: controlling blood-product utilization and costs”, Journal of Healthcare
Management, Vol. 53 No. 3, pp. 183-196

40
Sanders, D., and Hild [2000], C. "A discussion of strategies for six sigma
implementation" Quality Engineering Vol. 12 No. 3: 303-309.
Tennant, Geoff (2001). SIX SIGMA: SPC and TQM in Manufacturing and Services. Gower Publishing,
Ltd. p. 6. ISBN 0-566-08374-4
Wand, Y., & Wang, R. Y. (1996). Anchoring data quality dimensions in ontological
foundations. Communications of the ACM, 39(11), 86-95.
Wang, R. Y.& Strong, D. M. (1996). Beyond accuracy: what data quality means to data
consumers. Journal of Management Information Systems, 12(4), 5-33.
Wang, R. Y., Ziad, M., & Lee, Y. W. (2001). Data Quality. Massachusetts: Kluwer
Academic Publishers.
Zmud, R., Lind, M., & Young, F. (1990). An attribute space for organisational
communication channels. Information Systems Research, 1(4), 440-457.

41