analysis article 4(13), january - march, 2018 climate change · 2017. 10. 28. · 1.assistant...
TRANSCRIPT

© 2018 Discovery Publication. All Rights Reserved. www.discoveryjournals.com OPEN ACCESS
ARTICLE
Page1
ANALYSIS
Effect of different fertilizer treatment and soiltexture on the emission of CO2 in the atmospherefrom the soil
Poonam Kumari1☼, Arvind Kumar Nema2
1.Assistant Professor, ABES Engineering College, Ghaziabad & Research Scholar at IIT, Delhi, India2.Professor, Civil Department, IIT Delhi, India
☼Corresponding Author:IIT Delhi, Department of Civil Engineering,
Hauzkhas, New Delhi,IndiaEmail: [email protected]
Article HistoryReceived: 20 September 2017Accepted: 24 October 2017Published: January-March 2018
CitationPoonam Kumari, Arvind Kumar Nema. Effect of different fertilizer treatment and soil texture on the emission of CO2 in theatmosphere from the soil. Climate Change, 2018, 4(13), 1-11
Publication License
This work is licensed under a Creative Commons Attribution 4.0 International License.
General Note
Article is recommended to print as color version in recycled paper. Save Trees, Save Climate.
ABSTRACTThe objectives of the present study were to investigate the effect of different fertilization treatment on Total Organic Carbon (TOC)and Total Nitrogen (TN) pool in different soil texture up to 0-30cm soil depth during the fallow period of agriculture and to calculatethe amount of CO2 released into the atmosphere from the soil in different fertilizer treatment in three different soil textures. A shortterm column experiment was done on three different soil texture, loamy, sandy loam and siltyclay, subjected to six treatments: 1)
ANALYSIS 4(13), January - March, 2018
ClimateChange
ISSN2394–8558
EISSN2394–8566
© 2018 Discovery Publication. All Rights Reserved. www.discoveryjournals.com OPEN ACCESS
ARTICLEANALYSIS
Page2
Organic Manure(OM), 2) Chemical fertilizer(CF), 3)7OM:3CF(70%Organic Manure +30% Chemical Fertilizer) 4) 5OM:5CF (50%Organic Manure +50% Chemical Fertilizer) 5) 3OM:7CF (30 % Organic Manure +70 % Chemical Fertilizer) and 6)CK (Check, meansWithout Fertilizer treatment). Amount of Carbon di oxide (CO2) released into the atmosphere from the soil by using differentfertilizer treatment in three different soil textures was calculated on the basis of the percentage change in TOC and comparativeanalysis was done in various permutation and combinations of fertilizer treatment and soil texture. The result of multiple regressiontaking OM and sandy loam as reference in fertilizer treatment and soil texture respectively reveals that if we shift from OM to CFtreatment in sandy loam, loam or siltyclay soil, the potential of additional amount of CO2 release in the atmosphere from onehectare agriculture land would be 40.10, 40.21, 40.62 tons respectively. Similarly the same was calculated with shifting to otherfertilizer treatment from manure in different soil texture and it was found that the more use of CF the more CO2 emission potentialwould be in the atmosphere. As the experiment represents fallow period so even the CK has less contribution than any combinationof CF in terms of CO2 emission in the atmosphere. Strong positive correlation was observed between percentage change in TOC andchange in TN(g/Kg) (0.86, 0.79, 0.86, 0.85, 0.89, and 0.78). As per the statistical analysis of experimental data the predictability(R2,p<0.05) (0.73, 0.62, 0.73, 0.73, 0.79, 0.61 ) and coefficient of change in TN (g/Kg) (1.210, 0.314, 0.700, 0.548, 0.546, 0.535) withrespect to percentage change in TOC decreases as we shift in fertilizer treatments OM, 7OM:3C, 5OM:5CF, 3OM:7CF, CF, CKrespectively.
Keywords: Total Organic Carbon (TOC), Soil Carbon Sequestration, Fertilization, Chemical Fertilizer, Manure.
1. INTRODUCTIONTotal Organic Carbon (TOC) in Soil is not only important to maintain soil fertility and to sustain productivity (Su et al. 2006; Kundu etal. 2007) but it is also important in the context of global climate change (Lal et al. 1995). Nature has provided soil as the secondmajor sink of Carbon but Anthropogenic disturbances slowly and steadily converted them as one of the major sources of carbon.According to recent FAO's report, in 2011, 44 % of agriculture-related Green House Gasses (GHG) outputs occurred in Asia, followedby the Americas (25%), Africa (15%), Europe (12%), and Oceania (4%), according to FAO's data agricultural from crop and livestockproduction grew from 4.7 billion tonnes of carbon dioxide equivalents (CO2eq) in 2001 to over 5.3 billion tonnes in 2011, a 14%increase. The increase occurred mainly in developing countries, due to an expansion of total agricultural outputs. Emissionsgenerated during the application of synthetic fertilizers accounted for 13 per cent of agricultural emissions (725 Mt CO2 eq.) in 2011,and is the fastest-growing emissions source in agriculture, has increased some 37% since 2001 (FAO, 2011; Devi Prasad Juvvadi,2017). Being the largest Carbon pool in terrestrial biosphere a small change in soil carbon stocks could lead to significant impacts onatmospheric CO2 concentration (Davidson and Janssens, 2006; Ram Asheshwar Mandal et al. 2017). Thus there is the call to action tonatural scientists to further explore how organic farming functions and is better than chemical farming in terms of lesser Greenhousegas emission by retaining large percentage TOC within the soil. Application of fertilizer increases TOC in soil because fertilizationincreases biomass production that leads to increasing C input (Schuman et al. 2002) to the soil and its humification (Lal 2004). Butthere is the lack of study on the effect of residual fertilizer on the soil during the fallow period of agriculture. Our short term columnstudies try to focus on this matter by focusing on the objectives: (1) To investigate the effect of different fertilization treatment onTOC and TN pool during the fallow period of agriculture in 0-30cm soil depth during the fallow period of agriculture and (2) toexamine how different soil texture respond with these treatments.
2. MATERIAL AND METHODS2.1. Experimental set upA short term, six month (June-November.) controlled column experiment was conducted in 2016 on soil brought from OrganicFarming and Chemical Farming fields located in Bulandsahar (Uttar Pradesh state in northern India having coordinates 28026’N 770
50; E), Ghaziabad, UP to know the response of soil organic carbon (SOC) on different fertilization treatment. Three sets of differentsoil texture were formed from the soils of fields, loamy (original field condition), sandy loam and siltyclay by mechanical sieving.Soils were compactly filled in 18 cylindrical columns (6*3, six of each three texture of soil) having a dimension of 30cm*5cm (Fig.1).The first column has soil of organic farming field only, the second and sixth column had soils of the chemical farming field only,third, and fourth and fifth column had the soil of both organic farming field and chemical farming field mixed in the ratio 7:3, 5:5and 3:7 respectively. All the columns were kept in a rectangular box having an open upper side. Columns filled with soil left oneweek for normalizing. Experimental set up was on the atmospheric temp in a covered shed. The average atmospheric temp during

© 2018 Discovery Publication. All Rights Reserved. www.discoveryjournals.com OPEN ACCESS
ARTICLEANALYSIS
Page3
experimental period was 24.40 C. Soil texture analysis, bulk density, pH and Electrical Conductivity (EC) of all soils of all 18 columnswas done (Table 1 & Table 2). The TOC pool was calculated as given below: Tons carbon per ha = TOC (%) x Soil bulk density(Mg/m3) xDepth (cm). Tons (t) of CO2 released into the atmosphere for every ton (t) of Total organic carbon that is decomposed iscalculated by the formula: (t) CO2 released in atmosphere = (t)TOC decomposed*3.67 ( DAFWA,n.d.).
Table 1 Physical characteristics of three texture of soil
Texture Loamy Sandy Loam SiltyClay
Sand (%) 40 70 5Silt (%) 35 25 55
Clay (%) 25 5 40Bulk Density(g/cm3) 1.37 1.67 1.19
Table 2 pH and EC of soil subjected to different fertilizer treatment
Fertilizer Treatment Loamy Soil Sandy Loam SiltyClay
pH EC (ds/m) pH EC (ds/m) pH EC(ds/m)OM 7.80 502 7.12 470 7.15 483CF 8.00 420 7.35 424 7.34 390
OM: CF (7:3) 7.84 475 7.15 469 7.19 475
OM: CF (5:5) 7.94 459 7.19 450 7.28 455OM:CF (3:7) 7.96 423 7.29 432 7.31 405
CK 8.00 420 7.35 420 7.34 390
Figure 1 Steps showings the experimental setup of the controlled experiments

© 2018 Discovery Publication. All Rights Reserved. www.discoveryjournals.com OPEN ACCESS
ARTICLEANALYSIS
Page4
2.2. Fertilization treatment and managementThe experiment is subjected to six fertilizer treatment on three soil texture which is as follows: 1.Organic Manure (OM), 2.ChemichalFertilizer (CF), 3. 7OM:3CF (70% Organic Manure + 30% Chemical Fertilizer) 4. 5OM:5CF (50% Organic Manure +50% ChemicalFertilizer) 5. 3OM:7CF (30 % Organic Manure + 70 % Chemical Fertilizer) and 6. CK (Check, means Without Fertilizer treatment). Nowequal amount of analysed, crushed plant residue (5g) with different fertilizer treatment (10 g) is loaded on the top of each column inthe first week of June and September months and is completely covered with moist soil on the top, 10ml water is provided afterevery 15 days to all columns throughout the experimental duration. Urea is used as chemical fertilizer whereas ripe manure of cowdung is used as organic manure.
2.3. Soil sampling and analysisSoil samples of all 18 columns were collected thrice of five depth intervals: 0-5cm,5-10cm, 10-15cm, 15-20cm, 20-30cm by SoilRecovery Probe (1/2In*40IN) made in the USA for analysis and mixed to obtain a composite sample needed for analysis. Thecollected soil samples were air-dried, ground to pass through 2mm sieve and analysed for pH, electrical conductivity (EC), bulkdensity (BD), TN and TOC. Soil pH and EC were measured by using a soil water suspension ratio of 1:2(Sparks et al., 1996). Initialsamples were collected in Jun first week after normalizing the soil and later two were collected just before second loading(September first week) and at the end of the experiment (November first week) respectively. Core samples were taken from eachcolumn for determination of bulk density. Total Organic and Inorganic Carbon was analysed by dry combustion method usingShimadzu Solid Sample Module, Model: SSM-5000A.
2.4. Statistical analysisTwo-Way ANOVA without replication was applied to analyze the significant differences of change in TOC(%) and TN(g/kg) amongsoil samples of different depth subjected to different fertilizer treatment. Regression coefficient was calculated between percentagechange in TOC and change in TN during the experimental period. Multiple regressions were done to study the influence of differentfertilizer treatment and change in TN on percentage change of TOC. SPSS statistical package & Excel (Window Version13.0) wereused for data analysis. All statements reported in this study are at the P < 0.05 levels.
3. RESULT AND DISCUSSION3.1. Influence of different fertilization modes and soil texture on the percentage change of TOCThe TOC contents showed statistically significant differences among the six treatments (Fig.2). We observed that the application ofOM had remarkably improved percentage change in TOC compared with the other treatment in all the texture of the soil. CFtreatment showed the least improvement in percentage change in TOC among all treatment in all the three soil textures. Even theCK (checked or without any fertilizer treatment) showed improved result than CF treatment in almost all soil texture. Percentageincrease in TOC in all treatment is highest in 0-5 cm depth and is decreases as we go down and is least at 20-30cm depth. The samepattern is observed in all the three soil texture. Compared with initial percentage of TOC at 0-30 cm depth the significantpercentage increasing trend in TOC percentage was found as follows: OM>OM:CF(7:3)>OM:CF(5:5)>CK>OM:CF(3:7)> CF,consistent trend was observed in other studies (Wang et al.2012; Bhattacharya et al.,2010; Pan et al., 2009; Hao X.Y. et al.,2003)differing only with CK treatment because in present study fallow period of agriculture is considered subjected to same input oforganic residues so no positive impact of excess production and returned input due to fertilization in the soil which leads toimproving SOC (Li Z.Z. et al., 2006; Bi et al., 2009). The present study showed the impact of different fertil izer treatment, remained inthe soil after harvesting of the crop, on TOC retaining capacity of the soil. No, statistically significant difference in percentage changein inorganic carbon was observed both depths wise as well as among different fertilization in all the three soil textures, same wasreported by Scholten and He (2012). It may be due to the short study period, the significant difference may be observed in the longperiod. A statistically significant difference in carbon pool due to the texture of soil was observed in loamy, sandy loam and siltyclaysoil in 0-30cm soil depth (Fig.3). siltyclay soil gave the best response in terms of retaining the highest TOC pool in all depth of soilwhereas sandy lomy soil has the least storing capacity of TOC in comparison to the loamy and siltyloamy. The observed percentagechange in six months in TOC in 0-5cm in loamy, sandy loam and siltyclay with OM treatment were 1.63, 0.79, 1.76 respectively, theobserved percentage change in TOC decrease with depth and they were found at 20-30cm soil depth -0.01, -0.12, 0.08 respectively.With CF treatment the percentage change in 0-5cm in loamy, sandy loam and siltyclay were 0.17, 0.15, 0.54 respectively whereas thesame at 20-30cm depth were as follows: 0.00, -0.24, 0.03.The observed trend to retain TOC in different soil texture were siltyclay >loam > sandy loam, which is similar to the trend observed by E. Sakin (2012), Hassink (1997), Kiem et al. (2002), and Six et al. (2002)they found that mineral soil particles (clay-silt) protected organic carbon against chemical weathering. Clay constitutes organo-

© 2018 Discovery Publication. All Rights Reserved. www.discoveryjournals.com OPEN ACCESS
ARTICLEANALYSIS
Page5
mineral complexes by combining with SOC in soil and helps to retain carbon within the soil for long periods. The carbon enteringinto the layers are trapped and thus protected against oxidation and weathering of organisms. Some metals in soil, clay minerals, Caand Fe constitutes complexes with carbon in soil and protects carbon (Hassink and Whitmore, 1997). Kölbl and Kögel-Knabner(2004), determined that the amount of organic carbon in soil increased with the increase for clay. Inconsistent with the findings ofthe present study and previous studies in the literature, some researchers have reported a very weak relationship between SOC andtexture. In a study of New Zealand soils, Percival et al. (2000) found a low relationship between clay and carbon concentration(r2<0.05). Mc.Lauchlan (2006) reported a very slight relationship between SOC and texture, and thus texture had a lesser effect onSOC storage in comparison to other parameters.
(a)
(b)
(c)
Figure 2 Average percentage change in TOC in different fertilizer treatment in different soil depth in (a) Loamy soil, (b) Sandy Loamsoil &(c) SiltyClay soil. Error bars represent standard deviation. Each value refers to mean +/- SD(n=3)
-0.50
0.00
0.50
1.00
1.50
2.00
2.50
OM
% ch
ange
in T
OC
-0.50
0.00
0.50
1.00
OM CF
% ch
ange
in T
OC
-0.50
0.00
0.50
1.00
1.50
2.00
OM CF% ch
ange
in T
OC
© 2018 Discovery Publication. All Rights Reserved. www.discoveryjournals.com OPEN ACCESS
ARTICLEANALYSIS
Page5
mineral complexes by combining with SOC in soil and helps to retain carbon within the soil for long periods. The carbon enteringinto the layers are trapped and thus protected against oxidation and weathering of organisms. Some metals in soil, clay minerals, Caand Fe constitutes complexes with carbon in soil and protects carbon (Hassink and Whitmore, 1997). Kölbl and Kögel-Knabner(2004), determined that the amount of organic carbon in soil increased with the increase for clay. Inconsistent with the findings ofthe present study and previous studies in the literature, some researchers have reported a very weak relationship between SOC andtexture. In a study of New Zealand soils, Percival et al. (2000) found a low relationship between clay and carbon concentration(r2<0.05). Mc.Lauchlan (2006) reported a very slight relationship between SOC and texture, and thus texture had a lesser effect onSOC storage in comparison to other parameters.
(a)
(b)
(c)
Figure 2 Average percentage change in TOC in different fertilizer treatment in different soil depth in (a) Loamy soil, (b) Sandy Loamsoil &(c) SiltyClay soil. Error bars represent standard deviation. Each value refers to mean +/- SD(n=3)
CF OM:CF(7:3) OM:CF (5:5) OM:CF (3:7)Fertilizer Treatment
CF OM:CF(7:3) OM:CF (5:5) OM:CF (3:7) CK
Fertilizer treatment
CF OM:CF(7:3) OM:CF (5:5) OM:CF (3:7) CK
Fertilizer treatment
© 2018 Discovery Publication. All Rights Reserved. www.discoveryjournals.com OPEN ACCESS
ARTICLEANALYSIS
Page5
mineral complexes by combining with SOC in soil and helps to retain carbon within the soil for long periods. The carbon enteringinto the layers are trapped and thus protected against oxidation and weathering of organisms. Some metals in soil, clay minerals, Caand Fe constitutes complexes with carbon in soil and protects carbon (Hassink and Whitmore, 1997). Kölbl and Kögel-Knabner(2004), determined that the amount of organic carbon in soil increased with the increase for clay. Inconsistent with the findings ofthe present study and previous studies in the literature, some researchers have reported a very weak relationship between SOC andtexture. In a study of New Zealand soils, Percival et al. (2000) found a low relationship between clay and carbon concentration(r2<0.05). Mc.Lauchlan (2006) reported a very slight relationship between SOC and texture, and thus texture had a lesser effect onSOC storage in comparison to other parameters.
(a)
(b)
(c)
Figure 2 Average percentage change in TOC in different fertilizer treatment in different soil depth in (a) Loamy soil, (b) Sandy Loamsoil &(c) SiltyClay soil. Error bars represent standard deviation. Each value refers to mean +/- SD(n=3)
CK
0-5 cm
5-10 cm
10-15 cm
15-20 cm
20-30 cm
0-30cm
0-5 cm
5-10 cm
10-15 cm
15-20 cm
20-30 cm
0-30cm
0-5 cm
5-10 cm
10-15 cm
15-20 cm
20-30 cm
0-30cm

© 2018 Discovery Publication. All Rights Reserved. www.discoveryjournals.com OPEN ACCESS
ARTICLEANALYSIS
Page6
Figure 3 Average percentage change in TOC in different soil texture in different soil depth. Each value refers to mean +/- SD(n=3)
3.2. Influence of different fertilization modes on the percentage change of TN poolThe TN content showed statistically significant differences among the six treatments (Fig. 4). Specially OM treatment resulted in thehighest increase TN concentration (0.34g/kg, 0.40 and 0.66g/kg) and CK the least (0.09g/kg, 0.04g/kg, 0.41g/kg) in 0-30cm in loamy,sandy loam and siltyclay soil respectively, among all soil treatment in the six month duration of the experiment. Similar to TOCpercentage differences trend, TN concentration also decreases as we go down from the ground level (0 to 30 cm). Statisticallysignificant differences in TN pool were observed in all the three observed soil texture. The siltyclay soil showed the significantlyhigher increase in TN Concentration in all the analysed soil depths than loamy and Sandy Loam soil in all the six treatment (Fig.5).Consistent with the finding of (Cote et al. 2000; Mc.Lauchlan et al., 2006) TN contains was found greater in the soil having higherpercentage of clay and showed similar trend as shown by TOC i.e the siltyclay showed higher retaining capacity of TN than loamyand the least retaining capacity was observed in sandy loam soil texture. According to Cote et al. (2000), N mineralization increasesas the percentage of clay contain increases in the soil which show positive correlation between N and Clay content. to But ourfinding was differing with Vejre et al. (2003) who reported an inverse relationship between clay content and Nitrogen within soildepth of 100 cm. The soils they worked as spodosol, alfisol that was well weathered and formed under high precipitation.(a)
(b)
-0.50
0.00
0.50
1.00
1.50
2.00
0-5
5-10
cm10
-15c
m15
-20c
m20
-30c
m 0-5
5-10
cm10
-15c
m15
-20c
mOM CF
% C
hang
e in
TO
C
-0.500.000.501.001.50
TN(g
/kG
)
Different Fertilization Treatment
-0.500.000.501.001.50
TN(g
/kG
)
Different Fertilization Treatment
© 2018 Discovery Publication. All Rights Reserved. www.discoveryjournals.com OPEN ACCESS
ARTICLEANALYSIS
Page6
Figure 3 Average percentage change in TOC in different soil texture in different soil depth. Each value refers to mean +/- SD(n=3)
3.2. Influence of different fertilization modes on the percentage change of TN poolThe TN content showed statistically significant differences among the six treatments (Fig. 4). Specially OM treatment resulted in thehighest increase TN concentration (0.34g/kg, 0.40 and 0.66g/kg) and CK the least (0.09g/kg, 0.04g/kg, 0.41g/kg) in 0-30cm in loamy,sandy loam and siltyclay soil respectively, among all soil treatment in the six month duration of the experiment. Similar to TOCpercentage differences trend, TN concentration also decreases as we go down from the ground level (0 to 30 cm). Statisticallysignificant differences in TN pool were observed in all the three observed soil texture. The siltyclay soil showed the significantlyhigher increase in TN Concentration in all the analysed soil depths than loamy and Sandy Loam soil in all the six treatment (Fig.5).Consistent with the finding of (Cote et al. 2000; Mc.Lauchlan et al., 2006) TN contains was found greater in the soil having higherpercentage of clay and showed similar trend as shown by TOC i.e the siltyclay showed higher retaining capacity of TN than loamyand the least retaining capacity was observed in sandy loam soil texture. According to Cote et al. (2000), N mineralization increasesas the percentage of clay contain increases in the soil which show positive correlation between N and Clay content. to But ourfinding was differing with Vejre et al. (2003) who reported an inverse relationship between clay content and Nitrogen within soildepth of 100 cm. The soils they worked as spodosol, alfisol that was well weathered and formed under high precipitation.(a)
(b)
15-2
0cm
20-3
0cm 0-5
5-10
cm10
-15c
m15
-20c
m20
-30c
m 0-5
5-10
cm10
-15c
m15
-20c
m20
-30c
m 0-5
5-10
cm10
-15c
m15
-20c
m20
-30c
m
OM:CF (7:3) OM:CF (5:5) OM:CF (3:7)
Different Fertilization Treatment
Different Fertilization Treatment
0-5 cm
5-10 cm
10-15 cm
15-20 cm
20-30 cm
Different Fertilization Treatment
© 2018 Discovery Publication. All Rights Reserved. www.discoveryjournals.com OPEN ACCESS
ARTICLEANALYSIS
Page6
Figure 3 Average percentage change in TOC in different soil texture in different soil depth. Each value refers to mean +/- SD(n=3)
3.2. Influence of different fertilization modes on the percentage change of TN poolThe TN content showed statistically significant differences among the six treatments (Fig. 4). Specially OM treatment resulted in thehighest increase TN concentration (0.34g/kg, 0.40 and 0.66g/kg) and CK the least (0.09g/kg, 0.04g/kg, 0.41g/kg) in 0-30cm in loamy,sandy loam and siltyclay soil respectively, among all soil treatment in the six month duration of the experiment. Similar to TOCpercentage differences trend, TN concentration also decreases as we go down from the ground level (0 to 30 cm). Statisticallysignificant differences in TN pool were observed in all the three observed soil texture. The siltyclay soil showed the significantlyhigher increase in TN Concentration in all the analysed soil depths than loamy and Sandy Loam soil in all the six treatment (Fig.5).Consistent with the finding of (Cote et al. 2000; Mc.Lauchlan et al., 2006) TN contains was found greater in the soil having higherpercentage of clay and showed similar trend as shown by TOC i.e the siltyclay showed higher retaining capacity of TN than loamyand the least retaining capacity was observed in sandy loam soil texture. According to Cote et al. (2000), N mineralization increasesas the percentage of clay contain increases in the soil which show positive correlation between N and Clay content. to But ourfinding was differing with Vejre et al. (2003) who reported an inverse relationship between clay content and Nitrogen within soildepth of 100 cm. The soils they worked as spodosol, alfisol that was well weathered and formed under high precipitation.(a)
(b)
20-3
0cm 0-5
5-10
cm10
-15c
m15
-20c
m20
-30c
m
CK
Loamy Soil
Sandy Loam Soil
Silty Clay Soil
0-5 cm
5-10 cm
10-15 cm
15-20 cm
20-30 cm
0-5 cm
5-10 cm
10-15 cm
15-20 cm
20-30 cm
© 2018 Discovery Publication. All Rights Reserved. www.discoveryjournals.com OPEN ACCESS
ARTICLEANALYSIS
Page7
(c)
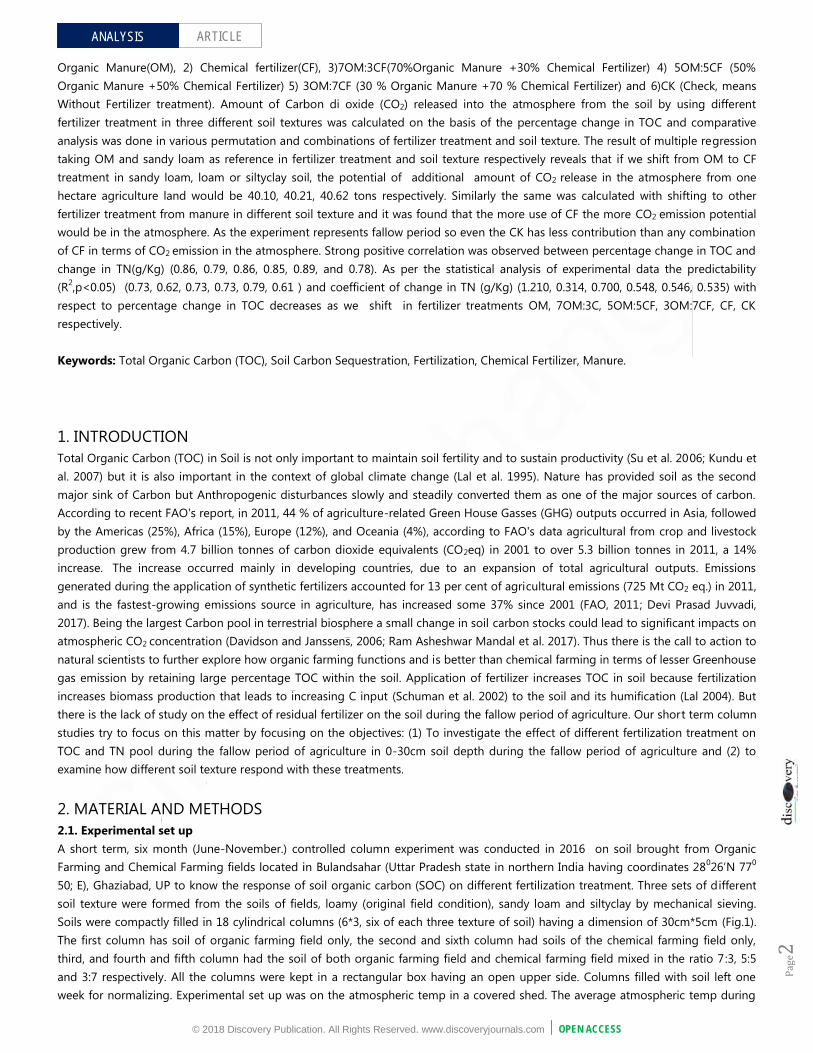
Figure 4 Average percentage change in TN(g/kg) in different fertilizer treatment in different soil depth in (a) Loamy soil, (b) SandyLoam soil &(c) SiltyClay soil. Error bars represent standard deviation. Each value refers to mean +/- SD(n=3)
Figure 5 Average percentage change in TN in different soil texture in different soil depth, Each value refers to mean +/- SD(n=3)
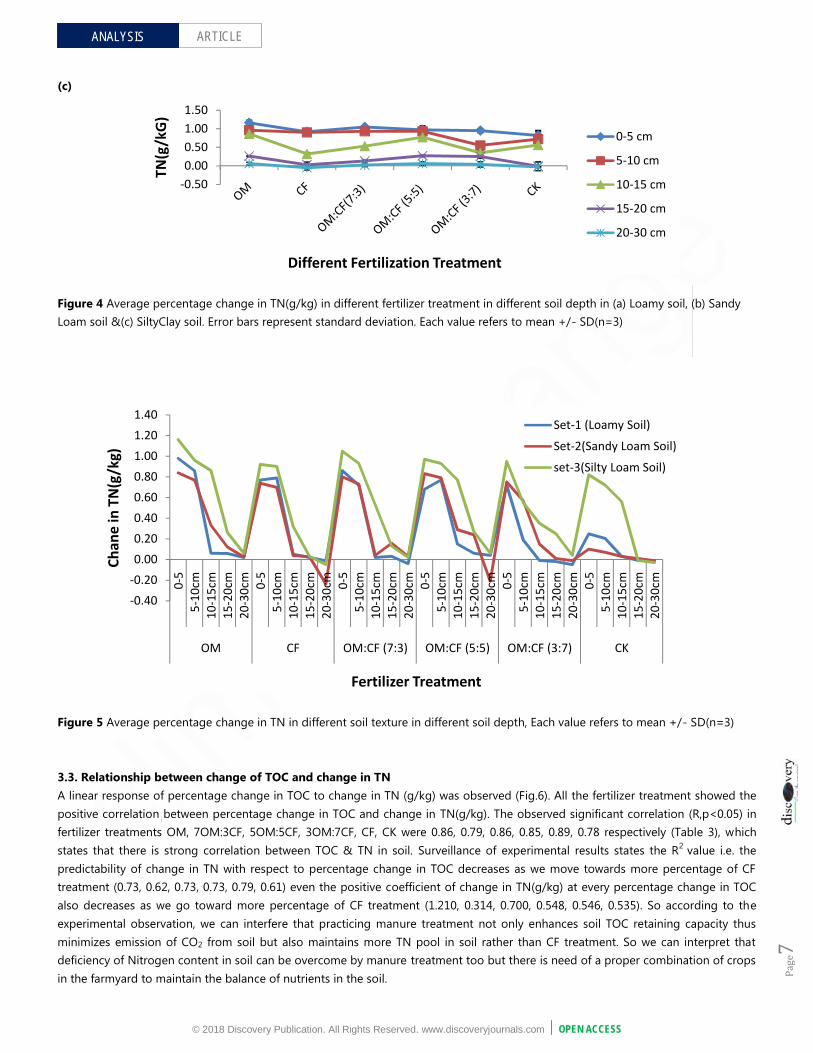
3.3. Relationship between change of TOC and change in TNA linear response of percentage change in TOC to change in TN (g/kg) was observed (Fig.6). All the fertilizer treatment showed thepositive correlation between percentage change in TOC and change in TN(g/kg). The observed significant correlation (R,p<0.05) infertilizer treatments OM, 7OM:3CF, 5OM:5CF, 3OM:7CF, CF, CK were 0.86, 0.79, 0.86, 0.85, 0.89, 0.78 respectively (Table 3), whichstates that there is strong correlation between TOC & TN in soil. Surveillance of experimental results states the R2 value i.e. thepredictability of change in TN with respect to percentage change in TOC decreases as we move towards more percentage of CFtreatment (0.73, 0.62, 0.73, 0.73, 0.79, 0.61) even the positive coefficient of change in TN(g/kg) at every percentage change in TOCalso decreases as we go toward more percentage of CF treatment (1.210, 0.314, 0.700, 0.548, 0.546, 0.535). So according to theexperimental observation, we can interfere that practicing manure treatment not only enhances soil TOC retaining capacity thusminimizes emission of CO2 from soil but also maintains more TN pool in soil rather than CF treatment. So we can interpret thatdeficiency of Nitrogen content in soil can be overcome by manure treatment too but there is need of a proper combination of cropsin the farmyard to maintain the balance of nutrients in the soil.
-0.500.000.501.001.50
TN(g
/kG
)
Different Fertilization Treatment
-0.40-0.200.000.200.400.600.801.001.201.40
0-5
5-10
cm10
-15c
m15
-20c
m20
-30c
m 0-5
5-10
cm10
-15c
m15
-20c
m
OM CF
Chan
e in
TN
(g/k
g)
© 2018 Discovery Publication. All Rights Reserved. www.discoveryjournals.com OPEN ACCESS
ARTICLEANALYSIS
Page7
(c)
Figure 4 Average percentage change in TN(g/kg) in different fertilizer treatment in different soil depth in (a) Loamy soil, (b) SandyLoam soil &(c) SiltyClay soil. Error bars represent standard deviation. Each value refers to mean +/- SD(n=3)
Figure 5 Average percentage change in TN in different soil texture in different soil depth, Each value refers to mean +/- SD(n=3)
3.3. Relationship between change of TOC and change in TNA linear response of percentage change in TOC to change in TN (g/kg) was observed (Fig.6). All the fertilizer treatment showed thepositive correlation between percentage change in TOC and change in TN(g/kg). The observed significant correlation (R,p<0.05) infertilizer treatments OM, 7OM:3CF, 5OM:5CF, 3OM:7CF, CF, CK were 0.86, 0.79, 0.86, 0.85, 0.89, 0.78 respectively (Table 3), whichstates that there is strong correlation between TOC & TN in soil. Surveillance of experimental results states the R2 value i.e. thepredictability of change in TN with respect to percentage change in TOC decreases as we move towards more percentage of CFtreatment (0.73, 0.62, 0.73, 0.73, 0.79, 0.61) even the positive coefficient of change in TN(g/kg) at every percentage change in TOCalso decreases as we go toward more percentage of CF treatment (1.210, 0.314, 0.700, 0.548, 0.546, 0.535). So according to theexperimental observation, we can interfere that practicing manure treatment not only enhances soil TOC retaining capacity thusminimizes emission of CO2 from soil but also maintains more TN pool in soil rather than CF treatment. So we can interpret thatdeficiency of Nitrogen content in soil can be overcome by manure treatment too but there is need of a proper combination of cropsin the farmyard to maintain the balance of nutrients in the soil.
Different Fertilization Treatment
0-5 cm
5-10 cm
10-15 cm
15-20 cm
20-30 cm
15-2
0cm
20-3
0cm 0-5
5-10
cm10
-15c
m15
-20c
m20
-30c
m 0-5
5-10
cm10
-15c
m15
-20c
m20
-30c
m 0-5
5-10
cm10
-15c
m15
-20c
m20
-30c
m 0-5
5-10
cm
CF OM:CF (7:3) OM:CF (5:5) OM:CF (3:7) CK
Fertilizer Treatment
Set-1 (Loamy Soil)
Set-2(Sandy Loam Soil)
set-3(Silty Loam Soil)
© 2018 Discovery Publication. All Rights Reserved. www.discoveryjournals.com OPEN ACCESS
ARTICLEANALYSIS
Page7
(c)
Figure 4 Average percentage change in TN(g/kg) in different fertilizer treatment in different soil depth in (a) Loamy soil, (b) SandyLoam soil &(c) SiltyClay soil. Error bars represent standard deviation. Each value refers to mean +/- SD(n=3)
Figure 5 Average percentage change in TN in different soil texture in different soil depth, Each value refers to mean +/- SD(n=3)
3.3. Relationship between change of TOC and change in TNA linear response of percentage change in TOC to change in TN (g/kg) was observed (Fig.6). All the fertilizer treatment showed thepositive correlation between percentage change in TOC and change in TN(g/kg). The observed significant correlation (R,p<0.05) infertilizer treatments OM, 7OM:3CF, 5OM:5CF, 3OM:7CF, CF, CK were 0.86, 0.79, 0.86, 0.85, 0.89, 0.78 respectively (Table 3), whichstates that there is strong correlation between TOC & TN in soil. Surveillance of experimental results states the R2 value i.e. thepredictability of change in TN with respect to percentage change in TOC decreases as we move towards more percentage of CFtreatment (0.73, 0.62, 0.73, 0.73, 0.79, 0.61) even the positive coefficient of change in TN(g/kg) at every percentage change in TOCalso decreases as we go toward more percentage of CF treatment (1.210, 0.314, 0.700, 0.548, 0.546, 0.535). So according to theexperimental observation, we can interfere that practicing manure treatment not only enhances soil TOC retaining capacity thusminimizes emission of CO2 from soil but also maintains more TN pool in soil rather than CF treatment. So we can interpret thatdeficiency of Nitrogen content in soil can be overcome by manure treatment too but there is need of a proper combination of cropsin the farmyard to maintain the balance of nutrients in the soil.
0-5 cm
5-10 cm
10-15 cm
15-20 cm
20-30 cm
5-10
cm10
-15c
m15
-20c
m20
-30c
mCK
Set-1 (Loamy Soil)
Set-2(Sandy Loam Soil)
set-3(Silty Loam Soil)
© 2018 Discovery Publication. All Rights Reserved. www.discoveryjournals.com OPEN ACCESS
ARTICLEANALYSIS
Page8
(a)
(b)
(c)
(d)
(e)
(f)
Figure 6 Regression Analysis of Change in TN in relation with percentage change in TOC(a); OM treatment (b); CF treatment (c);7OM:3CF treatment (d);5OM:5CF treatment (e); 3OM:7CF treatment (f)CK treatment. Each value refers to mean +/- SD(n=15)
Table 3 Table of regression model showing the relationship of TN with respect to TOC in thesoil.
FertilizerTreatment Multiple R R 2
AdjustedR2
StandardError Observation
Significance F(ANOVA) Coefficient p-value
OM 0.86 0.73 0.71 0.33 15 0.000 1.210 5E-05CF 0.79 0.62 0.59 0.11 15 0.000 0.314 5E-04
7OM:3CF 0.86 0.73 0.71 0.18 15 0.000 0.700 5E-055OM:5CF 0.85 0.73 0.71 0.13 15 0.000 0.548 5E-05
3OM:7CF 0.89 0.79 0.77 0.10 15 0.000 0.546 1E-05CK 0.78 0.61 0.58 0.13 15 0.001 0.535 6E-04
0.00
0.50
1.00
1.50
-0.50 0.00 0.50 1.00Cha
nge
in T
N(g
/kg)
Percentage change in TOC
-0.50
0.00
0.50
1.00
1.50
-0.40 -0.20 0.00 0.20 0.40
Chan
ge in
TN
(g/k
gg)
Percentage change in TOC
-0.50
0.00
0.50
1.00
1.50
-0.50 0.00 0.50
Cha
nge
in T
N(g
/kg)
Percentage change in TOC
© 2018 Discovery Publication. All Rights Reserved. www.discoveryjournals.com OPEN ACCESS
ARTICLEANALYSIS
Page8
(a)
(b)
(c)
(d)
(e)
(f)
Figure 6 Regression Analysis of Change in TN in relation with percentage change in TOC(a); OM treatment (b); CF treatment (c);7OM:3CF treatment (d);5OM:5CF treatment (e); 3OM:7CF treatment (f)CK treatment. Each value refers to mean +/- SD(n=15)
Table 3 Table of regression model showing the relationship of TN with respect to TOC in thesoil.
FertilizerTreatment Multiple R R 2
AdjustedR2
StandardError Observation
Significance F(ANOVA) Coefficient p-value
OM 0.86 0.73 0.71 0.33 15 0.000 1.210 5E-05CF 0.79 0.62 0.59 0.11 15 0.000 0.314 5E-04
7OM:3CF 0.86 0.73 0.71 0.18 15 0.000 0.700 5E-055OM:5CF 0.85 0.73 0.71 0.13 15 0.000 0.548 5E-05
3OM:7CF 0.89 0.79 0.77 0.10 15 0.000 0.546 1E-05CK 0.78 0.61 0.58 0.13 15 0.001 0.535 6E-04
1.00 1.50 2.00Percentage change in TOC
0.40 0.60
Percentage change in TOC
-0.50
0.00
0.50
1.00
1.50
-0.50 0.00 0.50
Cha
nge
in T
N(g
/kg)
Percentage change in TOC
-0.50
0.00
0.50
1.00
1.50
-0.40 -0.20 0.00 0.20
Cha
nge
in T
N(g
/kg)
Percentage change inTOC
1.00
Percentage change in TOC -0.50
0.00
0.50
1.00
-0.50 0.00
Cha
nge
in T
N(g
/kg)
Percentage change in TOC
© 2018 Discovery Publication. All Rights Reserved. www.discoveryjournals.com OPEN ACCESS
ARTICLEANALYSIS
Page8
(a)
(b)
(c)
(d)
(e)
(f)
Figure 6 Regression Analysis of Change in TN in relation with percentage change in TOC(a); OM treatment (b); CF treatment (c);7OM:3CF treatment (d);5OM:5CF treatment (e); 3OM:7CF treatment (f)CK treatment. Each value refers to mean +/- SD(n=15)
Table 3 Table of regression model showing the relationship of TN with respect to TOC in thesoil.
FertilizerTreatment Multiple R R 2
AdjustedR2
StandardError Observation
Significance F(ANOVA) Coefficient p-value
OM 0.86 0.73 0.71 0.33 15 0.000 1.210 5E-05CF 0.79 0.62 0.59 0.11 15 0.000 0.314 5E-04
7OM:3CF 0.86 0.73 0.71 0.18 15 0.000 0.700 5E-055OM:5CF 0.85 0.73 0.71 0.13 15 0.000 0.548 5E-05
3OM:7CF 0.89 0.79 0.77 0.10 15 0.000 0.546 1E-05CK 0.78 0.61 0.58 0.13 15 0.001 0.535 6E-04
0.50 1.00 1.50
Percentage change in TOC
0.20 0.40 0.60 0.80 1.00
Percentage change inTOC
0.50 1.00
Percentage change in TOC

© 2018 Discovery Publication. All Rights Reserved. www.discoveryjournals.com OPEN ACCESS
ARTICLEANALYSIS
Page9
3.4. Influence of Different Fertilizer Treatment and TN on percentage change in TOCA Statistically significant multiple linear regression model is developed taking manure treatment as a reference in fertilizer treatmentand sandy loam soil in texture (Table-4) considering other parameter constants for all permutation and combination of fertilizertreatment and soil texture. The significance F (0.000) value which is less than .05 and less than 0.05 P value of all Independentvariables states that the model of predicted change in percentage change in TOC corresponding to different fertilizer treatment indifferent soil texture is statistically significant. Negative Sign in the coefficient of CK, CF, and 7CF:3OM, 5CF:5OM, 3CF:7OM statesthat the retention capacity of TOC in soil decreases as we opt other fertilizer treatment than manure. The positive coefficient valuefor loamy and siltyclay soil texture states that TOC retention capacity of soil increases of with 0.14 and 0.11 times respectively fromsandy loam soil. The model states that in sandy loam soil if we shift from manure treatment to CK, CF, 7CF:3OM, 5CF:5OM and3CF:7OM there would be 0.18, 0.310, 0.25, 0.26 and 0.19 per cent more degradation of TOC from soil respectively. Similarly, changein TOC percentage could be calculated for all permutation and combinations.
Net emission of CO2 in the atmosphere is calculated taking all permutation and combinations (Table-5) which reveal howchemical fertilizer contributing in increasing CO2 concentration in the atmosphere. The more percentage of CF has used in fertilizerthe more CO2 released into the atmosphere due to high degradation of TOC from the soil. In fallow period even controlled orchecked treatment (CK) has less contribution to CO2 emission than any combination of CF and if we 100% shifts from manure to CFtreatment in siltyclay, loamy or sandy loam soil there would be 40.10, 40.21, 40.62 ton more CO2 would be released in atmosphererespectively.
Percentage Change in TOC =0.11+0.64 (Change in TN(g/Kg)-0.18(CK)-0.31(CF)-0.25(7CF:3OM)-0.26(5CF:5OM)-0.19(3CF:7OM)+0.11(Lomy)+0.14(SiltyClay)
Table 4 Table of the regression model with eight explanatory variables taking Manure treatment as the reference in Fertilizertreatment variables and Sandy Loam soil in texture variable.
Regression Statistics
Multiple R 0.83
R Square 0.69
Adjusted R Square 0.66
Standard Error 0.20
Observations 90.00
ANOVA
df SS MS F Significance F
Regression 8 7.498 0.937 22.843 0.000
Residual 81 3.323 0.041
Total 89 10.821
Table 5 Tonnes of CO2 released in atmosphere per hectare of farm if we shift from Manure
Fertilizer Treatment SiltyClay Soil Loamy Soil Sandy Loam soilCF 40.10 40.21 40.62
7CF:3OM 32.24 32.35 32.755CF:5OM 33.55 32.35 34.063CF:7OM 24.38 24.49 24.89
CK 23.07 23.18 23.58

© 2018 Discovery Publication. All Rights Reserved. www.discoveryjournals.com OPEN ACCESS
ARTICLEANALYSIS
Page10
4. EXPERIMENTAL LIMITATIONThe most important limitations of this study are (1) too short experimental duration and (2) to study the effect of fertilizer treatmentwithout Plantation. The long-term agricultural studies indicate that the rate of change in SOC may be greatest at the beginning ofthe experiment but that reaching a new steady state may take more than 100 years (Johnston et al. 2009).
5. CONCLUSIONThe result suggests that the fertilization treatment has significant effects on the TOC retaining capacity in all soil texture even in afallow period of agriculture. In all the three texture of the soil, there was significant difference in percentage change in TOC &TNpools both depths wise as well as with different fertilizer treatment. In the entire column percentage change in TOC &TN washighest on topsoil (0-5cm) and it decreases as we go down the depth. In all the three soil texture, the observed significantpercentage increasing trend of TOC were: OM> 7OM:3C > 5OM:5CF> 3OM:7CF> CK> CF. According to experimental data, it wasobserved that the potential to retain more TOC in subjected soil texture are: siltyclay> loam >sandy Loam. The result of Multipleregression taking OM as the reference in fertilizer treatment and sandy loam as reference in texture reveals that if we shift from OMto CF treatment in sandy loam, loam or siltyclay soil, the amount of CO2 released in atmosphere from one hectare agriculture land is40.10, 40.21, 40.62 tons respectively. So farmers are not only entitled to claims for carbon credits by opting OM instead of CF butalso they will improve the fertility of their soil in every cycle of farming. As this experiment reveals that even in a fallow period ofagriculture CF has its adverse effect on TOC and TN retaining capacity of the soil. By using OM we are not only preventing the soilfrom being converting into a source of carbon instead of the sink but also are saving our earth from that carbon which is emittingduring the synthesis of these chemical fertilizers. On the contrast, during the synthesis of OM, we can generate biogas which can beused as the source of energy.
RREEFFEERREENNCCEE1. Bhattacharyya, R., Prakash, V., Kundu, S., Srivastva, A.K.,
Gupta, H.S., Mitra, S., (2010). Long-term effects offertilization on carbon and nitrogen sequestration andaggregate associated carbon and nitrogen in the Indian sub-Himalayas. Nutr. Cycl. Agroecosys., 86(1):1-16.
2. Bi, L.D., Zhang, B., Liu, G.R., Li, Z.Z., Liu, Y.R., Ye, C., Yu,X.C.,Lai, T., Zhang, J.G., Yin, J.M., Liang, Y.,( 2009).Long-termeffects of organic amendments on the riceyields for doublerice cropping systems in subtropicalChina. Agric. Ecosyst.Environ., 129(4):534-541.
3. Cote, L., S. Brown, D. Pare, J. Fyles and J. Bauhus, (2000).Dynamics of carbon and nitrogen mineralization in relationto stand type, stand age and soil texture in the boreal mixedwood. Soil Biology & Biochemistry, 32 (8–9): 1079–1090.
4. Davidson, E. A., and Janssens, I. A. Temperature sensitivity ofsoil carbon composition and feedbacks to climate change,Nature, 440, 165–173, 2006.
5. DAFWA(n.d.),https://www.agric.wa.gov.au/climate-change/soil-organic-carbon-and-greenhouse-gas-emissions.
6. Devi Prasad Juvvadi. (2017). Water - Energy - Food NexusGovernance Adaptation to Climate Change. Climate Change,3(9), 568-600
7. E,Sakin, (2012). Organic carbon organic matter and bulkdensity relationships in arid-semi arid soils in SoutheastAnatolia region. African Journal of Biotechnology11(6):1373-1377.
8. FAO Statistics, (2011). Food and Agriculture Organisation ofthe United Nations Statistics Division.
9. Hao, X.Y., Chang, C., Travis, G.R., Zhang, F.R., (2003).Soilcarbon and nitrogen response to 25 annual cattle manureapplications. J. Plant Nutr. Soil Sci., 166(2):239-245.
10. Hassink, J. and A. P. Whitmore, (1997). A model of thephysical protection of organic matter in soils. Soil Sci. Soc.Am. J., 61:131–139.
11. Hassink, J., (1997). The capacity of soils to preserveorganicCand-Nby their association withclay and silt particles.Plant & Soil,191 (1): 77–87.
12. Johnston, A., P.R. Poulton, and K. Coleman. (2009). Soilorganic matter: Its importance in agriculture andcarbondioxide fluxes. Advance in Agronomy 101:1-57.
13. Kiem, R. and I. Kögel-Knabner, (2002). Refractory organiccarbonin particle-size fractions of arable soils II: organiccarbon inrelation to mineral surface area and iron oxidesinfractions < 6mu m. Org Geochem., 33: 1699–1713.
14. Kölbl, A. and I. Kögel-Knabner, (2004). Content andcomposition of free and occluded particulate organic matterin a differently textured arable Cambisol as revealed bysolid-state C-13 NMR spectroscopy. J. Plant Nutr. Soil Sci.,167: 45–53.
15. Kundu S, Bhattacharyya R, Prakash V, Ghosh BN, Gupta HS.,(2007). Carbon sequestration and relationship betweencarbon addition and storage under rainfed soybean–wheatrotation in a sandy loamsoil of the Indian Himalayas. Soil TillRes 92:87–95.
16. Lal, R., Kimble, J., Stewart, B.A., (1995). World soils as asource or sink for radio-active gases. Soil Management and

© 2018 Discovery Publication. All Rights Reserved. www.discoveryjournals.com OPEN ACCESS
ARTICLEANALYSIS
Page11
Greenhouse Effect, Lewis Publishers, London, pp.1–7.17. Lal R (2004). Soil carbon sequestration impacts on global
climate change and food security. Science 304:1623–1627.doi:10.1126/science.1097396.
18. Li, Z.Z., Liu, G.R., Liu, Y.R., Zhou, R.J., (2006). The Effects ofLong-term Fertilization on Soil Fertility of a Paddy Field inLow Hilly Area. In: Xu, M.G., Liang, G.Q., Zhang, F.D.(Eds.),Soil Fertility Change in China. China Agri. Sci.Tech. Press,Peking, p.67-84 (in Chinese).
19. McLauchlan, K. K., (2006). Effect of soil texture on soil carbonand nitrogen dynamic after cessation of agriculture.Geoderma,136: 289-299.
20. Pan, G.X., Xu, X.W., Smith, P., Pan, W., Lal, R., (2009). Anincrease in topsoil SOC stock of China’s croplands between1985 and 2006 revealed by soil monitoring. Agric. Ecosyst.Environ., 136(1-2):133-138.
21. Percival, H. J., R. L. Parfitt and N. A. Scott, (2000). Factorscontrolling soil carbon levels in New Zealand grasslands: isclay content important? Soil Science Society AmericanJournal, 64(5): 1623–1630.
22. Ram Asheshwar Mandal, Kabita Aryal, Jai Prakash Gupta,Pramod Kumar Jha. (2017). Effects of Hilly Aspects onCarbon Stock of Pinus roxburghii Plantations in Kaleri, SalyanSalleri and Barahpakho Community Forests, Nepal. ClimateChange, 3(10), 708-716
23. Scholten, T. and J. He. (2012). Organic and Inorganic Carbonin the Topsoil of the Mongolian and Tibetan Grasslands :Pattern, Control, and Implications. 2287–99.
24. Schuman, G. E., H. H. Janzen and J. E. Herrick. 2002.Soilcarbon dynamics and potential carbon sequestration byrangelands. Environmental Pollution 116, 3: 391-396.
25. Six, J., R. T. Conant, E. A. Paul and K. Paustian, (2002).Stabilization mechanisms of soil organic matter: implicationsfor saturationof soils. Plant & Soil, 241 (2): 155–176.
26. Su Y-Z, Wang F, Suo D-R, Zhang Z-H, DuM-W (2006). Long-term effect of fertilizer and manure application on soilcarbon sequestration andsoil fertility under the wheat–wheat–maize cropping system in northeast China. NutrCycling Agroecosyst 75:285–295.
27. Trumbore, S. E., and Czimczik, C. I. (2008). An uncertainfuture for soil carbon, Science, 321, 1455–1456.
28. Vejre, H., I. Callesen, L. Vesterdal, and K. Raulund-Rasmussen,(2003). Carbon and nitrogen in Danish forest soils-contentsand distribution determined by soil order. Soil ScienceSociety American Journal, 67: 335-343.
29. Liu, X. B., and S. Y. Gu. (2016). A Brief Discussion on EnergyUse and Greenhouse Gas Emission in OrganicFarming.International Journal of Plant Production,10(1):1735–6814. Retrieved (www.ijpp.info).
30. McLauchlan, K.K., 2006. Effects of soil texture on soil carbonand nitrogen dynamics after cessation of agriculture.
Geoderma, 136: 289-299.31. Wang, Shao-xian et al. 2012.Fertilization Increases Paddy
Soil Organic Carbon Density. 13(4):274–82.