analysis and evaluation of road defects on the flexible
TRANSCRIPT

ANALYSIS AND EVALUATION OF ROAD DEFECTS ON
THE FLEXIBLE PAVEMENT
A case study from LPU main gate Chaheru to Rama Mandi
Submitted in partial fulfillment of the requirements
of the degree of
MASTER OF TECHNOLOGY
in
CIVIL ENGINEERING
by
SATYA PAL SINGH
(11502602)
Supervisor
MR. WASEEM AKRAM BHAT
UID (19417)
Assistant Professor
School of Civil Engineering
LOVELY PROFESSIONAL UNIVERSITY, PHAGWARA
2017

i
DECLARATION
I, Satya Pal Singh (Regd. No. 11502602 ), hereby declare that this thesis report entitled
“Analysis and evaluation of the road defects on the flexible pavement” submitted in the
partial fulfillment of the requirements for the award of degree of Master of Civil Engineering, in
the School of Civil Engineering, Lovely Professional University, Phagwara, is my own work.
This matter embodied in this report has not been submitted in part or full to any other university
or institute for the award of any degree.
Date: Satya Pal Singh
Place: Phagwara

ii
CERTIFICATE
Certified that this project report entitled “Analysis and evaluation of road defects on the flexible
pavement” submitted individually by student of School of Civil Engineering, Lovely
Professional University, Phagwara , carried out the work under my supervision for the Award
of Degree. This report has not been submitted to any other university or institution for the
award of any degree.
Signature of the supervisor
Mr. Waseem Akram Bhat
Assistant Professor

iii
ACKNOWLEDGEMENT
A thesis cannot be completed without the help of many people who contribute directly or
indirectly through their constructive criticism in the evolution and preparation of this work. It
would not be fair on my part, if I don’t say a word of thanks to all those whose sincere advice
made this period a real educative, enlightening, pleasurable and memorable one.
First of all, a special debt of gratitude is owned to my assistant Professor Mr. Waseem Akram
Bhat for his gracious efforts and keen pursuits, which has remained as a valuable asset for the
successful instrument my dissertation report. His dynamism and diligent enthusiasm has been
highly instrumental in keeping my spirit high. His flawless and forthright suggestion blended
with an innate intelligent application has crowned my task a success. I would also like to offer
my sincere thanks to my faculty, teaching and non teaching of civil engineering (CED), and
staff of central library, LPU, Pahagwara for their assistance. I am extremely thankful to Mr.
Ram Simran for helping me carry out experimental work.
I would also like to thank my parents, grandmother, sister and my friends for their constant
encouragement during the entire course of my thesis work.
Signature of Student
SATYA PAL SINGH

iv
ABSTRACT
According to the research, the flexible pavement defects and its causes are defined in terms of
decrease in serviceability which was caused by the development of different types of
deteriorations like cracks, surface defects, disintegration etc. on the flexible pavement. Before we
going into the maintenance part, we will try to focus on the various defects and its causes. There
are so many reasons for bituminous pavement failures. The level of correction in the existing
surface will extend the life of maintenance works and strengthening the layer as well. According
to my study, there are mainly 2 parameters i have figured out which are: - pavement cracking and
surface defects on the pavement. While other distresses have been excluded including these
parameters while stepping for maintenance part. With the study of maintenance techniques, there
are various methods we are going to adopting for pavement protection which will help to
increasing the life of the pavement and failure delay. The motive of this study was to analyze and
evaluate the various causes of pavement defects, and provision of remedies to improve the
various failures of the surface. Based on the past researches of researchers, various techniques
has been studied with their measures which are helpful for increasing the life of serviceability.
This case study attempts to identify the various parameters that affect the performance of the
flexible pavement and by rid off this problem by applying the remedial measures over the
particular stretch. LPU main gate to Rama-mandi was chosen as a case study. It is a pursuit
towards a study of the road condition of Punjab with respect to varying soil, traffic and climatic
conditions, periodic performance evaluation of selected roads of representative types and
development of distress prediction models for roads of Punjab. To achieve this aim, we divide
the entire area into no. of sample units. By taking the measurement of each part, we measured the
various type of defects, corresponding to that we found out pavement condition Index (PCI). A
PCI is a numerical index which tells us about the condition of the road as per its range that is 0 to
100 which was coming out to be very poor. Testing was done to know the reason of the
pavement failures and we found out that the most of the pavement was damaged by alligator
cracks by repetitive heavily loading of the vehicles and surface defects. Pavement also damaged
due to poor drainage and inadequate designing and poor quality of material.
Keywords:- Flexible Pavement, distresses, analysis, evaluation.

v
TABLE OF CONTENT
CHAPTER DESCRIPTION PAGE NO.
DECLARATION i
CERTIFICATE ii
ACKNOWLEDGEMENT iii
ABSTRACT iv
TABLE OF CONTENT v
LIST OF FIGURES ix
LIST OF TABLES xi
CHAPTER 1 INTRODUCTION 1-4
1.1 General 1
1.2 Problem Definition 2
1.3 Study Area 3
1.3.1 Location 3
1.3.2 Coordinates 3
1.3.3 Elevations 3
1.3.4 Terrain and Weather 4
1.4 Methodology Adopted 4
CHAPTER 2 LITERATURE REVIEW 5-12
2.1 Flexible pavement deterioration and its causes 5
vi
2.2 Application of the waste plastic as a effective construction
material in the flexible pavement 6
2.3 Design approach for Geocell Reinforcement flexible pavement 7
2.4 Analysis of the influence of soft soil depth on the subgrade
capacity for flexible pavement 7
2.5 Consideration of the deterioration of the stabilized subgrade
soil in analytical road pavement design 8
2.6 Fatigue and Rutting in the flexible pavement 9
2.7 Survey and evaluation of flexible pavement failures 11
CHAPTER 3 DATA COLLECTION AND EXPERIMENTAL DESIGN 13-42
3.1 General 13
3.2 How to collect the data 13
3.3 Probable defects of the pavement 22
3.3.1 Transverse Cracks 22
3.3.2 Block Cracks 23
3.3.3 Alligator Cracks 23
3.3.4 Slippage Cracks 24
3.3.5 Patching 24
3.3.6 Potholes 25
3.3.7 Longitudinal Cracks 25
3.3.8 Swelling 26

vii
3.3.9 Edge Cracking and Shoulder drop off 26
3.3.10 Weathering and Raveling 27
3.4 Factors affecting the performance of the flexible pavement 27
3.5 Materials 29
3.6 Testing of the materials 30
3.6.1 Aggregate crushing value test 31
3.6.2 Aggregate impact value test 33
3.6.3 Los angeles abration test 35
3.6.4 Penetration test 37
3.6.5 Softening point of the bitumen 39
3.6.6 Ductility test of the bitumen 41
CHAPTER 4 ANALYSIS AND TEST RESULTS 43-47
4.1 General 43
4.2 Tests on bitumen 43
4.2.1 Penetration Value Test 43
4.2.2 Softening point of the bitumen 44
4.2.3 Ductility Test 44
4.3 Tests on aggregates 44
4.3.1 Aggregate Impact value test 44
4.3.2 Aggregate crushing value test 45
4.3.3 Los Angele’s abrasion test 45

viii
4.4 Causes of the defects 45
4.5 Selection of the best maintenance option 46
CHAPTER 5 CONCLUSION AND FUTURE RECOMMENDATIONS 48-49
5.1 General 48
5.2 Conclusion 48
5.3 Future scope and recommendations 48
REFERENCES 50-51

ix
LIST OF FIGURES
FIGURE NO. DESCRIPTION PAGE NO.
1.1 Map of the stretch from LPU to Rama Mandi 3
1.2 Flow chart 4
3.1 Transverse cracks 22
3.2 Block cracks 23
3.3 Alligator cracks 23
3.4 Slippage cracks 24
3.5 Patching 24
3.6 Potholes 25
3.7 Longitudinal cracks 25
3.8 Swelling 26
3.9 Edge cracking and shoulder drop off 26
3.10 Weathering and ravelling 27
3.11 Compression testing machine 32
3.12 Impact testing machine 34
3.13 Los angeles abrasion testing machine 36
3.14 Penetration test apparatus (penetrometer) 37
3.15 Softening point apparatus 40
3.16(a) Briquette Apparatus 41

x
3.16(b) Ductility machine 41

xi
LIST OF TABLES
TABLE NO. DESCRIPTION PAGE NO.
3.1 Data sheet of various types of defects 14
3.2 Alligator cracking distress table 20
3.3 Pavement condition index calculation table 21
4.1 Penetration values of the bitumen 43

1
CHAPTER 1
INTRODUCTION
1.1 GENERAL
Pavement is anything which is being covered or paved, that is the covering of solid material
like floor laid so that is to make a comfortable and hard surface for travel. Road pavement is
a durable material for surface which is resting on an area design to sustain vehicular traffic or
walk traffic, such as a road or pedestrian. Pavement is generally classified as
i. Flexible pavement
ii. Rigid Pavement
iii. Semi-Rigid pavement
iv. Composite pavement
FLEXIBLE PAVEMENT
The pavement which constructed with different number of layers of granular materials and
covering of one or more of the waterproofing asphalt layer is considered as flexible. The flexible
pavement will deflect under the load of the wheels. The purpose of this design of a flexible
pavement is to prevent the excessive bending of any layer of the pavement structure, An over
stressing may done if it fails in the design of the layer, which will cause the pavement directly to
fail. In these flexible pavements, due to the strength of each layer is different; the load
distribution pattern changes from one layer to another. The strongest material is to be provided
on the top layer and the weakest layer is to be provided to the bottom layer.
RIGID PAVEMENT
Rigid pavements are those pavements which are constructing from reinforced concrete slabs
(RCC) or cement concrete. The grouted concrete roads are the categories of semi-rigid
pavements. The design criteria of this type of pavement are based on providing a cement
concrete slab of sufficient strength to sustain the loads from vehicular movement. The rigid
pavement has high modulus of elasticity and rigidity to distribute the load over a large area of the
soil.

2
SEMI-RIGID PAVEMENT
The type of pavements in which a semi rigid base layer, which is usually made up of cement-
stabilized base or cement treated base, is laid with a top flexible layer of bituminous mixture.
Typical examples of semi rigid pavements are the lean-concrete base, soil-cement
and lime-pozzolona concrete construction.
COMPOSITE PAVEMENT
The pavements are called “composite” since they consist of layers of the different materials
bonded together. They are provided for their strength purpose wherever it requires. A composite
type of pavement is the one which consists of multiple structurally significant layers of
heterogeneous composition. The type of composite pavements generally provides are:
Asphalt concrete over plain concrete cement (AC/PCC)
Plain concrete cement over plain concrete cement (PCC/PCC)
1.2 PROBLEM DEFINING
An highway which is either flexible or rigid can get deteriorated in its level of serviceability due
to various causes. These factors are
1. Traffic loading
2. Environmental Factors
3. Quality of the material
4. Drainage
According to IRC, a pavement is designed for its design period of 10 years. After its
design period pavement is likely to fail and needs maintenance operations to extend its life
further. But sometimes it may fail earlier to its design period because of low quality of material
or may by other factors. So the possible causes which arises has mentioned below.
Various types of failures are:
1) Alligator Cracking or Fatigue Cracking
2) Block Cracking
3) Hungry Surface
4) Formation of Corrugations
5) Depressions

3
6) Fatty surface or Bleeding
7) Formation of Potholes
8) Loss of Aggregates
9) Stripping
10) Reflection Crack
1.3 STUDY AREA
1.3.1 Location
The area of the site will be focusing on NH1- LPU to Rama-Mandi, Jalandhar, Punjab.
The area was coming out to be 10 kms.
Fig 1.1 Map of the stretch from LPU to Rama Mandi
1.3.2 Coordinates
The coordinates at Entrance, Lovely Professional University to Rama Mandi are
calculated approximately as 31°15’37.8”N 75°42’27”E (Entrance, LPU) to
31°18’39.68”N 75°21’53.94”E (Rama Mandi)
1.3.3 Elevations
According to the map study, the elevation of the particular stretch is calculated 759 as
minimum, 771 as average and 785 as maximum elevation.

4
1.3.4 Terrain and Weather
It is a plane terrain approximately having flatter surface with some of the vertical curves.
The region of this area is hotter on summers, colder on winters. Temperature goes upto
45°C or more on summer and go down to 5°C on winters.
1.4 METHODOLOGY ADOPTED
The method which we are going to adopted is a flow diagram mention as below:
Fig:1.2 Flow Chart
INTRODUCTION
LITERATURE REVIEWS
DATA COLLECTION AND
EXPERIMENTAL DESIGN
ANALYSIS AND TEST RESULTS
CONCLUSION

5
CHAPTER 2
LITERATURE REVIEW
2.1 FLEXIBLE PAVEMENT DETERIORATION AND ITS CAUSES
Sharad. S. Adlinge, Professor AK Gupta
IOSR Journal of Mechanical and Civil Engineering (IOSR-JMCE)
ISSN: 2278-1684, PP: 09-15
In this research the failure of pavement was defined in terms of decreasing the
serviceability caused by development of cracks and formation of ruts. Before going into
maintenance part, it is better to interpret the causes of failure. Failures of bituminous pavements
are caused due to a lot of reasons or combination of one with the other. Application of correct
measure in existing surface will increase the overall life of pavement and will increase its
supporting power. Three parameters were considered during this research that is unevenness
index, rutting and pavement cracking. The purpose of this study was to evaluate the causes of
pavement failure and discuss the particular remedies which can be adopted to improve the
pavement performance.
CONCLUSION
The causes of deterioration were summed up as follows:
a) Impact load of traffic, especially of new roads on where the road is designed for
comparatively for less traffic.
b) When a new road is constructed with better facilities the traffic from other roads also
gets diverted to this new facility causes fatigue to newly constructed pavement.
c) Temperature fluctuations were considered to be prime cause of bleeding and cracking.
d) When shoulders provided were not adequate, it lead to edge failures.

6
e) If the provided subgrade was of poor clay, corrugations were resulted.
2.2 APPLICATION OF WASTE PLASTICAS AN EFFECTIVE CONSTRUCTION
MATERIAL IN THE FLEXIBLE PAVEMENT
SasaneNeha .B. Gaikwad .Harish , Dr. J R Patil, Dr. S.D. Khandekar
International Research Journal of Engineering and Technology (IRJET)
Volume: 02, Issue: 03/June-2015
To preserve a particular road so that it behaves well in future for design period, it needs a
systematic and pre-planned approach. It will reduce its maintenance operations and will increase
its service life. Nowadays a pavement is subjected to various types of loading and which
increases rapidly at an alarming rate causing failure of a pavement before it is expected to fail.
So there is need of an alternative advanced material to be used while construction of a pavement,
so that it behaves well during its service life. Use of plastic waste becomes handy in that matter.
The paper included various laboratory tests bitumen, aggregate and bitumen-aggregate plastic
mix.
CONCLUSION
a) After performing various tests like penetration test, marshal stability test and ductility test
on bitumen with addition of waste plastic it was been observed that with the increase in
quantity of waste plastic in bitumen, the properties of bitumen were enhanced
b) When waste plastic was used in newly constructed flexible pavements they showed good
results when compared to existing ones
c) It was concluded that the optimum use of plastic can be done up to 10% based on marshal
stability test
d) This method of using plastic waste in pavement construction emerged as an alternative
for eco-friendly disposal of plastic
e) When aggregates were coated with polymers, their performance under wheel loads
emerged to be better.

7
2.3 DESIGN APPROACH FOR GEOCELL REINFORCED FLEXIBLE
PAVEMENTS
ChandanBasu&Jitendra Kumar Soni
Highway Research Journal
Indian Road Congress
Volume 6, No: 2, July-December 2013
Geocell is a recent development in civil industry. It has a unique three dimensional
structure which makes it more important when compared to other geosynthetics. When
the local soil is confined with a geosynthetic material like geocell, it shows better
structural properties. When the geocells are incorporated in the pavement layers, it
facilitates better load distribution and reduces the vertical stresses that are transmitted to
the underlying layers. Use of geocells reduces pavement thickness and allows it to give
adequate support for moving loads.
CONCLUSION
Geocell when used properly in flexible pavement depending upon the requirement, it can
yield significant reduction in bituminous layers and reduces the overall cost of pavement.
However this technology needs skilled and experienced installation. Besides cost saving
it also reduces the overall construction time and increases the service life of a particular
pavement.
2.4 ANALYSIS OF THE INFLUENCE OF SOFT SOIL DEPTH ON SUBGRADE
CAPACITY FOR FLEXIBLE PAVEMENTS
Carvajal E & Romana M.
Proceeding of Int. conference on soil mechanics and Geotech. Paris 2013
Flexible pavement structure is analyzed on soft soil subgrade, through the finite
element modeling of a multilayered system, with objective to evaluate the effect of soft
soil on the pavement depth. The analysis also includes iterative procedure to evaluate

8
influence of small strains on stiffness of the soil sample. A simple static load imposed by
a heavy truck was considered to evaluate the pavement response. The results so obtained
were co-related with the empirical one, so as to estimate rutting failure intensity.
CONCLUSION
It was concluded that deep ground treatments are needed to be applied for achieving an
allowable capacity of soft soil up to a minimum depth of 6m, otherwise maintenance cost
will increase. The theoretical procedure done by finite element modeling system depicted
that soft soil may be significant for long term behavior of flexible pavement, especially in
case when shallow treatment of subgrade would be uneconomic. The application of deep
treatment was good to achieve allowable capacity of soft soil.
2.5 CONSIDERATION OF THE DETERIORATION OF STABLISED SUBGRADE
SOIL IN ANALYTICAL ROAD PAVEMENT DESIGN
Jabar M. Rasul, Michael P.N. Burrow, Gurmel S. Ghataora
Transportation Geotechnics(2016), vol.9:96-109
The stabilization of road subgrade soil may improve its mechanical properties considerably,
however under the combined effect of cumulative traffic load and weathering these materials
deteriorate over time and lose performance. However, current road design procedures neglect
such deterioration of stabilised soils and consequently their use may result in the under design of
road pavements and as a result unplanned maintenance and /or premature road failure. To
address this, this research presents the results of a research program marrying experimental,
analytical and numerical work which was used to develop a methodology which can be used for
the first time to design accurately road pavements incorporating stabilized subgrade soils.
An extensive experimental program was carried out consisting oflaboratory durability tests to
determine the mechanical behavior of stabilized subgrade soils,in terms of permanent
deformation and resilient modulus, under cycles of wetting and drying.Results of the durability
tests were used to validate an analytical predictive equation which considers the changes that
take place to the material after cycles of wetting and drying. The experimental results show a

9
decrease in the resilient modulus after 25 cycles of wetting anddrying cycles for 3 types of fine
grained subgrade soils stabilized with varying amounts of lime-cement. In order to adequately
replicate the stress dependency of the performance of the stabilised subgrades for analytical
pavement design, two equations were developed that relate the resilient modulus of a stabilised
soil with unconfined compressive strength (UCS). The developed equations were utilized with a
numerical finite element model of a road pavement to determine the most appropriate road
pavement designs, on an engineering basis, for a variety of stabilised soils.
CONCLUSION
a) A novel relationship which can predict the deteriorated resilient modulus values for different
stabilizer contents and types from a deteriorated resilient modulus value of one specified
stabilizer content which was tested for durability.
b) Two correlation equations derived from permanent deformation and unconfined compressive
strength tests. The equations predict with an adequate accuracy the resilient modulus from the
unconfined compressive strength and the stress state, for three soil types at four different
stabilizer contents. The correlation equations can be used to determine a set of resilient modulus
values for a series of different stress states.
c) A procedure to take into account the nonlinearity of the stress dependency of the resilient
modulus values of stabilized and unstablized subgrade soils.
d) A performance model for stabilized subgrade soils which can predict with a satisfactory
degree of accuracy the incremental accumulation of permanent deformation.
2.6 FATIGUE AND RUTTING LIVES IN FLEXIBLE PAVEMENT
Ahmed Ebrahim Abu El-MaatyBehiry
Ain Sham Engineering journal (2012) 3,367-374
In this research, the flexible pavement is designed based on climatic conditions and axle load
limits. According to the Egyptian code has specified certain load limits that should not be
exceeded. The heavily loaded vehicles like overweight trucks cause many type of deterioration to

10
the pavement and thus reduce its life. The motive of the study is studying the effect of axle load
increase, and the variation in pavement modulus on the overall pavement life.
This research used the BISAR software and the Egyptian environmental materials conditions of
pavement to evaluate the tensile strains which are occurring on the asphalt concrete (AC) layer
and the compressive strains above the subgrade surface. The results revealed that tensile and
compressive strain increased with increasing axle loads and decreased with increasing asphalt
layer modulus thus the excessive trucks should be prohibited when their weights exceed the
limits. Base thickness and subgrade resilient modulus were the key elements which control the
equilibrium between fatigue and rutting lives.
CONCLUSION
a)Tensile and compressive strain increased with increasing axle loads and decreased with
increasing asphalt layer elastic modulus. Furthermore, fatigue and rutting lives decrease
dramatically with increasing the axle load, especially after the axle load exceeds 150 kN for
fatigue life and 120 kN for rutting life.
b) The fatigue damage basically increases in a higher rate with increasing the axle load while the
rutting damage rate increases with a converging rate. Furthermore with increasing asphalt layer
elastic modulus the fatigue and rutting damage decrease.
c) Fatigue life has no sensitivity with the variation of base thickness compared with rutting life,
which is high sensitive. While both fatigue and rutting lives have a good sensitivity with the
variation of surface thickness specially at base thickness thicker than 300 mm.
d) The increase of elastic modulus of asphalt or base layers has not obvious effect on the rutting
life at base thickness thinner than 300 mm, thicker thickness lead to obvious increase in Rutting
life. With respect to fatigue life, it has no sensitivity with the variation of base thickness while
has a good sensitivity with the variation of surface modulus or base modulus at all values of base
thickness.
e) The optimum axle load causing both fatigue and rutting failures at the same time is about 135
kN. Thus, the maximum allowable axle load should not exceed 135kN because it will cause a
fast deterioration rate to the pavement especially in summer season. Moreover, base thickness d2
and subgrade elastic modulus E3 are the key elements which control the equilibrium between
11
rutting and fatigue life.
f) The pavement design life is governed by fatigue failure with smaller axle loads that is
less than 150 kN and by rutting failure with greater axle loads.
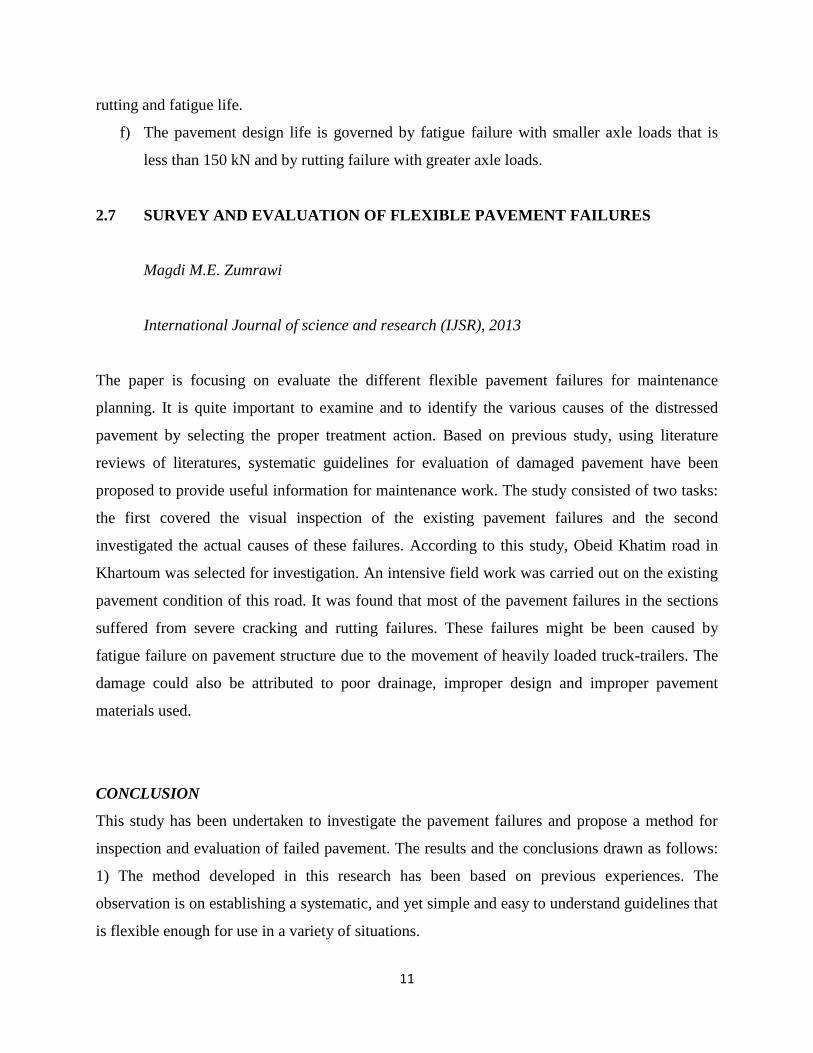
2.7 SURVEY AND EVALUATION OF FLEXIBLE PAVEMENT FAILURES
Magdi M.E. Zumrawi
International Journal of science and research (IJSR), 2013
The paper is focusing on evaluate the different flexible pavement failures for maintenance
planning. It is quite important to examine and to identify the various causes of the distressed
pavement by selecting the proper treatment action. Based on previous study, using literature
reviews of literatures, systematic guidelines for evaluation of damaged pavement have been
proposed to provide useful information for maintenance work. The study consisted of two tasks:
the first covered the visual inspection of the existing pavement failures and the second
investigated the actual causes of these failures. According to this study, Obeid Khatim road in
Khartoum was selected for investigation. An intensive field work was carried out on the existing
pavement condition of this road. It was found that most of the pavement failures in the sections
suffered from severe cracking and rutting failures. These failures might be been caused by
fatigue failure on pavement structure due to the movement of heavily loaded truck-trailers. The
damage could also be attributed to poor drainage, improper design and improper pavement
materials used.
CONCLUSION
This study has been undertaken to investigate the pavement failures and propose a method for
inspection and evaluation of failed pavement. The results and the conclusions drawn as follows:
1) The method developed in this research has been based on previous experiences. The
observation is on establishing a systematic, and yet simple and easy to understand guidelines that
is flexible enough for use in a variety of situations.

12
2) The method was developed in this research is pavement failure investigation. It was
developed in this research can serve as a useful guide for the inspection and evaluation of
pavement failures. The method, combined with the experience of the highway engineer
and adequate materials investigation, will help to ensure that the cause of a pavement
failure can be reliably determined.
3) The method developed for inspection and evaluation was trialed in pavement failures of
Obeid Khatim road, to evaluate the effectiveness of the method for real use. It was
found that the method was good as a general guide, particularly for junior highway
engineers. However, the experience of the engineer is also an important factor in
correctly diagnosing the pavement failure causes and determination of the best
maintenance option.

13
CHAPTER 3
DATA COLLECTION AND EXPERIMENTAL DESIGN
3.1 GENERAL
This chapter deals with the presentation of data obtained from the site which are conducted on
flexible pavement. In order to achieve the present study, we studied the different type of defects
on the pavement and their causes as well.
The survey of data collection was done by two ways: first was walking along the road and
observe the various defects and second was by means of measurement. That is the whole area is
to be selected by no. of chainage corresponding to that sample units will be calculated.
3.2 HOW TO COLLECT THE DATA
The data is done by means of sample units. The area under different types of defects was
observed, measured and then a survey sheet was prepared of these sample units on the stretch.
The type of defects is taken as their severity level as small, medium or large according to their
respective conditions.
For that, we have prepared a sample sheet of different types of distresses. The whole area was
selected in chainage into the equal parts. By taking each and every part in account, we started the
survey. According to ASTM, there should be minimum 30 sample units under the given stretch.
So we found 45 sample units in the whole area.
Therefore the chainage is coming around
The length of the stretch= 9.7 kms~10 kms
The no. of calculated sample units= 45
Therefore, chainage is coming out to be 10,000/45= 222.222 metres.
The sample units are collected on both side of the road starting from LPU main to Left to right
and coming from Rama Mandi to right to left respectively.
At every part, we calculate the atleast one sample unit. The survey sheet of the various defects
corresponding to their severity level as shown below:

14
Table:3.1 Data sheet of various type of defects
Asphalt Road Surface Distress Data Sheet
Branch—Transportation Engineering
Station – LPU Main gate to Rama Mandi
Sample Unit- 45
Surveyed by— Satya Pal Singh
Date – 29/11/2016
Sample Area (in kms)—700 sq.m (approxi.)
SKETCH
7m
100 m
S.N
o
Distress
Type
Level of
Distress
Severity
Chainage
in metres
Righ
t Left
Dimension (in metres)
H/B/L
Remarks
L H M H B L
1 Longitudinal
cracks √ 0+000 √ - - 3.4
At the end of
flyover,
chaheru
2 Alligator
cracks √ 0+222 √ - 0.6 3.7
Near petrol
pump,
chaheru
3 Patches √ 0+444 √ - 0.32 0.51
Near petrol
pump,
chaheru
4 potholes √ 0+666 √ 0.0
06 0.23 0.23
Near police
booth, haveli
5 Slippage
crack √ 0+888 √ - 1.3 1.7
Near to
haveli
6 Longitudinal
cracks √ 1+1111 √ - - 4.2
Near to
haveli
7 Swell √ 1+1333 √ - 0.53 0.58 At Haveli
8 potholes √ 1+1555 √ 0.0
03 0.29 0.26
Near
showroom
At haveli
9 Alligator
cracks √ 1+1777 √ - 2.4 8.1
Uphill,
haveli
10 Corrugation √ 2+2000 √ - 3.2 3.2 Near police
booth, haveli

15
11 Alligator
cracks with
longitudinal
cracks
√
2+2222
√
-
0.8, -
3.0, 2.2
Along some
steps
12
Alligator
cracks with
potholes
√ 2+2444 √ 0.1
5 2.0, 3.0 8.0, 11.5
Near side
lane to LPU
13 Transverse
cracks √ 2+2666 √ - - 3.6
Along some
steps
14 Longitudinal
cracks √ 2+2888 √ - - 2.4
At uphill on
flyover
15 Alligator
cracks √ 3+3111 √ - 0.7 4.2 Near LPU
16 Alligator
cracks √ 3+3333 √ - 2.7 4.9
In front of
LPU main
gate
17 Patches √ 3+3555 √ 0.5 1.4
Near
McDonalds,
Haveli-Viva
collage
18
Block
cracking with
patching
√ 3+3777 √ - 2.2, 2.2 2.5, 3.3
Near hotel
grand resort,
Haveli
19 Alligator
crack √ 4+4000 √ 3.0 13.7
Near hotel
grand resort,
Haveli
20
Longitudinal
crack with
alligator
cracks
√ 4+4222 √ 2.5 12.8
Near modi
resort viva-
Rama Mandi
21
Longitudinal
cracks with
small
potholes
√ 4+4444 √ 0.0
11 - 10.4
Along some
steps toward
jalandhar
cantt
22
Patches
√
4+4667
√
3.1
7.9
Underpass,
Rama Mandi
23 Potholes √ 4+4889 √ 0.0
05 0.32 0.32
Near
underpass,
Rama Mandi
24 Edge cracks √ 5+5111 √ - 0.6 1.1
In front of
resident
colony,
Rama Mandi
25 Alligator
cracks √ 5+5333 √ - 1.5 4.3
Along some
steps, Rama
Mandi
26 Block cracks √ 5+5555 √ - 4.2 11.7 Near police
booth, Rama
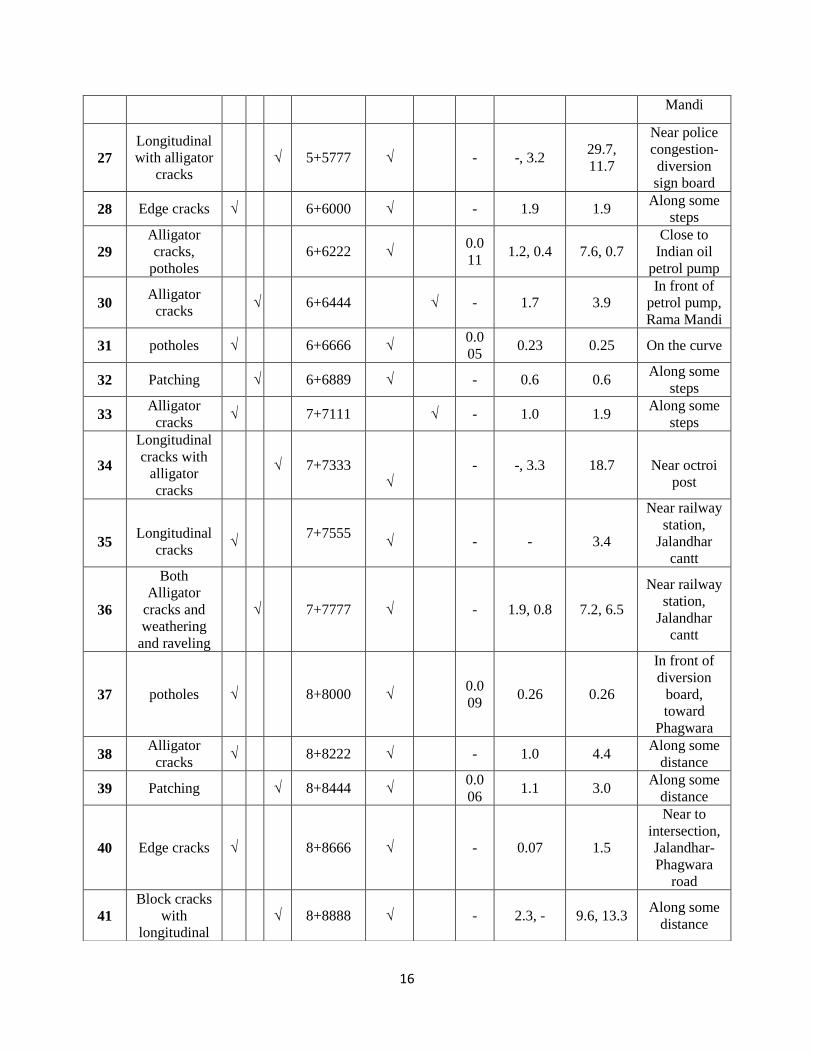
16
Mandi
27
Longitudinal
with alligator
cracks
√ 5+5777 √ - -, 3.2 29.7,
11.7
Near police
congestion-
diversion
sign board
28 Edge cracks √ 6+6000 √ - 1.9 1.9 Along some
steps
29
Alligator
cracks,
potholes
6+6222 √ 0.0
11 1.2, 0.4 7.6, 0.7
Close to
Indian oil
petrol pump
30 Alligator
cracks √ 6+6444 √ - 1.7 3.9
In front of
petrol pump,
Rama Mandi
31 potholes √ 6+6666 √ 0.0
05 0.23 0.25 On the curve
32 Patching √ 6+6889 √ - 0.6 0.6 Along some
steps
33 Alligator
cracks √ 7+7111 √ - 1.0 1.9
Along some
steps
34
Longitudinal
cracks with
alligator
cracks
√ 7+7333
√
- -, 3.3 18.7
Near octroi
post
35
Longitudinal
cracks
√ 7+7555
√
-
-
3.4
Near railway
station,
Jalandhar
cantt
36
Both
Alligator
cracks and
weathering
and raveling
√ 7+7777 √ - 1.9, 0.8 7.2, 6.5
Near railway
station,
Jalandhar
cantt
37 potholes √ 8+8000 √ 0.0
09 0.26 0.26
In front of
diversion
board,
toward
Phagwara
38 Alligator
cracks √ 8+8222 √ - 1.0 4.4
Along some
distance
39 Patching √ 8+8444 √ 0.0
06 1.1 3.0
Along some
distance
40 Edge cracks √ 8+8666 √ - 0.07 1.5
Near to
intersection,
Jalandhar-
Phagwara
road
41
Block cracks
with
longitudinal
√ 8+8888 √ - 2.3, - 9.6, 13.3 Along some
distance
17
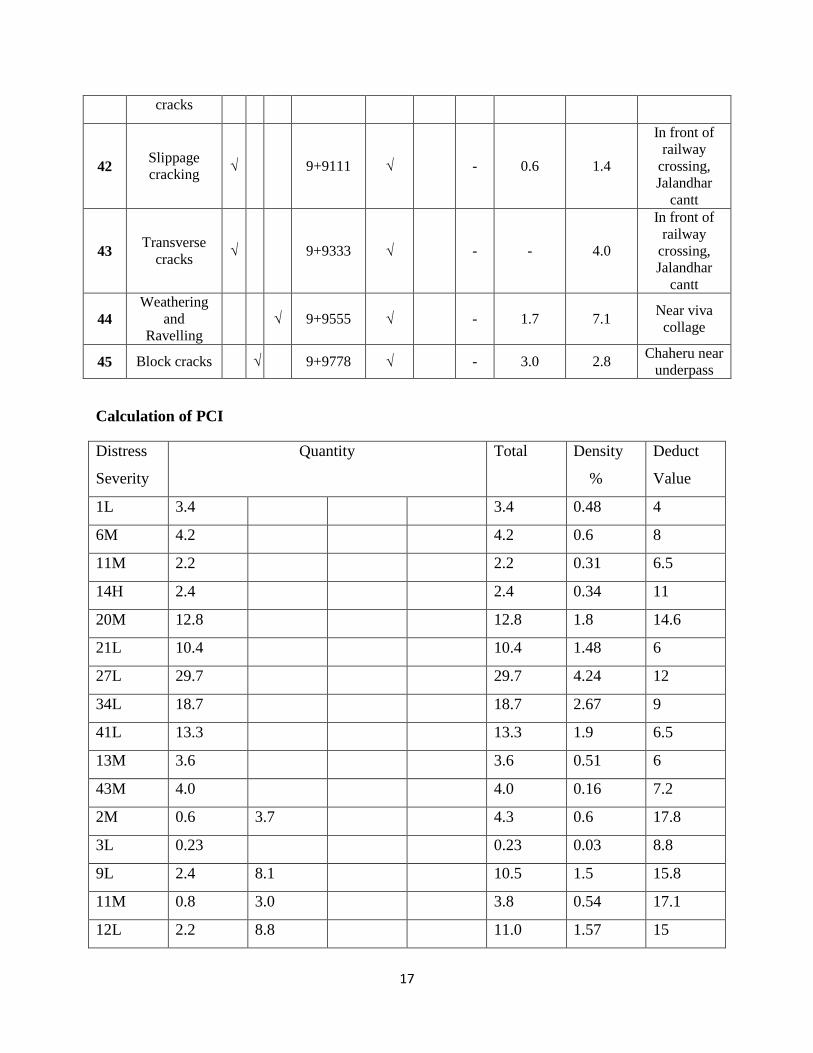
Calculation of PCI
Distress
Severity
Quantity Total Density
%
Deduct
Value
1L 3.4 3.4 0.48 4
6M 4.2 4.2 0.6 8
11M 2.2 2.2 0.31 6.5
14H 2.4 2.4 0.34 11
20M 12.8 12.8 1.8 14.6
21L 10.4 10.4 1.48 6
27L 29.7 29.7 4.24 12
34L 18.7 18.7 2.67 9
41L 13.3 13.3 1.9 6.5
13M 3.6 3.6 0.51 6
43M 4.0 4.0 0.16 7.2
2M 0.6 3.7 4.3 0.6 17.8
3L 0.23 0.23 0.03 8.8
9L 2.4 8.1 10.5 1.5 15.8
11M 0.8 3.0 3.8 0.54 17.1
12L 2.2 8.8 11.0 1.57 15
cracks
42 Slippage
cracking √ 9+9111 √ - 0.6 1.4
In front of
railway
crossing,
Jalandhar
cantt
43 Transverse
cracks √ 9+9333 √ - - 4.0
In front of
railway
crossing,
Jalandhar
cantt
44
Weathering
and
Ravelling
√ 9+9555 √ - 1.7 7.1 Near viva
collage
45 Block cracks √ 9+9778 √ - 3.0 2.8 Chaheru near
underpass

18
15H 0.7 2.2 2.9 0.41 21
16L 2.7 4.9 7.6 1.08 11
19L 3.0 13.7 16.7 2.38 18.7
20L 2.5 5.8 8.3 1.18 11.7
25M 0.5 4.3 4.8 0.68 18.6
27H 0.9 3.7 4.6 0.65 26
29L 1.2 7.6 8.8 1.25 13
30M 1.7 3.9 5.6 0.8 20.3
33L 1.0 1.9 2.9 0.41 21
34L 3.3 18.7 22 3.14 22
36M 1.9 7.2 9.1 1.3 24.7
38L 1 4.4 5.4 0.77 19.6
7M 0.29 0.29 0.04 18.6
11L 0.6 0.6 0.085 20
21L 0.011 0.011 0.001 2.5
23L 0.32 0.32 0.045 12
29L 0.7 0.7 0.1 21.5
31L 0.25 0.25 0.035 9.8
37L 0.26 0.26 0.037 10.1
2H 0.32 0.51 0.83 0.118 8.3
17L 0.5 1.4 1.9 0.27 0.2
18H 2.2 3.3 5.5 0.78 18
22L 3.1 7.9 11 1.57 3.4
32M 0.6 0.6 1.2 0.171 3.5
39H 1.1 3.0 4.1 0.58 16
43M 4.0 4.0 0.57 7
24L 1.1 1.1 0.49 1
28M 1.9 1.9 0.27 5.03
40L 1.5 1.5 0.21 10
18M 2.2 2.5 4.7 0.67 1.7

19
26H 4.2 11.7 15.9 2.27 14.7
41H 2.3 9.6 11.9 1.7 10.4
45M 2.8 3.0 5.8 0.83 2.2
4M 1.3 1.7 3.0 0.43 7.1
42L 0.6 1.4 2.0 0.28 2.3
22H 0.112 0.112 0.016 7
28L 0.036 0.036 0.005 3
36M 0.8 6.5 7.3 1.04 8.9
44M 1.7 7.1 8.8 1.25 9.3
5L 1.3 1.7 3.0 0.42 1.6
9L 0.5 3.2 3.7 0.53 1
7M 0.53 0.58 1.11 0.158 12
Here, we’ve arranged all the values of each distress in terms of its severity level. Then, calculate
the density by dividing the total quantity of each distress of each severity level by the total area
of the sample and multiplied it with 100.
For example, At 1L, the total quantity was calculated as 3.4. Therefore, density was
(3.4/2500)*100 = 0.136%
Then, calculated the deduct values (D.V) of each distress of each severity level from the distress
deduct value graph as per ASTM-D6433
Here, I have mention the deduct value graph of alligator cracking.

20
Table: 3.2 Alligator cracking distress table:
The next step will be to find out the maximum corrected deduct value (CDV). Here is the
procedure of maximum CDV:-
If no value or only one value is greater than 2 then the total value will be used in the place of
maximum CDV for calculation of the CDV otherwise the maximum CDV will be calculated as
Arrange all the values of C.V in their descending order.
Calculate the no. of deducts from the given formula
m= 1+(9/98)(100-HDV) < = 10
where, m= no. of deducts including fractions and should be less than or equal to 10
HDV= Highest individual deduct value

21
For example,
m= 1+(9/98)(100-HDV)
m= 1+(9/98)(100-26)
m= 7.79
Now, after calculating “m” we are going to calculate CDV based on distress severity chart by
arranging the maximum deduct values in a descending order.
Table 3.3 Pavement condition index calculation table:
# Deduct Values Total q CDV
1 26 24.7 22 21.5 21 20.3 19.6 14.77 169.87 8 -
2 26 24.7 22 21.5 21 20.3 19.6 2 157.1 7 73.0
3 26 24.7 22 21.5 21 20.3 2 2 139.5 6 67.5
4 26 24.7 22 21.5 21 2 2 2 121.2 5 63.3
5 26 24.7 22 21.5 2 2 2 2 102.2 4 59.3
6 26 24.7 22 2 2 2 2 2 82.7 3 53.1
7 26 24.7 2 2 2 2 2 2 62.7 2 46.0
8 26 2 2 2 2 2 2 2 40 1 40.0
(Since, m= 1+(9/98)(100-26) = 7.79 < 8
So, we use the highest 7 deducts and 0.79 of 8th
deducts
Therefore, 18.7*0.79 = 14.77)
Now, from the table, we have max. CDV = 73
PCI = 100 – max CDV = 100-73 = 27
Therefore, Rating = Very Poor

22
Severity level of distresses
Distresses Severity level
Longitudinal cracks Moderate
Alligator Cracks Heavy
Potholes Low
Patches Moderate
Transverse Cracks Low
Edge cracking Low
Block Cracking Moderate
Slippage Cracking Low
Weathering and Raveling Low
3.3 PROBABLE DEFECTS OF THE PAVEMENT
Here we have mentioned the pictures of different types of defects that we have studied.
3.3.1 TRANSVERSE CRACKS
These cracks are non- connected cracks which are formed perpendicular to the direction
of the pavement.
Fig:3.1 Longitudinal cracks

23
3.3.2 BLOCK CRACKS
These cracks are similar to fatigue cracks. Only the difference is the cracks occurs over
the entire area of the ground. These cracks divide the entire area into rectangular pieces.
Fig:3.2 Block Cracks
3.3.3 ALLIGATOR CRACKS
It is the series of interconnected cracks which are caused by fatigue failures. These are
normally called as crocodile cracks. These interconnected cracks can be called as cells. Each cell
size may go larger than 300 mm.
Fig:3.3 Alligator Cracks

24
3.3.4 SLIPPAGE CRACKS
These are formed like crescent or horseshoe shape which are generally formed due to
braking of the vehicles. Mostly these cracks shows on intersections due to stopping.
Fig:3.4 Slippage Cracks
3.3.5 PATCHING
It is the area of the pavement which was replaced or covered with a new layer of bitumen
to repair the existing one. This is to be considered as a defect no matter good it is been laid.
Fig:3.5 Patching

25
3.3.6 POTHOLES
These are small bowl-shaped holes formed on the pavement.They have sharp corners and
vertical sides near the top of the hole.
Fig:3.6 Potholes
3.3.7 LONGITUDINAL CRACKS
These are the long, straight cracks and formed parallel to the centre of the pavement. This
could be occurred due to joint failure or frost heaving.
Fig:3.7 Longitudinal Cracks

26
3.3.8 SWELLING
It is the upward budge in the pavement surface. Generally, it is caused by moisture due to
expansion. Swelling is caused by expansion in the supporting layer of the pavement.
Fig:3.8 Swelling
3.3.9 EDGE CRACKING AND SHOULDER DROP OFF
The type of cracking starts from edge of the pavement which may leads to alligator
cracks after some days. The main causes of this type of defects are weak bases of the soil.
Shoulder drop off of the pavement is caused by weak edges of the pavement.
Fig:3.9 Edge Cracking and shoulder drop off

27
3.3.10 WEATHERING AND RAVELLING
It is the adhesion between the asphalt cement and aggregate. Deformation starts with
breaking up of fine aggregates in small pieces and leaves small patches over the pavement. Later,
the larger aggregates breaks and leaves rough surface.
Fig:3.10 Weathering and ravelling
3.4 FACTORS AFFECTING THE PERFORMANCE OF THE FLEXIBLE
PAVEMENT
These are the various factors which affects the performance of the pavement:
a) Subgrade
b) Traffic
c) Moisture content
d) Quality of material
e) Maintenance
a) SUBGRADE
Subgrade is the underlying soil which supports the overall load of the traffic and
transmits into it. Properties of subgrade material are important in determining the
thickness of pavement. When subgrade stability is low, the thickness of pavement
require is greater to protect it from wheel loads.

28
b) TRAFFIC
Traffic is the primary factor to which affecting the performance of the flexible pavement.
The performance of the pavement is mainly affected by its magnitude and frequency of
loading, number of repetitions and configuration of the load by heavily vehicles.
Primarily, the thickness of the pavement depends upon design wheel load. When the
wheel load is higher, the thickness of pavement required is greater.
Design wheel load is further dependent on various factors such as:
Gross wheel load
Contact pressure
Dual or multiple wheel loads and Equivalent single wheel load
Repetition of loads
c) MOISTURE CONTENT
Moisture content significantly weakens the soil strength of the subgrade. It may be form
at any coarse of the pavement. Moisture content variations are dependent upon climatic
conditions, type of soil, drainage conditions, type of pavement and ground water level.
d) QUALITY OF MATERIAL
The material provides on the pavement is mainly supports of the whole pavement. Better
quality of material withstands the whole pavement for a longer period. While the poor
quality of materials leads to failure on the pavement. Quality of material indicates the
required compaction, control of moisture content and use of skilled labor when a
pavement is being constructed.
e) MANTANENCE
It is the most important parameter of the pavement system. The maintenance operations
involve the assessment of road conditions, diagnosis of the related problem and adopting
the appropriate measures. Several types of failures are ranging from minor to major does
takes place on roads even on well constructed highways, so they need a periodic
maintenance to increase their service life.

29
3.5 MATERIALS
Here the type of the materials provides on the flexible pavement:
I. SOIL
Soil is the main material of construction of fill or embankment and the subgrade of
roadways. Soil is also used in other pavement layers usually as stabilized soil in sub-base
and base course. The pavement layers are laid above the soil subgrade which provides the
stability and support to the pavement. The design performance of a pavement particularly
flexible one depends upon the type of subgrade and its properties.
Soil compaction is an important parameter in construction of a road. Compaction of soil
subgrade improves the load supporting capacity of the pavement, which in turn results in
decreased pavement thickness. There are various tests to be performed for evaluation of
strength of soil subgrade and important one is CBR- California Bearing Ratio Test which
is to be carried out in the laboratory.
II. AGGREGATES
Aggregates bear the load stresses occurring on the road and runway pavements and they
also abrasive action of traffic under dry and wet conditions, when used in wearing course.
As compared to fine aggregates, coarse aggregate shave greater importance in pavement
construction. Aggregates are used in construction flexible pavement layers and also as
sub-base course in rigid pavement construction.
There are various tests to be performed to check the desirable properties of aggregates e.g
Aggregate Impact Test, Toughness Test or resistance to Impact test etc.
The required properties of aggregates may be summarized as follows:
1) Resistance against Impact loading.
2) Resistance to abrasive action due to wheel loads.
3) Resistance against getting polished due to moving traffic.
4) Crushing strength must be adequate.

30
5) Shape and gradation.
6) Soundness or resistance against weathering action.
7) Good adhesion with bitumen.
8) Resistance against getting slippery surface.
III. BITUMINOUS MATERIALS
Bitumen is binder used in pavement construction which includes both bitumen and tar.
Bitumen is a petroleum product obtained by distillation of crude petroleum but the road
tar is formed from destructive distillation of charcoal, coal or wood. Both bitumen and tar
have same appearance but they differ in properties. Tar is rarely used in pavement
construction because of its undesirable properties such as susceptible to temperature etc.
The bitumen is brought to sufficient fluidity or viscosity before using it in the pavement
construction by any one of the following methods:
Heating in the form of hot bituminous binder
Dissolving in light oils, in the form of cutback
Dispersion in bituminous water, in the form of bituminous emulsion
Bituminous binders are commonly used in surface course of pavement and may be
also used as a base course in flexible pavement to withstand relatively adverse
conditions of traffic and climate. These materials are also used in soil bitumen
stabilization and to prepare sealer materials for filling and fixing the joints in cement
concrete pavements.
Bitumen is available in variety of types and grades depending upon its use. Paving
grade bitumen is used in construction of roads and for water proofing of structures
industrial grades are used. There are a number of tests to be performed to assess the
quality of bitumen being used in construction e.g. viscosity test, penetration test etc.
3.6 TESTING OF THE MATERIALS
A pavement is designed against a particular design period and is expected to give
satisfactory service for the period of its design life. The recommended design life for
31
National Highways and State Highways is 15 years and for Expressways or Freeways is
20 years as per IRC: 37-2001, when we talk about flexible pavements and for rigid
pavements it can be taken 20-40 years. After the expiry of its design period, the pavement
starts to fail structurally and therefore it needs renewal to extend its life. Even during
service life of pavement the wearing course gets deteriorated due to wheel loads and
needs routine maintenance.
According to “Code of practice for maintenance of bituminous surfaces of highway”
IRC:82, the defects of bituminous surfacing can be summarized as following:
a) CRACKS: For example, alligator cracks, longitudinal cracks, transverse cracks,
shrinkage cracks, edge cracks, reflection cracks etc.
b) DEFORMATIONS: For example, rutting, corrugations, settlement, heaving etc.
c) SURFACE DEFECTS: For example, fatty surfaces, hungry surfaces, smooth
surfaces etc.
d) DISINTEGRATIONS: For example, stripping, loss of aggregates, formation of
potholes, weathering and ravellings etc.
Defects can be occurs in the various layers of the pavements. So, for
all these defects measurements, we are going conduct the various type of tests:
3.6.1 AGGREGATE CRUSHING VALUE TEST
The test is performed on the aggregates for checking the mechanical properties of the
material that is aggregate. It helps us to know
a) Satisfactory resistance to crushing under the roller during construction of pavement
and under application of heavy wheel loads on the pavement.
b) Sufficient resistance to impact loads
c) Adequate resistance to abrasive action and getting polished under traffic movements.
The test on the stone aggregates is carried out on Compression Testing Machine. The coarse
aggregates which are used for pavement construction should be strong enough to resist the
crushing under the load of the rollers during compaction. If the aggregates are weak, the stability
and performance of the pavement is liable to be negatively affected. The resistance to crushing of
the coarse aggregates under the progressively applied compressive loads is articulated in terms of
Aggregate Crushing Value.

32
A low aggregate crushing value indicates higher resistance to getting crushed under the
application of specific load, hence aggregate crushing value should be low to achieve high
quality pavement.
Fig:3.11 Compression Testing machine
APPRATUS
a) Steel cylinder with central diameter 150 mm including an appropriate plunger and a
piston
b) Steel tamping rod having diameter of 16mm and length of 450-600mm
c) Balance of capacity 3kg at least
d) A Compressive Testing Machine (CTM) which is capable of applying load 50 tones at a
uniform rate of 4-5 tones per minute
e) IS sieves of having sizes 2.36mm, 10mm, 12.5mm
f) Cylindrical measure having dimensions of internal diameter of 115mm and height
180mm
PREPARATION OF THE TEST SAMPLE
The sample of coarse aggregate which are passing from standard 12.5mm IS sieve and
getting retained over 10mm IS sieve is to be taken. If the sample of aggregates is not dry
it should be oven-dried by heating at a temperature of 100-110 degrees for 4 hours and

33
then allowed them to cool at a room-temperature. The sample is filled in the cylindrical
measure in 3 layers and tamped 25 times with tamping rod, the depth of each layer being
approximately equal. Then the aggregates at the top layer are leveled and the sample is
weighed.
PROCEDURE
It consists of the aggregates passing from 12.5mm sieve and retained on 10mm sieve. The
aggregate should be oven-dried by heating at 100-110°C.
1) Sieve out the material through 12.5mm and 10mm from IS sieve. The test material should
be passed from 12.5mm of sieve and retained on 10mm.
2) The cylinder of the test shall be put in position on the base plate and the sample should be
added in 3 layers and each layer will subjected to 25 strokes with tempered rod.
3) The aggregate should be leveled properly after tempering.
4) A plunger is inserted in such a way that it laid horizontally at its surface. Proper care
must be taken as to make assure that it doesn’t jam in the cylinder.
5) Put the material under the compaction testing machine.
6) The load is applied gradually as the total load is reached in 10 minutes. The total load
shall be 40 tones.
7) Now, release the load and crushed material is to be collected from cylinder.
8) Crushed material is now sieved out by 2.36mm IS Sieve.
9) The material passing the sieve will be weighed and recorded.
Aggregate crushing Value = W2/W1*100 in percentage
W1 = Total weight of dry sample in gms
W2 = Weight of portion passing 2.36 mm sieve.
3.6.2 AGGREGATE IMPACT VALUE TEST
This experiment is done on the aggregates to check the toughness of the materials. Due to
the heavy vehicular movement on the road, the aggregates are subjected to the sudden

34
load as a result, break down takes place. The aggregate should have sufficient toughness
to resist the disintegration from the impact of wheels of the vehicles. Therefore, this
characteristic is measured by Impact value test in terms of testing of the materials.
Fig:3.12 Impact Testing machine
APPARATUS:
Steel cylinder with central diameter 150 mm including an appropriate plunger and a
piston
Steel tamping rod having diameter of 16mm and length of 450-600 mm
Balance of capacity 3kg at least
Impact Testing Machine having capacity 45 to 60 kg.
IS sieves of sizes 2.36mm, 10mm, 12.5mm
Cylindrical measure having dimensions of having internal diameter of 115mm and height
180mm
PROCEDURE:

35
a) The test sample having capacity size 10mm and 12.5mm are taken. The aggregates
must be oven-dried by heating at 100-110°C for a period of 4 hours and allow them to
cool.
b) Sieve out the test material through 12.5mm and 10.0mm from IS sieves. The aggregate
passing from 12.5mm sieve and retained on 10mm sieve were taken.
c) Now, put the aggregates to the measuring cylinder as it filled about just 1/3 rd depth.
d) Then compact the material by giving 25 blows with the tamping rod.
e) We add 2 more layers of aggregate in the same way, so that cylinder will be full.
f) Now, strike the remaining aggregates.
g) Find out the total weight of the aggregates which is taken as W.
h) Put the impact machine on the level plate on the floor.
i) Put the sample in a mould and place under the machine and tempered it 25 times with
temping rod.
j) Now, pull the hammer up at its lower end is 382mm above the aggregate sample in the
mould and allow it to fall.
k) Remove the crushed aggregate from the mould and sieve it out from 2.36mm IS sieve.
l) Weigh the crushed sample passing the sieve carefully. Also, weigh the material which
was retained in the sieve.
m) Now, calculate the aggregate impact value on the basis of their formulas.
Therefore, Aggregate Impact value= W2/W1*100 in percentage
W1 = Total weight of dry sample in gms
W2 = Weight of portion passing 2.36 mm sieve
3.6.3 LOS ANGELES ABRASION TEST
Due to the heavy vehicular movement, the surface coarse of the road pavement is
subjected to the wearing and tearing action at the top surface. So the road aggregates used in the
surface course should possess enough hardness or resistance to abrasive action. When the
vehicular loads on the pavement surface moves at a greater speed, the soil particles present

36
between the road surface and tyres causes abrasion to the road surface. Steel tyres of animal
drawn vehicles cause noteworthy abrasion of road surface.
Los angeles abrasion test is used to determine the abrasion of the aggregate which are used in the
construction. . In order to determine the hardness of aggregates IRC (Indian Road Congress) has
suggested Los Angeles Abrasion test over the other tests. It determines the percentage wearing
and tearing due to relative abrasion between the aggregates and the steel balls which we used as
a charge while performing the test.
Fig:3.13 Los angeles abrasion testing machine
APPARATUS:
Los Angeles Abrasion Testing machine
1.70 mm IS sieve
abrasive charge depending on grade of aggregates
balance
oven
tray
PROCEDURE:

37
a) Clean the aggregates that have been oven dried at a temperature of 105-110°C, to
constant weight. The grade of the aggregate to be used in the test should be closest to
those used in road construction.
b) Take the aggregate sample weighing 2.5kg and place them in the LA abrasion testing
machine.
c) Add steel charge balls as per grading. Here we are using 8 balls.
d) Fix the cover of machine and tighten the bolts so that no material is lost during the test.
e) Now, allow the machine to rotate at a specified speed of 30-33 revolutions per min. and
the specified number of revolution is 500 for the grade C.
f) If the revolutions are complete, the machine is stopped and the material is removed out
and dust is taken care off.
g) The material is sieved out on 1.70 mm sieve and then washed and dried up.
3.6.4 PENETRATION TEST
Fig:3.14 Penetration test apparatus (Penetrometer)

38
Consistency of bituminous materials depends upon numerous factors such as its composition and
temperature when temperature lies between 25-50 degrees. Most of the paving grade bitumen
remains either in plastic or semi-solid state and have high viscosity because of which they cannot
be mixed with aggregates. But there are certain grades of cutback bitumen and bituminous
emulsion which possess low viscosity at this temperature and can be easily mixed at low
temperatures without heating.
Penetration value we used to find the consistency of bituminous material and measure of
hardness. It is the vertical distance penetrated by the needle point in to the bituminous material
under the specific load condition, time and temperature. This distance is measured in one tenths
(1/10th
) of an mm. This test is used for finding out the consistency of bitumen.
APPARATUS:
Container: A flat bottom, cylindrical metallic dish having dia. 55cm and 35mm of depth
is required. If we get the penetration value is of the order of 225 or more, dish of having
70mm dia. and 45mm depth is to be taken.
A Standard needle: A straight, good quality, conical end needle.
Water Bath: It should maintain at 25±0.1°C to the sample to be immerged to the depth
should not less than 100mm from top and supported on perforated shelf shouldn’t be
more than 50 mm.
Penetration Apparatus or Penetrometer: It should allow the needle to penetrate with
appreciable friction for desired time duration and should accurately give results in 1/10 of
mm.
Thermometer: It should be readable upto 0.2°C.
PROCEDURE:
(i) Test specimen preparation: - First of all, soften the bitumen to a pouring consistency at
a temperature between 75° to 100°C above its temperature which soften the bitumen and stir the
material thoroughly to make it homogeneous and should free from air bubbles and water. Pour
the melt sample into the container at a depth at least 15mm in excess of the expected penetration.
Now, allow it to cool at an a temperature between 15° to 30°C for 1 hour. Then place it with the
transfer metallic dish in the water bath at 25° ± 0.1 °C.

39
(ii) Now, fill the metallic dish with water to a sufficient depth so that it completely covers the
container. Place the sample under the needle of penetrometer and put this on the stand of the
given apparatus.
(iii) Now, clean up the needle with benzene solution (C6H6), allow it to dry and then adjust it
with the weight. The total moving load should be 100gms by including the weight of the needle,
super-imposed weight and carrier.
(iv)Adjust the needle using the adjusting screws to make the contact with the surface of the given
sample.
(v) Set the pointer on the penetrometer dial to read 0 and note down the initial reading.
(vi) Now, release the needle by pressing the knob for exactly 5.0 sec.
(vii) Note down the final reading by the adjustment of penetrometer for checking the penetration.
(viii) At least 3 readings at points after testing the sample should not be less than 100mm apart.
(ix) Clean the needle with benzene carefully and dried.
(ix) Now sample container is also transfer in the water bath before next testing is to be done so as
to maintain the temperature 25°C at the constant rate.
Penetration value will be calculated on the basis of their mean by taking the values of initial and
final penetrations in considerations.
3.6.5 Softening point of the Bitumen
The softening point of the bitumen is that temperature at which the bituminous material
gets soften. It consists of 2 steel balls having dia. 9.5 mm each which place between the two
brass rings and heated up under water at a constant temperature. As the rings touches the ground,
the temperature will be counted as softening point temperature.
Apparatus:
i. Two steel balls having dia 9.5 mm each

40
ii. Two brass ring members to support the balls in between, having dia from
top to bottom 17.5 mm and 15.9 mm respectively.
iii. One support- beaker- so it can hold the rings in position.
iv. Thermometre
Procedure:
i. Take two steel balls having dia 9.5 mm each and should have weight 0.05 gms.Also, take
two members of brass rings having depth of 6.4 mm and having dia. from top 17.5 mm
and from 15.9 mm respectively.
Fig:- 3.15 Softening Point Apparatus
ii. Now, assemble the apparatus with the rings and put thermometer in position.
iii. Fill the beaker with water at a height of 50 mm from the upper surface of rings and it
should be at temperature of 5°C.

41
Note:- we can use glycerin as well only if we want the softening point above than 80°C and
initial temperature must be at 35°C.
iv. Now, apply heat to the beaker and stir the liquid so it can maintain the constant
temperature 5±0.5°C.
v. As the temperature increases, the balls start getting soften and sink through the ring along
with some portion of bitumen.
vi. Note down the readings as the balls touches the surface of the beaker.
vii. Record the temperature when both balls touch the base. And by taking the average of
both, it will be the softening point of the bitumen.
3.6.6 Ductility test of the bitumen
Apparatus: - standard briquette mould, Ductility testing machine, water bath,
thermometer having range 0 to 44°C
Fig 3.16 (a):- Briquette apparatus Fig 3.16 (b):- Ductility Machine
a) Procedure: - Heat the bitumen at a temperature more than 100°C till become
liquid.
a. Assemble the moulds on the brass plate.
b. Get the mould oily internally with glycerin and dextrin to prevent it from sticking
while pouring the bitumen into the moulds.
c. Now, pour the bitumen into the briquette moulds until it get level full.
d. Allow it to cool at room temperature for 30-35 minutes and then put the moulds
into the water bath to make it specific temperature for 30 minutes.
e. Remove the excess bitumen with the help of sharp blade or knife

42
f. Put the brass plate and mould with briquette specimen for one and half hour.
g. After that, remove the briquette from the plate and detach the side pieces.
h. Now, clamp the sample with rings at each end of the testing machine.
i. Adjust the reading of the machine at 0.
j. Now, start the machine and pull clips at a constant speed 50 mm per minute.
k. As it moves, the bitumen tends to elongate. The point where it thread of the
bitumen breaks, note down the reading.
l. Take such 3 reading and compute the ductility of the material.
43
CHAPTER 4
ANALYSIS AND TESTS RESULTS
4.1 GENERAL:
This chapter deals with the presentation of results obtained from various tests which are
conducted on flexible pavement defects. The main objective of this research was to
observe the different types of defects occurring on the pavement. In order to achieve this
goal, experimental program was performed to check this problem. It consists of testing of
the materials of the pavement which was used for construction.
Various tests were performed as following:
4.2 Tests on Bitumen
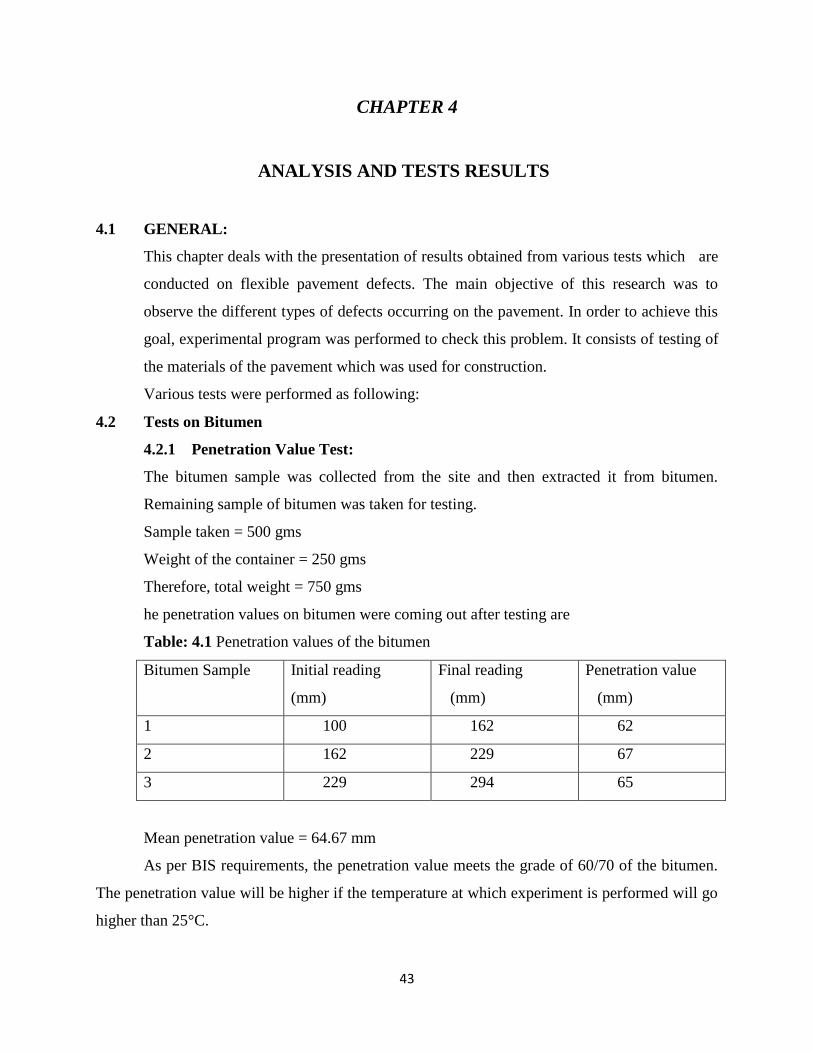
4.2.1 Penetration Value Test:
The bitumen sample was collected from the site and then extracted it from bitumen.
Remaining sample of bitumen was taken for testing.
Sample taken = 500 gms
Weight of the container = 250 gms
Therefore, total weight = 750 gms
he penetration values on bitumen were coming out after testing are
Table: 4.1 Penetration values of the bitumen
Bitumen Sample Initial reading
(mm)
Final reading
(mm)
Penetration value
(mm)
1 100 162 62
2 162 229 67
3 229 294 65
Mean penetration value = 64.67 mm
As per BIS requirements, the penetration value meets the grade of 60/70 of the bitumen.
The penetration value will be higher if the temperature at which experiment is performed will go
higher than 25°C.

44
4.2.2 Softening Point of bitumen
The softening point of the bitumen was calculated by heating the bitumen sample below 80°C.
The temperatures at which the balls touch the bottom are following
Temperature at which the 1st ball touches the ground= 40°C
Temperature at which the 2nd
ball touches the ground= 42°C
Therefore, the Softening point of the bitumen = (40+42)/2 = 41°C
As per the BIS requirements, the value of the softening point is meeting the properties of
VG10.
4.2.3 Ductility Test
The ductility test was calculated by pulling the briquette specimens from the testing machine
which helps us to know how ductile the sample is.
Here, we have the values which we found out from testing machine, which was measured by
distance covered by specimens in cm.
Specimen 1 = 45 cm
Specimen 2 = 49 cm
Specimen 3 = 52 cm
Therefore, the ductility of various samples is calculated by Specimens= (45+49+52)/3 = 48.67
cm
As per BIS requirements, the values of ductility is closely equal to 50 meets the limits of VG20.
4.3 Test on Aggregate
4.3.1 Aggregate Impact Value Test
Total weight of the fresh sample w1 = 1000 gms
Weight of the sample after passing from 2.36 mm sieve = w2 = 313 gms
45
Aggregate Impact value = w2/w1*100 = (313/1000)*100 = 31.3%
By the classification of quality of the material, the value greater than 30% of used sample is
weak for road surfacing.
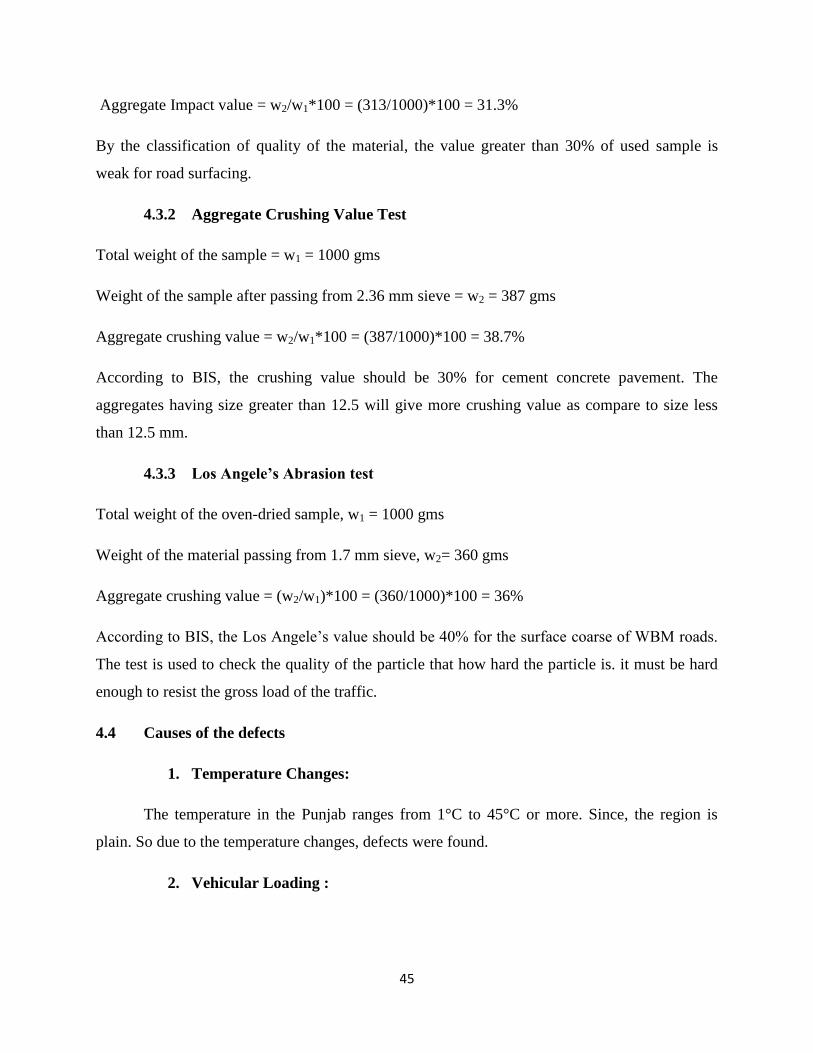
4.3.2 Aggregate Crushing Value Test
Total weight of the sample = w1 = 1000 gms
Weight of the sample after passing from 2.36 mm sieve = w2 = 387 gms
Aggregate crushing value = w2/w1*100 = (387/1000)*100 = 38.7%
According to BIS, the crushing value should be 30% for cement concrete pavement. The
aggregates having size greater than 12.5 will give more crushing value as compare to size less
than 12.5 mm.
4.3.3 Los Angele’s Abrasion test
Total weight of the oven-dried sample, w1 = 1000 gms
Weight of the material passing from 1.7 mm sieve, w2= 360 gms
Aggregate crushing value = (w2/w1)*100 = (360/1000)*100 = 36%
According to BIS, the Los Angele’s value should be 40% for the surface coarse of WBM roads.
The test is used to check the quality of the particle that how hard the particle is. it must be hard
enough to resist the gross load of the traffic.
4.4 Causes of the defects
1. Temperature Changes:
The temperature in the Punjab ranges from 1°C to 45°C or more. Since, the region is
plain. So due to the temperature changes, defects were found.
2. Vehicular Loading :

46
Since, the road is exposed of heavy vehicular movements resulting in fatigue failure so this is the
main reason of distresses. The probable defect is coming out to be Alligator cracks.
3. Poor quality of material
From the performed tests, we’ve found out that the quality of the material is poor.
It was just due to materials which was laid on the ground was defected.
4. Poor quality control and method of construction
Due to improper method of construction and poor quality control, distresses took
place. It might because of the temperature maintenance on which mix is prepared
which is either bituminous mix or aggregate was not properly maintained which
leads to the pavement distresses.
5. Due to the provision of the poor shoulders, it leads to edge cracking.
6. Environmental factors such as heavy rainfall, due to water-logging pavement duw
to poor drainage conditions leads to failure which are either in the shape of
potholes or patches.
7. Poor paving lane joins and inadequate construction joints leads to longitudinal
and transverse cracks.
4.5 Selection of the best maintenance option
From the graph of severity level, alligator cracks are the main reason of pavement
defects. So for Alligator cracks, rehabilitation is required on the top layer and a proper additional
surface coarse is needed with a fresh layer of the bitumen as per design and quality standards.
This may be economical then by providing the overlay for whole pavement.
For potholes, it can be covered by premix material after cleaning and painted with bituminous
binder.
Patches are the one kind of improvement for the pavement. A entire damaged area is selected
and covered/filled with fresh layer of bitumen. So it can be economical as compared to by
demolishing the whole pavement ground.
Block cracking also can be improved by surface treatment or by providing a thin overlay on the
surface coarse.

47
Edge cracks are improved either by the improvement of drainage or a also we can fill the cracks
by making the slurry of bituminous emulsion or emulsified bituminous crack seal.
Longitudinal and transverse cracks also have the same techniques as edge cracking. By
improvement of drainage by clearing off the source that collects water on the pavement and also
by bituminous slurry to fill the cracks on the joints. Making the side drainage is also a good idea
for this.
Slippage cracking can be maintained by making a full depth patch by selecting the entire area of
the crack.
Weathering is raveling is improved by any surface treatment or a thin coat of the bitumen.

48
CHAPTER 5
CONCLUSION AND FUTURE RECOMMENDATIONS
5.1 GENERAL
Various tests were computed on the material. The results are calculated based on the
tests. In this chapter, the focus will be on the result and what should be the major
recommendations will be in the future.
5.2 CONCLUSION
The case study was undertaken to investigate the road failures on the particular stretch
(LPU main gate to Rama Mandi) and purpose of this research is to analyze and evaluation of the
pavement failures. Various results and conclusions are drawn below:
1) The technique is based on the past experiences by keeping literature reviews in mind and
selected the simple and best suitable method of analysis.
2) Pavement condition Index (PCI) was found out to know the condition of the pavement
according to its distress sheet as per severity level from ASTM-D6433. From the method
of pavement condition index, we got know the condition of the pavement which was
coming out to be very poor in the range. The defects having the high severity level was
found out to be alligator cracks.
3) Since the maintenance option is required because the pavement is severe. So various kind
of tests were performed on the sample which was taken from the site and we found that
the failures was coming by the different reasons which I have already mentioned in the
chapter 4 of part 4 and gave the best maintenance option for the pavement failures.
5.3 FUTURE SCOPE AND RECOMMENDATIONS
1) The rehabilitation will be focus on NH-1 Phagwara to Ludhiana road to save it
from early damage.
2) The special attention will be given to the areas having high severity level.

49
3) Future road performance will be assessed and forecasted.
4) Control of surface water or infiltration is needed by providing adequate drainage.
5) Adequate road markings to save it from collision of vehicles should be provided.
6) All the above parameters affects the allocation of funds for maintenance option
for different stretches of the road.

50
REFERENCES
1. Manual for design, construction, maintenance of gravel roads by Indian road congress.
(2008)
2. TODD V.SCHOLZ, SATHYANARAYANAN RAJENDRAN (2009) “Investigating
Premature pavement failure due to moisture” Kiewit Center for Infrastructure and
Transportation.
3. AHMED IBRAHIM ABU EL-MAATY BEHIRY (2012)- “Fatigue and Rutting lives in
Flexible Pavement” Ain Sham Engineering journal 3,367-374
4. CHANDANBASU AND JITENDRA KUMAR SONI (2013)- “Design approach for
geocell reinforced flexible pavements” Highway Research journal, Indian Road
Congress- Volume 6, No: 2, July-December 2013
5. KA-YEE HO, WING-TAT HUNG, CHUNG-FAI NG, YAT-KEN LAM, RANDOLPH
LEUNG, EDDY KAM (2013)“The effect of road surface tyre deterioration on tyre/road
noise” Applied acoustics 74
6. MISS APURVA J.CHAVAN (2013)- “Use of plastic waste in flexible pavements”
international journal of application or innovation in engineering management (IJAIEM),
ISSN 2319- 4847, Vol-2
7. CARVAJAL E AND ROMANA M. (2013)-“Analysis of the influence of soil depth on
the subgrade capacity for the flexible pavements” Proceeding of Int. conference on soil
mechanics and Geotech. Paris
8. MAGDI M.E ZUMRAWI (2013)“Survey and evaluation of flexible pavement failures”
International Journal of science and research (IJSR)
9. Traffic Engineering and Transportation planning by DR. L.R. KADYALI, KHANNA
PUBLISHERS (2013) Eighth edition
10. Highway Engineering by DR. SK KHANNA AND C.E.G. JUSTO (2014) eighth edition
11. HNIN EI EI KHAING, DR. TIN TIN HTWE (2014) “Study on Failures and
Maintenance of Flexible Pavement (Pyay-Aunglan –Koepin Portion)”- International
journal of scientific engineering and technology research. ISSN 2319-8885, Vol.03-14

51
12. SHARAD S ADILINGE, PROF. A.K GUPTA (2015) “Flexible Pavement deterioration
and its causes” IOSR Journal of Mechanical & Civil Engineering (IOSR-JMCE) ISSN:
2278-1684, PP: 09-15 - www.iosrjournals.org
13. MR.ETIKALA NAGARAJU (2015) “Pavement Rehabilitation and Maintenance”- SSRG
International Journal of Civil Engineering (SSRG-IJCE) – volume 2, Issue 6
14. SASANE NEHA .B. GAIKWAD. HARISH, DR. J R PATIL, DR. S D KHANDEKAR
(2015) “Application of waste plastic as an effective construction material in flexible
pavement” International Research Journal of Engineering and Technology(IRJET,)
Volume: 02 Issue: 03/June
15. JABAR M. RASUL, MICHEAL P.N. BURROW, GURMEL S. GHATAORA (2016)-
“consideration of the deterioration of the stablised subgrade soil in analytical road
pavement design”-Transportation Geotechnics vol.9:96-109
16. ASTM-D6433 manual for the calculation of pavement condition index (2016)
17. http://www.asphaltinstitute.org/asphalt-pavement-distress-summary/
18. http://nptel.ac.in/courses/105101087/19-Ltexhtml/p7/p.html