analysis and estimation of trace metals in seawater and...
TRANSCRIPT
Southeast Asian Fisheries Development Center
374
Analysis and Estimation of Trace Metals in Seawater and
Prof. Dr. Trinh Xuan Gian
Institute of Chemistry, Vietnam National Center for Natural Science and Technology.Hoang Quoc Viet Road, Caugiay District, Hanoi, Vietnam
ABSTRACT
Water samples from off shore of Vietnam from latitude 6oN to 21oN and longitude 103oC to112oE were collected on 30 April 1999 to 29 May 1999 and analyzed for copper (Cu), lead (Pb),cadmium (Cd), zinc (Zn), nickel (Ni), chromium (Cr), arsenic (As) and mercury (Hg). The concentrationof metals Cu, Pb, Cd, Zn, Ni and Cr was measure using flameless atomic absorption spectroscopy.The total concentration of all eight metals was in concentration ranges of unpolluted coastal water. Theresults indicated that the concentration of metals in bottom layer higher than in surface layer. Also, tracemetal contents in the surface sediment were studied in off shore of Vietnam during this cruise. Totalmetals content were measured. The range of concentration of metals were 10.3 - 71.0 mg.g-1 for Cu,12.9 - 33.7 mg.g-1 for Pb, 1.29 - 18.72 mg.g-1 for Cd, 45.8 - 164.8 mg.g-1 for Zn, 21.2 - 93.6 mg.g-
1 for Cr, 5.7 - 45.8 mg.g-1 for Ni, 1.64 - 3.80 mg.g-1 for As, and 0.104 - 0.493 mg.g-1 for Hg. Thelevels found in the present study are similar to data from other marine.
Key words: Trace metals, Seawater, Surface sediment, South China Sea, Off shore of Vietnam
Aquatic systems such as the seawater, inland water etc. are important stages in thebiogeochemical cycle. Although dissolved levels are usually in the trace range of 10-6-10-9 Ml-1 theyremain significant, because they entry into the food chain and interactions with suspended particulateand sediments largely occur via the dissolve state.
The various heavy metals as Cd, Ni, As, Hg, etc. in seawater become toxic if present inexcessive quantities and pose a potential threat to the ecosystem. Therefore, there has been constanteffort to measure the impact of these metals on fauna [De Silva].
In environmental research and protection toxic metal, particularly Cd, Pb, Hg, As, Ni, Cr, etc.are becoming increasingly signification owing their biological nondergradability and chromic toxicityresulting from their accumulation in vital organs of man. As part of the SEAFDEC Cooperative Programin the Study of Fisheries Oceanography of the South China Sea, a Research on trace heavy metals inseawater was made.
The first analyses of seawater were performed just prior the beginning to the 19th century in
laboratories. However, problems arising from changes in chemical composition through evanosation,biological activity, or chemical interactions with the containing vessel, forced the marine chemist totransfer his laboratory from land to ships. Herman Walterberg, the chemist on the famous “MeteorExpedition” in 1925, pioneered this change. Today, there is a strong and necessary trend towardinstrumental techniques, as opposed to the classical methods, especially when assaying very smallamounts of materials.
Sediment in the South China Sea, Area IV: Vietnamese Waters
Introduction
Proceedings of the SEAFDEC Seminar on Fishery Resources in the South China Sea, Area IV : Vietnamese Waters
375
General comparative considerations suggest atomic absorption spectroscopy and modernvoltametric methods, particularly differential pulse stripping voltammetry with high sensitivity, precision,and accuracy also a simple sample preparation and treatment to be the most promising chose for thedetermination and characterization of toxic heavy metal traces in seawater.
Material and Methods
Analytical methods
The concentrations of metals: Cu, Pb, Cd, Zn, Ni, Cr, As and Hg in Vietnamese waters werestudied in the SEAFDEC interdepartmental collaborative research survey. The samples were analyzedin laboratory of the Department for Analytical Science and Technique of the Institute of Chemistry,National Center for Natural Science and Technology of Vietnam, NCST.
All bottles, filter membranes and lab wares that would be contact with samples were carefullypre-washed by 10% suprapure HNO
3
acid and Mili-Q water. Merck standard solutions diluted by
Mili-Q water was use as standard.
The concentrations of metals Cu, Pb, Cd, Zn, Cr, Ni were measured using graphite furnaceatomic absorption spectrometer PE AAS 3300, USA and As by using hydride AAS technique withMHS-10, Hg by using coldvapour method with MHS-10, and 746 VA Trace Analyzer Metrohm,Switzerland. Polyethylene containers, which have been previously cleaned with nitric acid then rinsewith water, shall be used for sampling.
Sampling
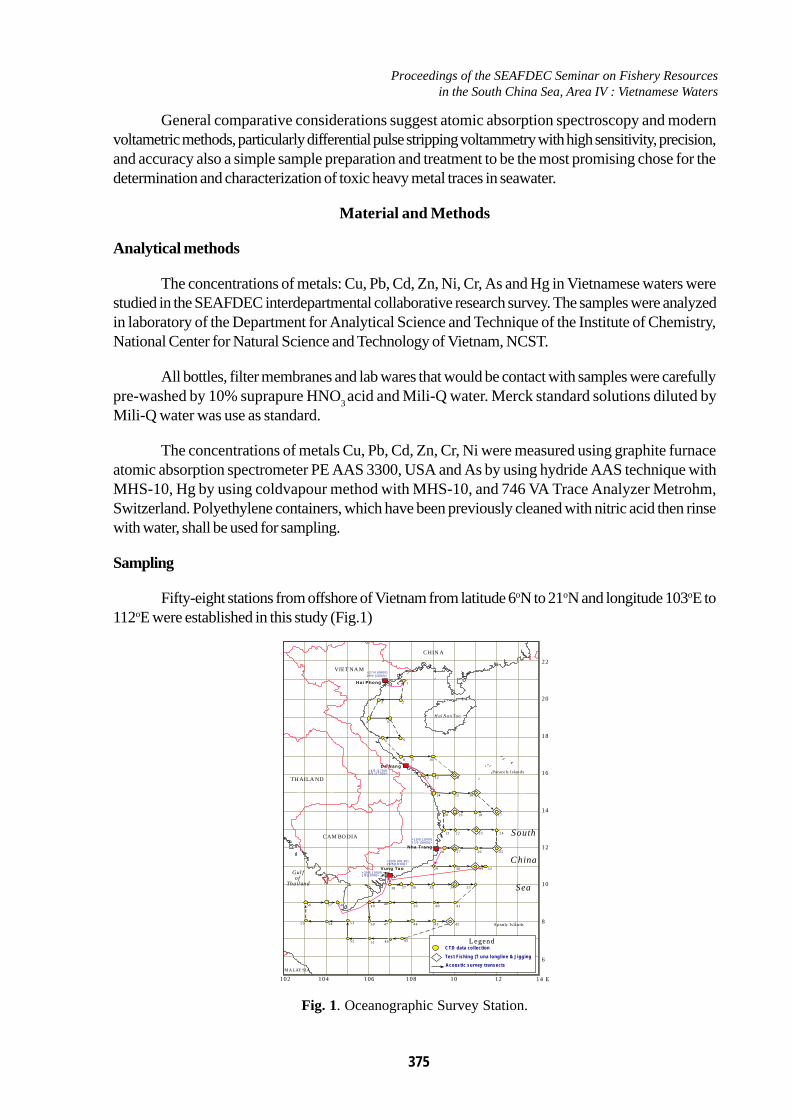
Fifty-eight stations from offshore of Vietnam from latitude 6oN to 21oN and longitude 103oE to112oE were established in this study (Fig.1)
Fig. 1. Oceanographic Survey Station.
TH AILA ND
CAM BO DIA
VIET NA M
CHIN A
Gulfof
Thailand
South
China
Sea
Hai P hong
Da Nang
Nha Trang
V ung Ta o
M A LAY SIA
22
20
18
16
14
12
10
8
6
102 104 106 108 10 12 14 E
H ai Na n Tao
1
3 2
4 5
7 6
8 9 10
13 12 11
14 15 16
20 19 18 17
21 22 23 24
28 27 26 25
29 30 31 32
37 36 35 34 33
39 40 41
44 43 42
4546
47
48
38
53
52
5455
56 57 58
> 27/4 (0800)29/4 (1000)>
> 4 /5 (1700)5 /5 (1700)>
> 15/5 (1000)17/5 (0800)>
> 30/5 (1000)1 /6 (1000)>
C TD data co llectionLegend
Test F ishing (T una long line & Jigg ing
A coustic survey transects
49
50
51
Sp rat ly Is lands
Paracels Islan ds
> 20/5 (08 :30 )20/5 (10 :00)>

Southeast Asian Fisheries Development Center
376
MV SEAFDEC collected the water samples on 30 April 1999 to 29 May 1999. The water wascollected at each station during cruise at least two depth (surface and bottom) by water sampler attachedto a rosette system. The water samples were transferred into acidic washed PE bottles and acidified topH 1 with suprapure nitric acid for determination of Cu, Pb, Cd, Zn, Ni, Cr and As and with 1ml 10%K
2Cr
2O
7 solution to 1 liter for determination of Hg. Glass or other inert materials should be used if there
is a risk of interaction of the sample with the container.
Determination of Cu, Pb, Cd, Zn, Ni and Cr
This method describes the determination of soluble copper, lead, cadmium, zinc, chromiumand nickel in seawater and other saline waters by the simultaneous extraction of their complexes withammonium pyrirolidine dithiocarbanate in to methyl isobutyl ketone and by the atomic absorptionspectrophotometer with the graphite tube technique. Place 750ml aliquot of the sample, acidified seawaterand each of the calibration solutions into series of 1 liter separating funnels fitted withpolytetrafluoroethylene (PTFE) taps.
Add 35 ml of MIBK followed by 7ml of 1% APDC. Shake vigorously for 30 min. separate theorganic layer in a polypropylene bottle and store for analysis. Allow the mixture to settle for at least 1haway from light or heat in the stoppered funnel. The settling time shall be strictly the same for all thesolutions. Collect the organic layer taking care to avoid any trace of the aqueous phase (centrifuge ifnecessary) carry out a blank test in parallel with the determination by the same procedure, using thesame quantities of all the reagents as in the sampling and chelation and extraction, but replacing the testportion by water.
Proceed as follows for each metal being determined. Before carrying out the spectrometricmeasurement, set up spectrometer according to the manufacturer’s instructions by aspirating the organicextract of calibration solution of the metal being determined and using information in Table1.
Optimize the aspiration and conditions. Adjust the response of the instrument to zero absorbancewith MIBK. For each metal being determined, aspirate the set of organic extracts of the calibrationsolutions. Plot a graph having the metal contents, in micrograms per liter, of the calibration solutions asabscissas and the corresponding values of absorbance as ordinates for example by measuring theabsorbance of a calibration solution every five samples. Aspirate the organic extract of the test portion.Measure the absorbance of the metal being determined and after each measurement aspirate MIBK inorder to rinse the nebulizer system.
Table 1. Wavelength (nm) used to determine metal element.
Element to be determined W avelength (nm)
Nickel 232.0
Copper 324.7
Zinc 213.8
Cadmium 228.8
Chromium 357.9
Lead283.3
217.0
Proceedings of the SEAFDEC Seminar on Fishery Resources in the South China Sea, Area IV : Vietnamese Waters
377
Determination of Mercury
Mercury ions are reduced to metallic mercury by NaBH4, entrancement of the mercury in a
current of inert gas at ambient temperature and determination of the mercury, by flameless atomicabsorption spectrometry at a wavelength of 253.7nm
Take a test portion of 100 ml from the previously mixed sample containing not more than 0.5mg of mercury. Prepare, just before use, using the standard mercury solutions at least five calibrationsolutions, covering the range of concentrations which can be measured with the apparatus to be used.
Treat each of these solutions immediately after their preparation in exactly the same way as thetest portion on which the determination is to carry out. Also, proceed in exactly the same way on asolution in which the standard mercury solution is replaced with water.
Set up the instrument in accordance with the manufacturer’s introductions. Transfer a volumeof sample solution into aeration flask in accordance with the manufacturer’s introductions with on theentrainment gas supply and let the developed mercury vapour flow through the absorption cell andmeasure the absorption of atoms in the beam of the PE - AAS - 3300 by using of MHS - 10 carry outa blank test with each batch of samples, but replacing the test portion with water and using the samevolume of reagents as for the determination prefer.
Determination of Arsenic
The method is based on the atomic absorption measurement of arsenic generated by the thermaldecomposition of arsenic (III) hydride. As (III) is reduced to gaseous arsenic (III) hydride (AsH
3) by
reaction with sodium tetrahydroborate in a hydrochloric acid medium.
The absorbance is determined at a wavelength of 193.7nm. Set all instrumental parameters ofthe atomic absorption spectrometer in accordance with the manufacturer’s operating manual and optimizethe position of the absorption cell in order to obtain maximum transmission of the light beam.
Pass a stream of argon through the system and set the instrument to zero. Measure the absorptiongiven by the solutions in the following order:
· Blank solution,· Calibration solutions,· Samples, prepared as follows,
Depending on the hydride system used, transfer an appropriate volume of the sample solutionto the reaction vessel (MHS - 10). Connect the reaction vessel to the hydride system pass argonthrough the solution until the absorption signal of atomic absorption spectrometer returns to zero. For20 ml of the sample solution add 5ml ± 0.1ml of sodium tetrahydroborate solution to the solution andrecord the signal. Repeat the procedure using separate portions of each solution. Use the mean of theseresults.Establish the calibration curve using means of values obtained with the blank and calibrationsolutions.
Results and Discussion
Certified Reference Seawater Probe CASS-3 of the Institute for Environmental Chemistry,Canada, were included in sample preparation and analysis as quality control samples to ensure the
Southeast Asian Fisheries Development Center
378
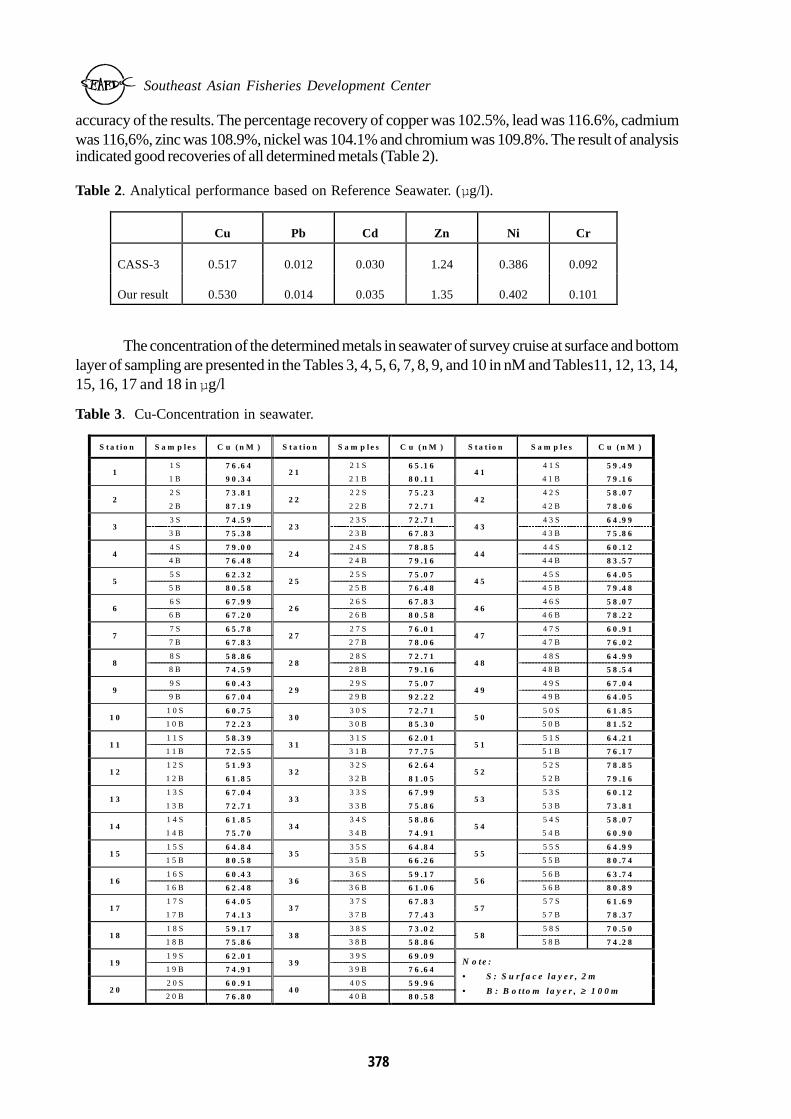
accuracy of the results. The percentage recovery of copper was 102.5%, lead was 116.6%, cadmiumwas 116,6%, zinc was 108.9%, nickel was 104.1% and chromium was 109.8%. The result of analysisindicated good recoveries of all determined metals (Table 2).
Table 2. Analytical performance based on Reference Seawater. (µg/l).
The concentration of the determined metals in seawater of survey cruise at surface and bottomlayer of sampling are presented in the Tables 3, 4, 5, 6, 7, 8, 9, and 10 in nM and Tables11, 12, 13, 14,15, 16, 17 and 18 in µg/l
Table 3. Cu-Concentration in seawater.
S t a t i o n S a m p l e s C u ( n M ) S t a t i o n S a m p l e s C u ( n M ) S t a t i o n S a m p l e s C u ( n M )
1 S 7 6 .6 4 2 1 S 6 5 .1 6 4 1 S 5 9 .4 9 1
1 B 9 0 .3 42 1
2 1 B 8 0 .1 14 1
4 1 B 7 9 .1 6
2 S 7 3 .8 1 2 2 S 7 5 .2 3 4 2 S 5 8 .0 7 2
2 B 8 7 .1 92 2
2 2 B 7 2 .7 14 2
4 2 B 7 8 .0 6
3 S 7 4 .5 9 2 3 S 7 2 .7 1 4 3 S 6 4 .9 9 3
3 B 7 5 .3 82 3
2 3 B 6 7 .8 34 3
4 3 B 7 5 .8 6
4 S 7 9 .0 0 2 4 S 7 8 .8 5 4 4 S 6 0 .1 2 4
4 B 7 6 .4 82 4
2 4 B 7 9 .1 64 4
4 4 B 8 3 .5 7
5 S 6 2 .3 2 2 5 S 7 5 .0 7 4 5 S 6 4 .0 5 5
5 B 8 0 .5 82 5
2 5 B 7 6 .4 84 5
4 5 B 7 9 .4 8
6 S 6 7 .9 9 2 6 S 6 7 .8 3 4 6 S 5 8 .0 7 6
6 B 6 7 .2 02 6
2 6 B 8 0 .5 84 6
4 6 B 7 8 .2 2
7 S 6 5 .7 8 2 7 S 7 6 .0 1 4 7 S 6 0 .9 1 7
7 B 6 7 .8 32 7
2 7 B 7 8 .0 64 7
4 7 B 7 6 .0 2
8 S 5 8 .8 6 2 8 S 7 2 .7 1 4 8 S 6 4 .9 9 8
8 B 7 4 .5 92 8
2 8 B 7 9 .1 64 8
4 8 B 5 8 .5 4
9 S 6 0 .4 3 2 9 S 7 5 .0 7 4 9 S 6 7 .0 4 9
9 B 6 7 .0 42 9
2 9 B 9 2 .2 24 9
4 9 B 6 4 .0 5
1 0 S 6 0 .7 5 3 0 S 7 2 .7 1 5 0 S 6 1 .8 5 1 0
1 0 B 7 2 .2 33 0
3 0 B 8 5 .3 05 0
5 0 B 8 1 .5 2
1 1 S 5 8 .3 9 3 1 S 6 2 .0 1 5 1 S 6 4 .2 1 1 1
1 1 B 7 2 .5 53 1
3 1 B 7 7 .7 55 1
5 1 B 7 6 .1 7
1 2 S 5 1 .9 3 3 2 S 6 2 .6 4 5 2 S 7 8 .8 5 1 2
1 2 B 6 1 .8 53 2
3 2 B 8 1 .0 55 2
5 2 B 7 9 .1 6
1 3 S 6 7 .0 4 3 3 S 6 7 .9 9 5 3 S 6 0 .1 2 1 3
1 3 B 7 2 .7 13 3
3 3 B 7 5 .8 65 3
5 3 B 7 3 .8 1
1 4 S 6 1 .8 5 3 4 S 5 8 .8 6 5 4 S 5 8 .0 7 1 4
1 4 B 7 5 .7 03 4
3 4 B 7 4 .9 15 4
5 4 B 6 0 .9 0
1 5 S 6 4 .8 4 3 5 S 6 4 .8 4 5 5 S 6 4 .9 9 1 5
1 5 B 8 0 .5 83 5
3 5 B 6 6 .2 65 5
5 5 B 8 0 .7 4
1 6 S 6 0 .4 3 3 6 S 5 9 .1 7 5 6 B 6 3 .7 4 1 6
1 6 B 6 2 .4 83 6
3 6 B 6 1 .0 65 6
5 6 B 8 0 .8 9
1 7 S 6 4 .0 5 3 7 S 6 7 .8 3 5 7 S 6 1 .6 9 1 7
1 7 B 7 4 .1 33 7
3 7 B 7 7 .4 35 7
5 7 B 7 8 .3 7
1 8 S 5 9 .1 7 3 8 S 7 3 .0 2 5 8 S 7 0 .5 0 1 8
1 8 B 7 5 .8 63 8
3 8 B 5 8 .8 65 8
5 8 B 7 4 .2 8
1 9 S 6 2 .0 1 3 9 S 6 9 .0 9 1 9
1 9 B 7 4 .9 13 9
3 9 B 7 6 .6 4
2 0 S 6 0 .9 1 4 0 S 5 9 .9 6 2 0
2 0 B 7 6 .8 04 0
4 0 B 8 0 .5 8
N o te :
• S : S u r f a c e l a y e r , 2 m
• B : B o t to m la y e r , ≥≥ 1 0 0 m
Cu Pb Cd Zn Ni Cr
CASS-3 0.517 0.012 0.030 1.24 0.386 0.092
Our result 0.530 0.014 0.035 1.35 0.402 0.101

Proceedings of the SEAFDEC Seminar on Fishery Resources in the South China Sea, Area IV : Vietnamese Waters
379
Table 4. Pb-Concentration in seawater.
Station Samples Pb (nM) Station Samples Pb (nM) Station Samples Pb (nM)
1S 9.56 21S 8.73 41S 9.75 1
1B 10.5221
21B 9.8541
41B 8.49
2S 9.79 22S 8.40 42S 8.11 2
2B 13.1822
22B 9.0342
42B 8.59
3S 8.40 23S 8.16 43S 9.22 3
3B 9.5123
23B 9.2743
43B 11.29
4S 10.23 24S 7.63 44S 8.59 4
4B 11.1524
24B 10.3344
44B 9.75
5S 8.49 25S 9.80 45S 7.58 5
5B 10.8125
25B 9.0745
45B 15.01
6S 9.07 26S 9.51 46S 7.82 6
6B 8.9726
26B 11.2946
46B 11.87
7S 8.49 27S 10.23 47S 9.80 7
7B 11.2527
27B 13.6147
47B 9.56
8S 8.30 28S 10.52 48S 8.78 8
8B 8.8328
28B 14.3848
48B 11.25
9S 7.58 29S 9.75 49S 9.46 9
9B 9.8529
29B 10.6249
49B 8.83
10S 8.83 30S 8.49 50S 8.25 10
10B 10.9630
30B 11.2550
50B 9.70
11S 9.27 31S 7.14 51S 8.16 11
11B 11.8231
31B 11.6351
51B 9.46
12S 9.70 32S 8.40 52S 8.69 12
12B 9.6032
32B 11.2952
52B 11.92
13S 8.54 33S 7.82 53S 7.34 13
13B 10.2833
33B 11.9753
53B 14.07
14S 8.11 34S 9.22 54S 7.14 14
14B 7.7834
34B 8.6454
54B 9.27
15S 8.88 35S 8.78 55S 8.56 15
15B 7.8235
35B 11.4855
55B 7.87
16S 7.58 36S 9.70 56B 7.53 16
16B 6.9536
36B 10.2356
56B 9.60
17S 9.75 37S 8.40 57S 8.40 17
17B 6.6637
37B 6.4757
57B 8.45
18S 6.37 38S 8.11 58S 10.52 18
18B 7.5338
38B 10.8158
58B 10.52
19S 7.05 39S 8.74 19
19B 8.7839
39B 9.51
20S 9.70 40S 8.30 20
20B 8.5440
40B 8.40
Note:
• S: Surface layer, 2m
• B: Bottom layer, ≥≥ 100m

Southeast Asian Fisheries Development Center
380
Table 5. Cd-Concentration in seawater.
Station Samples Cd (nM) Station Samples Cd (nM) Station Samples Cd (nM)
1S 1.86 21S 2.05 41S 1.25 1
1B 2.1421
21B 1.3341
41B 2.31
2S 1.95 22S 1.60 42S 1.42 2
2B 2.3122
22B 2.0542
42B 2.40
3S 1.69 23S 1.42 43S 1.07 3
3B 2.0523
23B 1.6043
43B 2.58
4S 1.51 24S 1.33 44S 1.16 4
4B 1.4224
24B 1.4244
44B 2.14
5S 1.78 25S 1.86 45S 0.98 5
5B 1.5125
25B 1.6945
45B 2.22
6S 1.60 26S 1.69 46S 2.67 6
6B 1.9626
26B 1.9546
46B 2.40
7S 1.51 27S 1.51 47S 2.49 7
7B 1.1627
27B 2.3147
47B 2.58
8S 1.42 28S 1.60 48S 1.25 8
8B 1.3328
28B 2.7648
48B 2.67
9S 1.60 29S 2.31 49S 1.86 9
9B 1.3329
29B 2.8549
49B 1.60
10S 1.33 30S 1.51 50S 2.31 10
10B 2.0530
30B 2.7650
50B 2.05
11S 1.07 31S 1.69 51S 1.78 11
11B 2.1431
31B 2.4951
51B 2.31
12S 0.98 32S 1.95 52S 1.51 12
12B 2.4032
32B 2.1452
52B 3.38
13S 1.16 33S 1.25 53S 1.42 13
13B 2.7633
33B 2.3153
53B 3.91
14S 1.60 34S 1.16 54S 1.25 14
14B 1.2534
34B 1.0754
54B 3.11
15S 1.07 35S 1.33 55S 1.07 15
15B 1.4235
35B 1.5155
55B 2.14
16S 1.25 36S 1.51 56B 2.55 16
16B 1.2536
36B 2.1456
56B 2.49
17S 1.69 37S 1.80 57S 0.98 17
17B 1.8637
37B 2.6757
57B 2.85
18S 1.42 38S 1.95 58S 2.05 18
18B 1.9538
38B 1.6958
58B 5.05
19S 1.86 39S 2.67 19
19B 1.1639
39B 3.39
20S 2.67 40S 1.51 20
20B 1.0740
40B 2.14
Note:
• S: Surface layer, 2m
• B: Bottom layer, ≥≥ 100m

Proceedings of the SEAFDEC Seminar on Fishery Resources in the South China Sea, Area IV : Vietnamese Waters
381
Table 6. Zn-Concentration in seawater.
Station Samples Zn (nM) Station Samples Zn (nM) Station Samples Zn (nM)
1S 156.52 21S 156.68 41S 136.96 1
1B 188.3821
21B 118.4541
41B 147.73
2S 149.36 22S 134.38 42S 146.97 2
2B 180.6522
22B 155.3142
42B 133.17
3S 133.32 23S 120.43 43S 134.08 3
3B 181.1123
23B 134.3843
43B 154.86
4S 145.91 24S 158.95 44S 133.17 4
4B 162.9024
24B 138.6344
44B 168.06
5S 152.13 25S 132.56 45S 172.00 5
5B 150.4625
25B 135.5945
45B 158.05
6S 150.46 26S 145.91 46S 161.83 6
6B 147.2726
26B 157.1446
46B 147.73
7S 127.10 27S 152.73 47S 163.96 7
7B 132.8727
27B 170.0247
47B 146.82
8S 127.71 28S 150.00 48S 132.56 8
8B 137.5728
28B 188.3848
48B 150.76
9S 133.59 29S 151.22 49S 131.65 9
9B 149.8529
29B 174.2749
49B 156.53
10S 162.75 30S 156.37 50S 136.96 10
10B 156.3830
30B 182.9250
50B 167.91
11S 133.47 31S 146.06 51S 133.17 11
11B 158.0531
31B 198.9951
51B 203.55
12S 141.36 32S 147.43 52S 140.45 12
12B 135.5932
32B 173.8252
52B 161.99
13S 115.42 33S 134.53 53S 150.16 13
13B 138.6333
33B 164.1153
53B 150.46
14S 133.47 34S 142.42 54S 126.04 14
14B 131.5034
34B 176.2454
54B 134.08
15S 141.97 35S 140.15 55S 150.46 15
15B 131.0535
35B 148.4955
55B 156.53
16S 133.32 36S 157.44 56B 150.64 16
16B 139.8136
36B 172.0056
56B 167.75
17S 123.31 37S 134.54 57S 152.13 17
17B 140.4537
37B 148.9557
57B 173.82
18S 154.86 38S 150.61 58S 102.53 18
18B 163.5038
38B 146.9758
58B 187.17
19S 150.15 39S 139.08 19
19B 155.0139
39B 156.53
20S 167.14 40S 133.32 20
20B 138.2140
40B 161.98
Note:
• S: Surface layer, 2m
• B: Bottom layer, ≥≥ 100m
Southeast Asian Fisheries Development Center
382
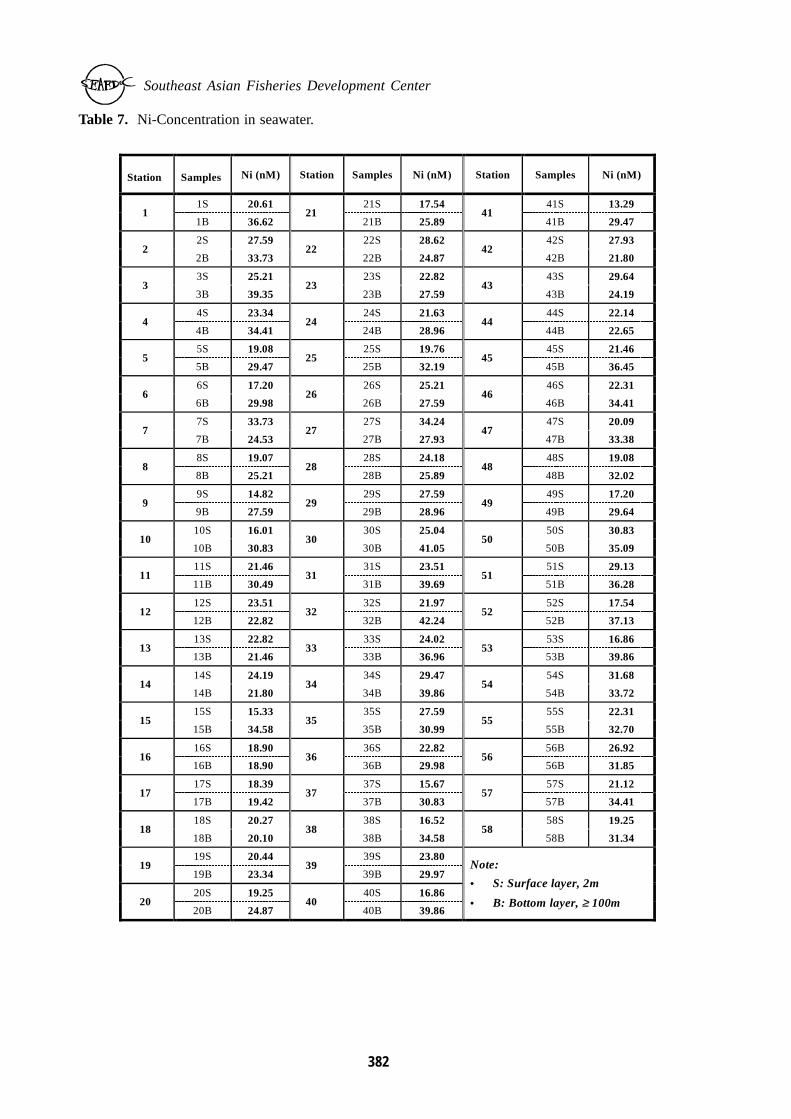
Table 7. Ni-Concentration in seawater.
Station Samples Ni (nM) Station Samples Ni (nM) Station Samples Ni (nM)
1S 20.61 21S 17.54 41S 13.29 1
1B 36.6221
21B 25.8941
41B 29.47
2S 27.59 22S 28.62 42S 27.93 2
2B 33.7322
22B 24.8742
42B 21.80
3S 25.21 23S 22.82 43S 29.64 3
3B 39.3523
23B 27.5943
43B 24.19
4S 23.34 24S 21.63 44S 22.14 4
4B 34.4124
24B 28.9644
44B 22.65
5S 19.08 25S 19.76 45S 21.46 5
5B 29.4725
25B 32.1945
45B 36.45
6S 17.20 26S 25.21 46S 22.31 6
6B 29.9826
26B 27.5946
46B 34.41
7S 33.73 27S 34.24 47S 20.09 7
7B 24.5327
27B 27.9347
47B 33.38
8S 19.07 28S 24.18 48S 19.08 8
8B 25.2128
28B 25.8948
48B 32.02
9S 14.82 29S 27.59 49S 17.20 9
9B 27.5929
29B 28.9649
49B 29.64
10S 16.01 30S 25.04 50S 30.83 10
10B 30.8330
30B 41.0550
50B 35.09
11S 21.46 31S 23.51 51S 29.13 11
11B 30.4931
31B 39.6951
51B 36.28
12S 23.51 32S 21.97 52S 17.54 12
12B 22.8232
32B 42.2452
52B 37.13
13S 22.82 33S 24.02 53S 16.86 13
13B 21.4633
33B 36.9653
53B 39.86
14S 24.19 34S 29.47 54S 31.68 14
14B 21.8034
34B 39.8654
54B 33.72
15S 15.33 35S 27.59 55S 22.31 15
15B 34.5835
35B 30.9955
55B 32.70
16S 18.90 36S 22.82 56B 26.92 16
16B 18.9036
36B 29.9856
56B 31.85
17S 18.39 37S 15.67 57S 21.12 17
17B 19.4237
37B 30.8357
57B 34.41
18S 20.27 38S 16.52 58S 19.25 18
18B 20.1038
38B 34.5858
58B 31.34
19S 20.44 39S 23.80 19
19B 23.3439
39B 29.97
20S 19.25 40S 16.86 20
20B 24.8740
40B 39.86
Note:
• S: Surface layer, 2m
• B: Bottom layer, ≥≥ 100m

Proceedings of the SEAFDEC Seminar on Fishery Resources in the South China Sea, Area IV : Vietnamese Waters
383
Table 8. Cr-Concentration in seawater.
Station Samples Cr (nM) Station Samples Cr (nM) Station Samples Cr (nM)
1S 23.08 21S 16.54 41S 16.73 1
1B 22.1221
21B 13.0841
41B 27.31
2S 19.80 22S 15.19 42S 17.69 2
2B 24.2322
22B 14.2342
42B 16.73
3S 18.85 23S 14.23 43S 24.42 3
3B 18.8523
23B 15.1943
43B 26.35
4S 18.46 24S 21.73 44S 16.54 4
4B 16.1524
24B 21.3544
44B 27.30
5S 15.96 25S 20.00 45S 34.81 5
5B 25.3825
25B 19.0445
45B 24.23
6S 18.65 26S 22.31 46S 25.00 6
6B 27.1226
26B 23.6646
46B 22.69
7S 19.42 27S 18.85 47S 24.23 7
7B 20.7727
27B 20.7747
47B 25.38
8S 16.35 28S 14.62 48S 21.15 8
8B 30.7728
28B 21.5448
48B 23.65
9S 21.54 29S 25.39 49S 14.82 9
9B 15.7729
29B 24.2349
49B 24.04
10S 14.62 30S 17.31 50S 15.19 10
10B 23.4630
30B 25.0050
50B 35.00
11S 17.69 31S 16.54 51S 16.54 11
11B 18.0831
31B 21.3551
51B 26.73
12S 16.73 32S 13.85 52S 15.38 12
12B 26.1632
32B 16.9252
52B 23.37
13S 21.35 33S 16.15 53S 20.58 13
13B 23.8533
33B 19.0453
53B 28.46
14S 18.46 34S 15.77 54S 21.54 14
14B 25.1934
34B 25.5854
54B 25.00
15S 26.54 35S 15.19 55S 18.85 15
15B 20.9635
35B 23.8555
55B 33.85
16S 14.23 36S 25.77 56B 15.92 16
16B 22.1836
36B 16.7356
56B 30.39
17S 14.82 37S 22.31 57S 15.00 17
17B 16.7337
37B 17.6957
57B 37.31
18S 23.27 38S 17.31 58S 20.38 18
18B 15.1938
38B 25.5858
58B 25.38
19S 25.00 39S 25.19 19
19B 16.9239
39B 24.23
20S 17.69 40S 25.77 20
20B 18.0840
40B 25.19
Note:
• S: Surface layer, 2m
• B: Bottom layer, ≥≥ 100m
Southeast Asian Fisheries Development Center
384
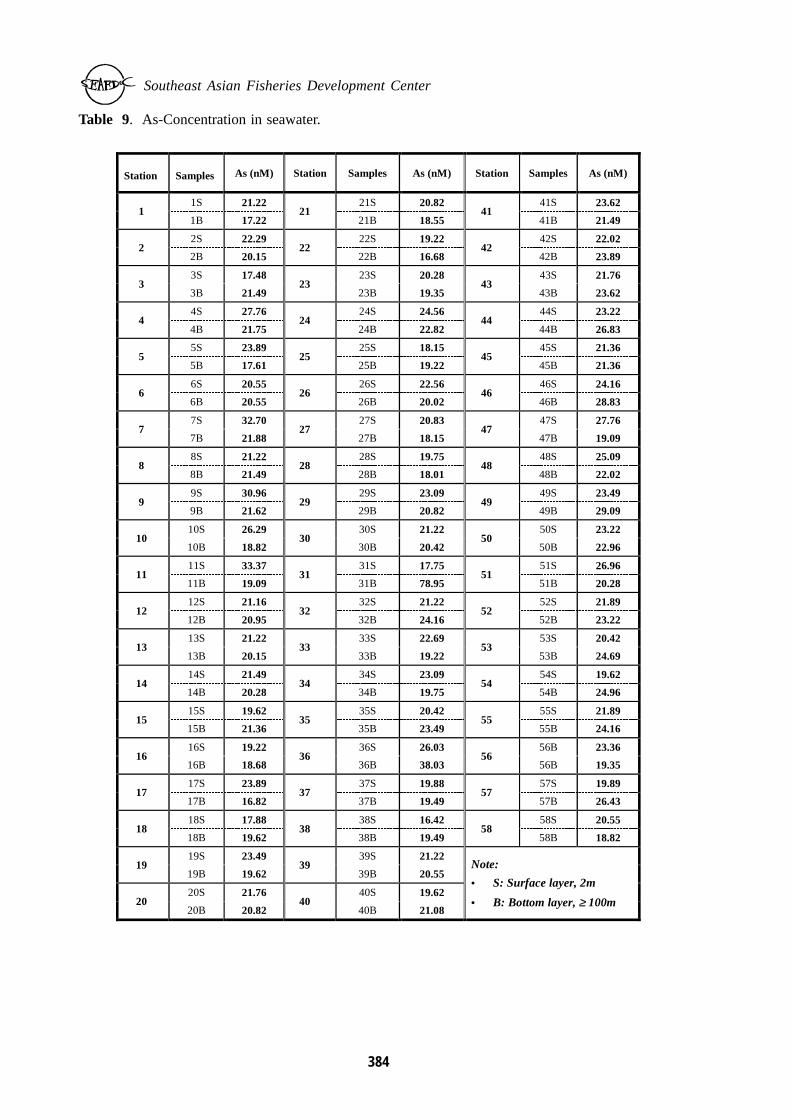
Table 9. As-Concentration in seawater.
Station Samples As (nM) Station Samples As (nM) Station Samples As (nM)
1S 21.22 21S 20.82 41S 23.62 1
1B 17.2221
21B 18.5541
41B 21.49
2S 22.29 22S 19.22 42S 22.02 2
2B 20.1522
22B 16.6842
42B 23.89
3S 17.48 23S 20.28 43S 21.76 3
3B 21.4923
23B 19.3543
43B 23.62
4S 27.76 24S 24.56 44S 23.22 4
4B 21.7524
24B 22.8244
44B 26.83
5S 23.89 25S 18.15 45S 21.36 5
5B 17.6125
25B 19.2245
45B 21.36
6S 20.55 26S 22.56 46S 24.16 6
6B 20.5526
26B 20.0246
46B 28.83
7S 32.70 27S 20.83 47S 27.76 7
7B 21.8827
27B 18.1547
47B 19.09
8S 21.22 28S 19.75 48S 25.09 8
8B 21.4928
28B 18.0148
48B 22.02
9S 30.96 29S 23.09 49S 23.49 9
9B 21.6229
29B 20.8249
49B 29.09
10S 26.29 30S 21.22 50S 23.22 10
10B 18.8230
30B 20.4250
50B 22.96
11S 33.37 31S 17.75 51S 26.96 11
11B 19.0931
31B 78.9551
51B 20.28
12S 21.16 32S 21.22 52S 21.89 12
12B 20.9532
32B 24.1652
52B 23.22
13S 21.22 33S 22.69 53S 20.42 13
13B 20.1533
33B 19.2253
53B 24.69
14S 21.49 34S 23.09 54S 19.62 14
14B 20.2834
34B 19.7554
54B 24.96
15S 19.62 35S 20.42 55S 21.89 15
15B 21.3635
35B 23.4955
55B 24.16
16S 19.22 36S 26.03 56B 23.36 16
16B 18.6836
36B 38.0356
56B 19.35
17S 23.89 37S 19.88 57S 19.89 17
17B 16.8237
37B 19.4957
57B 26.43
18S 17.88 38S 16.42 58S 20.55 18
18B 19.6238
38B 19.4958
58B 18.82
19S 23.49 39S 21.22 19
19B 19.6239
39B 20.55
20S 21.76 40S 19.62 20
20B 20.8240
40B 21.08
Note:
• S: Surface layer, 2m
• B: Bottom layer, ≥≥ 100m

Proceedings of the SEAFDEC Seminar on Fishery Resources in the South China Sea, Area IV : Vietnamese Waters
385
Table 10. Hg-Concentration in seawater.
Station Samples Hg (nM) Station Samples Hg (nM) Station Samples Hg (nM)
1S 0.60 21S 0.85 41S 0.79 1
1B 0.5521
21B 0.3541
41B 0.89
2S 0.55 22S 0.45 42S 0.85 2
2B 0.6922
22B 0.3542
42B 0.89
3S 0.59 23S 0.45 43S 0.85 3
3B 0.6923
23B 1.2443
43B 0.89
4S 0.40 24S 0.49 44S 0.85 4
4B 0.4024
24B 0.4944
44B 0.80
5S 0.59 25S 0.45 45S 0.49 5
5B 0.8525
25B 0.4145
45B 0.82
6S 0.75 26S 0.49 46S 0.60 6
6B 0.5526
26B 0.4546
46B 0.45
7S 0.75 27S 0.45 47S 0.49 7
7B 0.5527
27B 0.3547
47B 0.60
8S 6.48 28S 0.35 48S 0.60 8
8B 0.4928
28B 0.4948
48B 3.60
9S 1.54 29S 0.99 49S 0.70 9
9B 0.8929
29B 0.8949
49B 1.05
10S 0.59 30S 0.45 50S 2.09 10
10B 0.6030
30B 0.7550
50B 1.45
11S 0.70 31S 0.65 51S 0.60 11
11B 0.7031
31B 0.6551
51B 0.55
12S 0.75 32S 0.89 52S 0.55 12
12B 0.4532
32B 0.6052
52B 0.55
13S 0.55 33S 0.80 53S 0.65 13
13B 0.4533
33B 3.0953
53B 0.65
14S 0.40 34S 1.69 54S 0.60 14
14B 0.8034
34B 0.8554
54B 0.49
15S 0.41 35S 0.60 55S 0.80 15
15B 0.6535
35B 0.7055
55B 0.49
16S 0.35 36S 0.75 56B 0.60 16
16B 0.4936
36B 08956
56B 7.13
17S 0.35 37S 0.45 57S 1.20 17
17B 0.4137
37B 0.7557
57B 0.89
18S 0.55 38S 0.60 58S 0.60 18
18B 0.8938
38B 0.7558
58B 2.46
19S 0.45 39S 0.70 19
19B 0.4139
39B 0.95
20S 0.55 40S 0.60 20
20B 0.9040
40B 2.59
Note:
• S: Surface layer, 2m
• B: Bottom layer, ≥≥ 100m

Southeast Asian Fisheries Development Center
386
Table 11. Cu-Concentration in seawater.
Station Samples Cu (µg/l) Station Samples Cu (µg/l) Station Samples Cu (µg/l)
1S 4.87 21S 4.14 41S 3.78 1
1B 5.74 21
21B 5.09 41
41B 5.03
2S 4.69 22S 4.78 42S 3.69 2
2B 5.54 22
22B 4.62 42
42B 4.96
3S 4.74 23S 4.62 43S 4.13 3
3B 4.79 23
23B 4.31 43
43B 4.82
4S 5.02 24S 5.01 44S 3.82 4
4B 4.86 24
24B 5.03 44
44B 5.31
5S 3.96 25S 4.77 45S 4.07 5
5B 5.12 25
25B 4.86 45
45B 5.05
6S 4.32 26S 4.31 46S 3.69 6
6B 4.27 26
26B 5.12 46
46B 4.97
7S 4.18 27S 4.83 47S 3.87 7
7B 4.31 27
27B 4.96 47
47B 4.83
8S 3.74 28S 4.62 48S 4.13 8
8B 4.74 28
28B 5.03 48
48B 3.72
9S 3.84 29S 4.77 49S 4.26 9
9B 4.26 29
29B 5.86 49
49B 4.07
10S 3.86 30S 4.62 50S 3.93 10
10B 4.59 30
30B 5.42 50
50B 5.18
11S 3.71 31S 3.94 51S 4.08 11
11B 4.61 31
31B 4.94 51
51B 4.84
12S 3.30 32S 3.98 52S 5.01 12
12B 3.93 32
32B 5.15 52
52B 5.03
13S 4.26 33S 4.32 53S 3.82 13
13B 4.62 33
33B 4.82 53
53B 4.69
14S 3.93 34S 3.74 54S 3.69 14
14B 4.81 34
34B 4.76 54
54B 3.87
15S 4.12 35S 4.12 55S 4.13 15
15B 5.12 35
35B 4.21 55
55B 5.13
16S 3.84 36S 3.76 56B 4.05 16
16B 3.97 36
36B 3.88 56
56B 5.14
17S 4.07 37S 4.31 57S 3.92 17
17B 4.71 37
37B 4.92 57
57B 4.98
18S 3.76 38S 4.64 58S 4.48 18
18B 4.82 38
38B 3.74 58
58B 4.72
19S 3.94 39S 4.39 19
19B 4.76 39
39B 4.87
20S 3.87 40S 3.81 20
20B 4.88 40
40B 5.12
Note:
• S: Surface layer, 2m
• B: Bottom layer, ≥≥ 100m
Proceedings of the SEAFDEC Seminar on Fishery Resources in the South China Sea, Area IV : Vietnamese Waters
387
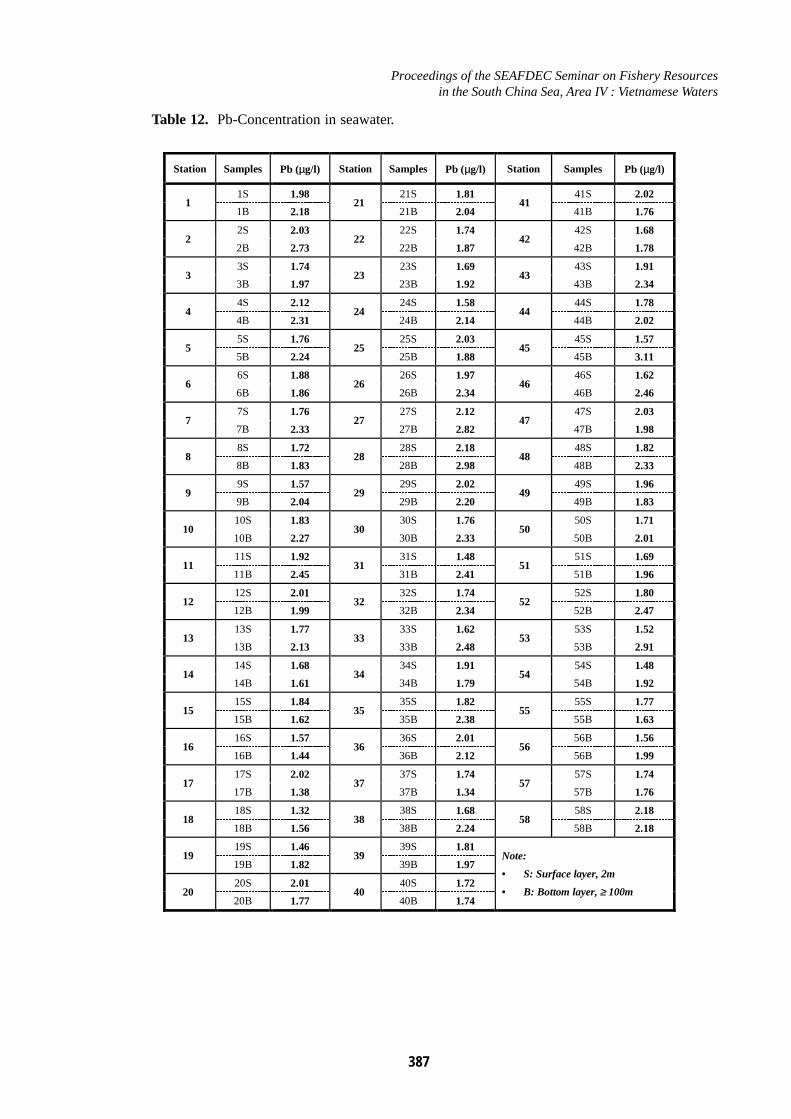
Table 12. Pb-Concentration in seawater.
Station Samples Pb (µg/l) Station Samples Pb (µg/l) Station Samples Pb (µg/l)
1S 1.98 21S 1.81 41S 2.02 1
1B 2.1821
21B 2.0441
41B 1.76
2S 2.03 22S 1.74 42S 1.68 2
2B 2.7322
22B 1.8742
42B 1.78
3S 1.74 23S 1.69 43S 1.91 3
3B 1.9723
23B 1.9243
43B 2.34
4S 2.12 24S 1.58 44S 1.78 4
4B 2.3124
24B 2.1444
44B 2.02
5S 1.76 25S 2.03 45S 1.57 5
5B 2.2425
25B 1.8845
45B 3.11
6S 1.88 26S 1.97 46S 1.62 6
6B 1.8626
26B 2.3446
46B 2.46
7S 1.76 27S 2.12 47S 2.03 7
7B 2.3327
27B 2.8247
47B 1.98
8S 1.72 28S 2.18 48S 1.82 8
8B 1.8328
28B 2.9848
48B 2.33
9S 1.57 29S 2.02 49S 1.96 9
9B 2.0429
29B 2.2049
49B 1.83
10S 1.83 30S 1.76 50S 1.71 10
10B 2.2730
30B 2.3350
50B 2.01
11S 1.92 31S 1.48 51S 1.69 11
11B 2.4531
31B 2.4151
51B 1.96
12S 2.01 32S 1.74 52S 1.80 12
12B 1.9932
32B 2.3452
52B 2.47
13S 1.77 33S 1.62 53S 1.52 13
13B 2.1333
33B 2.4853
53B 2.91
14S 1.68 34S 1.91 54S 1.48 14
14B 1.6134
34B 1.7954
54B 1.92
15S 1.84 35S 1.82 55S 1.77 15
15B 1.6235
35B 2.3855
55B 1.63
16S 1.57 36S 2.01 56B 1.56 16
16B 1.4436
36B 2.1256
56B 1.99
17S 2.02 37S 1.74 57S 1.74 17
17B 1.3837
37B 1.3457
57B 1.76
18S 1.32 38S 1.68 58S 2.18 18
18B 1.5638
38B 2.2458
58B 2.18
19S 1.46 39S 1.81 19
19B 1.8239
39B 1.97
20S 2.01 40S 1.72 20
20B 1.7740
40B 1.74
Note:
• S: Surface layer, 2m
• B: Bottom layer, ≥≥ 100m

Southeast Asian Fisheries Development Center
388
Table 13. Cd-Concentration in seawater.
Station Samples Cd (µg/l) Station Samples Cd (µg/l) Station Samples Cd (µg/l)
1S 0.21 21S 0.23 41S 0.14 1
1B 0.2421
21B 0.1541
41B 0.26
2S 0.22 22S 0.18 42S 0.16 2
2B 0.2622
22B 0.2342
42B 0.27
3S 0.19 23S 0.16 43S 0.12 3
3B 0.2323
23B 0.1843
43B 0.29
4S 0.17 24S 0.15 44S 0.13 4
4B 0.1624
24B 0.1644
44B 0.24
5S 0.20 25S 0.21 45S 0.11 5
5B 0.1725
25B 0.1945
45B 0.25
6S 0.18 26S 0.19 46S 0.30 6
6B 0.2226
26B 0.2246
46B 0.27
7S 0.17 27S 0.17 47S 0.28 7
7B 0.1327
27B 0.2647
47B 0.29
8S 0.16 28S 0.18 48S 0.14 8
8B 0.1528
28B 0.3148
48B 0.30
9S 0.18 29S 0.26 49S 0.21 9
9B 0.1529
29B 0.3249
49B 0.18
10S 0.15 30S 0.17 50S 0.26 10
10B 0.2330
30B 0.3150
50B 0.23
11S 0.12 31S 0.19 51S 0.20 11
11B 0.2431
31B 0.2851
51B 0.26
12S 0.11 32S 0.22 52S 0.17 12
12B 0.2732
32B 0.2452
52B 0.38
13S 0.13 33S 0.14 53S 0.16 13
13B 0.3133
33B 0.2653
53B 0.44
14S 0.18 34S 0.13 54S 0.14 14
14B 0.1434
34B 0.1254
54B 0.35
15S 0.12 35S 0.15 55S 0.12 15
15B 0.1635
35B 0.1755
55B 0.24
16S 0.14 36S 0.17 56B 0.29 16
16B 0.1436
36B 0.2456
56B 0.28
17S 0.19 37S 0.20 57S 0.11 17
17B 0.2137
37B 0.3057
57B 0.32
18S 0.16 38S 0.22 58S 0.23 18
18B 0.2238
38B 0.1958
58B 0.57
19S 0.21 39S 0.30 19
19B 0.1339
39B 0.38
20S 0.30 40S 0.17 20
20B 0.1240
40B 0.24
Note:
• S: Surface layer, 2m
• B: Bottom layer, ≥≥ 100m

Proceedings of the SEAFDEC Seminar on Fishery Resources in the South China Sea, Area IV : Vietnamese Waters
389
Table 14. Zn-Concentration in seawater.
Station Samples Zn (µg/l) Station Samples Zn (µg/l) Station Samples Zn (µg/l)
1S 10.32 21S 10.33 41S 9.03 1
1B 12.4221
21B 7.81 41
41B 9.74
2S 9.85 22S 8.86 42S 9.69 2
2B 11.9122
22B 10.24 42
42B 8.78
3S 8.79 23S 7.94 43S 8.84 3
3B 11.9423
23B 8.86 43
43B 10.21
4S 9.62 24S 10.48 44S 8.78 4
4B 10.7424
24B 9.14 44
44B 11.08
5S 10.03 25S 8.74 45S 11.34 5
5B 9.9225
25B 8.94 45
45B 10.42
6S 9.92 26S 9.62 46S 10.67 6
6B 9.7126
26B 10.36 46
46B 9.74
7S 8.38 27S 10.07 47S 10.81 7
7B 8.7627
27B 11.21 47
47B 9.68
8S 8.42 28S 9.89 48S 8.74 8
8B 9.0728
28B 12.42 48
48B 9.94
9S 8.81 29S 9.97 49S 8.68 9
9B 9.8829
29B 11.49 49
49B 10.32
10S 10.73 30S 10.31 50S 9.03 10
10B 10.3130
30B 12.06 50
50B 11.07
11S 8.80 31S 9.63 51S 8.78 11
11B 10.4231
31B 13.12 51
51B 13.42
12S 9.32 32S 9.72 52S 9.26 12
12B 8.9432
32B 11.46 52
52B 10.68
13S 7.61 33S 8.87 53S 9.90 13
13B 9.1433
33B 10.82 53
53B 9.92
14S 8.80 34S 9.39 54S 8.31 14
14B 8.6734
34B 11.62 54
54B 8.84
15S 9.36 35S 9.24 55S 9.92 15
15B 8.6435
35B 9.79 55
55B 10.32
16S 8.79 36S 10.38 56B 9.93 16
16B 9.2236
36B 11.34 56
56B 11.06
17S 8.13 37S 8.87 57S 10.03 17
17B 9.2637
37B 9.82 57
57B 11.46
18S 10.21 38S 9.93 58S 6.76 18
18B 10.7838
38B 9.69 58
58B 12.34
19S 9.90 39S 9.17 19
19B 10.2239
39B 10.32
20S 11.02 40S 8.79 20
20B 9.1140
40B 10.68
Note:
• S: Surface layer, 2m
• B: Bottom layer, ≥≥ 100m
Southeast Asian Fisheries Development Center
390
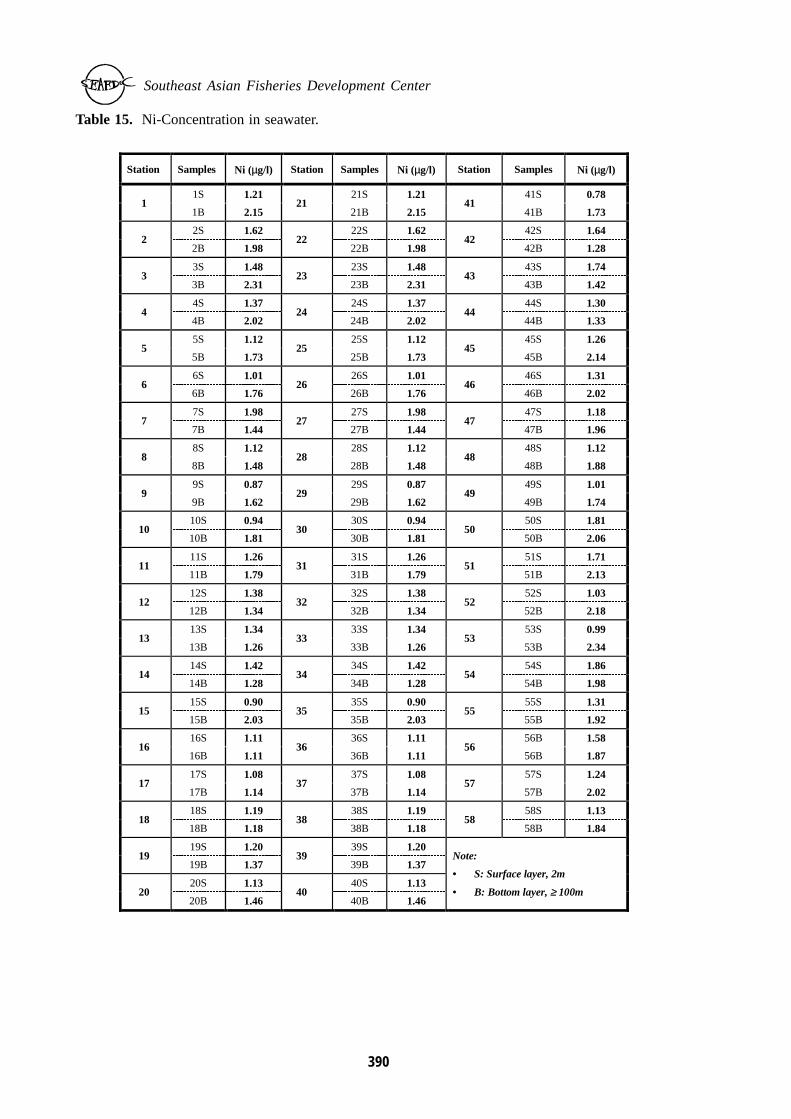
Table 15. Ni-Concentration in seawater.
Station Samples Ni (µg/l) Station Samples Ni (µg/l) Station Samples Ni (µg/l)
1S 1.21 21S 1.21 41S 0.78 1
1B 2.1521
21B 2.15 41
41B 1.73
2S 1.62 22S 1.62 42S 1.64 2
2B 1.9822
22B 1.98 42
42B 1.28
3S 1.48 23S 1.48 43S 1.74 3
3B 2.3123
23B 2.31 43
43B 1.42
4S 1.37 24S 1.37 44S 1.30 4
4B 2.0224
24B 2.02 44
44B 1.33
5S 1.12 25S 1.12 45S 1.26 5
5B 1.7325
25B 1.73 45
45B 2.14
6S 1.01 26S 1.01 46S 1.31 6
6B 1.7626
26B 1.76 46
46B 2.02
7S 1.98 27S 1.98 47S 1.18 7
7B 1.4427
27B 1.44 47
47B 1.96
8S 1.12 28S 1.12 48S 1.12 8
8B 1.4828
28B 1.48 48
48B 1.88
9S 0.87 29S 0.87 49S 1.01 9
9B 1.6229
29B 1.62 49
49B 1.74
10S 0.94 30S 0.94 50S 1.81 10
10B 1.8130
30B 1.81 50
50B 2.06
11S 1.26 31S 1.26 51S 1.71 11
11B 1.7931
31B 1.79 51
51B 2.13
12S 1.38 32S 1.38 52S 1.03 12
12B 1.3432
32B 1.34 52
52B 2.18
13S 1.34 33S 1.34 53S 0.99 13
13B 1.2633
33B 1.26 53
53B 2.34
14S 1.42 34S 1.42 54S 1.86 14
14B 1.2834
34B 1.28 54
54B 1.98
15S 0.90 35S 0.90 55S 1.31 15
15B 2.0335
35B 2.03 55
55B 1.92
16S 1.11 36S 1.11 56B 1.58 16
16B 1.1136
36B 1.11 56
56B 1.87
17S 1.08 37S 1.08 57S 1.24 17
17B 1.1437
37B 1.14 57
57B 2.02
18S 1.19 38S 1.19 58S 1.13 18
18B 1.1838
38B 1.18 58
58B 1.84
19S 1.20 39S 1.20 19
19B 1.3739
39B 1.37
20S 1.13 40S 1.13 20
20B 1.4640
40B 1.46
Note:
• S: Surface layer, 2m
• B: Bottom layer, ≥≥ 100m

Proceedings of the SEAFDEC Seminar on Fishery Resources in the South China Sea, Area IV : Vietnamese Waters
391
Table 16. Cr-Concentration in seawater.
Station Samples Cr (µg/l) Station Samples Cr (µg/l) Station Samples Cr (µg/l)
1S 1.20 21S 0.86 41S 0.87 1
1B 1.1521
21B 0.68 41
41B 1.42
2S 1.03 22S 0.79 42S 0.92 2
2B 1.2622
22B 0.74 42
42B 0.87
3S 0.98 23S 0.74 43S 1.27 3
3B 0.9823
23B 0.79 43
43B 1.37
4S 0.96 24S 1.13 44S 0.86 4
4B 0.8424
24B 1.11 44
44B 1.42
5S 0.83 25S 1.04 45S 1.81 5
5B 1.3225
25B 0.99 45
45B 1.26
6S 0.97 26S 1.16 46S 1.30 6
6B 1.4126
26B 1.23 46
46B 1.18
7S 1.01 27S 0.98 47S 1.26 7
7B 1.0827
27B 1.08 47
47B 1.32
8S 0.85 28S 0.76 48S 1.10 8
8B 1.6028
28B 1.12 48
48B 1.23
9S 1.12 29S 1.32 49S 0.77 9
9B 0.8229
29B 1.26 49
49B 1.25
10S 0.76 30S 0.90 50S 0.79 10
10B 1.2230
30B 1.30 50
50B 1.82
11S 0.92 31S 0.86 51S 0.86 11
11B 0.9431
31B 1.11 51
51B 1.39
12S 0.87 32S 0.72 52S 0.80 12
12B 1.3632
32B 0.88 52
52B 1.22
13S 1.11 33S 0.84 53S 1.07 13
13B 1.2433
33B 0.99 53
53B 1.48
14S 0.96 34S 0.82 54S 1.12 14
14B 1.3134
34B 1.33 54
54B 1.30
15S 1.38 35S 0.79 55S 0.98 15
15B 1.0935
35B 1.24 55
55B 1.76
16S 0.74 36S 1.34 56B 0.83 16
16B 1.1536
36B 0.87 56
56B 1.58
17S 0.77 37S 1.16 57S 0.78 17
17B 0.8737
37B 0.92 57
57B 1.94
18S 1.21 38S 0.90 58S 1.06 18
18B 0.7938
38B 1.33 58
58B 1.32
19S 1.30 39S 1.31 19
19B 0.8839
39B 1.26
20S 0.92 40S 1.34 20
20B 0.9440
40B 1.31
Note:
• S: Surface layer, 2m
• B: Bottom layer, ≥≥ 100m
Southeast Asian Fisheries Development Center
392
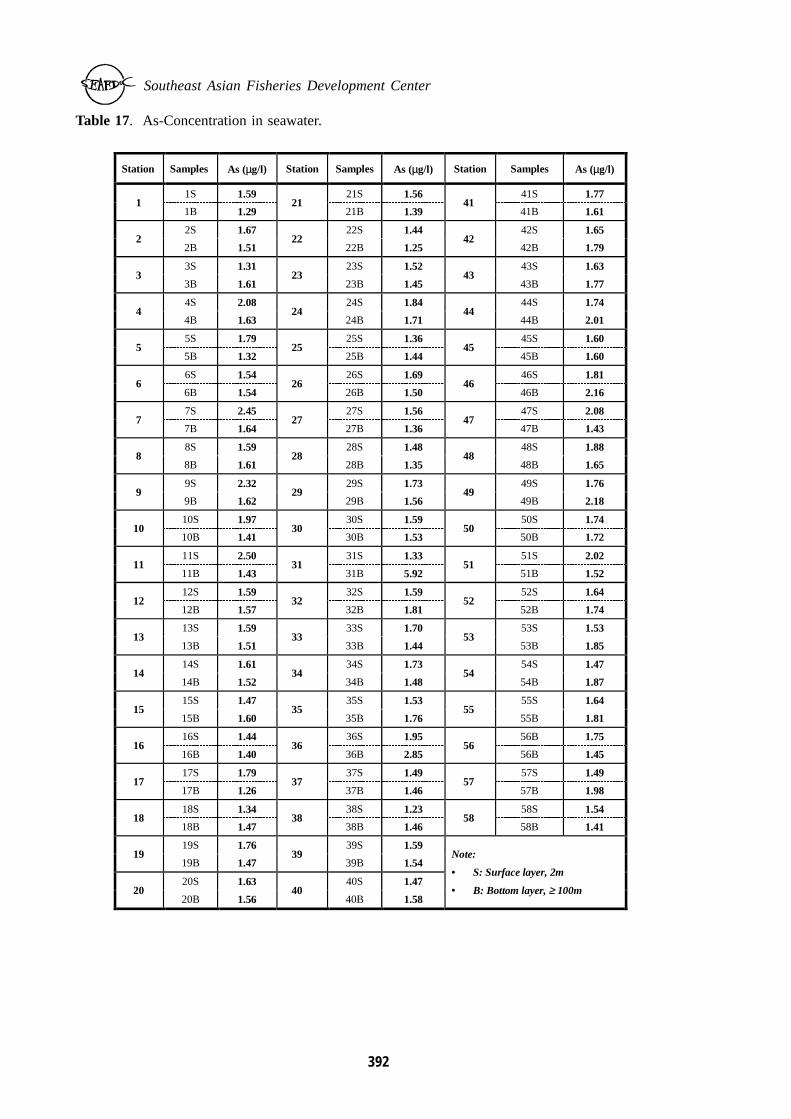
Table 17. As-Concentration in seawater.
Station Samples As (µg/l) Station Samples As (µg/l) Station Samples As (µg/l)
1S 1.59 21S 1.56 41S 1.77 1
1B 1.2921
21B 1.39 41
41B 1.61
2S 1.67 22S 1.44 42S 1.65 2
2B 1.5122
22B 1.25 42
42B 1.79
3S 1.31 23S 1.52 43S 1.63 3
3B 1.6123
23B 1.45 43
43B 1.77
4S 2.08 24S 1.84 44S 1.74 4
4B 1.6324
24B 1.71 44
44B 2.01
5S 1.79 25S 1.36 45S 1.60 5
5B 1.3225
25B 1.44 45
45B 1.60
6S 1.54 26S 1.69 46S 1.81 6
6B 1.5426
26B 1.50 46
46B 2.16
7S 2.45 27S 1.56 47S 2.08 7
7B 1.6427
27B 1.36 47
47B 1.43
8S 1.59 28S 1.48 48S 1.88 8
8B 1.6128
28B 1.35 48
48B 1.65
9S 2.32 29S 1.73 49S 1.76 9
9B 1.6229
29B 1.56 49
49B 2.18
10S 1.97 30S 1.59 50S 1.74 10
10B 1.4130
30B 1.53 50
50B 1.72
11S 2.50 31S 1.33 51S 2.02 11
11B 1.4331
31B 5.92 51
51B 1.52
12S 1.59 32S 1.59 52S 1.64 12
12B 1.5732
32B 1.81 52
52B 1.74
13S 1.59 33S 1.70 53S 1.53 13
13B 1.5133
33B 1.44 53
53B 1.85
14S 1.61 34S 1.73 54S 1.47 14
14B 1.5234
34B 1.48 54
54B 1.87
15S 1.47 35S 1.53 55S 1.64 15
15B 1.6035
35B 1.76 55
55B 1.81
16S 1.44 36S 1.95 56B 1.75 16
16B 1.4036
36B 2.85 56
56B 1.45
17S 1.79 37S 1.49 57S 1.49 17
17B 1.2637
37B 1.46 57
57B 1.98
18S 1.34 38S 1.23 58S 1.54 18
18B 1.4738
38B 1.46 58
58B 1.41
19S 1.76 39S 1.59 19
19B 1.4739
39B 1.54
20S 1.63 40S 1.47 20
20B 1.5640
40B 1.58
Note:
• S: Surface layer, 2m
• B: Bottom layer, ≥≥ 100m
Proceedings of the SEAFDEC Seminar on Fishery Resources in the South China Sea, Area IV : Vietnamese Waters
393
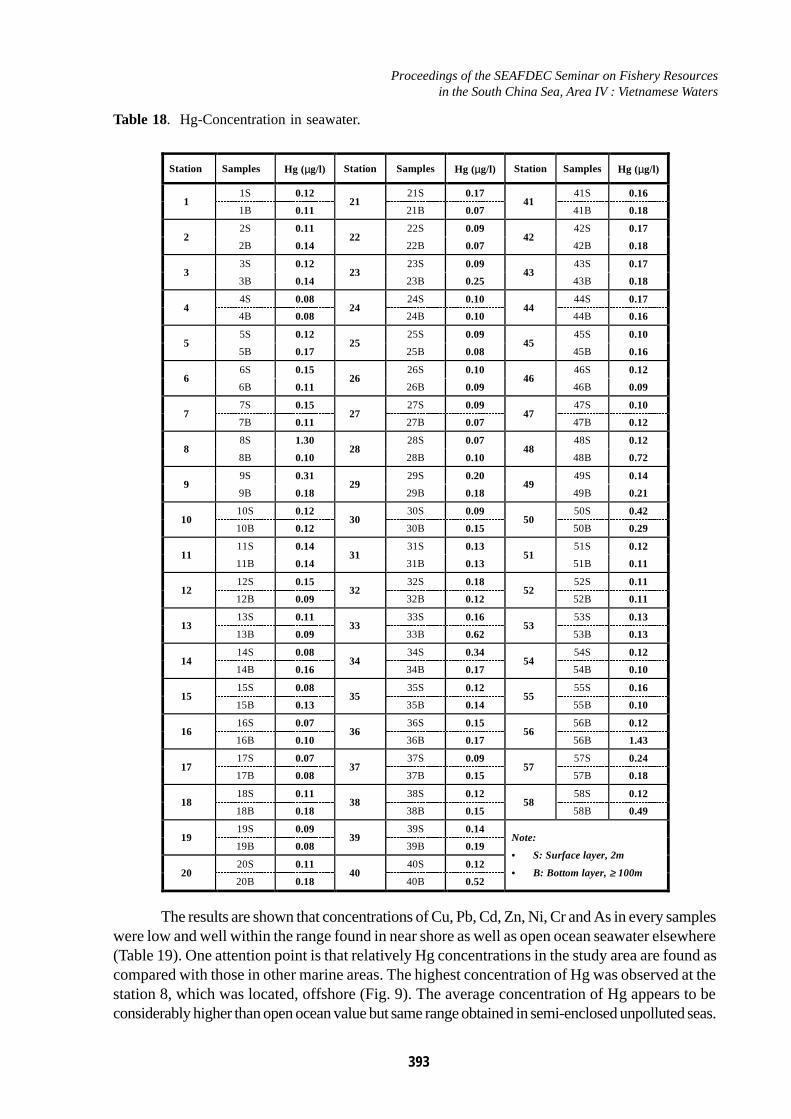
Table 18. Hg-Concentration in seawater.
The results are shown that concentrations of Cu, Pb, Cd, Zn, Ni, Cr and As in every sampleswere low and well within the range found in near shore as well as open ocean seawater elsewhere(Table 19). One attention point is that relatively Hg concentrations in the study area are found ascompared with those in other marine areas. The highest concentration of Hg was observed at thestation 8, which was located, offshore (Fig. 9). The average concentration of Hg appears to beconsiderably higher than open ocean value but same range obtained in semi-enclosed unpolluted seas.
Station Samples Hg (µg/l) Station Samples Hg (µg/l) Station Samples Hg (µg/l)
1S 0.12 21S 0.17 41S 0.16 1
1B 0.1121
21B 0.07 41
41B 0.18
2S 0.11 22S 0.09 42S 0.17 2
2B 0.1422
22B 0.07 42
42B 0.18
3S 0.12 23S 0.09 43S 0.17 3
3B 0.1423
23B 0.25 43
43B 0.18
4S 0.08 24S 0.10 44S 0.17 4
4B 0.0824
24B 0.10 44
44B 0.16
5S 0.12 25S 0.09 45S 0.10 5
5B 0.1725
25B 0.08 45
45B 0.16
6S 0.15 26S 0.10 46S 0.12 6
6B 0.1126
26B 0.09 46
46B 0.09
7S 0.15 27S 0.09 47S 0.10 7
7B 0.1127
27B 0.07 47
47B 0.12
8S 1.30 28S 0.07 48S 0.12 8
8B 0.1028
28B 0.10 48
48B 0.72
9S 0.31 29S 0.20 49S 0.14 9
9B 0.1829
29B 0.18 49
49B 0.21
10S 0.12 30S 0.09 50S 0.42 10
10B 0.1230
30B 0.15 50
50B 0.29
11S 0.14 31S 0.13 51S 0.12 11
11B 0.1431
31B 0.13 51
51B 0.11
12S 0.15 32S 0.18 52S 0.11 12
12B 0.0932
32B 0.12 52
52B 0.11
13S 0.11 33S 0.16 53S 0.13 13
13B 0.0933
33B 0.62 53
53B 0.13
14S 0.08 34S 0.34 54S 0.12 14
14B 0.1634
34B 0.17 54
54B 0.10
15S 0.08 35S 0.12 55S 0.16 15
15B 0.1335
35B 0.14 55
55B 0.10
16S 0.07 36S 0.15 56B 0.12 16
16B 0.1036
36B 0.17 56
56B 1.43
17S 0.07 37S 0.09 57S 0.24 17
17B 0.0837
37B 0.15 57
57B 0.18
18S 0.11 38S 0.12 58S 0.12 18
18B 0.1838
38B 0.15 58
58B 0.49
19S 0.09 39S 0.14 19
19B 0.0839
39B 0.19
20S 0.11 40S 0.12 20
20B 0.1840
40B 0.52
Note:
• S: Surface layer, 2m
• B: Bottom layer, ≥≥ 100m

Southeast Asian Fisheries Development Center
394
Comparison of determined metals at different areas of world indicated that concentrations ofCu, Pb, Cd, Zn, Ni, Cr and As in Vietnamese Sea, South China Sea, Baltic Sea, Pacific Ocean andSouth African Coast were in the same concentration range.
The concentration values for all determined trace metals at the most stations were near placedaverage values. (Fig. 2, 3, 4, 5, 6, 7 and 8)
Table 19. Comparison of the concentration of Cu, Pb, Cd, Zn, Cr, Ni, As and Hg in Vietnamese waterswith other areas of the World (nM) [Utoomprurkporn (1997), Utoomprurkporn (1998),Brugman (1977), Bruland (1983), Millins(1964), Brugman (1977), Gian (1987), Jacinto (1996)].
T race M eta ls C u Pb C d Z n N i C r A s H g
4 .7 -2 3 .6 0 .3 -1 .4 1 0 .2 -6 6 .4
4 6 8 .1 8 2 0 .6 7 2 .5 8 4 2 4 .9
S ea o f Japan 4 .7 2 0 .9 8 1 7 .0 3
C h ina sea 6 .3 -3 6 .2 0 .4 -1 .1 1 1 .9 -8 5 .2
G ulf o f T hailand 1 .5 -9 .0 0 .0 3 -1 .0 0 0 .0 1 -0 .1 7 0 .5 -9 .0
G ulf o f T hailand and E ast C oast o f Pen insu lar M alaysia
1 .6 -1 4 .2 0 .0 5 -0 .8 7 0 .0 0 1 -0 .1 0 1 .7 -8 .5
O ff S abah, S araw ak and B runei D arussalam
2 .9 -2 0 .5 0 .0 2 -1 .5 0 0 .0 1 -1 .3 7 1 .3 -1 4 .1
O cean 4 7 .2 4 1 4 .4 9 0 .8 9 1 5 2 .9 8 .8 2 0 .9 6 4 0 0 .1 5
P acif ic O cean 2 .3 6 0 .4 8 0 .1 3 9 .9 4 2 1 .5 1 .3 3 0 .0 8
A tlan tic O cean 4 .0 6 0 .2 7 1 2 1 .1
B altic S ea 1 1 1 .8 3 .8 6 2 .5 8 1 2 5 .3 8
S outh C h ina S ea 7 .9 -1 0 0 2 .4 -2 6 4 .4 -3 0 7 .6 -6 5 0 .0
T h is S tudy (Su rface L ayer) 6 5 .6 7 1 0 .0 4 1 .6 1 1 4 2 .6 2 2 .6 9 1 9 .2 6 2 2 .3 5 0 .7 7 5
S outh A frican C oast

Proceedings of the SEAFDEC Seminar on Fishery Resources in the South China Sea, Area IV : Vietnamese Waters
395
Fig. 2. Cu-Concentration in seawater.
Fig. 3. Pb-Concentration in seawater.
Fig. 4. Cd-Concentration in seawater.
mg/
Lmg/
Lmg/
L
0
1
2
3
4
5
6
7
1 3 5 7 9 11 13 15 17 19 21 23 25 27 29 31 33 35 37 39 41 43 45 47 49 51 53 55 57
Sampling station
Surface Bottom
0
0.5
1
1.5
2
2.5
3
3.5
1 3 5 7 9 11 13 15 17 19 21 23 25 27 29 31 33 35 37 39 41 43 45 47 49 51 53 55 57Sampling station
Surface Bottom
0
0.1
0.2
0.3
0.4
0.5
0.6
1 3 5 7 9 11 13 15 17 19 21 23 25 27 29 31 33 35 37 39 41 43 45 47 49 51 53 55 57Sampling station
Surface Bottom

Southeast Asian Fisheries Development Center
396
Fig. 5. Zn-Concentration in seawater.
Fig. 6. Ni-Concentration in seawater.
Fig. 7. Cr-Concentration in seawater.
mg/
Lmg/
Lmg/
L
0
2
4
6
8
10
12
14
16
1 3 5 7 9 11 13 15 17 19 21 23 25 27 29 31 33 35 37 39 41 43 45 47 49 51 53 55 57Sampling station
Surface Bottom
0
0.5
1
1.5
2
2.5
1 3 5 7 9 11 13 15 17 19 21 23 25 27 29 31 33 35 37 39 41 43 45 47 49 51 53 55 57Sampling station
Surface Bottom
0
0.5
1
1.5
2
2.5
1 3 5 7 9 11 13 15 17 19 21 23 25 27 29 31 33 35 37 39 41 43 45 47 49 51 53 55 57
Sampling station
Surface Bottom

Proceedings of the SEAFDEC Seminar on Fishery Resources in the South China Sea, Area IV : Vietnamese Waters
397
Fig. 8. As-Concentration in seawater.
Fig. 9. Hg-Concentration in seawater.
mg/
Lmg/
L
0
1
2
3
4
5
6
7
1 3 5 7 9 11 13 15 17 19 21 23 25 27 29 31 33 35 37 39 41 43 45 47 49 51 53 55 57Sampling station
Surface Bottom
0
0.2
0.4
0.6
0.8
1
1.2
1.4
1.6
1 3 5 7 9 11 13 15 17 19 21 23 25 27 29 31 33 35 37 39 41 43 45 47 49 51 53 55 57Sampling station
Surface Bottom
Southeast Asian Fisheries Development Center
398
ANALYSIS OF SEA-SEDIMENT
Sediment is known to be the key to ancient and historian environments. A sequence ofsedimentary layers can tell us about environmental changes over time [Hallberg (1992)]. The geophysicalproperties of ocean sediments have been used as environmental indicators. Studies on ocean sedimentshave begun since the early 1900s. [Folk (1966), Krumbrein (1996)]
The recent sedimentary record can reveal cultural impacts on the environments during theindustrial era. During formation and digenesis, the sediments also take an active part in the biogeochemicalcycles of the elements, which affect the overlying water column.
Assessment of sediment contaminants has become increasingly import over the past severalyears. These assessments must be predictive of pollutant transport and of potential biological effects.
The bottom sediments logical properties not only play a major role in determining the richnessof benthic life and productivity i.e. the diversity of benthic organisms but are also an important parameterthat closely relates to pollution and mineral resources in the oceans.
It was carried as one subproject under the Collaborative Research Project. Objective of thisresearch was to collect up - to -data sediment information concerning on the marine fishery resourceand present oceanographic conditions in the sea area for suitable development of fishery resourcescheme of the South China Sea.
Samples Collection and preparation
Surface sediment samples from offshore of Vietnam are collected using a Smith McIntyre grabon board of the M.V. SEAFDEC.
Out of the 58 stations, a total of 38 stations were sampled on 30 April 1999 to 29 May 1999during the cruise (Fig. 1)
20 stations were not sampled due to technician problems (too deep).
A portion of sediment were carefully collected with a clean plastic spatula, kept in acid cleanedPE bottles, then stored at -20
oC until ready for analysis.
The sediment samples were dried at 85oC then lightly ground to break up the particles. The
sediment was achieved homogeneity and sieved through a 65 mm.
All equipment used for homogenization should be cleaned to minimize the potential of cross-contamination.
Analytical method
About 1 gram homogenized prepared sediment was totally digested in a Teflon decompositionvessel under pressure with a mixture of nitric, hydrochloric, perchloric and hydrofluoric acid. TheTeflon bomb was placed inside a plastic pressure cooker, which was this. Then inside an ordinaryhousehold microwave over with the power turned on full for 1.5h at 150oC.
Proceedings of the SEAFDEC Seminar on Fishery Resources in the South China Sea, Area IV : Vietnamese Waters
399
After cooling, the digest was than made up to 50ml with Mili-Q water.
The sediment samples were analyzed in laboratory of the Department for Analytical Scienceand Technique of the Institute of Chemistry, NCST.
Results and Discussion
This report focuses only on the information gathered and data analyzed from the surface sedimentsamples collected during cruise.
The metal concentrations of Cu, Pb, Cd, Zn, Cr and Ni were determined with the same
The contents of trace heavy metals in sediments of the South China Sea, nevertheless, are notwell documented.
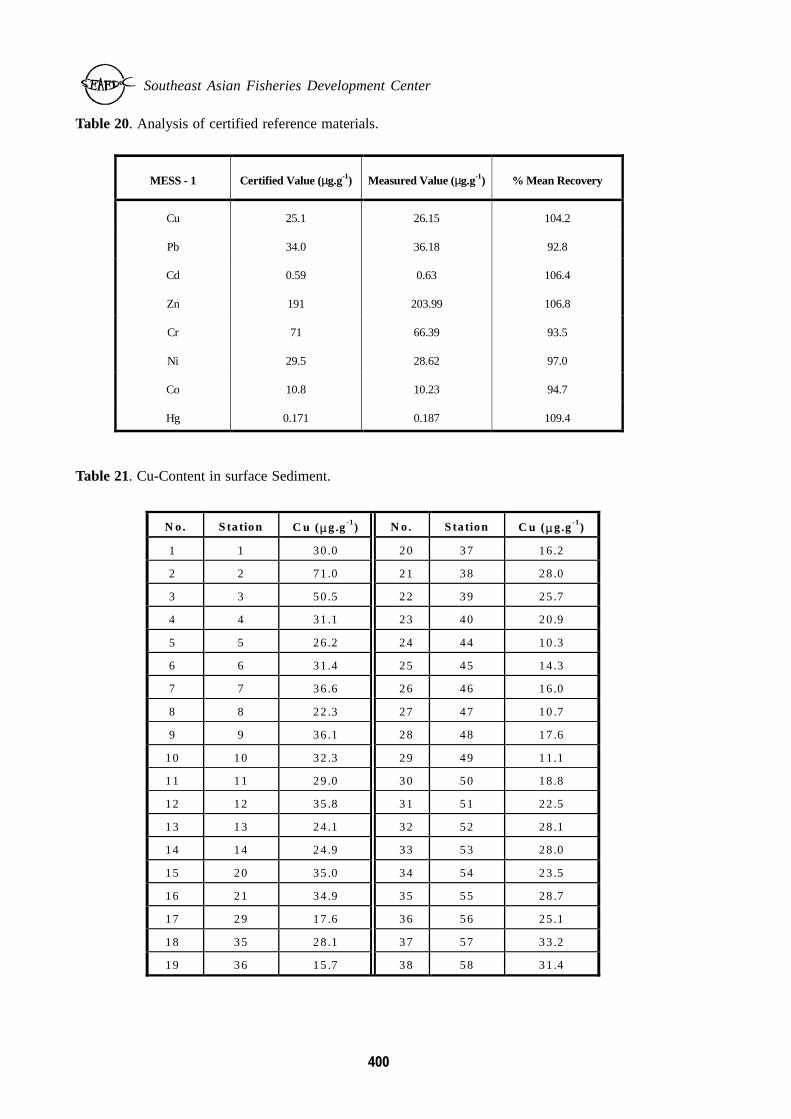
For quality assurance standard reference materials (MESS-1 Gulf of sea Miramichi River)from National Research Council, Marine Analytical Chemistry Standards program, Ottawa, Canadawere digested as above and analyzed for metals with same above described methods. (Table 20)
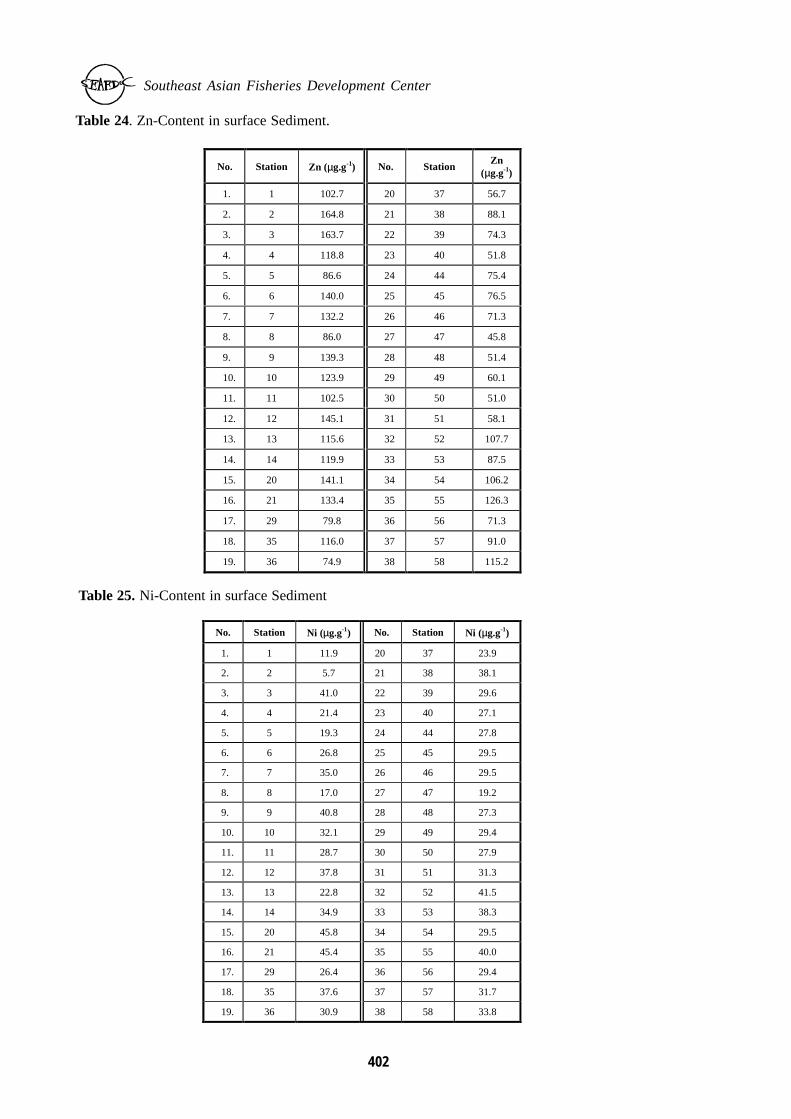
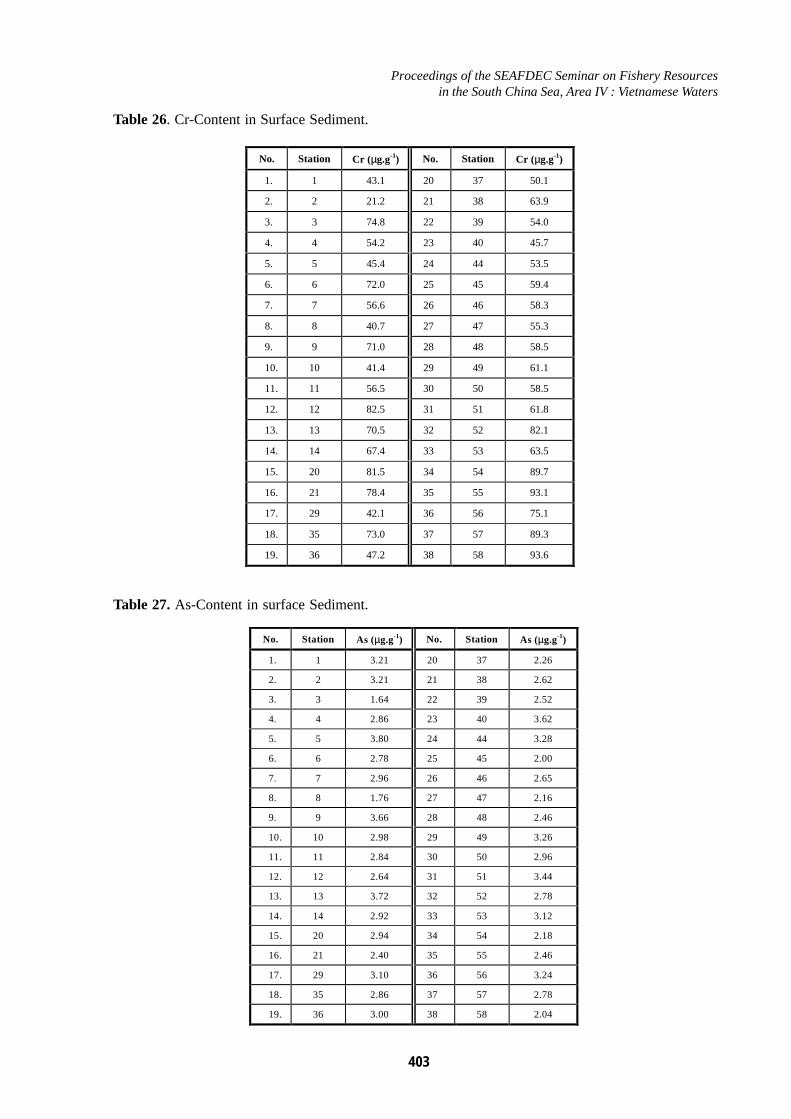
The total contents of determined metals in surface sediment are shown in Tables 21, 22, 23,24, 25, 26, 27 and 28 respectively.
The average concentration of metals in surface layer were found 65.57 nM for Cu, 10.04 nMfor Pb, 1.61 nM for Cd, 142.65 nM for Zn, 22.35 nM for As, 0.775 nM for Hg, 22.39 nM for Ni and19.26 nM for Cr.
Comparison of concentration of determined metals reported by different papers are difficult tocompare because of different method for samples sampling, preparation and determining used.
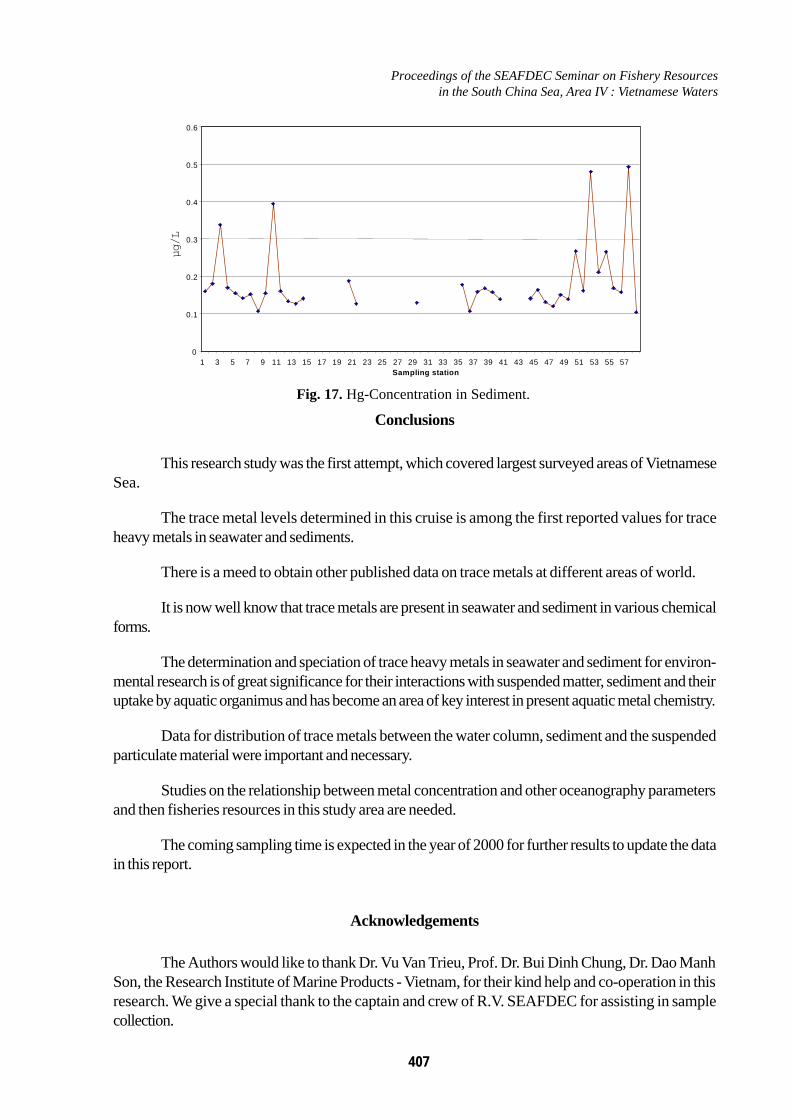
The range of concentration of metals were 10.3 - 71.0 µg.g-1 for Cu, 12.9 - 33.7 µg.g-1 for Pb,1.29 - 18.72 µg.g-1 for Cd, 45.8 - 164.8 µg.g-1 for Zn, 21.2 - 93.6 µg.g-1 for Cr, 5.7 - 45.8 µg.g-1 forNi, 1.64 - 3.80 µg.g-1 for As, and 0.104 - 0.493 µg.g-1 for Hg. The levels found in the present study aresimilar to data from other marine. [Shazili (1986), Shazili (1997), Shazili (1998), Brugman (1982)]
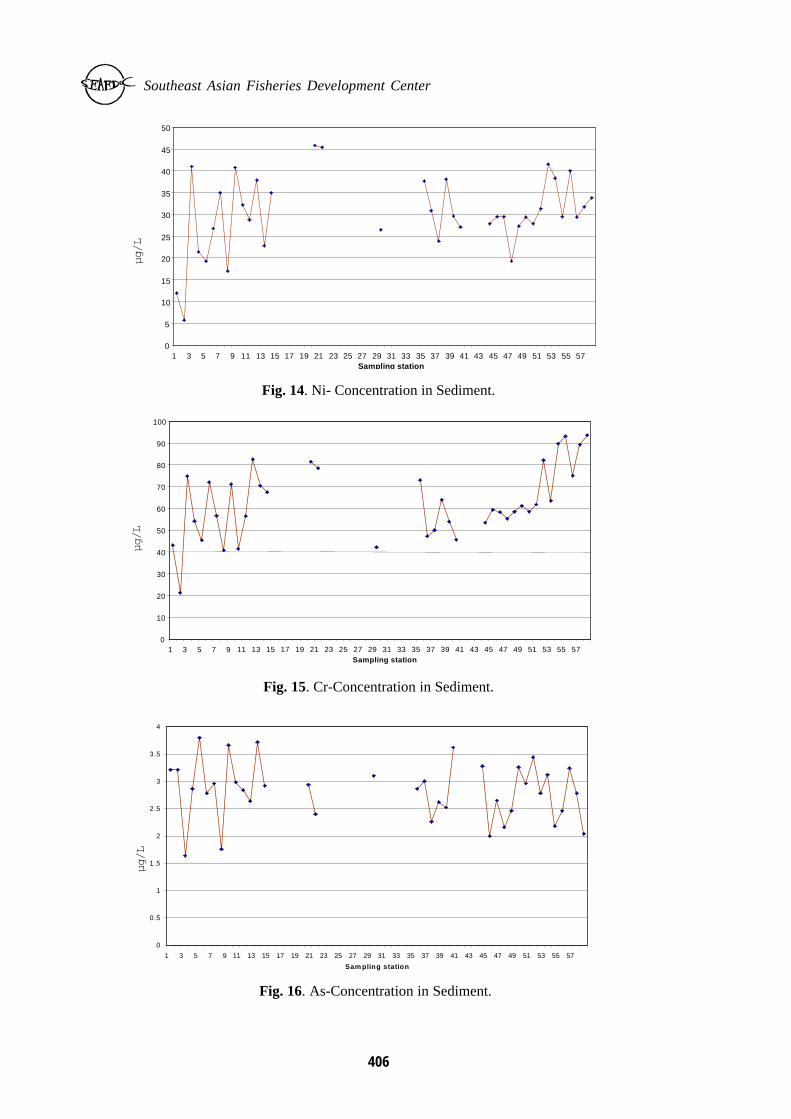
The highest contents of metals were 71.0 µg.g-1 for Cu at station 2, 32.0 µg.g-1 for Pb at station3, 18.72 µg.g-1 for Cd at station 40, 169.8 µg.g-1 for Zn at station 2, 41.0 µg.g-1 for Ni at station 3,93.6 µg.g-1 for Cr at station 58, 3.8 µg.g-1 for As at station 5 and 0.493 µg.g-1 for Hg at station 57.(Fig. 10, 11, 12, 13, 14, 15, 16 and 17)
Southeast Asian Fisheries Development Center
400
Table 21. Cu-Content in surface Sediment.
N o. S ta tion C u (µ g.g-1) N o. S ta tion C u (µ g.g-1)
1 1 30.0 20 37 16.2
2 2 71.0 21 38 28.0
3 3 50.5 22 39 25.7
4 4 31.1 23 40 20.9
5 5 26.2 24 44 10.3
6 6 31.4 25 45 14.3
7 7 36.6 26 46 16.0
8 8 22.3 27 47 10.7
9 9 36.1 28 48 17.6
10 10 32.3 29 49 11.1
11 11 29.0 30 50 18.8
12 12 35.8 31 51 22.5
13 13 24.1 32 52 28.1
14 14 24.9 33 53 28.0
15 20 35.0 34 54 23.5
16 21 34.9 35 55 28.7
17 29 17.6 36 56 25.1
18 35 28.1 37 57 33.2
19 36 15.7 38 58 31.4
Table 20. Analysis of certified reference materials.
MESS - 1 Certified Value (µg.g-1) Measured Value (µg.g-1) % Mean Recovery
Cu 25.1 26.15 104.2
Pb 34.0 36.18 92.8
Cd 0.59 0.63 106.4
Zn 191 203.99 106.8
Cr 71 66.39 93.5
Ni 29.5 28.62 97.0
Co 10.8 10.23 94.7
Hg 0.171 0.187 109.4

Proceedings of the SEAFDEC Seminar on Fishery Resources in the South China Sea, Area IV : Vietnamese Waters
401
Table 22. Pb-Content in surface Sediment.
No. Station Pb (µg.g-1) No. Station Pb (µg.g-1)
1. 1 19.3 20 37 16.1
2. 2 18.3 21 38 16.3
3. 3 32.2 22 39 15.6
4. 4 13.8 23 40 17.1
5. 5 17.4 24 44 14.0
6. 6 13.5 25 45 15.3
7. 7 17.8 26 46 17.5
8. 8 19.6 27 47 18.4
9. 9 14.4 28 48 18.6
10. 10 12.9 29 49 20.48
11. 11 13.9 30 50 16.8
12. 12 20.9 31 51 15.4
13. 13 17.8 32 52 12.9
14. 14 19.3 33 53 19.3
15. 20 18.3 34 54 14.4
16. 21 18.5 35 55 17.2
17. 29 19.4 36 56 14.2
18. 35 21.6 37 57 12.9
19. 36 33.7 38 58 21.0
Table 23. Cd-Content in surface Sediment.
No. Station Cd (µg.g-1) No. Station Cd (µg.g-1)
1. 1 2.52 20 37 3.02
2. 2 1.29 21 38 5.56
3. 3 3.99 22 39 4.37
4. 4 1.52 23 40 18.72
5. 5 4.07 24 44 2.88
6. 6 4.26 25 45 3.67
7. 7 3.91 26 46 3.53
8. 8 3.26 27 47 3.70
9. 9 3.73 28 48 4.28
10. 10 3.13 29 49 3.69
11. 11 3.75 30 50 3.40
12. 12 3.44 31 51 4.23
13. 13 2.45 32 52 4.12
14. 14 3.46 33 53 6.63
15. 20 3.64 34 54 3.41
16. 21 4.36 35 55 4.27
17. 29 2.87 36 56 4.17
18. 35 4.42 37 57 4.53
19. 36 5.57 38 58 3.61
Southeast Asian Fisheries Development Center
402
Table 25. Ni-Content in surface Sediment
No. Station Ni (µg.g-1) No. Station Ni (µg.g-1)
1. 1 11.9 20 37 23.9
2. 2 5.7 21 38 38.1
3. 3 41.0 22 39 29.6
4. 4 21.4 23 40 27.1
5. 5 19.3 24 44 27.8
6. 6 26.8 25 45 29.5
7. 7 35.0 26 46 29.5
8. 8 17.0 27 47 19.2
9. 9 40.8 28 48 27.3
10. 10 32.1 29 49 29.4
11. 11 28.7 30 50 27.9
12. 12 37.8 31 51 31.3
13. 13 22.8 32 52 41.5
14. 14 34.9 33 53 38.3
15. 20 45.8 34 54 29.5
16. 21 45.4 35 55 40.0
17. 29 26.4 36 56 29.4
18. 35 37.6 37 57 31.7
19. 36 30.9 38 58 33.8
Table 24. Zn-Content in surface Sediment.
No. Station Zn (µg.g-1) No. StationZn
(µg.g-1)
1. 1 102.7 20 37 56.7
2. 2 164.8 21 38 88.1
3. 3 163.7 22 39 74.3
4. 4 118.8 23 40 51.8
5. 5 86.6 24 44 75.4
6. 6 140.0 25 45 76.5
7. 7 132.2 26 46 71.3
8. 8 86.0 27 47 45.8
9. 9 139.3 28 48 51.4
10. 10 123.9 29 49 60.1
11. 11 102.5 30 50 51.0
12. 12 145.1 31 51 58.1
13. 13 115.6 32 52 107.7
14. 14 119.9 33 53 87.5
15. 20 141.1 34 54 106.2
16. 21 133.4 35 55 126.3
17. 29 79.8 36 56 71.3
18. 35 116.0 37 57 91.0
19. 36 74.9 38 58 115.2
Proceedings of the SEAFDEC Seminar on Fishery Resources in the South China Sea, Area IV : Vietnamese Waters
403
Table 26. Cr-Content in Surface Sediment.
No. Station Cr (µg.g-1) No. Station Cr (µg.g-1)
1. 1 43.1 20 37 50.1
2. 2 21.2 21 38 63.9
3. 3 74.8 22 39 54.0
4. 4 54.2 23 40 45.7
5. 5 45.4 24 44 53.5
6. 6 72.0 25 45 59.4
7. 7 56.6 26 46 58.3
8. 8 40.7 27 47 55.3
9. 9 71.0 28 48 58.5
10. 10 41.4 29 49 61.1
11. 11 56.5 30 50 58.5
12. 12 82.5 31 51 61.8
13. 13 70.5 32 52 82.1
14. 14 67.4 33 53 63.5
15. 20 81.5 34 54 89.7
16. 21 78.4 35 55 93.1
17. 29 42.1 36 56 75.1
18. 35 73.0 37 57 89.3
19. 36 47.2 38 58 93.6
Table 27. As-Content in surface Sediment.
No. Station As (µg.g-1) No. Station As (µg.g-1)
1. 1 3.21 20 37 2.26
2. 2 3.21 21 38 2.62
3. 3 1.64 22 39 2.52
4. 4 2.86 23 40 3.62
5. 5 3.80 24 44 3.28
6. 6 2.78 25 45 2.00
7. 7 2.96 26 46 2.65
8. 8 1.76 27 47 2.16
9. 9 3.66 28 48 2.46
10. 10 2.98 29 49 3.26
11. 11 2.84 30 50 2.96
12. 12 2.64 31 51 3.44
13. 13 3.72 32 52 2.78
14. 14 2.92 33 53 3.12
15. 20 2.94 34 54 2.18
16. 21 2.40 35 55 2.46
17. 29 3.10 36 56 3.24
18. 35 2.86 37 57 2.78
19. 36 3.00 38 58 2.04

Southeast Asian Fisheries Development Center
404
Fig. 10. Cu-Concentration in Sediment.
Table 28. Hg-Content in surface Sediment.
No. Station Hg (µg.g-1) No. Station Hg (µg.g-1)
1. 1 0.160 20 37 0.159
2. 2 0.181 21 38 0.168
3. 3 0.338 22 39 0.158
4. 4 0.170 23 40 0.139
5. 5 0.155 24 44 0.141
6. 6 0.142 25 45 0.164
7. 7 0.152 26 46 0.132
8. 8 0.107 27 47 0.120
9. 9 0.155 28 48 0.151
10. 10 0.394 29 49 0.139
11. 11 0.161 30 50 0.268
12. 12 0.133 31 51 0.162
13. 13 0.127 32 52 0.480
14. 14 0.141 33 53 0.211
15. 20 0.188 34 54 0.266
16. 21 0.127 35 55 0.169
17. 29 0.130 36 56 0.158
18. 35 0.178 37 57 0.493
19. 36 0.107 38 58 0.104
mg/
L
0
10
20
30
40
50
60
70
80
1 3 5 7 9 11 13 15 17 19 21 23 25 27 29 31 33 35 37 39 41 43 45 47 49 51 53 55 57Sampling station

Proceedings of the SEAFDEC Seminar on Fishery Resources in the South China Sea, Area IV : Vietnamese Waters
405
Fig. 11. Pb-Concentration in Sediment.
Fig. 12. Cd-Concentration in Sediment.
Fig. 13. Zn-Concentration in Sediment.
µg/L
µg/
Lµg
/L
0
5
10
15
20
25
30
35
40
1 3 5 7 9 11 13 15 17 19 21 23 25 27 29 31 33 35 37 39 41 43 45 47 49 51 53 55 57Sampling station
0
2
4
6
8
10
12
14
16
18
20
1 3 5 7 9 11 13 15 17 19 21 23 25 27 29 31 33 35 37 39 41 43 45 47 49 51 53 55 57Sampling station
0
20
40
60
80
100
120
140
160
180
1 3 5 7 9 11 13 15 17 19 21 23 25 27 29 31 33 35 37 39 41 43 45 47 49 51 53 55 57Sampling station
Southeast Asian Fisheries Development Center
406
Fig. 16. As-Concentration in Sediment.
Fig. 14. Ni- Concentration in Sediment.
Fig. 15. Cr-Concentration in Sediment.
µg/L
µg/L
µg/L
0
5
10
15
20
25
30
35
40
45
50
1 3 5 7 9 11 13 15 17 19 21 23 25 27 29 31 33 35 37 39 41 43 45 47 49 51 53 55 57Samplin g station
0
10
20
30
40
50
60
70
80
90
100
1 3 5 7 9 11 13 15 17 19 21 23 25 27 29 31 33 35 37 39 41 43 45 47 49 51 53 55 57Sampling station
0
0.5
1
1.5
2
2.5
3
3.5
4
1 3 5 7 9 11 13 15 17 19 21 23 25 27 29 31 33 35 37 39 41 43 45 47 49 51 53 55 57
Sam pling station
Proceedings of the SEAFDEC Seminar on Fishery Resources in the South China Sea, Area IV : Vietnamese Waters
407
Fig. 17. Hg-Concentration in Sediment.
Conclusions
This research study was the first attempt, which covered largest surveyed areas of VietnameseSea.
The trace metal levels determined in this cruise is among the first reported values for traceheavy metals in seawater and sediments.
There is a meed to obtain other published data on trace metals at different areas of world.
It is now well know that trace metals are present in seawater and sediment in various chemicalforms.
The determination and speciation of trace heavy metals in seawater and sediment for environ-mental research is of great significance for their interactions with suspended matter, sediment and theiruptake by aquatic organimus and has become an area of key interest in present aquatic metal chemistry.
Data for distribution of trace metals between the water column, sediment and the suspendedparticulate material were important and necessary.
Studies on the relationship between metal concentration and other oceanography parametersand then fisheries resources in this study area are needed.
The coming sampling time is expected in the year of 2000 for further results to update the datain this report.
Acknowledgements
The Authors would like to thank Dr. Vu Van Trieu, Prof. Dr. Bui Dinh Chung, Dr. Dao ManhSon, the Research Institute of Marine Products - Vietnam, for their kind help and co-operation in thisresearch. We give a special thank to the captain and crew of R.V. SEAFDEC for assisting in samplecollection.
µg/L
0
0.1
0.2
0.3
0.4
0.5
0.6
1 3 5 7 9 11 13 15 17 19 21 23 25 27 29 31 33 35 37 39 41 43 45 47 49 51 53 55 57Sampling station
Southeast Asian Fisheries Development Center
408
References
Brugmann L., D.1977. Nehring. Beitrage zur Meereskunde. Heft 39: 89-97.Brugmann L.1977. Zur Verteilung einiger Schwermetalle in der Ostsee. Acta Hydrochim. Hydrobiol.
5: 3-21.Brugmann L., U. Hennings.1982. Stratigraphie und Spezifizierung von Metallen in Sedimenten der
Westlichen Ostsee. Acta. Hydrochim. Hydrobiol. 10: 41-53.Bruland K.W.1983. Trace Elements in Seawater; In J.R. Riley, R. Chester. Chemical Oceanography.
Academic Press. New York.Conference of the Vietnam - Philippines. JOM SRE - SCS’96, Hanoi, Vietnam,1977, pp. 10De Silva J.J.R.F. Interaction of Chemical Elements with Biological Systems; In R.J. Williams and J.J.R.F.
De Silva (Eds.). New Trent in Bioinorganic Chemistry. Academic Press, London, pp. 449 -484
Folk. R.L.1966. A Review of Grain Size Parameter Sedimentology, 6: 73-93.Gian T.X.1987. Untersuchungen zur Bestimmung von Metallspuren in Naturlichen Proben. Dissertation.
Rostock.Hallberg R.O.1992. Sediments their Interaction with Biogeochemical Cycles. Biogeochemical Cycles.
Academic Press, pp. 155-174.Jacinto G.S., M.L.S.D. Mc Glone, C.I. Narcise, L.B. Velasquez, N.D. Cu, M.T. Nhuan. Chemical
Hydrographic Feature of the South China Sea between Luzon Philippines and South Vietnam.Krumbein W.C.1937. Sediments and Exponential Curves. Jour. Geol. 45: 577-601.Mullins F. Chemistry and Ocean. Chem. a. Eng. News. Easton 1964. Spec. Rep.Shazili N.A.M., M.L.Husain, R.Yaacob. 1985.Heavy Metal Content of Sediment in South China Sea
1986, pp. 113-116. In: Matahari Expedition, Mohsin et al. (ed). 233 pp.Shazili N.A.M., M.K. Abd Rashi, M.L. Husain, A. Nordin S. Ali. 1997. Trace Metals in the Surface
Sediments of the South China Sea. Area I: Gulf of Thailand and East Coast of PeninsularMalaysia. Proceedings of the First Technical Seminar on Marine Fishery Resources Survey inthe South China Sea. Bangkok, Thailand, pp.73 - 85.
Shazili N.A.M., M.K. Abd Rashi, M.L. Husain, R. Yaakob. 1998. Trace Metals in Surface Sedimentof the South China Sea. Area II: Sarawak, Sabah and Brunei. Proceedings of the SecondTechnical Seminar on Marine Fishery Resources Survey in the South China Sea. Kuala Lumpur,Malaysia, pp.146 - 155.
Utoomprurkporn W., M. Hungspreugs, S. Ratanachongkiat, A. Snidvongs. 1997. BiogeochemicalImplications of Dissolved Trace Metals Concentration and Distribution in South China Sea.Area I: Gulf of Thailand and East Coast of Peninsular Malaysia. Proceedings of the FirstTechnical Seminar on Marine Fishery Resources Survey in the South China Sea. Bangkok,Thailand, pp.86 – 99.
Utoomprurkporn W., A. Snidvongs.1998. Trace Metal Concentration and Distribution in Seawater ofthe South China Sea. Area II: Off Sabah, Sarawak und Brunei Darussalam. Proceedings of theSecond Technical Seminar on Marine Fishery Resources Survey in the South China Sea. KualaLumpur, Malaysia, pp.129 – 145.