analysis and development of a three body heaving … · analysis and development of a three body...
TRANSCRIPT

Analysis and Development of a Three Body Heaving Wave EnergyConverter
by
Scott J. Beatty
BASc, University of British Columbia, 2003
A thesis Submitted in Partial Fulfillment of theRequirements for the Degree of
Master of Applied Science
in the Department of Mechanical Engineering
c© Scott J. Beatty, 2009
University of Victoria
All rights reserved. This thesis may not be reproduced in whole or in part byphotocopy or other means, without the permission of the author.
ii
Analysis and Development of a Three Body Heaving Wave EnergyConverter
by
Scott J. Beatty
BASc, University of British Columbia, 2003
Supervisory Committee
Dr. B. Buckham, Supervisor (Department of Mechanical Engineering)
Dr. P. Wild, Supervisor (Department of Mechanical Engineering)
Dr. C. Crawford, Departmental Member (Department of Mechanical Engineering)
Dr. Rolf Lueck, Outside Member (School of Earth and Ocean Sciences)

iii
Supervisory Committee
Dr. B. Buckham, Supervisor (Department of Mechanical Engineering)
Dr. P. Wild, Supervisor (Department of Mechanical Engineering)
Dr. C. Crawford, Departmental Member (Department of Mechanical Engineering)
Dr. Rolf Lueck, Outside Member (School of Earth and Ocean Sciences)
Abstract
A relative motion based heaving point absorber wave energy converter is being co-
developed by researchers at the University of Victoria and SyncWave Systems Inc. To that
end—this thesis represents a multi-faceted contribution to the development effort. A small
scale two-body prototype wave energy converter was developed and tested in a wave tank.
Although experimental problems were encountered, the results compare reasonably well to
the output of a two degree of freedom linear dynamics model in the frequency domain.
A two-body wave energy converter design is parameterized as a basis for an optimization
and sensitivity study undertaken to illustrate the potential benefits of frequency response
tuning. Further, a mechanical system concept for frequency response tuning is presented.
The two degree of freedom model is expanded to three degrees of freedom to account for the
tuning system. An optimization procedure, utilizing a Sequential Quadratic Programming
algorithm, is developed to establish control schedules to maximize power capture as a
function of the control variables. A spectral approach is developed to estimate WEC power
capture in irregular waves.
Finally, as a case study, the modeling, optimization, and spectral methods are applied to

iv
predict performance for a large scale wave energy converter deployed offshore of a remote
Alaskan island. Using archived sea-state data and community electrical load profiles, a
wave/diesel hybrid integration with the remote Alaskan community power system is assessed
to be technologically feasible.

v
Table of Contents
Supervisory Committee ii
Abstract iii
Table of Contents v
List of Figures vii
Nomenclature x
Acknowledgements xi
1 Introduction 1
1.1 Objectives of this Thesis . . . . . . . . . . . . . . . . . . . . . . . . . . . . . 31.2 Background . . . . . . . . . . . . . . . . . . . . . . . . . . . . . . . . . . . . 41.3 Methods of this Thesis . . . . . . . . . . . . . . . . . . . . . . . . . . . . . . 91.4 Thesis Organization . . . . . . . . . . . . . . . . . . . . . . . . . . . . . . . 101.5 Other Relevant Publications . . . . . . . . . . . . . . . . . . . . . . . . . . . 11
2 Dynamics Modeling and Experimentation 12
2.1 Wave Excitation Forces . . . . . . . . . . . . . . . . . . . . . . . . . . . . . 122.2 Fundamental WEC Design Parameters . . . . . . . . . . . . . . . . . . . . . 152.3 Two Degree of Freedom Dynamics Model . . . . . . . . . . . . . . . . . . . 162.4 Small Scale Prototype Design . . . . . . . . . . . . . . . . . . . . . . . . . . 172.5 Wave Tank Testing . . . . . . . . . . . . . . . . . . . . . . . . . . . . . . . . 192.6 Theoretical Power Calculation . . . . . . . . . . . . . . . . . . . . . . . . . . 212.7 Experimental Power Calculation . . . . . . . . . . . . . . . . . . . . . . . . 212.8 Results and Discussion . . . . . . . . . . . . . . . . . . . . . . . . . . . . . . 222.9 Summary . . . . . . . . . . . . . . . . . . . . . . . . . . . . . . . . . . . . . 23
3 Frequency Response Tuning 24
3.1 Parametric Spar Hull Design . . . . . . . . . . . . . . . . . . . . . . . . . . 243.2 Sensitivity to Spar Natural Frequency . . . . . . . . . . . . . . . . . . . . . 263.3 A Mechanical Tuning System . . . . . . . . . . . . . . . . . . . . . . . . . . 27

vi
3.4 Three Degree of Freedom Dynamics Model . . . . . . . . . . . . . . . . . . 283.5 Scheduling the Control Variables . . . . . . . . . . . . . . . . . . . . . . . . 293.6 Results and Discussion . . . . . . . . . . . . . . . . . . . . . . . . . . . . . . 313.7 Summary . . . . . . . . . . . . . . . . . . . . . . . . . . . . . . . . . . . . . 33
4 A Full Scale Wave Energy Converter 34
4.1 Wave Resource Assessment . . . . . . . . . . . . . . . . . . . . . . . . . . . 354.2 Large Scale WEC Design . . . . . . . . . . . . . . . . . . . . . . . . . . . . 354.3 WEC Power Capture in Irregular Waves . . . . . . . . . . . . . . . . . . . . 364.4 Comparison of WEC power delivery to St. George Island Demand . . . . . 384.5 Summary . . . . . . . . . . . . . . . . . . . . . . . . . . . . . . . . . . . . . 40
5 Conclusions 41
5.1 Conclusions . . . . . . . . . . . . . . . . . . . . . . . . . . . . . . . . . . . . 425.2 Future Work . . . . . . . . . . . . . . . . . . . . . . . . . . . . . . . . . . . 42
Bibliography 44
A Modeling, Design and Testing of a Two-Body Heaving Wave Energy Con-
verter 48
B Frequency Response Tuning for a Two-Body Heaving Wave Energy Con-
verter 57
C Integration of a Wave Energy Converter into the Electricity Supply of a
Remote Alaskan Island 66

vii
List of Figures
1.1 A diagram of Airy waves. . . . . . . . . . . . . . . . . . . . . . . . . . . . . 51.2 Superposition of plane waves . . . . . . . . . . . . . . . . . . . . . . . . . . 61.3 Four examples of wave spectra . . . . . . . . . . . . . . . . . . . . . . . . . 71.4 An idealized schematic of the WEC operation. . . . . . . . . . . . . . . . . 9
2.1 A cylindrical floating body j in regular Airy waves. . . . . . . . . . . . . . . 132.2 A schematic of the two DOF dynamics model. . . . . . . . . . . . . . . . . . 162.3 Orthographic projections of the wave tank prototype WEC . . . . . . . . . 182.4 Orthographic projections of the spar with generator housing details. . . . . 192.5 A photo of the wave tank prototype during testing September 2006. . . . . 202.6 Experimental vs. Dynamics model power capture. . . . . . . . . . . . . . . 22
3.1 Schematic of the parameterized WEC geometry and FLIP. . . . . . . . . . . 273.2 Schematic of the frequency response tuning system . . . . . . . . . . . . . . 283.3 A schematic of the three DOF dynamics model. . . . . . . . . . . . . . . . . 303.4 Power capture comparison for two WEC examples. . . . . . . . . . . . . . . 323.5 Example optimal control variables from a wave tank specific WEC design. . 33
4.1 A drawing of the full scale WEC design. . . . . . . . . . . . . . . . . . . . . 374.2 Hourly power penetration. . . . . . . . . . . . . . . . . . . . . . . . . . . . . 39

viii
Nomenclature
A wave amplitude
A wave amplitude
Fb hydrostatic buoyancy force on floating body j
H regular wave height H = 2A
H(ωi)1/2 float-spar relative displacement transfer function
Hs significant wave height
Hdesign WEC design wave height
Hdir peak wave direction
J rotational inertia of the frequency response control system
N number of components of the discretized spectrum
P mean power capture in irregular waves
P (ω) WEC power capture in the frequency domain
Pelec(t) electrical power output from the DC power take off generator
Pmech(t) instantaneous generator shaft power
R parametric spar bulb radius
Rext electrical resistance of the external power take off circuit
S(ω) wave spectral density
Tj draft (depth of submergence) of body j
Tp peak period
V voltage drop over Rext
Vj displaced volume of body j
η water surface elevation with respect to the mean water level
a0j complex amplitude of fluid acceleration at depth zPj

ix
v0j complex amplitude of fluid velocity at depth zPj
λ wavelength
µ heave added mass coefficient of body j
ω wave frequency
ωi frequency component i of the discretized spectrum
ωj undamped natural frequency of a floating body j
ωp peak frequency
φ angular displacement of rotational system
ρ mass density of water ≈ 1020 [kg/m3]
τ(t) instantaneous torque on the power take off generator shaft
θ direction of wave propagation from the x axis
θgen(t) instantaneous rotational speed of the power take off generator shaft
ε phase constant in wave equation
ξj complex amplitude of displacement of body j
ξj(t) displacement of body j
ξ1/2 complex amplitude of the float relative to the spar
ξ1/2(t) displacement of the float relative to the spar
a radius of the body parallel to wave propagation
a(z) complex amplitude of water particle acceleration at (x, y) = (0, 0)
a(z, t) water particle acceleration at (x, y) = (0, 0)
a1, a2, a3 geometric constraint parameters
c∗g(ω) optimal generator damping coefficient in the frequency domain
cj damping coefficient of body j
cg generator damping coefficient
closs power take–off losses damping coefficient
fe,j complex amplitude of wave excitation force on body j
fe,j(t) wave excitation force on body j
g acceleration due to gravity
h water depth

x
h water depth
i imaginary number
i imaginary number
j index of the jth floating body
k wave number
kj hydrostatic stiffness of body j
l ballscrew lead in meters translation per radian rotation
ljacket parametric spar jacket length
m4 inertial control parameter
m∗4(ω) optimal inertial control parameter in the frequency domain
mj mass of body j
m23 combined spar and tuning system mass
rj water-plane radius of floating body j
t time
v(z) complex amplitude of water particle velocity at (x, y) = (0, 0)
v(z, t) water particle velocity at (x, y) = (0, 0)
x, y, z Cartesian axes. z is zero at mean water level, positive upward
zPj reference depth for bodyj
DOF degree of freedom
NIMBY “not in my backyard”
OTD over-topping device
OWC oscillating water column
PTO power take-off
WAB wave activated body
WEC wave energy converter

xi
Acknowledgements
There are many whom have made this research an incredible experience. Dr. Brad
Buckham, a gifted teacher, I thank for his patience and confidence when pushing me into
unfamiliar theoretical directions. Dr. Peter Wild has been an ideal mentor who leads by
example. Having worked very closely with Nigel Protter, Jim Adamson, Ryan Nicoll and
the SyncWave team throughout this research—I thank them not only for their support but
also for making the work exciting. Clayton Hiles, I thank for his tireless and enthusiastic
contributions, undertaken with eternal pragmatism. As for Jon Zand, I have appreciated
his healthy skepticism and sense of humour. Above all, I thank my family and friends for
their unconditional support.

xii
to Shentae
Chapter 1
Introduction
Ocean surface gravity waves, generated by the transfer of wind energy to the ocean surface,
are a vast source of clean and renewable energy. The total wave power incident on all of
the world’s coastlines has been estimated to be 10 TW, the same order of magnitude as
the world’s total current power demand [1]. As wind energy is transferred to wave energy,
the energy density improves. The spatial concentration increases from an average wind
power intensity of 0.5 kW per square meter of area perpendicular to the wind direction,
at a height of 20 meters above the sea surface, to an average of 2-3 kW per square meter
perpendicular to direction of wave propagation just below the sea surface [1].
Canada’s average incident wave power has been estimated at 37,000 MW on the West
coast and 146,500 MW on the East coast [2] which cumulatively exceed Canada’s current
electrical demand. Although the magnitude of the wave power incident on Canada’s coasts
is impressive, it should be obvious that all of the incident wave power potential cannot
be captured. First, an endeavor of such scale would interrupt the extremely important
ecological processes near the coasts. Second, because wave energy is a distributed and
highly variable renewable energy source and much of Canada’s coastlines are uninhabited,
the cost of extending electrical grids along all coastlines would be astronomical. However,
wave energy conversion—similar to wind energy conversion, can offer an environmentally
benign, economical, and immediate solution to electricity generation for many locations.
An increased public awareness of environmental and energy issues has stimulated a
world-wide increase in support for the development of renewable energy technologies. As
a result, a proliferation of wave energy device developers is occurring globally. However,

2
immediate public acceptance of wave energy has not occurred because wave energy conver-
sion technology and government policy are relatively immature compared to wind energy
parallels, and there are no fully commercialized wave energy devices at this time.
A so-called “design-convergence” has not occurred in the wave energy industry whereas
the global wind energy industry is said to have “converged” to the horizontal axis wind
turbine design. There are many classes of wave energy converters (WEC’s) being developed
and tested worldwide, each with specific advantages and disadvantages:
1. Classified by location, WEC’s are typically separated into shoreline, near-shore, sub-
merged, and offshore devices. Cable costs and incident wave power intensity are
competing economic factors because they both decrease with proximity to shore. Al-
though shoreline devices fit well with breakwater structures, they typically require
more structural material than floating devices, due to the impact stresses from break-
ing waves, and suffer from “not-in-my-back-yard” (NIMBY) issues due to the require-
ment for particularly unattractive structures in coastal locations. Since the kinetic
energy part of the wave power transport decays exponentially with water depth, sub-
merged devices are exposed to less incident wave power, and are expected to suffer
from complex deployment and maintenance procedures.
2. Classified by operating principle, WEC’s can be separated into oscillating water
columns (OWC), over-topping devices (OTD), and wave-activated bodies (WAB).
OWC devices are afflicted with thermodynamic losses resulting from the pressuriza-
tion of air, and noise issues with large air turbines. OTD’s offer relatively smooth
power output but tend to be extremely large devices that require huge capital invest-
ments. WAB’s, a category that encompasses a diverse range of devices that operate
from single modes or combinations of translational and rotational modes, are typically
the most compact and efficient devices [3].
3. Classified according to directional characteristics, WEC’s are typically separated into
point-absorbers, attenuators, and terminators. Point absorbers, attenuators, and ter-
minators, absorb energy from a single point, from a line parallel with the direction of

3
wave propagation, and from a line perpendicular to the direction of wave propagation
respectively.
The point absorber class of WEC offers a relatively low capital investment and high
power capture to mass ratio wave energy conversion solution [3]. The scope of this research
is limited to a WEC classified as a near-shore-to-offshore, point absorbing, wave activated
body. The relative motion based heaving WEC is being co-developed by researchers at
the University of Victoria with SyncWave Systems Inc. The device converts reciprocating
motion between vertically oscillating bodies into electrical energy.
Since there are no clearly superior heaving point absorber designs to date, this thesis is
motivated by the need to expose a further area of the conceptual design space for heaving
point absorber systems to critical study. Whereas other self-reacting designs rely on massive
damper plates [4, 5], monolithic reacting body structures [6], or power extraction from an
internally supported reaction masses [7,8], this thesis explores the SyncWave WEC concept
which employs a streamlined surface-piercing reacting body that is not held fixed, like the
other designs, but is a tunable heaving body.
1.1 Objectives of this Thesis
The overall objective of this thesis is to advance the development of the WEC using ex-
perimental and analytical techniques. The first objective is to develop a dynamics model
for prediction of WEC power capture and experimentally verify its suitability. The second
objective is to extend the model to account for the introduction of a frequency response
control system. The extended model is to be setup to allow application of optimization
algorithms to maximize the utility of the control system. The last objective is to investigate
the technical and economic feasibility of a full scale WEC device integration into a remote
island community power system.
The following specific contributions are sought:
1. To develop and validate a dynamics model that can be used to evaluate WEC per-
formance with and without the tuned reacting body.
2. To develop a process, from first principles, for the sizing of an efficient implementation

4
of the SyncWave WEC.
3. To develop a mechanism for frequency response tuning of the reacting body, so that
it can be used in addition to common methods of generator damping control.
4. To utilize the dynamics model to illustrate the power delivery of a large scale WEC
implementation in irregular waves with comparison to the electrical needs of a remote
coastal community.
1.2 Background
The following theory, descriptions, and discussions provide a foundation for the work pre-
sented in this thesis. Linear water wave theory, which draws on the field of fluid mechanics
is presented first. Second, the spectral approach to ocean waves is introduced. Third, a
basic description of the WEC operating concept is presented. Lastly, a discussion on the
fundamental point absorbing WEC design parameters is given.
1.2.1 Ocean Waves
The temporal and spatial variation of the water surface displacement, η, about the mean
surface elevation, h, for a regular, monochromatic ocean wave of amplitude A, angular
frequency ω, phase constant ε, that is propagating in the positive x and y axes with a
direction θ from the x axis can be expressed by Equation 1.1, where k is the wavenumber
defined as k ≡ 2πλ .
η(x, y, t) = <A exp(−ikx cos θ − iky sin θ + iωt+ ε) (1.1)
A special case, given by Equation 1.2, results when no phase or directionality are considered
(ε = 0 and θ = 0).
η(x, t) = <A exp(−ikx+ iωt) (1.2)
The wavenumber for water waves can be found by an iterative solution to the dispersion
relation given by Equation 1.3.
ω2 = gk tanh(kh) (1.3)

5
In sufficiently deep water, where h > 0.3λ, the waves are not influenced by the ocean
mean surface elevation
Figure 1.1: A diagram of Airy waves. Notice the elliptical particle trajectories as the waveprogresses. The time dependent descriptions of the vertical particle velocities and accelerations arev(z, t) = <
v(z)eiωt
and a(z, t) = <
a(z)eiωt
respectively.
floor, so tanh(kh)→ 1 and as a result, k = ω2
g . The WEC is located at x = 0 so the water
surface elevation is simply η(t) = <Aeiωt.
Linear wave theory, first published by Sir George Biddel Airy, is developed using the
Laplace equation for potential flow, with its associated assumptions (the fluid is inviscid,
incompressible, and irrotational), to govern the fluid domain. By assuming that wave
amplitudes are small, the free surface boundary condition can be linearized, enabling a
solution to the boundary value problem on the fluid domain. The water particle velocities
and accelerations below the water surface, according to the linear solution, in water of
intermediate depth, are functions of wave frequency, wavenumber, depth, and water depth,
as shown in Figure 1.1.
1.2.2 The Wave Spectrum
By utilizing the assumption that all waves maintain a small amplitude, the principle of
superposition can be invoked to describe the surface of a random, irregular sea. Multiple

6
wave systems, each described by Equation 1.1, of various amplitudes, frequencies, and
directions are summed to represent the ocean surface (see Figure 1.2). The spectral density
Figure 1.2: An illustration of the superposition of ocean waves. Monochromatic propagating waves,shown by the lightly shaded stacked surfaces, of different amplitudes, frequencies, and directionscan be superposed to represent the ocean surface shown as the heavily shaded bottom surface.
function, S(ω), also known as the ‘wave spectrum’ of a sea-state, is a continuous function
that represents the instantaneous distribution of variance in water surface elevation across
the frequency range. If the physical constants ρg are applied (i.e. ρgS(ω)), the spectral
density function represents the distribution of wave energy across the frequency range. The
total energy per unit surface area in a sea-state is directly proportional to the area under
its spectral density function. Semi-empirical relationships, established from decades of
oceanographic study, such as the Pierson–Moscowitz spectral form, describe typical shapes
of the spectral density function. These spectral forms are of major importance to marine
engineers as they allow the synthesis of statistically representative ocean surfaces, η(t), from
basic statistical parameters, and they allow the estimation of the probability of occurrence
of any sea-state. The pair of parameters, Hs and Tp, are commonly used for fitting spectral
forms to discrete measured or modeled wave data. Peak frequency, ωp, and peak period,
Tp, are the wave frequency and corresponding period at which S(ω) is a maximum. The
total energy per unit surface area in an irregular sea-state is proportional to the square
of the significant wave height, Hs, in the same way that the energy per unit surface area

7
in monochromatic wave is proportional to the square of its wave height. Significant wave
height, Hs, as defined in practice by Equation 1.4 in both the continuous and discrete
forms [9], is a fitting parameter based on the area under the spectral density function that
is indicative of the intensity of a sea-state.
Hs ≡ 4
√∫ ∞
0S(ω)dω = 4
√√√√N∑
i
S(ωi)∆ω (1.4)
The Pierson–Moscowitz spectral form, shown in Figure 1.3 with comparison to spectral
0 1 2 30
0.2
0.4
ω [rad/s]
S(ω
) [m
2 /rad
/s]
0 1 2 30
0.2
0.4
ω [rad/s]
S(ω
) [m
2 /rad
/s]
0 1 2 30
0.2
0.4
ω [rad/s]
S(ω
) [m
2 /rad
/s]
0 1 2 30
0.2
0.4
ω [rad/s]
S(ω
) [m
2 /rad
/s]
Figure 1.3: Four examples of wave spectra. Individual plots show the comparison of NOAAWavewatch3 hindcast spectral data (indicated by stems) to a fitted Pierson-Moscowitz spectralform indicated by the solid lines. The top left plot shows a particularly good fit, top right showsa reasonable fit, whereas the lower plots are relatively poor fits—showing the limitations of thePierson-Moscowitz spectral form for broad-banded spectra.
data produced by the NOAA Wavewatch 3 model—a global wave propagation model driven
by sattelite-based wind measurements, is synthesized using the pair parameters Hs and Tp
in this thesis. The comparisons between the discrete Wavewatch 3 spectra and the Pierson–
Moscowitz spectral form shown in Figure 1.3 reveal that, depending on the applicability of
the underlying assumptions, the quality of fit can vary.

8
1.2.3 Point Absorbing Wave Energy Conversion
The SyncWave WEC, is classified as an offshore, self-reacting, point absorber. The term
self-reacting means that the device captures energy from the relative motion between float-
ing components as opposed to energy capture from motion relative to a fixed reference (the
ocean floor). The benefits of a self-reacting WEC, over devices that react against the ocean
floor are two-fold:
1. A ‘self-reacting’ WEC is inherently more capable of surviving storms which produce
extreme waves, because the WEC can be adjusted to allow the extreme waves to pass
over the device while enduring minimal mechanical stress, similar to a wind turbine
fitted with a ‘coning’ rotor used to minimize mechanical stresses during extreme
winds.
2. A ‘self-reacting’ WEC is expected to experience significantly less mooring and struc-
tural contact forces during operation. As a result, it can be manufactured using less
material, therefore reducing manufacturing costs and cost of energy [3].
The SyncWave WEC is composed of a float and spar with heave natural frequencies,
ω1 and ω2 respectively. By design, the float and spar natural frequencies in heave are
not equal, ω1 6= ω2. Consider the frequency response of a classic one degree of freedom
(DOF) oscillator that is exposed to a harmonic base excitation of frequency, ω. The ratio
of the excitation frequency to the oscillator’s natural frequency, ω/ωj , will determine the
amplitude and phase of the oscillator’s response. Assuming the oscillator is under-damped,
the amplitude and phase responses are sensitive to the frequency ratio, ω/ωj , when the
excitation is near the classic criteria for resonance, ω/ωj ≈ 1. Since the float and spar are
exposed to wave excitation of the same frequency, ω, but have unequal natural frequencies,
ω1 6= ω2, it follows that their frequency ratios will not be equal, ω/ω1 6= ω/ω2. Thus, the
float and spar will respond with different amplitudes and phases to the wave excitation. So
the fundamental operational concept of the SyncWave WEC is as follows:
For a given wave frequency, there will be some relative motion between the float and
spar from which energy can be extracted.

9
Figure 1.4: An idealized schematic of the WEC operation. The float has large water plane diameterand therefore a high hydrostatic stiffness causing it to behave as a “wave-follower.” The spar hasa small water plane diameter and therefore a relatively low hydrostatic stiffness causing it to moveout of phase with the wave. Relative float-spar displacement causes generator rotation. Thus, thesuperposition of the float and spar motions result in generator rotation. This diagram is idealizedbecause, in actuality, the spar undergoes a smaller displacements and less phase difference withrespect to the water surface than is shown here.
As shown by the schematic in Figure 1.4, a power-take-off (PTO) is mounted between
the float and spar to extract energy from the relative float-spar motion.
1.3 Methods of this Thesis
A two-body scale prototype WEC, dubbed ‘Charlotte,’ was developed in the months pre-
ceding experimental tests performed at the BC Research Ocean Engineering Centre, Van-
couver, B.C. in September 2006. The experimental dynamics and power capture results
were used to validate results derived from a heave constrained linear dynamics model in
the frequency domain.
The experimental results were used to guide a series of recommendations for design
improvement. Power capture improvements were expected with the introduction of an
internally housed reaction mass coupled to a rotational system with variable inertia. To
quantify the potential benefits, the dimensionality of the frequency domain dynamics model
was extended to include the effects of the reaction mass and rotational system. The solution
to the extended dynamics model was expressed as a smooth analytical function of the

10
control variables and subsequently used as an objective function for a Sequential Quadratic
Programming procedure with nonlinear constraints.
Lastly, a set of specifications of a full-scale WEC design were used in combination with
publicly available archived wave data to compare realistic power capture data (obtained
using the developed modeling and optimization codes) to the requirements of a remote
island community in a wave/diesel hybrid scenario.
1.4 Thesis Organization
This thesis describes many aspects of development of the SyncWave WEC, hereafter re-
ferred to as ‘the WEC’. First, a small scale wave-tank model is designed and tested. The
mechanical design and experimental procedure are presented. The test results are com-
pared to the output from a two DOF linear dynamics model, which is developed with all
specific and general assumptions stated.
Next, a parametric design of the two body WEC is developed to investigate the effects
of spar natural frequency adjustments. This lays the foundation for the presentation of a
novel tuning system intended to provide the spar natural frequency adjustments. The two
DOF dynamics model is then expanded to three DOF to account for the tuning system.
A numerical optimization process, based on the three DOF model, are then presented and
used to maximize theoretical power capture.
Further, a spectral representation of ocean waves is applied for estimation of power
capture in irregular waves and used to estimate power capture of a full–scale WEC at a
case study location using hourly wave statistics. Wave power capture is compared in detail
to community electrical power demand. Grid penetration levels are computed to assess the
level of technical challenge associated with the integration of the WEC with the community
electrical system.
The contributions of this thesis are presented in three papers:
1. Modeling, Design, and Testing of a Two-Body Heaving Wave Energy Converter
(BEATTY, S., BUCKHAM, B., and WILD, P., Presented, International Society of
Offshore and Polar Engineers, ISOPE, Lisbon, 2007; Submitted, Proc. International
Journal of Offshore and Polar Engineering, 2008);
11
2. Frequency Response Tuning for a Two-Body Heaving Wave Energy Converter
(BEATTY, S., BUCKHAM, B., and WILD, P., Presented, International Society of
Offshore and Polar Engineers, ISOPE, Vancouver, 2008; Submitted, Proc. Interna-
tional Journal of Offshore and Polar Engineering, 2008);
3. Integration of a Wave Energy Converter into the Electricity Supply of a Remote
Alaskan Island (BEATTY, S., WILD, P., and BUCKHAM, B., Submitted, Journal
of Renewable Energy, 2008);
These papers ore contained in appendices A, B, and C respectively. The body of the
thesis contains three chapters, 2 to 4, which describe the papers in the appendices, including
the methodology, and a discussion of significant findings. Chapter 5 presents the conclusions
of the combined papers, and discusses potential future work.
1.5 Other Relevant Publications
During the research, innovative concepts for the frequency response control system were
contributed which resulted in the submission of United States and International patent
applications. In addition, ongoing work to develop a large-scale WEC within an academic-
industrial consortium has led to a conference submission outlining WEC design and analysis
methodologies.
1. PCT Patent No. WO 2007/137426 A1 - Wave Energy Converter.
(PROTTER, N., BEATTY, S., and BUCKHAM, B.J., World Intellectual Property
Organization, 2007);
2. Design Synthesis of a Wave Energy Converter
(BEATTY, S., HILES, C., NICOLL, R., ADAMSON, J., and BUCKHAM, B., Ac-
cepted, International Conference on Ocean, Offshore and Arctic Engineering, OMAE,
Honolulu, 2009);

Chapter 2
Dynamics Modeling and Experimentation
A linearized dynamics model is used to predict the displacements of the WEC floating
bodies in the frequency domain. To illustrate the WEC operational concept and validate
the dynamics model, a small scale two-body WEC model was designed and constructed
from May through September 2006. The model was tested in a wave channel in September
2006. The modeling, design, and testing results are outlined in detail in Appendix A.
2.1 Wave Excitation Forces
The wave excitation force on a floating body j due to incident waves, with its geometry
defined by Figure 2.1, is based on the assumptions that the floating body undergoes small
displacements and that body j is small with respect to the wavelengths in the horizontal
plane. The assumption of small displacements enables the application of the principle of
superposition. The small body approximation neglects variation of water surface displace-
ment over the body in the horizontal plane. As a result, volume and surface integrals
that would normally be required to obtain excitation force from pressure distributions,
collapse to simple expressions. Derivation of the approach for an axi-symmetric body is
given by Falnes [10] and applications of the approach can be found throughout wave energy
literature [11] and in the analysis of offshore structures [12].
The wave excitation force, fe,j , is calculated as if the body is held fixed. The force, fe,j ,
is superposed with forces experienced by the body j due to its own motion in the ordinary
differential equation that governs the resulting motion of floating body j. Assuming steady
state oscillations, excitation force can be represented by a complex amplitude multiplied

13
Figure 2.1: A cylindrical floating body j in regular Airy waves of amplitude, A, in water depth, h.Body j is characterized by its radius at the water-plane, rj , draft, Tj , and submerged volume, Vj .The reference depth, zPj , is the depth at which the vertical velocity and acceleration of the fluidparticles is considered to interact with the body. This image is not to scale
by a time dependent oscillatory component as in Equation (2.1).
fe,j(t) = <fe,jeiωt
(2.1)
The complex amplitude of the wave excitation force, represented by Equation (2.2), has
three components. On the right hand side of Equation (2.2), the first term accounts for
inertial effects due to the acceleration of the fluid, the second term accounts for drag effects
due to the velocity of the fluid, and the last term accounts for hydrostatic pressure changes
due to the surface displacement of the fluid.
fe,j =[−ω2ρVj(1 + µ)
sinh(kzPj + kh)sinh(kh)
A+ iωcjsinh(kzPj + kh)
sinh(kh)A+ kjA
](2.2)
There are two contributions to the inertial term of Equation (2.2). Falnes [10] attributes
the contribution, ρVj , to the pressure field associated with the undisturbed fluid potential

14
of the incident wave. Secondly, in the approach of Falnes, the added mass term, ρVjµ, is
attributed to the effects of diffraction—the fluid potential field from waves scattered by the
body j when it is held fixed. In another approach, consistent with Falnes’ description of
the physical phenomenon, Dean and Dalrymple [13] describe that, “the pressure gradient
required to accelerate the fluid exerts a so-called “buoyancy” force on the object, corre-
sponding to the [ρVj ] term. . . An additional local pressure gradient occurs to accelerate the
neighboring fluid around the cylinder. The force necessary for the acceleration of the fluid
around the cylinder yields the added mass term, [µ].”
Falnes [10, 11] neglects the second term in Equation 2.2 representing the force due to
the radiation of waves. However, force contributions from viscous drag effects, seen from
experiments to be small but not insignificant, have been blended into the second term in
Equation (2.2). Thus, in this work, the damping coefficient, cj , includes both wave radiation
and viscous damping effects.
The ratios containing the sinh terms account for the depth dependence of the fluid
velocity and accelerations, as established from linear wave theory in Section 1.2.1. The
fractional sinh terms decay to zero as z → −h and approach unity as z → 0. Consistent
with the approaches of Falnes [10,11] and Clauss [12], the fractional sinh terms are evaluated
at a reference depth, zPj which can be seen in Equations (2.3) and (2.4). The reference
depth is the depth at which the vertical fluid velocity and acceleration components interact
most strongly with the structure.
a0j = −ω2 sinh(kzPj + kh)sinh(kh)
A (2.3)
v0j = iωsinh(kzPj + kh)
sinh(kh)A (2.4)
In the case of a cylindrical object, as seen in Figure 2.1, the reference depth is set equal
to the draft of the cylinder [12] (zPj = Tj). In the case of a submerged, horizontally
aligned, flat plate, the reference depth is set equal to the depth of submergence of the
plate [11]. The reference depth for the non-cylindrical spar shape considered in Appendix A
is approximated by a weighted average of the protruding areas normal to the heave direction

15
as described by Equation (21) and Figure 5 of Appendix A.
2.2 Fundamental WEC Design Parameters
The WEC is composed of two floating bodies, a wide float and slender spar (sometimes
called the pillar), that oscillate in the vertical direction (heave). If body j is displaced in
the vertical direction from its equilibrium position by a distance, ∆z, there will be change
in the buoyancy force exerted on the body, ∆Fb, that is proportional to the change in the
submerged volume. For an object that has a constant cross-sectional area at the water-
plane, such as the cylindrical body shown in Figure 2.1, the change in submerged volume
depends only on the vertical displacement, as seen in Equation (2.5).
∆Fb = −ρgπr2j∆z = −kj∆z (2.5)
kj = −∆Fb∆z
= ρgπr2j (2.6)
The change in hydrostatic force per unit vertical displacement of the body is termed
“stiffness” because it is analogous to the stiffness of a mechanical spring (units of N/m).
Denoted, kj , the stiffness of body j is given by Equation (2.6).
A single floating body j can be modeled as a classical one DOF oscillator with mass, mj ,
stiffness, kj , and damping cj . By continuing the analogy with a mechanical oscillator, the
undamped heave natural frequency of body j can then be computed using Equation. (2.7).
ωj =
√kjmj
=
√ρgπr2jmj
(2.7)
It should be apparent from Equation. (2.7) that, through design decisions on the diameters
and masses of any floating body, the heave natural frequencies can be arbitrarily chosen
within physical constraints. For application to the WEC in this thesis, the diameters
and masses are specifically chosen so that the float and spar have different heave natural
frequencies.

16
2.3 Two Degree of Freedom Dynamics Model
The heave oscillation of the floating bodies in this thesis is modeled using a system of two
coupled linear ordinary differential equations with constant coefficients. The excitation of
the system is provided by forces induced by the waves. A schematic of the dynamics model
is shown in Figure 2.2. The float and spar are indicated as body 1 and 2, respectively. The
major assumptions inherent to the modeling approach are:
1. the float and spar oscillate at steady state;
2. the float and spar oscillate in the heave direction only;
3. the float and spar are small with respect to the wavelengths in the horizontal plane
so that the bodies do not “bridge” wavelengths;
Figure 2.2: A schematic of the two DOF dynamics model. The power dissipated through theviscous dashpot, with a damping coefficient of cg, represents the useful power captured by theWEC. Frictional losses are represented here by the dashpot with a damping coefficient, closs.
The solution of the dynamics model at each wave frequency yields the complex ampli-
tudes of the steady state displacements of the float and spar, denoted ξ1 and ξ2 respectively.
Using the relative displacement between the float and spar ξ1/2 = ξ1 − ξ2, the power cap-
tured by the WEC in regular waves is found from the average energy dissipated over the

17
power-take-off damper per cycle, given in Equation (2.8).
P (ω) =12ω2cg|ξ1/2|2 (2.8)
2.4 Small Scale Prototype Design
The design of the wave tank prototype, shown by the drawings in Figure 2.3, was imple-
mented using readily accessible and machinable materials. Material and component choices
were guided by budgetary constraints, material accessibility, and ease of manufacture. As
such, the float and spar hulls were made using PVC pipes normally used for municipal drink-
ing water distribution. Primary structural elements were manufactured from aluminium
bar, tube, and plate. Some of the design strategies used on this device do not apply to
ocean scale devices because the wave tank prototype was intended as a research device to
be used in a controlled wave tank environment only. The spar and float components of
the proof-of-concept WEC was sized so that the natural frequencies of each floating body
fell within the wave frequency range of the wave maker. The draft of the spar was limited
by the tank depth and maximum expected heave oscillations. In consideration of pitch
stability, it was desirable to maintain a low center of gravity and a high center of buoyancy.
As a result, the spar center of gravity was lowered by attaching a ballast ‘bulb’ filled with
lead weights to the bottom of the spar. The center of buoyancy was raised by attaching
streamlined foam buoyancy collars to the spar.
A linear guide system, using recirculating ball-bearings running on hardened stainless
steel shafts, enabled low friction linear relative motion between the float and spar. The
linear relative motion is translated to rotation using a plastic coated cable chain that
engages with both a drive sprocket and an idler sprocket on the spar. The driven shaft,
sealed using a dynamic O-ring, penetrates through the generator housing which forms the
top-most portion of the spar. The driven shaft connects to a DC generator through a
toothed belt transmission with a four-to-one drive ratio, as seen in Figure 2.4(b). Specific
design details are given in Appendix A. Note that the spar is referred to as the “pillar” in
Appendix A. A brush commutated DC generator, modeled as a linear viscous dashpot with
damping coefficient cg, was used for the PTO. A series of bench-top tests were performed

18
float
spar
linear guide rails
idler sprocket
ballast
buoyancy collars
generator sprocket
mean water level
mooring lines
Figure 2.3: Orthographic projections of the wave tank prototype WEC with labels of basic features.
to characterize generator specific constants so that the generator damping coefficient could
be set by the resistance of an external circuit through Equation (29) of Appendix A.
To facilitate mechanical shaft-power measurements, the PTO system was designed to
ensure the input shaft torque could measured using the combination of a force signal from
an offset load cell with a rotational position/velocity signal from an optical encoder. The
design of the PTO system is shown in Figure 2.4(b). Because the generator shaft rotation is
kinematically coupled to the float-spar relative translation through the generator sprocket
and belt-drive, the optical encoder signal also enabled measurement of the relative float-spar

19
cut-awaydetail A
cut-awaydetail B
(a) Spar design
generator
load cell
PTO chain
generatorsprocket
load cell
cut-away detail A
cut-away detail B
opticalencoder
4:1 belt drive
(b) Generator housing cut-away views
Figure 2.4: Orthographic projections of the spar with generator housing cut-away views. Thecylindrical spar hull and end caps have been cut-away (sectioned portions indicated by gray shading)to reveal the power take off mechanism within the generator housing.
motion, ξ1/2.
2.5 Wave Tank Testing
The WEC device was tested in September 2006 at the Ocean Engineering Center in Van-
couver, British Columbia—at that time operated by Oceanic Consulting Corporation. The
WEC can be seen during the testing in Figure 2.5. The testing, as described in detail in
Appendix A, was done in a tank of 2.4m depth, 3.6m width, and 100m length and the
wave maker was capable of producing regular waves of 25cm maximum height. The testing
was done in two phases. In the first phase, ‘drop tests’ were done for each of the float
and spar in the absence of waves. The hydrostatic stiffness values, kj , were easily obtained
from the known water plane areas of the float and spar. Accounting for frictional damping
from the linear guides, damping coefficients and added mass coefficients for each body were
experimentally determined for the float and spar using decaying heave oscillations of each

20
Figure 2.5: A photo of the wave tank prototype during testing September 2006.
body, seen in Figure 6 of Appendix A. The damping coefficients were extracted using the
method of logarithmic decrement. The added mass coefficients were obtained by compar-
ing the mass values extracted from the frequencies of experimental heave oscillation via the
relationship mj = kj/ω2j to the known physical masses of the float and spar.
In the second phase, regular waves of constant height were propagated in the tank
while the water elevation, 6 DOF motion, shaft power, and DC electrical power signals
were sampled at a rate of 1 kHz using a data acquisition system. Multiple runs were done
at various wave frequencies across the wave maker’s frequency bandwidth capability. A
single capacitance type wave probe was utilized for water surface elevation measurements.
With reference to the steady-state wave tank tests, discussions of the validity of the
major assumptions inherent to the dynamics model are given below. The float-spar relative
motion signal from the rotational encoder was nearly sinusoidal with zero mean. During
data analysis, attention was given to ensuring the measurement window did not contain
signals with amplifying and decaying amplitudes, thus for the wave tank tests, the model
assumption of steady-state oscillations is considered valid.
The WEC displacements in six DOF were logged using an LED based motion capture
21
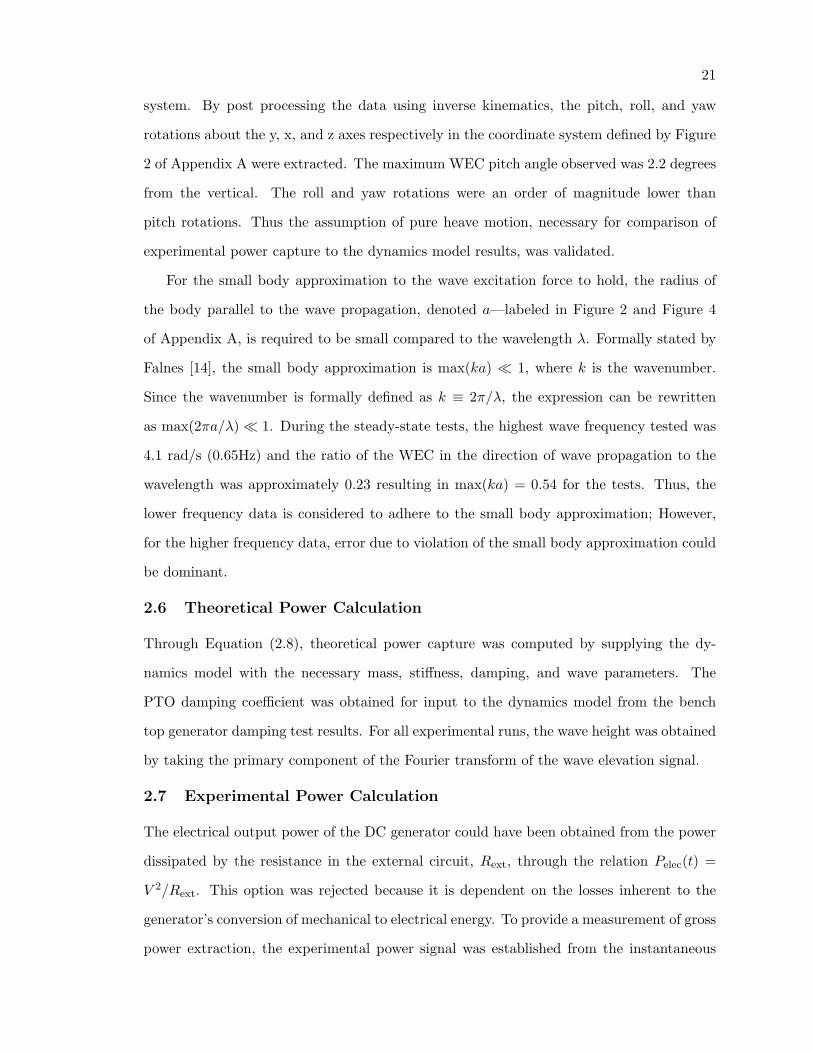
system. By post processing the data using inverse kinematics, the pitch, roll, and yaw
rotations about the y, x, and z axes respectively in the coordinate system defined by Figure
2 of Appendix A were extracted. The maximum WEC pitch angle observed was 2.2 degrees
from the vertical. The roll and yaw rotations were an order of magnitude lower than
pitch rotations. Thus the assumption of pure heave motion, necessary for comparison of
experimental power capture to the dynamics model results, was validated.
For the small body approximation to the wave excitation force to hold, the radius of
the body parallel to the wave propagation, denoted a—labeled in Figure 2 and Figure 4
of Appendix A, is required to be small compared to the wavelength λ. Formally stated by
Falnes [14], the small body approximation is max(ka) 1, where k is the wavenumber.
Since the wavenumber is formally defined as k ≡ 2π/λ, the expression can be rewritten
as max(2πa/λ) 1. During the steady-state tests, the highest wave frequency tested was
4.1 rad/s (0.65Hz) and the ratio of the WEC in the direction of wave propagation to the
wavelength was approximately 0.23 resulting in max(ka) = 0.54 for the tests. Thus, the
lower frequency data is considered to adhere to the small body approximation; However,
for the higher frequency data, error due to violation of the small body approximation could
be dominant.
2.6 Theoretical Power Calculation
Through Equation (2.8), theoretical power capture was computed by supplying the dy-
namics model with the necessary mass, stiffness, damping, and wave parameters. The
PTO damping coefficient was obtained for input to the dynamics model from the bench
top generator damping test results. For all experimental runs, the wave height was obtained
by taking the primary component of the Fourier transform of the wave elevation signal.
2.7 Experimental Power Calculation
The electrical output power of the DC generator could have been obtained from the power
dissipated by the resistance in the external circuit, Rext, through the relation Pelec(t) =
V 2/Rext. This option was rejected because it is dependent on the losses inherent to the
generator’s conversion of mechanical to electrical energy. To provide a measurement of gross
power extraction, the experimental power signal was established from the instantaneous

22
2 2.2 2.4 2.6 2.8 3 3.2 3.4 3.6 3.8 4 4.2 4.40
1
2
3
4
5
6
7
8
9
Wave Frequency ω [rad/s]
Pow
er C
aptu
re P
[W
]
ka = 0.50
Figure 2.6: Experimental vs. dynamics model power capture. Experimental data is indicated bydots. Model data at the mean wave height is indicated by the solid line and model data for +/- onestandard deviation in wave height is indicated by dashed lines. The small body approximation isconsidered valid for wave frequencies below, and invalid above, the indicated ka = 0.5 line.
torque, τ(t), and rotational speed θgen(t) signals from the generator shaft. An instantaneous
power capture signal through the relation Pmech(t) = τ(t)θgen(t) was computed. Thus,
assuming the linear guide and linear to rotational conversion losses are negligible, the shaft
power signal was comparable directly to theoretical power dissipation derived from the
dynamics model.
2.8 Results and Discussion
As a result of the tests, the two body prototype WEC successfully illustrated the self-
reacting point absorber concept. Observing Figure 2.6, the experimental data follows the
theoretical trend reasonably well at low frequencies, although there exists a high variance
in the experimental data about the general trend. The scatter in the experimental power
signal is attributed to three main sources, summarized below.
1. Significant wave reflections were experienced by the WEC model after a few seconds of
clean incident waves because the wave channel facility was fitted with an ineffective

23
beach. Thus filtering, using Fourier transforms, of the wave elevation signal was
required.
2. The wave maker was not capable of producing waves of consistent nominal height
throughout the frequency range. A statistical analysis of the primary wave com-
ponents for the steady state tests yielded a mean height of 19cm with a standard
deviation of 3cm. Since the power transmitted in waves is proportional to the square
of the wave height, the standard deviation of 3cm is significant.
3. Backlash in the PTO system resulted in spikes in the torque signal. Even after low
pass-filtering the signal, some residual error remained in the mechanical power data.
4. The DC generator was undersized for the application. As a result, lack of precision
in the setting of the PTO external circuit resistance, Rext, resulted in errors in the
generator damping level experienced by the WEC.
The divergence of the experimental data from the dynamics model, as seen in Figure 2.6, at
roughly 4.1 rad/s (the highest frequency tested) is attributed to a violation of the previously
discussed small body approximation. At this frequency, the float was observed to ‘bridge’
wavelengths, thereby mitigating the pure excitation forces felt in waves of lower frequency
and longer wavelength.
2.9 Summary
This chapter summarized the manuscript contribution in Appendix A. A two DOF dynam-
ics model was developed to predict the displacements of the WEC floating bodies in the
frequency domain. An account of the design, construction, and testing of a proof-of-concept
two body WEC model was given. Although experimental problems were encountered, the
test results provided reasonable confidence in the dynamics model from the validation of
trends in Figure 2.6. The dynamics model is the vehicle for the investigations of the next
chapter. The next section of the thesis introduces a frequency response tuning system to
maximize power capture of a more current, ocean-representative device.
Chapter 3
Frequency Response Tuning
This chapter summarizes the development of a frequency response tuning system, discussed
in detail in Appendix B, using the dynamics model produced in Chapter 2. The frequency
response tuning research was conducted in the context of the design of a small scale device
suited for the wave tank size and wave making capabilities of the National Research Council
Institute for Ocean Technology (IOT), located in St. John’s, Newfoundland. Testing at the
IOT is considered the next step in the WEC technology development process. Since the
relationships between WEC geometry and WEC performance are complex, a model-based
design methodology is developed and applied to the small scale WEC in this chapter.
First, a parametric description of the WEC is developed that translates a desired natural
frequency into a hull geometry and mass. Considering a family of WEC’s derived from the
parametric design philosophy, an optimization and sensitivity study was undertaken to
understand what benefits may be available if the natural frequency of the spar could be
adjusted. Next, the internal frequency response tuning system is presented as a feasible
means to create the desired natural frequency adjustments and a three degree of freedom
dynamics model, extended from previous work, is used to evaluate the performance of a
single WEC geometry that employs the internal tuning system.
3.1 Parametric Spar Hull Design
Since the power capture of the WEC is directly related to the frequency responses of the
individual WEC components, the natural frequencies associated with the oscillating bodies
are seen as fundamental design parameters. For a single floating body j, the undamped

25
heave natural frequency is expressed, as for any one DOF oscillating system by Equa-
tion (2.7).
According to Archimedes [15], “If a body which is lighter than a fluid is placed in the
fluid, it will be immersed to such an extent that a volume of fluid which is equal to the
volume of the part of the body immersed has the same weight as the whole body.” In other
words, the mass of a floating body must be equal to the mass of water it displaces. For a
cylindrical floating body, volume displaced by the body is the product of its draft, Tj and
its cross-sectional area at the water-plane, πr2j .
mj = ρVj (3.1)
Vj = πr2jTj (3.2)
Subsequently, the heave natural frequency of a cylindrical body can be represented by
Equation (3.3). The resulting Equation (3.3) indicates that, for a cylindrical body, the
natural frequency is a function of only the body’s draft.
ωj =
√ρgπr2jρπr2jTj
=√
g
Tj(3.3)
Since the float is very stiff in heave (k1 is large), its response is that of a “wave-follower”—
meaning the float responds in phase with the wave. To achieve relative displacement with
the float, the spar must have a response out of phase with the wave excitation. Further, to
maximize the relative response, ξ1/2, and therefore power capture of the WEC, a relatively
low spar natural frequency is desirable.
Consider sizing a cylindrical spar so that its natural frequency is in the range of common
peak frequencies seen in the ocean (take the range 0.35 ≤ ω ≤ 0.75 rad/s observing the ex-
ample wave spectra in Figure 1.3). By substituting the range of ω2 = ω into Equation (3.3)
and solving for T2, the draft of the cylindrical spar must be in the range 23.0 ≤ T2 ≤ 157
m. This result suggests, if the spar design is kept cylindrical, an extremely deep spar draft
is required to achieve a low enough heave natural frequency for the operation of the WEC.
To decrease the draft of the spar while maintaining a low spar natural frequency, it was

26
decided that the spar should deviate from an extruded cylindrical geometry below the water
surface. Therefore a “bulb” structure, consisting of a tapered section, a larger diameter
cylindrical section and a hemispherical portion provides an increase to the submerged vol-
ume while holding the water plane area constant. The resulting strategy enables a spar
design of reasonable draft, while minimizing the ratio k2/m2.
A schematic, showing the parametric design of the WEC with a cylindrical float and
non-cylindrical spar, is given in Figure 3.1. The spar hull shape resembles a baseball bat,
similar to the design of the Scripps Institution of Oceanography’s Floating Instrument
Platform (FLIP) [16]. Since the spar considered here must support the mass of the internal
tuning system in addition to its own mass, the bulb is sized to maintain static equilibrium
of the spar/tuning system combination.
3.2 Sensitivity to Spar Natural Frequency
After choices of Hdesign, a1, a2, a3 are made, based on mechanical design and site constraints,
the parametric spar geometry, given by Equations (2-8) of Appendix B, enables a choice
of spar natural frequency to completely define the spar geometry. Since the spar, of mass,
m2, must support the tuning system mass, m3, the combined spar and tuning system mass
has been labeled m23 = m2 +m3 which allows for later comparisons to a “mass-equivalent”
WEC where the tuning system mass is locked to the spar and considered as ballast rather
than an active control system. Using the two degree of freedom dynamics model developed
in the previous chapter, the sensitivity of power capture to changes in spar design, defined by
the natural frequency of the spar, was investigated. For the sensitivity study conducted
here, the power calculations were done using an optimization of the generator damping
coefficient, as is commonplace in wave energy literature [17–19]. The float was designed to
have the highest natural frequency possible without bridging wavelengths (a violation of
the small body approximation).
The results of the sensitivity and natural frequency optimizations show power capture
benefits of up to 25% over the lowest frequency fixed natural frequency spar, shown in
Figure 5 and 8 of Appendix B from 1.2 rad/s to 2.8 rad/s—a substantial portion of the
frequency range, available if the spar natural frequency could be adjusted.
27
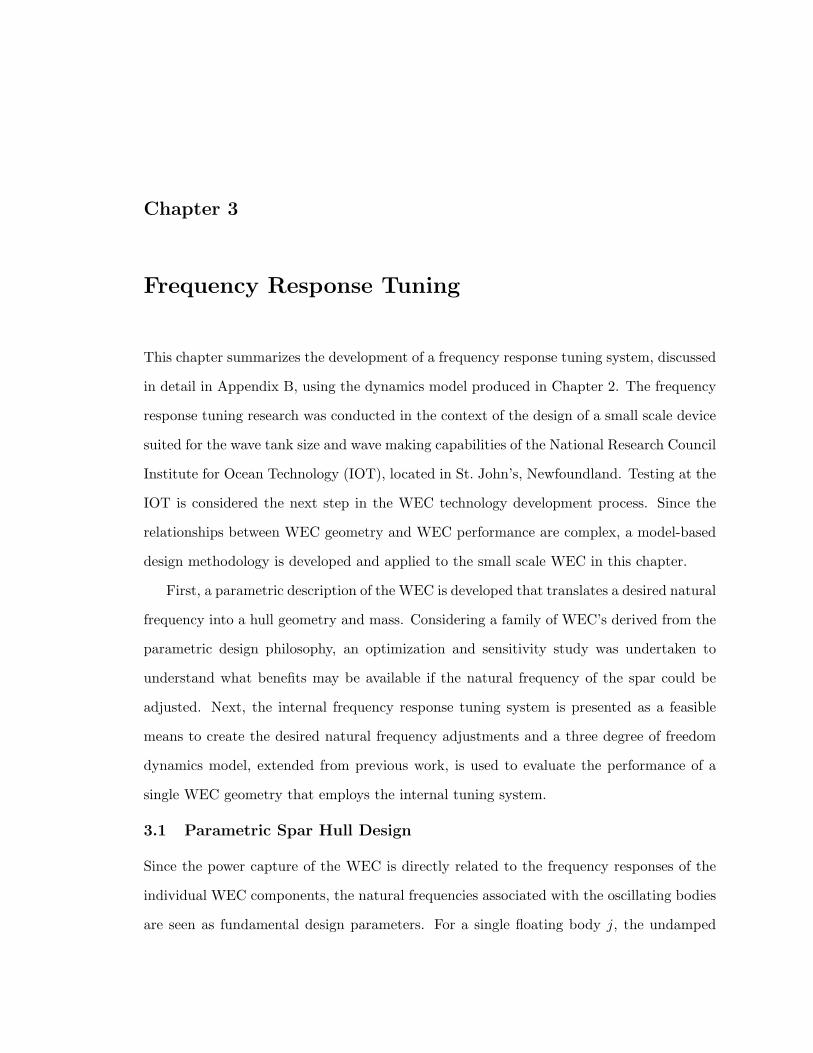
(a) Parameterized WEC geometry
6.1m
3.8m
90m
(b) FLIP
Figure 3.1: Schematic of the parameterized WEC geometry (a). In this schematic, Hdesign isdesign wave height, a1, a2, a3 are geometric constants, ljacket is the jacket length, R is the bulbradius, and h is the water depth. The Scripps Floating Instrument Platform (b). The bulb designafforded an increase of the natural heave period from 19sec to 27sec (decrease of natural frequencyfrom 0.33rad/s to 0.23rad/s) compared to a cylindrical spar of the same draft [16].
3.3 A Mechanical Tuning System
Rather than realize the heaving natural frequency adjustments through spar hull geometry
changes, which is not practical, an internal mechanical tuning system mounted inside the
spar will be exploited. The tuning system has mass m3 labeled in Figure 3.1.
A schematic of the mechanical system, designed to enable additional frequency response
tuning in addition to generator damping control, is shown in Figure 3.2. A spring supported
reaction-mass, m3,of mass comparable to the spar mass, is housed within the spar. The
reaction-mass is constrained to oscillate along the vertical axis inside the spar. The oscil-
lating reaction-mass is kinematically coupled to a rotational system with variable inertia.
28
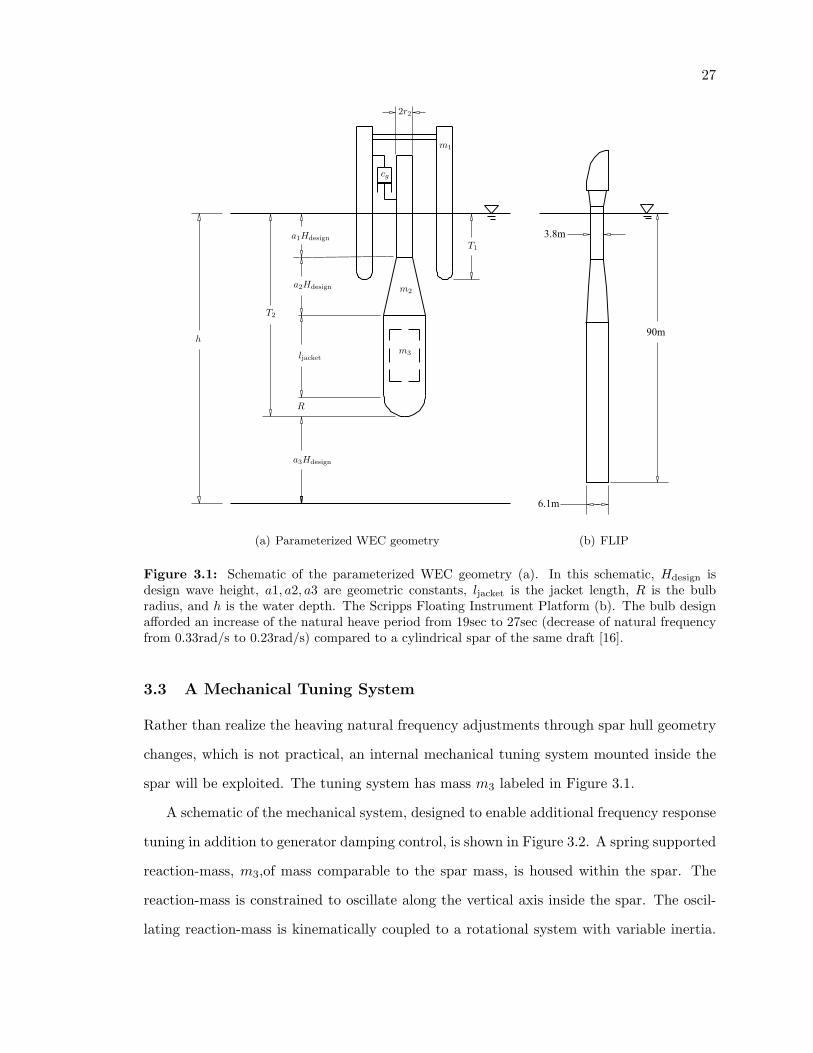
Figure 3.2: Schematic of the frequency response tuning system composed of an internal reaction-mass of mass m3, ball screw of lead l, spring support of stiffness k3, and rotational system withadjustable inertia, J all housed within the spar. Gyroscopic effects due to the angular momentumabout the vertical axis will tend to stabilize the WEC in pitch and roll.
The implementation shown in Figure 3.2 uses a ball screw to convert linear displacement
of the reaction-mass to angular displacement of the rotational system. The inertia, J , of
the rotational system can be adjusted by changing the radial distribution of mass of the
rotational system through a ‘flyball’ apparatus using a hydraulic or electric servo, as shown
in Figure 3.2.
3.4 Three Degree of Freedom Dynamics Model
In addition to the design frequencies of the spar and float, the heaving oscillations of the
coupled three-body WEC(spar, float, and reaction-mass) are also dependent on the reaction
mass, m3, the support stiffness, k3 and most importantly the rotational inertia, J .
Of the new variables introduced to the WEC model, m3, k3 and J , the rotational inertia,
J , is the premier control variable for the three body WEC. It is conceivable to adjust the
spar mass m2 or reaction mass m3 through a water ballast pump system, but a water

29
pumping system offers very slow frequency response tuning. Further, the support stiffness
k3 represents a possible control variable but an efficient system to provide sufficient stiffness
range for frequency response tuning has yet to be invented. Lastly, since the inertia of a
rotating system is proportional to the square of the radial position of the flyball masses,
the flyball type inertial control offers fast, continuous, and efficient adjustments. Thus
frequency response tuning by means of rotational inertia adjustment, using the concept
shown in Figure 3.2, has been chosen for further investigation.
An inertial control parameter has been introduced to simplify the resulting dynamics
equations and eliminate the need to choose a specific ball screw lead, l. Denoted, m4, the
inertial control parameter has units of kilograms and is related to the rotational inertia, J
and ball screw lead, l, by Equation (3.4).
m4 ≡J
l2(3.4)
Since there are three coupled oscillating bodies, the expanded dynamics model is a system
of three coupled linear ordinary differential equations. A schematic of the three DOF
mathematical model is shown in Figure 3.3. A detailed derivation of the extended equation
system is given by Equations (21-30) in Appendix B and the final set of three body WEC
system matrices are stated in Appendix B by Equations (34-36).
3.5 Scheduling the Control Variables
The control of the conceptual WEC is facilitated by coordinated adjustments of the gener-
ator damping level, cg, and the inertial control parameter of the rotational system, m4.
There are two primary strategies for tuning WEC’s that are defined by their time-scale.
The first, called a ‘slow tuning’ method, is to make control adjustments on a 10 to 30
minute basis. A slow-tuned WEC is controlled to optimize power capture as the general
sea-state changes. The second, called ‘fast tuning’ or ‘wave-to-wave control’, is to make
control adjustments on a one to five second basis—responding to individual incident wave
shapes. Although fast tuning of WEC’s is known to significantly increase the theoretical
energy capture efficiency [1], a successful implementation of fast tuning could require orders

30
Figure 3.3: A schematic of the three DOF dynamics model.
of magnitude increases of forecasted wave data, provided by on-site sensors, than for slow-
tuned WEC’s. Wave measurements, data management, and optimization for ‘fast-tuning’
are currently subjects of world-wide research [20–23].
However, to develop base-line performance estimates of the WEC, this thesis proceeds
by implementing a slow-tuning system for the three body WEC intended as a back-drop
for future research into the implementation of a fast-tuning scenario utilizing the frequency
response tuning mechanism shown in Figure 3.2.
For the ‘slow-tuning’ method used here, the omni-directional sea-sate is defined by its
peak period, Tp, and significant wave height, Hs. For a typical wave spectrum, the most
energetic wave components occur at the peak period, Tp. As a result, the WEC is optimized
for the most energetic wave component, namely the peak period. The sea-state parameters
are gathered either from accelerometer-based wave-buoy measurements or wind-data driven
wave forecast models. Data quality and specifics on derivation of sea-state parameters
from raw wave data are important issues, but outside the scope of this thesis. Regardless
of spectral assumptions and sea-state parameter choices, the ‘slow-tuning’ methodology
presented here is applicable. The maximization of power capture as a function of cg and
m4 can be viewed as a classic optimization problem.

31
The section titled “A Complete Three-Body System” beginning on page 7 of Appendix B
describes how a set of optimization codes, built on the Sequential Quadratic Programming
algorithm provided by Matlab, were developed during the course of this research to search
for a schedule of optimal generator damping-rotational inertia pairings across the frequency
domain. The code development was done using the following basic steps. First, a parametric
solution to the heave constrained dynamics model in the frequency domain was obtained
using the analytical mathematics package Maple. By manipulating the analytical solution,
an expression for power capture in terms of fixed WEC specifications and the control
variables cg and m4 was obtained.
Next, the optimization was setup to maximize the power capture expression, given by
Equation (20) of Appendix B, as a function of the control variables. To ensure relative
displacements between the float and spar as well as between the reaction-mass and spar
are always kept within feasible limits, nonlinear constraints were included in the optimiza-
tion problem. These constraints, sometimes referred to as “end-stop” limits, are extremely
important considerations for the survivability of WECs. Maple was used to find the ana-
lytical gradients of the objective function with respect to control variables and nonlinear
constraints. When supplied to the optimization algorithm, the analytical gradient expres-
sions significantly improved the speed and accuracy of convergence.
Since the optimization algorithm is applied to maximize power at a single wave fre-
quency, the process is iterated over the range of wave frequencies of interest. After con-
vergence has been achieved at all wave frequencies, the outputs are the optimized power
capture as a function frequency (given by Figure 3.4) and a set of optimal control schedules
(given by Figure 3.5) which specify the optimal value of each control variable at each wave
frequency, c∗g(ω) and m∗4(ω).
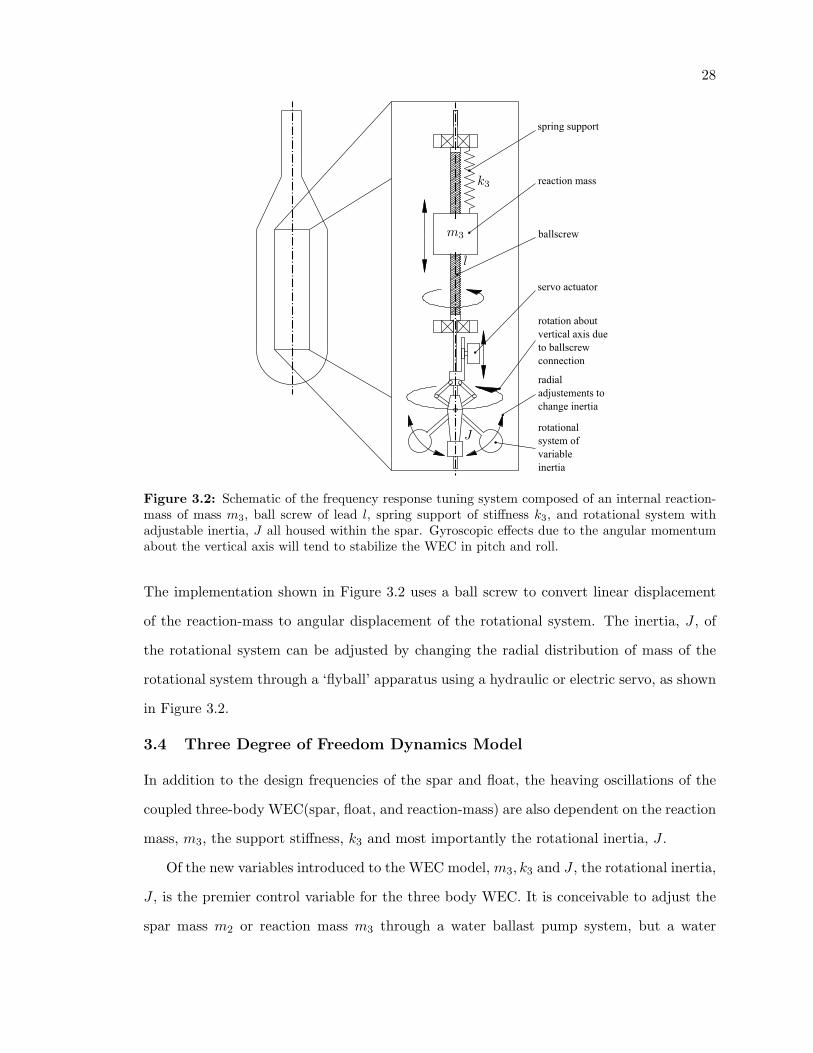
3.6 Results and Discussion
The power capture improvement afforded by the frequency response tuning system is shown
in Figure 3.4 to approach a maximum of 80% at 1.5 rad/s when compared to a two body
system of equivalent mass. The benefits in power capture illustrated by Figure 3.4 made
possible by the control scheduling summarized in Figure 3.5 are subject to the following

32
1 1.5 2 2.5 3 3.5 45
10
15
20
25
30
35
40
Wave Frequency [ω]
Pow
er [
W]
3 body system with tuning, (cg*, m
4*)
2 body fixed spar shape, (ω2 = 1.0 rad/s)
Figure 3.4: Power capture comparison for two WEC examples. 3-Body WEC with optimizedgenerator damping, c∗g(ω), and inertial control parameter m∗
4(ω) vs. 2-Body WEC with optimalc∗g(ω) only. The 3-Body WEC is mass-equivalent to the 2-Body WEC.
two design constraints. First, the float diameter, and therefore its hydrostatic stiffness,
k1, was set for the wave tank (IOT) wave frequency range to not violate the small body
approximation at the highest wave frequencies. However, at ocean scale, where wavelengths
are from 100-500 meters, the small body approximation is not as critical. Increasing the
float natural frequency relative to the spar natural frequency enables greater power capture
by increasing the relative float-spar response, ξ1/2. Second, motivated out of caution to
represent realistic results, the inertia control range in the work of Appendix B was limited
arbitrarily at the high end. However, as a result of recent mechanical design activities [24]
investigating possible ranges with feasible mechanical design techniques, the upper limit
of the inertia control range was increased. In Figure 3.5, the optimized inertial control
parameter is seen to be at its upper limit for much of the frequency domain—indicating
that relaxing the upper inertial control limit would allow the optimization to converge on
a more optimal objective.
Although not explicitly discussed in Appendix C, the two design constraints (float
natural frequency and inertial control upper limits) have been modified in the WEC design
and control for the next chapter of this thesis.
33
1 1.5 2 2.5 3 3.5 40
500
1000
1500
2000
c g* [N
s/m
]
1 1.5 2 2.5 3 3.5 4500
1000
1500
m4* [
kg]
Wave Frequency [ω]
Figure 3.5: Example optimal control variables from a wave tank specific WEC design.
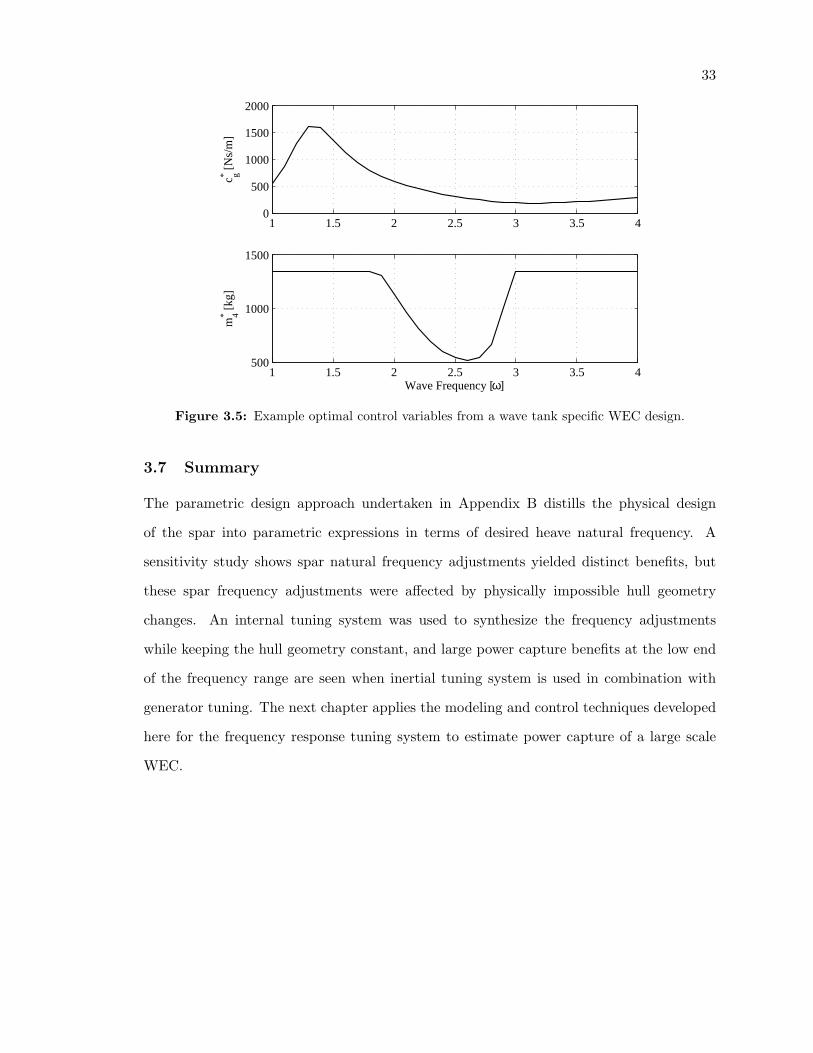
3.7 Summary
The parametric design approach undertaken in Appendix B distills the physical design
of the spar into parametric expressions in terms of desired heave natural frequency. A
sensitivity study shows spar natural frequency adjustments yielded distinct benefits, but
these spar frequency adjustments were affected by physically impossible hull geometry
changes. An internal tuning system was used to synthesize the frequency adjustments
while keeping the hull geometry constant, and large power capture benefits at the low end
of the frequency range are seen when inertial tuning system is used in combination with
generator tuning. The next chapter applies the modeling and control techniques developed
here for the frequency response tuning system to estimate power capture of a large scale
WEC.

Chapter 4
A Full Scale Wave Energy Converter
This chapter summarizes the integration of a WEC in an isolated electric gird. The details
of this work are reported in a manuscript included as Appendix C. The goal of this study
is to evaluate the feasibility of providing electricity from a large scale WEC to a remote
Alaskan community. The community, located on St. George Island, which is located roughly
500 kilometers North of the Aleutian island chain in the Bering Sea, has approximately 100
inhabitants and is reliant on diesel generators for electricity. Known in the past for its
commercial fur seal harvest, St. George Island is now host to predominantly commercial
fishing and eco-tourism activities.
To meet the study goal, a resource assessment was done using archived US National
Oceanographic and Atmospheric Administration’s (NOAA) Wavewatch3 Alaskan Waters
model [25] parameter data. To evaluate the power capture of the WEC in irregular waves,
additional relationships were used to allow the dynamics model and control methodology,
as developed in the previous chapters, to handle realistic sea states with multiple wave
frequencies and directions. The assumptions made in applying control schedules derived
for regular waves to the irregular wave field are discussed. The island’s electrical system,
driven by diesel-electric generators, is described. Lastly, the feasibility of integrating the
WEC into the island electrical system is assessed in terms of grid penetration measures and
estimated fuel savings.

35
4.1 Wave Resource Assessment
Since the most logical deployment location, for reasons discussed in Section 2.1 of Ap-
pendix C, is to the South-West of the island, the island itself would “shelter” the WEC
from waves approaching from the North-East. However, the NOAA Watchwatch3 model
grid does not resolve the effects of small land masses such as St. George Island. Therefore,
as a crude method of accounting for the blockage effects due to the island, the hourly records
of significant wave height, Hs, peak period, Tp, and peak direction, Hdir, from the NOAA
Wavewatch3 were post-processed to attenuate sea states with primary directions that fall
in the directional range indicated by Figure 2 of Appendix C. Although the number of at-
tenuated records comprises 37% of the dataset, the most frequently occuring and energetic
seas remained unaffected by postprocessing, as indicated by Figure 3 of Appendix C.
In this integration study, the Pierson-Moscowitz spectrum, which is completely defined
by the Hs and Tp pair, was chosen. The sea is assumed to be fully developed, the WEC
is assumed to be in deep water, and the sea-state is assumed stationary over the hour for
which Wavewatch3 parameters were recorded. The WEC is assumed to be directionally
independent so an omni-directional spectrum can be used. The prevailing sea state, as
identified by the joint probability contour plot in Figure 4 of Appendix C, is (Hs, Tp) =
(1.1m, 6.1sec). The mean incident wave power over three years of directionally screened
data, calculated by Equation (7) of Appendix C, is estimated to be between 26 kW/m and
28 kW/m for the deployment site.
4.2 Large Scale WEC Design
Recent full-scale WEC development activities [24] have resulted in design changes to the
WEC. First, to raise the natural frequency of the float as high as possible, the float has been
modified. Previously composed of a series of vertical cylinders, the float is now a toroidal
shape. Second, a hydraulic PTO system has been chosen—enabling power smoothing with
gas accumulators. Third, the design work on the frequency response tuning system has
defined the upper and lower limits in the inertial control. A drawing of the latest WEC
design is shown in Figure 4.1. Specifications for the full scale WEC device used in the
study given by Appendix C, taken from recent full-scale development activities [24], are

36
summarized in Table 4.1. The specifications were used in the three DOF dynamics model
Table 4.1: Summary specifications of the large scale WEC
Parameter ValueMass of structure 166,000 kgOuter diameter 5 mDraft 30 mCapacity 100 kW
and control optimization developed in Chapter 3 of this thesis to produce generator and
rotational inertia control schedules with non-linear ‘end-stop’ constraints enabled. Applica-
tion of the constraints ensures that power capture results do not reflect scenarios where the
relative displacements between heaving bodies violate mechanical design limitations. One
important limitation is the maximum stroke length for the hydraulic PTO pistons which is
established from the consideration of potential buckling failure in the piston rods.
4.3 WEC Power Capture in Irregular Waves
The three DOF frequency domain model has been used to predict and optimize power cap-
ture assuming regular sinusoidal waves. A more realistic approximation to the ocean surface
uses a superposition of multiple wave components—a spectral approach. The following ad-
ditional steps to the three DOF frequency domain model and optimization routines were
made to accommodate a spectral representation of the incident waves.
1. A two dimensional gridded ‘sea state’ space was setup, ranging over 0.5 ≤ Hs ≤ 8.5
meters of significant wave height and ranging over 0.393 ≤ ωp ≤ 1.26 rad/s of peak
frequency which corresponds to 5 ≤ Tp ≤ 16 seconds in peak period.
2. Optimal control schedules, c∗g(H,ω),m∗4(H,ω), were interpolated at each (Hs, ωp)
pairing, yielding the control decisions for each sea-state, c∗g(Hs, ωp),m∗4(Hs, ωp).
3. For calculation of the relative float-spar response to irregular waves of multiple fre-
quency components, a spectral frequency domain was setup. The chosen number of
frequency components was N = 256 and the chosen range was 0 < ωi ≤ 3.2 rad/s.
4. By applying control decisions c∗g(Hs, ωp),m∗4(Hs, ωp), the relative float-spar response
ξ1/2(ω, c∗g(Hs, ωp),m∗4(H,ωp)) to a wave of unit amplitude is obtained from the dy-

37
top
of s
par
ball
ast t
ank
free
flo
odin
g vo
lum
e
pow
er ta
ke-o
ffcy
lind
er
floa
t
Spa
r
freq
uenc
y re
spon
se
tuni
ng a
ssem
bly
ball
ast
tank
spar
stru
ctur
e
spar
shel
l
sect
ion
2-2
top
ofsp
ar
pow
er ta
ke-o
ff
cyli
nder ac
cess
pla
n v
iew
moo
ring
line
atta
chm
ent
gas
spri
ngcy
lind
er
reac
tion
mas
s
rem
ovab
lepa
nel
conn
ecti
onfl
ange
sect
ion
3-3
free
flo
odin
gvo
lum
e
stbd
. flo
at h
alf
gene
rato
r
spar
nec
k
port
flo
at h
alf
sect
ion
1-1
fron
t se
ctio
n
11
22
33
Fig
ure
4.1:
Adr
awin
gof
the
full
scal
eW
EC
desi
gn(a
dapt
edfr
om[2
4]w
ith
perm
issi
onfr
omJi
mA
dam
son)
.N
ote
the
doub
leac
ting
hydr
aulic
cylin
ders
used
for
pow
erta
ke-o
ffan
dth
eto
roid
alflo
atsh
ape
repr
esen
tth
em
ain
adva
ncem
ents
from
prev
ious
iter
atio
nsof
the
WE
Cde
sign
.
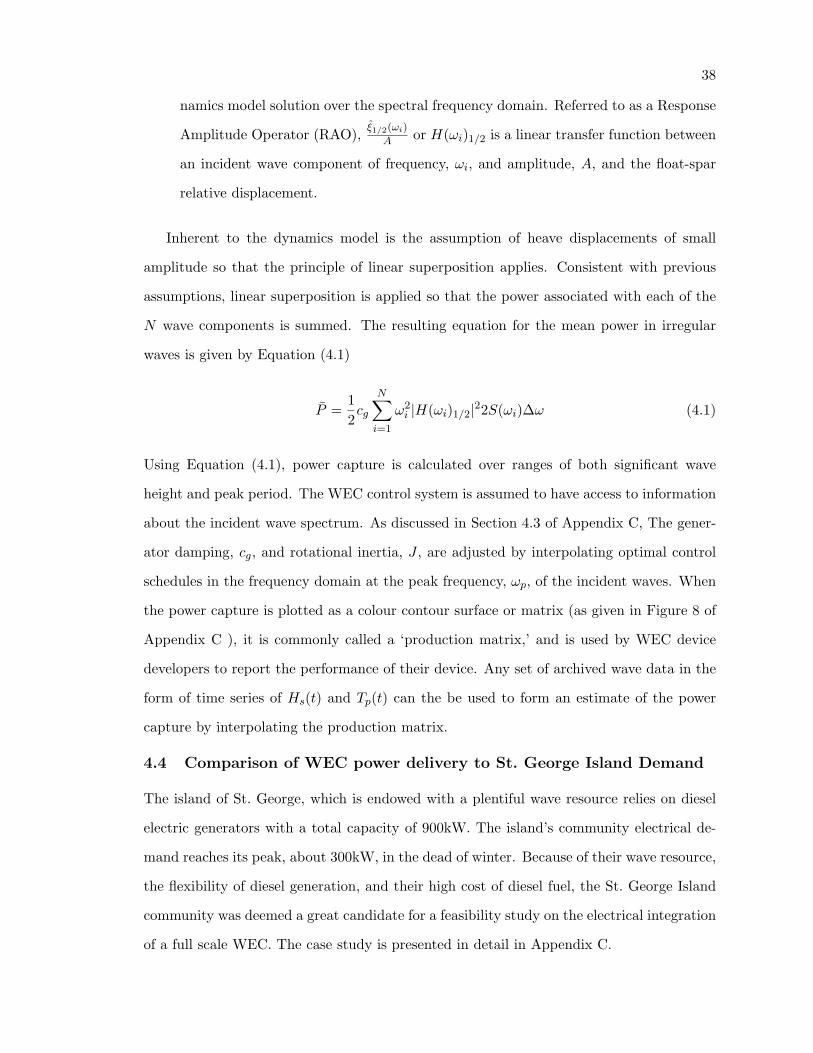
38
namics model solution over the spectral frequency domain. Referred to as a Response
Amplitude Operator (RAO), ξ1/2(ωi)
A or H(ωi)1/2 is a linear transfer function between
an incident wave component of frequency, ωi, and amplitude, A, and the float-spar
relative displacement.
Inherent to the dynamics model is the assumption of heave displacements of small
amplitude so that the principle of linear superposition applies. Consistent with previous
assumptions, linear superposition is applied so that the power associated with each of the
N wave components is summed. The resulting equation for the mean power in irregular
waves is given by Equation (4.1)
P =12cg
N∑
i=1
ω2i |H(ωi)1/2|22S(ωi)∆ω (4.1)
Using Equation (4.1), power capture is calculated over ranges of both significant wave
height and peak period. The WEC control system is assumed to have access to information
about the incident wave spectrum. As discussed in Section 4.3 of Appendix C, The gener-
ator damping, cg, and rotational inertia, J , are adjusted by interpolating optimal control
schedules in the frequency domain at the peak frequency, ωp, of the incident waves. When
the power capture is plotted as a colour contour surface or matrix (as given in Figure 8 of
Appendix C ), it is commonly called a ‘production matrix,’ and is used by WEC device
developers to report the performance of their device. Any set of archived wave data in the
form of time series of Hs(t) and Tp(t) can the be used to form an estimate of the power
capture by interpolating the production matrix.
4.4 Comparison of WEC power delivery to St. George Island Demand
The island of St. George, which is endowed with a plentiful wave resource relies on diesel
electric generators with a total capacity of 900kW. The island’s community electrical de-
mand reaches its peak, about 300kW, in the dead of winter. Because of their wave resource,
the flexibility of diesel generation, and their high cost of diesel fuel, the St. George Island
community was deemed a great candidate for a feasibility study on the electrical integration
of a full scale WEC. The case study is presented in detail in Appendix C.
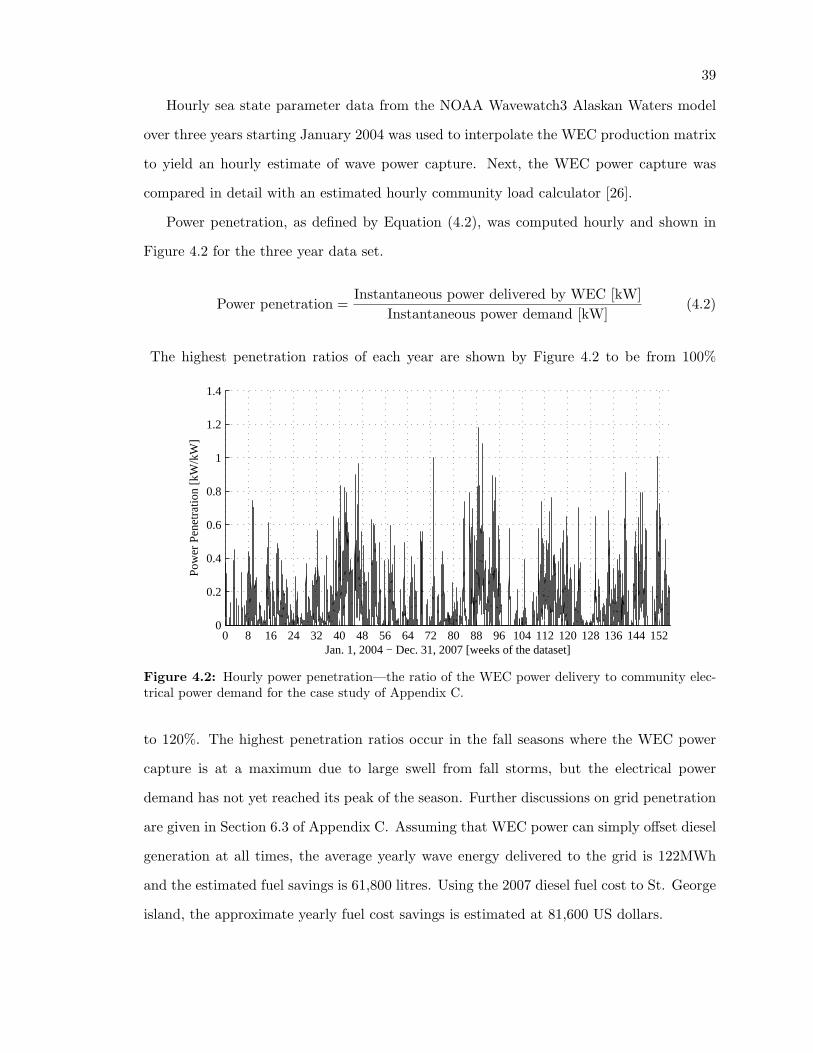
39
Hourly sea state parameter data from the NOAA Wavewatch3 Alaskan Waters model
over three years starting January 2004 was used to interpolate the WEC production matrix
to yield an hourly estimate of wave power capture. Next, the WEC power capture was
compared in detail with an estimated hourly community load calculator [26].
Power penetration, as defined by Equation (4.2), was computed hourly and shown in
Figure 4.2 for the three year data set.
Power penetration =Instantaneous power delivered by WEC [kW]
Instantaneous power demand [kW](4.2)
The highest penetration ratios of each year are shown by Figure 4.2 to be from 100%
0 8 16 24 32 40 48 56 64 72 80 88 96 104 112 120 128 136 144 1520
0.2
0.4
0.6
0.8
1
1.2
1.4
Pow
er P
enet
ratio
n [k
W/k
W]
Jan. 1, 2004 − Dec. 31, 2007 [weeks of the dataset]
Figure 4.2: Hourly power penetration—the ratio of the WEC power delivery to community elec-trical power demand for the case study of Appendix C.
to 120%. The highest penetration ratios occur in the fall seasons where the WEC power
capture is at a maximum due to large swell from fall storms, but the electrical power
demand has not yet reached its peak of the season. Further discussions on grid penetration
are given in Section 6.3 of Appendix C. Assuming that WEC power can simply offset diesel
generation at all times, the average yearly wave energy delivered to the grid is 122MWh
and the estimated fuel savings is 61,800 litres. Using the 2007 diesel fuel cost to St. George
island, the approximate yearly fuel cost savings is estimated at 81,600 US dollars.
40
4.5 Summary
This chapter summarized the feasibility study of the electrical integration of a full-scale
WEC design with the island of St. George, given by the manuscript in Appendix C. First,
a resource assessment was done using archived Wavewatch3 parameter data. A spectral
approach was utilized to enable the calculation of power capture in irregular waves using the
frequency domain dynamics model and control methodology from Chapter 3. Comparison
of the estimated in situ WEC power delivery to the St. George Island electrical demand
reveal patterns in the seasonal behavior of grid penetration levels as well as estimates of the
magnitudes of penetration levels. Using a simplified power management strategy, estimated
yearly fuel savings and fuel cost savings offer some indication of the economic constraints
of the project.

Chapter 5
Conclusions
The goal of the research presented was to advance the development of a ‘self-reacting’ point
absorber WEC. An experimental two body prototype was designed and tested in a wave
tank. Although the power capture test results contained significant scatter, they compare
reasonably well to power estimates using a two DOF linear model in the frequency domain.
A parametric spar model was developed to completely define the external geometry of the
spar by its natural frequency. Further, to investigate the potential benefits to frequency
response tuning, the parametric spar model was used for a sensitivity of power capture
to spar natural frequency. Results of the sensitivity study indicated distinct benefits if
the spar natural frequency could be tuned. Subsequently conceptual design of a novel
mechanism for spar frequency response tuning system was presented. The two DOF linear
model was then expanded to represent the WEC with frequency response tuning as a three
DOF system. An optimization algorithm was used to compute recommended schedules for
the adjustment of the available control parameters to maximize power capture. The theory
of floating body motions in irregular waves was applied to the three DOF frequency domain
model with optimal control in order to estimate power capture of an example large scale
WEC design at a remote Alaskan location using archived Wavewatch3 model data. Lastly
the results from the case study on the integration of a full scale WEC with the remote
island electrical system indicated that high grid penetration levels due to the variability
of wave power generation could be technically managed using strategies from the field of
wind-diesel hybridization. Lastly, substantial diesel fuel cost savings were estimated based
on a simplified power management scheme.

42
5.1 Conclusions
1. A heave constrained linear dynamics model in the frequency domain can be used with
reasonable accuracy to estimate power capture in regular waves of the WEC.
2. Analytical solutions to linear dynamics models enable the efficient use of Sequential
Quadratic Programming algorithms to maximize power capture of WEC’s with non-
linear travel constraints.
3. An internally housed, spring supported reaction mass coupled to a rotational system
with variable inertia can be effectively used to tune the frequency response of a heaving
body. In the case of the heaving point absorber WEC in this thesis, significant power
capture improvements are expected with the use of the tuning system.
4. A single full-scale WEC could represent a technically and economically feasible solu-
tion offset diesel generated electricity for St. George Island and other remote coastal
communities.
5.2 Future Work
There are many areas to continue and enhance the research presented here:
1. Improve the fidelity of the hydrodynamic coefficients of the WEC in the existing
dynamics model, including hydrodynamic cross-coupling effects, so that changes in
hydrodynamic coefficients due to external geometry changes can be effectively mod-
eled for future design optimization exercises.
2. Investigate the implementation of a ‘fast-tuning’ or ‘wave-to-wave’ control of the
inertia and generator damping using accurate wave field and/or WEC dynamics in-
formation to maximize power capture to a much higher degree.
3. Design and test a second WEC model in a wave tank in both regular and irregular
wave conditions. The WEC would be fitted with a working frequency response control
system. A full suite of design features, learned from wave tank testing experience
gained in this thesis, to improve experimentation work would be implemented.

43
4. Develop a multiple objective design optimization procedure. Increase the utility of
the design parameterization by including pitch and roll stability constraints which
would have effects on the distribution of mass of the WEC. Design variables would
be critical parameters such as the undamped natural frequencies of the float and
spar. Stochastic based optimization methods such as Genetic Algorithms or Simulated
Annealing might be best suited to the problem because the objective function is
expected to not be a smooth function of the design variables.
5. The frequency response tuning system is sensitive not only to the inertial control pa-
rameter, m4, but also the spring support stiffness, k3. If a suitable variable stiffness
mechanism could be obtained or designed, the addition of k3 as a third control variable
holds promise of significant control leverage and associated increases of power cap-
ture. A further project could be initiated to evaluate the feasibility and performance
benefits of variable-stiffness mechanisms.
6. Implement a time-domain power system model of the St. George Island integration
case. This would allow a more accurate evaluation of the energy and fuel savings by
including diesel generator minimum loads, maximum ramp rates, and optimal power
management strategies in the analysis.
44
Bibliography
[1] J. Falnes, “A review of wave-energy extraction,” Marine Structures, vol. 20, pp. 185–
201, Oct. 2007.
[2] A. Cornett, “Inventory of canada’s marine renewable energy resources,” Tech. Rep.
CHC-TR-041, National Research Council - Canadian Hydraulics Centre, Ottawa, K1A
0R6, Canada, April 2006.
[3] M. French, “On the difficulty of inventing an economical sea wave energy converter: a
personal view,” Proceedings of the I MECH E Part M Journal of Engineering for the
Maritime Environment, vol. 220, no. 3, pp. 149–155, 2006.
[4] A. Weinstein, G. Fredrikson, L. Claeson, J. Forsberg, M. J. Parks, K. Nielsen, M. S.
Jenses, K. Zandiyeh, P. Frigaard, M. Kramer, and T. L. Andersen, “Aquabuoy - the
offshore wave energy converter numerical modeling and optimization,” in Oceans Con-
ference Record (IEEE), vol. 4, (San Diego, CA., United states), pp. 1988–1995, Insti-
tute of Electrical and Electronics Engineers Inc., 2003.
[5] M. Draper, “More than just a ripple: Ocean power technologies sets its sights high,”
Refocus, vol. 7, no. 1, pp. 54–56, 2006.
[6] R. Taghipour and T. Moan, “Efficient frequency-domain analysis of dynamic response
for the multi-body wave energy converter in multi-directional waves,” in Proceedings
of the Eighteenth (2008) International Offshore and Polar Engineering Conference,
Vancouver, BC, Canada, July 2008.
[7] R. H. Bracewell, Frog and PS Frog: A Study of Two Reactionless Ocean Wave Energy
Converters. PhD thesis, Lancaster University, September 1990.

45
[8] A. Babarit, A. Clement, J. Ruer, and C. Tartivel, “SEAREV : A fully integrated
wave energy converter,” in Proceedings of the 2006 Offshore Wind And Other Marine
Renewable Energies In Mediterranean And European Seas, Offshore Wind And Other
Marine Renewable Energies In Mediterranean And European Seas, OWEMES, April
2006.
[9] M. Tucker and E. Pitt, Waves in ocean engineering, vol. 5 of Elsevier ocean engineering
book series. Amsterdam, New York: Elsevier, 1st ed., 2001.
[10] J. Falnes, Ocean Waves and Oscillating Systems: Linear Interactions including Wave
Energy Extraction, ch. 5.6 The Froude Krylov Force and the Small-Body Approxima-
tion, pp. 160–167. Cambridge University Press, 2002.
[11] J. Falnes, “Wave-energy conversion through relative motion between two single-mode
oscillating bodies,” Journal of Offshore Mechanics and Arctic Engineering, vol. 121,
no. 1, pp. 32–38, 1999.
[12] G. Clauss, E. Lehmann, and C. Ostergaard, Offshore Structures - Conceptual design
and hydromechanics, vol. 1. Springer-Verlag, 1992.
[13] R. G. Dean and R. A. Dalrymple, Water wave mechanics for engineers and scientists,
vol. 2 of Advanced Series in Ocean Engineering, book 8 Wave Forces, p. 218. World
Scientific, 1991.
[14] J. Falnes, Ocean Waves and Oscillating Systems: Linear Interactions including Wave
Energy Extraction. Cambridge University Press, 2002.
[15] R. Dugas and J. R. Maddox, A History of Mechanics. Courier Dover Publications,
illustrated ed., 1988.
[16] P. Rudnick, “FLIP: An oceanographic buoy,” Science, vol. 146, no. 3649, pp. 1268–
1273, 1964.
[17] G. A. Nolan, J. V. Ringwood, W. E. Leithead, and S. Butler, “Optimal damping
profiles for a heaving buoy wave energy converter,” 15th International Offrshore and
46
Polar Engineering Conference, ISOPE-2005, Jun 19-24 2005, vol. 2005, pp. 477–484,
2005.
[18] G. Duclos, A. Babarit, and A. H. Clement, “Optimizing the power take off of a wave
energy converter with regard to the wave climate,” Transactions of the ASME. Journal
of Offshore Mechanics and Arctic Engineering, vol. 128, no. 1, pp. 56–64, 2006.
[19] DeBacker, V. Banasiak, Beels, and D. Rouck, “Numerical modelling of wave energy
absorption by a floating point absorber system,” in Proceedings of the Sixteenth (2007)
International Offshore and Polar Engineering Conference Lisbon, Portugal, July 1–6,
2007, ISOPE, 2007.
[20] A. Babarit, G. Duclos, and A. Clement, “Comparison of latching control strategies
for a heaving wave energy device in random sea,” Applied Ocean Research, vol. 26,
pp. 227–238, July 2004.
[21] T. Mundon, A. Murray, J. Hallam, and L. Patel, Causal Neural Control of a Latching
Ocean Wave Point Absorber, vol. 3697/2005 of Lecture Notes in Computer Science,
pp. 423–429. Springer Berlin / Heidelberg, 2005.
[22] A. Babarit and A. Clement, “Optimal latching control of a wave energy device in
regular and irregular waves,” Applied Ocean Research, vol. 28, pp. 77–91, Apr. 2006.
[23] F. Tedd, “Short term wave forecasting, using digital filters, for improved control of
wave energy converters,” in Proceedings of the Sixteenth (2007) International Offshore
and Polar Engineering Conference Lisbon, Portugal, July 1-6, 2007, ISOPE, 2007.
[24] S. Beatty, C. Hiles, R. Nicoll, J. Adamson, and B. J. Buckham, “Design synthesis of
a wave energy converter,” in 28th International Offshore Mechanics and Artic Engi-
neering Conference, (Honolulu Hawaii), May-June 2009. In Review.
[25] “National Oceanic and Atmospheric Administration WaveWatch III.” http://
polar.ncep.noaa.gov/waves/index2.shtml, Accessed May 5th, 2008.

47
[26] M. Devine and E. Baring-Gould, “The Alaska Village Electric Load Calculator,” Tech.
Rep. NREL/TP-500-36824, U.S. Department of Energy, National Renewable Energy
Laboratory, Golden, Colorado, October 2004.

48
Appendix A
Modeling, Design and Testing of a Two-Body
Heaving Wave Energy Converter

IJOPE Paper No January 23, 2009 Beatty 1
Modeling, Design and Testing of a Two-Body Heaving Wave Energy Converter
Scott J. Beatty, Bradley J. Buckham, Peter Wild Department of Mechanical Engineering, University of Victoria.
Victoria, B.C., Canada
ABSTRACT A small scale point absorber was constructed and tested in September 2006. The tests were aimed at performance characterization and validation of a linear dynamics model in the frequency domain. The coefficients used in the model are obtained through a combination of bench-top and tank-side experiments. The device produced an average of 5.5 W from waves of 19 cm height and frequencies between 0.35 and 0.65 Hz. The experimental results compare reasonably well with the frequency domain dynamics model. However, there is a significant amount of scatter in the experimental values which was attributed to various sources.
KEY WORDS: Wave energy; point absorber; heaving buoy
NOMENCLATURE
a prototype half-length in wave propagation direction agen, bgen generator constants a0j fluid acceleration due to incident wave at zpj
jjb radiation damping coefficient for body j
gencξ generator damping coefficient based on 1/ 2ξɺ
gencθ generator damping coefficient based on genθɺ
cj total damping coefficient of body j
lossc damping coefficient due to frictional losses
cvj viscous damping coefficient of body j d half-width normal to wave propagation direction
ef
wave excitation force
h tank depth k wave number kj buoyancy stiffness of body j mj physical mass of body j mjtot total mass of body j m11, m22 added mass coefficients v0j fluid velocity due to incident wave at zpj
x, y, z body fixed Cartesian coordinates (see Fig. 1) xPj, yPj, zPj reference point location of body j A incident wave amplitude
Ai pillar cross sectional area at station i
PTOI rotational inertia of the PTO system
L distance from float to tank wall P(t), P(ω) mechanical power absorbed Rint armature resistance of generator Rext external load resistance on generator Tj draft of body j εj phase angle of body j η(x,t) incident wave elevation
genθ angular position of generator shaft
ξj heave displacement of body j ξ1/2 displacement of body 1 relative to body 2 τ(t) torque applied to generator shaft ω wave frequency ωnj natural frequency of body j
INTRODUCTION
Experiments with resonating “point absorbers” date back to Budal and Falnes (1975). In the numerical and experimental studies since that time, body geometries and kinematics have been adjusted to maximize the kinetic energy of the WEC that is subsequently harvested by some form of energy generator. The choice to work in multiple degrees of freedom, or use multiple bodies working in single degrees of freedom has been guided by theoretical work defining the response of floating bodies to wave forces. Srokosz and Evans (1979) considered the tuning of two independent oscillating bodies in regular sinusoidal waves. In their concept, a separate power take-off (PTO) is attached to
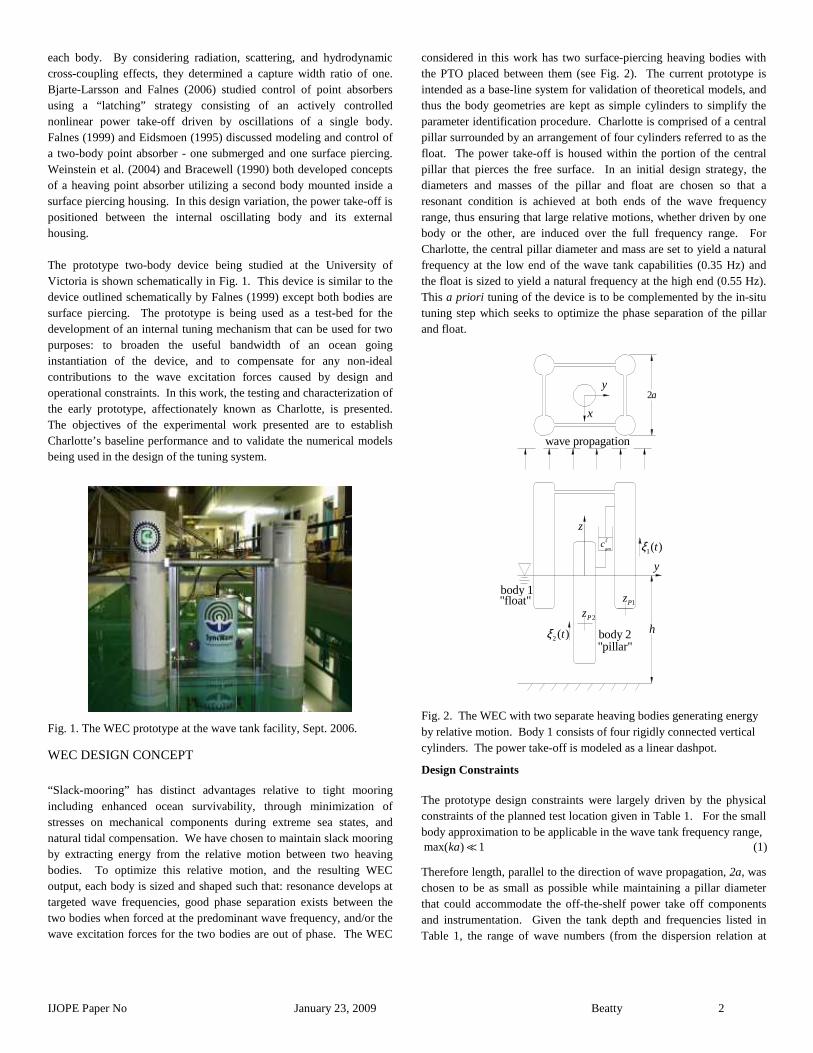
IJOPE Paper No January 23, 2009 Beatty 2
each body. By considering radiation, scattering, and hydrodynamic cross-coupling effects, they determined a capture width ratio of one. Bjarte-Larsson and Falnes (2006) studied control of point absorbers using a “latching” strategy consisting of an actively controlled nonlinear power take-off driven by oscillations of a single body. Falnes (1999) and Eidsmoen (1995) discussed modeling and control of a two-body point absorber - one submerged and one surface piercing. Weinstein et al. (2004) and Bracewell (1990) both developed concepts of a heaving point absorber utilizing a second body mounted inside a surface piercing housing. In this design variation, the power take-off is positioned between the internal oscillating body and its external housing. The prototype two-body device being studied at the University of Victoria is shown schematically in Fig. 1. This device is similar to the device outlined schematically by Falnes (1999) except both bodies are surface piercing. The prototype is being used as a test-bed for the development of an internal tuning mechanism that can be used for two purposes: to broaden the useful bandwidth of an ocean going instantiation of the device, and to compensate for any non-ideal contributions to the wave excitation forces caused by design and operational constraints. In this work, the testing and characterization of the early prototype, affectionately known as Charlotte, is presented. The objectives of the experimental work presented are to establish Charlotte’s baseline performance and to validate the numerical models being used in the design of the tuning system.
Fig. 1. The WEC prototype at the wave tank facility, Sept. 2006.
WEC DESIGN CONCEPT
“Slack-mooring” has distinct advantages relative to tight mooring including enhanced ocean survivability, through minimization of stresses on mechanical components during extreme sea states, and natural tidal compensation. We have chosen to maintain slack mooring by extracting energy from the relative motion between two heaving bodies. To optimize this relative motion, and the resulting WEC output, each body is sized and shaped such that: resonance develops at targeted wave frequencies, good phase separation exists between the two bodies when forced at the predominant wave frequency, and/or the wave excitation forces for the two bodies are out of phase. The WEC
considered in this work has two surface-piercing heaving bodies with the PTO placed between them (see Fig. 2). The current prototype is intended as a base-line system for validation of theoretical models, and thus the body geometries are kept as simple cylinders to simplify the parameter identification procedure. Charlotte is comprised of a central pillar surrounded by an arrangement of four cylinders referred to as the float. The power take-off is housed within the portion of the central pillar that pierces the free surface. In an initial design strategy, the diameters and masses of the pillar and float are chosen so that a resonant condition is achieved at both ends of the wave frequency range, thus ensuring that large relative motions, whether driven by one body or the other, are induced over the full frequency range. For Charlotte, the central pillar diameter and mass are set to yield a natural frequency at the low end of the wave tank capabilities (0.35 Hz) and the float is sized to yield a natural frequency at the high end (0.55 Hz). This a priori tuning of the device is to be complemented by the in-situ tuning step which seeks to optimize the phase separation of the pillar and float.
Fig. 2. The WEC with two separate heaving bodies generating energy by relative motion. Body 1 consists of four rigidly connected vertical cylinders. The power take-off is modeled as a linear dashpot.
Design Constraints
The prototype design constraints were largely driven by the physical constraints of the planned test location given in Table 1. For the small body approximation to be applicable in the wave tank frequency range, max( ) 1ka ≪ (1)
Therefore length, parallel to the direction of wave propagation, 2a, was chosen to be as small as possible while maintaining a pillar diameter that could accommodate the off-the-shelf power take off components and instrumentation. Given the tank depth and frequencies listed in Table 1, the range of wave numbers (from the dispersion relation at
z
y
2a
genc
ξ
2( )tξ
1( )tξ
x
y
1Pz
2Pzh
body 1"float"
body 2"pillar"
wave propagation

IJOPE Paper No January 23, 2009 Beatty 3
finite depth) is, -1 -10.56 m 2.26 mk≤ ≤ (2)
The final design yields, max( ) 0.54ka ≤ (3)
Table 1. Wave Tank Parameters Physical Parameter Value Depth (h) 2.438 m
Width 3.658 m
Wave Frequency Range (/ 2ω π ) 0.35 Hz 0.65 Hzf≤ ≤
Wavelengths (2 /kπ ) 2.78 m 11.2 mλ≤ ≤
Maximum Wave Height (2A) 0.254 m
To keep the length 2a small with respect to the shortest wavelength, a directional geometry was used rather than an axisymmetric design. As shown in Fig. 4, the float spacing is smaller in the direction of the wave propagation. This non-axisymmetric float design was expected to cause some yaw instability or “weather-vaning” and so a two point mooring was attached to the outside of the pillar hull at a depth near the device center of gravity to constrain yaw rotation. Light weight nylon mooring lines (shown as dotted lines in Fig. 4) were tied off to a tank bridge located approximately 3m ahead of the model so that drift forces would be taken up by tension in the lines. The directional float geometry is not intended for future ocean going units. As the system is sized to an ocean environment the relative sizes of suitable power take-off components will decrease with respect to ocean scale wavelengths. This will allow for an axisymmetric float plan-form that easily satisfies Eq. 1. The stability of Charlotte was improved using a mass extension at the bottom of the central pillar to increase the righting buoyant moment. Also, the center of the submerged volume was raised by using external buoyancy ‘collars’ to redistribute the submerged volume while maintaining the desired equilibrium draft. To ensure a linear buoyancy stiffness, the ‘collars’ were placed so as not to pierce the water surface during expected heave motion. The flotation collars, seen just below the waterline in Fig. 1 and more clearly in the schematic of Fig. 4, had significant effects on the hydrodynamic properties of the pillar, as will be discussed in the following sections.
Charlotte Design
The final design is summarized in Table 3 and shown in Figs. 3 and 4. The mass extension, visible at the bottom of the device, cleared the tank bottom by less than 0.5 m. The flotation collar is the bulbous attachment on the pillar located at the same draft as the float. Stainless steel rails, mounted on flexures, guide the float travel along the pillar.
Power Take off and Instrumentation
To provide a nominal capability to produce electricity, a simple brush-commutated DC generator was chosen as the PTO damper. The generator is mounted on a plate inside the dry section of the pillar assembly. The generator is belt driven by the shaft of the top sprocket of an external chain drive such that linear motion of the float along the pillar causes rotation of the generator shaft. This relative travel is kinematically related to the generator rotation by:
1/ 2( ) ( )4spr
gen
rt tξ θ=ɺ ɺ (4)
As shown in Fig. 3, a load cell is used to support the vertical mounting plate as the driving torque is applied by the top sprocket shaft. The
relative motion of the float along the pillar, 1/ 2( )tξɺ , was captured using
a rotational encoder on the generator shaft,( )gen tθɺ .
Table 3. WEC Prototype Design Parameters Physical Parameter Value
Prototype horizontal width (2d) 1.120 m
Prototype horizontal length (2a) 0.636 m
Float Buoyancy Stiffness (k1) 1479 N/m
Float Draft (T1) 0.762 m
Float Mass (m1tot) 128.5 kg
Float Damping (c1) 120.6 Ns/m
Float Natural Frequency (ωn1) 0.540 Hz
Pillar Buoyancy Stiffness (k2) 612.4 N/m
Pillar Draft (T2) 1.97 m
Pillar Mass (m2tot) 179.5 kg
Pillar Damping (c2) 270.1 Ns/m
Pillar Natural Frequency (ωn2) 0.294 Hz
Generator Damping (cgen) ~115 Ns/m
Fig. 3. Two views of the power take off unit. The dynamometer assembly, which measures the generator reaction forces using a load cell, is also shown.
As shown by Graves (2000), a simple DC generator can be modeled as a rotational dashpot with inductive torque linearly proportional to angular velocity. Using this model, the driving torque delivered by the input shaft is related to the load cell measurement through a single degree of freedom differential equation:
( ) ( ) ( )PTO gen gen gent I t c tθτ θ θ= +ɺɺ ɺ (5)
As described in the following sections, the inertiaPTOI , of the power
take off assembly is very small and can be neglected in the calculation of the driving torque and hence:
( ) ( )gen gent c tθτ θɺ≃ (6)
MODELLING
generator
1/ 2( )tξɺ
( )gen tθɺ
loadcell
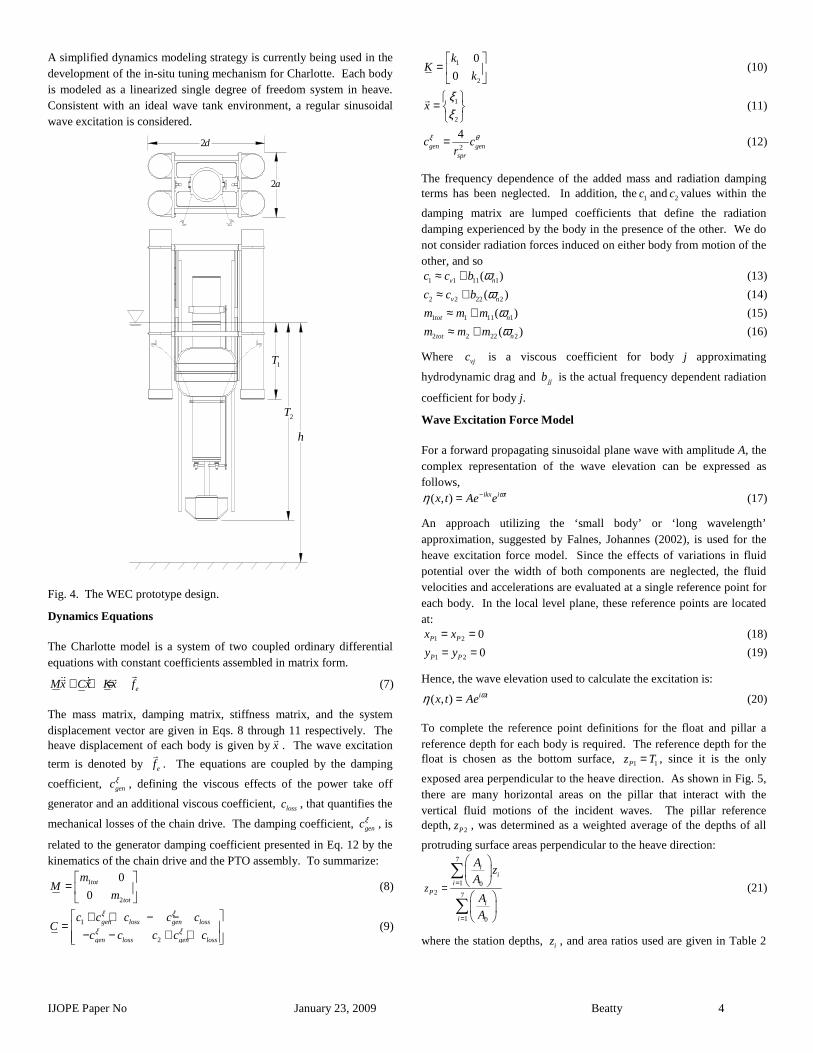
IJOPE Paper No January 23, 2009 Beatty 4
A simplified dynamics modeling strategy is currently being used in the development of the in-situ tuning mechanism for Charlotte. Each body is modeled as a linearized single degree of freedom system in heave. Consistent with an ideal wave tank environment, a regular sinusoidal wave excitation is considered.
Fig. 4. The WEC prototype design.
Dynamics Equations
The Charlotte model is a system of two coupled ordinary differential equations with constant coefficients assembled in matrix form.
eMx Cx Kx f+ + = ɺɺ ɺ (7)
The mass matrix, damping matrix, stiffness matrix, and the system displacement vector are given in Eqs. 8 through 11 respectively. The heave displacement of each body is given byx
. The wave excitation
term is denoted by ef
. The equations are coupled by the damping
coefficient, gencξ , defining the viscous effects of the power take off
generator and an additional viscous coefficient, lossc , that quantifies the
mechanical losses of the chain drive. The damping coefficient, gencξ , is
related to the generator damping coefficient presented in Eq. 12 by the kinematics of the chain drive and the PTO assembly. To summarize:
1
2
0
0tot
tot
mM
m
=
(8)
1
2
gen loss gen loss
gen loss gen loss
c c c c cC
c c c c c
ξ ξ
ξ ξ
+ + − −= − − + +
(9)
1
2
0
0
kK
k
=
(10)
1
2
xξξ
=
(11)
2
4gen gen
spr
c cr
ξ θ= (12)
The frequency dependence of the added mass and radiation damping terms has been neglected. In addition, the1c and 2c values within the
damping matrix are lumped coefficients that define the radiation damping experienced by the body in the presence of the other. We do not consider radiation forces induced on either body from motion of the other, and so
1 1 11 1( )v nc c b ω≈ + (13)
2 2 22 2( )v nc c b ω≈ + (14)
1 1 11 1( )tot nm m m ω≈ + (15)
2 2 22 2( )tot nm m m ω≈ + (16)
Where vjc is a viscous coefficient for body j approximating
hydrodynamic drag and jjb is the actual frequency dependent radiation
coefficient for body j.
Wave Excitation Force Model
For a forward propagating sinusoidal plane wave with amplitude A, the complex representation of the wave elevation can be expressed as follows,
( , ) ikx i tx t Ae eωη −= (17)
An approach utilizing the ‘small body’ or ‘long wavelength’ approximation, suggested by Falnes, Johannes (2002), is used for the heave excitation force model. Since the effects of variations in fluid potential over the width of both components are neglected, the fluid velocities and accelerations are evaluated at a single reference point for each body. In the local level plane, these reference points are located at:
1 2 0P Px x= = (18)
1 2 0P Py y= = (19)
Hence, the wave elevation used to calculate the excitation is:
( , ) i tx t Aeωη = (20)
To complete the reference point definitions for the float and pillar a reference depth for each body is required. The reference depth for the float is chosen as the bottom surface, 1 1Pz T= , since it is the only
exposed area perpendicular to the heave direction. As shown in Fig. 5, there are many horizontal areas on the pillar that interact with the vertical fluid motions of the incident waves. The pillar reference depth, 2Pz , was determined as a weighted average of the depths of all
protruding surface areas perpendicular to the heave direction: 7
1 02 7
1 0
ii
iP
i
i
z
Az
A
A
A
=
=
=
∑
∑ (21)
where the station depths, iz , and area ratios used are given in Table 2
2a
h
1T
2T
2d
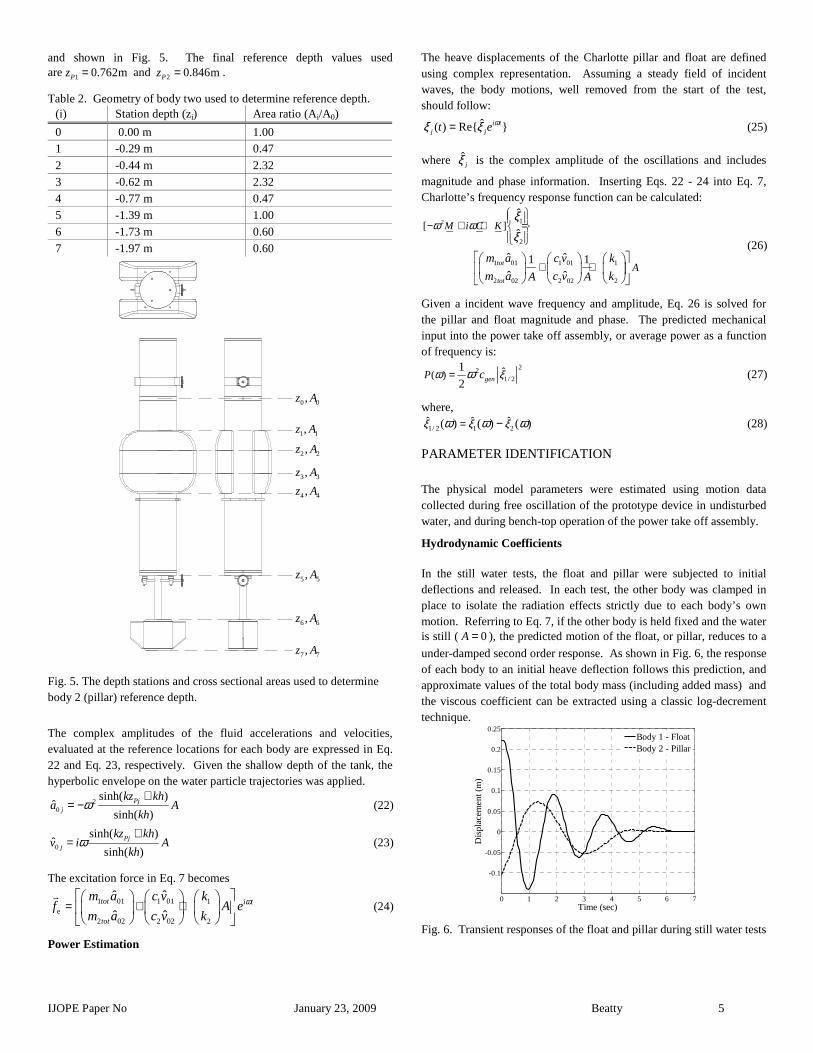
IJOPE Paper No January 23, 2009 Beatty 5
and shown in Fig. 5. The final reference depth values used are 1 0.762mPz = and 2 0.846mPz = .
Table 2. Geometry of body two used to determine reference depth. (i) Station depth (zi) Area ratio (Ai/A0) 0 0.00 m 1.00 1 -0.29 m 0.47
2 -0.44 m 2.32 3 -0.62 m 2.32 4 -0.77 m 0.47 5 -1.39 m 1.00 6 -1.73 m 0.60 7 -1.97 m 0.60
Fig. 5. The depth stations and cross sectional areas used to determine body 2 (pillar) reference depth.
The complex amplitudes of the fluid accelerations and velocities, evaluated at the reference locations for each body are expressed in Eq. 22 and Eq. 23, respectively. Given the shallow depth of the tank, the hyperbolic envelope on the water particle trajectories was applied.
20
sinh( )ˆ
sinh( )Pj
j
kz kha A
khω
+= − (22)
0
sinh( )ˆ
sinh( )Pj
j
kz khv i A
khω
+= (23)
The excitation force in Eq. 7 becomes
1 01 1 01 1e
2 02 2 02 2
ˆ ˆ
ˆ ˆtot i t
tot
m a c v kf A e
m a c v kω= + +
(24)
Power Estimation
The heave displacements of the Charlotte pillar and float are defined using complex representation. Assuming a steady field of incident waves, the body motions, well removed from the start of the test, should follow:
ˆ( ) Re i tj jt eωξ ξ= (25)
where ˆjξ is the complex amplitude of the oscillations and includes
magnitude and phase information. Inserting Eqs. 22 - 24 into Eq. 7, Charlotte’s frequency response function can be calculated:
2 1
2
1 01 1 01 1
2 02 2 02 2
[ ]ˆ
ˆ
ˆ ˆ1 1
ˆ ˆtot
tot
M i C K
Am a c v k
m a c v kA A
ω ωξξ
− + + =
+ +
(26)
Given a incident wave frequency and amplitude, Eq. 26 is solved for the pillar and float magnitude and phase. The predicted mechanical input into the power take off assembly, or average power as a function of frequency is:
221/ 2ˆ( )
1
2 genP cω ξω= (27)
where,
1/ 2 1 2ˆ ˆ ˆ( ) ( ) ( )ξ ξ ξω ω ω= − (28)
PARAMETER IDENTIFICATION
The physical model parameters were estimated using motion data collected during free oscillation of the prototype device in undisturbed water, and during bench-top operation of the power take off assembly.
Hydrodynamic Coefficients
In the still water tests, the float and pillar were subjected to initial deflections and released. In each test, the other body was clamped in place to isolate the radiation effects strictly due to each body’s own motion. Referring to Eq. 7, if the other body is held fixed and the water is still ( 0A = ), the predicted motion of the float, or pillar, reduces to a
under-damped second order response. As shown in Fig. 6, the response of each body to an initial heave deflection follows this prediction, and approximate values of the total body mass (including added mass) and the viscous coefficient can be extracted using a classic log-decrement technique.
0 1 2 3 4 5 6 7
-0.1
-0.05
0
0.05
0.1
0.15
0.2
0.25
Time (sec)
Dis
pla
cem
en
t (m
)
Body 1 - FloatBody 2 - Pillar
Fig. 6. Transient responses of the float and pillar during still water tests
0 0,z A
1 1,z A
2 2,z A
3 3,z A
4 4,z A
5 5,z A
6 6,z A
7 7,z A

IJOPE Paper No January 23, 2009 Beatty 6
(both with the power take-off disconnected).
Several tests were conducted for the float to determine the hydrodynamic effects, the generator damping and the mechanical losses. In the first test, the chain drive was disconnected to isolate the contribution of 1c . In the second test, the chain drive and power take
off were connected, but the generator circuit was opened. These tests isolated the viscous effects due to 1c and lossc , respectively, and the
coefficient lossc could, as a result, be determined. Holding the float
stationary and displacing the pillar, the coefficient 2c was calculated.
Given that the frequency variation of the 1c and 2c coefficients was
neglected, no external springs or masses were added to the pillar or float to vary the frequency of the decaying oscillations, as was done by Bracewell (1990). The flotation collars produced a significantly larger damping coefficient for the pillar than for the float, and the observed frequency of pillar vibration was 0.3 Hz.
Power Take-Off Characterization
Eq. 12 relates the generator damping, gencθ , to the damping of float
travel along the pillar, gencξ . Regardless of the coefficient chosen,
Graves (2000) showed that the generator damping coefficient for a simple DC generator has an inverse relationship with external load resistance, of the form,
( )( )
gengen ext gen
int ext
ca
R bR R
ξ = ++
(29)
The constants, gena , and, genb , depend on the motion variable in terms
of which the damping effect is defined. We choose to work with, gencξ ,
to be consistent with Eq. 1. Additional float decay tests were conducted in which the generator circuit was closed using various field resistances. However, the rheostat used as the field resistance was not well matched to the chosen DC generator: the full scale resistance was 5 kΩ and the useful range of resistance values was found to be 0 200extRΩ ≤ ≤ Ω . Values above 200extR = Ω were found to produce
overall damping behavior that matched the tests in which the generator was disconnected. This indicated that, gena , was small and that the DC
generator was undersized. A bench-top experiment, the setup of which is shown in Fig. 7, was built to more accurately quantify the generator damping as a function of external resistance. The experiment consisted of the Charlotte power take-off module with the input shaft coupled to a torsion spring, in place of the chain drive. A rotational encoder provided generator shaft rotation data during a series of transient response tests at various external resistances. The generator response traversed from under-damped to over-damped as external resistance decreased. Various methods of damping quantification including logarithmic decrement, settling time, and percent overshoot methods were applied.
Fig. 7. Bench experiment to quantify generator damping. Shows the PTO input shaft coupled to a torsion spring.
The data from all methods are plotted and a least squares fit of the form of Eq. 29 is shown in Fig. 8. and the coefficient values are given in Table 3. During the bench-top tests, the power take-off inertia was found to be small, thus validating the removal of PTOI from Eq. 5. At
low resistances, reasonable agreement with the hypothesis of Graves (2000) was achieved.
100
101
102
10310
0
101
102
103
External Resistance (Ohms)
Gen
erat
or D
ampi
ng
(Ns/
m)
Best Fit LineLogarithmic DecrementSettling Time & %Overshoot
Fig. 8. Generator Damping vs. External Load Resistance.
From Fig. 8, it is apparent that the generator damping is extremely sensitive to small changes in external load resistance, especially at small resistance values. During the tank trials generator damping was set at its maximum value (i.e. smallest resistance – approximately 1Ω) in an attempt to maximize the power output. However, due to the lack of resolution of the 5kΩ rheostat, the actual generator damping may have varied significantly.
Table 3. Generator Parameters from best fit of gencξ .
Physical Parameter Value
Generator Constant (agen) 2556 NsΩ/m
Generator Offset (bgen) 3.658 Ns/m
External Resistance used for wave testing (Rext) 1 Ω
Armature Resistance (Rint) 21.7 Ω
RESULTS
Mean wave-height and the wave frequency for each trial run were obtained using the Fourier transform of a wave probe signal. The wave amplitude used in the model based predictions, A, was the magnitude of the dominant peak. This technique was used to filter out high frequency components due to wave reflections. Wave reflections were
generator
torsionalspring
4:1ratio
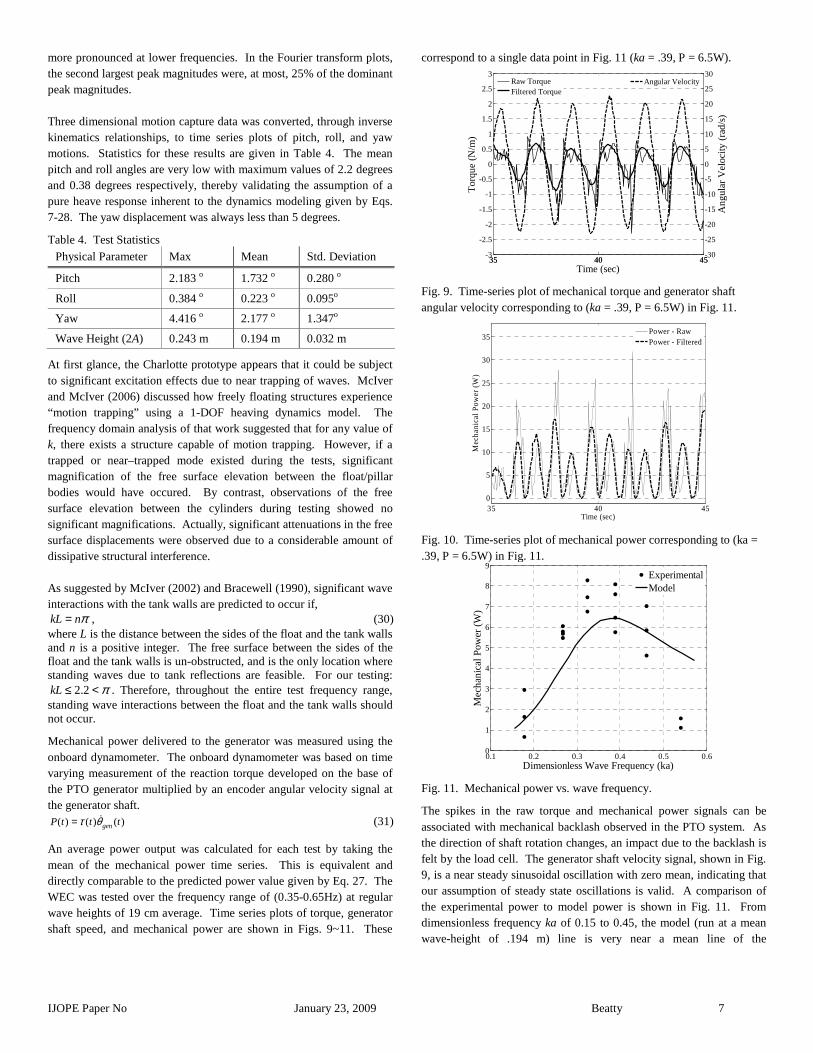
IJOPE Paper No January 23, 2009 Beatty 7
more pronounced at lower frequencies. In the Fourier transform plots, the second largest peak magnitudes were, at most, 25% of the dominant peak magnitudes. Three dimensional motion capture data was converted, through inverse kinematics relationships, to time series plots of pitch, roll, and yaw motions. Statistics for these results are given in Table 4. The mean pitch and roll angles are very low with maximum values of 2.2 degrees and 0.38 degrees respectively, thereby validating the assumption of a pure heave response inherent to the dynamics modeling given by Eqs. 7-28. The yaw displacement was always less than 5 degrees.
Table 4. Test Statistics
Physical Parameter Max Mean Std. Deviation Pitch 2.183 o 1.732 o 0.280 o
Roll 0.384 o 0.223 o 0.095o
Yaw 4.416 o 2.177 o 1.347o
Wave Height (2A) 0.243 m 0.194 m 0.032 m
At first glance, the Charlotte prototype appears that it could be subject to significant excitation effects due to near trapping of waves. McIver and McIver (2006) discussed how freely floating structures experience “motion trapping” using a 1-DOF heaving dynamics model. The frequency domain analysis of that work suggested that for any value of k, there exists a structure capable of motion trapping. However, if a trapped or near–trapped mode existed during the tests, significant magnification of the free surface elevation between the float/pillar bodies would have occured. By contrast, observations of the free surface elevation between the cylinders during testing showed no significant magnifications. Actually, significant attenuations in the free surface displacements were observed due to a considerable amount of dissipative structural interference. As suggested by McIver (2002) and Bracewell (1990), significant wave interactions with the tank walls are predicted to occur if, kL nπ= , (30) where L is the distance between the sides of the float and the tank walls and n is a positive integer. The free surface between the sides of the float and the tank walls is un-obstructed, and is the only location where standing waves due to tank reflections are feasible. For our testing:
2.2kL π≤ < . Therefore, throughout the entire test frequency range, standing wave interactions between the float and the tank walls should not occur.
Mechanical power delivered to the generator was measured using the onboard dynamometer. The onboard dynamometer was based on time varying measurement of the reaction torque developed on the base of the PTO generator multiplied by an encoder angular velocity signal at the generator shaft.
( ) ( ) ( )genP t t tτ θ= ɺ (31)
An average power output was calculated for each test by taking the mean of the mechanical power time series. This is equivalent and directly comparable to the predicted power value given by Eq. 27. The WEC was tested over the frequency range of (0.35-0.65Hz) at regular wave heights of 19 cm average. Time series plots of torque, generator shaft speed, and mechanical power are shown in Figs. 9~11. These
correspond to a single data point in Fig. 11 (ka = .39, P = 6.5W).
35 40 45-3
-2.5
-2
-1.5
-1
-0.5
0
0.5
1
1.5
2
2.5
3
Tor
que
(N/m
)
35 40 45-30
-25
-20
-15
-10
-5
0
5
10
15
20
25
30
An
gul
ar V
eloc
ity (
rad
/s)
Time (sec)
Raw TorqueFiltered Torque
Angular Velocity
Fig. 9. Time-series plot of mechanical torque and generator shaft angular velocity corresponding to (ka = .39, P = 6.5W) in Fig. 11.
35 40 450
5
10
15
20
25
30
35
Time (sec)
Mec
han
ical
Po
wer
(W
)
Power - RawPower - Filtered
Fig. 10. Time-series plot of mechanical power corresponding to (ka = .39, P = 6.5W) in Fig. 11.
0.1 0.2 0.3 0.4 0.5 0.60
1
2
3
4
5
6
7
8
9
Dimensionless Wave Frequency (ka)
Me
chan
ica
l Pow
er (
W)
ExperimentalModel
Fig. 11. Mechanical power vs. wave frequency.
The spikes in the raw torque and mechanical power signals can be associated with mechanical backlash observed in the PTO system. As the direction of shaft rotation changes, an impact due to the backlash is felt by the load cell. The generator shaft velocity signal, shown in Fig. 9, is a near steady sinusoidal oscillation with zero mean, indicating that our assumption of steady state oscillations is valid. A comparison of the experimental power to model power is shown in Fig. 11. From dimensionless frequency ka of 0.15 to 0.45, the model (run at a mean wave-height of .194 m) line is very near a mean line of the
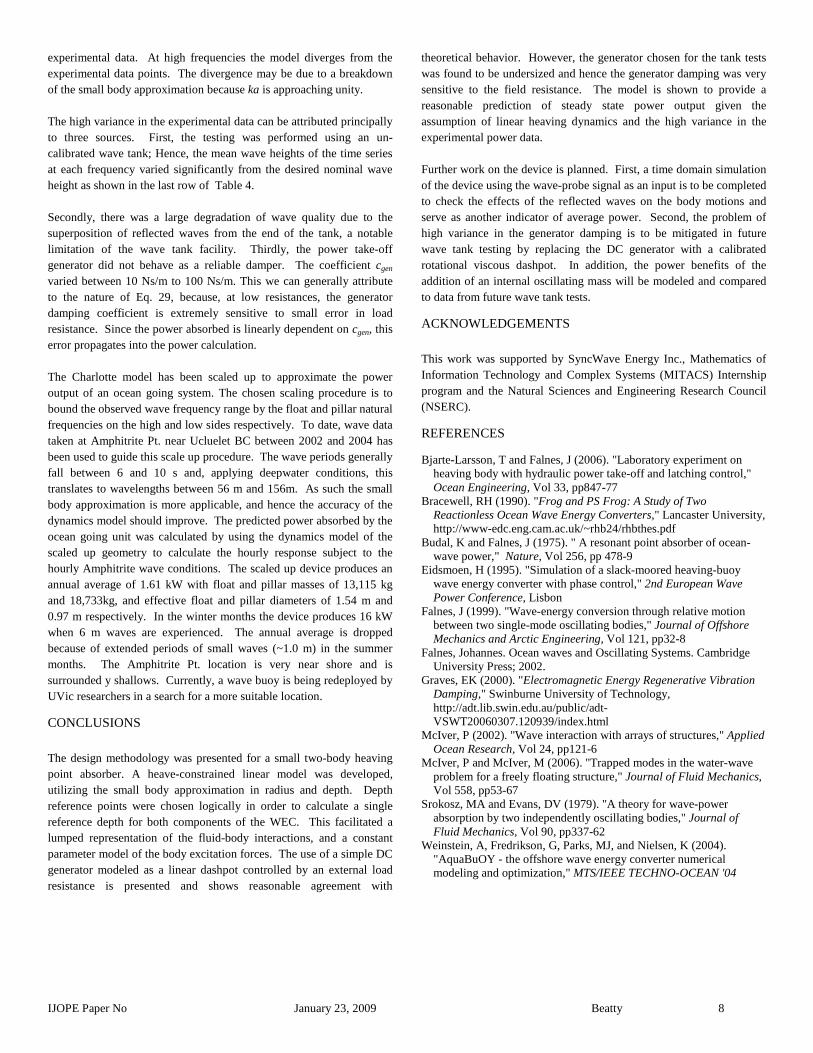
IJOPE Paper No January 23, 2009 Beatty 8
experimental data. At high frequencies the model diverges from the experimental data points. The divergence may be due to a breakdown of the small body approximation because ka is approaching unity. The high variance in the experimental data can be attributed principally to three sources. First, the testing was performed using an un-calibrated wave tank; Hence, the mean wave heights of the time series at each frequency varied significantly from the desired nominal wave height as shown in the last row of Table 4. Secondly, there was a large degradation of wave quality due to the superposition of reflected waves from the end of the tank, a notable limitation of the wave tank facility. Thirdly, the power take-off generator did not behave as a reliable damper. The coefficient cgen varied between 10 Ns/m to 100 Ns/m. This we can generally attribute to the nature of Eq. 29, because, at low resistances, the generator damping coefficient is extremely sensitive to small error in load resistance. Since the power absorbed is linearly dependent on cgen, this error propagates into the power calculation. The Charlotte model has been scaled up to approximate the power output of an ocean going system. The chosen scaling procedure is to bound the observed wave frequency range by the float and pillar natural frequencies on the high and low sides respectively. To date, wave data taken at Amphitrite Pt. near Ucluelet BC between 2002 and 2004 has been used to guide this scale up procedure. The wave periods generally fall between 6 and 10 s and, applying deepwater conditions, this translates to wavelengths between 56 m and 156m. As such the small body approximation is more applicable, and hence the accuracy of the dynamics model should improve. The predicted power absorbed by the ocean going unit was calculated by using the dynamics model of the scaled up geometry to calculate the hourly response subject to the hourly Amphitrite wave conditions. The scaled up device produces an annual average of 1.61 kW with float and pillar masses of 13,115 kg and 18,733kg, and effective float and pillar diameters of 1.54 m and 0.97 m respectively. In the winter months the device produces 16 kW when 6 m waves are experienced. The annual average is dropped because of extended periods of small waves (~1.0 m) in the summer months. The Amphitrite Pt. location is very near shore and is surrounded y shallows. Currently, a wave buoy is being redeployed by UVic researchers in a search for a more suitable location.
CONCLUSIONS
The design methodology was presented for a small two-body heaving point absorber. A heave-constrained linear model was developed, utilizing the small body approximation in radius and depth. Depth reference points were chosen logically in order to calculate a single reference depth for both components of the WEC. This facilitated a lumped representation of the fluid-body interactions, and a constant parameter model of the body excitation forces. The use of a simple DC generator modeled as a linear dashpot controlled by an external load resistance is presented and shows reasonable agreement with
theoretical behavior. However, the generator chosen for the tank tests was found to be undersized and hence the generator damping was very sensitive to the field resistance. The model is shown to provide a reasonable prediction of steady state power output given the assumption of linear heaving dynamics and the high variance in the experimental power data. Further work on the device is planned. First, a time domain simulation of the device using the wave-probe signal as an input is to be completed to check the effects of the reflected waves on the body motions and serve as another indicator of average power. Second, the problem of high variance in the generator damping is to be mitigated in future wave tank testing by replacing the DC generator with a calibrated rotational viscous dashpot. In addition, the power benefits of the addition of an internal oscillating mass will be modeled and compared to data from future wave tank tests.
ACKNOWLEDGEMENTS
This work was supported by SyncWave Energy Inc., Mathematics of Information Technology and Complex Systems (MITACS) Internship program and the Natural Sciences and Engineering Research Council (NSERC).
REFERENCES
Bjarte-Larsson, T and Falnes, J (2006). "Laboratory experiment on heaving body with hydraulic power take-off and latching control," Ocean Engineering, Vol 33, pp847-77
Bracewell, RH (1990). "Frog and PS Frog: A Study of Two Reactionless Ocean Wave Energy Converters," Lancaster University, http://www-edc.eng.cam.ac.uk/~rhb24/rhbthes.pdf
Budal, K and Falnes, J (1975). " A resonant point absorber of ocean-wave power," Nature, Vol 256, pp 478-9
Eidsmoen, H (1995). "Simulation of a slack-moored heaving-buoy wave energy converter with phase control," 2nd European Wave Power Conference, Lisbon
Falnes, J (1999). "Wave-energy conversion through relative motion between two single-mode oscillating bodies," Journal of Offshore Mechanics and Arctic Engineering, Vol 121, pp32-8
Falnes, Johannes. Ocean waves and Oscillating Systems. Cambridge University Press; 2002.
Graves, EK (2000). "Electromagnetic Energy Regenerative Vibration Damping," Swinburne University of Technology, http://adt.lib.swin.edu.au/public/adt-VSWT20060307.120939/index.html
McIver, P (2002). "Wave interaction with arrays of structures," Applied Ocean Research, Vol 24, pp121-6
McIver, P and McIver, M (2006). "Trapped modes in the water-wave problem for a freely floating structure," Journal of Fluid Mechanics, Vol 558, pp53-67
Srokosz, MA and Evans, DV (1979). "A theory for wave-power absorption by two independently oscillating bodies," Journal of Fluid Mechanics, Vol 90, pp337-62
Weinstein, A, Fredrikson, G, Parks, MJ, and Nielsen, K (2004). "AquaBuOY - the offshore wave energy converter numerical modeling and optimization," MTS/IEEE TECHNO-OCEAN '04

57
Appendix B
Frequency Response Tuning for a Two-Body
Heaving Wave Energy Converter
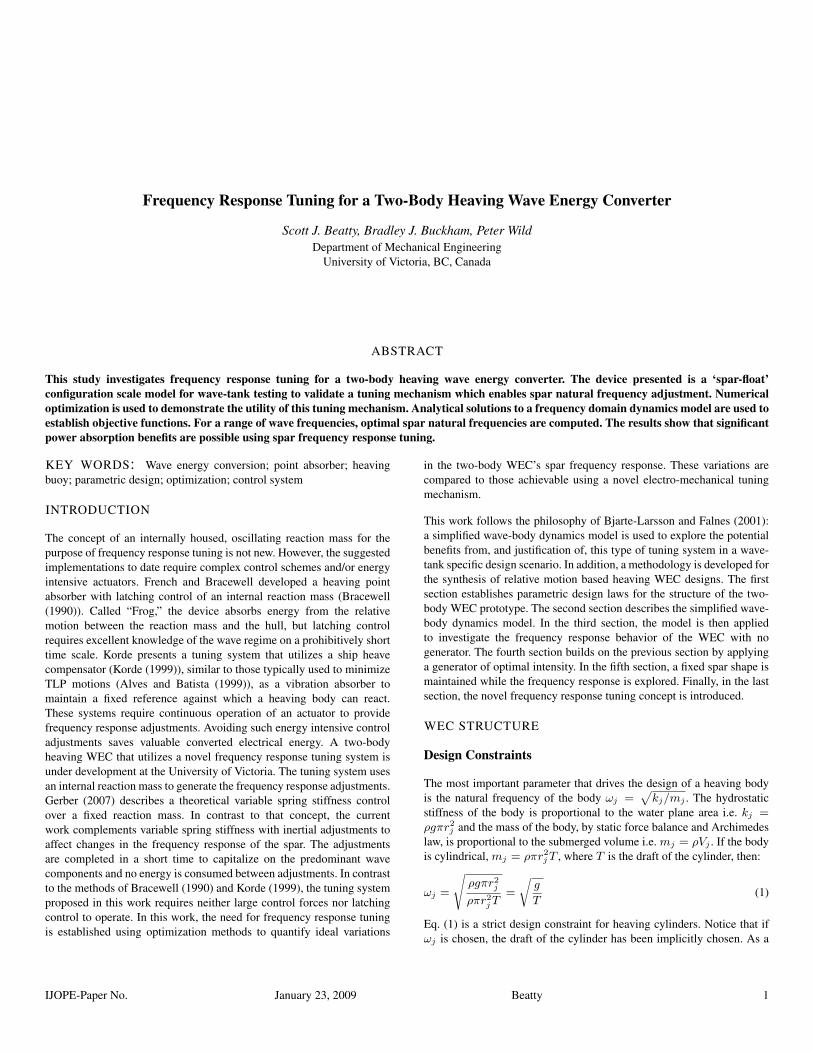
Frequency Response Tuning for a Two-Body Heaving Wave Energy Converter
Scott J. Beatty, Bradley J. Buckham, Peter WildDepartment of Mechanical Engineering
University of Victoria, BC, Canada
ABSTRACT
This study investigates frequency response tuning for a two-body heaving wave energy converter. The device presented is a ‘spar-float’configuration scale model for wave-tank testing to validate a tuning mechanism which enables spar natural frequency adjustment. Numericaloptimization is used to demonstrate the utility of this tuning mechanism. Analytical solutions to a frequency domain dynamics model are used toestablish objective functions. For a range of wave frequencies, optimal spar natural frequencies are computed. The results show that significantpower absorption benefits are possible using spar frequency response tuning.
KEY WORDS: Wave energy conversion; point absorber; heavingbuoy; parametric design; optimization; control system
INTRODUCTION
The concept of an internally housed, oscillating reaction mass for thepurpose of frequency response tuning is not new. However, the suggestedimplementations to date require complex control schemes and/or energyintensive actuators. French and Bracewell developed a heaving pointabsorber with latching control of an internal reaction mass (Bracewell(1990)). Called “Frog,” the device absorbs energy from the relativemotion between the reaction mass and the hull, but latching controlrequires excellent knowledge of the wave regime on a prohibitively shorttime scale. Korde presents a tuning system that utilizes a ship heavecompensator (Korde (1999)), similar to those typically used to minimizeTLP motions (Alves and Batista (1999)), as a vibration absorber tomaintain a fixed reference against which a heaving body can react.These systems require continuous operation of an actuator to providefrequency response adjustments. Avoiding such energy intensive controladjustments saves valuable converted electrical energy. A two-bodyheaving WEC that utilizes a novel frequency response tuning system isunder development at the University of Victoria. The tuning system usesan internal reaction mass to generate the frequency response adjustments.Gerber (2007) describes a theoretical variable spring stiffness controlover a fixed reaction mass. In contrast to that concept, the currentwork complements variable spring stiffness with inertial adjustments toaffect changes in the frequency response of the spar. The adjustmentsare completed in a short time to capitalize on the predominant wavecomponents and no energy is consumed between adjustments. In contrastto the methods of Bracewell (1990) and Korde (1999), the tuning systemproposed in this work requires neither large control forces nor latchingcontrol to operate. In this work, the need for frequency response tuningis established using optimization methods to quantify ideal variations
in the two-body WEC’s spar frequency response. These variations arecompared to those achievable using a novel electro-mechanical tuningmechanism.
This work follows the philosophy of Bjarte-Larsson and Falnes (2001):a simplified wave-body dynamics model is used to explore the potentialbenefits from, and justification of, this type of tuning system in a wave-tank specific design scenario. In addition, a methodology is developed forthe synthesis of relative motion based heaving WEC designs. The firstsection establishes parametric design laws for the structure of the two-body WEC prototype. The second section describes the simplified wave-body dynamics model. In the third section, the model is then appliedto investigate the frequency response behavior of the WEC with nogenerator. The fourth section builds on the previous section by applyinga generator of optimal intensity. In the fifth section, a fixed spar shape ismaintained while the frequency response is explored. Finally, in the lastsection, the novel frequency response tuning concept is introduced.
WEC STRUCTURE
Design Constraints
The most important parameter that drives the design of a heaving bodyis the natural frequency of the body ωj =
√kj/mj . The hydrostatic
stiffness of the body is proportional to the water plane area i.e. kj =ρgπr2j and the mass of the body, by static force balance and Archimedeslaw, is proportional to the submerged volume i.e. mj = ρVj . If the bodyis cylindrical, mj = ρπr2jT , where T is the draft of the cylinder, then:
ωj =
√ρgπr2jρπr2jT
=
√g
T(1)
Eq. (1) is a strict design constraint for heaving cylinders. Notice that ifωj is chosen, the draft of the cylinder has been implicitly chosen. As a
IJOPE-Paper No. January 23, 2009 Beatty 1

result, a low frequency heaving cylinder must have a very deep draft. Forexample, a cylinder designed to resonate to waves of 14 second period(0.45 rad/s) will have a draft of 49 m. An obvious way to avoid thedeep draft problem is to deviate from a cylindrical geometry. To set thedevice size, the radius at the water-plane, rj , can be chosen, hence kj isfixed. Below the water surface, the diameter can vary as required so thatthe submerged volume (displacement) satisfies the static vertical forcebalance. For realistically shaped WEC components, it is expected thata deviation from the cylindrical shape will be required achieve the lownatural frequencies to required to approach a resonant response in themore energetic ocean waves.
Parametric Design
For this study, the design wave height, H , is chosen to be 0.5m tobest utilize the wave tank capabilities. The float geometry is fixed as acylindrical body with natural frequency ω1 set to 3.13 rad/s for a draftof T1 = 2H = 1 m. The spar has a parameterized, non-cylindricalgeometry as shown in Fig. 1. The spar bulb radius is free to vary asnecessary with the spar natural frequency within the range 1.0 ≤ ω2 ≤2.0 rad/s. A semi-spherical bottom and conical section were chosenfor simplicity as well as to minimize viscous damping effects due tovortex formation. The water plane cylindrical section of radius r2, thetapered section, and the clearance between the WEC and tank bottomall have been parameterized with respect to H . Notice that the spar(body 2 in Fig. 1) contains a sub-system of mass m3 which is the tuningmodule to be discussed later. The spar bulb shape is parameterized in
Fig. 1. Parameterized Spar and Tank Geometry
terms of H and arbitrary geometric constants a1, a2, a3, and a4. Tomaintain a linear hydrostatic stiffness throughout the spar motion, thetotal length of the constant cross section of radius r2 (a1H) is chosen.a2 is chosen to define a gradually tapered section so that a low heavedamping can be maintained. a3 specifies the clearance between the tankbottom and the spar bottom to prevent impact with the floor. The ratio
Table 1. Wave Tank and design constraint parameters
Parameter Symbol Value
Tank depth h 7.0 mDesign wave height H 0.5 mWave frequency range ω 1→ 4 rad/sBottle neck constraint a1 1.5Taper portions constraint a2 2.0Draft constraint a3 3.0Spar to reaction mass ratio a4 1.8Body 1 natural frequency ω1 3.13 rad/sBody 1 hydrost. stiffness k1 1491 N/mBody 2 natural frequency ω2 1.0→ 2.0 rad/sBody 2 hydrost. stiffness k2 613 N/mFloat damping ratio ζ1 0.2Spar damping ratio ζ2 0.3Reaction mass damping ratio ζ3 0.3
of the reaction mass to the spar mass, represented by a4, relates to theeffectiveness of the tuning module. As a4 increases, the effectivenessof the tuning module improves, however the practical feasibility ofthe system decreases. For this study, we have approached the limit ofpracticality by setting a4 = 1.8. Using this geometrical formulation, adesired spar draft (h− a3H), stiffness k2, and natural frequency ω2 canbe defined. Table 1 shows the Institute for Ocean Technology wave tankparameters and the chosen parametric spar design parameters. Since thiswork is focused on design synthesis using a simplified model, tank widtheffects and detailed hydrodynamics have been neglected. The submergedvolume of the parameterized spar can be expressed as:
V2 = π(a1Hr22 +
1
3a2H(R2 +Rr2 + r22) + ljR
2 +2
3R3) (2)
where lj is,
lj = h− (a1 + a2 + a3)H −R (3)
To account for the tuning module of mass m3 to be housed inside thespar (body 2), the total mass of the system comprising the both the sparand tuning module is as follows,
m23 = m2 +m3 = (1 + a4)m2 (4)
where a4 = m3m2
. We define the natural frequency of the systemcomprising the both the spar and tuning module as,
ω23 ≡√
k2
m2 +m3=
ω2√1 + a4
(5)
Using the Archimedes principle:
m23 = (1 + a4)m2 = ρV2 (6)
and substituting in the hydrostatic stiffness, k2 = ρgπr22 , and massm23 = k2
ω223
of body 2 into Eq. (2), the result is a cubic equation inR:
R3 +A1R2 +A2R
3 +A3 = 0 (7)
where,
A1 = −3a1H − 2a2H − 3a3H + 3h (8a)
A2 = a2Hr (8b)
A3 = 3a1Hr2 + a2Hr
2 − 3gr2
ω223
(8c)
IJOPE-Paper No. January 23, 2009 Beatty 2

Solutions of Eq. 7 give R as a function of ω23 (which can easily beexpressed in terms of ω2 using Eq. 5) and so the spar geometry issuccessfully parameterized in terms of desired size and natural frequency.The resulting relationship between spar natural frequency and spargeometry has been obtained and plotted for a relevant range of ω2 givenby Fig. 2. Notice the transition point at ω2 = 2.2 rad/s. This representsthe transition to a cylindrical geometry from a non-cylindrical (bulbous)geometry. This arises because, as the spar natural frequency ω2 increases,the bulbous hull shape is no longer required to supply added submergedvolume to maintain a vertical force balance and adhere to the maximumdraft constraint. From ω2 = 2.2 rad/s on, the spar geometry is cylindricalwith decreasing draft, as governed by Eq. 1. At the low end of the
1 1.5 2 2.5 3 3.5 40.1
0.15
0.2
0.25
0.3
0.35
ω2 [rad/s]
Spar
Bul
b R
adiu
s R
[m
]
Fig. 2. Variation of R with body 2 natural frequency ω2
frequency range, Fig. 2 shows that extremely large R is required forω2 < 1.0 rad/s. For large values of R, the spar would most likelyviolate the assumption of a low heave damping coefficient. Hence thelower spar frequency limit was arbitrarily chosen as ω2 = 1.0 rad/sto maintain a reasonable hull aspect ratio. The upper limit was chosento be consistent with the expected capability of the tuning system to bepresented later. As a result, the chosen range of the spar natural frequencyis 1.0 ≤ ω2 ≤ 2.0 rad/s. Through Eq. 5, this range can be converted tothe range 0.6 ≤ ω23 ≤ 1.2 rad/s given the chosen spar to reaction massratio a4 given in Table 1.
SMALL BODY DYNAMICS MODELING
In the preceding section, we arbitrarily set the float natural frequency toa relatively high value ω1 = 3.13 rad/s and parameterized the spar sothat ω2 completely specifies its geometry. In this section, the dynamicsmodel is used to predict the performance given an arbitrary choice of ω1
and ω2. The model is a 2 degree-of-freedom system of linear ODE’s withconstant coefficients, as described in Beatty et al. (2007). This modelcan be used to approximate the steady state response of the WEC toregular waves. The model employs the “long wavelength approximation”to the wave excitation forces, under the assumption that max(ka) 1,where the water surface amplitude is evaluated at the vertical axis ofsymmetry of the WEC. Since the waves are assumed regular, the complexamplitudes of the body displacements, ξj , can be found in the frequencydomain.
Excitation Force
For a given wave amplitude, A = H2
, the wave excitation force on eachbody is modeled by Eq. 9.
fe12 =
[(m1a01
m2a02
)1
A+
(c1v01c2v02
)1
A+
(k1
k2
)]A (9)
The fluid velocity and accelerations, v0j in Eq. 11 and a0j in Eq. 10respectively, are evaluated at a “reference depth” zPj as described byFalnes (2002) and Clauss et al. (1992) for application to the design ofoffshore structures. The wavenumber, k, is obtained from an iterativesolution to the dispersion relation.
a0j = −ω2 sinh(kzPj + kh)
sinh(kh)A (10)
v0j = iωsinh(kzPj + kh)
sinh(kh)A (11)
The reference depth for any cylindrical body is assumed to be equal toits draft; However, the reference depth for a composite shape, such as thespar design given by Fig. 1, is approximated by a weighted average depthwhere the weighting is based on the protruding areas normal to the heavedirection as outlined by Beatty et al. (2007). The reference depths usedfor the float and spar, are given by Eq. 12 and Eq. 13 respectively, whereTmax is the draft constraint defined by Tmax = h− a3H .
zP1 =g
ω21
(12)
zP2 =
((a1+a2)H(R2−r2)+((a1+a2)H+lj)R2)(2R2−r2)
if T2 ≥ Tmax,(1+a4)g
ω22
if T2 < Tmax(13)
Governing Dynamics Equations
The vector of displacements for this “spar-float” two-body system isdefined by Eq. 14, and the governing differential equation can bearranged in matrix form (Eq. 15).
x = <[ξ1ξ2
]eiωt
(14)
M x + Cx +Kx = fe (15)
For the two body system comprising body 1 and body 2, the mass,stiffness, and damping matrices are given by Eq. 16, Eq. 17, andEq. 18 respectively. The model employs a linear viscous dashpot withcoefficient cg to represent the power take off generator. The dampingmatrix includes the coupling effect of the generator damping, but forsimplicity, no hydrodynamic cross-coupling terms are included.
M12 =
[m1 00 m2 +m3
]=
[k1ω21
0
0 (1 + a4)k2ω22
](16)
K12 =
[k1 00 ρgπr22
](17)
C12 =
[c1 + cg −cg−cg c2 + cg
](18)
[−ω2M12 + iωC12 +K12]
[ξ1ξ2
]=
[(m1a01
m2a02
)1
A+
(c1v01c2v02
)1
A+
(k1
k2
)]A
(19)
The solution, in terms of the complex amplitudes of the heaving dis-placements is found by matrix inversion of the combined dynamic matrixon the LHS of Eq. 19 multiplied by the RHS. This operation is doneanalytically to obtain closed form expressions for ξ1(ω), ξ2(ω), andξ1/2(ω), where ξ1/2(ω) = ξ1(ω) − ξ2(ω). The power absorbed by thepower take off damper is given by Eq. 20.
P (ω) =1
2ω2cg|ξ1/2(ω)|2 (20)
IJOPE-Paper No. January 23, 2009 Beatty 3
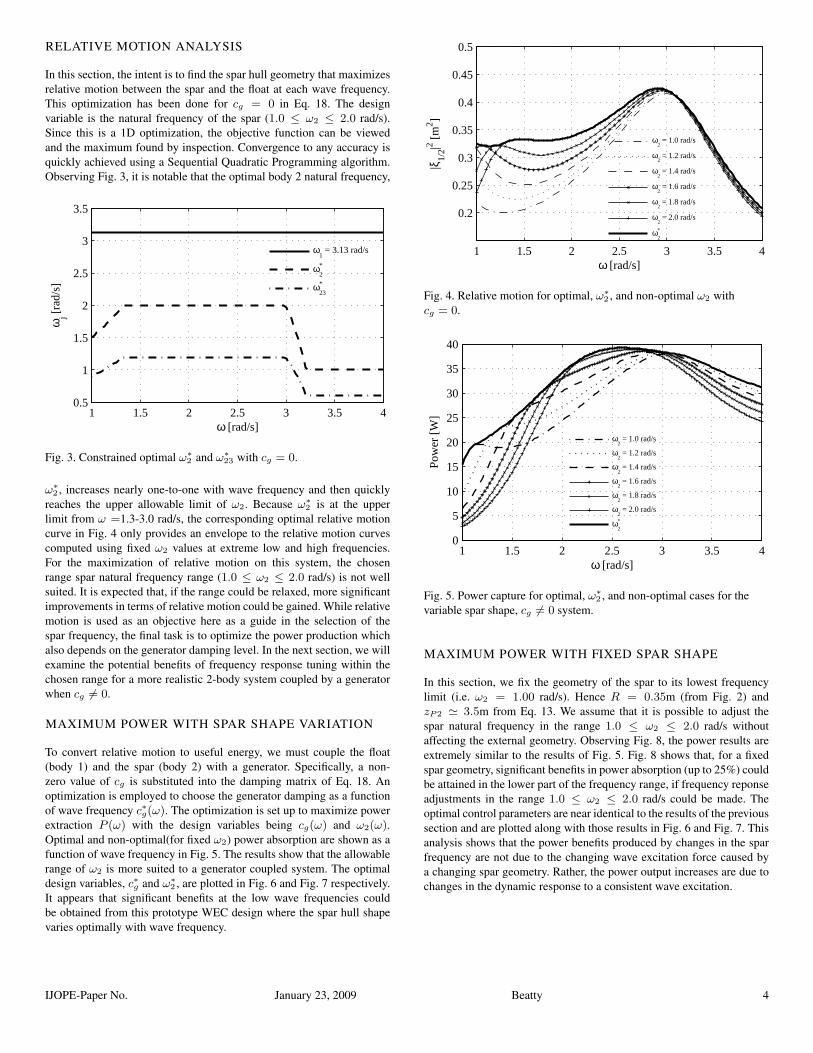
RELATIVE MOTION ANALYSIS
In this section, the intent is to find the spar hull geometry that maximizesrelative motion between the spar and the float at each wave frequency.This optimization has been done for cg = 0 in Eq. 18. The designvariable is the natural frequency of the spar (1.0 ≤ ω2 ≤ 2.0 rad/s).Since this is a 1D optimization, the objective function can be viewedand the maximum found by inspection. Convergence to any accuracy isquickly achieved using a Sequential Quadratic Programming algorithm.Observing Fig. 3, it is notable that the optimal body 2 natural frequency,
1 1.5 2 2.5 3 3.5 40.5
1
1.5
2
2.5
3
3.5
ω [rad/s]
ωj [
rad/
s]
ω1 = 3.13 rad/s
ω2
*
ω23
*
Fig. 3. Constrained optimal ω∗2 and ω∗23 with cg = 0.
ω∗2 , increases nearly one-to-one with wave frequency and then quicklyreaches the upper allowable limit of ω2. Because ω∗2 is at the upperlimit from ω =1.3-3.0 rad/s, the corresponding optimal relative motioncurve in Fig. 4 only provides an envelope to the relative motion curvescomputed using fixed ω2 values at extreme low and high frequencies.For the maximization of relative motion on this system, the chosenrange spar natural frequency range (1.0 ≤ ω2 ≤ 2.0 rad/s) is not wellsuited. It is expected that, if the range could be relaxed, more significantimprovements in terms of relative motion could be gained. While relativemotion is used as an objective here as a guide in the selection of thespar frequency, the final task is to optimize the power production whichalso depends on the generator damping level. In the next section, we willexamine the potential benefits of frequency response tuning within thechosen range for a more realistic 2-body system coupled by a generatorwhen cg 6= 0.
MAXIMUM POWER WITH SPAR SHAPE VARIATION
To convert relative motion to useful energy, we must couple the float(body 1) and the spar (body 2) with a generator. Specifically, a non-zero value of cg is substituted into the damping matrix of Eq. 18. Anoptimization is employed to choose the generator damping as a functionof wave frequency c∗g(ω). The optimization is set up to maximize powerextraction P (ω) with the design variables being cg(ω) and ω2(ω).Optimal and non-optimal(for fixed ω2) power absorption are shown as afunction of wave frequency in Fig. 5. The results show that the allowablerange of ω2 is more suited to a generator coupled system. The optimaldesign variables, c∗g and ω∗2 , are plotted in Fig. 6 and Fig. 7 respectively.It appears that significant benefits at the low wave frequencies couldbe obtained from this prototype WEC design where the spar hull shapevaries optimally with wave frequency.
1 1.5 2 2.5 3 3.5 4
0.2
0.25
0.3
0.35
0.4
0.45
0.5
ω [rad/s]
|ξ1/
2|2 [m
2 ]
ω2 = 1.0 rad/s
ω2 = 1.2 rad/s
ω2 = 1.4 rad/s
ω2 = 1.6 rad/s
ω2 = 1.8 rad/s
ω2 = 2.0 rad/s
ω2
*
Fig. 4. Relative motion for optimal, ω∗2 , and non-optimal ω2 withcg = 0.
1 1.5 2 2.5 3 3.5 40
5
10
15
20
25
30
35
40
ω [rad/s]
Pow
er [
W]
ω2 = 1.0 rad/s
ω2 = 1.2 rad/s
ω2 = 1.4 rad/s
ω2 = 1.6 rad/s
ω2 = 1.8 rad/s
ω2 = 2.0 rad/s
ω2
*
Fig. 5. Power capture for optimal, ω∗2 , and non-optimal cases for thevariable spar shape, cg 6= 0 system.
MAXIMUM POWER WITH FIXED SPAR SHAPE
In this section, we fix the geometry of the spar to its lowest frequencylimit (i.e. ω2 = 1.00 rad/s). Hence R = 0.35m (from Fig. 2) andzP2 ' 3.5m from Eq. 13. We assume that it is possible to adjust thespar natural frequency in the range 1.0 ≤ ω2 ≤ 2.0 rad/s withoutaffecting the external geometry. Observing Fig. 8, the power results areextremely similar to the results of Fig. 5. Fig. 8 shows that, for a fixedspar geometry, significant benefits in power absorption (up to 25%) couldbe attained in the lower part of the frequency range, if frequency reponseadjustments in the range 1.0 ≤ ω2 ≤ 2.0 rad/s could be made. Theoptimal control parameters are near identical to the results of the previoussection and are plotted along with those results in Fig. 6 and Fig. 7. Thisanalysis shows that the power benefits produced by changes in the sparfrequency are not due to the changing wave excitation force caused bya changing spar geometry. Rather, the power output increases are due tochanges in the dynamic response to a consistent wave excitation.
IJOPE-Paper No. January 23, 2009 Beatty 4

1 1.5 2 2.5 3 3.5 40.5
1
1.5
2
2.5
3
3.5
ω [rad/s]
ωj [
rad/
s]
ω
1 = 3.13 rad/s
ω2
* varying spar
ω23
* varying spar
ω2
* fixed spar
ω23
* fixed spar
Fig. 6. Constrained optimal ω∗2 , for the variable spar shape, cg 6= 0system.
1 1.5 2 2.5 3 3.5 40
500
1000
1500
2000
2500
3000
ω [rad/s]
c g* [N
s/m
]
ω
2 = 1.0 rad/s
ω2 = 1.2 rad/s
ω2 = 1.4 rad/s
ω2 = 1.6 rad/s
ω2 = 1.8 rad/s
ω2 = 2.0 rad/s
ω2
*
Fig. 7. Constrained optimal c∗g for the variable spar shape, cg 6= 0system.
FREQUENCY RESPONSE TUNING
In the preceding sections, it was shown that the ω∗2 variations have apositive influence on the prototype two-body WEC energy conversion.In addition, significant energy improvements are still available whilemaintaining a fixed spar hull shape. In this section, a novel way ofmaintaining a fixed spar hull shape while still providing frequencyresponse tuning to the optimal spar natural frequency, ω∗2 , is presented.
A Novel Tuning Mechanism
The mechanical implementation of the tuning mechanism housed withinthe spar, as described in Protter et al. (2007) and shown in Fig. 9,utilizes a spring mounted reaction mass. Through the use of a ballscrewassembly, the reaction mass is kinematically coupled to a rotationalsystem. Mounted to the ballscrew shaft is a rotating assembly that can bevaried geometrically so as to provide a variable moment of inertia (J).The operation of this device is essentially a “fly-ball governor” driven inreverse.
1 1.5 2 2.5 3 3.5 40
5
10
15
20
25
30
35
40
ω [rad/s]
Pow
er [
W]
ω2 = 1.0 rad/s
ω2 = 1.2 rad/s
ω2 = 1.4 rad/s
ω2 = 1.6 rad/s
ω2 = 1.8 rad/s
ω2 = 2.0 rad/s
ω2
*
Fig. 8. Power capture for optimal, ω∗2 , and non-optimal cases for thefixed spar shape, cg 6= 0 system.
Fig. 9. Conceptual schematic of the frequency response tuning system
Dynamics Model
In order to investigate the capability of the proposed tuning system, adynamics model of the two-body system consisting of the spar (body2), reaction mass (body 3), and the rotational system with moment ofinertia, J , will now be adapted from the previous two-body model. Forthe spar, the same excitation force model of Eq. 9 is used, however thereaction mass has no excitation due to waves. Forces are induced onthe reaction mass only by relative motion between it and the spar. Forany heave translation of the reaction mass, the rotational system mustrotate according to the ballscrew lead l (units are m/rad). Specifically, theangular displacement of the rotational system, θ, is related to the relativemotion between the spar and reaction mass by:
θ =ξ3 − ξ2
l, θ =
ξ3 − ξ2l
, θ =ξ3 − ξ2
l(21)
For now, we assume a ballscrew of perfect efficiency so that torque, τ ,can completely be converted to thrust force, Ft, related by the ballscrewlead. By applying Newton’s 2nd Law to the rotational system we have,
τ = Ftl = Jθ (22)
IJOPE-Paper No. January 23, 2009 Beatty 5

Therefore,
Ft =Jθ
l(23)
By substituting the kinematic coupling relationship of Eq. 21 into Eq. 23,a final expression for the thrust force on the reaction mass due to therotational inertia is obtained.
Ft =J
l2(ξ3 − ξ2) (24)
By applying Newton’s law (observing the free body diagrams given by
a) b) c)
Fig. 10. (a) Free body diagram of the spar (body 2). (b) Free bodydiagram of the reaction mass (body 3). (c) Free body diagram of therotational system.
Fig. 10) in the vertical direction, the governing differential equations forthe spar and reaction mass are derived in Eq. 25 and Eq. 26 respectively.(m2 +
J
l2
)ξ2 −
(J
l2
)ξ3 + (c2 + c3)(ξ2 − ξ3)− c3ξ3+
(k2 + k3)ξ2 − k3ξ3 = fe2
(25)
(m3 +
J
l2
)ξ3 −
(J
l2
)ξ2 + c3(ξ3 − ξ2) + k3(ξ3 − ξ2) = 0 (26)
Next, we choose to represent the terms proportional to the reaction massacceleration as a function of the ratio of effective mass due to rotation,Jl2
, to the total mass defined as:
η ≡Jl2
Jl2
+m3
(27)
The mass, stiffness, and damping and matrices are formed in Eq. 28,Eq. 29 and Eq. 30. By manipulating Eq. 27 and substituting in to themass matrix, a conversion can be made to express the entries in the massmatrix as a function of the inertial control parameter, η, and the reactionmass, m3.
M23 =
[Jl2
+m2 − Jl2
− Jl2
Jl2
+m3
]
=
[ η1−ηm3 +m2 − η
1−ηm3
− η1−ηm3
11−ηm3
] (28)
K23 =
[k2 + k3 −k3
−k3 k3
](29)
C23 =
[c2 + c3 −c3−c3 c3
](30)
The excitation force vector for the system comprising the spar and thereaction-mass, given by Eq. 31 is similar to Eq. 9, but the entries relatedto the reaction mass are zero because it has no external forcing.
fe23 =
[(m2a01
0
)1
A+
(c2v01
0
)1
A+
(k2
0
)]A (31)
Un-Damped Natural Frequencies
Introducing the reaction mass (body 3) to the spar (body 2) causes thesystem to have two natural frequencies; one above and one below theoriginal natural frequency of the spar-reaction mass system (ω23 given byEq. 5). These two natural frequencies can be found as the square roots ofthe eigenvalues λi associated with mode shape vectorsXi of the dynamicmatrix, D, formed using Eq. 28 and Eq. 29.
D = M−123 K23 (32)
We assemble a modal matrix from each mode shape vector as follows,
X =[X1 X2
](33)
However, for this 2-body (spar-reaction mass) system, the distributionof damping, due to hydrodynamics and the viscous effects within thereaction mass assembly, is not proportional. For a non-proportionallydamped system, the total response of the system may not be a linearcombination of each mode. Hence, further analysis must be done toapproximate the contributions of each natural mode to the steady statesolution. As a result, Fig. 11 can only be used as a rough guide to theunderstanding of the 3-body steady state dynamics. Observing Fig. 12,
0.10.20.30.40.50.6−1
0
1
η
Mod
e X 1
Spar (body 2)Reaction mass (body 3)
0.10.20.30.40.50.6−1
0
1
Mod
e X 2
η
Fig. 11. Normalized natural mode shapes X1 and X2 as a function ofcontrol parameter η
the wave frequency range is always above√λ1, but it is possible that
mode X1 could provide some contribution to the spar motion and thusto the power generation. The natural frequencies (
√λi) are plotted as
a surface against η and k3 in Fig. 13. We observe in Fig. 13 thatvariations of both η and k3 can be used to affect changes in the naturalfrequencies
√λi, and therefore must provide some changes to the steady
state solution. The operating point of the control system would be such
IJOPE-Paper No. January 23, 2009 Beatty 6
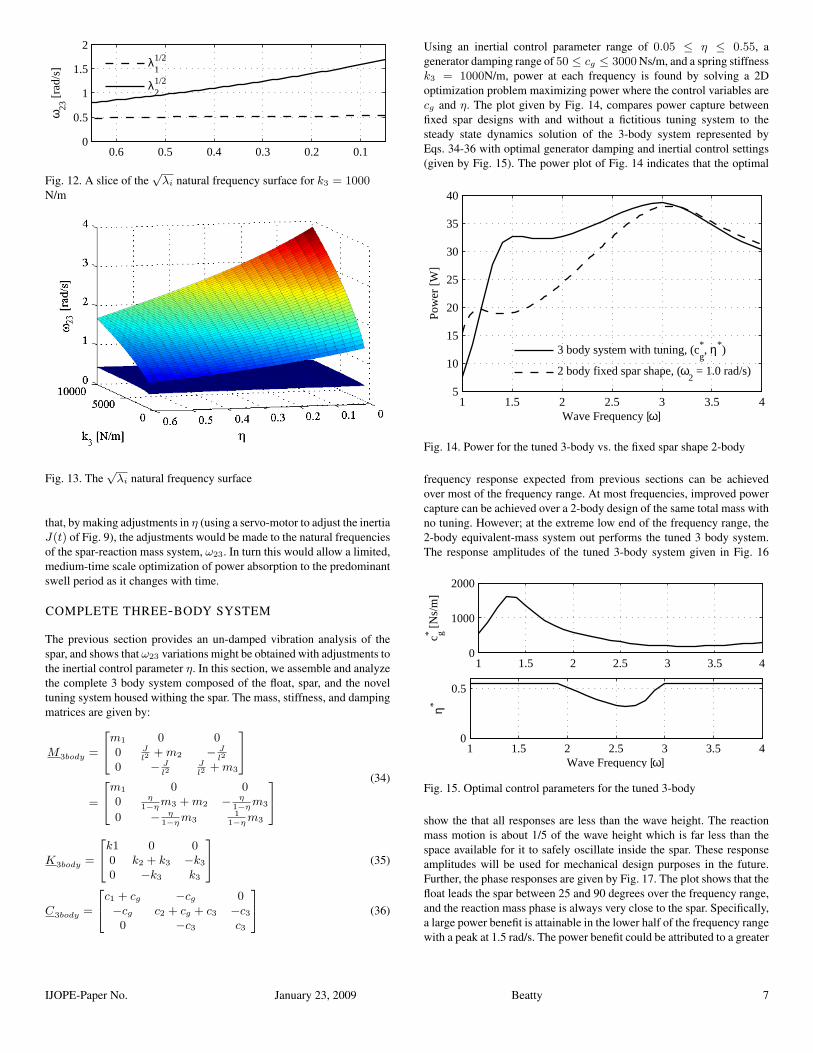
0.10.20.30.40.50.60
0.5
1
1.5
2
η
ω23
[ra
d/s]
λ
11/2
λ21/2
Fig. 12. A slice of the√λi natural frequency surface for k3 = 1000
N/m
Fig. 13. The√λi natural frequency surface
that, by making adjustments in η (using a servo-motor to adjust the inertiaJ(t) of Fig. 9), the adjustments would be made to the natural frequenciesof the spar-reaction mass system, ω23. In turn this would allow a limited,medium-time scale optimization of power absorption to the predominantswell period as it changes with time.
COMPLETE THREE-BODY SYSTEM
The previous section provides an un-damped vibration analysis of thespar, and shows that ω23 variations might be obtained with adjustments tothe inertial control parameter η. In this section, we assemble and analyzethe complete 3 body system composed of the float, spar, and the noveltuning system housed withing the spar. The mass, stiffness, and dampingmatrices are given by:
M3body =
m1 0 00 J
l2+m2 − J
l2
0 − Jl2
Jl2
+m3
=
m1 0 00 η
1−ηm3 +m2 − η1−ηm3
0 − η1−ηm3
11−ηm3
(34)
K3body =
k1 0 00 k2 + k3 −k3
0 −k3 k3
(35)
C3body =
c1 + cg −cg 0−cg c2 + cg + c3 −c30 −c3 c3
(36)
Using an inertial control parameter range of 0.05 ≤ η ≤ 0.55, agenerator damping range of 50 ≤ cg ≤ 3000 Ns/m, and a spring stiffnessk3 = 1000N/m, power at each frequency is found by solving a 2Doptimization problem maximizing power where the control variables arecg and η. The plot given by Fig. 14, compares power capture betweenfixed spar designs with and without a fictitious tuning system to thesteady state dynamics solution of the 3-body system represented byEqs. 34-36 with optimal generator damping and inertial control settings(given by Fig. 15). The power plot of Fig. 14 indicates that the optimal
1 1.5 2 2.5 3 3.5 45
10
15
20
25
30
35
40
Wave Frequency [ω]
Pow
er [
W]
3 body system with tuning, (cg*, η*)
2 body fixed spar shape, (ω2 = 1.0 rad/s)
Fig. 14. Power for the tuned 3-body vs. the fixed spar shape 2-body
frequency response expected from previous sections can be achievedover most of the frequency range. At most frequencies, improved powercapture can be achieved over a 2-body design of the same total mass withno tuning. However; at the extreme low end of the frequency range, the2-body equivalent-mass system out performs the tuned 3 body system.The response amplitudes of the tuned 3-body system given in Fig. 16
1 1.5 2 2.5 3 3.5 40
1000
2000
c g* [N
s/m
]
1 1.5 2 2.5 3 3.5 40
0.5
η*
Wave Frequency [ω]
Fig. 15. Optimal control parameters for the tuned 3-body
show the that all responses are less than the wave height. The reactionmass motion is about 1/5 of the wave height which is far less than thespace available for it to safely oscillate inside the spar. These responseamplitudes will be used for mechanical design purposes in the future.Further, the phase responses are given by Fig. 17. The plot shows that thefloat leads the spar between 25 and 90 degrees over the frequency range,and the reaction mass phase is always very close to the spar. Specifically,a large power benefit is attainable in the lower half of the frequency rangewith a peak at 1.5 rad/s. The power benefit could be attributed to a greater
IJOPE-Paper No. January 23, 2009 Beatty 7

1 1.5 2 2.5 3 3.5 40
0.1
0.2
0.3
0.4
ω [rad/s]
ξ i [m
]
ξ
1
ξ2
ξ3
ξ1/2
Fig. 16. Tuned 3-body response amplitudes (wave height H = 0.5m)
1 1.5 2 2.5 3 3.5 4−200
−150
−100
−50
0
50
100
ω [rad/s]
φ [d
eg]
φ1
φ2
φ3
φ1/2
Fig. 17. Tuned 3-body response phases
contribution of mode X1 associated with eigenvalue λ1, to the steadystate heave displacement solution. This performance benefit would havea drastic effect on the overall performance of a full-scale device sincethese waves correspond to much more energetic ocean waves. The designand tuning methodology presented allows an a priori selection of the sparand float shapes and sizes to target higher frequency waves that normallyoccur in the summer months and then rely on frequency response tuningto capture more energy energy from the lower frequency waves whichnormally occur in the winter months.
CONCLUSIONS
The effects of natural frequency adjustment of the spar of a two-body “spar-float” heaving point absorber have been investigated usinga simplified heaving dynamics model. The results have been shown in
terms of relative motion for an un-coupled WEC, and power absorptionfor a coupled WEC. The output of an optimization has provided thechoice for both the spar natural frequency and viscous power take-off damping coefficient. Results from this design study indicate thatsignificant power absorption improvements at low frequencies could bederived (over an un-controlled WEC of the same mass) if a system couldbe developed to alter the frequency response of the spar. Subsequently,a description and analysis of a novel mechanical system for use with areaction mass to provide frequency response tuning capability was givenwhich is predicted provide power absorption improvements of upto 80%in a critical area of the wave frequency range.
ACKNOWLEDGMENTS
This work was funded by Mathematics of Information Technologyand Complex Systems (MITACS) under an ACCELERATE BC Intern-ship program, the National Science and Engineering Research Council(NSERC), and SyncWave Energy Inc.
REFERENCES
Alves, RM, and Batista, RC (1999). “Active/passive control of heavemotion for TLP type offshore platform,” Proceedings of theInternational Offshore and Polar Engineering Conference, vol. 1, pp.332–338.
Beatty, SJ, Buckham, B, and Wild, P (2007). “Modeling, Designand Testing of a Two-Body Heaving Wave Energy Converter,” inProceedings of the International Society of Offshore and PolarEngineers, ISOPE 2007, Lisbon Portugal.
Bjarte-Larsson, T, and Falnes, J (2001). “Long-wavelength approxima-tion of wave force on two-body axisymmetric system,” in Proceedingsof the International Offshore and Polar Engineering Conference,Stavanger, Norway, vol. 3, pp. 244–249.
Bracewell, RH (1990). Frog and PS Frog: A Study of Two ReactionlessOcean Wave Energy Converters, Ph.D. thesis, Lancaster University.
Clauss, G, Lehmann, E, and Ostergaard, C (1992). Offshore Structures -Conceptual design and hydromechanics, vol. 1, Springer-Verlag.
Falnes, J (2002). Ocean Waves and Oscillating Systems: LinearInteractions including Wave Energy Extraction, Cambridge UniversityPress.
Gerber, J (2007). “United States Patent Application No. US2007/0068153 A1 - Tunable Wave Energy Converter,” USPTO.
Korde, UA (1999). “On providing a reaction for efficient wave energyabsorption by floating devices,” Applied Ocean Research, vol. 21,no. 5, pp. 235–248.
Protter, N, Beatty, SJ, and Buckham, BJ (2007). “PCT PATENT NO.WO 2007/137426 A1 - Wave Energy Converter,” World IntellectualProperty Organization.
IJOPE-Paper No. January 23, 2009 Beatty 8

66
Appendix C
Integration of a Wave Energy Converter into the
Electricity Supply of a Remote Alaskan Island
Integration of a wave energy converter into the electricity supply of aremote Alaskan island
Scott J. Beattya,∗, Peter Wilda, Bradley J. Buckhama
aUniversity of Victoria, Department of Mechanical Engineering, PO Box 3055, Stn. CSC, Victoria, BC,V8W 3P6, Canada
Abstract
The electrical power integration of a heaving point absorber wave energy converter to a remoteisland community of population 100 is investigated. A wave resource assessment, taking intoaccount the local geography, is completed. The operational concept and specifications of thewave energy converter are presented. A detailed description of the frequency domain modellingand control approach used to estimate in situ performance of the wave energy converteris given. Time series comparisons are made between wave power capture and communityelectrical demand. Analyses of electrical grid penetration ratios suggest that a deploymentof a single offshore wave energy converter of 100kW capacity could be a feasible renewableelectricity source for the island.
Key words: Wave energy, grid integration, point absorber, marine energy
Nomenclature
A wave amplitudeAj amplitude of the jth frequency component in the spectrumC WEC damping matrixE total energy per unit surface area of a sea-stateEdem total community electrical energy demand [Joules]Ewec total electrical energy delivered by WEC [Joules]H height of a regular (monochromatic) wave, H = 2AH(ω)1/2 relative motion transfer functionHs significant wave heightHdir primary wave directionJ rotational inertiaK WEC stiffness matrixM WEC mass matrixN number of spectral componentsP (Hs, ωp) WEC power capture in irregular seastate defined by (Hs, ωp)P (ω) WEC power capture in the frequency domainPdem community electrical power demand [Watts]
∗Corresponding author. Tel: 1-250-472-4903; Fax: 1-250-721-6051.Email addresses: [email protected] (Scott J. Beatty)
Preprint submitted to Elsevier March 17, 2009

Pwec electrical energy delivered by WEC [Watts]S(ω) wave spectral density [m2/ rad
s ]S(ω)s structural response spectral densityTe energy periodTp peak wave period∆ω frequency bin widthξ1, ξ2, ξ3 complex amplitude displacement of float, spar, slug respectivelyξ1/2 complex amplitude of float to spar relative displacementa01, a02 fluid acceleration at depth zP1, zP2 respectivelyv01, v02 fluid velocity at depth zP1, zP2 respectivelyµ generation efficiencyω frequency of a regular (monochromatic) waveωj frequency of the jth component in the wave spectrumωp peak frequency, ωp = 2π/Tp
ρ water density ≈ 1020 [kg/m3]~fe excitation force vector~x vector of body displacementsc1, c2, c3 damping coefficient of float, spar, slug respectivelycg generator damping coefficientc∗g(H,ω) optimal generator damping coefficientg acceleration due to gravityh water depthi imaginary numberj index for spectral components (jth component)k wave numberk1, k2, k3 (hydrostatic) stiffness of float, spar, slug respectivelyl ballscrew lead in meters per radianm1,m2,m3 mass of float, spar, slug respectivelym∗4(H,ω) optimal inertial control parametermn nth spectral momentzP1, zP2 reference depth for float, spar resepectively
1. Introduction
St. George Island (population 100) is part of the Pribilof Island group located in theBering Sea, 350 km North of the Aleutian Islands. This is an extremely isolated locationwhere fishing is the primary commercial activity. The residents of St. George Island, areinvestigating possible uses of renewable energy to reduce the financial and environmentalcosts associated with their current dependence on electricity derived from the combustion ofdiesel fuel. Part of this investigation is focused on the use of the plentiful ocean wave energyresource of the region. Researchers at the University of Victoria and SyncWave Systems Inc.have conducted an initial study of the application of their co-developed wave energy converter(WEC) technology for electricity supply to the St.George Island electrical grid.
Several previous studies have investigated the feasibility of interconnection of wave powerdevices, mainly with medium-sized communities. Babarit et al [1] investigated the potentialsynergy of wind energy and wave energy (applying their SeaREV device) with various storage
2

scenarios. They discuss the potential for improved energy independence through a study ofimport/export balance of electricity supply for a French island community of 5000 inhabitants.St. Germain [2] simulated the connection of various WEC devices to a coastal communitygrid in Western Canada with various storage scenarios. The feasibility of wave energy isdiscussed in terms of grid capacity issues and economics. Dunnet and Wallace [3] provide ageneral comparative performance evaluation of representative WEC’s at various locations onCanada’s coasts for which wave buoy is available from the Canadian Marine EnvironmentalData Service. They indicate the most economical locations using economic analyses of thedevices, but do not consider community interconnection issues other than proximity to urbancenters.
Many studies have been done on hybrid renewable energy/diesel systems for remote com-munities. Singal et al [4] investigated the economic feasibility of the replacement of a PV-dieselsystem with a system with biogas, biomass gasification, and solar PV sources to a group ofislands in India. Dalton et al [5] provide a feasibility analysis of using Wind and solar PVsources to offset diesel generation for remotely located tourist accommodations. They use netpresent cost and payback time as indicators to rate different storage scenarios while reportingsensitivities to carbon taxes and diesel fuel price variation.
Singal et al [4], Dalton et al [5] and numerous other studies show that the integration ofwell-established renewable energy technologies with small scale loads is not only technicallymanageable due to the dispatchability of diesel generation, but also is economical due to thehigh cost of diesel generation.
Currently, wave energy technology is not well-established and the installed cost of elec-tricity from wave energy converters is high in comparison to other renewable sources. Ac-celeration of wave energy research activity, successful ocean deployments, and convergenceto standardized designs are all expected to improve trust in the technology and significantlyreduce installed wave energy costs worldwide. However, if progress is to be made, wave en-ergy proponents must deal with the present socio-economic landscape, and identify currentfinancially realistic applications of the technology.
The goal of this study is to assess the technical feasibility of a WEC connection to theisland of St. George. Further, this study is intended to lay the foundation for investigationsof specific design and control elements required for wave/diesel hybridization of small remoteelectrical grids. Calculated from a relatively robust estimations of the wave resource anddevice performance, grid penetration levels and fuel savings estimates are used as metrics forthe feasibility analysis.
First, a detailed wave resource assessment is completed for evaluation of wave power cap-ture. The most likely deployment location is chosen in consideration of various constraints,both general and site specific, associated with the offshore WEC. Next, descriptions of theWEC device operation and mechanical systems are presented. The in situ performance ofthe wave energy converter is computed at the deployment location by interpolation of powercapture results obtained using previously developed WEC dynamics models [6]. Lastly, timeseries of the electrical demand and WEC power delivery are compared in terms of grid pene-tration ratios.
3
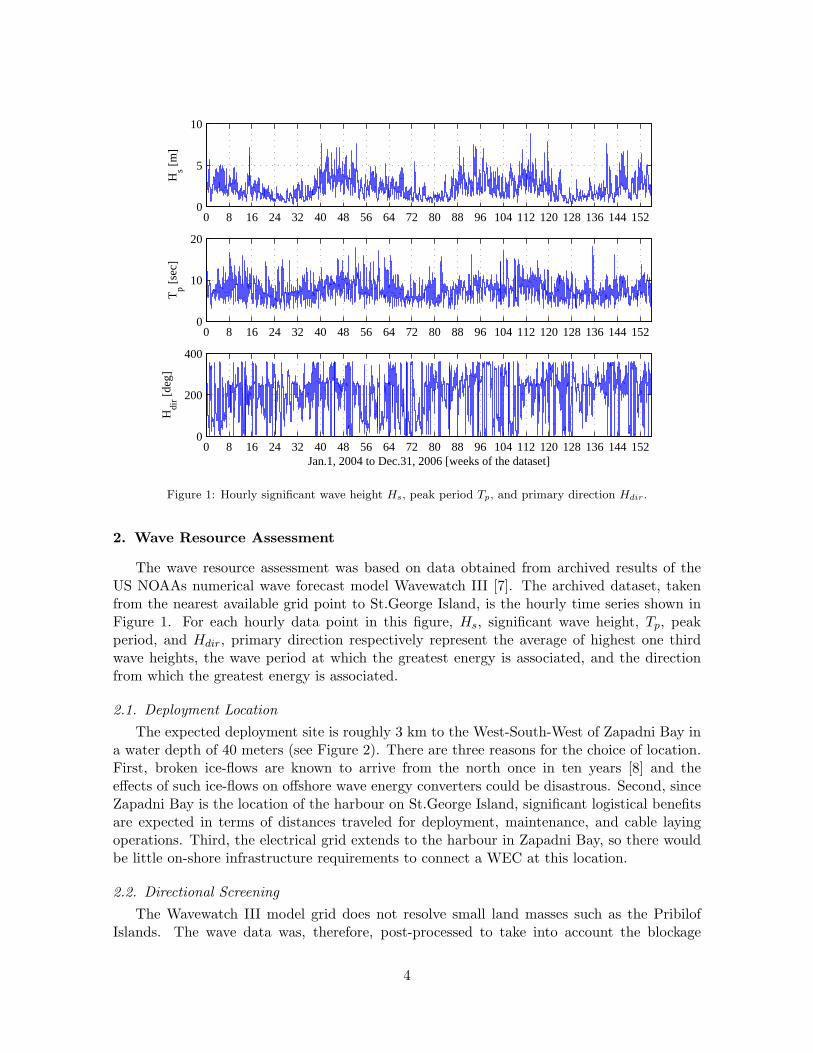
0 8 16 24 32 40 48 56 64 72 80 88 96 104 112 120 128 136 144 1520
5
10
Hs [
m]
0 8 16 24 32 40 48 56 64 72 80 88 96 104 112 120 128 136 144 1520
10
20
Tp [
sec]
0 8 16 24 32 40 48 56 64 72 80 88 96 104 112 120 128 136 144 1520
200
400
Jan.1, 2004 to Dec.31, 2006 [weeks of the dataset]
Hdi
r [de
g]
Figure 1: Hourly significant wave height Hs, peak period Tp, and primary direction Hdir.
2. Wave Resource Assessment
The wave resource assessment was based on data obtained from archived results of theUS NOAAs numerical wave forecast model Wavewatch III [7]. The archived dataset, takenfrom the nearest available grid point to St.George Island, is the hourly time series shown inFigure 1. For each hourly data point in this figure, Hs, significant wave height, Tp, peakperiod, and Hdir, primary direction respectively represent the average of highest one thirdwave heights, the wave period at which the greatest energy is associated, and the directionfrom which the greatest energy is associated.
2.1. Deployment LocationThe expected deployment site is roughly 3 km to the West-South-West of Zapadni Bay in
a water depth of 40 meters (see Figure 2). There are three reasons for the choice of location.First, broken ice-flows are known to arrive from the north once in ten years [8] and theeffects of such ice-flows on offshore wave energy converters could be disastrous. Second, sinceZapadni Bay is the location of the harbour on St.George Island, significant logistical benefitsare expected in terms of distances traveled for deployment, maintenance, and cable layingoperations. Third, the electrical grid extends to the harbour in Zapadni Bay, so there wouldbe little on-shore infrastructure requirements to connect a WEC at this location.
2.2. Directional ScreeningThe Wavewatch III model grid does not resolve small land masses such as the Pribilof
Islands. The wave data was, therefore, post-processed to take into account the blockage
4

Figure 2: Nautical Chart indicating deployment location and Wavewatch III grid point with respect to St.George Island. Lines outward from deployment location indicate screening directions in degrees relative to truenorth. Depth soundings are in fathoms. Image Courtesy of the US National Oceanographic and AtmosphericAssociation(NOAA)[9]. Do not use for navigational purposes.
5
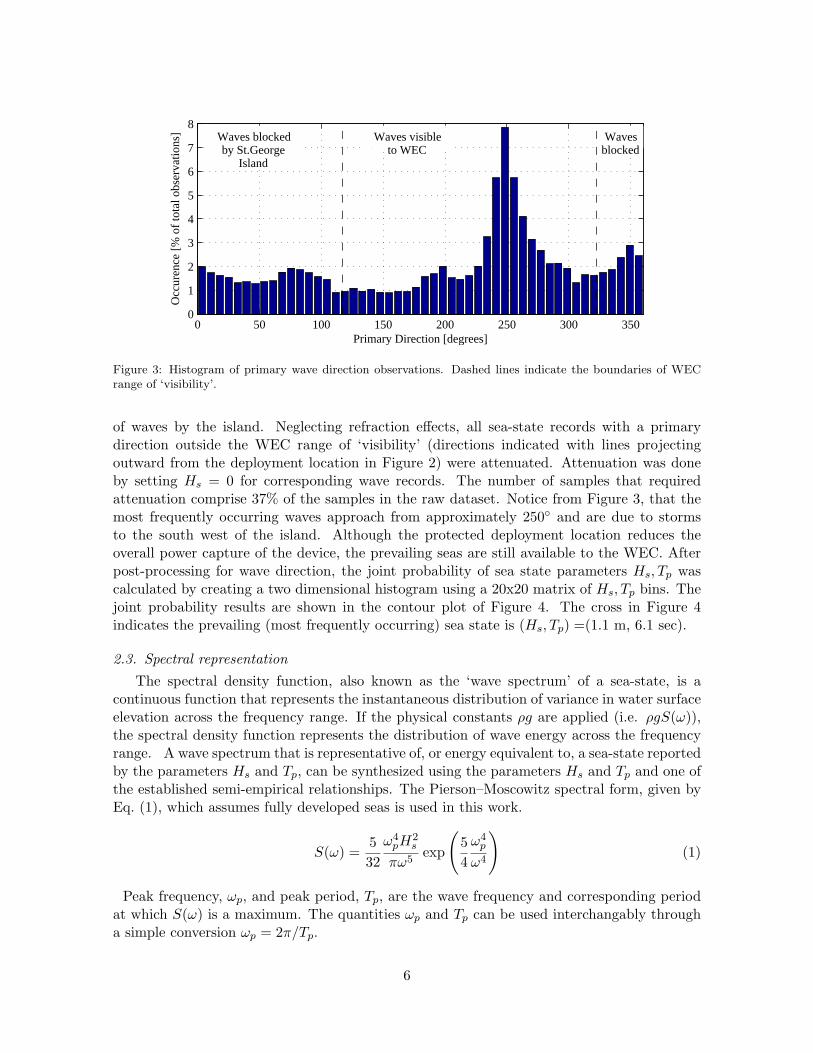
0 50 100 150 200 250 300 3500
1
2
3
4
5
6
7
8
Primary Direction [degrees]
Occ
uren
ce [
% o
f to
tal o
bser
vatio
ns] Waves blocked
by St.GeorgeIsland
Waves visibleto WEC
Wavesblocked
Figure 3: Histogram of primary wave direction observations. Dashed lines indicate the boundaries of WECrange of ‘visibility’.
of waves by the island. Neglecting refraction effects, all sea-state records with a primarydirection outside the WEC range of ‘visibility’ (directions indicated with lines projectingoutward from the deployment location in Figure 2) were attenuated. Attenuation was doneby setting Hs = 0 for corresponding wave records. The number of samples that requiredattenuation comprise 37% of the samples in the raw dataset. Notice from Figure 3, that themost frequently occurring waves approach from approximately 250 and are due to stormsto the south west of the island. Although the protected deployment location reduces theoverall power capture of the device, the prevailing seas are still available to the WEC. Afterpost-processing for wave direction, the joint probability of sea state parameters Hs, Tp wascalculated by creating a two dimensional histogram using a 20x20 matrix of Hs, Tp bins. Thejoint probability results are shown in the contour plot of Figure 4. The cross in Figure 4indicates the prevailing (most frequently occurring) sea state is (Hs, Tp) =(1.1 m, 6.1 sec).
2.3. Spectral representationThe spectral density function, also known as the ‘wave spectrum’ of a sea-state, is a
continuous function that represents the instantaneous distribution of variance in water surfaceelevation across the frequency range. If the physical constants ρg are applied (i.e. ρgS(ω)),the spectral density function represents the distribution of wave energy across the frequencyrange. A wave spectrum that is representative of, or energy equivalent to, a sea-state reportedby the parameters Hs and Tp, can be synthesized using the parameters Hs and Tp and one ofthe established semi-empirical relationships. The Pierson–Moscowitz spectral form, given byEq. (1), which assumes fully developed seas is used in this work.
S(ω) =532ω4
pH2s
πω5exp
(54ω4
p
ω4
)(1)
Peak frequency, ωp, and peak period, Tp, are the wave frequency and corresponding periodat which S(ω) is a maximum. The quantities ωp and Tp can be used interchangably througha simple conversion ωp = 2π/Tp.
6

3 4 5 6 7 8 9 10 11 12 13 140.5
1
1.5
2
2.5
3
3.5
4
4.5
5
5.5
Peak Period Tp [sec]
Sign
ific
ant W
ave
Hei
ght H
s [m
]
0.2
0.2
0.2
0.2
0.2
0.6
1
1.4
0.60.2
1
0.6
0.6
0.2
Figure 4: Joint probability of Hs and Tp. Contour labels indicate the percent occurrence in the dataset. Thecross indicates the prevailing sea state inside the 1.8% contour.
For practical purposes, the continuous spectral density function must be discretized intoN frequency components, each of width ∆ω. To obtain the amplitude of the wave associatedwith the jth frequency component, one must use Eq. (2):
12A2
j = S(ωj)∆ω (2)
Moments of the spectral density function are used for fitting of spectral forms to discretewave measurements. The nth moment, in continuous and discrete forms [10], is given byEq. (3).
mn =∫ ∞
0ωnS(ω)dω =
N∑
j=1
ωnj S(ωj)∆ω (3)
The total energy per unit surface area in the sea-state is directly proportional to the zerothmoment, the area under the spectral density function, as shown in continuous and discreteforms by Eq. (4).
E = ρgm0 = ρg
∫ ∞
0S(ω)dω = ρg
N∑
j=1
S(ωj)∆ω (4)
The mathematical definition of significant wave height, follows from the zeroth moment of
7
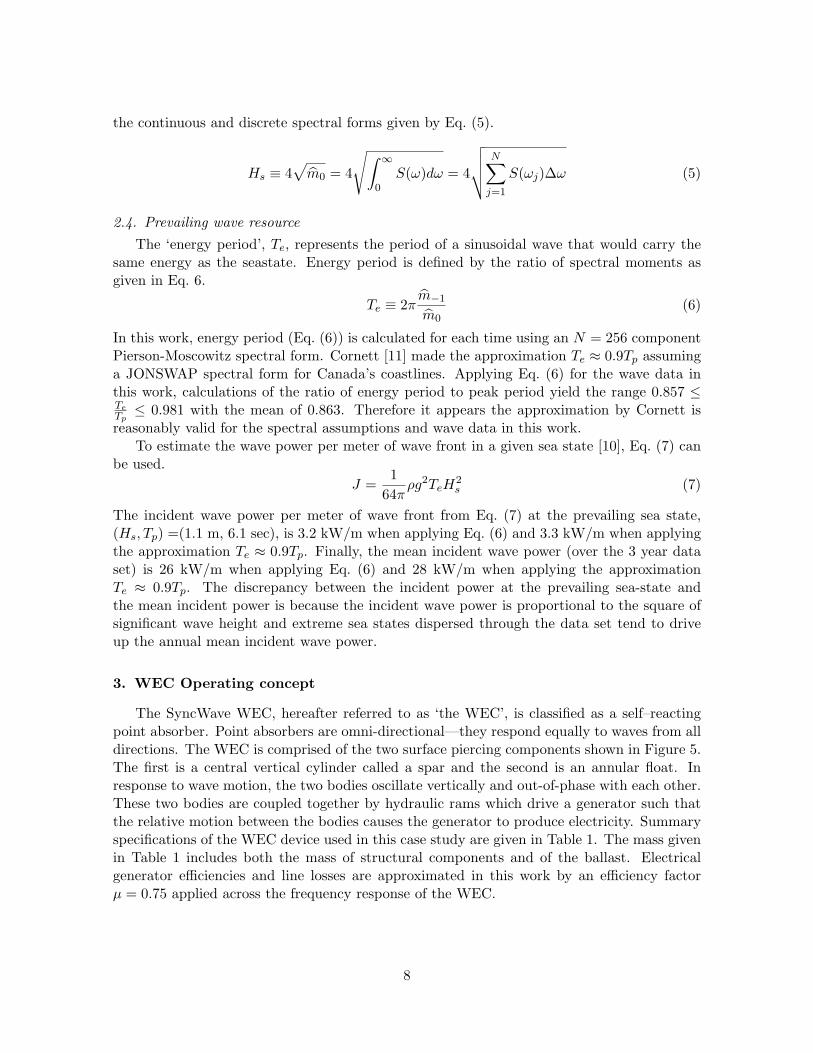
the continuous and discrete spectral forms given by Eq. (5).
Hs ≡ 4√m0 = 4
√∫ ∞
0S(ω)dω = 4
√√√√N∑
j=1
S(ωj)∆ω (5)
2.4. Prevailing wave resourceThe ‘energy period’, Te, represents the period of a sinusoidal wave that would carry the
same energy as the seastate. Energy period is defined by the ratio of spectral moments asgiven in Eq. 6.
Te ≡ 2πm−1
m0(6)
In this work, energy period (Eq. (6)) is calculated for each time using an N = 256 componentPierson-Moscowitz spectral form. Cornett [11] made the approximation Te ≈ 0.9Tp assuminga JONSWAP spectral form for Canada’s coastlines. Applying Eq. (6) for the wave data inthis work, calculations of the ratio of energy period to peak period yield the range 0.857 ≤TeTp≤ 0.981 with the mean of 0.863. Therefore it appears the approximation by Cornett is
reasonably valid for the spectral assumptions and wave data in this work.To estimate the wave power per meter of wave front in a given sea state [10], Eq. (7) can
be used.J =
164π
ρg2TeH2s (7)
The incident wave power per meter of wave front from Eq. (7) at the prevailing sea state,(Hs, Tp) =(1.1 m, 6.1 sec), is 3.2 kW/m when applying Eq. (6) and 3.3 kW/m when applyingthe approximation Te ≈ 0.9Tp. Finally, the mean incident wave power (over the 3 year dataset) is 26 kW/m when applying Eq. (6) and 28 kW/m when applying the approximationTe ≈ 0.9Tp. The discrepancy between the incident power at the prevailing sea-state andthe mean incident power is because the incident wave power is proportional to the square ofsignificant wave height and extreme sea states dispersed through the data set tend to driveup the annual mean incident wave power.
3. WEC Operating concept
The SyncWave WEC, hereafter referred to as ‘the WEC’, is classified as a self–reactingpoint absorber. Point absorbers are omni-directional—they respond equally to waves from alldirections. The WEC is comprised of the two surface piercing components shown in Figure 5.The first is a central vertical cylinder called a spar and the second is an annular float. Inresponse to wave motion, the two bodies oscillate vertically and out-of-phase with each other.These two bodies are coupled together by hydraulic rams which drive a generator such thatthe relative motion between the bodies causes the generator to produce electricity. Summaryspecifications of the WEC device used in this case study are given in Table 1. The mass givenin Table 1 includes both the mass of structural components and of the ballast. Electricalgenerator efficiencies and line losses are approximated in this work by an efficiency factorµ = 0.75 applied across the frequency response of the WEC.
8

PowerTake-Off
Float
Spar
SpringSupport
ReactionMass withIntegralBall-nut
Ballscrew
RotationalSystem
Figure 5: Schematic of the WEC.
9

Table 1: WEC Design Specifications
Parameter ValueMass of structure 166,000 kgOuter diameter 5 mDraft 30 mCapacity 100 kW
3.1. Frequency Response TuningTo maximize power production, the WEC is actively tuned to ensure that its response is
approximately optimal over the range of most probable sea-states. The tuning system is alsoused to ensure device survival in extreme sea-states. If un-controlled during storm events, therelative motion between components could be excessively high, potentially leading to damageto the WEC.
In addition to adjustments made to the generator, mechanical adjustments are madeto an inertial tuning system housed within the spar. As shown by Figure 5, an internallyhoused, spring-supported, reaction mass is coupled to a rotational system using a ballscrewconnection. By way of a mechanical linkage, adjustments can be made to the inertia of therotational system. This, in turn, affects the dynamic behavior of the WEC by changingthe inertial resistance to relative motion of the slug within the spar and, consequently, theresistance to extension/compression of the spring support. In terms of the device dynamicsmodel, changes are the J/l2 entries in the mass matrix given by Eq. (10). Further detail onthe inertial control system can be found in previous contributions [6, 12].
4. Computation of in situ WEC performance
In this section, the detailed computations required to estimate the WEC power captureare presented in the following steps.
1. A linear dynamics model in the frequency domain is established for the device.2. Optimization is used to establish control schedules to maximize power capture.3. Control schedules are interpolated for calculation of power capture in irregular waves.4. WEC Power delivery is computed for each hourly sea-state in the wave data.
4.1. Dynamics modelPredictions of the float, spar, and reaction mass responses to incoming waves are made
using a heave-constrained, linear dynamics model in the frequency domain. The model yieldsthe resulting motions and power capture in response to a regular wave of amplitude A andfrequency ω. The dynamics model represents the three-body system consisting of the float(body 1), spar (body 2), reaction mass (body 3), and the rotational system with moment ofinertia, J kgm2 , ballscrew lead, l in meters displacement per radian of rotation. The vectorof body displacements is defined as follows.
~x =
ξ1(t)ξ2(t)ξ3(t)
(8)
10

The governing dynamics equation, Eq. (9), follows:
M~x+ C~x+K~x = ~fe (9)
The mass, stiffness, and damping and matrices, given in Eqs. (10-12), were developedpreviously in [13].
M =
m1 0 00 J
l2+m2 − J
l2
0 − Jl2
Jl2
+m3
(10)
K =
k1 0 00 k2 + k3 −k3
0 −k3 k3
(11)
C =
c1 + cg −cg 0−cg c2 + cg + c3 −c3
0 −c3 c3
(12)
The wave excitation force vector for the system is given by Eq. (13). The third row entries(associated with the reaction mass) are zero because it is internally housed within the sparand thereofre has no external wave forcing.
~fe =
m1a01
m2a02
0
1A
+
c1v01
c2v02
0
1A
+
k1
k2
0
A (13)
The fluid velocity and accelerations, v01, v02 in Eq. 15 and a01, a02 in Eq. 14 respectively,established from Airy wave theory, are evaluated at “reference depths” zP1, zP2 for the floatand spar. This is a common approach to the wave excitation force calculation for offshorestructures [14, 15]. The wavenumber, k, is obtained from an iterative solution to the dispersionrelation, calculated for each wave frequency ω considered.
a01 = −ω2 sinh(kzP1 + kh)sinh(kh)
A, a02 = −ω2 sinh(kzP2 + kh)sinh(kh)
A (14)
v01 = iωsinh(kzP1 + kh)
sinh(kh)A, v02 = iω
sinh(kzP2 + kh)sinh(kh)
A (15)
The reference depth for any cylindrical body is assumed to be equal to its draft; However,the reference depth for a composite shape, such as the spar design given by Fig. 5, may beapproximated by a weighted average of the protruding areas normal to the heave direction [13].Assuming all bodies undergo steady state sinusoidal oscillations at the wave frequency ω,Eq. (9) becomes:
[−ω2M + iωC +K]
ξ1ξ2ξ3
=
m1a01
m2a02
0
1A
+
c1v01
c2v02
0
1A
+
k1
k2
0
A
(16)
11

An analytical solution, in terms of the complex amplitudes of the heaving displacements isfound by matrix inversion of the combined dynamic matrix on the LHS of Eq. (16) multipliedby ~fe. An analytical expression for the relative float-spar displacement is found by Eq. 17.
ξ1/2(ω) = ξ1(ω)− ξ2(ω) (17)
Finally, applying the assumed power-take-off and transmission line efficiency µ, the WECpower delivery in the frequency domain is given by Eq. (18).
P (ω) = µ12ω2cg|ξ1/2(ω)|2 (18)
4.2. Frequency domain control optimizationA Sequential Quadratic Programming algorithm is used maximize power capture as given
by Eq. (18). The first control variable is the generator damping coefficient, denoted cg. Thesecond control variable is an inertial control parameter, denoted m4, which is related to therotational system inertia J and ballscrew lead l by Eq. (19). The inertial control parameter,intuitively expressed in units of kilograms, represents the ‘effective mass due to the rotationalsystem.’
m4 ≡J
l2(19)
The constraints on the optimization consist of range limits on the decision variables and non-linear travel constraints to mitigate excessive relative motion between the WEC components,which could result in catastrophic failures.
The converged solutions of the optimization are used as ‘schedules’ for operation of theWEC across the domain of wave frequencies. Specifically, the optimal generator intensityand inertial control parameter which are functions of both wave height H = 2A and wavefrequency ω are denoted c∗g(H,ω) and m∗4(H,ω) respectively. They are plotted as surfaces inFigures 6 and 7 respectively.
4.3. Application of optimal control resultsTo apply the optimal control results from the frequency domain (which assume regular
waves), to the irregular wave fields, the surfaces shown in Figures 6 and 7 are interpolated atthe Hs and ωp = 2π/Tp pairing to yield the control decisions c∗g(Hs, ωp) and m∗4(Hs, ωp) forthat hour. Note that the Hs and ωp pairing are stochastic sea-state parameters taken froman observed or modelled wave spectrum; whereas the horizontal axes of Figures 6 and 7, Hand ω, are simple parameters to represent a regular (sinusoidal) wave.
Sea-states often occur that do not fit semi-empirical spectral forms, such as double peakedspectra arising from multiple storms, which would render the above control method non-optimal. However, because single peaked spectra are assumed for this study, the chosenmethod for control decisions is considered adequate to assess the general in situ performanceof the WEC. Optimal control of WECs in complex seas-states is an important subject ofongoing research [16, 17] but it outside the scope of this work.
12

H [m]
ω [
rad/
s]
0.5 1.5 2.5 3.5 4.5 5.5 6.5 7.5 8.50.35
0.45
0.55
0.65
0.75
0.85
0.95
1.05
1.15
1.25
1.35
1.45
c g [N
s/m
]
1
2
3
4
5
6
7
8
9
10x 10
5
Figure 6: Constrained optimal generator damping schedule
H [m]
ω [
rad/
s]
0.5 1.5 2.5 3.5 4.5 5.5 6.5 7.5 8.50.35
0.45
0.55
0.65
0.75
0.85
0.95
1.05
1.15
1.25
1.35
1.45
m4 [
kg]
0.6
0.8
1
1.2
1.4
1.6
1.8
2
2.2
2.4x 10
6
Figure 7: Constrained optimal rotational inertia schedule
13

4.4. Performance estimation in irregular wavesTo establish an irregular wave field, a discretized Pierson–Moscowitz spectrum with fre-
quency 256 components (N = 256), S(ω) is obtained for each of the hourly sea-state records(Hs, Tp) by evaluating Eq. (1), as discussed in Section 2.3. The wave frequency range used isthe typical range observed in the ocean (0.2 ≤ ω ≤ 2.0 rad/s).
To estimate the WEC displacements, a normalized transfer function is obtained fromEq. (17), referred to as a response amplitude operator (RAO), by applying c∗g(Hs, ωp) andm∗4(Hs, ωp) in Eq. (9).
|H(ω)1/2| =ξ(ω)1/2
A= RAO1/2 (20)
The wave spectral density can be multiplied by the square of the RAO to obtain the WECresponse spectrum S(ω)s.
S(ω)s = |H(ω)1/2|2S(ω) (21)
The method of Eq. (21) is commonly used in the analysis of floating offshore structures.Further details regarding the usage and implicit assumptions to the equation can be found in[15] and [18]. The power associated with each of the N wave components in a sea-state is afunction of the relative motion response. By summing power contributions (each of the formof Eq. (18)) for each wave component, and utilizing Eq. (2), an equation for the mean powercapture from the irregular wave field defined by (Hs, ωp) is derived.
P (Hs, ωp) = µ12c∗g(Hs, ωp)
N∑
j=1
ω2j 2S(ωj)s∆ω (22)
If Eq. (21) is substituted into Eq. (22), the final relationship is:
P (Hs, ωp) = µ12c∗g(Hs, ωp)
N∑
j=1
ω2j |H(ωj)1/2|22S(ωj)∆ω (23)
Using the relative motion and optimal power take-off and frequency response control sched-ules, WEC power capture estimates are made for a range of sea-states, resulting in a WECproduction matrix. The normalized production matrix is provided by Fig. 8, which providespower capture in kW, as a function of sea state (Hs, Tp) or (Hs, ωp). The production matrixis interpolated using the hourly sea-state data, in the form (Hs(t), Tp(t)), as discussed in Sec-tion 2 to yield a time series of WEC power delivery (see Fig. 9). The production matrix ofFigure 8 has been interpolated over the directionally screened wave data to find the hourlyoutput of the device during the years 2004 through 2007. Figure 9 shows that the maximumoutput reaches the capacity limit of 100kW and that the average output is 13kW, so theaverage capacity factor is 0.13.
5. St. George Island generating system
St. George Island’s electrical power is currently supplied by four generators in total– two175 kW units, one 350kW unit, and one 200kW unit [8]. In 2007, the diesel fuel cost forthe island inhabitants was $US 1.32 per litre ($US 5.00 per US gallon) and the approximateoverall fuel efficiency of the diesel generation system is 1.98 kWh per litre (7.5 kWh per USgallon).
14

Tp [sec]
Hs [
m]
5 6 7 8 9 10 11 12 13 14 15 16
1
2
3
4
5
6
7
8
0
0.1
0.2
0.3
0.4
0.5
0.6
0.7
0.8
0.9
1
Figure 8: Normalized power capture vs sea-state for the WEC.
0 50 100 1500
20
40
60
80
100
120
Jan. 1 2004 − Dec. 31 2006 [weeks]
Ave
rage
pow
er a
bsor
ptio
n [k
W] MEAN = 13kW
Figure 9: Simulated power capture for a single WEC unit.
15

1 2 3 4 5 6 7 8 9 10 11 12 13 14 15 16 17 18 19 20 21 22 23 24
50
75
100
125
150
175
200
225
250
275
300
Time [hrs]
Loa
d [k
W]
Typical Winter DayTypical Summer Day
Figure 10: Daily electrical demand profiles derived from [19].
5.1. Community electrical loadA summary of the overall electrical demand, as reported by the Mayor and Public Works
manager of St.George during personal communication [8], is given by Table 2. An airstrip onthe island intermittently demands up to 150 kW. One or more of the generators is manuallyramped up and down by a human operator during aircraft take-off and landing, to power therunway lighting.
Table 2: St. George Island Electrical demand summary
Summer WinterMinimum 70 kW 150 kWAverage 160 kW 200 kW
Peak 200 kW 300 kW
Because an hourly (rather than seasonal) data source for community load was required,the community load was also synthesized using the Alaska Village Electric Load Calculator,developed by NREL [19], which uses community census data [20] to scale typical Alaskanvillage load profiles. The output of the calculator is hourly load data for a typical year.For this study, the community load is simply repeated for three years to match the lengthof the wave data time series. The final result is an approximate set of electrical demanddata extending from from Jan.1, 2004 to Dec.31, 2006. The demand profiles in the summerand winter are shown by Figure 10. As a check, the synthesized data reflect fairly closelythe summary data provided in Table 2. It is believed that this fabricated time series is areasonable approximation to the true demand profiles, within 10% error according to [19].
16

0 8 16 24 32 40 48 56 64 72 80 88 96 104 112 120 128 136 144 1520
50
100
150
200
250
300
350
Pow
er [k
W]
Jan. 1, 2004 − Dec. 31, 2006 [weeks of the dataset]
W04 W05 W06S04 S05 S06F04 F05 F06
Demand
WECPower
Figure 11: Longterm WEC and Demand comparisons.
6. Comparison of WEC power capture to community loads
6.1. Time-seriesCommunity demand is compared directly to the WEC electrical power generation over the
entire time series in Figure 11. Note that the wave power follows a similar seasonal variationas the demand–the wave power is at a maximum when the energy is required most. Althoughthe wave power roughly follows the trend of electrical demand, during the fall of each year,wave power ramps up much faster than electrical demand, causing potential for instantaneouspower penetration to exceed 100%. During extreme seas, the 100kW capacity limit is reached.
Time series comparisons of WEC power capture to electrical demand are made for tenweeks in the summer, fall, and winter in Figures 12, 13, and 14 respectively. During thesummer seasons (labelled S04, S05, S06 in Figures 11 and 12), both electrical demand andwave power capture are at a minimum. Summer maximum penetrations levels are on theorder of 60%. During the fall seasons (labelled F04, F05, F06 in 11 and Figures 13), thecommunity electrical demand is at an average level but wave power capture is at a maximum.The resulting maximum instantaneous penetration levels are shown to be 120%. During thewinter seasons (labelled W04, W05, W06 in Figures 11 and 14), the community electricaldemand is at a maximum, the wave power is at its peak availability, and maximum powerpenetrations are on the order of 75%.
17

24 25 26 27 28 29 30 31 32 33 340
100
200
300
S04 − Summer 2004 [weeks]
kW
76 77 78 79 80 81 82 83 84 85 860
100
200
300
S05 − Summer 2005 [weeks]
kW
128 129 130 131 132 133 134 135 136 137 1380
100
200
300
S06 − Summer 2006 [weeks]
kW
Figure 12: Ten week summer WEC power and demand comparisons
36 37 38 39 40 41 42 43 44 45 460
100
200
300
F04 − Fall 2004 [weeks]
kW
88 89 90 91 92 93 94 95 96 97 980
100
200
300
F05 − Fall 2005 [weeks]
kW
140 141 142 143 144 145 146 147 148 149 1500
100
200
300
F06 − Fall 2006 [weeks]
kW
Figure 13: Ten week fall WEC power and demand comparisons.
18
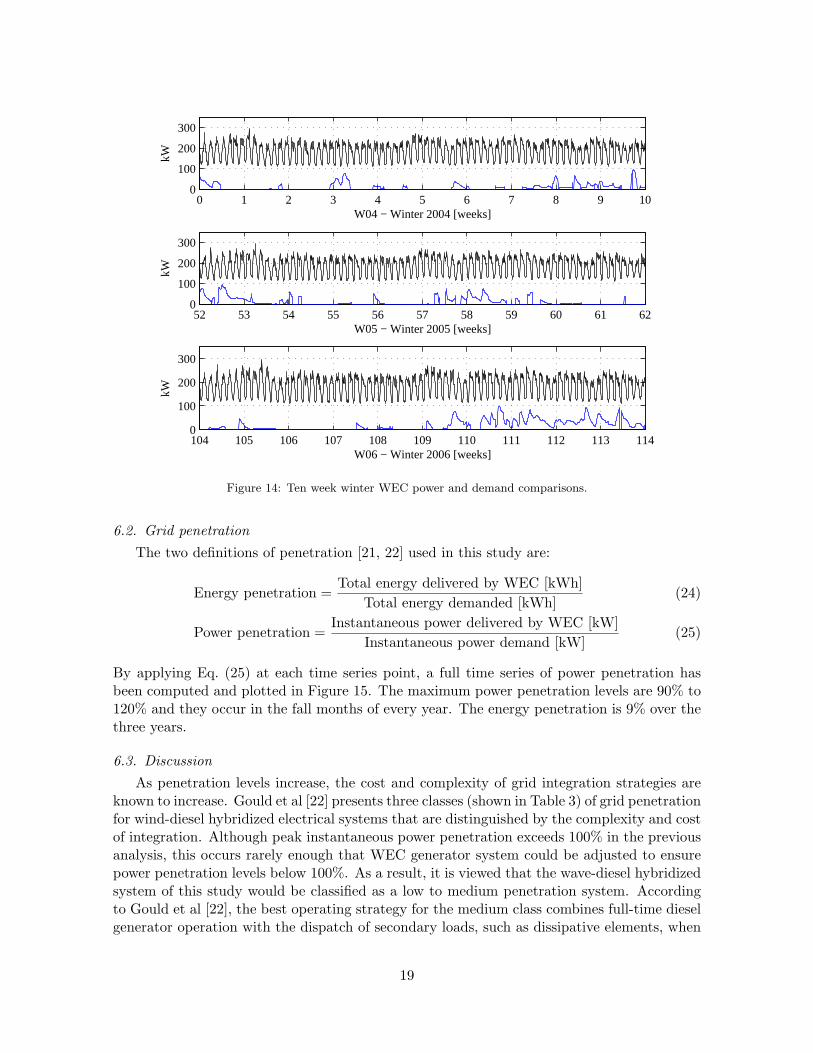
0 1 2 3 4 5 6 7 8 9 100
100
200
300
W04 − Winter 2004 [weeks]
kW
52 53 54 55 56 57 58 59 60 61 620
100
200
300
W05 − Winter 2005 [weeks]
kW
104 105 106 107 108 109 110 111 112 113 1140
100
200
300
W06 − Winter 2006 [weeks]
kW
Figure 14: Ten week winter WEC power and demand comparisons.
6.2. Grid penetrationThe two definitions of penetration [21, 22] used in this study are:
Energy penetration =Total energy delivered by WEC [kWh]
Total energy demanded [kWh](24)
Power penetration =Instantaneous power delivered by WEC [kW]
Instantaneous power demand [kW](25)
By applying Eq. (25) at each time series point, a full time series of power penetration hasbeen computed and plotted in Figure 15. The maximum power penetration levels are 90% to120% and they occur in the fall months of every year. The energy penetration is 9% over thethree years.
6.3. DiscussionAs penetration levels increase, the cost and complexity of grid integration strategies are
known to increase. Gould et al [22] presents three classes (shown in Table 3) of grid penetrationfor wind-diesel hybridized electrical systems that are distinguished by the complexity and costof integration. Although peak instantaneous power penetration exceeds 100% in the previousanalysis, this occurs rarely enough that WEC generator system could be adjusted to ensurepower penetration levels below 100%. As a result, it is viewed that the wave-diesel hybridizedsystem of this study would be classified as a low to medium penetration system. Accordingto Gould et al [22], the best operating strategy for the medium class combines full-time dieselgenerator operation with the dispatch of secondary loads, such as dissipative elements, when
19
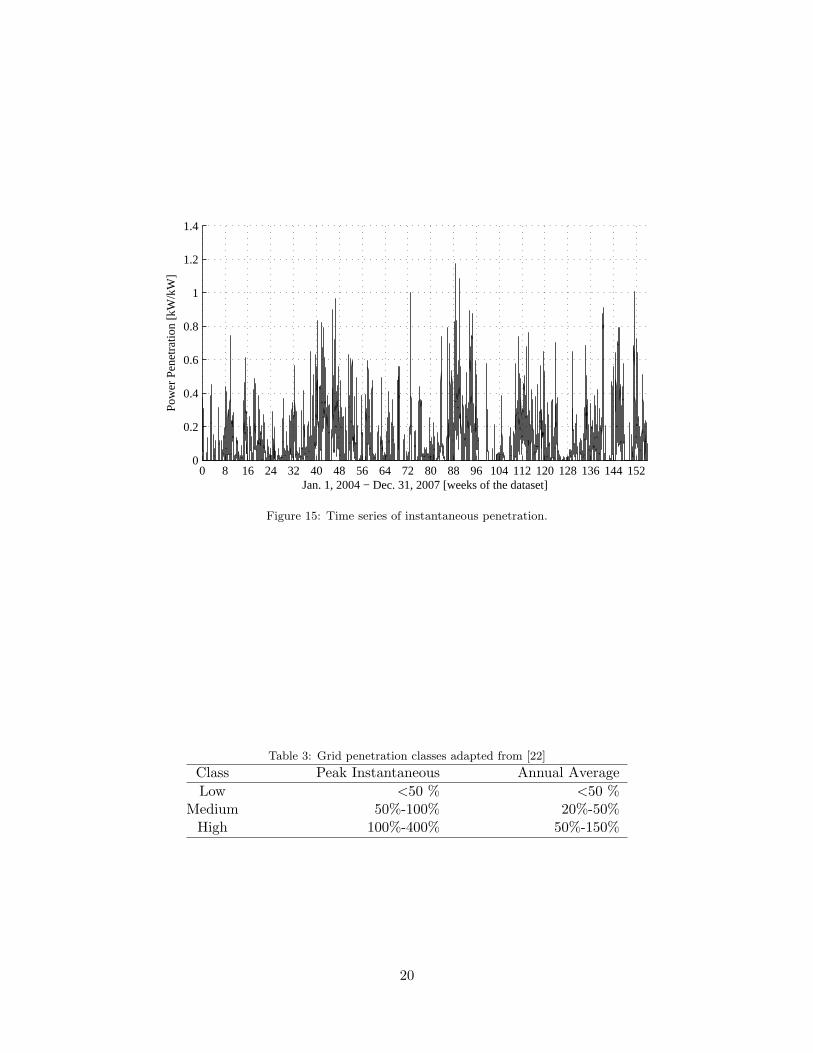
0 8 16 24 32 40 48 56 64 72 80 88 96 104 112 120 128 136 144 1520
0.2
0.4
0.6
0.8
1
1.2
1.4
Pow
er P
enet
ratio
n [k
W/k
W]
Jan. 1, 2004 − Dec. 31, 2007 [weeks of the dataset]
Figure 15: Time series of instantaneous penetration.
Table 3: Grid penetration classes adapted from [22]
Class Peak Instantaneous Annual AverageLow <50 % <50 %
Medium 50%-100% 20%-50%High 100%-400% 50%-150%
20

excess wave power exists to ensure a sufficient load on the diesel generators. The followingSt. George system design options could be investigated to maintain diesel loading:
1. A seasonal specific WEC control strategy be adopted. For example, adjustments to theWEC generator intensity could be made to ‘de-tune’ the system to mitigate the highpower penetration levels.
2. An electrical storage element could be introduced to store excess WEC power duringperiods of high power penetration.
3. An electrical ‘dump load’ could be introduced that dissipates excess WEC power, suchas the resistive heating of water for residential or municipal buildings.
7. Approximate energy and fuel savings
To approximate the energy and fuel savings possible, a simplified analysis of the WECpower capture and community load is performed. Under the assumption that all wave poweris utilized to offset diesel generator output, the time series of both wave power and electricaldemand are summed. Using the total energy demanded (Eqs. (26-27)) and captured alongwith the stated diesel generator efficiency, the approximate volume of fuel savings is calculated.The results are summarized in Table 4.
Edem =26280∑
t=0
Pdem(t)∆t (26)
Ewec =26280∑
t=0
Pwec(t)∆t (27)
In reality, all wave power could not be utilized to offset diesel generator output because there
Table 4: Energy and Fuel Savings Results
Units Total(3yr) Per yearHours hr 26280 8760Years yr 3.00 1
Demanded Energy MWh 4130 1380Wave Energy MWh 367 122
Energy Penetration % 9% 9%Fuel Volume burned if all Diesel L 2.09E+06 6.95E+05
Fuel Volume with Wave-Diesel L 1.90E+06 6.33E+05Fuel Savings L 1.85E+05 6.18E+04
Fuel Cost Savings $US $245,000 $81,600
are minimum load requirements and maximum ramp rates of the diesel generation systemthat need consideration. Therefore, to improve the accuracy of the energy and fuel savingsestimates of Table 4, a time simulation of the integrated wave-diesel generation system wouldbe required. This would enable the application of a detailed, time varying, power managementstrategy.
21

Conclusions
The wave energy integration study for St. George Island, Alaska provides a number ofinteresting and useful results. A wave resource assessment indicates an average wave powerper meter wave front of 28 kW/m, taking into account directional screening due to the pro-posed location of the deployment with respect to the island. The performance of a 100kWcapacity WEC device has been estimated at the site. The mean WEC power output is 13kWaverage and could provide 9% of the island electrical energy demand. The calculation ofgrid penetration levels has enabled an assessment of the technical feasibility of interconnec-tion to the existing electrical infrastructure. According to precedents set by the establishedwind-diesel hybridization field, this integration scenario could be classified as low to mediumpenetration, whereby relatively simple control systems could facilitate integration of waveenergy converters to the diesel generation system. In order to evaluate power managementstrategies and economics in detail, further work involving a time simulation of the proposedwave-diesel electrical system is planned.
Acknowledgments
This project was funded in part by SyncWave Energy Inc. and the Natural Sciences andEngineering Research Council (NSERC) of Canada. The contribution of Michael Tarbottenof Triton Consulting is gratefully acknowledged. Special thanks are given to Mr. Max Mala-vansky and Mr. Alvin Merculief on St. George Island for all of their cooperation in providinguseful information. It is hoped that this study can be expanded into further collaborationand that wave power will be used on St.George Island in the future.
References
[1] A. Babarit, H. Ben Ahmed, A. Clement, V. Debusschere, G. Duclos, B. Multon, G. Robin,Simulation of electricity supply of an atlantic island by offshore wind turbines and waveenergy converters associated with a medium scale local energy storage, Renewable Energy31 (2) (2006) 153–160.
[2] L. A. St.Germain, A Case Study of Wave Power Integration into the Ucluelet AreaElectrical Grid, Master’s thesis, University of Victoria (2005).
[3] D. Dunnett, J. S. Wallace, Electricity generation from wave power in canada, RenewableEnergy (2008),In Press.
[4] S. Singal, Varun, R. Singh, Rural electrification of a remote island by renewable energysources, Renewable Energy 32 (15) (2007) 2491–2501.
[5] G. Dalton, D. Lockington, T. Baldock, Case study feasibility analysis of renewable energysupply options for small to medium-sized tourist accommodations, Renewable Energy InPress (2008) –.
[6] S. J. Beatty, B. Buckham, P. Wild, Frequency response tuning for a two-body heavingwave energy converter, in: Proceedings of the International Society of Offshore and PolarEngineers, ISOPE 2008, Vancouver Canada, 2008.
22
[7] NOAA–WaveWatchIII, http://polar.ncep.noaa.gov/waves/index2.shtml, AccessedMay 5th, 2008.
[8] Alvin Merculief, Mayor, City of St. George, Alaska, Personal Communication (December2007).
[9] National Oceanic, Atmospheric Administration, St. George Island, Nautical Chart 16381,http://www.charts.noaa.gov/OnLineViewer/16381.shtml (April 2006).
[10] M. Tucker, E. Pitt, Waves in ocean engineering, 1st Edition, Vol. 5 of Elsevier oceanengineering book series, Elsevier, Amsterdam, New York, 2001.
[11] A. Cornett, Inventory of canada’s marine renewable energy resources, Tech. Rep. CHC-TR-041, National Research Council - Canadian Hydraulics Centre, Ottawa, K1A 0R6,Canada (April 2006).
[12] N. Protter, S. J. Beatty, B. J. Buckham, PCT Patent No. WO 2007/137426 A1 - WaveEnergy Converter, World Intellectual Property Organization (December 2007).
[13] S. J. Beatty, B. Buckham, P. Wild, Modeling, design and testing of a two-body heavingwave energy converter, in: Proceedings of the International Society of Offshore and PolarEngineers, ISOPE 2007, Lisbon Portugal, 2007.
[14] J. Falnes, Ocean Waves and Oscillating Systems: Linear Interactions including WaveEnergy Extraction, Cambridge University Press, 2002.
[15] G. Clauss, E. Lehmann, C. Ostergaard, Offshore Structures - Conceptual design andhydromechanics, Vol. 1, Springer-Verlag, 1992.
[16] C. Gilloteaux, Babarit, Influence of wave spectrum spreading on the production of thesearev wave energy converter., in: Proceedings of the Sixteenth (2007) InternationalOffshore and Polar Engineering Conference, Lisbon, Portugal, July 1-6, 2007, ISOPE,2007.
[17] G. Duclos, A. Babarit, A. H. Clement, Optimizing the power take off of a wave energyconverter with regard to the wave climate, Transactions of the ASME. Journal of OffshoreMechanics and Arctic Engineering 128 (1) (2006) 56–64.
[18] L. Holthuijsen, Waves in Oceanic and Coastal Waters, Cambridge University Press, 2007.
[19] M. Devine, E. Baring-Gould, The Alaska Village Electric Load Calculator, Tech. Rep.NREL/TP-500-36824, U.S. Department of Energy, National Renewable Energy Labora-tory, Golden, Colorado, http://www.nrel.gov/docs/fy05osti/36824.pdf (October 2004).
[20] State of Alaska, Commerce Community and Economic Development, Division of Com-munity and Regional Affairs, Community Database Online, http://www.dced.state.ak.us/dca/commdb/CF_COMDB.htm, Accessed September 2008.
[21] D. Weisser, R. S. Garcia, Instantaneous wind energy penetration in isolated electricitygrids: concepts and review, Renewable Energy 30 (8) (2005) 1299–1308.
23

[22] E. I. Baring-Gould, L. Flowers, P. Lundsager, Worldwide Status of Wind-Diesel Applications, in: DOE/AWEA/CanWEA Wind-Diesel Workshop, 2002,http://www.eere.energy.gov/windandhydro/windpoweringamerica/pdfs/workshops/2004_
wind_diesel/101_status.pdf.
24