analysing the consumer market microstructure in …
TRANSCRIPT

1
ANALYSING THE CONSUMER MARKET MICROSTRUCTURE IN SOUTH AFRICA BY MEANS OF A CONSUMER FINANCIAL VULNERABILITY SURVEY:
UNCOVERING THE PREDICTORS OF FINANCIAL VULNERABILITY B De Clercq CJ van Aardt JMP Venter Department of Taxation Bureau of Market Research Department of Taxation Unisa Unisa Unisa
Abstract
As with many developing countries, the consumer macrostructure of South Africa is beset with a
number of serious problems including high levels of poverty, a very unequal income distribution,
negative personal saving rates and high personal gearing ratios. A consumer financial
vulnerability study conducted in 2009 showed that South Africans are generally financially
vulnerable, thus confirming these problems in the consumer macrostructure and suggested
various reasons for the existence of such problems.
The question could be asked regarding the reasons for such problems in South Africa given the
economic progress that has been made during the post-apartheid era. In order to identify the
reasons for the said problems, this paper will focus on the endogenous and exogenous
predictors of financial vulnerability in South Africa, which could be derived from the said
consumer financial vulnerability survey. Predictors of consumer financial vulnerability uncovered
by this study include, inter alia, endogenous predictors such as over-indebtedness, bad financial
planning, consumers spending more that they earn. Exogenous factors include adverse
economic conditions, age and population group. In the analyses that were conducted for this
paper, the usual econometric diagnostics (i.e. co-linearity, autocorrelation and
underindentification) of postulated relationships were conducted to ensure valid conclusions
regarding predictive relationships. By means of such analyses consumer market microstructure
dynamics are described to generate results that could be used to provide input to policy and
programme formulation as well as the education of personal financial advisors who deal with
financially vulnerable customers.
1. BACKGROUND

2
Concern regarding the high levels of borrowing and low levels of savings as causes of
consumer financial vulnerability has been the focus of discussions and research amongst
various stakeholders and policymakers. The financial crisis left numerous consumers across the
world unemployed and over-indebted with low or no level of savings, thus causing them to feel
financially vulnerable. It appears from what is happening in Greece that this situation is still
continuing with large numbers of consumers being vulnerable due to negative macroeconomic
impacts resulting from fiscal constraints being experienced by countries who used fiscal space
to bail out struggling companies.
In its report entitled European trends in consumer financial vulnerability the European Credit
Research Institute (ECRI) (2008a) defined consumer financial vulnerability (CFV) as ‘the
personal feeling of being in a financially unstable situation’, and indicates that this ‘feeling’ is an
early indicator of financial stress in households. It is important to note that consumer financial
vulnerability is not necessarily an actual state of over-indebtedness but the consumer
experiencing financial vulnerability. Consumers may not currently feel financially vulnerable but
could become vulnerable when they become unemployed, unable to service debts or
experience financial emergencies.
On a macroeconomic level, several factors could lead to consumers feeling more financially
vulnerable. These include:
• the debt-to-income ratio in South Africa increased to 79.8% during the period July 2008 to
June 2009 (SARB, 2009);
• consumption expenditure (R1 385 billion) during 2008 was higher than total disposable
income (R1 329 billion), indicating that consumers on average spend more than they earn;
(SARB, 2009); and
• the wealth-to-disposable income ratio declined from about 3.45:1 in mid-2007 to 2.65:1 in
mid-2009, indicating poor financial planning by households; (SARB, 2009).
On a microeconomic level, aspects of the financial situation of consumers that seem to have
particularly deteriorated during the period up to June 2009 are the ability of consumers to stick
to their budgets, their ability to save and their ability to manage their financial situations:
• Household consumption expenditure on nondurable goods (including foodstuffs) declined by
3.4% during the second quarter of 2009 indicating that household financial situations have
deteriorated to such an extent that they are cutting back even on foodstuffs (SARB, 2009).

3
• The general lack of personal financial discipline is also reflected by National Credit
Regulator (NCR) (2009) statistics showing that by June 2009 about 15.4 million of a total of
62.3 million consumer accounts had impaired records, while 4.3% of consumer accounts
had judgements or administration orders against them.
Other studies conducted on consumer financial vulnerability reported on a variety of variables
that could result in consumers feeling financially vulnerable. Disney, Bridges and Gathergood
(2008) reported that household indebtedness, income shocks, unemployment, family
breakdown, ill health, macroeconomic shocks, interest rates and low savings could all influence
the level of consumer financial vulnerability.
FinMark Trust (FinMark) and the Bureau of Market Research (BMR) (2009) identified a range of
variables that appear to be strong predictors of financial vulnerability. These include: over-
indebtedness (in situations where consumers have high consumption expenditure as well as
high debt servicing); expenditure can also be constrained by income fragility leaving even less
money available for consumption expenditure and to spend on debt servicing); income fragility
in turn is brought about by a range of endogenous and exogenous factors. Endogenous factors
such as insufficient savings and/or investments, becoming unemployed, ill health,
separation/divorce and bad financial management, as well as external factors such as higher
interest rates, price inflation and adverse economic conditions were identified as possible
factors influencing the feeling of being financially vulnerable. This relationship is illustrated in
figure 1.
FIGURE 1 CONSUMER FINANCIAL VULNERABILITY MODEL

4
(Source: FinMark/BMR, 2009)

5
As illustrated above, various variables that could influence the financial vulnerability of
households are present on both macro- and microeconomic levels. However, there is a lack of
information to identify which households are actually financially vulnerable should they require
assistance.
2. RESEARCH PROBLEM AND RESEARCH QUESTIONS The purpose of this paper is to identify the endogenous and exogenous factors related to
financial vulnerability of households with the aim of describing financial microstructure dynamics
in South Africa.
To address the research problem it was necessary to determine drivers of various indices and
therefore the following questions were posed:
• What are the endogenous and exogenous predictors of the income-index?
• What are the endogenous and exogenous predictors of the savings-index?
• What are the endogenous and exogenous predictors of the consumption expenditure-index?
• What are the endogenous and exogenous predictors of the debt servicing-index?
Following is an overview of existing indices measuring financial consumer vulnerability,
concluding with the South African Consumer Financial Vulnerability (CFV) Index (section 3),
which forms the basis of the paper. Section 4 discusses the research methodology, while
section 5 provides analyses of the index predictors and identifies the main predictors of the four
sub-indices. Section 6 concludes with an interpretation of the analyses.
3. OVERVIEW OF CONSUMER FINANCIAL VULNERABILITY INDICES
This section provides a brief summary of the South African consumer financial vulnerability
survey and the resulting index completed in July 2009 preceded by information on the European
Genworth index on which the South African index is broadly based. The purpose of this
discussion is to determine to what level the South African and Genworth indices succeed in
identifying the predictors of consumer financial vulnerability.
3.1 Genworth Index The South African consumer financial vulnerability index is loosely based on the Genworth
Index developed by the ECRI and the Personal Finance Research Centre (PFRC) at the

6
University of Bristol. To measure CFV the European Credit Research Institute developed a CFV
index that provides an indication of the share of survey respondents in a specific country who
feel financially vulnerable relative to the share of people who feel financially secure
(ECRI/PFRC, 2008b). Multivariate statistical methods were applied to a series of questions
included in the Ipsos Mori omnibus survey with the aim of developing an index of financial
vulnerability (ECRI/PFRC, 2008b). Initially, the measures included in the survey were, firstly, to
determine current financial difficulties, secondly, to identify measures or predictors of financial
vulnerability and lastly, to determine the socio-demographic and attitudinal dimensions.
Originally, the following questions were asked of households to obtain useful data from
households with financial difficulties:
Current financial difficulties
• How often the household experienced financial difficulties during the preceding 12 months;
• How often the household had been unable to pay bills after a final reminder; and
• How well the household is currently keeping up with bills and credit commitments
(ECRI/PFRC, 2008b).
Future financial vulnerability
• Perceptions whether the household can afford more borrowing;
• Whether the household has savings equivalent to one month’s income;
• Expectations of the future financial position of the household (financial expectations);
Deteriorating financial circumstances
• The number of credit commitments in the household; and
• Whether the household suffered a decline in income during the preceding 12 months
(ECRI/PFRC, 2008b).
Measures or predictors of financial vulnerability
• Age
• Family type
• Occupational status
• Number of earners and whether there is a full-time earner in the household

7
• Housing tenure
• Attitudes towards savings, spending and borrowing (ECRI/PFRC, 2008b).
Based on a cluster analysis, four distinct groups of households were identified as reflected in
figure 2, namely Group A (financially vulnerable), Group B (strivers), Group C (circumspect) and
Group D (financially secure).
FIGURE 2
GROUPS OF HOUSEHOLDS
Expectations for the future financial position of household Get better Stay the same Get worse Frequency of expediency
financial difficulties
Often or always B A A Sometimes B C A Hardly ever D C C Never D C C
Source: Consumer Financial Vulnerability Technical Report – ECRI/PFRC – June 2008.
As shown in figure 2 four distinct vulnerability groups can be identified, ranging from Group A
(Financially Vulnerable) – people often being in financial difficulties during the preceding 12
months and not sure that their situation will improve, Group B (Striver) – these households have
experienced some financial difficulties during the preceding 12 months but are positive about
their situation improving (these households are neither financially vulnerable nor financially
secure), Group C (Circumspect) – these households did not often experience financial
difficulties during the preceding 12 months, and did not think their financial situations would
change during the following 12 months (also not financially vulnerable nor secure), and Group D
(Financially Secure) – encompassing those households who seldom, if ever, experienced
financial difficulties during the preceding 12 months and expect their financial situation to
improve during the following 12 months (ECRI/PFRC, 2008c).
On the basis of the constructed index, the researchers were able to establish that the level of
financial vulnerability could be influenced by:
• Gender (in some countries financial security is more evident amongst men than women);
• Age (in some countries a greater proportion of those aged 18 to 39 years reported financial
security compared to countries that reported the highest level of financial vulnerability
amongst those aged 50 to 69 years);

8
• Occupational status (there were differences in the level of financial vulnerability amongst
manual and clerical workers, and senior or professional occupations);
• Housing tenure (consumers who rent homes were more financially vulnerable than those
who owned fixed property);
• Number of earners (households with two income earners were less vulnerable than those
with no earners in the household (e.g. retirees));
• Saving (savers appear to be more financially secure than people who not saving);
• Credit (consumers who “prefer to buy things on credit rather than wait and save” reflected
higher levels of financial vulnerability) (ECRI/PFRC, 2008c).
Since the original measurement of the Genworth Index in June 2008, it was repeated in
November 2008 as well as November 2009. The results of the November 2008 study reflected a
decrease in the level of financial security as would be expected in the wake of the global
financial crisis and great uncertainty regarding the macro-economic outlook of the various
countries. This could largely be contributed to the following (not applicable to all countries
reviewed):
• Very high ratio of mortgage debt to GDP (households are highly leveraged – in certain
countries their liabilities exceed their assets by approximately 20%);
• House prices have fallen;
• Reduction in private consumption expenditure limiting economic growth;
• Potential and actual job losses (increasing unemployment);
• Devaluation of currencies;
• Stricter credit conditions enforced by financial institutions and regulators;
• Rising commodity prices (e.g. oil and electricity);
• Rising inflation (that results in higher food prices, reducing disposable income);
• Rising interest rates;
• Growing climate of fear (reduction in consumer confidence);
• Declines in exports; and
• Global recession (ECRI/PFRC, 2008d).
As discussed in the introduction (section 1), most of these trends identified in the European
context are also applicable to the South African environment, e.g. high inflation, job losses,
falling house prices – thus one can deduce that South African households will reflect the same

9
levels of financial vulnerability as their European counterparts. The actual level of consumer
financial vulnerability was measured through a study commissioned by FinMark Trust and
conducted by the Bureau of Market Research (BMR) during 2009 and will be discussed in
section 3.2.
3.2 South African Consumer Financial Vulnerability (CFV) Index A consumer financial vulnerability index for South Africa was constructed during 2009 by
FinMark and the BMR based on information obtained from a vast body of literature on consumer
financial vulnerability research worldwide. By means of analytical hierarchical process (AHP)
modelling techniques, such information was used to construct a CFV index for South Africa. The
CFV index derived by means of the AHP is shown in figure 3. It appears from figure 3 that
income fragility and expenditure both contribute 50% to the index. As predictors of income
fragility, household income predicts 75% and saving 25%. In the case of expenditure,
consumption expenditure predicts 16.7% and debt servicing 83.3%.
FIGURE 3 CONSUMER FINANCIAL VULNERABILITY INDEX
(Source: FinMark/BMR, 2009)

10
From the CFV index weights shown in figure 3, the following was derived with respect to the
South African CFV index:
• the consumer income vulnerability sub-index was computed by using the ‘growth in
disposable income’, ‘employment growth’ and ‘social benefits/transfers’ questions in the
questionnaire. For index purposes ‘growth in disposable income’ questions obtained a
weight of 0.637, ‘employment growth’ questions a weight of 0.258 and ‘social
benefits/transfers’ questions a weight of 0.105;
• the consumer savings vulnerability sub-index was computed by using the ‘growth in
financial assets’, ‘savings as a percentage of household disposable income’ and
‘percentage of population saving’ questions in the questionnaire. For index purposes
‘growth in financial assets’ obtained a weight of 0.429, ‘savings as a percentage of
household disposable income’ a weight of 0.429 and ‘percentage of population saving’ a
weight of 0.143;
• the consumer consumption expenditure vulnerability sub-index was compiled using
‘consumption expenditure growth’, ‘expenditure to income growth’ and ‘arrears on current
expenditure’ questions from the questionnaire (see figure 3). The weights applied were
0.135 for ‘consumption expenditure growth’, 0.281 for ‘expenditure to income growth’ and
0.584 for ‘arrears on current expenditure’;
• the consumer debt servicing vulnerability index was compiled based on ‘debt service
ratio’, ‘number of applications for debt counselling’ and ‘number of policy surrenders’
questions asked to respondents. The weights used for index compilation purposes were
0.319 for ‘debt service ratio’, 0.460 for ‘number of applications for debt counselling’ and
0.221 for ‘number of policy surrenders’; and
• finally, by bringing the various sub-indices together the CFV index was compiled. This was
done by using the following weights derived from the model developed (as shown in figure
3): the income vulnerability index score contributed 0.75 × 0.50 to the index, savings
vulnerability contributed 0.25 × 0.50, consumption expenditure vulnerability contributed
0.167 × 0.50 and debt servicing vulnerability contributed 0.833 × 0.50 to the index.
(FinMark/BMR, 2009)
The South African CFV index consists of a 10-point scale varying from 0 to 10, with ‘0’ being
indicative of consumers being completely financially secure while ‘10’ is indicative of consumers
being completely financially vulnerable. Five CFV groups were identified as shown in figure 4:

11
FIGURE 4 GROUPS OF HOUSEHOLDS
0 – 1.99 2.0 – 3.99 4.0 – 5.99 6.0 – 7.99 8.0 – 10.0
Financially very secure
Financially secure Somewhat financially
vulnerable Financially vulnerable
Financially very vulnerable
(Source: FinMark/BMR, 2009)
3.3 Research Methodology
The population focused on in this study included all consumers, which included nearly 48.1
million people in South Africa. To ensure a representative sample of consumers a sample was
drawn covering all nine provinces, all four main population groups, both genders, all age groups
as well as the various income groups in South Africa. This resulted in a sample of 976
households (representing an estimated 2 329 consumers).
The data collection conducted was threefold, namely (1) household-level interviews conducted
telephonically via the BMR’s CATI facility, (2) face-to-face in-house interviews, and (3) key
informant interviews conducted telephonically via the CATI system. The household sample (see
table 1) consisted of the following two sub-samples:
• 571 households with landlines that were contacted via the BMR’s CATI system; and
• 405 households in areas where limited amenities are available via face-to-face interviews.
TABLE 1 SAMPLE SIZE BY PROVINCE
Province CATI In-house
Total n % n % n
Eastern Cape 52 9.1 70 17.3 122 Free State 28 4.9 40 9.8 68 Gauteng 157 27.5 20 5.0 177 KwaZulu-Natal 80 14.0 35 8.6 115 Limpopo 49 8.6 70 17.3 119 Mpumalanga 21 3.7 60 14.8 81 North West 20 3.5 70 17.3 90 Northern Cape 66 11.6 20 5.0 86 Western Cape 98 17.2 20 5.0 118 Total 571 100.0 405 100 976

12
The distribution of key informant respondents by type of institution they represent is shown in
table 2.
TABLE 2 DISTRIBUTION OF KEY INFORMANTS BY INSTITUTION
Institution Frequency Percentage Municipality 18 31.0 Bank 9 15.5 Furniture store 9 15.5 Clothing store 9 15.5 Micro lender 9 15.5 Insurer 1 1.7 Credit bureau 2 3.4 Debt counselling organisation 1 1.7 Total 58 100.0
In addition to the household sample that was required to populate the CFV index, a sample of
key informants was also constructed to obtain information regarding the financial situation of
consumers from key informants who could be used for different purposes, namely:
• to explain the CFV findings derived from the household survey;
• to determine the level of congruence between the financial vulnerability of consumers as
reported by themselves in the household survey and the views of the key informants in this
regard; and
• to shed further light on the causes of CFV in South Africa.
The sample of key informants drawn was as follows:
o municipalities : 2 per province
o banks : 1 per province
o furniture stores : 1 per province
o clothing stores : 1 per province
o micro-lenders : 1 per province
o cellular communications providers : 1 head office
o insurers : 1 head office
o credit bureaux : 2 head offices
o motor industry associations : 1 head office
o debt counsellors : 1 head office

13
For the purpose of the household-level interviews a structured multiple-response research
instrument was designed and compiled by the BMR with the inputs from and final approval of
FinMark Trust. The questionnaire was designed to be completed both electronically via an
interviewer-administered approach (for CATI purposes) as well as in-house personal interviews
(for fieldwork purposes). The main focus of the questionnaire was to determine the CFV of
consumers in South Africa.
The questionnaire consisted of three sections, namely Section A requiring respondents to
describe the members of their household, Section B contained questions relating to the
household financial status and Section C required respondents to provide their personal details.
The questions were structured in such a way that various structured measuring scale questions
could be used with very few open-ended response questions requiring respondents to provide
details about their financial situation.
The questionnaire was based on the following topics:
• persons in the household;
• banking details;
• improvement in consumers’ financial situation over the preceding 12 months;
• determining whether consumers’ financial situation will be better or worse the following
year;
• financial tools utilised during the preceding 12 months;
• attitudes and views on money;
• attitudes towards saving;
• saving tools utilised during the preceding 12 months;
• reasons for financial difficulties during the preceding 12 months; and
• respondent’s biographical background.
As indicated above, an additional questionnaire was constructed for key informants to complete.
This questionnaire consisted of two sections, namely consumers’ financial situation and
respondent details. In the first section, the focus was to determine whether key informants
believed that consumers’ financial situations improved during the preceding 12 months with
respect to employment, income, debt servicing, access to credit, ability to save money, etc. The
key informants were also asked to indicate the reasons that could possibly lead to consumers
experiencing financial difficulties. In addition, key informants were asked to indicate in terms of

14
consumers’ demographics (income, age, gender, population group) who they thought were the
most financially vulnerable or the most financially secure in South Africa.
After populating the above-mentioned sub-indices and overall index, the validity and structural
integrity of the sub-indices and overall index were determined by means of factor analysis. The
factor loadings obtained were indicative of high levels of validity and structural integrity of the
various sub-indices and overall index. The final overall index and sub-indices are based on 10-
point scales where ‘0’ is indicative of complete financial security by all consumers while ‘10’ is
indicative of complete financial vulnerability by all consumers.
The consumer financial vulnerability index data was captured onto an SPSS file and used to
identify the predictors of the four components of the CFV Index, i.e Labour income,
Savings/non-labour income, Consumption expenditure and Debt servicing, based on the
following conceptual model:
(LI + S) – (C + DS) = R
where:
LI = Labour income
S = Savings/non-labour income
C = Consumption expenditure
DS = Debt servicing
R = Residual
The research results obtained for the purposes of this paper were derived by means of in-depth
analyses of the abovementioned consumer financial vulnerability data via regression analysis.
The data was used to identify the predictors of the four components of the CFV index, i.e.
income, savings, expenditure and debt. The results of these analyses are shown and discussed
in the next section.
The method of regression analyses used was categorical regression due to the fact that the
potential predictor variables ranged in nature from nominal to interval level, necessitating a form
of regression that can incorporate predictor variables on a range of measurement levels. For the
purposes of this study multiple categorical regression analyses were used to construct a path
analysis consisting of different layers of predicting variables.

15
By means of the said regression analyses a number of diagnostic results were obtained, which
were used to construct the said path analysis, namely:
• coefficient of determination to measure the strength of relationships;
• F-tests to determine the ratio between model variation and error variation in order to assess
the level of homoscedasticity in the postulated relationships;
• Durbin-Watson test for autocorrelation; and
• Partial regression analyses to determine the percentage contribution of each predictor
variable to variation in the criterion variable.
Decision rules were formulated to determine whether specific predictor variables should be
included or excluded in the final model. These were as follows:
• Coefficient of determination of higher than 0.15;
• High-level F-scores of 1.1 or higher and low-level F-scores of 5 and higher;
• Partial regression contribution of higher than 8%; and
• Low autocorrelation.
The path analyses conducted by using the regression analyses and decision rules shown above
commenced by firstly identifying the strength of the relationship between the four sub-indices of
consumer financial vulnerability and the overall consumer vulnerability index. Thereafter, a
variety of endogenous and exogenous variables were regressed onto the four sub-indices to
determine the predictors of each one of the sub-indices. Having completed the first two levels of
analyses, additional analyses were conducted to determine further levels of prediction until no
more levels could be predicted, with the implication that no further analyses were conducted
when the path analyses became saturated.
4. Results
4.1 Consumer financial vulnerability index scores obtained
Based on the abovementioned groups, the overall results (on the above-mentioned 10-point
scale) of the various sub-indices and CFV index revealed that South African consumers are
somewhat financially vulnerable or financially vulnerable when taking the following values of the
various indices into account:

16
• consumer income vulnerability : 7.13 (financially vulnerable)
• consumer savings vulnerability : 7.05 (financially vulnerable)
• consumer expenditure vulnerability : 5.94 (somewhat financially vulnerable)
• consumer debt servicing vulnerability : 5.03 (somewhat financially vulnerable)
• consumer financial vulnerability : 6.13 (financially vulnerable)
(FinMark/BMR, 2009)
Through further analysis of the various sub-indices and overall index scores, the FinMark/BMR
study reported that differential levels of vulnerability were experienced by:
• different income groups (large differences between the highest and lowest income groups
were found with regard to the income, expenditure and saving sub-indices but not with
regard to the debt servicing index);
• gender (it appears that females are more financially vulnerable than males with regard to
income and savings);
• province (clear provincial differences with regard to financial vulnerability were identified);
• area (it appears that rural dwellers are the most financially vulnerable, especially with
regard to income and savings);
• age (younger and older people were found to be especially vulnerable with respect to
income and savings, with young people having increasing expenditure while income
increases less rapidly, while older people experience a drop in income as they become
older although their expenditure remains relatively the same);
• marital status (divorce or widowhood was found to be a strong predictor of CFV);
• population group (few differences with regard to financial vulnerability were found);
• educational status (consumers with higher levels of education were found to be less
financially vulnerable);
• employment status (consumers employed full-time and those self-employed part-time who
experienced the highest level of income security were found to be less financially
vulnerable compared to people who were employed part-time, self-employed full-time, the
unemployed and those who are not economically active);
• source of income (consumers receiving social grants were the most financially vulnerable
in South Africa). (FinMark/BMR, 2009)

17
4.2 Regression results pertaining to predictors of overall CFV index
It appears from the regression analyses conducted that the four sub-indices succeeded in
predicting 95.1% of the variance in consumer financial vulnerability. As reflected in table 3 and
supported by figure 5, the regression analyses succeeded in predicting consumer financial
vulnerability accurately by making use of the income, savings, expenditure and debt indices at a
100% level of certainty. It can also be seen from this table that the model variance accurately
predicted by the regression model was 4.5 times that of the error variance, which is an
indication of a high level of accuracy with which the various indices predict consumer financial
vulnerability.
TABLE 3 RESULTS OF THE OVERALL CONSUMER FINANCIAL VULNERABILITY INDEX
Coefficient of determination (R2 0.951 ) F-ratio 4.459 Significant value of F 0.000
A breakdown of the percentage contribution of each of the independent indices in predicting
CFV is as follows (see figure 5):
• Income index: 34%
• Savings index: 14%
• Expenditure index: 9%
• Debt index: 28%
FIGURE 5
OVERALL CONSUMER FINANCIAL VULNERABILITY INDEX
CFVI
Income Index Savings Index Expenditure Index Debt Index
R2 = 0.951 F = 4.459 p = 0.000
34.0% F = 1025.027 p=0.000
13.7% F = 192.317 p=0.000 8.9% F = 60.526 p=0.000 27.9% F = 414.445 p=0.000

18
Factors such as the high levels of poverty in South Africa and the high unemployment rate could
be possible explanations for the strong relationship shown in figure 5 between the income
vulnerability sub-index and the CFV index. High consumer price inflation rates regarding
necessities (such as food, utilities and housing) give rise to the expenditure index being a strong
predictor of CFV. Furthermore, high interest rates associated with rapid growth in unsecured
debt and debt-to-income ratios resulting in high debt servicing vulnerability, give rise to the debt
servicing index being a strong predictor of CFV. Finally, low levels of savings result in
consumers actually dis-saving, resulting in high savings vulnerability. Not having enough
savings, especially at retirement, could give lead to an increase in income vulnerability. The
various sub-indices are inter-related and should not be seen in isolation, as the circumstances
regarding one index could have a domino effect on the others. A further example of the inter-
relationship between the various indices is a household that has a large income (thus not
vulnerable regarding the income index), but low or no savings (thus high level of vulnerability
regarding the savings index), high living standards (i.e. high levels of consumer expenditure –
high vulnerability regarding the expenditure index) and high levels of debt (high debt servicing
vulnerability), resulting in it being overall financially vulnerable.
Personal Finance (2010:8-21) confirms that income, savings, expenditure and debt servicing
are the major predictors of CFV by showing the 10 most common errors consumers make
regarding their personal financial management that could lead to an increase in their
vulnerability:
• Not planning for the unexpected – according to Personal Finance, most South African’s die
before the age of 50 and seldom have sufficient life assurance to enable dependants to
maintain their standard of living. Life assurance is essential since there is usually no or very
little savings to compensate for the loss of income due to the death or disability of a family
member;
• Not having short-term insurance – numerous motor vehicles on South African roads are not
covered by short-terms insurance. Should the drivers of these vehicles be involved in an
accident, the lack of short-term insurance could lead to financial ruin.
• Not belonging to a medical aid scheme – many consumers prefer self-assurance regarding
their medical costs, but this could be inadequate in the event of severe/serious medical
emergencies;

19
• Not saving – various sources confirm that South Africans generally have a low savings rate,
which may result in insufficient retirement funds. In the light of higher levels of population
ageing, the need for adequate retirement provision is essential;
• Inadequate budgeting – the lack of proper budgeting could result in consumers not saving
enough and not managing their debt;
• Living off credit – consumers make use of credit facilities to finance their consumption as
well as their perceived living standard (enabling them to “keep up with the Joneses”). Such
bad financial management could increase financial vulnerability in several ways: should
interest rates increase, it will be necessary to pay more to service debts, or, in the event of
job losses debts will need to be repaid when there is no source of income;
• Not managing credit or store card debt – this is mentioned as the main reason consumers
experience financial hardship. Too much credit and store card debt makes it difficult to
make ends meet;
• Not reading loan agreements carefully – one of the main purposes of the National Credit Act
is to ensure that consumers are protected from loan sharks. However, it is the responsibility
of consumers to ensure that they have read and understand all the clauses of their credit
agreements;
• Not following basic rules of investing – good financial management practices such as not
investing all your money in the same asset, calculating the risks associated with
investments, not being too conservative, not making emotional decisions, being alert to
commission-driven products, knowing what the costs of the investment are, not taking the
time or effort to determine the validity of investment plans, etc; and
• Not planning for a long life – due to factors such as longevity and inflation, consumers are
underestimating the funds they will require at retirement and thus become financially
vulnerable at a time when they should be free of debt with adequate income.
The results in table 4 show that each sub-index is successfully predicted by other CFV
variables, i.e:
• 98.4% of the variance in the income sub-index is predicted by 3 CFV variables (see figure
6);
• 99.8% of the variance in the savings sub-index is predicted by 3 CFV variables (see figure
6);
• 94.2% of the variance in the consumption expenditure sub-index is predicted by 2 CFV
variables (see figure 6); and

20
• 97.3% of the variance in the debt servicing sub-index is predicted by 3 CFV variables (see
figure 6).
TABLE 4
RESULTS OF THE FOUR SUB-INDICES
Index Coefficient of determination
(R2F-ratio
) Significant value of F
Part correlations
Income Index 0.984 1.146 0.000 0.340 Savings Index 0.998 1.247 0.000 0.137 Consumption expenditure Index 0.942 5.174 0.000 0.089
Debt servicing Index 0.973 6.785 0.000 0.279
As can be seen from figure 6, the regression analyses succeeded in predicting four sub-indices
by identifying three variables as predictors for the income sub-index, three predictors of the
savings sub-index, two predictors of the consumption expenditure sub-index and three
predictors of the debt servicing sub-index.

21
FIGURE 6 PREDICTORS OF THE FOUR SUB-INDICES
It is evident from figure 6 that the main predictors of the income sub-index are employment
(15% of variance in income-index), income (43%) and the ability to access money from friends
or family (15%), which, combined, successfully predicted 98.4% of the income sub-index. The
implication of this is that income vulnerability is less impacted on by employment than would
have been expected, but to a larger extent by the ability of households to obtain income from a
wide variety of sources. A more detailed breakdown of the drivers of income vulnerability will be
provided in section 4.2.
Turning to savings, figure 6 illustrates that the main predictors of the savings sub-index are the
ability to save (30% of variance in savings-index), money that could be accessed when facing
hardship (30%) and saving money regularly (27%). This implies that the three variables
identified have a similar impact on the savings index (approximately a third each) and sound
financial management principles of not only having the ability to save, but actually saving on a
CFVI
Income Index
Employment situation
compared to last year
Income situations compared to last
year
Ability to access money from
friends/family or others compared
to last year
Savings Index
Ability to save compared to last
year
Money that could be accessed to assist when faced with
hardship compared to last year
Saving money regularly
Consumption Expenditure Index
Frequently having problems making
ends meet
Often spending more money than
available
Debt Servicing Index
Amount paid to service debt
compared to last year
Considered going to see someone to
help with debt problems
Considered cancelling policies
to cover debt
R2 = 0.951 F = 4.459 p = 0.000
34.0% F = 1025.027 p=0.000
13.7% F = 192.317 p=0.000 8.9% F = 60.526 p=0.000 27.9% F = 414.445 p=0.000
R2 = 0
.984
F =
1.1
46 p
= 0
.000
R2 = 0
.973
F =
6.7
85 p
= 0
.000
(15.1%) F = 30.682 p=0.000
(43.0%) F = 1964.518 p=0.000
(15.0%) F = 313.009 p=0.000
(49.1%) F = 546.912 p=0.000
52.5% F = 405.937 p=0.000
26.0% F = 122.469 p=0.000
(30.2%) F = 507.178 p=0.000
(29.9%) F = 3743.739 p=0.000
(27.0%) F = 1404.948 p=0.000
R2 = 0
.998
F =
1.2
47 p
= 0
.000
R2 = 0
.942
F =
5.1
74 p
= 0
.000
37.0% F = 917.410 p=0.000
65.8% F = 3410.203 p=0.000

22
regular basis cannot be underestimated. A more detailed breakdown of the drivers of the
savings vulnerability will be provided in section 4.3.
Figure 6 reflects the two main predictors of the expenditure sub-index as frequently having
problems making ends meet (37% of variance in consumption expenditure-index), and often
spending more money than available (66%). These results are in line with what was reported by
Personal Finance (see section 4.2) as being amongst the most common errors made by
consumers when managing their finances. A more detailed breakdown of the drivers of the
consumption expenditure vulnerability will be provided in section 4.4.
With regard to the debt servicing index three main predictors were identified (see figure 6),
namely the amount paid for debt servicing (49% of variance in debt servicing-index),
contemplating going to see someone to help with debt problems (52%) and considering
cancelling policies to cover debt (26%). The amount of debt servicing had a strong impact on
the level of consumer financial vulnerability debt as illustrated by the exposure to debt
increasing enormously over the past few years as reflected by SARB figures, namely the debt-
to-income ratio in South Africa increased from around 57% in 2004 to 79.8% by June 2009 (DTI,
2010 & SARB, 2009). In their attempts to address this bigger exposure to debt, consumers are
exploring coping mechanisms such as debt counselling to assist them and thereby reduce their
level of debt servicing vulnerability. Cancelling insurance policies is also being explored by
consumers in an attempt to address their vulnerability. A more detailed breakdown of the
drivers of the debt servicing vulnerability will be provided in section 4.5.
4.3 Income index
In explaining the predictors of the income sub-index shown in figure 6, it is important to note
that, the BMR’s income and expenditure database shows that during 2009 about 91% of adult
consumers in rural areas earned R50 000 pa or less, compared to 72% of non-metro area urban
consumers and 62% of metro area urban consumers (Coetzee, 2009). The FinMark/BMR study
(2009) reported that differential levels of vulnerability were experienced by the different income
groups. For example, the consumer financial vulnerability of consumers earning in excess of
R8 000 pm was at 5.69 far lower than that of consumers earning less than R2 000 pm whose
index score was 7.03.

23
The FinMark/BMR study (2009) reported that employment status was a strong predictor of CFV,
especially for full-time employed and self-employed part-time consumers (who are often part of
double-income households) who experience the highest levels of income security. High levels of
income vulnerability were experienced by consumers who were employed part-time, self-
employed full-time, unemployed and those who were not economically active. These groups
were more exposed to the full impact of the economic recession, i.e. many business owners
(self-employed full-time) experience firsthand the impact of contracting markets.
In addition, the FinMark/BMR (2009) study evaluated the effect of the source of income on the
financial vulnerability of participants. It appears from the results of that analysis that consumers
receiving social grants were the most financially vulnerable.
The Income-index contributed 34.0% (see figure 5) to the overall consumer financial
vulnerability index and three statistically significant predictors of the income index were
identified by means of regression analysis as shown in table 5.
TABLE 5 RESULTS OF THE INCOME INDEX
Variable Coefficient of determination
(R2F-ratio
)
Significant value of F
Part correlations
Employment situation compared to last year 0.652 5398360.915 0.000 (0.151)
Income situation compared to last year 0.669 6155230.280 0.000 (0.430)
Ability to access money from friends/family or others compared to last year
0.236 248475.451 0.000 (0.150)
A breakdown of the percentage contribution of each of the three variables is as follows (see
figure 7):

24
FIGURE 7 INCOME INDEX
It is interesting to note from figure 7 that in contrast to many other countries, it would appear that
the income situation (43%) and not employment (15%) of South African households is the main
variable that influences income vulnerability. The employment situation of the household and its
ability to access money from other non-employment sources such as friends or family, appears
to have the same level of influence on its income vulnerability (both 15%).
The number of persons in the labour force in South Africa decreased by 325 000 in the second
quarter of 2009 and 267 000 jobs were lost between the first and second quarters of 2009 with
most of the job losses reported in the private household sector (StatsSA, 2009a). The bulk of
the job losses occurred in Gauteng (28.7%), the Western Cape (25.1%) and KwaZulu-Natal
(21.3%), increasing the income vulnerability of South Africans as these three provinces
combined provide almost 65% of employment in South Africa (StatsSA, 2009a). This decline in
jobs resulted in an increase in the number of people discouraged from finding a job (now being
classified as not economically active and not unemployed). This phenomenon is also reflected
Income Index
Employment situation compared to last year
Income situations compared to last year
Value of goods that could be sold to assist when
faced with hardship compared to last year
Income situations compared to last year
Employment situation compared to last year
Money that could be accessed to assist when
faced with hardship compared to last year
Ability to access money from friends/family or others compared to
last year
Ability to access money from friends/family or
others next year compared to now
Does not have sufficient access to income
generating opportunities
Province
47.2% F = 122.899 p=0.000
18.2% F = 19.346 p=0.000
44.8% F = 112.251 p=0.000
23.1% F = 30.713 p=0.000
30.1% F = 58.044 p=0.000
(27.5%) F = 25.951 p=0.000
17.6% F = 12.108 p=0.000
R2 = 0.984 F = 1.146 p = 0.000
R2 = 0
.652
F =
539
8360
.915
p =
0.0
00
(15.1%) F = 30.682 p=0.000
(43.0%) F = 1964.518 p=0.000
(15.0%) F = 313.009 p=0.000
R2 = 0
.669
F =
615
5230
.280
p =
0.0
00
R2 = 0
.236
F =
248
475.
451
p =
0.0
00

25
in figure 7 as it appears that consumers are beginning to rely on their ability to endure from
survival activities as well as from money from friends or family as a source of income rather than
employment itself.
In addition to the large number of job losses during the second quarter of 2009, the
unemployment rate increased in five of the nine provinces of South Africa as reflected in figure
8. This supports the view illustrated in figure 7 that households are exploring other avenues as
sources of income as employment is no longer guaranteed. This finding is confirmed by a
comparison of the results of the 2002 and 2009 General Household Surveys, which show that
salaries and wages as a source of household income stagnated proportionally during this
period. According to available 2002 and 2007 Stats SA General Household Survey data, the
number of households receiving social grants and pensions increased from 2 130 000 in 2002
to 6 325 000 in 2009, which is indicative that more and more households are becoming
dependent on social grants as a source of income and not on actual employment (StatsSA 2003
& StatsSA 2008).
FIGURE 8 UNEMPLOYMENT RATE PER PROVINCE
(Source: StatsSA, Quarterly Labour Force Survey, Quarter 2, 2009)
0
5
10
15
20
25
30
KZN WC GP LP NC MP FS NWQ1: 2009 22.6 18.4 21.7 28.1 27.4 24.7 25.4 26.9
Q2: 2009 19.3 20.5 23.1 24.9 26.5 26.5 26.9 27.7
Q1: 2009
Q2: 2009
26
It is also evident from figure 7 that consumer’s views on their current financial situation are
strongly influenced by their future financial expectations. Family financial transfers are the core
of financial support for several households as being their only source of income. In many
instances the main source of income for households is social grants and money being
redistributed by other family members, for example, a grandparent raising the grandchildren
while the parents are working at a different location. As more and more household members are
unable to provide income, they realise that they can longer rely on a guaranteed source of
income, which increases their financial vulnerability.
The households’ income situation compared to the previous year, the employment situation as
well as the ability to access money from friends, family or other sources were identified as the
main drivers of the income vulnerability index. These drivers were influenced by the value of
goods that households can sell when faced with financial difficulty and are obliged to obtain
other sources of income.
4.4 Savings index
A common belief is that due to the high levels of poverty, South Africans are not able to save.
This belief was proven partly wrong by the extensive study conducted by the Financial Diaries
project, which researched the financial lives of the poor by interviewing households several
times in the course of a year and documenting their financial activities. These researchers
concluded that the poor were utilising several formal (such as bank accounts, pension and/or
provident funds, insurance, funeral plans) and informal (such as stokvel/umgalelo, burial
society, saving-in-house) financial products to assist in their day-to-day financial interactions.
The only concern regarding several of these mechanisms was the incorrect use of some of the
products, i.e. a savings account is used as a transaction account and therefore not for actual
long-term savings. The savings habit is also more short-term focused to address specific needs
such as education fees or Christmas gifts rather than long-term or for retirement. (Financial
Diaries, 2007a)
Contrary to expectations, the Financial Diaries project also reported that rural households were
using almost the same number of financial instruments as were urban households. However,
the impact on rural areas necessitated financial management practices that were not
necessarily the safest or most productive. Due to the lack of banking facilities, many households

27
keep their money at home, or if the money was deposited in a bank account a once-off
withdrawal was made as it was not possible to have quick access to the funds in the event of an
emergency. This practice also exposed the poor to high security risks as it may become
common knowledge that certain amounts of cash were kept at households, leading to burglaries
and theft and hard-earned money being lost (Financial Diaries, 2007a). Difficulties to save by
consumers living in rural areas may be due to circumstances and not necessarily bad financial
management, which may result in their being financially vulnerable.
From the abovementioned discussion, it can deduced that the reasons for some consumers not
saving are not necessarily due to bad financial management but as a result of other factors such
as a lack of access to formal saving instruments. It was important, however, for this study to
determine what the predictors of CFV relative to saving are as the Savings-index contributed
13.7% (refer figure 5) of the overall consumer financial vulnerability index. Three predictors of
the savings index were identified as reflected in table 6.
TABLE 6
RESULTS OF THE SAVINGS INDEX
Variable Coefficient of determination
(R2F-ratio
)
Significant value of F
Part correlations
Ability to save compared to previous year 0.667 5406783.911 0.000 (0.302) Money that could be accessed to assist when faced with hardship compared to previous year
0.765 9248778.964 0.000 (0.299)
Saving money regularly 0.420 650743.887 0.000 (0.270)
Three variables with similar importance were identified as being the main drivers of the savings
index (see figure 9), namely the ability to save compared to the previous year (30.2%), money
that could be accessed to assist when faced with hardship (29.9%) and saving money regularly
(27.0%). The results shown in table 6 indicate that savings vulnerability is determined by short-
term (money that could be accessed during emergencies), medium-term (current ability to save)
and long-term (saving money regularly) factors. In a research project focusing on savings
conducted by the BMR during 2009, it was shown that saving money regularly is especially
important with respect to retirement savings while the bulk of consumers do not save for
emergencies. Should an emergency arise retirement savings are used, thus negatively
impacting on retirement security (BMR 2010).

28
FIGURE 9 SAVINGS INDEX
As discussed, low income earners (as reported by the Financial Diaries researchers) are saving
for short term goals and not actually for retirement or unforeseen circumstances such as illness,
disability or loss of income (Financial Diaries, 2007c). In the FinMark/BMR study (2009)
respondents were probed regarding their reason for not saving, which elicited responses such
as that they were struggling to make ends meet or did not have sufficient money to save. With
a poverty rate of about 47% (SAIRR, 2007) there may be good reason for respondents feeling
this way as short-term saving is not regarded as actual saving (resulting in wealth creation) but
as survival.
Savings Index
Ability to save compared to last year
Ability to obtain credit compared to
last year
Money that could be accessed to
assist when faced with hardship
compared to last year
Money that could be accessed to assist when faced with hardship
compared to last year
Ability to save compared to last
year
Value of goods that could be sold
to assist when faced with
hardship compared to last year
Saving money regularly
Saving money to have money for
the future
Regularly putting money aside to
ensure that cash is available when
needed
Province
Area
R2 = 0.998 F = 1.247 p = 0.000
(30.2%) F = 507.178 p=0.000
(29.9%) F = 3743.739 p=0.000
(27.0%) F = 1404.948 p=0.000
R2 = 0
.667
F =
540
6783
.911
p =
0.0
00
26.3% F = 42.275 p=0.000
32.6% F = 68.276 p=0.000
R2 = 0
.765
F =
924
8778
.964
p =
0.0
00
R2 = 0
.420
F =
650
743.
887
p =
0.0
00
21.0% F = 23.242 p=0.000
50.8% F = 120.660 p=0.000
29.5% F = 49.151 p=0.000
25.6% F = 37.389 p=0.000
11.1% F = 10.816 p=0.000
18.0% F = 13.843 p=0.000

29
According to SARB (2009), the national savings ratio or gross saving as a percentage of gross
domestic product increased slightly from 15.0 % in the third quarter of 2008 to 16.5 % in the
second quarter of 2009. This improvement can largely be attributed to consumers spending less
in real terms as they learnt to survive on available funds. Consumers’ ability to obtain credit was
also impacted on by the strict enforcement by financial institutions of the Credit Act, making it
difficult for consumers to access credit. This can be seen from the decrease of credit-active
consumers in good standing from 10.15 million in the first quarter in 2009, to 9.94 million in the
second quarter in 2009 (NCR, 2009a).
The rate of household saving as a percentage of their disposable income (-0.6) for the second
quarter of 2009 reflects that they were spending more than their disposable income, thus
preventing them from saving. Households realised that they would have to drop their standard
of living to survive and explore other avenues of financial aid. The value of goods that could be
sold to assist households in difficult financial times was one such possibility. This is supported
by the Association for Savings and Investment South Africa (ASISA, 2010), which reported that
in 2009 a total of 5.2 million policies lapsed (3 million first year policies and 2.2 million policies in
their second year). The value of the policies that lapsed in their first year was R2.9 billion and
those in their second year amounted to R3.3 billion. Households having less money to save are
also reflected in the decrease in real growth in bank deposits by households, namely 0.6% in
the second quarter of 2009 as reported by SARB (SARB, 2009a).
The ability to save money regularly is dependent on earning an income that allows the
consumer to have excess money after essential expenditure. Having sufficient income could be
severely hampered by employment opportunities in the province of residence as only two of the
nine provinces in South Africa experienced an increase in the labour force participation rate for
the second quarter of 2009 (see table 7):

30
TABLE 7 LABOUR FORCE PARTICIPATION RATE
Province Jan – Mar 2009 Apr – Jun 2009 Qrt to Qrt change Western Cape 69.1 68.3 -0.8 Eastern Cape 46.0 46.9 0.9 Northern Cape 54.2 54.5 0.3 Free State 58.5 56.7 -1.8 KwaZulu-Natal 51.2 47.8 -3.4 North West 55.6 53.8 -1.8 Gauteng 72.2 71.9 -0.3 Mpumalanga 56.4 55.2 -1.2 Limpopo 40.7 38.8 -1.9
(Source: StatsSA, Quarterly Labour Force Survey, Quarter 2, 2009)
In conclusion, the ability to save, the availability of money that can be accessed in financial
difficulties and saving money on a regular basis are the leading factors that influence CFV with
regard to saving. These factors, in turn are influenced by the ability to obtain credit, other
sources of income (money or goods that can be sold), having aside money for emergencies, the
province of residence of a consumer, as well as the area. All these variables are subject to
various macro- and microeconomic variables that have demonstrated high levels of volatility
during the period Q3 2008 to Q2 2009 making households even more financially vulnerable.
4.5 Expenditure index The Expenditure-index contributed 8.9% (see figure 5) to the overall consumer financial
vulnerability index and two predictors of this index were identified. The two variables were
further regressed to determine the construct path, the results of which are reflected in table 8.
TABLE 8 RESULTS OF THE EXPENDITURE INDEX
Variable Coefficient of determination
(R2F-ratio
)
Significant value of F
Part correlations
Frequently have problems making ends meet 0.294 270459.795 0.000 0.370 Often have to spend more money than is available 0.194 243448.911 0.000 0.658

31
A breakdown of the percentage contribution of each of the two variables in predicting the
expenditure index is illustrated in figure 10, which shows that spending more money than what
is available was the biggest contributor (65.8%) to the expenditure index, followed by not being
able to make ends meet (37.0%).
FIGURE 10 EXPENDITURE INDEX
Expenditure
Frequently have problems making ends meet
Ability to cover emergency next year compared to now
Lenders will lend anyone money whatever the
person's circumstances because they want to make
profit
Province
Area
Population group
Often spend more money than available
Borrowed from family or friends
Always have enough money to cover expenses at month
end before getting next income
Considered cancelling policies to cover debts
Province
37.0% F = 917.410 p=0.000
65.8% F = 3410.203 p=0.000
R2 = 0.942 F = 5.174 p = 0.000
(20.2%) F = 31.285 p=0.000
R2 = 0
.294
F =
270
459.
795
p =
0.0
00
15.3% F = 15.487 p=0.000
27.0% F = 58.583 p=0.000
23.9% F = 27.723 p=0.000
15.1% F = 15.763 p=0.000
17.5% F = 15.293 p=0.000
(16.5%) F = 14.450 p=0.000
20.1% F = 12.881 p=0.000
23.7% F = 61.062 p=0.000
R2 = 0
.194
F =
243
448.
911
p =
0.0
00

32
As discussed in the savings index, the Financial Diaries researchers reported on households
saving for short-term needs but not being prepared for unexpected expenditure, which has a
severe impact on very poor households. Households are often obliged to contribute to out-of-
household funeral expenditure, traditional feasts, assisting others who have no income, as well
as for weddings and births of friends or family. Such unexpected expenditure is then funded
from the household’s own limited funds, which then often forces the household to obtain the
required funds from other external sources such as loans or other forms of credit (Financial
Diaries, 2007a). Such a situation could have a detrimental effect on the household taking into
account that the source of income for most of these households is also under severe pressure
and could increase the households’ income, saving, expenditure and debt servicing
vulnerability.
Aspects of the financial situation of consumers that appear to have deteriorated particularly
during the second quarter of 2009, were the ability of consumers to stick to their budgets, their
ability to save and their ability to manage their financial situation. This finding is confirmed by
statistics provided by SARB (2009) showing that household consumption expenditure on
nondurable goods (including foodstuffs) declined by 12.2 % during the first quarter of 2009,
indicating that the financial situations of households have deteriorated to such an extent that
households are even cutting back on foodstuffs. The decline in expenditure can also be
attributed to the large number of job losses (refer to the income index) resulting in consumers
having to tighten their belts to survive.
Furthermore, consumers are not only having to save on food but are also restricting other
expenses as reflected by the 4.5% decline in new vehicle sales between June and July 2009.
Real retail trade sales contracted at a seasonally adjusted rate of 3.6 % in the second quarter of
2009 compared with the first quarter. On a year-on-year basis, retail sales declined by 6.7 % in
June (SARB, 2009).
Another factor indentified as having an effect on the financial vulnerability regarding
expenditure, is the effect of the sub-prime crisis as reflected in consumers’ perceptions that
lenders are profit-driven and do not necessarily have the consumer’s best interests at heart. The
responsibility of sound financial management and ensuring the correct use of credit remains the
core of the problem as consumers are not all adequately financially literate to make the correct
financial decisions.
33
4.6 Debt servicing index The researchers from the Financial Diaries studies also reviewed the debt servicing practices of
the poor in South Africa. They concluded that households in urban and peri-urban areas were
more inclined to formal debt while households in rural areas tended to use more informal debt.
What is reassuring to note is that the researchers observed that the majority of the poor
households in their study were not over-indebted, although high levels of indebtedness were
prevalent among medium- and high-income households in urban areas compared to over-
indebtedness amongst all income groups in rural areas (Financial Diaries, 2007b).
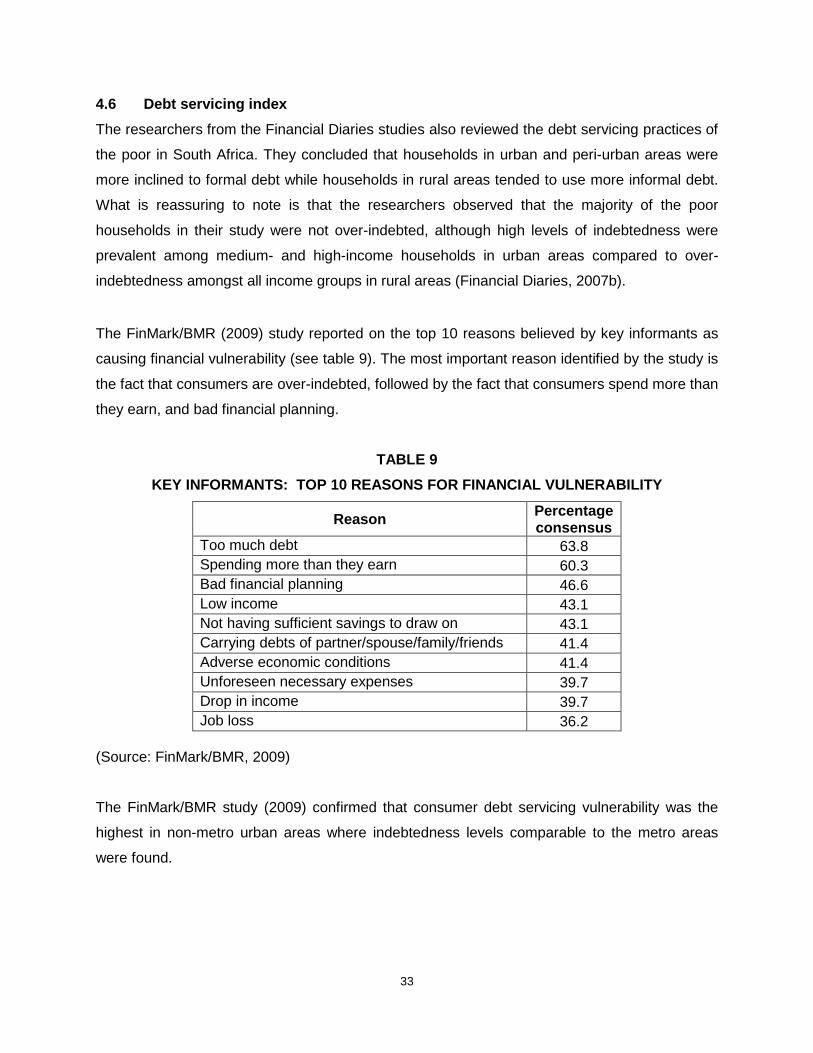
The FinMark/BMR (2009) study reported on the top 10 reasons believed by key informants as
causing financial vulnerability (see table 9). The most important reason identified by the study is
the fact that consumers are over-indebted, followed by the fact that consumers spend more than
they earn, and bad financial planning.
TABLE 9 KEY INFORMANTS: TOP 10 REASONS FOR FINANCIAL VULNERABILITY
Reason Percentage consensus
Too much debt 63.8 Spending more than they earn 60.3 Bad financial planning 46.6 Low income 43.1 Not having sufficient savings to draw on 43.1 Carrying debts of partner/spouse/family/friends 41.4 Adverse economic conditions 41.4 Unforeseen necessary expenses 39.7 Drop in income 39.7 Job loss 36.2
(Source: FinMark/BMR, 2009)
The FinMark/BMR study (2009) confirmed that consumer debt servicing vulnerability was the
highest in non-metro urban areas where indebtedness levels comparable to the metro areas
were found.

34
As the debt servicing index is the second largest contributor to the overall consumer financial
vulnerability index, i.e. 27.9% (refer figure 5) it is important to understand the underlying drivers
of this index. Should these issues be addressed in advance, it may assist consumers in better
managing their finances and not becoming deeply over-indebted. Three predictors of the
expenditure index were identified, namely the amount of debt servicing compared to the
previous year (49.1%), contemplating debt counselling (52.5%) and considering cancelling
policies to cover debt (26.0%). These three variables were further regressed to determine the
construct path and the results are reflected in table 9.
TABLE 9 RESULTS OF THE DEBT SERVICING INDEX
Variable Coefficient of determination
(R2
F-ratio
)
Significant value of F
Part correlations
The amount paid to service debt compared to previous year 0.703 6014673.455 0.000 (0.491) Considered going to see someone to help with debt problems 0.331 477971.584 0.000 0.525 Considered cancelling policies to cover debts 0.286 451213.629 0.000 0.260
A breakdown of the underlying drivers of each of the three variables predicting the debt
servicing index is reflected in figure 11:

35
FIGURE 11 DEBT SERVICING INDEX
It appears from figure 11 that the ability of consumers to service their debt is dependent on their
current credit situation as well as their ability to make ends meet. This finding shows that should
consumers be experiencing expenditure constraints due to not being able to access additional
credit or not having sufficient income to obtain necessities, they tend to cut back on debt
repayments.
The predictor of consumers seeking help with debt problems was also investigated as can be
seen in figure 11. The predictors in this regard indicate that consumers tend to seek advice
when they are in a desperate situation due to loss of income or when they have reached the
situation where they consider cancelling policies to make ends meet.
Debt Servicing
Amount paid to service debt compared to last year
Credit situation compared to last year
Ability to make ends meet compared to
last year
Considered going to see someone to help with debt problems
Considered cancelling policies to cover debt
Loss of income due to injuries/ disability
Province
Area
Considered cancelling policies to cover debt
Considered going to see someone to help with debt problems
Province
Population group
R2 = 0.973 F = 6.785 p = 0.000
(49.1%) F = 546.912 p=0.000
52.5% F = 405.937 p=0.000
26.0% F = 122.469 p=0.000
32.1% F = 71.421 p=0.000
R2 = 0
.703
F =
601
4673
.455
p =
0.0
00
R2 = 0
.331
F =
477
971.
584
p =
0.0
00
R2 = 0
.286
F =
451
213.
629
p =
0.0
00
32.2% F = 71.809 p=0.000
42.8% F = 79.558 p=0.000
17.0% F = 18.375 p=0.000
11.4% F = 17.640 p=0.000
17.0% F = 13.232 p=0.000
47.9% F = 113.419 p=0.000
15.9% F = 22.429 p=0.000
10.6% F = 13.819 p=0.000

36
The amount of debt servicing has a severe impact on the level of CFV as demonstrated by the
fact that the debt servicing to household disposable income ratio increased from about 6.5% in
2005 to about 10% by mid-2009 (StatsSA, 2010). During the period 2007 to 2009 the
percentage of credit active consumers with impaired records increased from 34.6% to 44.1%
(NCR, 2010).
The tendency of being unable to make ends meet is also reflected in figure 12, which was
derived from information provided by the National Credit Regulator (2009) as the number of
accounts 120 and older increased from 3.81% in 2008 to 6.72% in 2009.
FIGURE 12 AGE ANALYSIS OF DEBTORS BOOK (90+)
(Source: Compiled from statistics provided by the NCR, 2009)
With the introduction of the National Credit Act, the support to over-indebted consumers was a
main priority for the NCR and according to statistics from them 160 000 consumers had applied
for debt counselling since the implementation of the Act, with an average of 7 500 new
applications per month (NCR, 2010). Consumers are acknowledging that they are not capable
of coping with their current financial situation and are seeking assistance in this regard. Taking
into account, however, that only 160 000 consumers have applied, a lot still needs to be done in
making consumers aware of available assistance.
0.00%
1.00%
2.00%
3.00%
4.00%
5.00%
6.00%
7.00%
8.00%
2008-Q2 2008-Q3 2008-Q4 2009-Q1 2009-Q2
91 -120
120+

37
Taking into account that the most jobs were lost in Gauteng, the Western Cape and KwaZulu-
Natal during the second quarter of 2009 (StatsSA, 2009) it is alarming to note from figure 13
that R20.67 billion (46.41%) of the total disbursements for credit transactions of R44.54 billion in
2009-Q2 was to borrowers in Gauteng. The second largest share of credit granted went to the
Western Cape with R6.94 billion (15.58%) while KwaZulu-Natal received R5.53 billion (12.43%)
of credit transactions granted. This supports the view that consumers are funding their living
expenses by incurring debt.
FIGURE 13
PROVINCIAL DISTRIBUTION OF CREDIT TRANSACTIONS GRANTED, Q2 2009
As a result of the implementation of the National Credit Act obtaining credit has become far
more difficult for consumers and has had a direct impact on their ability to make ends meet. This
necessitated consumers to seek advice in managing their financial problems, negotiate
extended debt servicing periods as well as consider cancelling policies to cover debt.
6.17%3.77%
46.41%
12.43%
3.38%6.05%
1.57%3.86%
15.58%
0.77%0.00%
5.00%
10.00%
15.00%
20.00%
25.00%
30.00%
35.00%
40.00%
45.00%
50.00%
Province
EC FS GP KZN LP MP NC NW WC OTHER

38
5. OVERVIEW AND CONCLUDING REMARKS
The results of this study clearly show that there are a number of variables in the financial
microstructure that are strong predictors of the level of consumer financial vulnerability among
South Africans. Furthermore, the results are also confirmed by various other data sources
including StatsSA, the South African Reserve Bank, the National Credit Regulator, the South
Africa Savings Institute and FinMark Trust.
What is firstly clear with regard to the predictors of consumer financial vulnerability is that the
various variables:
• conjointly impact on CFV;
• enhance or deepen one another in their impacts on CFV;
• are interlinked with a number of feedback loops and spurious variables ensuring high levels
of multiplier effects between predicting variables. However, it should be noted that being
interlinked does not necessarily imply high levels of autocorrelation or co-integration as
shown in this study;
• differentially impact on the CFV in different provinces, age groups, income groups and skills
levels.
The major predictors of CFV in South Africa appear to be (1) high levels of unemployment, (2)
high poverty rates, (3) high debt and debt servicing ratios, (4) low savings rates, (5) bad
financial planning due to low financial literacy, (6) cancelling policies to cover debts, (7)
consumers living beyond their means and (8) a breakdown of inter-household and community-
level health transfer mechanisms.
Based on the results of this study the question arises regarding what needs to be done to
address the high levels of financial vulnerability experienced by consumers. It appears from this
study that South African consumers are generally financially vulnerable brought about by high
poverty rates, income inequalities, slow job creation growth, job losses, low savings,
expenditure outstripping income on a regular basis, too much debt and high debt servicing
burdens. Although macroeconomic policy measures to address financial vulnerability were
mostly focusing on increasing income via job creation and higher levels of economic growth, a
variety of microeconomic policy measures are required to address high levels of financial
vulnerability in South Africa. Such measures include:

39
• ensuring free education to all learners up to grade 12 (35.7% of school age youth are not at
school due to insufficient funds);
• mass-based financial literacy programmes;
• liberalising the labour market to ensure higher elasticity between GDP growth, employment
growth and income growth;
• changing the tax regime to encourage savings, i.e. by removing tax on savings returns;
• restructuring the social wage system in South Africa to ensure that recipients become more
financially secure instead of financially vulnerable;
• institutionalising a broad-based debt counselling and debt management system;
• ensuring that municipalities become a reliable, effective and efficient wealth transfer
mechanism in South Africa; and
• ensuring that a broad-based CFV intelligence system is implemented.

40
6. REFERENCES Association for Savings and Investment South Africa. 2010. SA life industry shows clean bill of
health - Media release 4 March 2010. Retrieved May 14, 2010, from Association for
Savings and Investment South Africa: www.asisa.org.za
Coetzee, M. 2009. BMR income and expenditure database (Electronic database).
Department of Trade and Industry. 2010. Household debt to disposable income of households
at current prices. Seasonally adjusted - March 1969 to December 2009.
Disney, R. B. 2008. Drivers of over-indebtness. Nottingham: Centre for Policy evaluation,
University of Nottingham.
DTI, see Department of Trade and Industry.
ECRI, see European Credit Research Institute.
European Credit Research Institute. 2008a. European trends in consumer financial vulnerability.
ECRI and the PFRC.
European Credit Research Institute. 2008b. CFV Technical Report. ECRI and the PFRC.
European Credit Research Institute. 2008c. The Genworth Index - Volume 1 - June 2008. ECRI
and the PFRC.
European Credit Research Institute. 2008d. The Genworth Index - Volume 2 - November 2008.
ECRI and the PFRC.
Financial Diaries. 2007a. Debt and household finance. Centre for Social Science Research.
Financial Diaries. 2007b. Findings in Brief. Centre for Social Science Research (CSSR).
Financial Diaries. 2007c. Grant recipient households - how do they manage their money?
Centre for Social Science Research.
FinMark Trust & Bureau for Market Research. 2009. A consumer financial vulnerability (CFV)
index for South Africa. Midrand: FinMark
National Credit Regulator. 2009. Credit bureau monitor, Second quarter / June 2009. Midrand:
NCR.
National Credit Regulators. 2010. NCR Task Team on Debt Counselling. Midrand: NCR.
NCR see National Credit Regulator.
Personal Finance. 2010. 10 worst financial mistake you can make. Personal Finance, Vol 43,
pp8-21.
PFRC see Personal Finance Research Centre. SAIRR see South African Institute for Race Relations.
SARB see South African Reserve Bank.

41
South African Institute for Race Relations. 2007. South African survey online: Business and
employment. Johannesburg: SAIRR.
South African Reserve Bank. 2009. Quarterly bulletin, September 2009. Pretoria: SARB.
Statistics South Africa. 2003. General Household Survey, 2003. Pretoria: StatsSA.
Statistics South Africa. 2007. Statistics of liquidations and insolvencies - July 2007. Pretoria:
StatsSA.
Statistics South Africa. 2008. General Household Survey, 2007. Pretoria: StatsSA.
Statistics South Africa. 2009. Quarterly employment statistics (QES), March 2009. Pretoria:
Stats SA.
Statistics South Africa. 2009. Quarterly Labour Force Survey, Quarter 2, 2009. Pretoria: Stats
SA.
Statistics South Africa. 2010. Statistics of liquidations and insolvencies - March 2010. Pretoria:
StatsSa.