analysing social media marketing on twitter using ...1214465/fulltext01.pdf · marketing on twitter...
TRANSCRIPT
INOM EXAMENSARBETE TEKNIK,GRUNDNIVÅ, 15 HP
, STOCKHOLM SVERIGE 2018
Analysing Social Media Marketing on Twitter using Sentiment Analysis
MAX MATTILA
HASSAN SALMAN
KTHSKOLAN FÖR ELEKTROTEKNIK OCH DATAVETENSKAP

Analysing Social MediaMarketing on Twitter usingSentiment Analysis
MAX MATTILA
HASSAN SALMAN
Degree Programme in Computer Science and EngineeringDate: June 6, 2018Supervisor: Richard GlasseyExaminer: Örjan EkebergSwedish title: Attitydanalys av marknadsföring på TwitterSchool of Electrical Engineering and Computer Science

iii
Abstract
Social media is an increasingly important marketing platform in to-day’s society, and many businesses use them in one way or anotherin their advertising. This report aimed to determine the effect of dif-ferent factors on the sentiment in the response to a tweet posted onTwitter for advertising purposes by companies in the fast food sectorin North America. The factors considered were the time of posting, thelength and the sentiment of a tweet, along with the presence of mediaother than text in the tweet. Sentiment was extracted from samplesof the response to the advertising tweets collected daily between the27th of March and the 28th of April and plotted against the factors men-tioned. The results indicate that the sentiment of the advertising tweetalong with the time of posting had the biggest impact on the response,though no definitive conclusions on their effects could be drawn.
iv
Sammanfattning
Sociala medier är en allt viktigare marknadsföringsplattform i dagenssamhälle, och många företag använder dem på ett eller annat sätt i sinmarknadsföring. Syftet med denna studie är att genom attitydanalysundersöka hur ett antal faktorer inom marknadsföring på det socialamediet Twitter påverkar responsen till den. Dessa faktorer var följan-de: inläggets tid, längd och attityd, samt förekomst av media i inlägget.Inläggen samlades från Twitter mellan 28. mars och 28. april och atti-tyden i dem mättes genom attitydanalys, varpå attityden i svaren tillreklaminläggen jämfördes baserat på de ovannämnda faktorerna. Re-sultaten visar på att attityden i reklaminläggen och tiden då de läggsupp har störst påverkan på hur svaren ser ut, men inga säkra slutsatserhar kunnat dras.
Contents
1 Introduction 11.1 Research Question . . . . . . . . . . . . . . . . . . . . . . 21.2 Hypothesis . . . . . . . . . . . . . . . . . . . . . . . . . . . 21.3 Motivation . . . . . . . . . . . . . . . . . . . . . . . . . . . 31.4 Limitations . . . . . . . . . . . . . . . . . . . . . . . . . . . 3
2 Background 42.1 Social Media Marketing . . . . . . . . . . . . . . . . . . . 42.2 Natural Language Processing . . . . . . . . . . . . . . . . 52.3 Sentiment Analysis . . . . . . . . . . . . . . . . . . . . . . 5
2.3.1 Methods . . . . . . . . . . . . . . . . . . . . . . . . 52.4 Tools . . . . . . . . . . . . . . . . . . . . . . . . . . . . . . 6
2.4.1 Twitter Developer API . . . . . . . . . . . . . . . . 62.4.2 Vader Sentiment . . . . . . . . . . . . . . . . . . . 62.4.3 Linear Regression . . . . . . . . . . . . . . . . . . . 7
2.5 Related Work . . . . . . . . . . . . . . . . . . . . . . . . . 8
3 Methods 93.1 Data Gathering . . . . . . . . . . . . . . . . . . . . . . . . 93.2 Sentiment Analysis . . . . . . . . . . . . . . . . . . . . . . 10
3.2.1 Lexicon-based . . . . . . . . . . . . . . . . . . . . . 103.3 Data Analysis . . . . . . . . . . . . . . . . . . . . . . . . . 11
4 Results 12
5 Discussion 175.1 Analysis of Results . . . . . . . . . . . . . . . . . . . . . . 175.2 Considerations . . . . . . . . . . . . . . . . . . . . . . . . 185.3 Future Work . . . . . . . . . . . . . . . . . . . . . . . . . . 19
v
vi CONTENTS
6 Conclusions 20
Bibliography 21
Chapter 1
Introduction
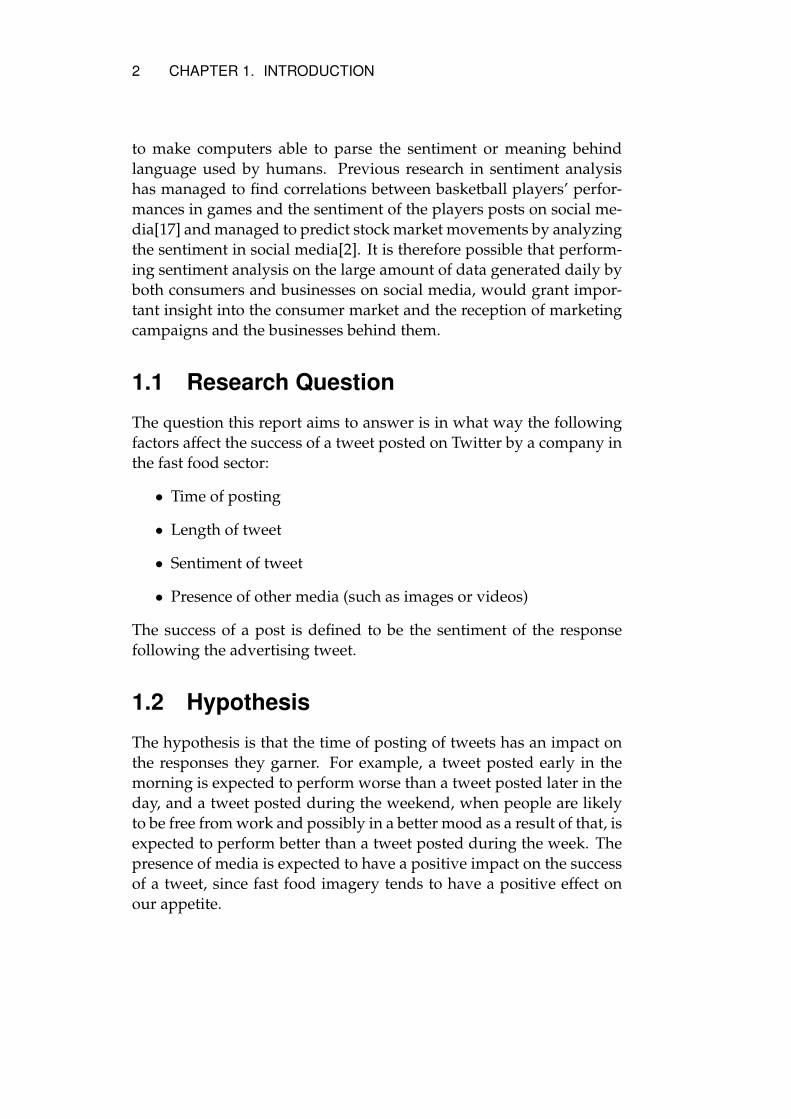
In recent years the role of social media has expanded far beyond justdealing with our social lives. Social media platforms, such as Face-book and Twitter, now play an integral part in how we interact withpolitics and the world. Social media also play an important economicrole, with many businesses using social media as integral parts of theirmarketing strategies, taking advantage of the direct interaction withconsumers that social media allow. A report compiled by the ContentMarketing Institute in North America[8] stated that 96% of business-to-consumer content marketers use social media for marketing pur-poses and some companies, such as Apple, even use social media as apart of their customer support.
The success of marketing campaigns is of great importance to thecompanies launching them. Social media management services, suchas Sprinklr and Sprout, have already emerged with the rise of socialmedia’s role in marketing, facilitating the planning and analysis ofsocial media marketing campaigns. Additionally, many social mediaplatforms provide their own research and consultation on marketingstrategies for their platforms. The effectiveness of ad campaigns is of-ten measured by brand and campaign awareness by looking at metricssuch as increase in followers and mentions following the campaign,view rate and view time, as well as brand sentiment, meaning the gen-eral perception of the brand on social media, not to mention the actualsales figures of the companies in question.
Sentiment analysis and natural language processing are two addi-tional tools that can be used in analyzing the response to and successof advertisements. They are both fields of computer science aimed
1
2 CHAPTER 1. INTRODUCTION
to make computers able to parse the sentiment or meaning behindlanguage used by humans. Previous research in sentiment analysishas managed to find correlations between basketball players’ perfor-mances in games and the sentiment of the players posts on social me-dia[17] and managed to predict stock market movements by analyzingthe sentiment in social media[2]. It is therefore possible that perform-ing sentiment analysis on the large amount of data generated daily byboth consumers and businesses on social media, would grant impor-tant insight into the consumer market and the reception of marketingcampaigns and the businesses behind them.
1.1 Research Question
The question this report aims to answer is in what way the followingfactors affect the success of a tweet posted on Twitter by a company inthe fast food sector:
• Time of posting
• Length of tweet
• Sentiment of tweet
• Presence of other media (such as images or videos)
The success of a post is defined to be the sentiment of the responsefollowing the advertising tweet.
1.2 Hypothesis
The hypothesis is that the time of posting of tweets has an impact onthe responses they garner. For example, a tweet posted early in themorning is expected to perform worse than a tweet posted later in theday, and a tweet posted during the weekend, when people are likelyto be free from work and possibly in a better mood as a result of that, isexpected to perform better than a tweet posted during the week. Thepresence of media is expected to have a positive impact on the successof a tweet, since fast food imagery tends to have a positive effect onour appetite.
CHAPTER 1. INTRODUCTION 3
1.3 Motivation
The results of this report could potentially grant further insight intosocial media marketing and the makings of a successful Twitter mar-keting campaign. This could impact how businesses model their ad-vertising strategies and manage their social media, in turn having eco-nomic consequences. It is also possible that this report would grantbetter understanding of the relationship and interaction between busi-nesses and consumers on social media.
1.4 Limitations
This report will only be looking at the posts of a select few fast foodcompanies on Twitter shared between the 27th of March and the 28th ofApril. These companies are McDonald’s, Burger King, Subway, PizzaHut, Papa Johns, Wendy’s, Taco Bell, KFC, Chick-fil-A and Domino’sPizza. The tweets will be collected exclusively from the North Ameri-can branches of the companies.
Chapter 2
Background
2.1 Social Media Marketing
Social media marketing is the use of social media to promote servicesand products. Big brands today use social media to a large extent inorder to promote their services and products. Facebook, Twitter andYoutube are the most popular social media and are widely used bylarge companies for marketing purposes [15].
Social media constitute a very cheap and cost-effective marketingplatform, since the usage of social media is free in most cases. Themain cost for businesses is the time employees spend on planning andexecuting the social media marketing, as opposed to traditional me-dia such as TV and news media, where advertising slots can be pricy.Additionally, using social media for marketing purposes means thatany advertising is made available to the consumers immediately andgrants the business the possibility of receiving instant feedback to themarketing efforts. [10]
While using social media for marketing has been identified as be-ing crucial for the growth of a company, it does imply some risks forthe companies and their public image. If the social media marketingis not carried out with a clearly defined plan that is in line with theexisting business goals and is instead carried out in an arbitrary fash-ion, the potential risks are much harder to predict, and the company’srevenue can be negatively affected. [13].
So, while the cost of social media marketing is very low in compar-ison to the existing alternatives, its effectiveness and potential can beboth an asset and a risk. It is therefore of great importance that social
4
CHAPTER 2. BACKGROUND 5
media campaigns are carefully planned and that its goals are clearlyidentified before it is realized, in order to minimise risks and optimizethe reception of the campaign and the profits accordingly.
2.2 Natural Language Processing
Natural Language Processing (NLP) is a research area that includes thedevelopment of computer programs and algorithms to analyse, under-stand or generate natural human language. It also includes modellingand simulation of human linguistic behaviour using computers [4].NLP is considered as a field in Artificial Intelligence , along with com-puter and information science, linguistics, mathematics, electronic en-gineering and psychology [11]. The most commonly used methods forNLP today are based on machine learning (ML) [3].
2.3 Sentiment Analysis
Sentiment Analysis (SA) extracts the sentiment out of a text and thenanalyses it. By analysing the sentiment it can be determined whethera text expresses an opinion or value and, if so, which one. There areseveral methods in which this can be done and the most commonlyused methods today are based on ML and lexicon-based methods [12].
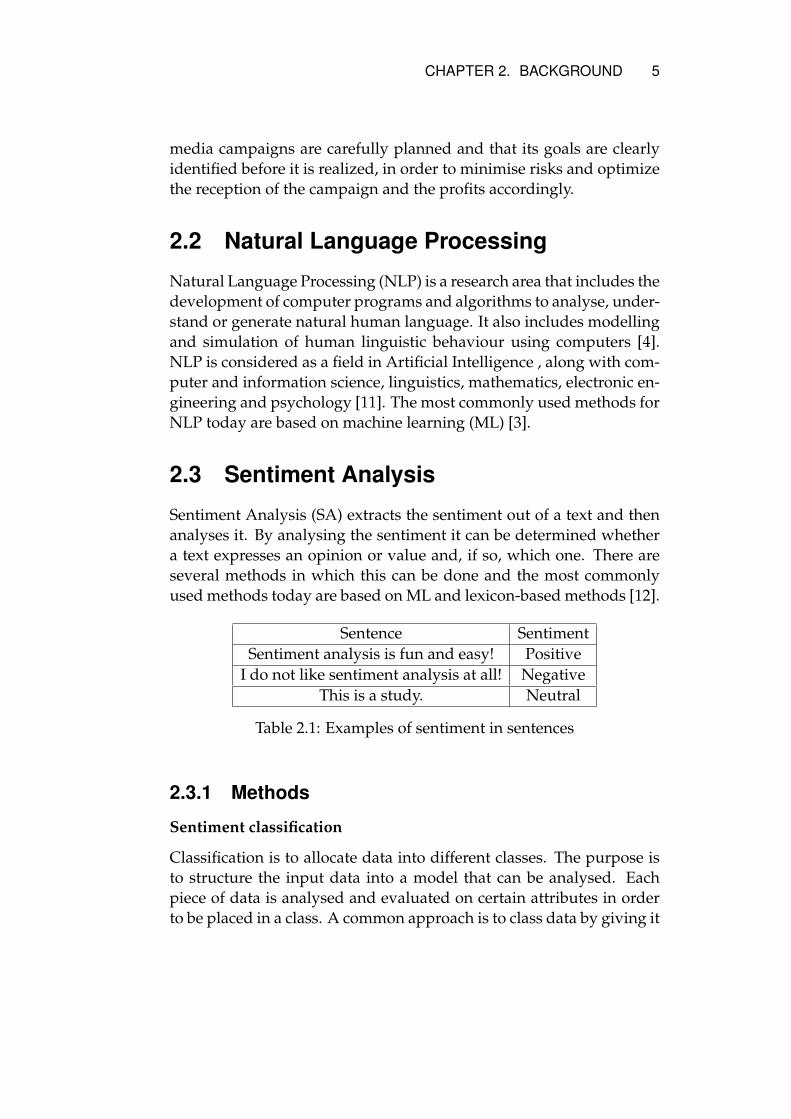
Sentence SentimentSentiment analysis is fun and easy! Positive
I do not like sentiment analysis at all! NegativeThis is a study. Neutral
Table 2.1: Examples of sentiment in sentences
2.3.1 Methods
Sentiment classification
Classification is to allocate data into different classes. The purpose isto structure the input data into a model that can be analysed. Eachpiece of data is analysed and evaluated on certain attributes in orderto be placed in a class. A common approach is to class data by giving it
6 CHAPTER 2. BACKGROUND
scores on a scale from negative to positive where a more neutral scoreis closer to the middle.
Lexicon-based
To classify data into different classes, one can use a lexicon-based ap-proach. This approach is more primitive and research indicates that itcan be more effective than other more complex approaches [9]. It usesa special lexicon based on certain data where each word has a score de-pending on its value. The lexicon is then used to give different scoresdepending on words in the text and the text as a whole.
Machine Learning-based
The ML based approach to classify data requires training to train theclassifier on a certain data set. There are several algorithms to solvethis problem, but three are considered as standard algorithms; NaiveBayes, maximum entropy classification, and support vector machines[14].The trained classifier is then used to classify text similar to the lexiconapproach by giving scores to the input data.
2.4 Tools
2.4.1 Twitter Developer API
The Twitter Developer API consists of a number of different endpoints,but the most central one to this report is the Search endpoint. Twitteroffers three tiers of search APIs: standard, premium and enterprise.Out of these, only the standard API is available to all, but an applica-tion can be made to access a free sandbox version of the premium API,which is what was used in this report. When querying for tweets fromthe last 30 days, the query length can be up to 265 characters long anda maximum of 100 tweets will be returned per request. Furthermore,these tweets can be filtered by specifying certain parameters in the APIcall, such as sender, recipient or date of posting.[16]
2.4.2 Vader Sentiment
Vader Sentiment (VS) is an open-source toolkit written in Python forextracting sentiment out of a text. This is a lexicon-based toolkit that
CHAPTER 2. BACKGROUND 7
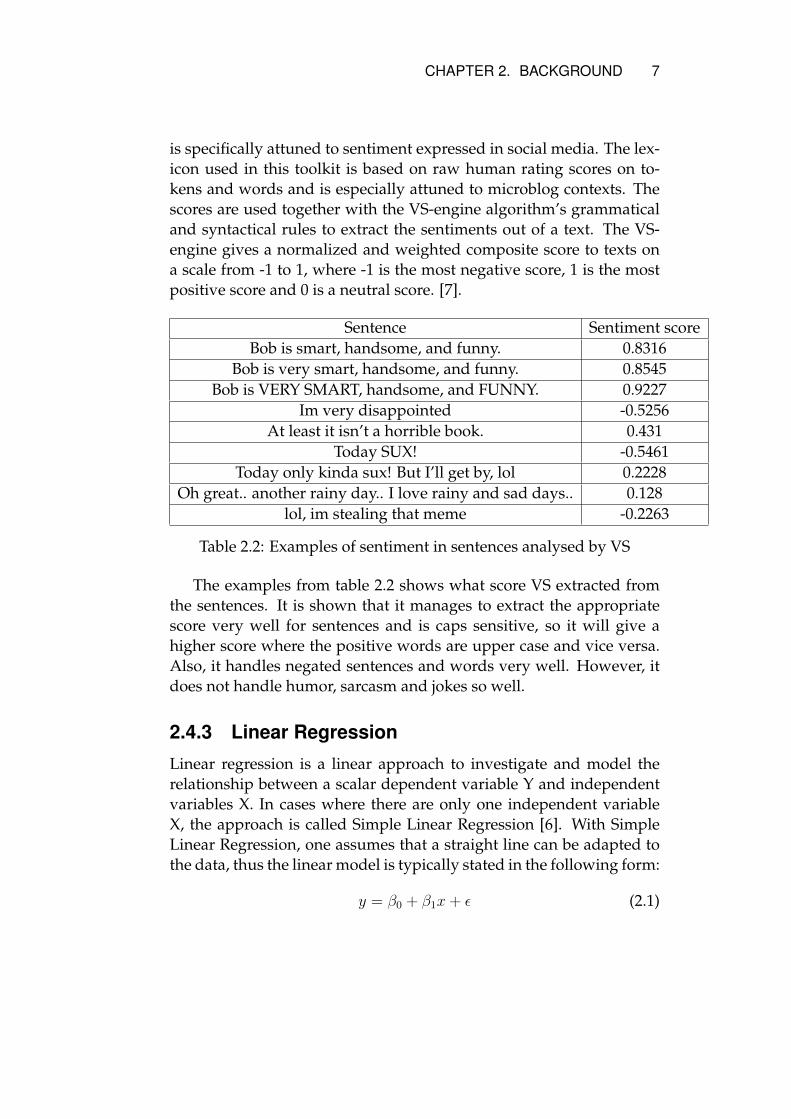
is specifically attuned to sentiment expressed in social media. The lex-icon used in this toolkit is based on raw human rating scores on to-kens and words and is especially attuned to microblog contexts. Thescores are used together with the VS-engine algorithm’s grammaticaland syntactical rules to extract the sentiments out of a text. The VS-engine gives a normalized and weighted composite score to texts ona scale from -1 to 1, where -1 is the most negative score, 1 is the mostpositive score and 0 is a neutral score. [7].
Sentence Sentiment scoreBob is smart, handsome, and funny. 0.8316
Bob is very smart, handsome, and funny. 0.8545Bob is VERY SMART, handsome, and FUNNY. 0.9227
Im very disappointed -0.5256At least it isn’t a horrible book. 0.431
Today SUX! -0.5461Today only kinda sux! But I’ll get by, lol 0.2228
Oh great.. another rainy day.. I love rainy and sad days.. 0.128lol, im stealing that meme -0.2263
Table 2.2: Examples of sentiment in sentences analysed by VS
The examples from table 2.2 shows what score VS extracted fromthe sentences. It is shown that it manages to extract the appropriatescore very well for sentences and is caps sensitive, so it will give ahigher score where the positive words are upper case and vice versa.Also, it handles negated sentences and words very well. However, itdoes not handle humor, sarcasm and jokes so well.
2.4.3 Linear Regression
Linear regression is a linear approach to investigate and model therelationship between a scalar dependent variable Y and independentvariables X. In cases where there are only one independent variableX, the approach is called Simple Linear Regression [6]. With SimpleLinear Regression, one assumes that a straight line can be adapted tothe data, thus the linear model is typically stated in the following form:
y = β0 + β1x+ ε (2.1)
8 CHAPTER 2. BACKGROUND
In this form y is the dependent variable, β1 is the y intercept and iscalculated through this following formula:
β1 =
∑ni=1(xi − x)(yi − y)∑n
i=1(xi − x)2(2.2)
β0 is the slope of the line and is obtained through this following for-mula:
β0 = y − xβ1 (2.3)
x is the independent variable and ε is the random error [18].
2.5 Related Work
In 2016, Ogbuji and Papazafeiropoulou [13] analysed frameworks usedfor social media marketing to suggest which one provides the neces-sary alignment between social media goals with business objectives.The frameworks are guidelines and strategies on how a business shoulduse social media for marketing purposes and are based on differentfactors. Effing and Spiel [5], for example, stress that marketing cam-paigns need to be modeled after target audience, marketing platformand business goals and policies, and that regular contribution on theplatform along with monitoring of the response is essential in develop-ing social media strategies. The study by Ogbuji and Papazafeiropouloufound that the best way for companies was to first identify areas withinthe business that needs improvement and then evaluate which socialmedia platform that should be used for marketing.
Asur & Huberman managed to predict box-office revenues of moviesusing sentiment analysis on Twitter. By looking at the number oftweets mentioning the individual movies and the sentiment in thetweets, the authors fit a linear regression model to the data to maketheir predictions, outperforming extant models such as a news-basedpredictor and the Hollywood Stock Exchange, which is a simulatedstock market for movies that has previously been proven to serve asa good indicator for the performance of movies in the box-office. Thepolarity or sentiment of the tweets was noticed to have a larger impactafter the movie had been released and the authors noted that “socialmedia expresses a collective wisdom which, when properly tapped,can yield and extremely powerful and accurate indicator of future out-comes”. [1]
Chapter 3
Methods
3.1 Data Gathering
The data used in this report is comprised of tweets collected betweenMarch 27th - April 28th 2018 from the official Twitter accounts of thefollowing companies:
• McDonald’s
• Subway
• KFC
• Wendy’s
• Pizza Hut
• Papa John’s
• Burger King
• Domino’s Pizza
Any tweet posted by the listed companies was regarded as an instanceof advertising, if it was not posted in reply to another tweet. This isbecause most of the original tweets posted by these accounts containat the very least some allusion to their products, while the replies areoftentimes posted for the sake of consumer interaction, either express-ing gratitude for their patronage, or concern in the case that a problemhas been brought up. As the focus of this report lies on social mediamarketing, only the original tweets of the companies (i.e. non-replytweets) have been used in the analysis.
9
10 CHAPTER 3. METHODS
The tweets were collected through the Twitter Developer API. TheAPI provides an endpoint to access the feed or timeline of specific ac-counts, returning only the non-reply tweets of that account. The time-lines of each company were accessed daily in order to save the mostrecent tweet of each company for later use in the analysis of the data.
In addition to the company tweets, the response to each tweet wasstored. The Twitter API does not allow direct access to the replies ofa specific tweet at the free sandbox level, but it is possible to searchfor any tweets sent to a specific account through the Search endpointof the API. However, a maximum of 100 tweets can be returned perrequest, and the number of requests that can be made is also limited.Therefore, the response to each original tweet posted by the companiesmentioned above was considered to be the sample of up to 100 tweetsdirected at the specific company, posted within 24 hours of the originaladvertising tweet.
These tweets were collected through the aforementioned Searchfeature of the Twitter API, using the query parameter “to:[accountname]”. Twitter offers the possibility to return either the most recenttweets, the most popular tweets (measured by a metric of their own)or a mix of the two. In this report the most recent tweets have beencollected at each point of sampling, since the popular tweets were of-tentimes posted by other business accounts and not consumers, in ourexperience.
3.2 Sentiment Analysis
3.2.1 Lexicon-based
Previous studies indicate that a lexicon-based approach often performsbetter than a ML approach on smaller texts [9]. Since the data-set usedin this thesis is of the same character, a lexicon approach and the VStoolkit was used over a ML approach to extract the sentiments out ofthe data. As mentioned, this toolkit is specifically attuned to texts insocial media contexts, which is another reason why this toolkit waschosen.
Every single tweet collected from companies was run on the VS-engine along with its replies and related tweets. A score for the com-pany tweet was extracted as well as a mean of all scores from thereplies and related tweets. This data along with data related to the
CHAPTER 3. METHODS 11
company tweet was stored for further analysis. Since this thesis aimsto measure the sentiment in the response to advertising tweets, anyresponse lacking a clear sentiment (i.e. having a neutral score) wasdisregarded in the analysis.
3.3 Data Analysis
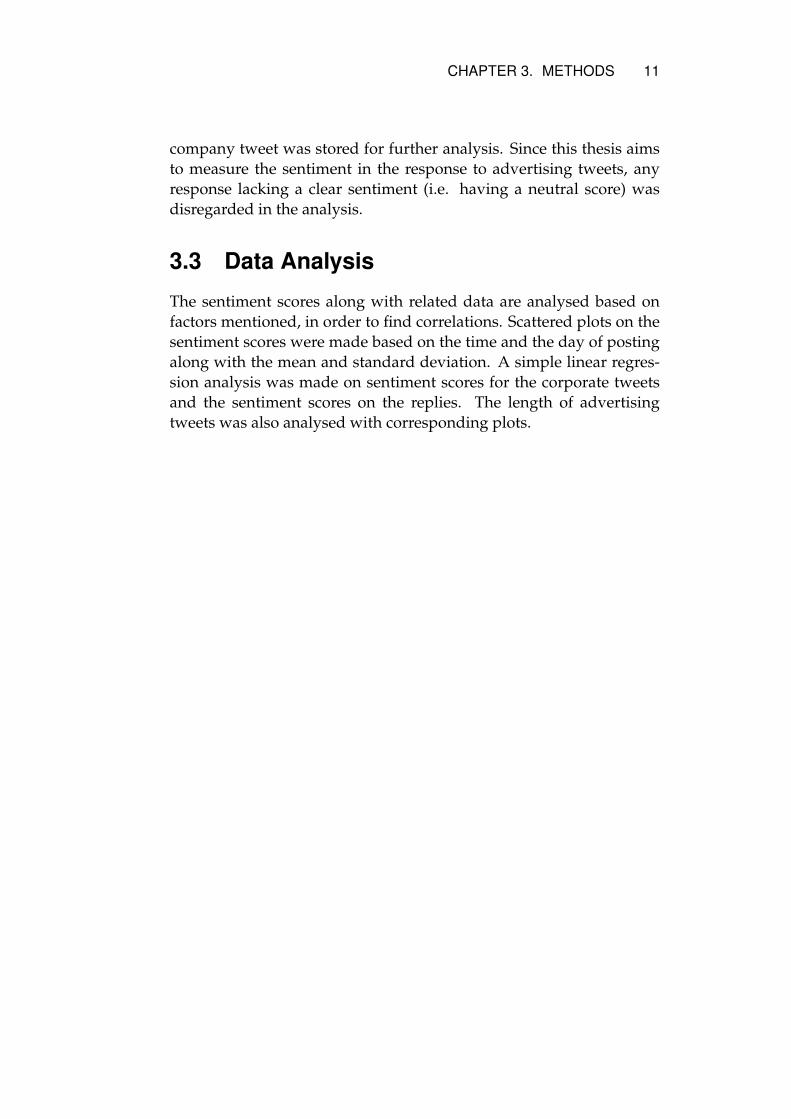
The sentiment scores along with related data are analysed based onfactors mentioned, in order to find correlations. Scattered plots on thesentiment scores were made based on the time and the day of postingalong with the mean and standard deviation. A simple linear regres-sion analysis was made on sentiment scores for the corporate tweetsand the sentiment scores on the replies. The length of advertisingtweets was also analysed with corresponding plots.
Chapter 4
Results
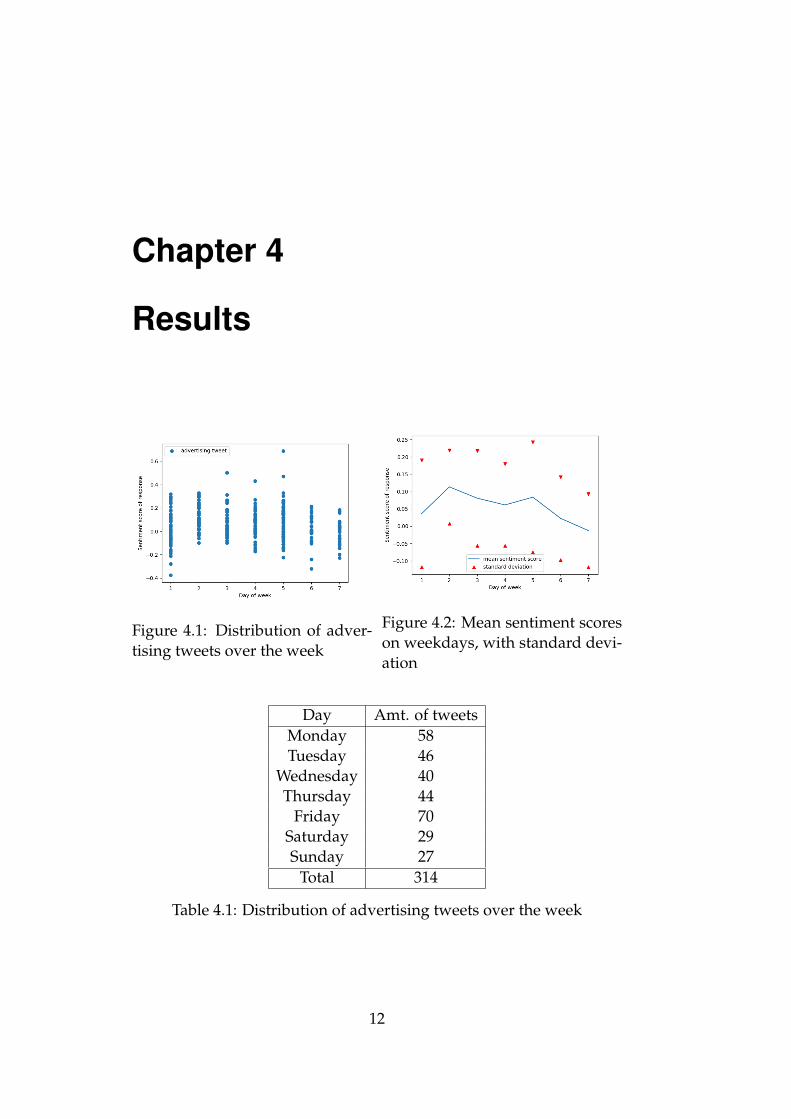
Figure 4.1: Distribution of adver-tising tweets over the week
Figure 4.2: Mean sentiment scoreson weekdays, with standard devi-ation
Day Amt. of tweetsMonday 58Tuesday 46
Wednesday 40Thursday 44
Friday 70Saturday 29Sunday 27
Total 314
Table 4.1: Distribution of advertising tweets over the week
12
CHAPTER 4. RESULTS 13
Figure 4.1 shows the distribution of company tweets over the daysof the week, starting with Monday, as well as the sentiment score ofeach tweet. Table 4.1 shows the total amount of tweets posted by thecompanies on each day of the week during the period of data gather-ing. Figure 4.2 shows the mean sentiment score of the response to thetweets posted on each weekday, with the red triangles marking thestandard deviations. The results show that advertising tweets tendto be unsuccessful on Sundays and less successful on Saturdays andMondays. The figure suggests that advertising tweets posted on Tues-days and Fridays tend to have a better success rate than other days.The response to tweets posted on Fridays seems to be more volatilethan others based on the fact that the standard deviation of their sen-timent scores is the largest, though one should note that Friday is alsothe day with the most data points, as shown in table 4.1.
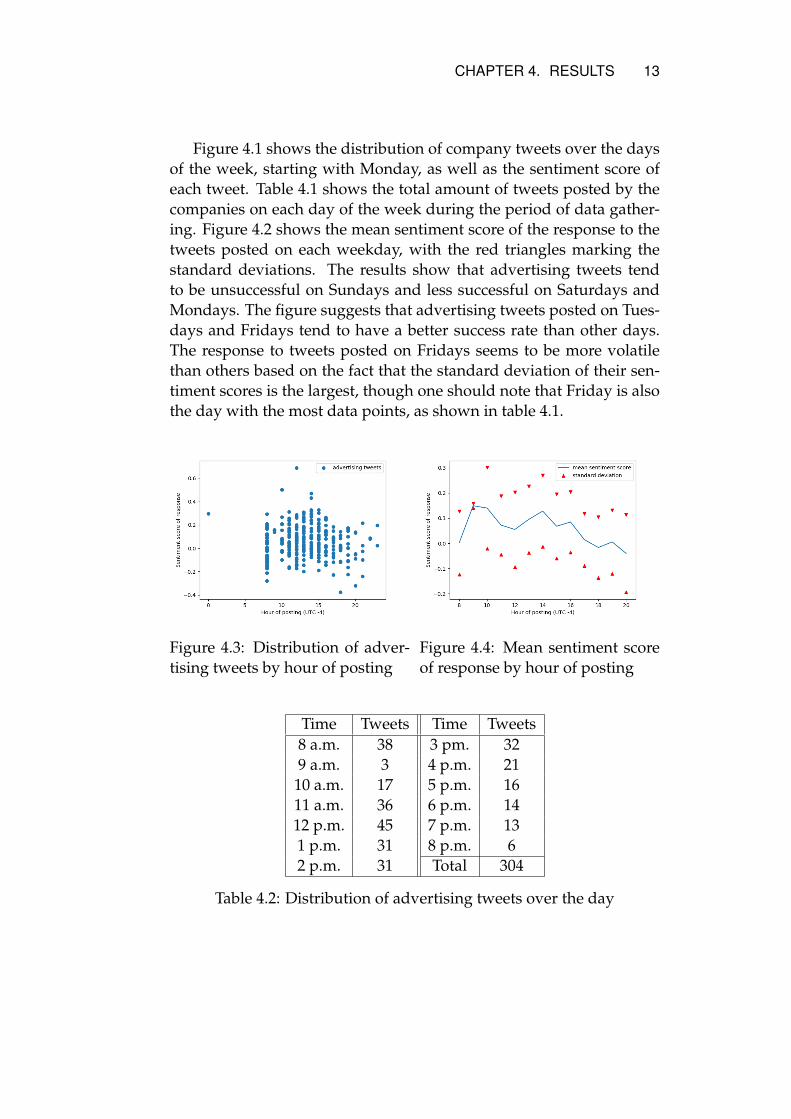
Figure 4.3: Distribution of adver-tising tweets by hour of posting
Figure 4.4: Mean sentiment scoreof response by hour of posting
Time Tweets Time Tweets8 a.m. 38 3 pm. 329 a.m. 3 4 p.m. 21
10 a.m. 17 5 p.m. 1611 a.m. 36 6 p.m. 1412 p.m. 45 7 p.m. 131 p.m. 31 8 p.m. 62 p.m. 31 Total 304
Table 4.2: Distribution of advertising tweets over the day
14 CHAPTER 4. RESULTS
Figure 4.3 shows the distribution of advertising tweets over theday, with the X-axis marking time in UTC - 4, which is the time zoneof New York, chosen because it is the biggest city by population in theUSA. It is clear that most advertising tweets are posted roughly be-tween 8:00 a.m. and 8:00 p.m. Very few tweets were posted around9.00 a.m. during the data gathering for this report and thus the resultsmay be less reliable. In figure 4.4, which shows the average sentimentscore of the responses to tweets posted between 8:00 a.m. and 8:00p.m. along with the corresponding standard deviations, it is shownthat advertising tweets that were posted between 10:00 a.m. and 4:00p.m. were generally more successful than tweets posted at other times.
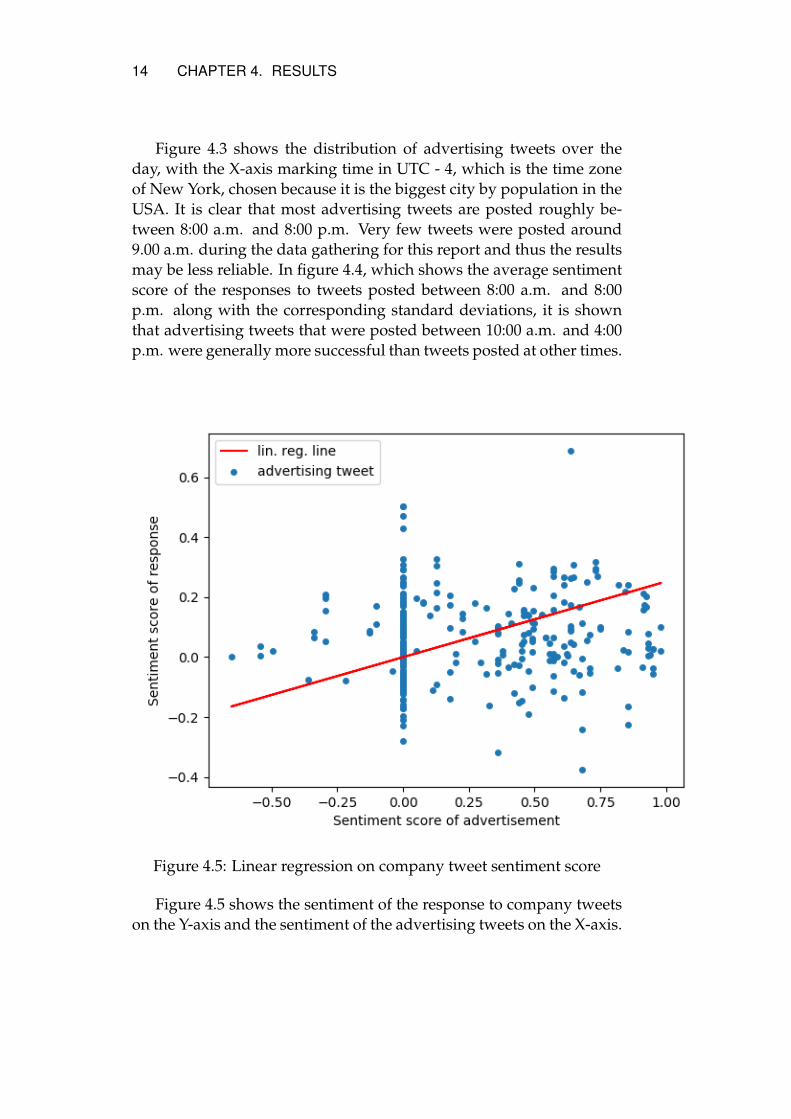
Figure 4.5: Linear regression on company tweet sentiment score
Figure 4.5 shows the sentiment of the response to company tweetson the Y-axis and the sentiment of the advertising tweets on the X-axis.
CHAPTER 4. RESULTS 15
A line has been fitted to the curve through linear regression, showinga positive correlation between the sentiment score of the response andthe original tweet. The majority of company tweets are neutral or pos-itive in sentiment, with only a handful of tweets scoring below zero.
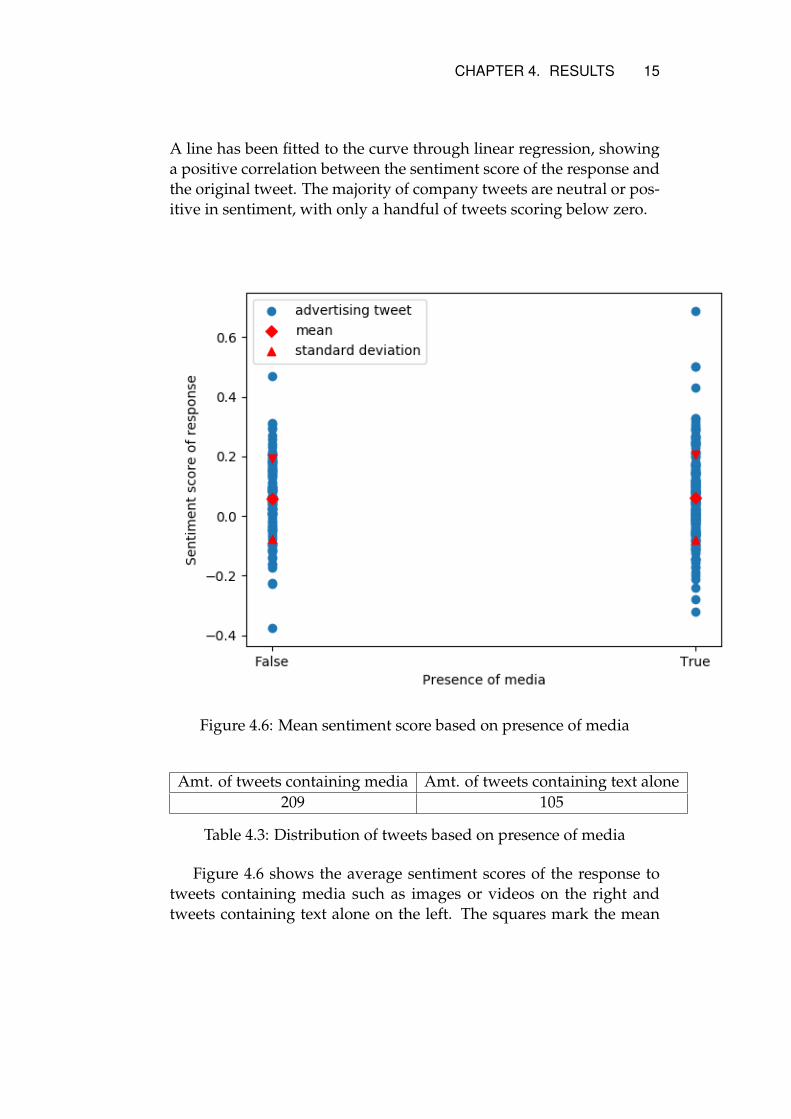
Figure 4.6: Mean sentiment score based on presence of media
Amt. of tweets containing media Amt. of tweets containing text alone209 105
Table 4.3: Distribution of tweets based on presence of media
Figure 4.6 shows the average sentiment scores of the response totweets containing media such as images or videos on the right andtweets containing text alone on the left. The squares mark the mean
16 CHAPTER 4. RESULTS
sentiment score in the response to all company tweets of either cate-gory and the triangles mark the standard deviation. As seen in thefigure, the presence of media in an advertising tweet does not seemto have a noticeable impact on the success rate of advertising tweets.There are some extreme cases where the sentiment score is above nor-mal, but generally the presence of media does not seem to have animpact on the success rate. As shown in table 4.3, about two thirds ofthe gathered advertising tweets contain media.
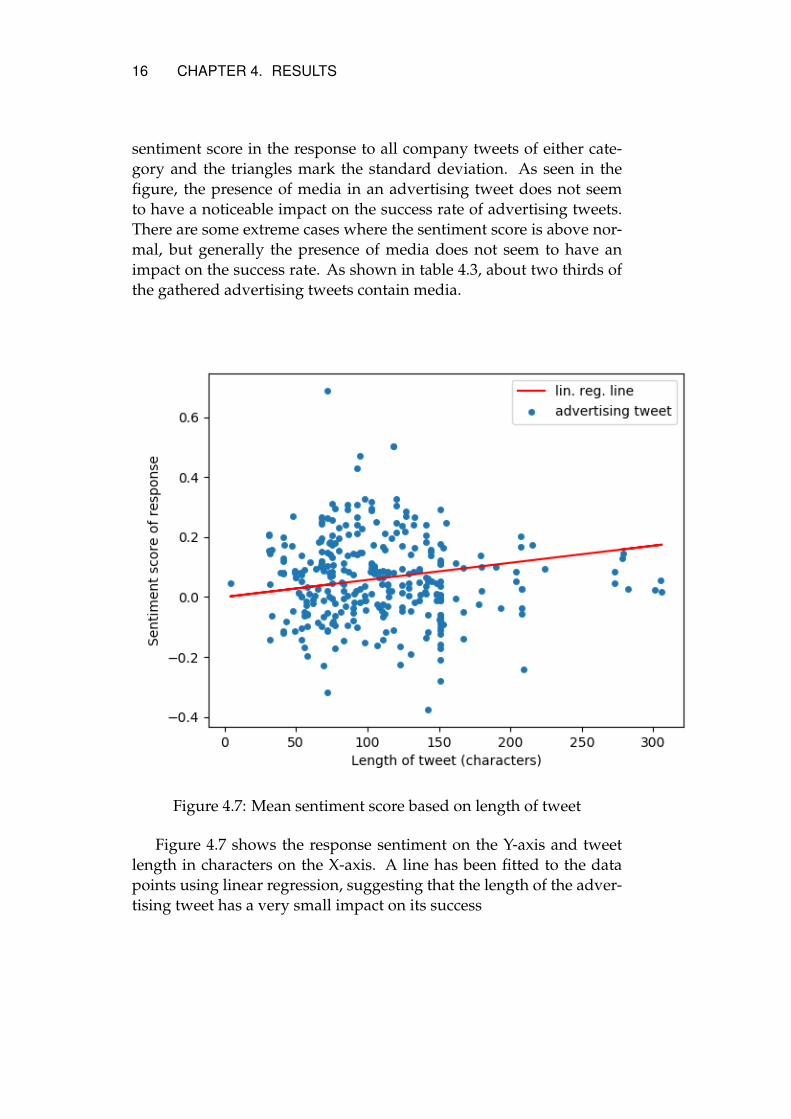
Figure 4.7: Mean sentiment score based on length of tweet
Figure 4.7 shows the response sentiment on the Y-axis and tweetlength in characters on the X-axis. A line has been fitted to the datapoints using linear regression, suggesting that the length of the adver-tising tweet has a very small impact on its success
Chapter 5
Discussion
5.1 Analysis of Results
The results indicate that the time of posting does seem to have an influ-ence on the sentiment of the response to the advertising tweets sent outby companies in the fast food sector. Tweets posted early in the morn-ing do perform worse than tweets posted later on in the day, partiallysupporting the hypothesis that was presented in section 1.3. Tweetsposted in the evening also seem to perform worse than tweets postedduring the day, which was unexpected. It should be noted that the dif-ferences in sentiment scores are rather small, and may not carry anysignificant meaning. However, even a small difference in sentimentmay be relevant in proportion to the overall range in sentiment score,which is quite small. This can be seen clearly in figure 4.6, where themajority of tweets are shown to lie between -0.2 and 0.3 in sentimentvalue.
Another observation that can be made from the results is that theresponse sentiment does vary slightly over the days of the week. In-terestingly, tweets posted on Tuesdays garnered the most positive re-sponse on average, though Friday was the most popular day for ad-vertising. The sentiment scores of the responses do seem to indicatethat fast food adverts are well received on Fridays as well, as was pre-dicted in the hypothesis. The reason for this could be that people arelooking forward to the weekend and are happy to find ways to enjoythemselves and spend time with friends and family, though this lineof reasoning is somewhat contradicted by the decline in positivity ofthe response on Saturdays and Sundays.
17
18 CHAPTER 5. DISCUSSION
A positive correlation could be found between the sentiment scoreof the advertising tweet and the sentiment of the response that it gar-nered. While the correlation is not very strong, it could be expectedthat a positive message is more likely positive response than a nega-tive message is. With that being said, even the advertising tweets thathave been categorized as negative often have a positive or humorousmessage. An example of this is the following tweet by Domino’s Pizza,which contains the word “steal” and has therefore been classified asnegative by the sentiment classification algorithm.
“Reply with a [emoji wearing sunglasses] if you alwaysmanage to steal the last slice“
While stealing generally has a negative connotation, the concept ofstealing the last slice of pizza is presented as a positive thing for thesake of humor, meaning that most people would probably interpret itpositively.
The working hypothesis was that tweets containing media wouldreceive a more positive response, but the data suggests that the pres-ence of media does not have a noteworthy impact on the sentimentof the response. That is not to say that the presence of media in foodadvertising especially does not have an effect on the overall success ofsocial media marketing, response sentiment aside.
The length of advertising tweets could not be shown to have a sig-nificant impact on the response in this report. A weak correlation wasfound when fitting a curve to the data through linear regression, butit is natural to assume that the length of the advertisement does havean impact on its success. Short advertisements may be limited in theircontent, while lengthy ones may lose the consumers’ attention prema-turely. This is not something that can be measured by sentiment anal-ysis alone, so future research may want to include likes and retweetsas a measure of engagement with the advertisement. In addition tothat, Twitter limits users to 280 characters, meaning that the differencein length tends to be small and its impact not as apparent.
5.2 Considerations
There are several factors that may have affected the results of this re-port, that have not been accounted for in the analysis of the data. One
CHAPTER 5. DISCUSSION 19
such factor is the occurrence of special events during the gathering ofthe data, which may affect either the content of the advertising or theconsumer base. Examples of events that occurred between March 27th
and April 28th are March Madness (a big sporting event), the Easterholidays and April Fool’s day. Additionally, a maximum of 100 tweetswere collected for each company per day and as mentioned before, thetweets were not direct replies to the original advertisement, but tweetsmentioning the company after the posting of the advertisement. Thismeans that the observed response is technically a sample of the gen-eral response to the company after the tweet, and not a response to theadvertisement itself.
Furthermore, the analysis in this report only looks at the sentimentof the advertising and not the actual content or character of the tweets.It is probable that humoristic tweets would garner a more positive re-sponse than more generic tweets, which is something that is difficultto capture through sentiment analysis alone. Another considerationregarding sentiment analysis is that sarcasm, negators and humor arenot picked up on in the analysis, meaning that tweets containing suchthings are easily misclassified.
5.3 Future Work
It would be interesting to see if similar results could be found in othersectors than the fast food sector. Would tweets posted on Fridays, forexample, still see an increase in the positivity of the response? Further-more, one could consider metrics such as likes and retweets in additionto sentiment in the analysis of the success of the advertising tweets.Using a different method of data gathering may give different and pos-sibly more reliable results. Another interesting approach would be toapply machine learning to analyse the content of the tweets, as well asthe sentiment, to get a more extensive view of social media marketing.
Chapter 6
Conclusions
The results suggest that posting positive advertising tweets during theday on Tuesdays or Fridays may increase the chances of a slightly morepositive response, but no definitive conclusions can be drawn as of towhat factors lead to a successful advertisement on Twitter for fast foodrestaurants. The presence of media in the tweet is determined to be in-significant to the sentiment of the response and the length of the tweethas only a small, albeit positive, influence on it, with data suggest-ing that longer tweets perform slightly better. Future research couldincorporate likes and retweets into the analysis and possibly makeuse of machine learning to form a better understanding of business-to-consumer interaction in social media marketing.
20
Bibliography
[1] Sitaram Asur and Bernardo A Huberman. “Predicting the futurewith social media”. In: Proceedings of the 2010 IEEE/WIC/ACMInternational Conference on Web Intelligence and Intelligent AgentTechnology-Volume 01. IEEE Computer Society. 2010, pp. 492–499.
[2] Johan Bollen, Huina Mao, and Xiaojun Zeng. “Twitter mood pre-dicts the stock market”. In: Journal of computational science 2.1(2011), pp. 1–8.
[3] Erik Cambria and Bebo White. “Jumping NLP curves: A reviewof natural language processing research”. In: IEEE Computationalintelligence magazine 9.2 (2014), pp. 48–57.
[4] Gobinda G Chowdhury. “Natural language processing”. In: An-nual review of information science and technology 37.1 (2003), pp. 51–89.
[5] Robin Effing and Ton AM Spil. “The social strategy cone: To-wards a framework for evaluating social media strategies”. In:International journal of information management 36.1 (2016), pp. 1–8.
[6] David A Freedman. Statistical models: theory and practice. cam-bridge university press, 2009.
[7] C.J. Hutto and E.E Gilbert. “VADER: A Parsimonious Rule-basedModel for Sentiment Analysis of Social Media Text”. In: Ann Ar-bor, MI, USA: Eighth International Conference on Weblogs andSocial Media, 2014.
[8] Content Marketing Institute. B2C Content Marketing Benchmarks,Budgets, and Trends—North America. 2018.
[9] Henrik Johansson and Anton Lilja. Method performance differenceof sentiment analysis on social media databases : Sentiment classifica-tion in social media. 2016.
21
22 BIBLIOGRAPHY
[10] A. Kazım Kirtis and Filiz Karahan. “To Be or Not to Be in SocialMedia Arena as the Most Cost-Efficient Marketing Strategy afterthe Global Recession”. In: Procedia - Social and Behavioral Sciences24 (2011). The Proceedings of 7th International Strategic Man-agement Conference, pp. 260–268. ISSN: 1877-0428. DOI: https://doi.org/10.1016/j.sbspro.2011.09.083. URL:http://www.sciencedirect.com/science/article/pii/S1877042811016119.
[11] Elizabeth D Liddy. “Natural language processing”. In: (2001).
[12] Walaa Medhat, Ahmed Hassan, and Hoda Korashy. “Sentimentanalysis algorithms and applications: A survey”. In: Ain ShamsEngineering Journal 5.4 (2014), pp. 1093–1113. ISSN: 2090-4479.DOI: https://doi.org/10.1016/j.asej.2014.04.011. URL: http://www.sciencedirect.com/science/article/pii/S2090447914000550.
[13] Bibian Ogbuji and Anastasia Papazafeiropoulou. “Social MediaStrategies for Companies: A Comprehensive Framework”. In:Social Media: The Good, the Bad, and the Ugly", year="2016. Ed. byYogesh K. Dwivedi et al. Cham: Springer International Publish-ing, pp. 3–14. ISBN: 978-3-319-45234-0.
[14] Bo Pang, Lillian Lee, and Shivakumar Vaithyanathan. “ThumbsUp?: Sentiment Classification Using Machine Learning Techniques”.In: Proceedings of the ACL-02 Conference on Empirical Methods inNatural Language Processing - Volume 10. EMNLP ’02. Strouds-burg, PA, USA: Association for Computational Linguistics, 2002,pp. 79–86. DOI: 10.3115/1118693.1118704. URL: https://doi.org/10.3115/1118693.1118704.
[15] M Saravanakumar and T SuganthaLakshmi. “Social media mar-keting”. In: Life Science Journal 9.4 (2012), pp. 4444–4451.
[16] Twitter. Search Tweets. URL: https://developer.twitter.com/en/docs/tweets/search/overview.
[17] Chenyan Xu, Yang Yu, and Chun-Keung Hoi. “Hidden in-gameintelligence in NBA players’ tweets”. In: Communications of theACM 58.11 (2015), pp. 80–89.
[18] Xin Yan and Xiaogang Su. Linear regression analysis: theory andcomputing. World Scientific, 2009.

www.kth.se